Submitted:
26 June 2024
Posted:
27 June 2024
You are already at the latest version
Abstract
Keywords:
1. Introduction
2. Literature Review
2.1. Traffic Signal Timing Optimization
2.2 Transportation Fairness
2.3 Summary
Intersection Delay Fairness Analysis
3.1 Delay Model Determination
3.2 Delay Model Fairness Analysis
3.2.1 Theory Analysis
3.2.2 Example Generation

3.2.3 Example Analysis
3.3 Delay Model Fairness Evaluation
3.3.1 Information Entropy
3.3.2 Fairness Evaluation Index
4. Efficiency and Fairness Signal Optimization Model
4.1 Feasibility Analysis
4.1.1 The Delay-to-Fairness Conversion Rate
4.1.2 Feasibility Discussion
4.2 Optimization Model Construction
4.2.1 Objection Function Construction
5. Model Examples Validation
5.1 Fairness Model
5.2 Validity and Sensitivity Analysis
5.2.1 Comparative Analyses of Validity
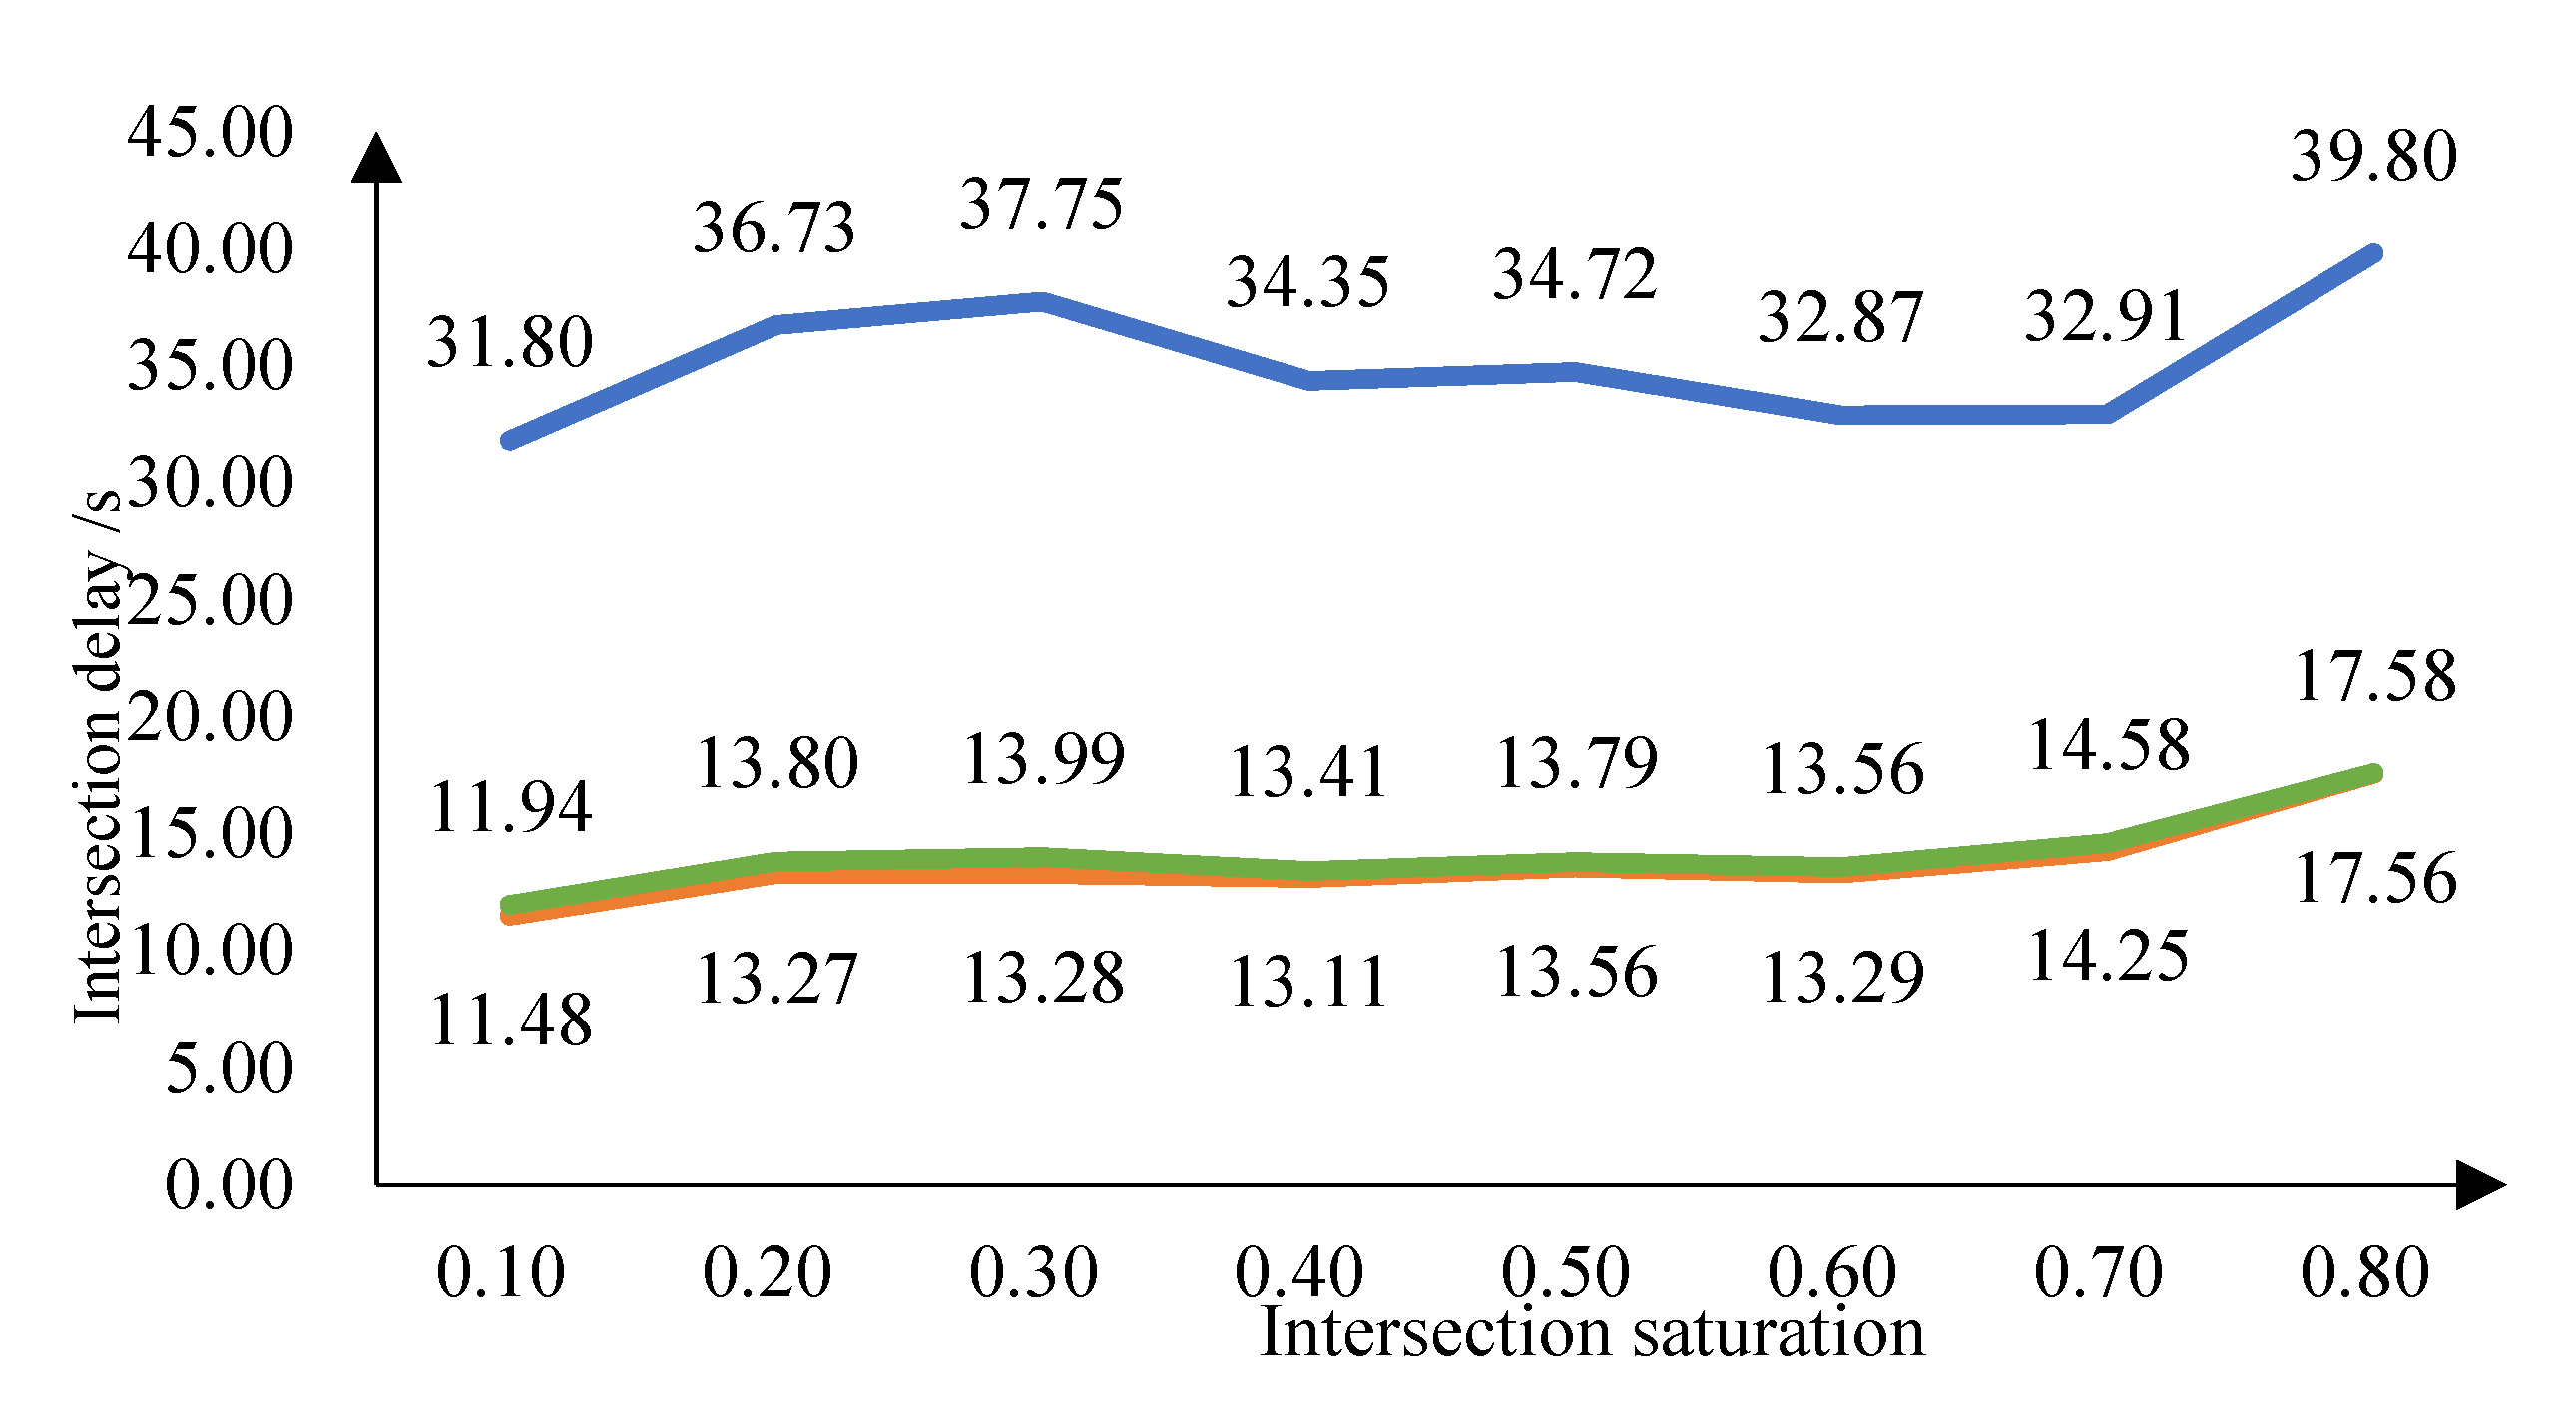
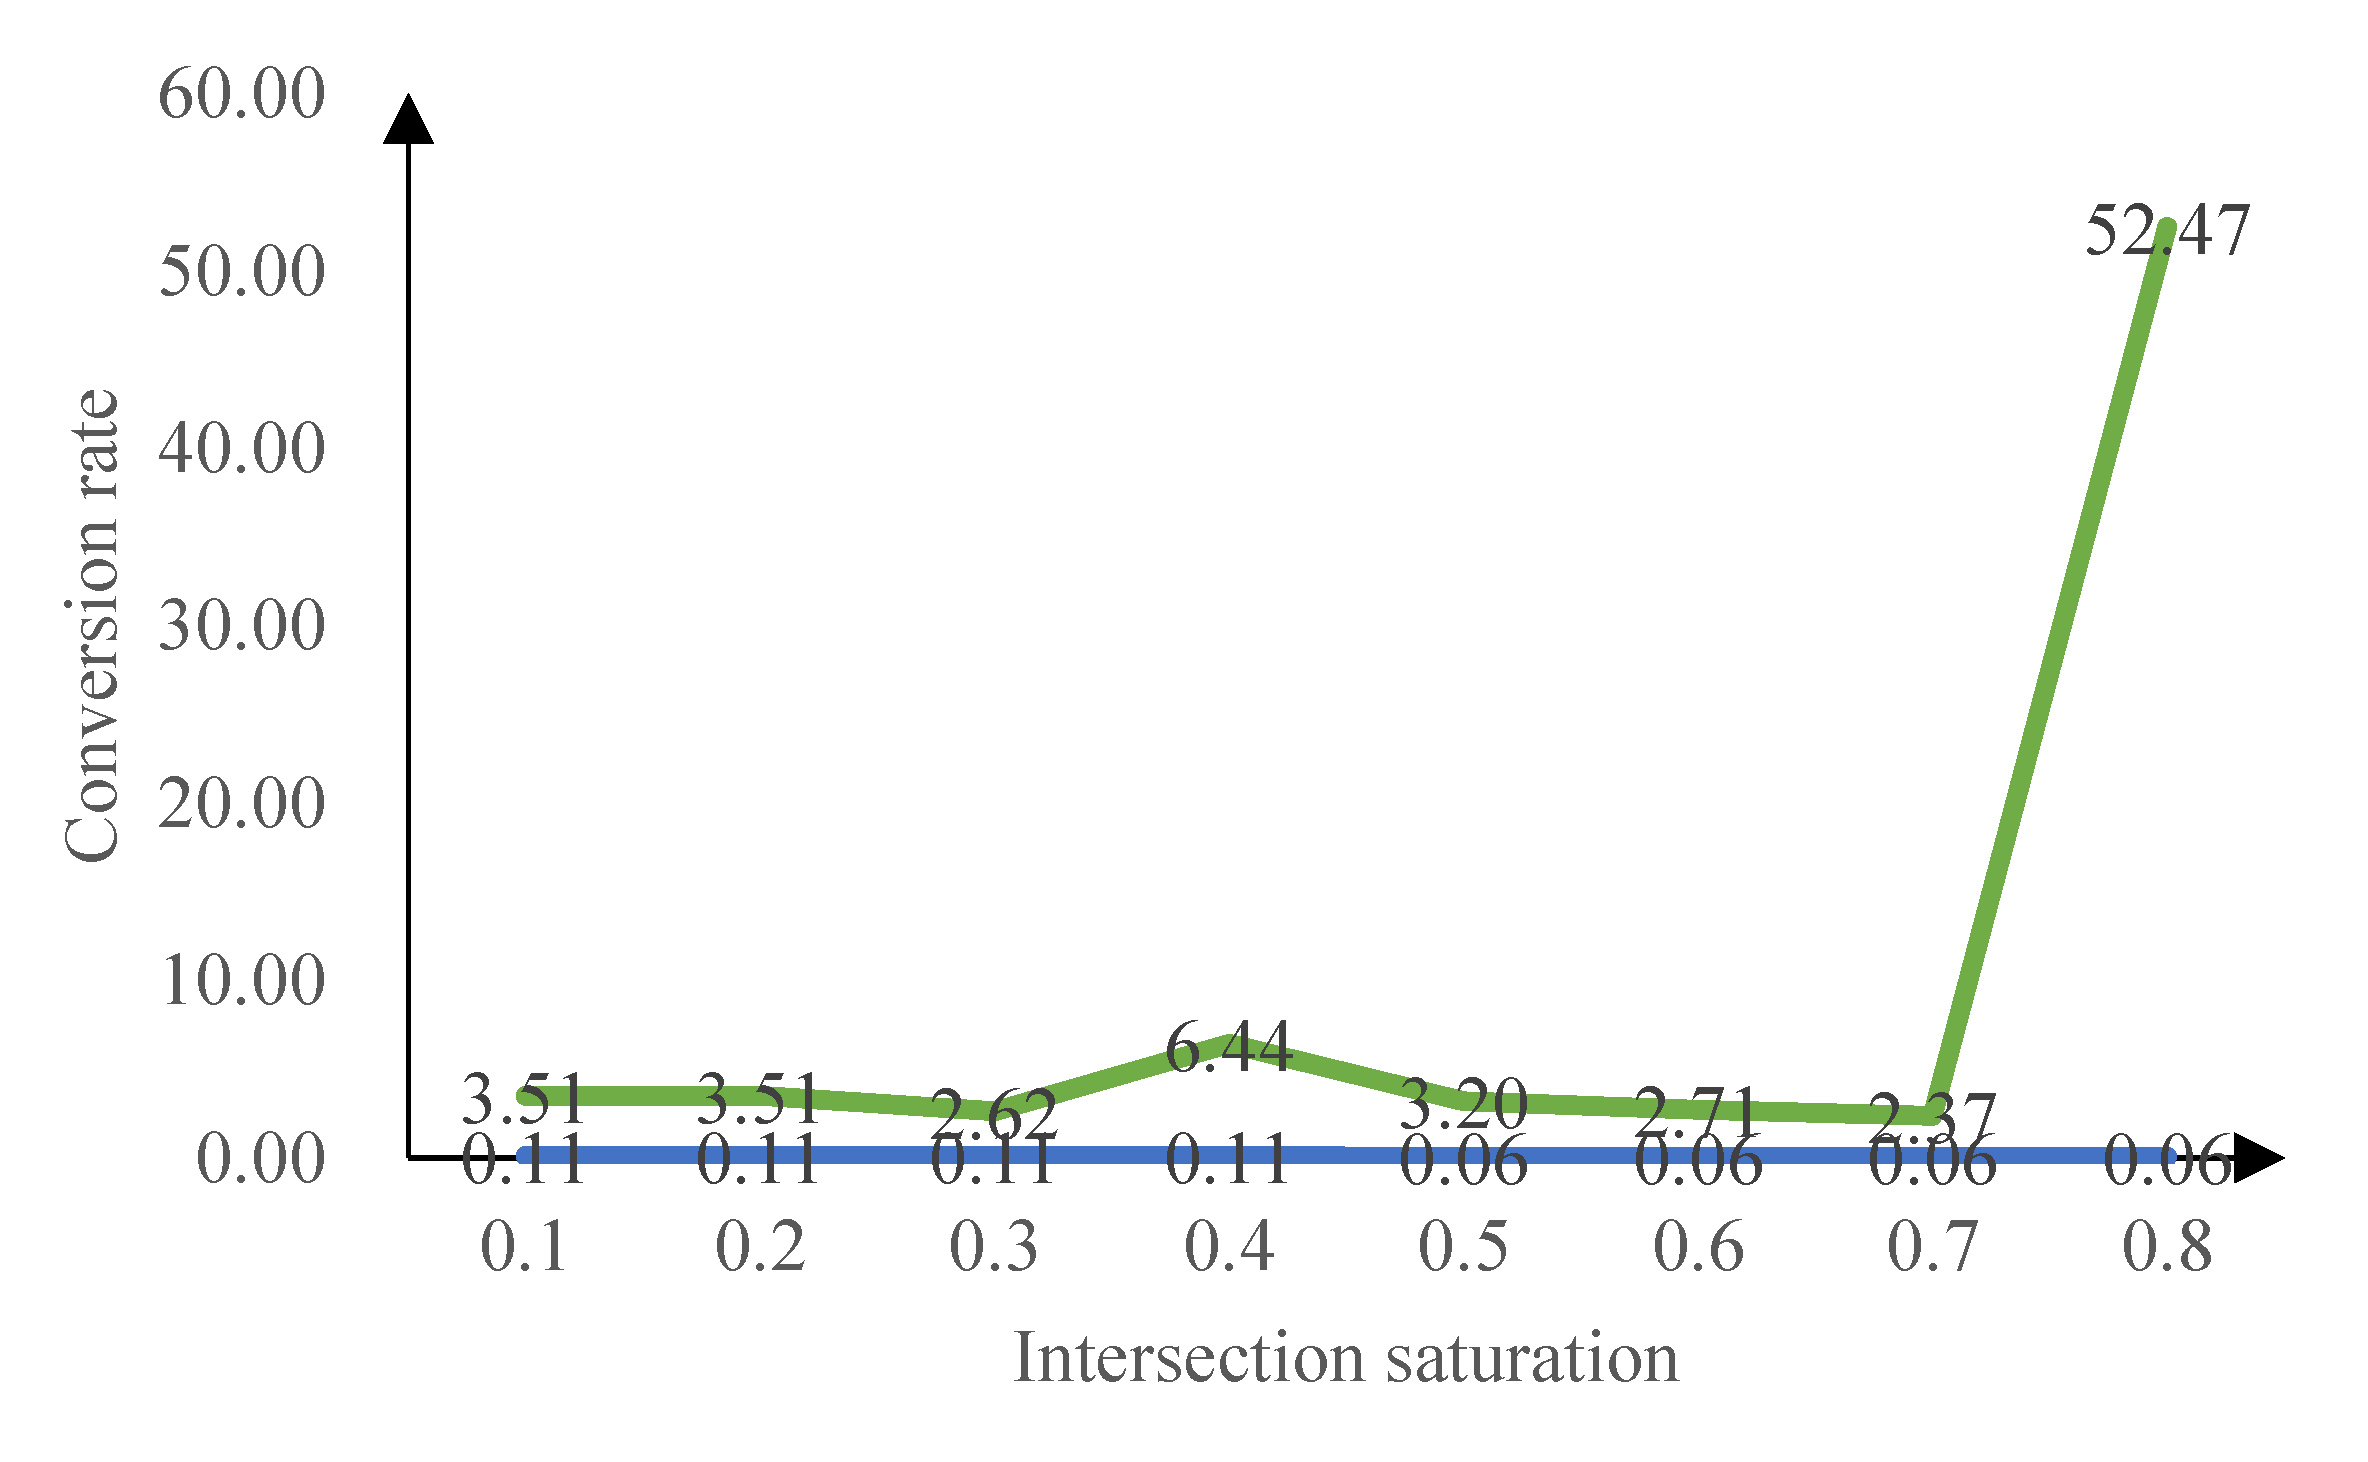
5.2.2 Comparative Analyses of Fluctuations
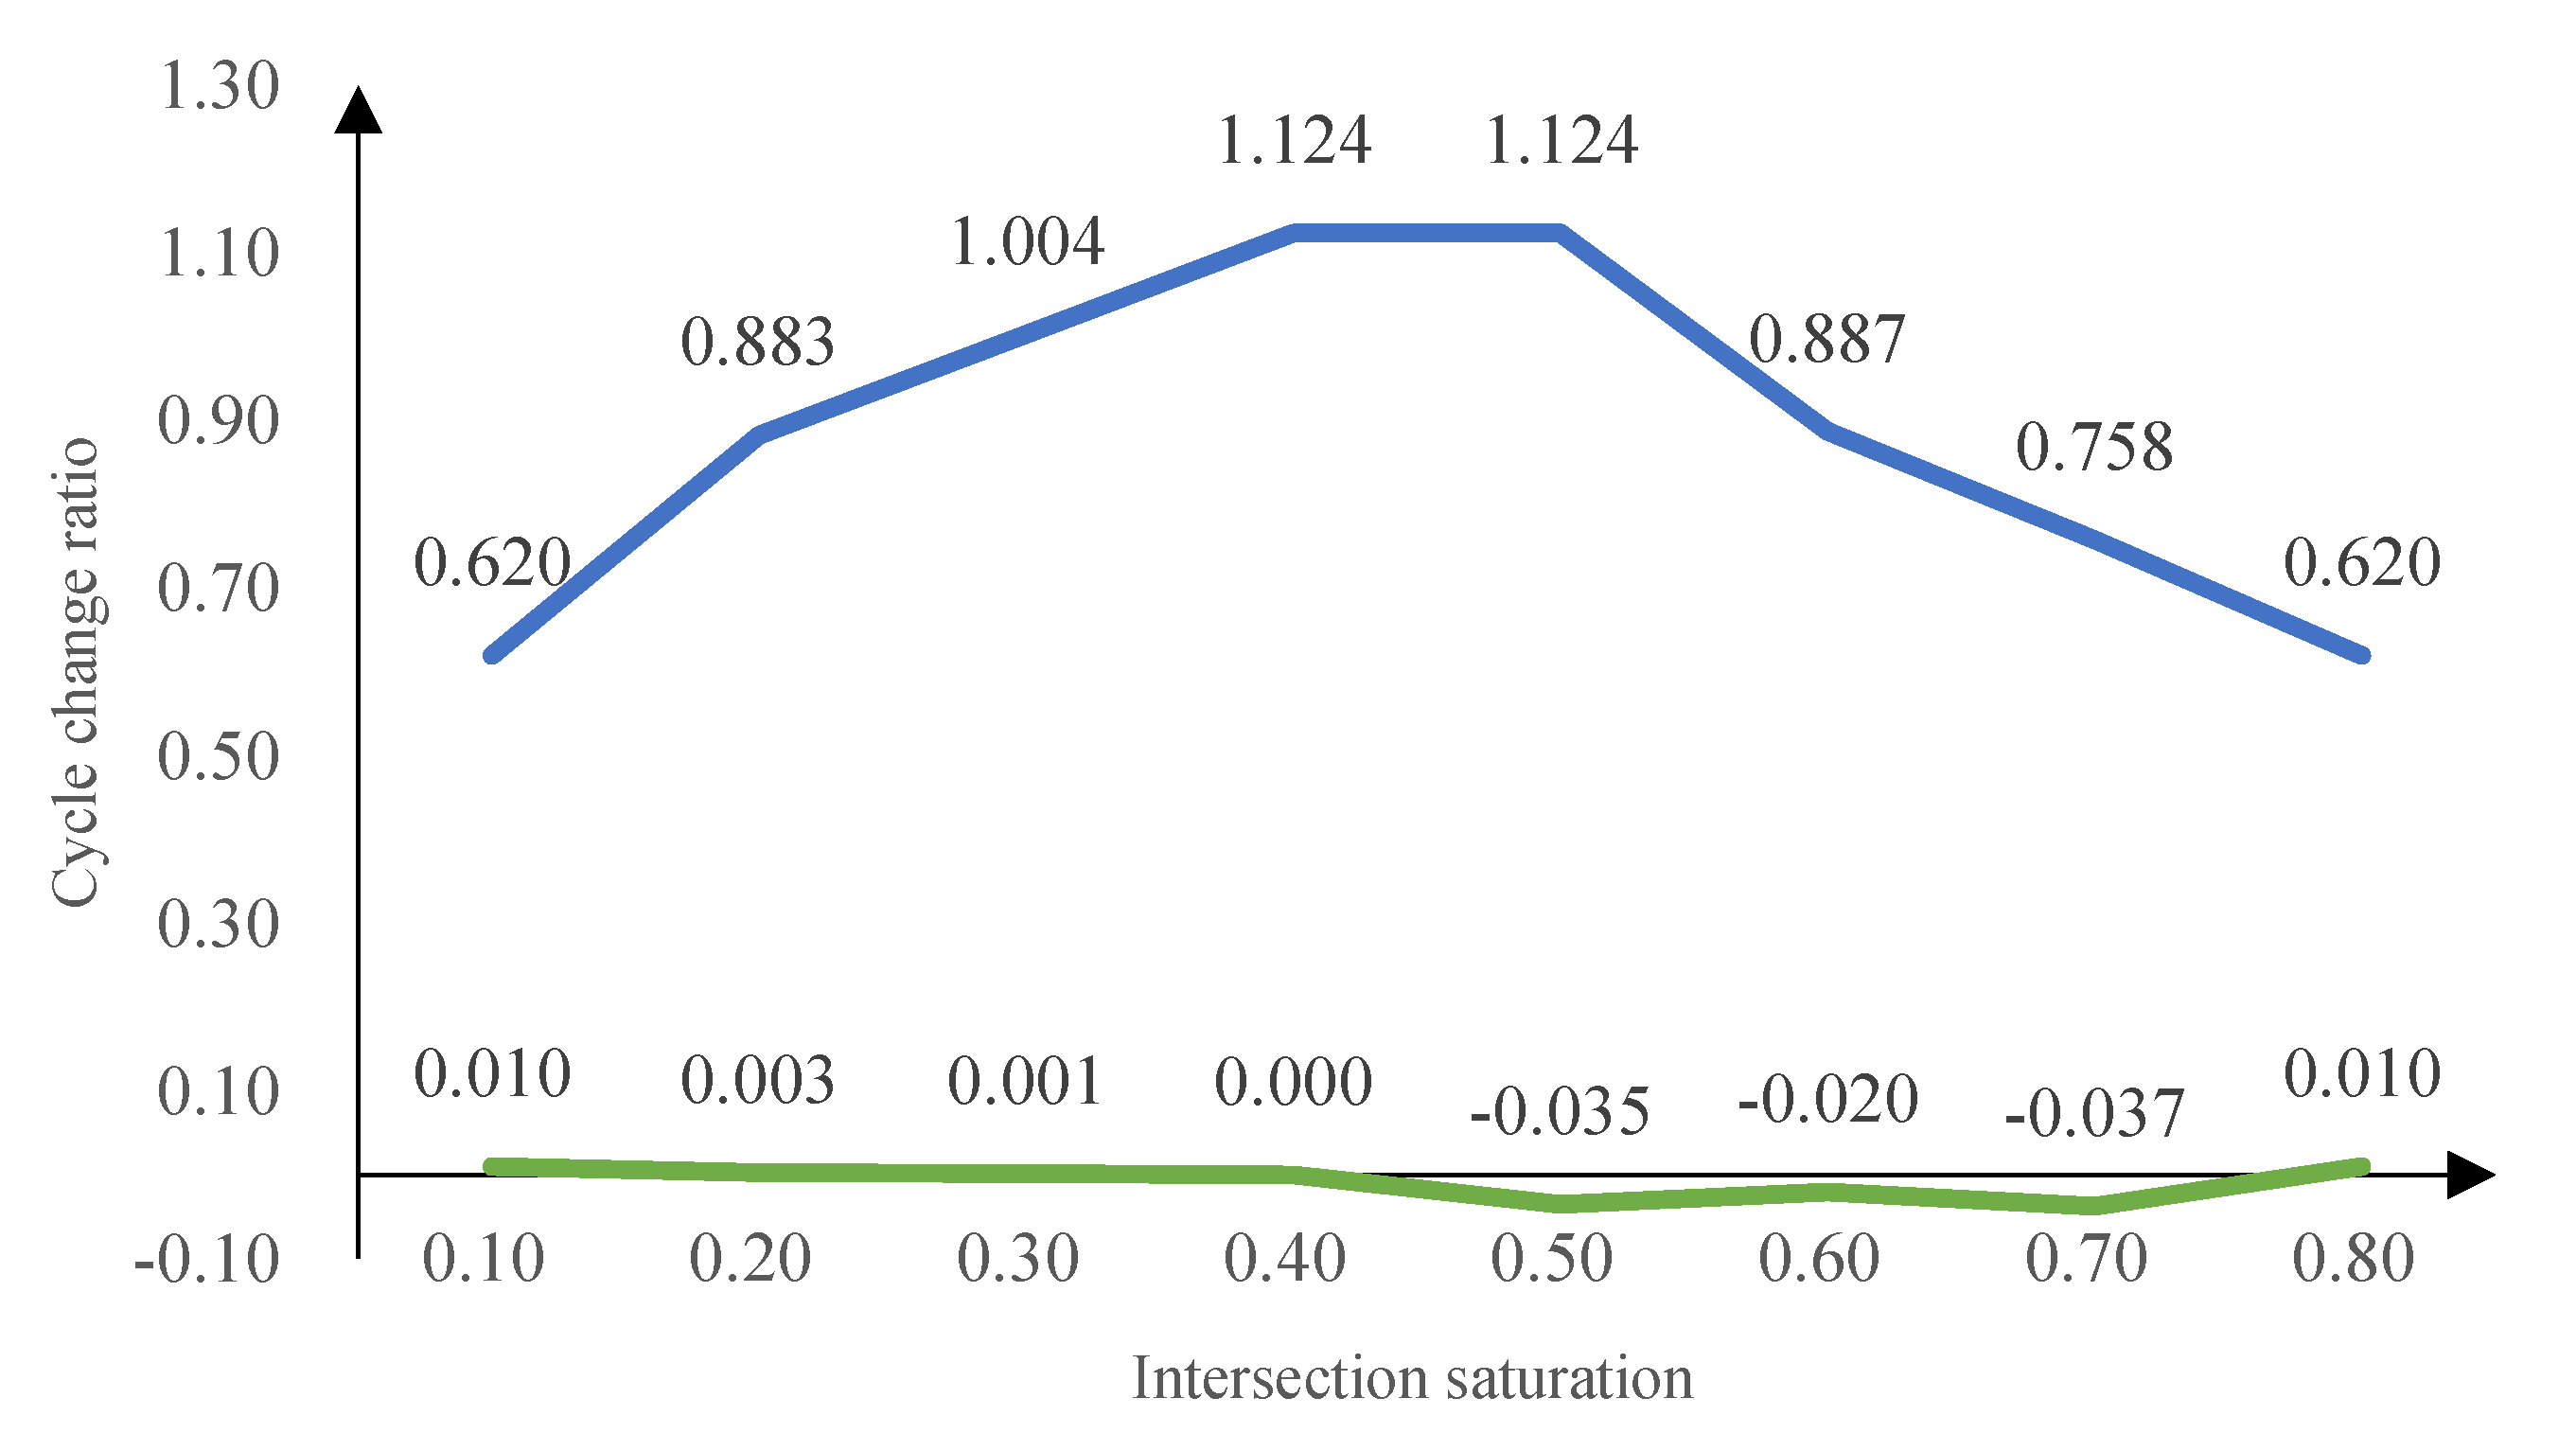
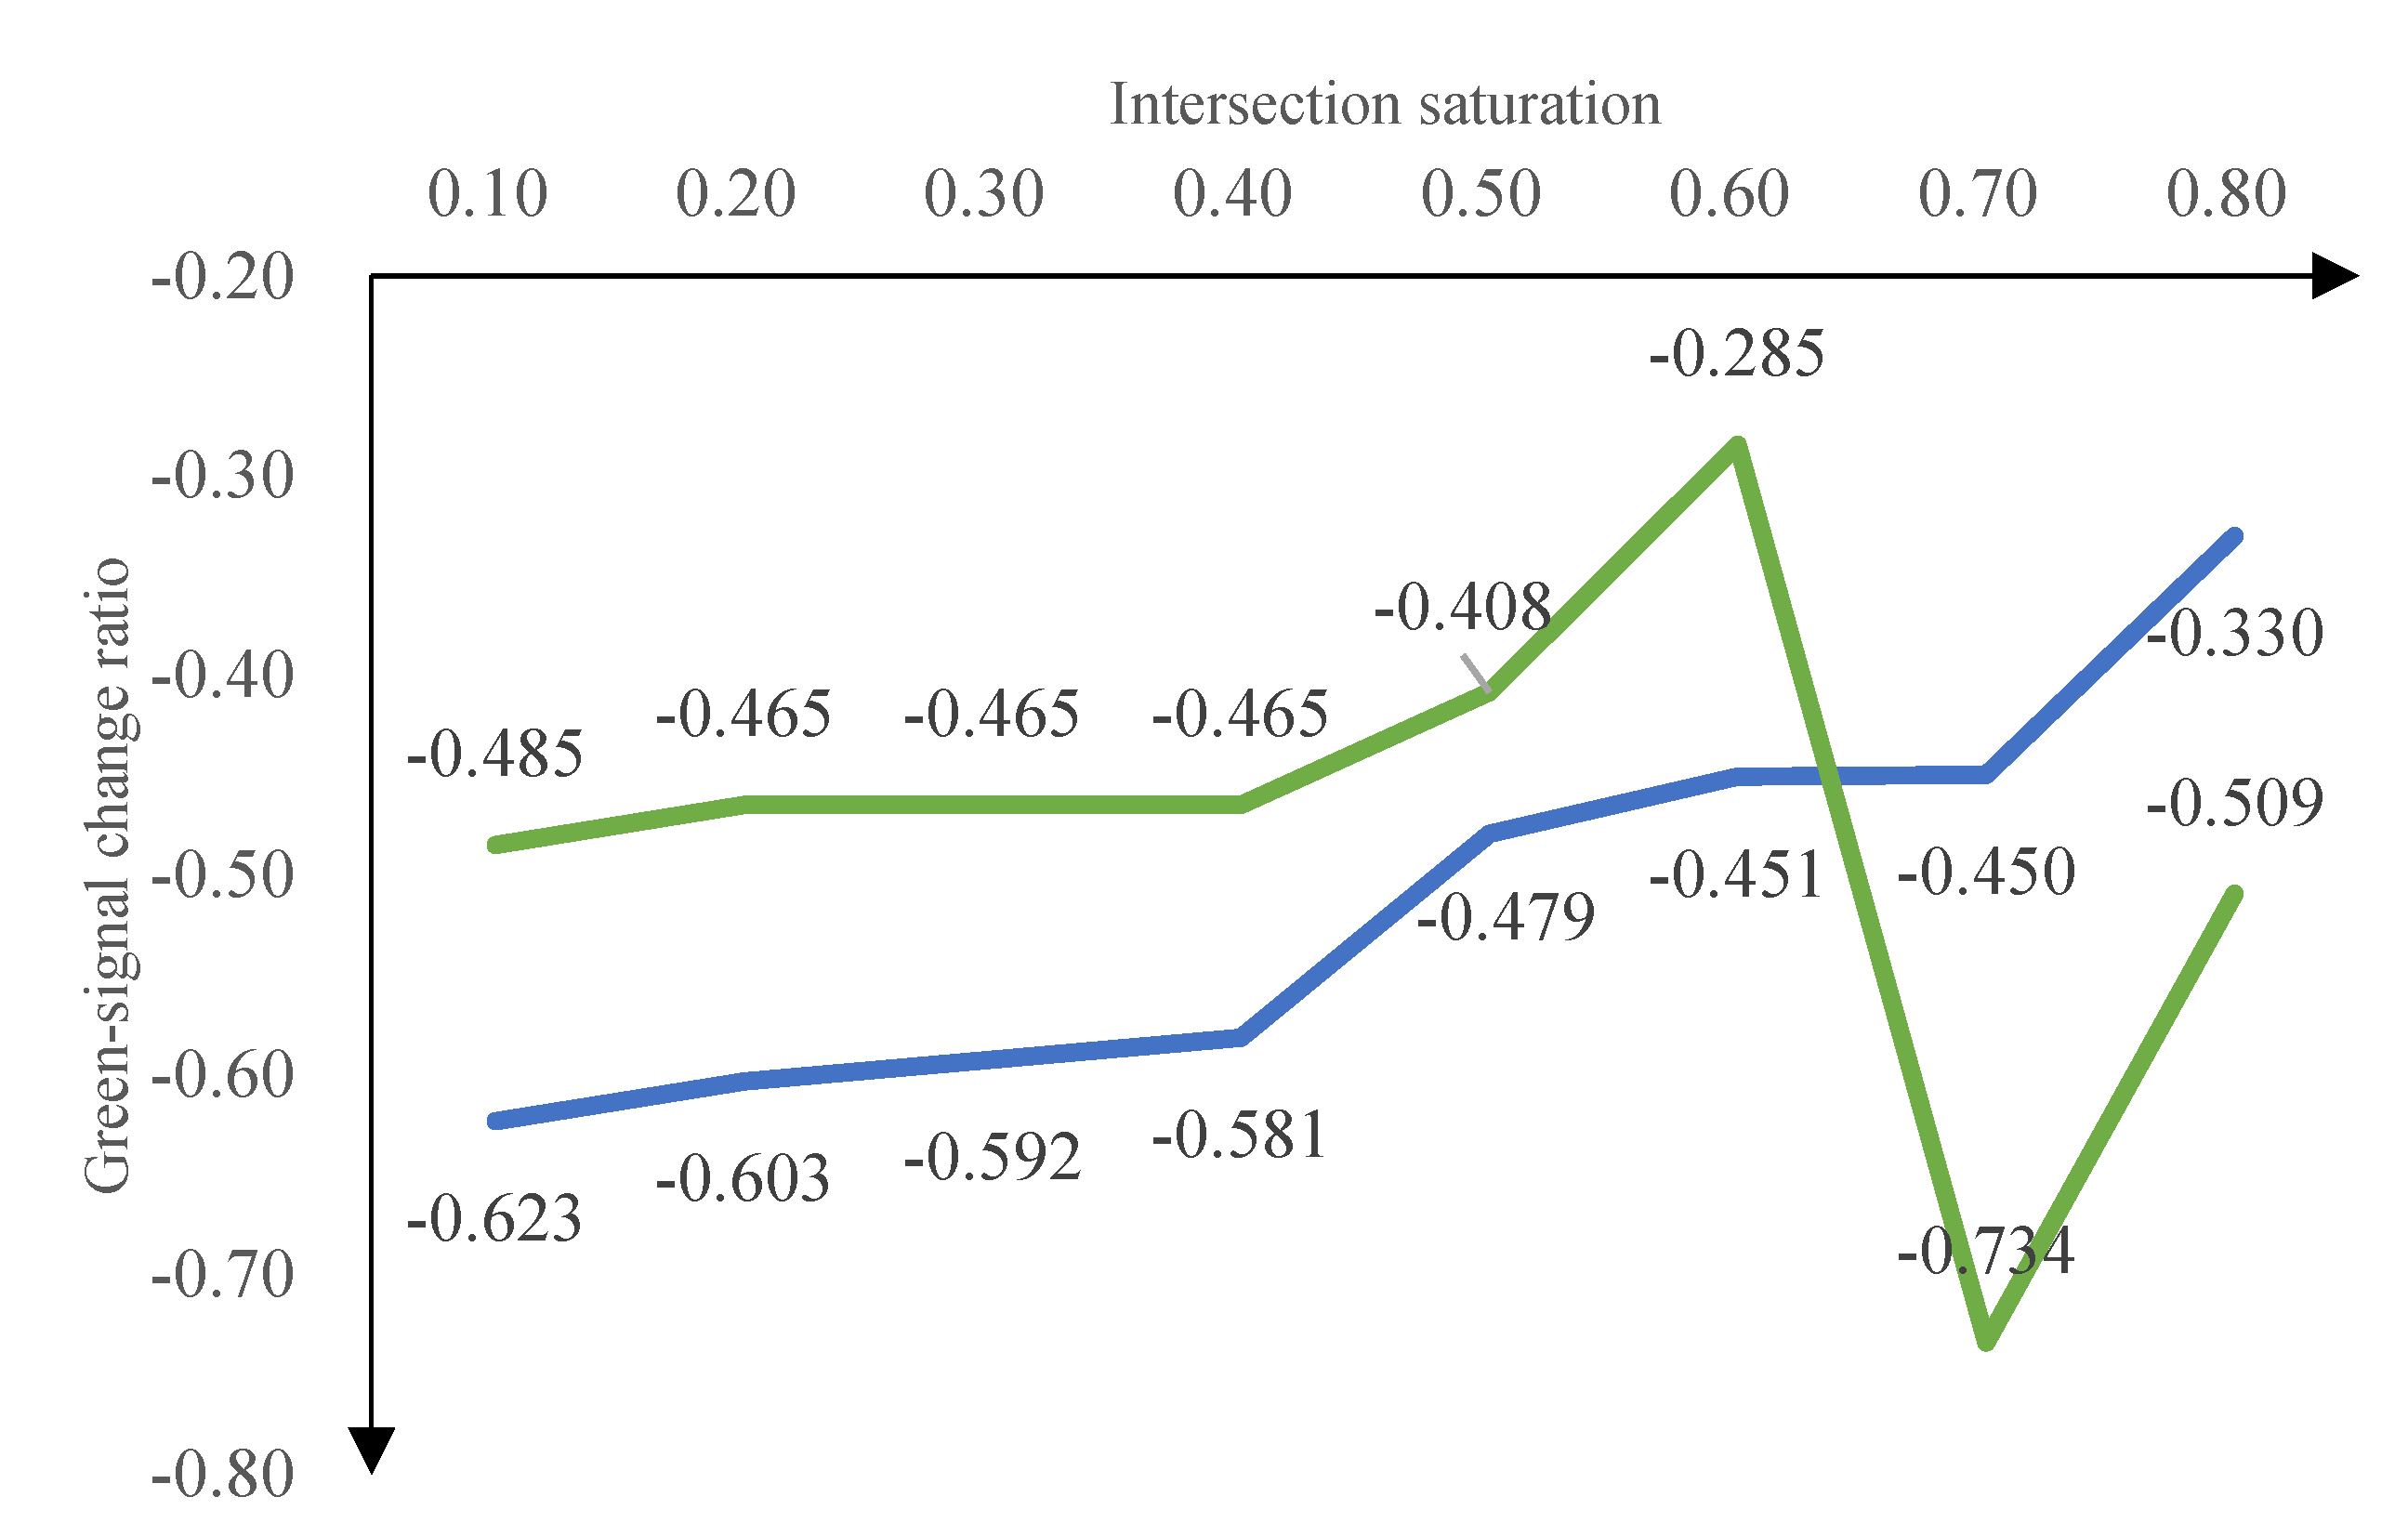
6. Conclusion
Author Contributions
Funding
Data Availability Statement
Conflicts of Interest
References
- Xi Jinping. Secure a Decisive Victory in Building a Moderately Prosperous Society in All Respects and Strive for the Great Success of Socialism with Chinese Characteristics for a New Era: Report to the 19th National Congress of the Communist Party of China [M]. Beijing: People’s Publishing House, 2017: 11-12.
- Zhang Zehua. Research on Equity Measurement of Transportation Development in China from the Perspective of Equalization of Public Services [D]. Beijing Jiaotong University, 2019.
- Australia S. Guide to traffic engineering practice: part 7: traffic signals[J]. 2003.
- Wang P, Yang Q. Genetic Algorithms Based Traffic Signal Optimization at a Congested Intersection[J]. Applied Mechanics & Materials, 2012,209-211:814-817.
- Kesur K B. Multiobjective Optimization of Delay and Stops in Traffic Signal Networks[J]. 2013.
- A, Ceder, I, et al. An algorithm to minimize queues at signalized intersections[J]. Journal of the Operational Research Society, 2001.
- Liu H, Balke K N, Lin W H. A reverse causal-effect modeling approach for signal control of an oversaturated intersection[J]. Transportation Research Part C Emerging Technologies, 2008,16(6):742-754. [CrossRef]
- Alhajyaseen W, Najjar M, Ratrout N T, et al. The effectiveness of applying dynamic lane assignment at all approaches of signalized intersection[J]. Case Studies on Transport Policy, 2017:65-72. [CrossRef]
- Murat Y S, Gedizlioglu E. A fuzzy logic multi-phased signal control model for isolated junctions[J]. Transportation Research Part C, 2005,13(1):19-36. [CrossRef]
- Schmoecker J D, Ahuja S, Bell M. Multi-objective signal control of urban junctions – Framework and a London case study[J]. Transportation Research Part C Emerging Technologies, 2008,16(4):454-470. [CrossRef]
- Chen J, Jia M. Robust Multi-objective Optimization and Decision for Signal Timing at Single Intersection: 2016 International Conference on Automatic Control and Information Engineering, 2016[C].
- Deng W, Jia L M, Dong H H. Multi-Objective Optimization Model for Urban Traffic Intersection Control Based on Data Fusion[J]. Advanced Materials Research, 2011,156-157:505-510.
- Gao Yunfeng, Xu Lihong, Hu Hua, et al. Multi-objective optimization method for fixed-cycle signal control at intersections[J]. China Journal of Highway and Transport, 2011, 24(05):82-88.
- Liu Quanfu, Lu Baichuan, Ma Qinglu, et al. Research on multi-objective optimization of signal control at signalized intersections[J]. Journal of Traffic Science and Engineering, 2014, 16(01):47-50.
- Wang Yuquan, Jiang Xinyue, Guo Weiwei. Research on optimization method of signalized intersection cycle length considering travel cost[J]. Journal of Chang’an University (Natural Science Edition), 2015, 35(S1):104-107.
- Liu Quanfu, Lu Baichuan, Ma Qinglu, et al. Research on multi-objective optimization of signal control at signalized intersections[J]. Journal of Traffic Science and Engineering, 2014, 16(01):47-50.
- Li Xun, Liu Yao, Zhou Jian, et al. Traffic signal timing optimization model based on improved genetic algorithm[J]. Industrial Instrumentation & Automation, 2017(04):125-130.
- Li Juan, Jia Tingyong. Signal timing optimization at signalized intersections based on per capita delay[J]. Journal of Highway Traffic Science and Technology, 2021, 38(11):134-141.
- Chen Song, Li Xiansheng, Wang Yunhao, et al. Optimization of traffic control scheme for left-turning intersections with opposing exit lanes[J]. Journal of Harbin Institute of Technology, 2018, 50(03):74-82.
- Jiang Tao, Ma Qiannan. Setting and signal optimization method for variable guidance lanes in multiple time periods[J]. Journal of Traffic Science and Engineering, 2019, 35(01):86-93.
- Cai Shiyao. Traffic network design model and application based on traffic fairness[D]. Huazhong University of Science and Technology, 2016.
- Zhu Zhaoming. Research on multi-mode traffic congestion charging methods considering fairness[D]. Southeast University, 2016.
- Litman T. EVALUATING TRANSPORTATION EQUITY - METHODS FOR INCORPORATING DISTRIBUTIONAL IMPACTS INTO TRANSPORT PLANNING[J]. Costs, 2005,8.
- Lu Dandan, Zhang Shengrui, Guo Meng. Analysis and Countermeasures of Urban Traffic Fairness[J]. Journal of Transportation Science and Engineering, 2008(02):103-105.
- Zhi C L, Xiao Y G. Traffic signal timing problems with environmental and equity considerations[J]. Journal of Advanced Transportation, 2014,48(8).
- Baskan O, Ozan C. Reserve Capacity Model for Optimizing Traffic Signal Timings with an Equity Constraint[M]. Highway Engineering, 2017.
- Liang Z, Xinfeng X, Chengcheng X, et al. A stochastic simulation-based optimization method for equitable and efficient network-wide signal timing under uncertainties[J]. Transportation Research Part B, 2019,122.
- Shi Jing, Yang Lang, Ying Xiwen, et al. Quantitative Evaluation Model of Traffic Fairness Based on Wilson Entropy Distribution Assumption[J]. Journal of Wuhan University of Technology (Transportation Science & Engineering), 2008(01):1-4.
- Lv Bin, Niu Huimin. Optimization Method of Phase Difference in Urban Traffic Line Control System[J]. Journal of Transportation Engineering, 2011, 11(04):103-107.
- Webster F V. Traffic signal settings[J]. Road Research Technical Paper, 1958,39.
- Akcelik R. TRAFFIC SIGNALS: CAPACITY AND TIMING ANALYSIS[J]. publication of australian road research board, 1981.
- Council W D N R. Transportation Research Board (TRB). Highway capacity manual 1985[R].1985.
- Council W D N R. Transportation Research Board (TRB). Highway capacity manual 1985[R].2000.
Disclaimer/Publisher’s Note: The statements, opinions and data contained in all publications are solely those of the individual author(s) and contributor(s) and not of MDPI and/or the editor(s). MDPI and/or the editor(s) disclaim responsibility for any injury to people or property resulting from any ideas, methods, instructions or products referred to in the content. |
© 2024 by the authors. Licensee MDPI, Basel, Switzerland. This article is an open access article distributed under the terms and conditions of the Creative Commons Attribution (CC BY) license (http://creativecommons.org/licenses/by/4.0/).


