1. Introduction
Through the activation of macrophages, interferon-gamma (IFN-γ) plays a major role in protection against
Mycobacterium tuberculosis infection. IFN-γ is important both in human and mouse model for the control of tuberculosis. CD4 T cells are the major source of IFN-γ during acute infection in mice and are essential for controlling bacterial growth and recovery from disease [
1,
2]. Tuberculosis infection suppresses host immunity, and IFN-γ production may be insufficient. In addition to insufficient IFN-γ production, certain host genetic disorders may be associated with the progression of the disease [
3]. In vitro, incubation of phagocytic cells with IFN-γ enhanced their antibacterial activities [
4] and in administration of the same was found to be a promising therapy against pulmonary tuberculosis [
5]. At the same time, in a mouse model of tuberculosis, the administration of anti-IFN-γ monoclonal antibodies lead to a significant increase in the mycobacterial population in the lungs of animals. IFN-γ-gene knockout mice are practically defenseless against infection with
M. tuberculosis (
Mtb) [
6,
7]. Although Th1 CD4 T cells specific for Mtb antigen ESAT-6 limit Mtb growth in vivo, this inhibition is independent of IFNγ or TNF. It is important to note that, IFN-γ is released during the treatment of tuberculosis [
8], and IFN-γ release assay is used for rapid diagnosis of TB in children [
9]. Suggesting, that IFN-γ plays a crucial role in recovery from tuberculosis.
In this work, we investigated the therapeutic effectiveness of IFN- against tuberculosis infection in a mouse model.
2. MATERIALS AND METHODS
2.1. Mycobacteria
M. tuberculosis strain H37Rv was originally obtained from the Institute Pasteur, Paris, France (a kind gift from G. Marshal). Mycobacteria was passaged through C57BL/6 mice to increase its virulence. The final culture was washed in PBS with 0.05% Tween80 and stored at -80oC in PBS added with 0.01% BSA.
2.2. Interferon-Gamma
Ingaron was produced by Research and Production Enterprise Pharmaclone, Russian Federation. Before use it was dissolved in sterile water.
2.3. Animals
BALB/c female mice 22-23 g of body weight were used. Mice were bred under conventional conditions in the Animal Facility of the Ural Research Institute of Phthisiopulmonology, Ekaterinburg, Russia in accordance with the guidelines from the Russian Ministry of Health #218. Totally 40 mice were used.
2.4. Infection of Mice
Mice were infected with a calculated dose of ~100 CFU/lung of M. tuberculosis H37Rv using the Inhalation Exposure System (Glas-Col, Terre Haute, IN).
2.5. Chemotherapy
Infected mice were divided into 5 groups: (1) early, pretreatment control; mice treated with (2) isoniazid; (3) mice treated with ingaron; (4) mice treated with combination of Ingaron + isoniazid; and (5) late control (mice without treatment for 7 weeks). Lungs and spleens of group (1) were collected at 3 weeks following infection and studied.
Three weeks following infection, group 2 with treated, PO, with INH, 25 mg/kg; group 3 with Ingaron, SC, 125,000 units/kg; group 4, with INH + Ingaron. Mice were treated 6 days a week for weeks.
2.6. CFU Counts
At indicated time points following infection, identical lobes of the right lungs from individual mice were excised and homogenized in 2.0 ml of sterile saline with Tween-80, and 10-fold serial dilutions of 0.2 ml samples were plated on Dubos agar (Difco). The agar plates were incubated at 370C for 20-22 days before CFU were counted.
2.7. Histology
The left lungs were removed and placed in formaldehyde. Sections were stained with hematoxylin/eosin.
2.8. Statistics
Data were processed by ANOVA and Student-t test with Bonferroni correction. In addition, Microsoft Excel, статистическoгo пакета IBM SPSS Statistics v.21 (2012г.) was used. To assess the significance of intergroup differences, the Mann-Whitney U test for unrelated populations was used. Differences were considered statistically significant at p<0.05 (95% significance level).
3. RESULTS
In experimental tuberculosis, lung and spleen weights usually reflect the severity of the disease or efficacy of treatment. In our study case, the greatest increase in the weight of the organs was observed in infected mice that did not receive any therapy (group 5) (
Table 1), and smallest increase - in mice treated with INH + Ingaron combination.
Microbiological study of lung and spleen homogenates showed that, after 4 weeks of treatment, most pronounced decrease in bacterial load was recorded in group (4) INH+Ingaron (
Table 2),
71250±53569 CFU, (Log=4.85); compared to mice of group 2 (isoniazid) and group 3 (ingaron) - 214500±104553 CFU, (Log=5.33), (p≤0.03); and 371875±892803 CFU (Log=6.57), (p≤0.001), respectively. A similar pattern was observed when assessing the bacterial load in the spleens - <10 CFU; Log<1 in group 4; and 93±23 CFU; Log=1.95 (p≤0.01), in group 2; 1466±889 CFU; Log=3.17(p≤0.001) in group 3, (
Table 2).
Histopathology Study
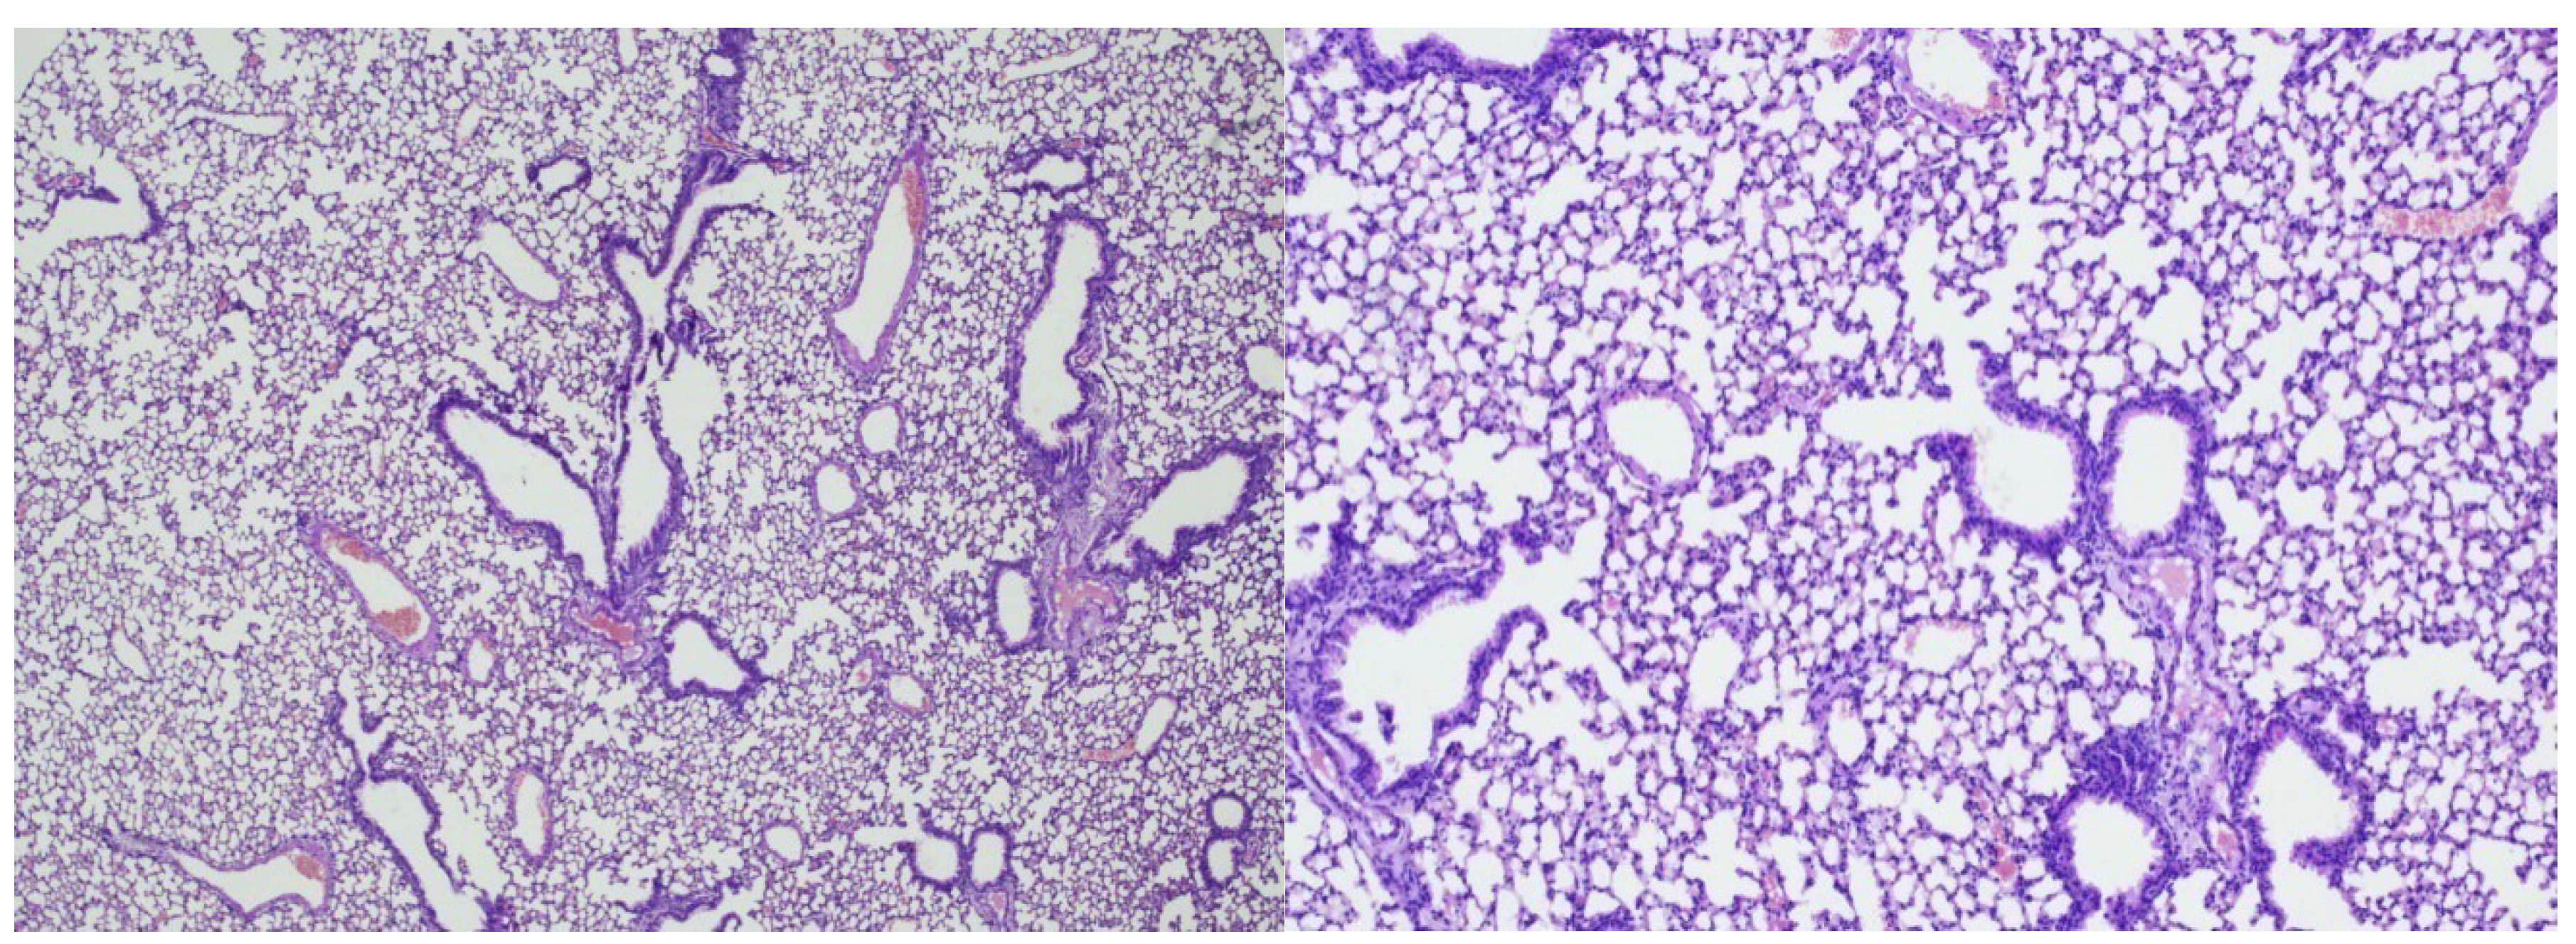
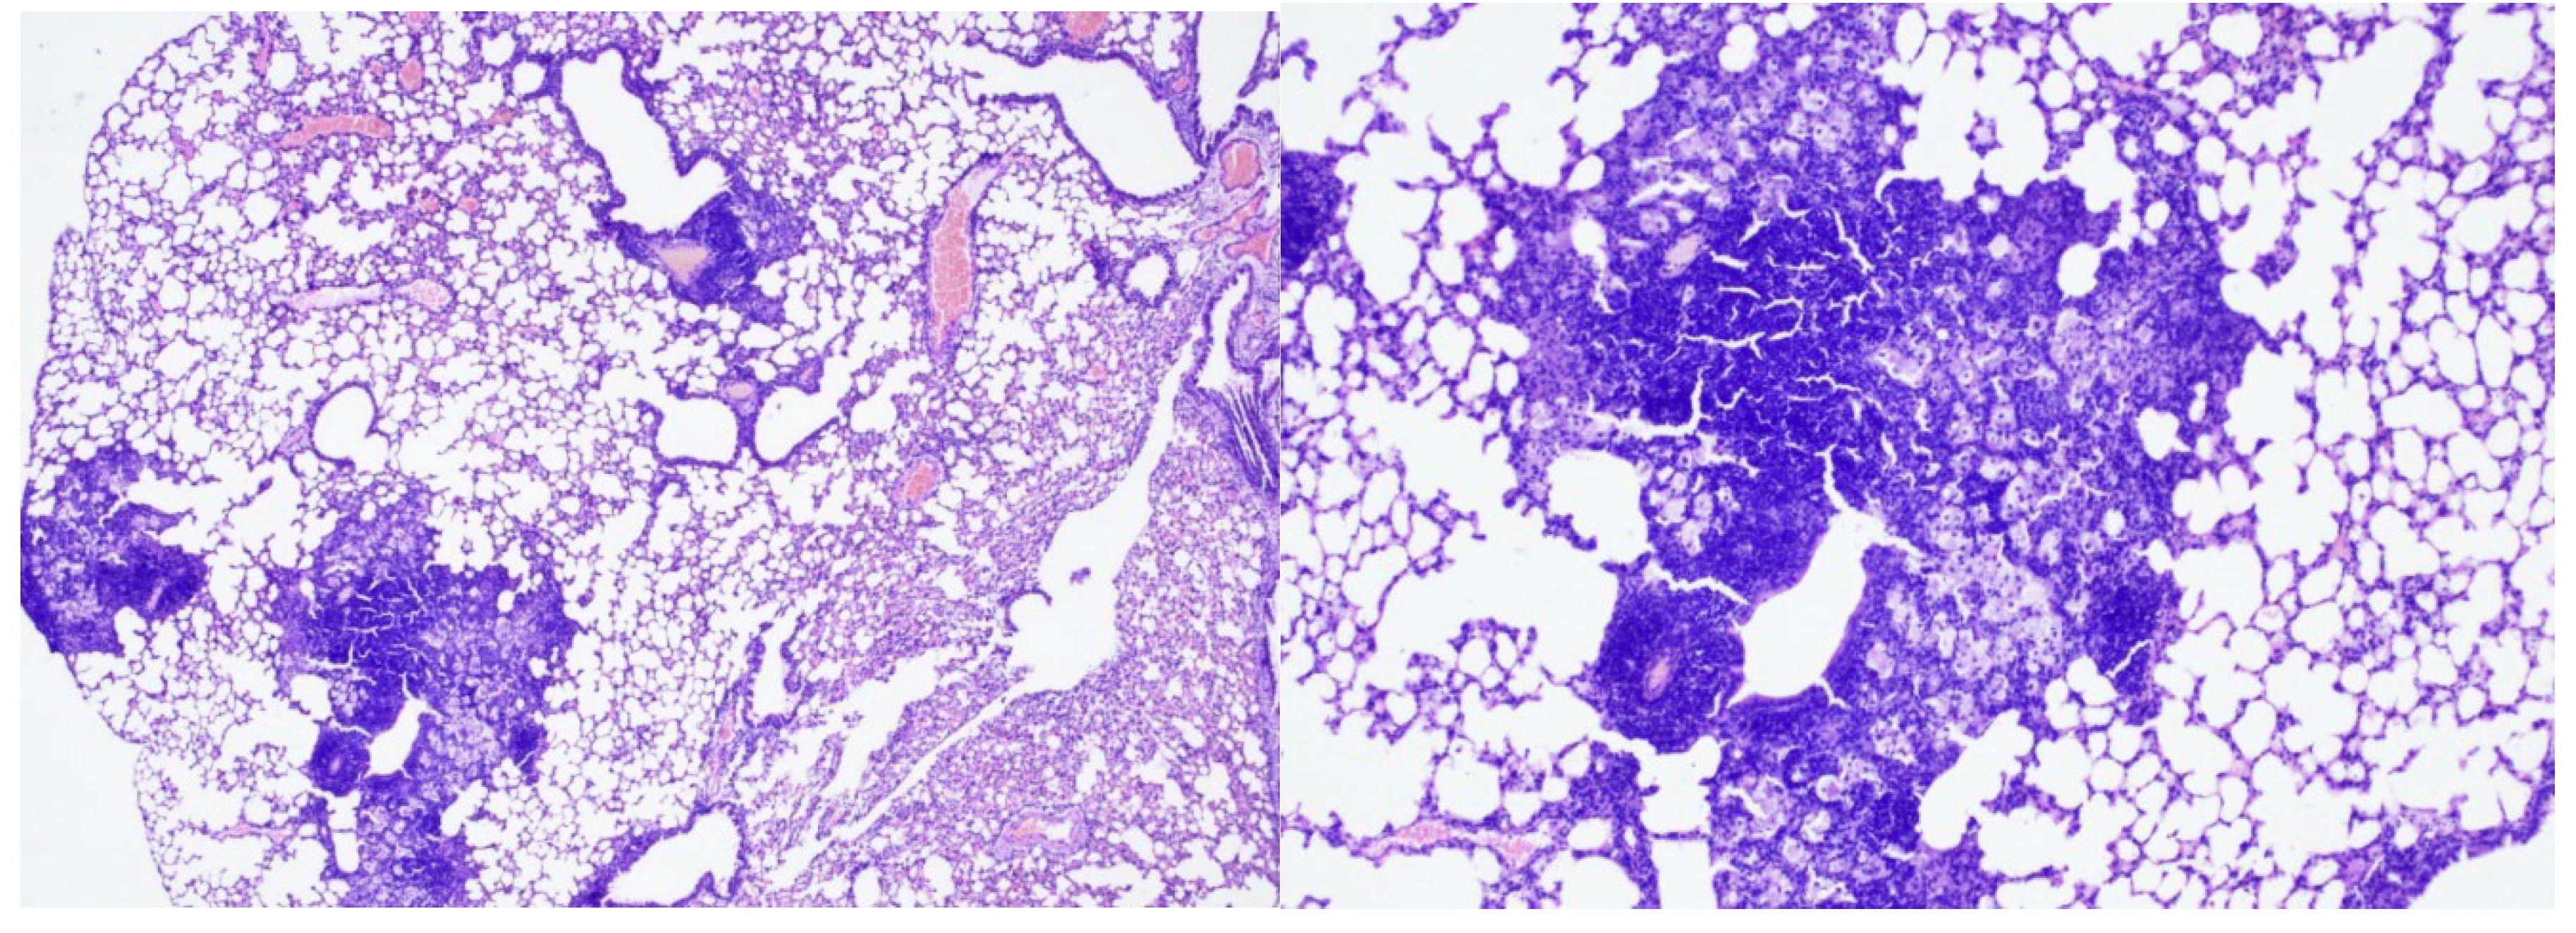
In group 1 (early control), Three weeks after
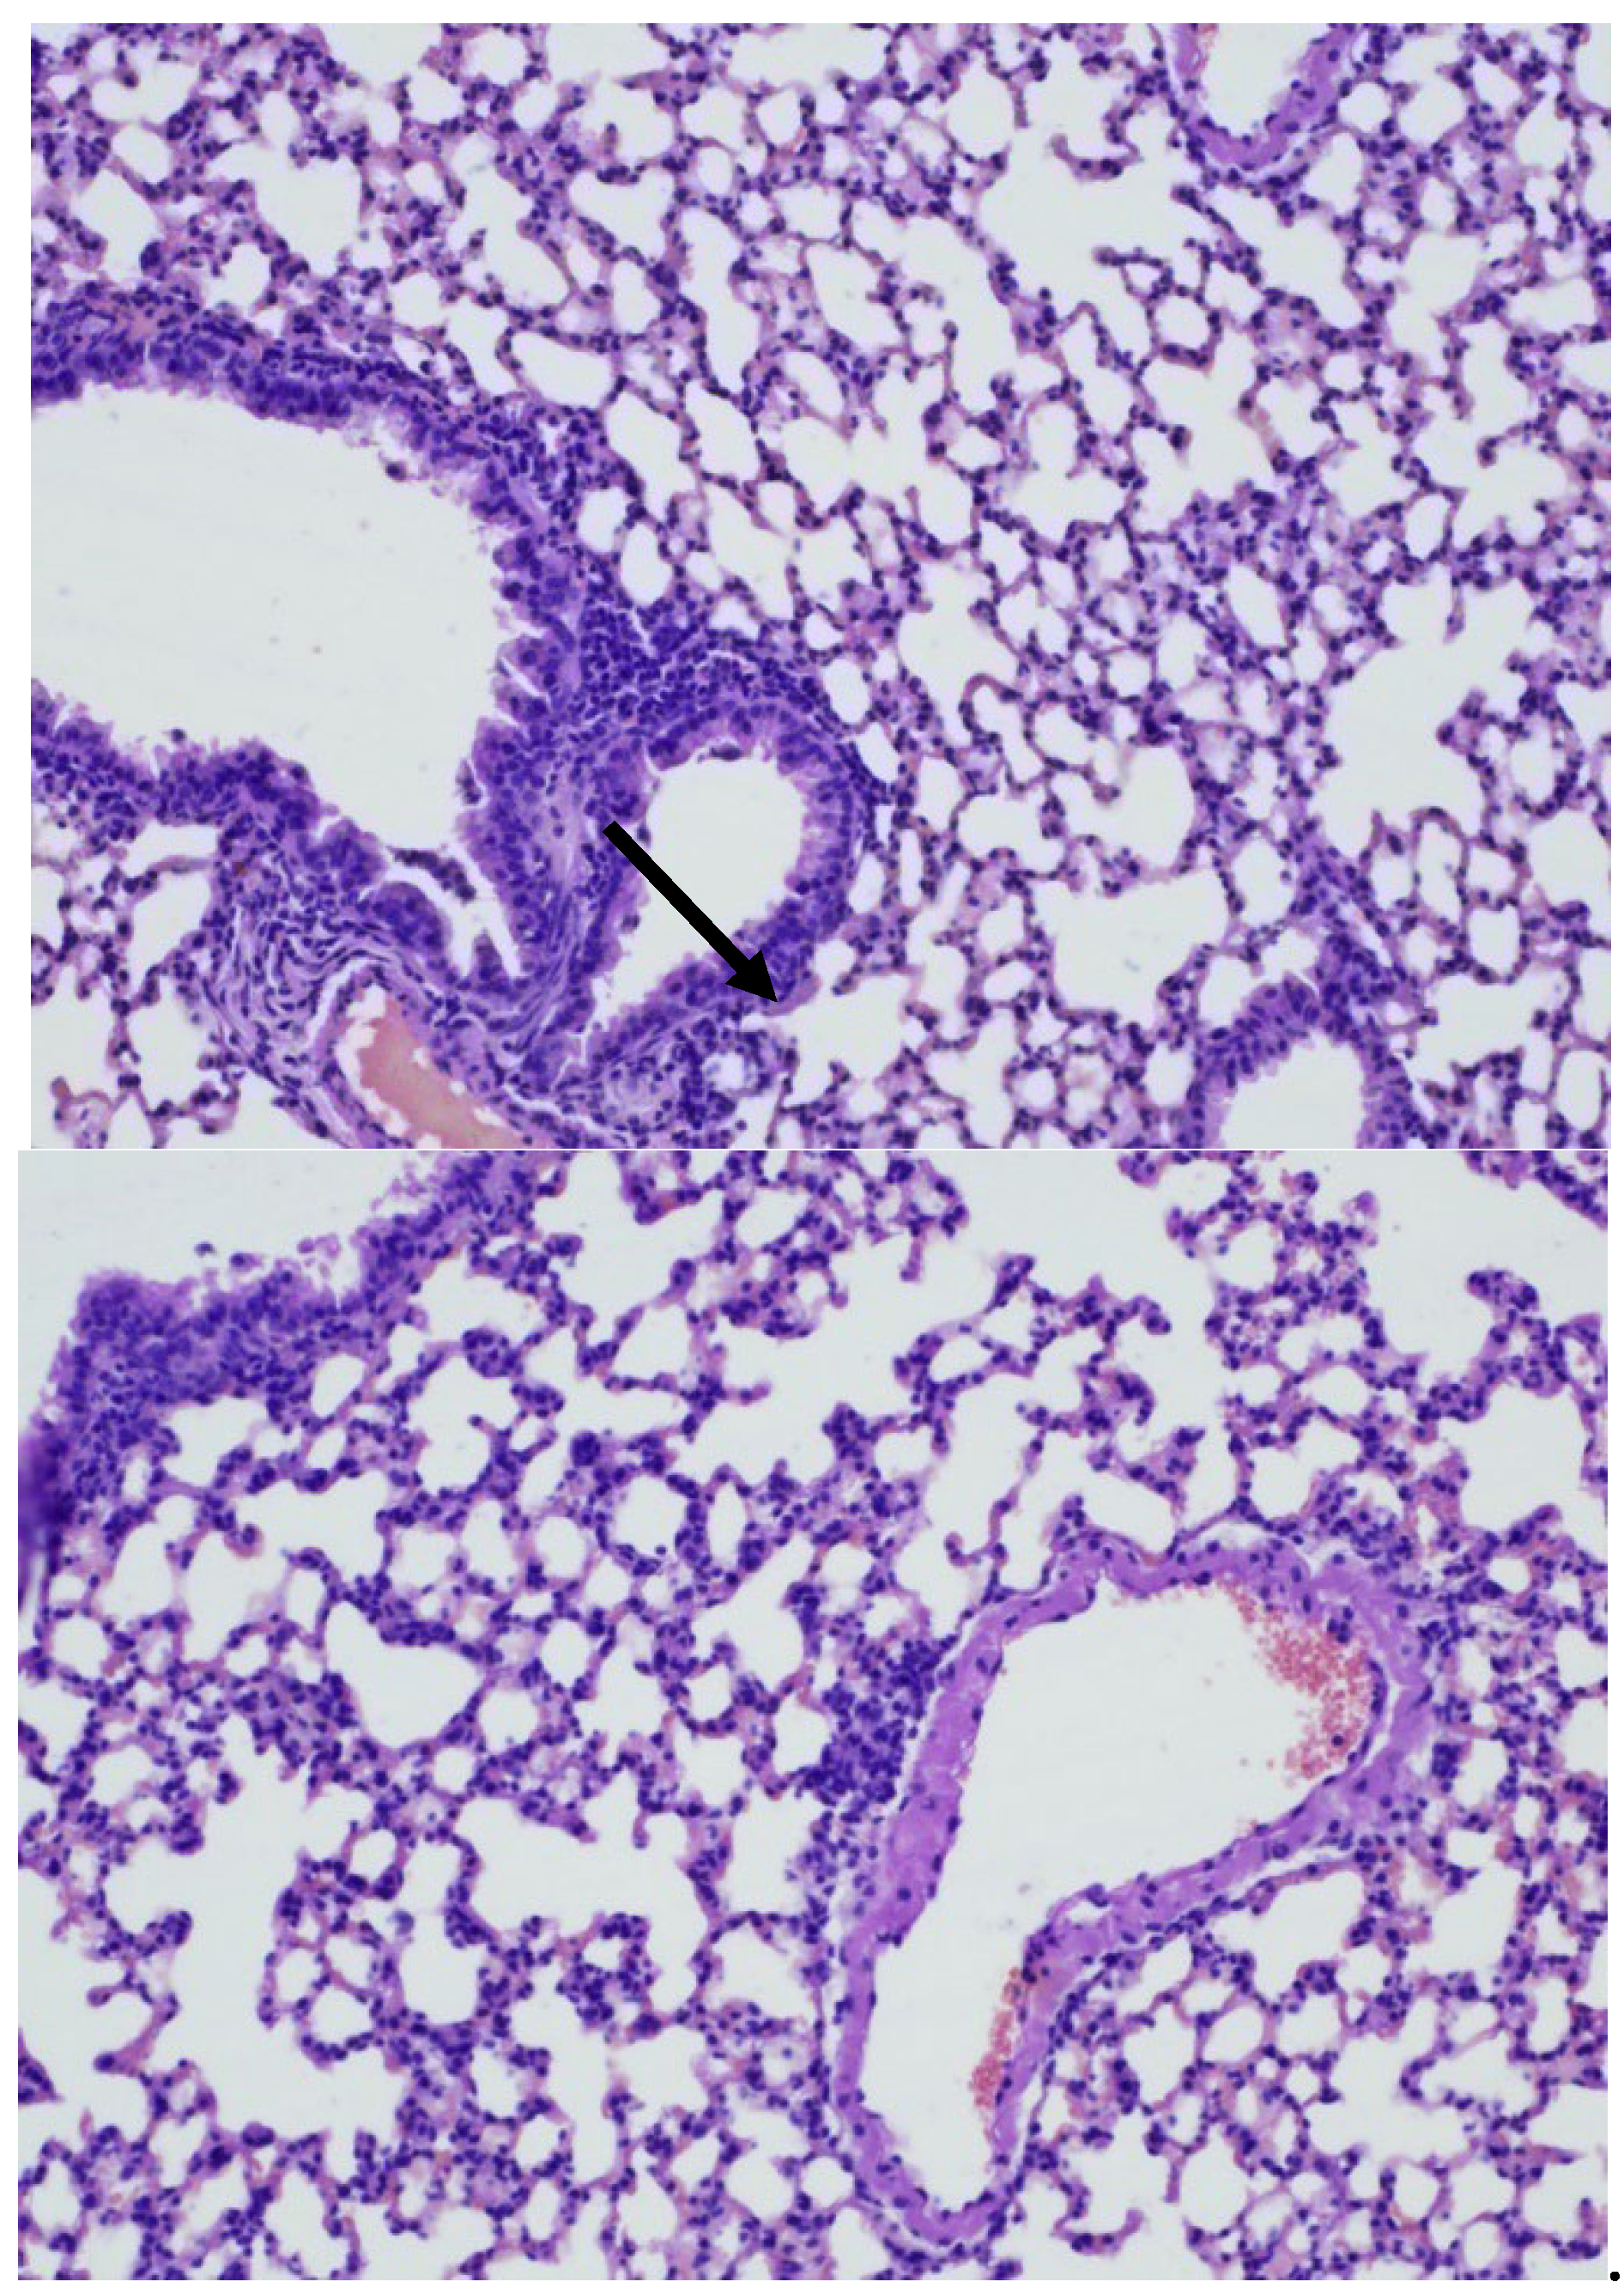
Mtb infection, slightly pronounced peribronchial round cell inflammatory infiltrates were recorded in the lung tissue. Airborne pulmonary parenchyma was observed with disruption of the integrity of individual inter alveolar septa. The lumens of the bronchi were round and oval in shape, with vascular congestion (
Figure 1 and 2) and peribronchial and perivascular single round cell accumulations were observed (
Figure 3 and 4).
Conclusion: In the early control group (Group 1), 3 weeks after Mtb infection, signs of inflammation were recorded in the form of slight inflammatory infiltration.
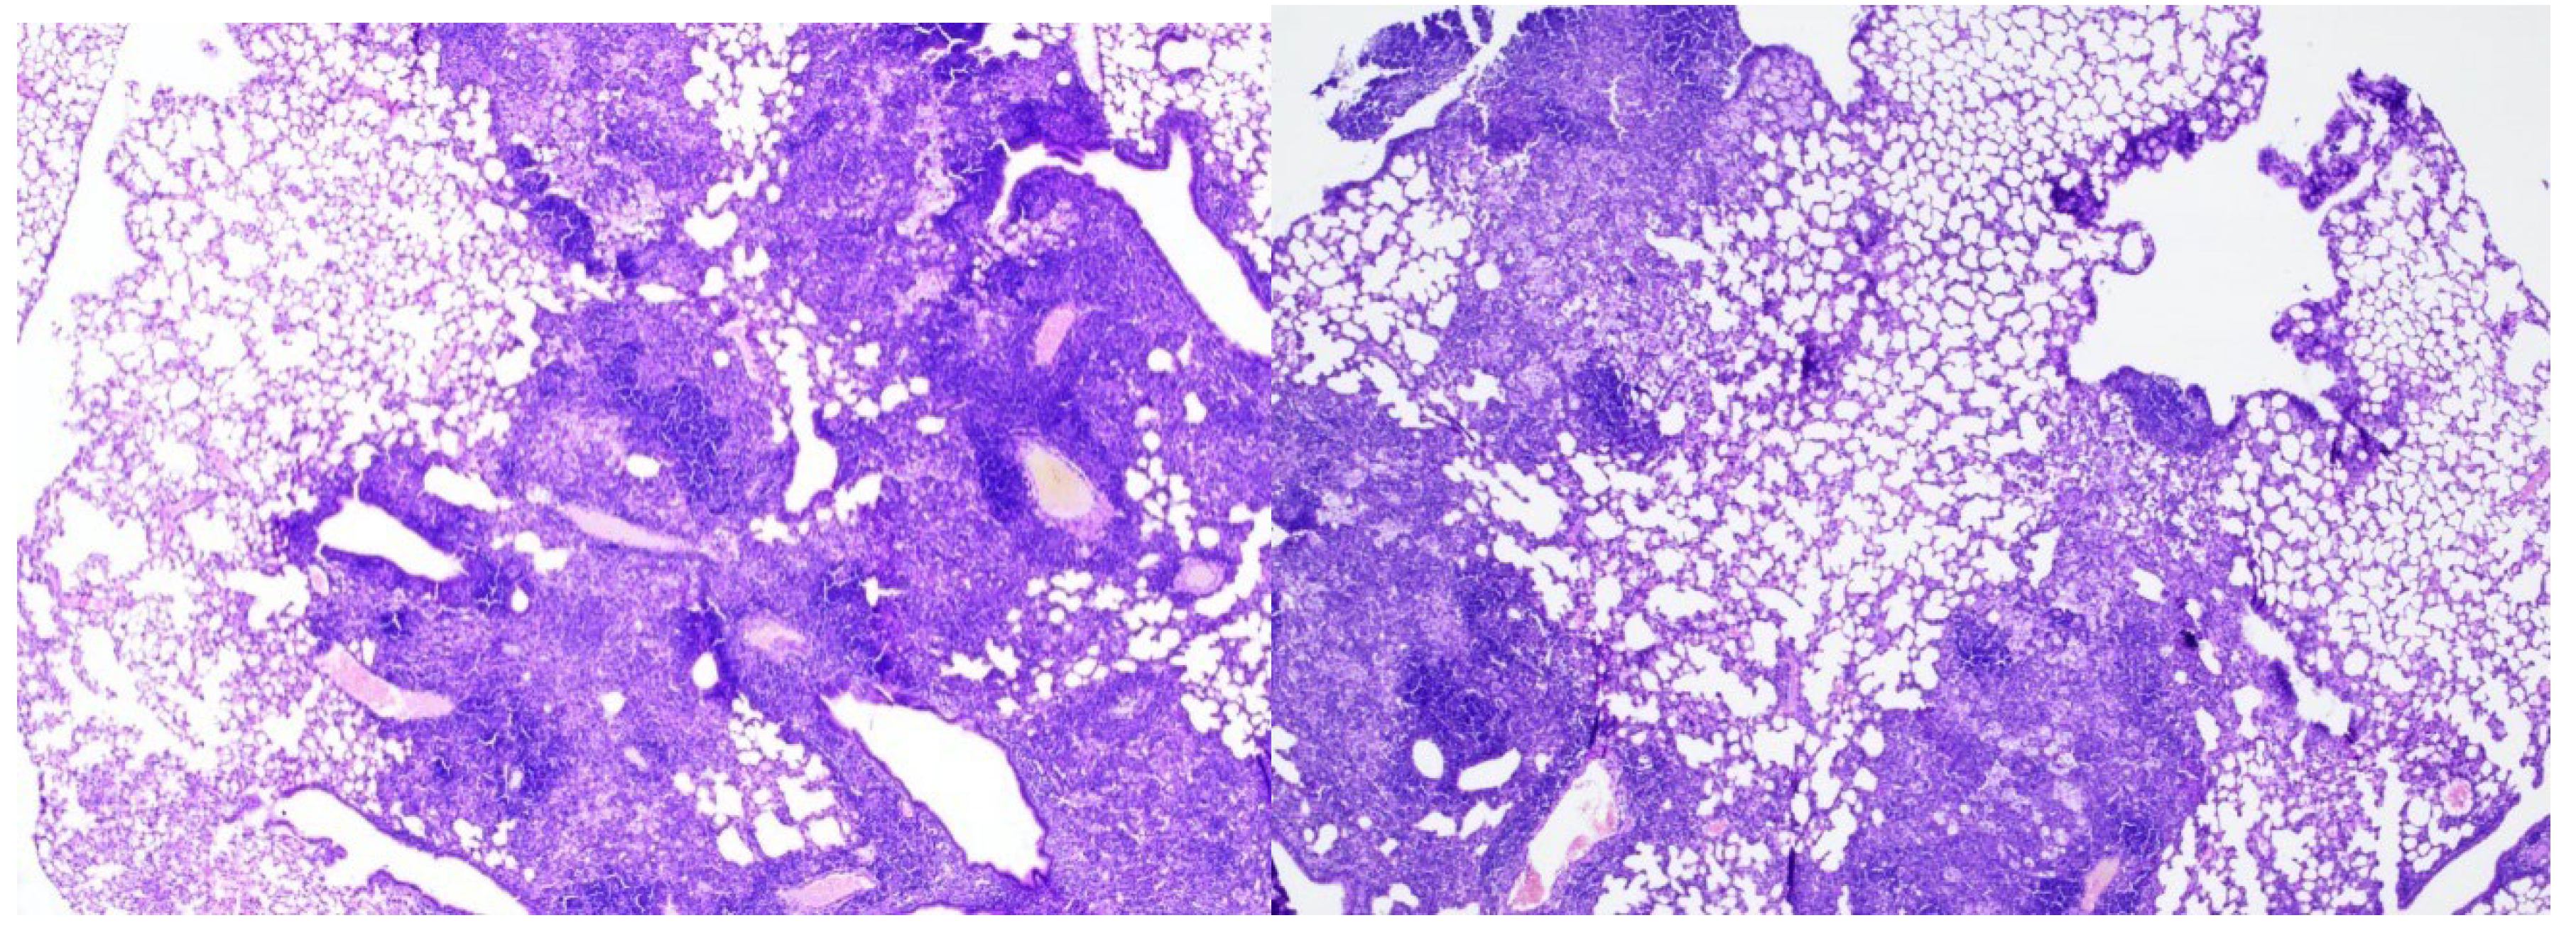
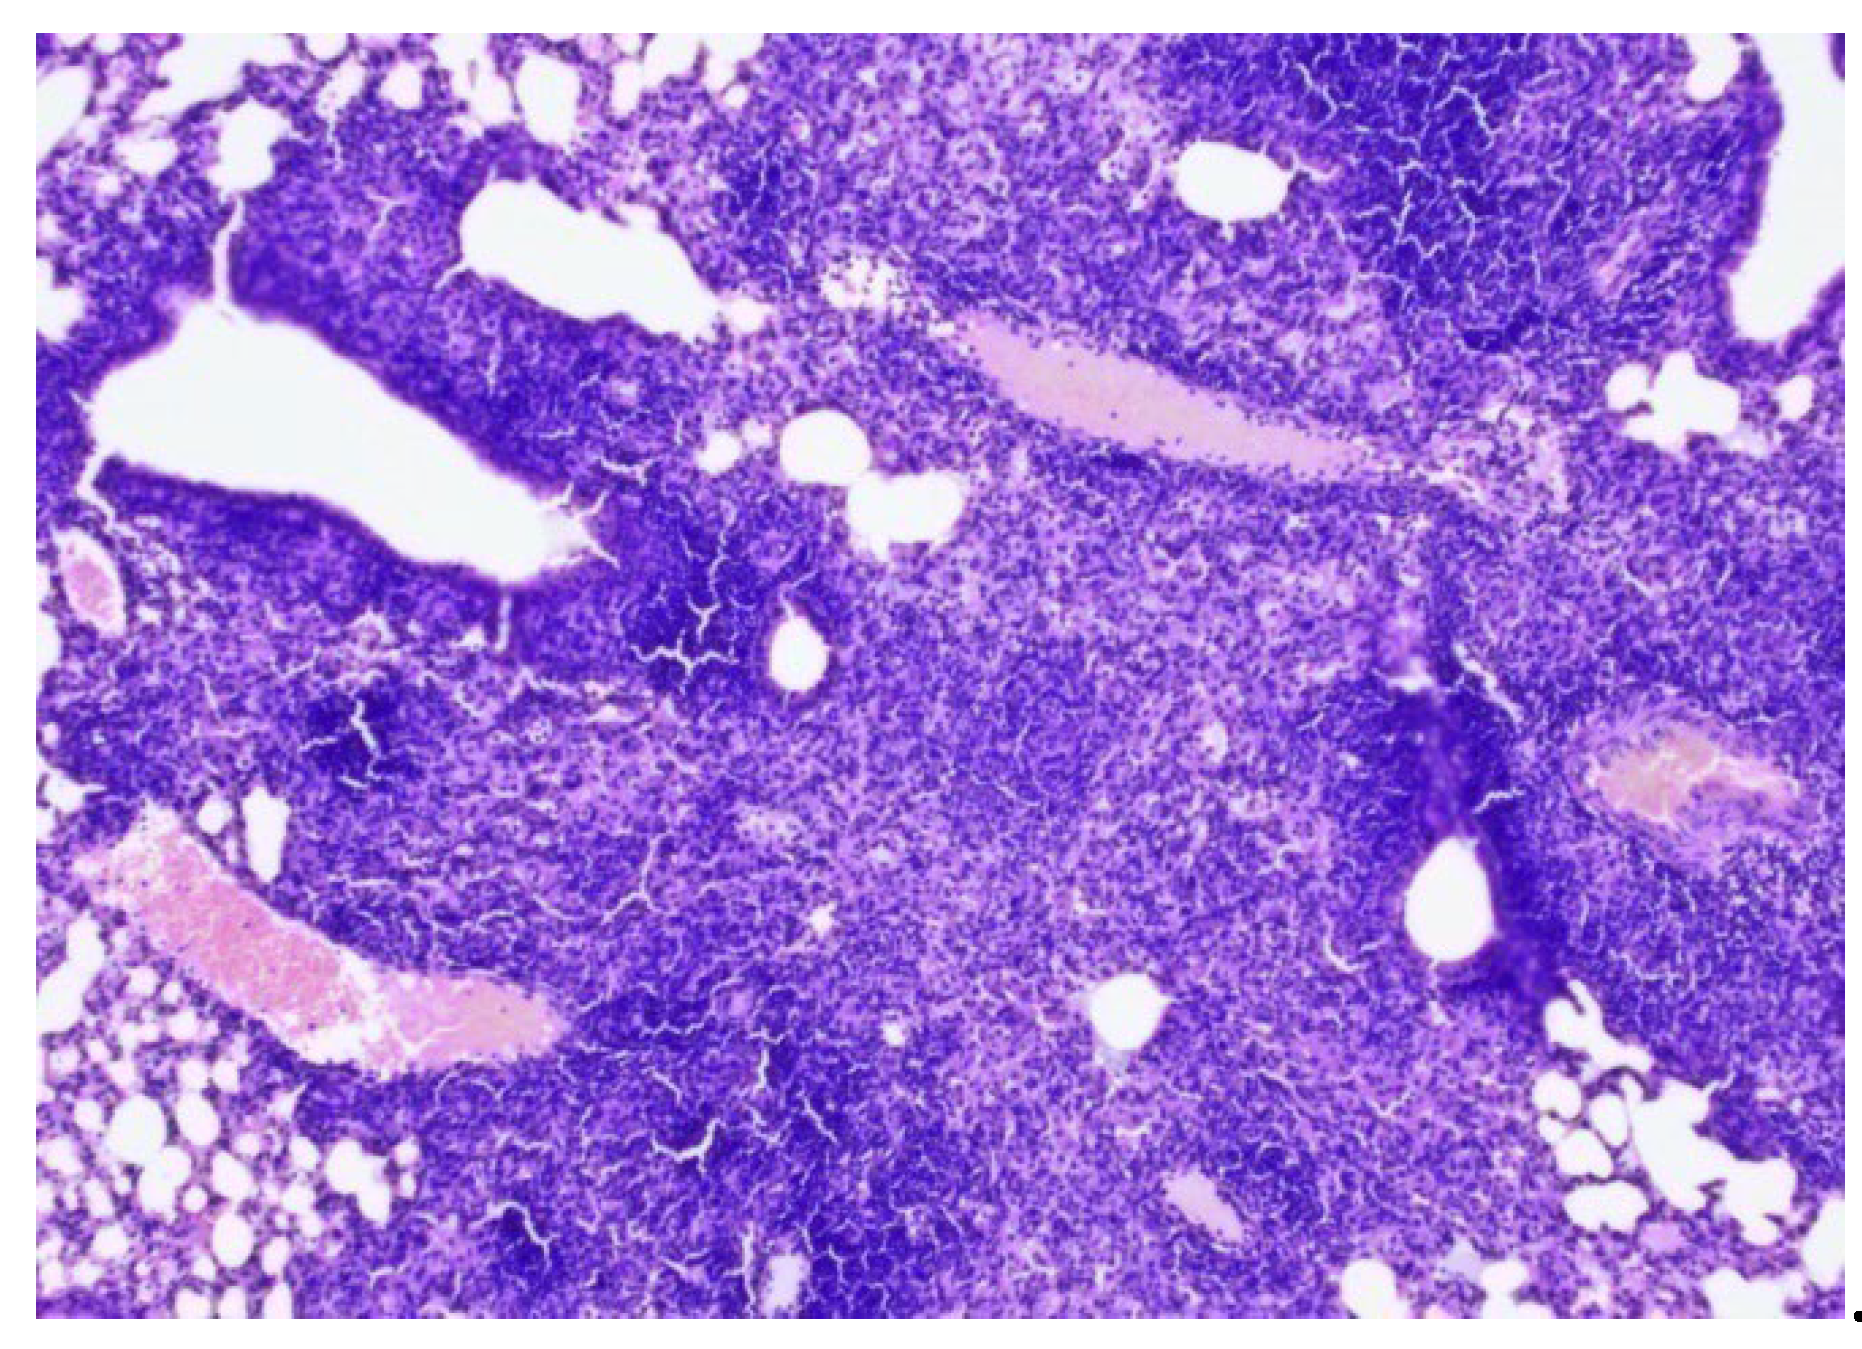
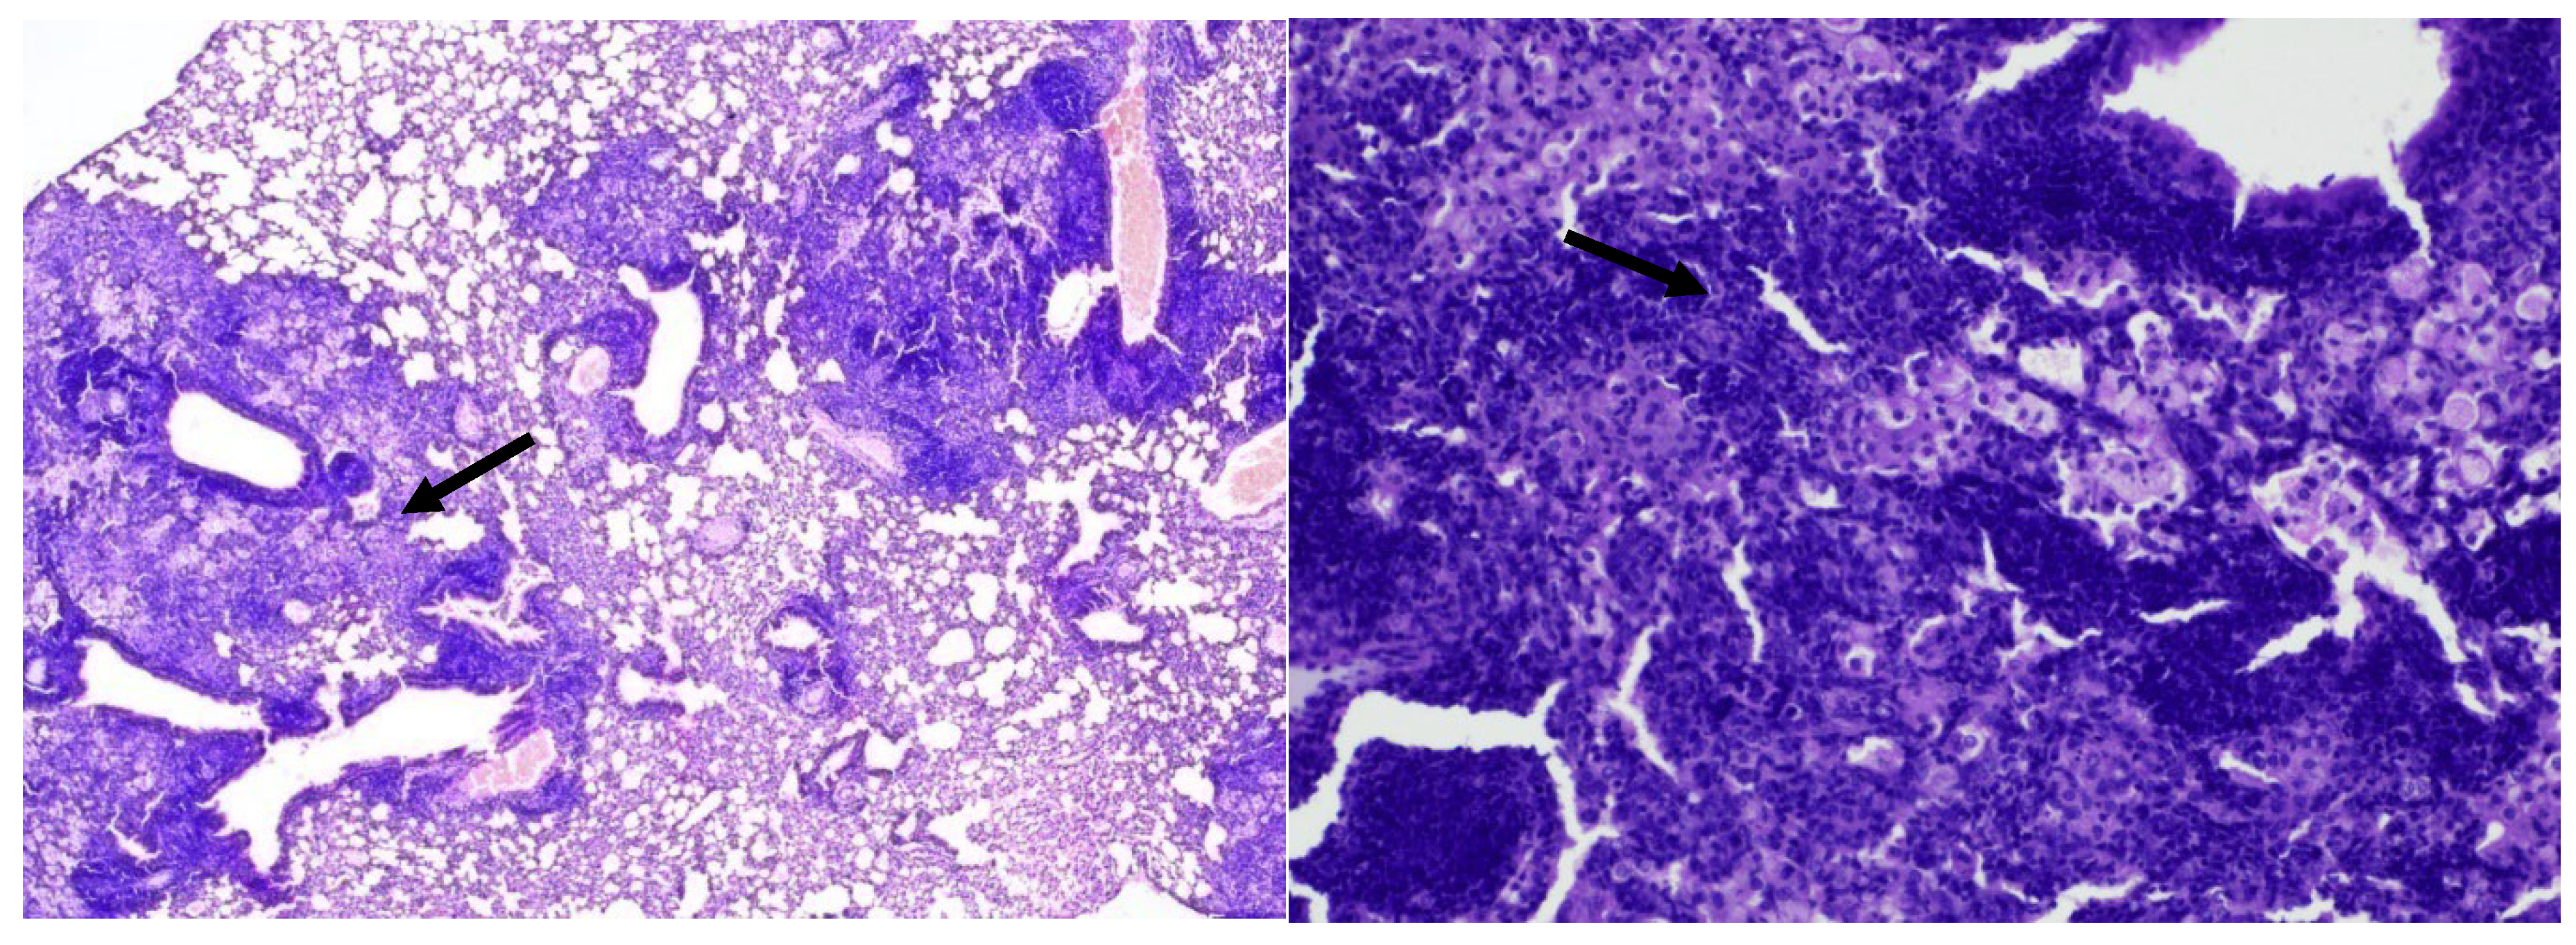
In the late control mice (Group 5), 7 weeks after Mtb infection, severe inflammation of the bronchopulmonary tissue was recorded in the lung tissue. In the pulmonary parenchyma, air fields were noted, alternating with airless areas filled with pronounced round cell inflammatory infiltration, an admixture of foamy macrophages, and the formation of focal accumulations; peribronchial and perivascular inflammatory infiltrates with melting disappearance of the interalveolar septa (
Figure 5, 6, 7).
Conclusion: In mice from the late control group (7 weeks after infection) compared to the early control group (3 weeks after infection), an increase in inflammatory changes in the lung tissue was noted in the form of pronounced and widespread infiltration with the appearance of foamy macrophages.
In the 2nd group of mice infected with
Mtb and treated with isoniazid, focal large cell inflammatory infiltration with an admixture of foamy macrophages, located predominantly peribronchial and perivascular, was detected in the lungs (
Figure 8, 9).
Conclusion: In mice of group 2 (treated with isoniazid), compared with the late control group, there was a decrease in the volume of inflammatory infiltration, localized mainly in the peribronchial space.
In the 3rd group of mice infected with Mtb and treated with ingaron, a pronounced round cell inflammatory infiltration with an admixture of foamy macrophages was detected in the lungs. Inflammatory infiltrates were recorded peribronchially with the involvement of adjacent pulmonary alveoli and perivascularly with infiltration of the vessel walls, without destructive changes (
Figure 10, 11).
Conclusion: Mice of the 3rd group showed more pronounced inflammation of the bronchopulmonary tissue compared to mice of the 2nd and 4th groups and identical results compared to the late control group.
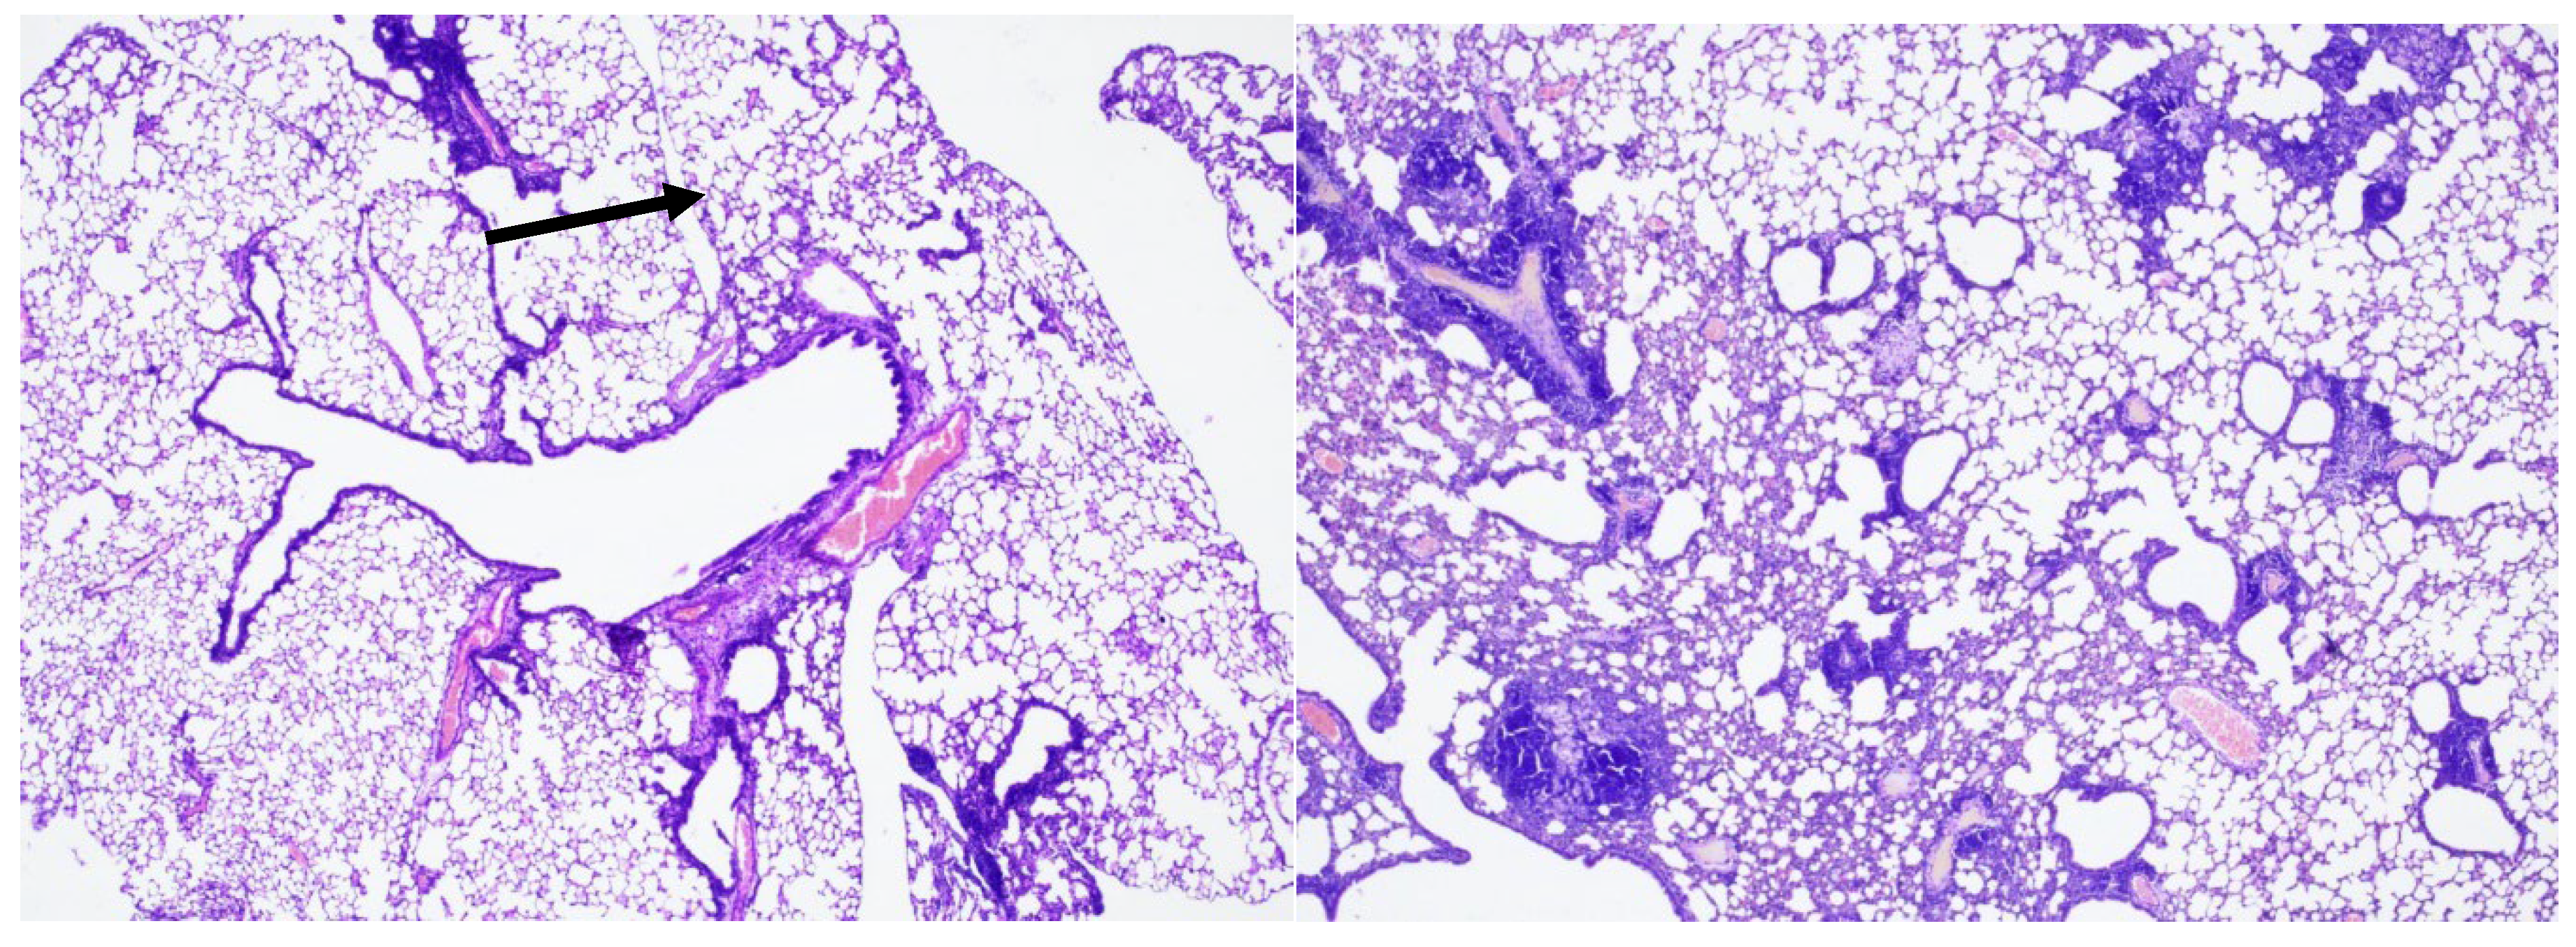
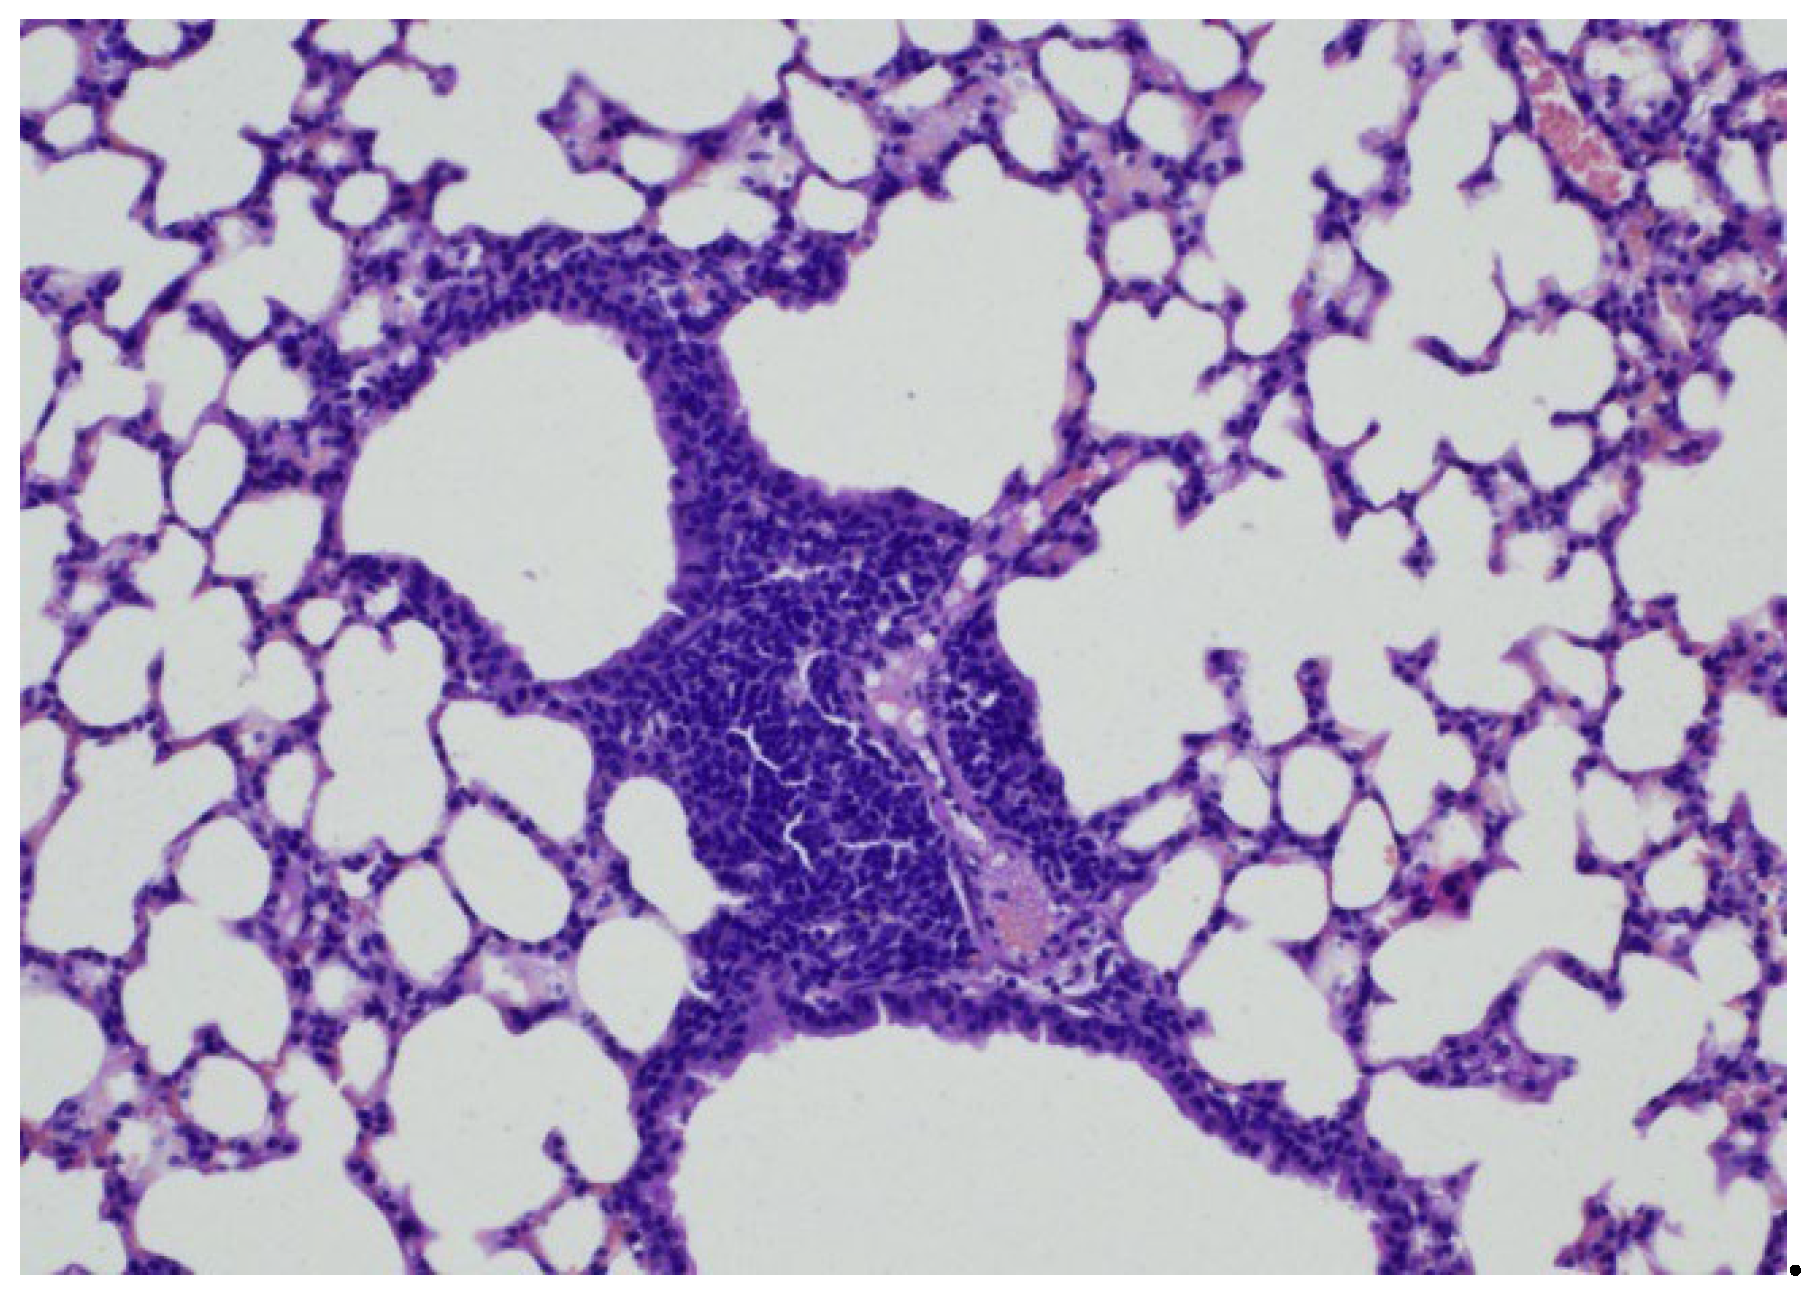
In the 4th group of mice infected with Mtb and treated with a combination of isoniazid and ingaron, a moderately pronounced focal round cell inflammatory infiltration was detected in the lungs, localized mainly perivascularly, along the periphery of individual bronchi and in some interalveolar septa (
Figure 12, 13, 14).
5. Conclusion:
In mice of the 4th group (treated with a combination of isoniazid and ingaron) compared with the 2nd and 3rd groups, less pronounced inflammatory infiltration was determined in the lung tissue.
Based on the results obtained, we made the following conclusions:
In BALB/c mouse model of experimental tuberculosis, treatment either with isoniazid or ingaron alone was effective, their combination, combination showed the greatest efficacy. Mice treated with Ingaron alone, despite increased inflammatory response in lungs, did not show significant increase in mycobacterial load.
The high efficacy of isoniazid and ingaron combination treatment was reflected by significantly lower weights of the lungs and spleens, a lower amount of bacterial load in both the lungs and spleens (CFU/organ) and less pronounced histopathological signs of inflammation in the lung tissue.
Thus, as demonstrated in this and previous studies, combination of IFN-γ with other anti-TB drugs enhances therapeutic efficacy, perhaps by augmenting host’s immune response.
References
- Gallegos AM, van Heijst JW, Samstein M, Su X, Pamer EG, Glickman MS. A gamma interferon independent mechanism of CD4 T cell mediated control of M. tuberculosis infection in vivo. PLoS Pathog. 2011. 7(5):e1002052. [CrossRef]
- Green A.M., Di Fazio R., Flynn JA. L. IFN-γ from CD4 T cells is essential for host survival and enhances CD8 T Cell Function during Mycobacterium tuberculosis infection J. Immunol. 2013; 190 (1): 270–277. [CrossRef]
- Serbina N. V., Lazarevic V., Flynn J. L. CD4(+) T cells are required for the development of cytotoxic CD8(+) T cells during Mycobacterium tuberculosis infection. J. Immunol. 2001.167: 6991–7000. [CrossRef]
- MarchiL.F., Sesti-Costa R., Ignacchiti M.D.C., Chedraoui-Silva S., B. Mantovani B.In vitro activation of mouse neutrophils by recombinant human interferon-gamma: Increased phagocytosis and release of reactive oxygen species and pro-inflammatory cytokines. [CrossRef]
- Gao X.-F., Yang Z.-W., Li J. Adjunctive therapy with interferon-gamma for treatment of pulmonary tuberculosis: a systematic review. Int. J. Infect. Dis. 2011, 15, e594-e600. [CrossRef]
- Khan T.A., Mazhar H, Saleha S. H.N., Muhammad N., and Abbas M.N. Interferon-gamma improves macrophages function against M. tuberculosis in multidrug-resistant tuberculosis patients. Chemother. Res. Res. and Practice V. 2016, Article ID 7295390, 6 pages. [CrossRef]
- Cooper AM, Dalton DK, Stewart TA, Griffin JP, Russell DG, et al. Disseminated tuberculosis in interferon gamma gene-disrupted mice. J Exp Med. 1993. 178: 2243–2247. [CrossRef]
- Lenaerts AJ, Gruppo V, Brooks JV, Orme IM. Rapid in vivo screening of experimental drugs for tuberculosis using gamma interferon gene-disrupted mice. Antimicrob Agents Chemother. 2003 Feb;47(2):783-5. [CrossRef]
- Riazi H., Zeligs B., Yeager H. et al. Rapid diagnosis of Mycobacterium tuberculosis infection in children using interferon-gamma release assay. Allergy and Asthma Proc., 2012. 33: 217-226. [CrossRef]
|
Disclaimer/Publisher’s Note: The statements, opinions and data contained in all publications are solely those of the individual author(s) and contributor(s) and not of MDPI and/or the editor(s). MDPI and/or the editor(s) disclaim responsibility for any injury to people or property resulting from any ideas, methods, instructions or products referred to in the content. |
© 2024 by the authors. Licensee MDPI, Basel, Switzerland. This article is an open access article distributed under the terms and conditions of the Creative Commons Attribution (CC BY) license (http://creativecommons.org/licenses/by/4.0/).
