Preprint
Article

Early Changes in Alpha-Fetoprotein and Des-γ-Carboxy Prothrombin Are Useful Predictors of Antitumor Response to Durvalumab Plus Tremelimumab Therapy for Advanced Hepatocellular Carcinoma

Submitted:

27 June 2024

Posted:

01 July 2024

You are already at the latest version

A peer-reviewed article of this preprint also exists.

Abstract
The relationship between antitumor response and tumor marker changes was evaluated in patients with advanced hepatocellular carcinoma treated with durvalumab plus tremelimumab (Dur/Tre). Thirty-two patients were enrolled in this retrospective evaluation of treatment outcomes. According to Response Evaluation Criteria for Solid Tumors at 8 weeks, the objective response rate (OR) was 25% and the disease control rate (DC) was 56.3%. Median alpha-fetoprotein (AFP) ratio at 4 weeks was 0.310 in patients who achieved OR at 8 weeks (8W-OR group), significantly lower than the 1.105 in the non-8W-OR group (p=0.0020), but was 1.210 in patients who did not achieve DC at 8 weeks (non-8W-DC group), significantly higher than the 0.470 in the 8W-DC group (p=0.0006). Similarly, median des-γ-carboxy-prothrombin (DCP) ratio at 4 weeks was 0.125 in the 8W-OR group, significantly lower than the 1.225 in the non-8W-OR group (p=0.0001), but was 1.120 in the non-8W-DC group, significantly higher than the 0.480 in the 8W-DC group (p=0.0255). Early changes in tumor markers after Dur/Tre initiation were associated with antitumor response. In particular, changes in AFP and DCP at 4 weeks may offer useful biomarkers for early prediction of both response and progressive disease following Dur/Tre.
Keywords: 
Subject: 
Medicine and Pharmacology  -   Gastroenterology and Hepatology

1. Introduction

In the Phase III HIMALAYA trial [1], the combination of durvalumab (an anti-programmed cell death ligand-1 antibody) and tremelimumab (an anti-cytotoxic T-lymphocyte-associated protein 4 [CTLA-4] antibody) demonstrated an overall survival (OS) benefit over sorafenib in patients with advanced hepatocellular carcinoma (HCC). Based on these positive results, the combination of durvalumab and tremelimumab (Dur/Tre) is now recommended as a first-line systemic therapy for advanced HCC, as is atezolizumab plus bevacizumab (Atz/Bev) [2,3]. However, no reports have detailed Dur/Tre outcomes in actual clinical practice, and whether Dur/Tre will have the same efficacy and safety profile as in clinical trials has remained unclear.
Measuring concentrations of tumor markers for HCC, namely alpha-fetoprotein (AFP) and des-gamma-carboxyprotein (DCP), is less invasive and more common than tumor biopsy or imaging, and is widely used not only for diagnosing HCC, but also as an adjunctive diagnosis to determine treatment efficacy for HCC [4,5]. Several studies have reported associations between changes in AFP and DCP and treatment response and prognosis following treatment with molecularly targeted agents (MTA) such as sorafenib [6,7,8] and lenvatinib [9,10,11], and in combined immunotherapy with atezolizumab plus bevacizumab [12,13,14,15]. During the initial phase of using Dur/Tre at our institution, several cases were encountered in which patients with significant decreases in AFP and DCP early after initiation of Dur/Tre showed good antitumor response, whereas patients showing rapid increases in these markers showed poor antitumor responses. In the HIMALAYA study, changes in tumor markers during Dur/Tre were not reported in detail, and the relationship between changes in these tumor markers and the therapeutic effects of Dur/Tre have remained unclear.
In this study, we investigated changes in AFP, DCP, and the lens culinaris agglutinin-reactive fraction of alpha-fetoprotein (AFP-L3) in the early period after initiating Dur/Tre. We also evaluated the correlation between changes in these tumor markers and antitumor response to Dur/Tre. Finally, we also analyzed factors contributing to progression-free survival (PFS).

2. Materials and Methods

2.1. Patients

Participants comprised 40 patients with advanced HCC who were not eligible for hepatic resection, puncture ablation, or hepatic arterial chemoembolization introduced to Dur/Tre at our hospital from March 2023 to May 2024. Thirty-two patients for whom information was available on antitumor response at 8 weeks after initiation of Dur/Tre were enrolled in this study for retrospective evaluation of treatment outcomes.

2.2. Dur/Tre Treatment, Evaluation of Adverse Events, and Changes in Liver Function

All patients received durvalumab 1500 mg and tremelimumab 300 mg intravenously on the first administration. Thereafter, durvalumab 1500 mg was administered every 4 weeks. Adverse events (AEs) were evaluated according to the Common Terminology Criteria for Adverse Events (CT-CAE), 5th edition [16]. In the event of a drug-related AE, durvalumab was temporarily interrupted until symptoms improved to grade 1 or 2, according to guidelines provided by the manufacturer. Dur/Tre treatment was continued until a potentially fatal AE occurred or the tumor progressed clinically. To assess changes in liver function, albumin-bilirubin (ALBI) scores [17] were examined at baseline and at weeks 1, 2, 4, and 8 after Dur/Tre initiation.

2.3. Determination of Antitumor Response

Evaluation of antitumor response to Dur/Tre was performed according to Response Evaluation Criteria in Solid Tumors (RECIST) version 1.1 [18] and modified RECIST (mRECIST) [19]. Dynamic computed tomography (CT) was performed at baseline, 8 weeks after initiation of Dur/Tre, and every 4–12 weeks thereafter according to a predefined schedule.

2.4. Evaluation of Changes in AFP, DCP, and AFP-L3

Serum AFP and DCP were measured as tumor markers for HCC at baseline and after 2, 4, and 8 weeks of Dur/Tre. AFP-L3 was measured at baseline and after 4 and 8 weeks of Dur/Tre. For each patient, the baseline concentration of each tumor marker was set to 1, and the ratio of each tumor marker to baseline was calculated at weeks 2, 4, and 8 of treatment. Analysis of tumor marker changes was performed in patients with AFP ≥ 10 ng/ml, DCP ≥ 40 mAU/ml, and AFP-L3 ≥ 0.5%, excluding those in the normal range of tumor markers at baseline.

2.5. Statistical Analysis

Statistical analysis was performed using Easy R (EZR) version 1.29 (Saitama Medical Center, Jichi Medical University) [20]. Statistical analysis was performed using Fisher's direct probability test, Mann-Whitney U test, Wilcoxon rank-sum test, Friedman test, Bonferroni method, etc., as appropriate. PFS and overall survival (OS) were evaluated using the Kaplan–Meier method, and differences in survival were evaluated by the log-rank test. The Cox proportional hazards model was used to analyze factors contributing to PFS. For all analyses, the significance level was set at less than 0.05.

3. Results

3.1. Patient Characteristics at Baseline

Table 1 shows the baseline characteristics of the 32 HCC patients enrolled in this study at the start of Dur/Tre. Median age was 75 years, 27 patients were men, and 21 had non-viral HCC. The treatment line of Dur/Tre was 1st-line in 15 patients, 28 had ECOG-PS 0, 16 had Child–Pugh score 5, and 14 had BCLC C stage HCC. Median levels of AFP, DCP, and AFP-L3 at baseline were 138 ng/ml (range: 1.7-17,239 ng/ml), 2068 mAU/ml (range: 10-162,000), and 19.1% (range: <0.5–88.1%), respectively. Median neutrophil-to-lymphocyte ratio (NLR) level at baseline was 2.73 (range: 1.36–10.95). The median observation period was 8.0 months (range: 1.5–13.6 months).

3.2. Antitumor Response at 8 Weeks after Dur/Tre Initiation According to RECIST and mRECIST

Antitumor responses at 8 weeks after Dur/Tre initiation according to RECIST (8W-RESIST) were complete response (CR) in 0 patients, partial response (PR) in 8 patients, stable disease (SD) in 10 patients, progressive disease (PD) in 13 patients and not evaluated (NE) in 1 patient (Table 2). The CR rate (CRR), objective response rate (ORR) and disease control rate (DCR) were 0%, 25.0% and 56.3%, respectively. According to mRECIST at 8 weeks after Dur/Tre initiation, 3 patients had CR, 7 had PR, 8 had SD, 13 had PD, and 1 had NE, with a CRR of 9.4%, ORR of 31.3%, and DCR of 56.3%, respectively.

3.3. PFS and OS by 8W-RESIST

Median PFS in all 32 patients was 5.7 months (95% confidence interval [CI]: 1.8–11.1 months) (Figure 1a). Median PFS stratified by 8W-RECIST was not reached (NR) (95%CI: 6.4–NR) in the CR + PR group (n = 8), 6.7 months (95%CI: 3.7–NR) in the SD group (n = 10) and 1.8 months (95%CI: 1.5–1.8 months) in the PD + NE group (n = 14) (Figure 1b).
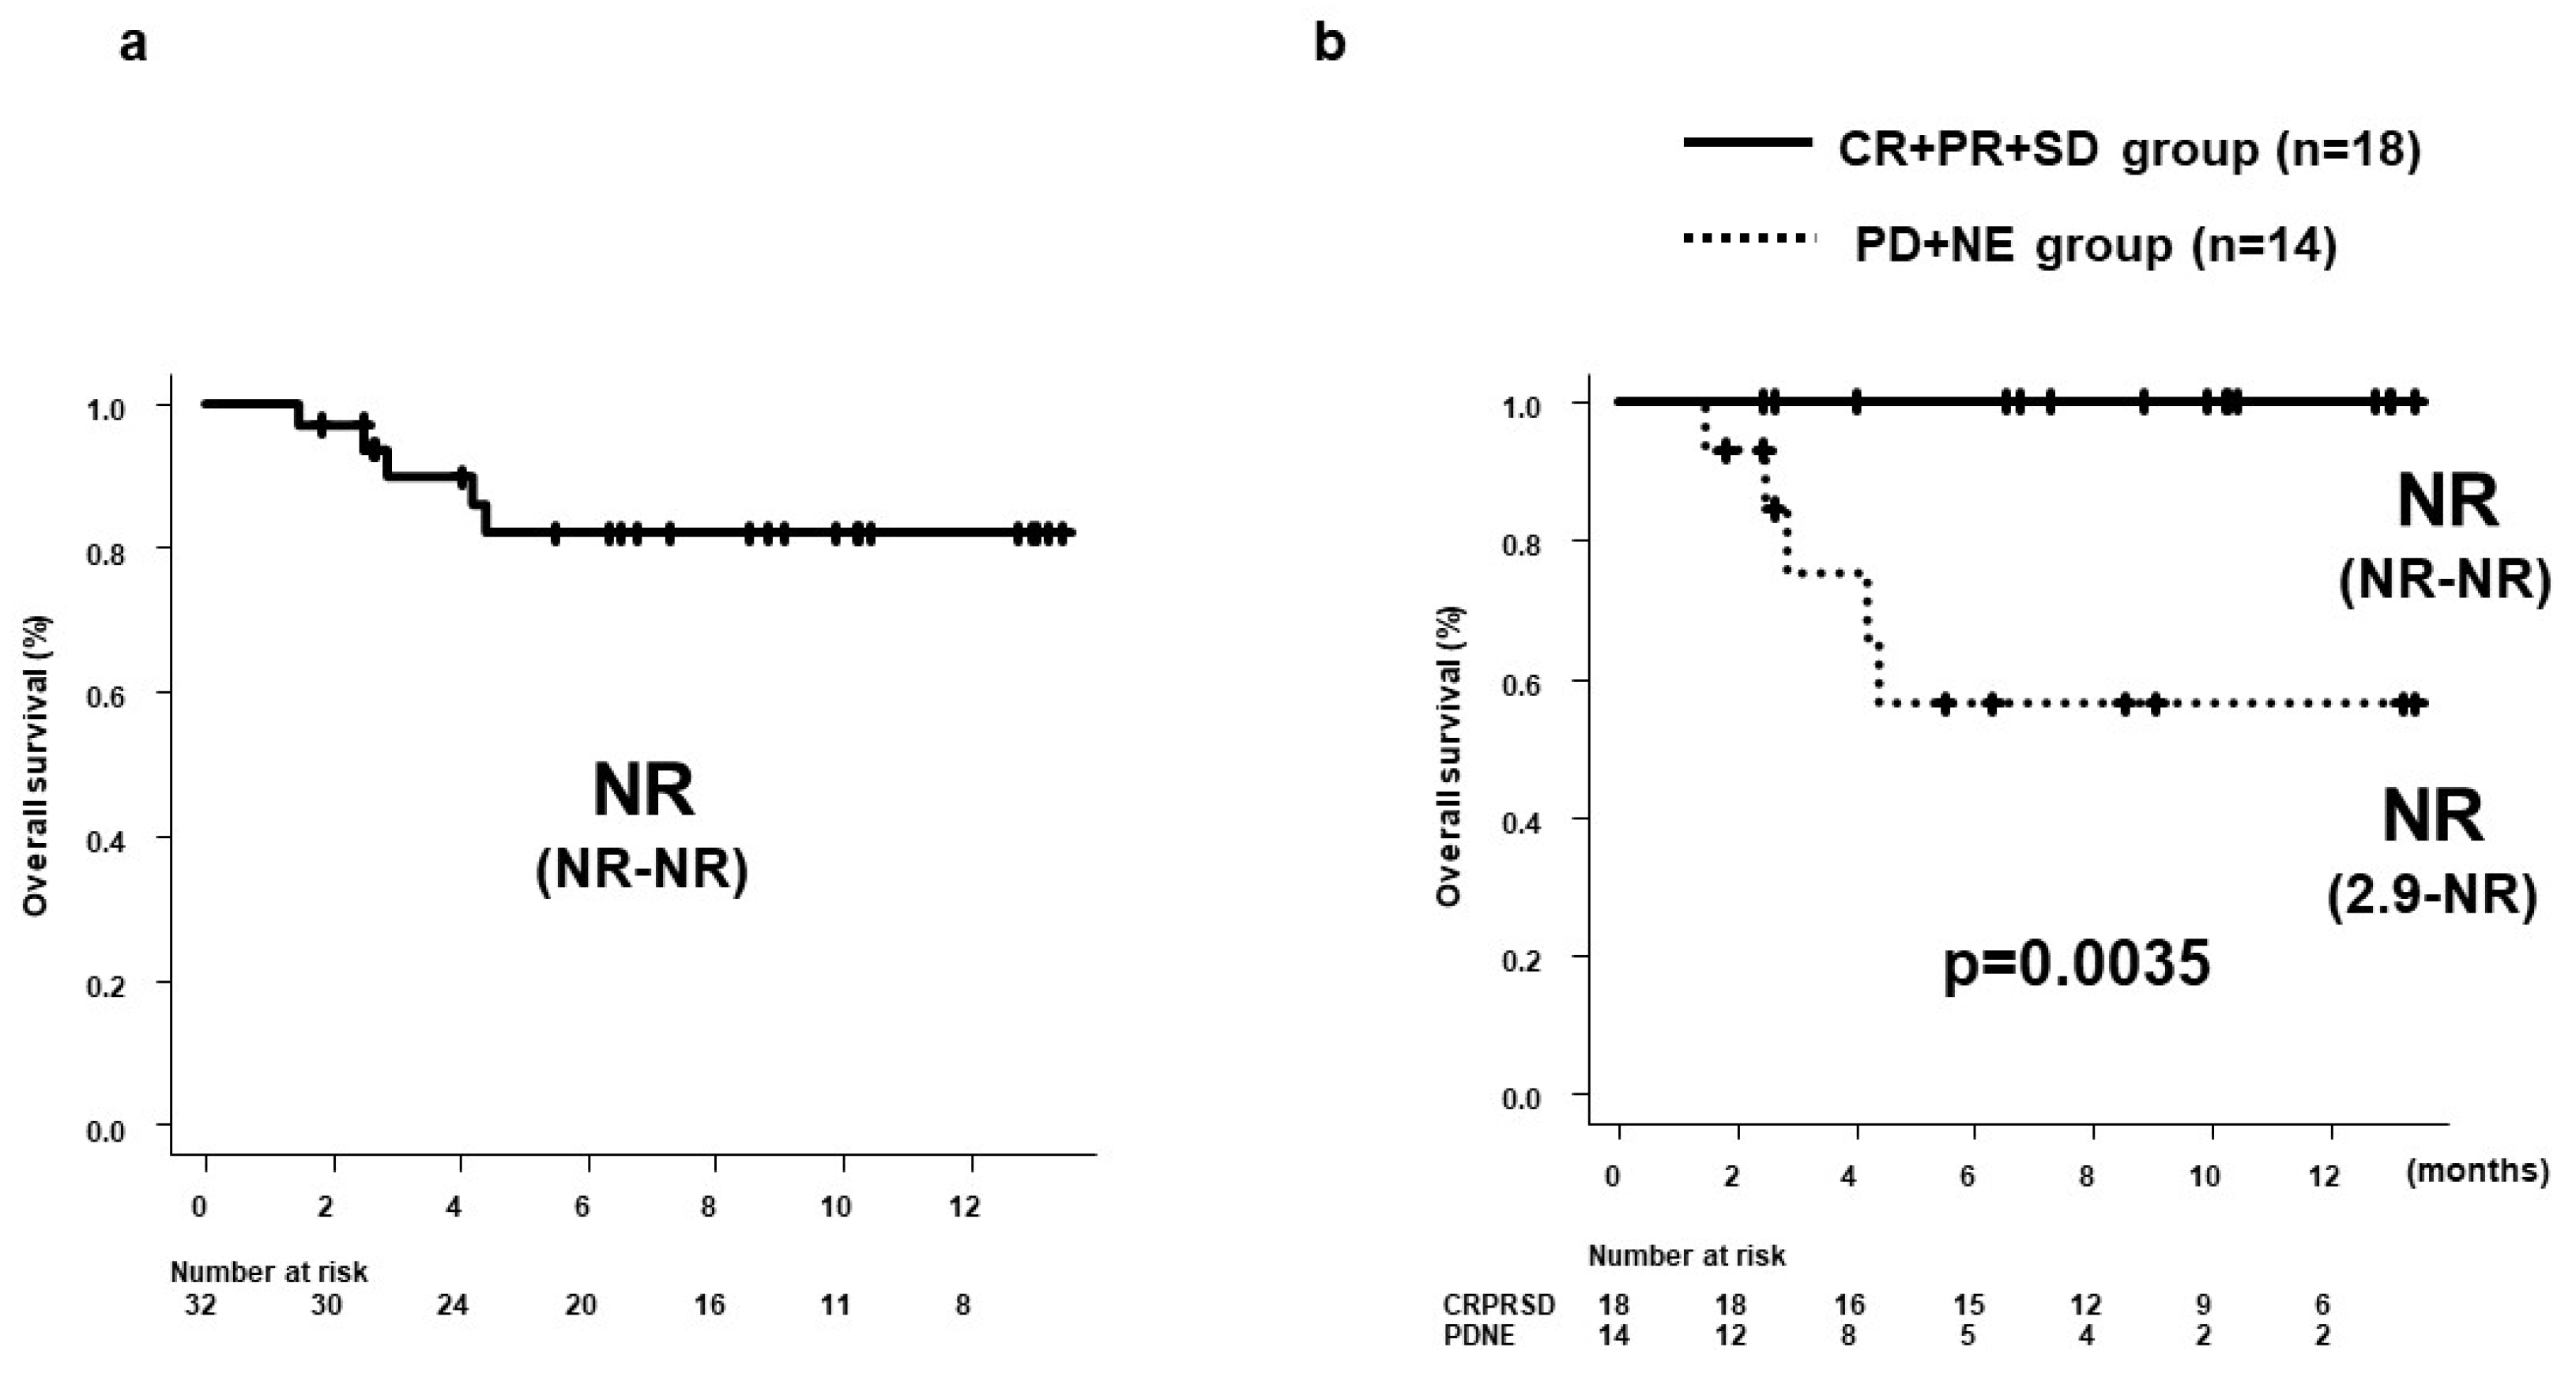
Median OS in all 32 patients was NR (95%CI: NR–NR) (Figure 2a). Median OS in the CR + PR + SD group was NR (95%CI: NR–NR), significantly longer than the NR (95%CI: 2.9 months—NR) in the PD + NE group (p = 0.0035) (Figure 2b).

3.4. AFP Ratios at 2, 4, and 8 Weeks after Dur/Tre Initiation, Stratified by 8W-RECIST

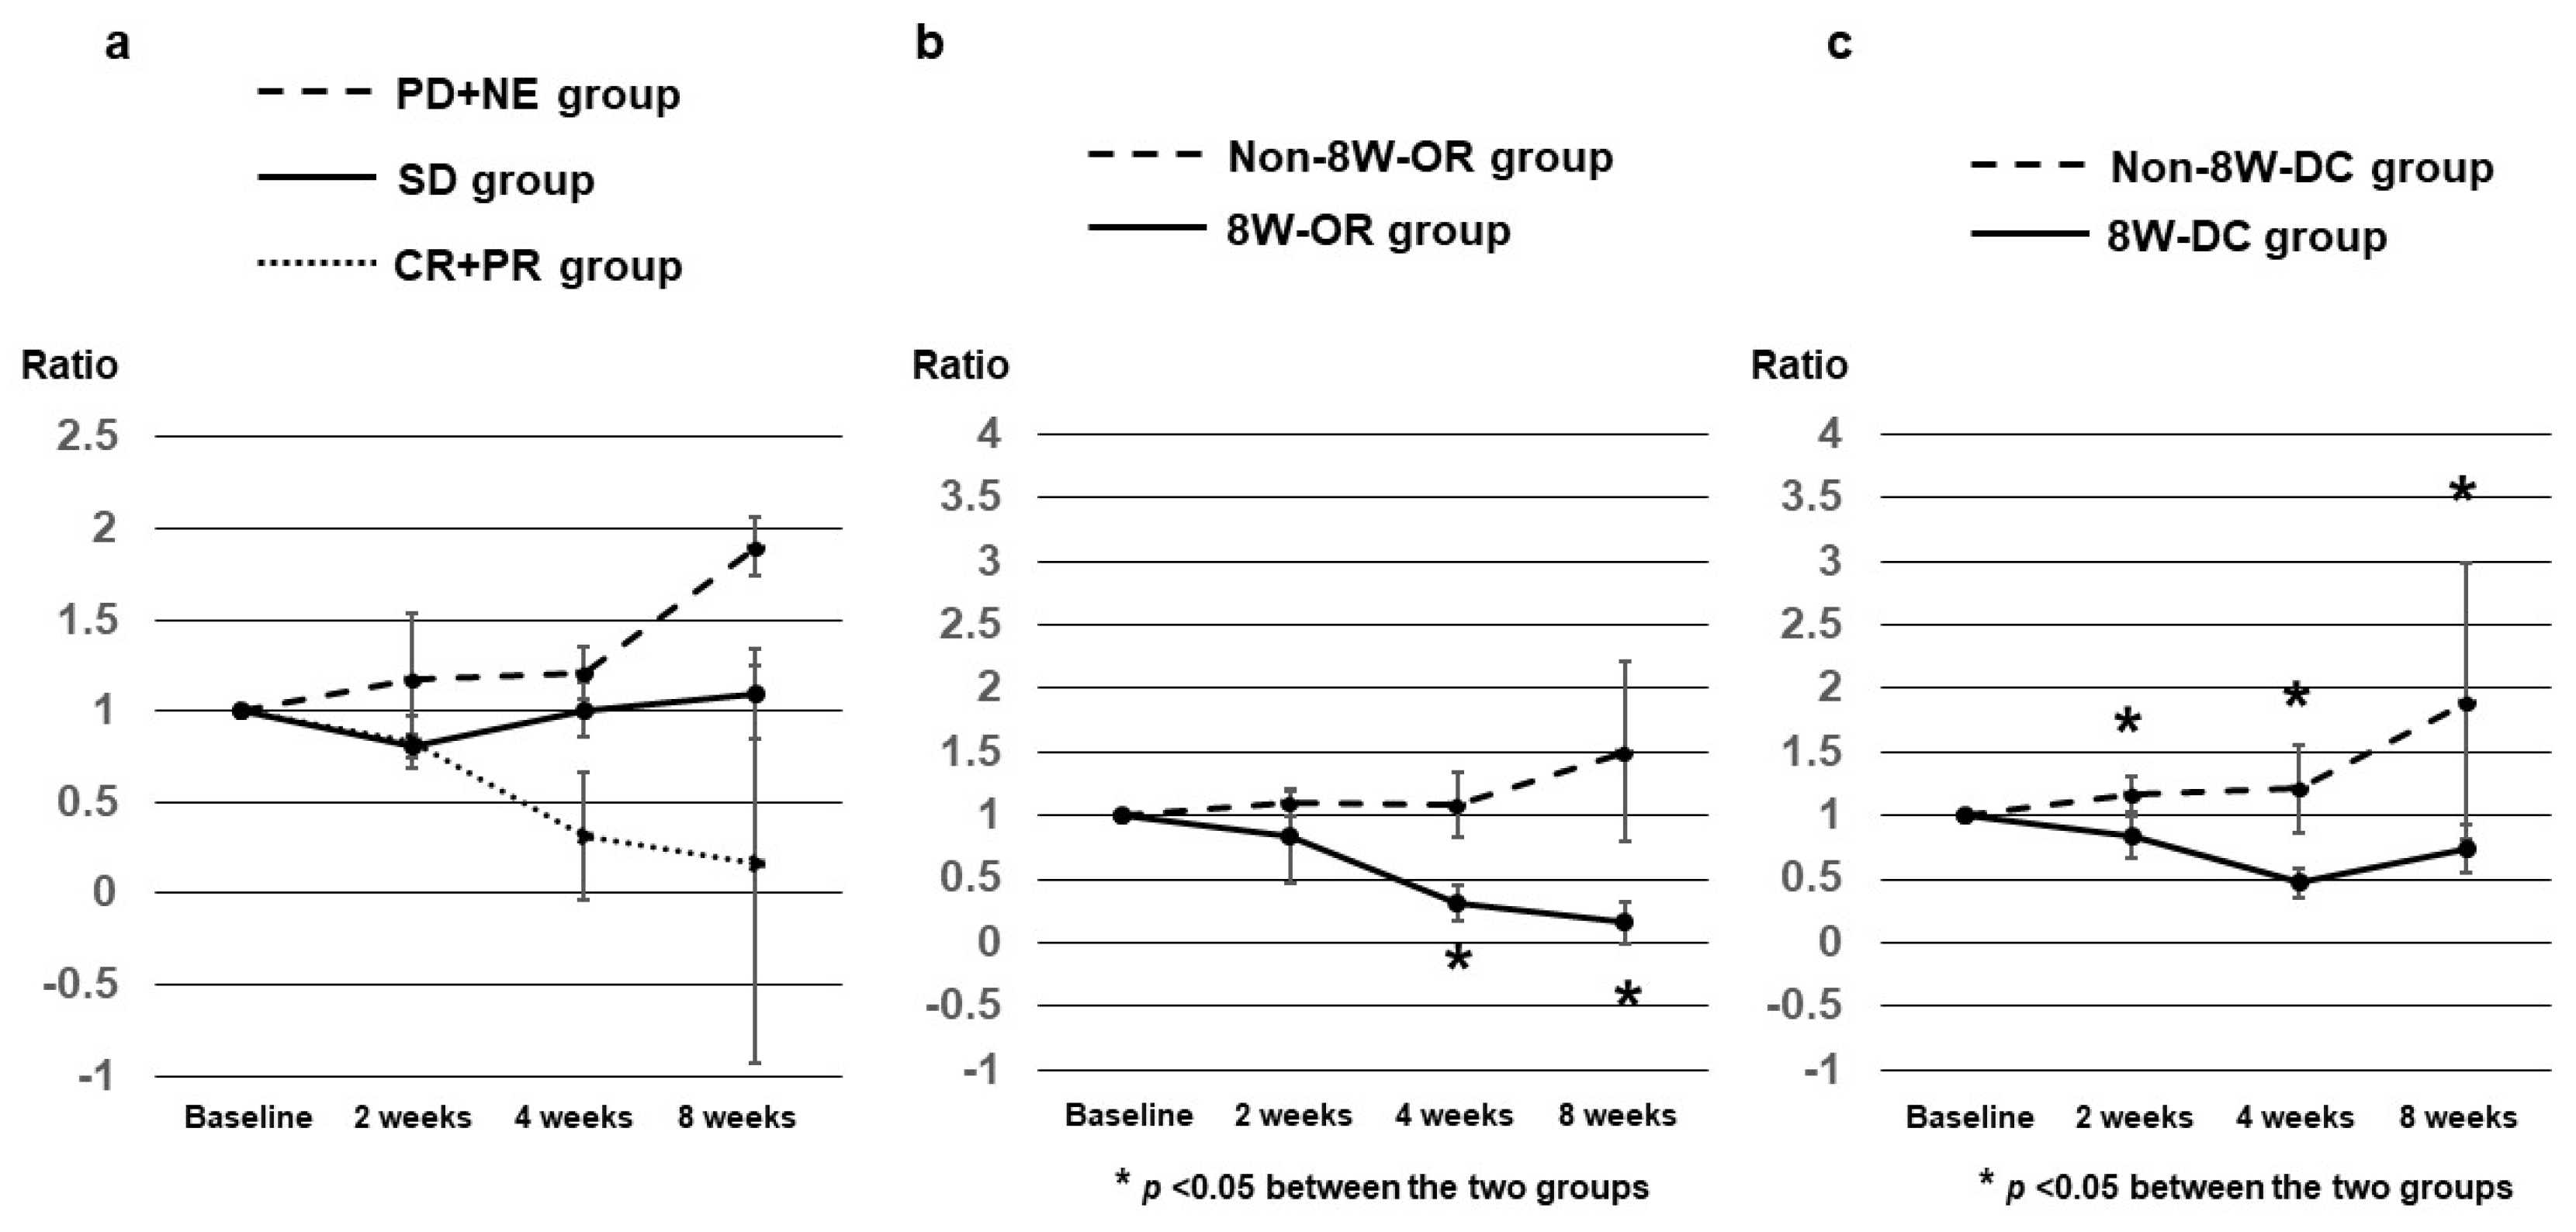
AFP ratios at 2, 4, and 8 weeks after Dur/Tre initiation, stratified according to the 8W-RECIST, in 23 patients with a baseline AFP level ≥10 ng/ml are shown in Table 3. Median AFP ratios at 2, 4 and 8 weeks were: 0.830, 0.310, and 0.16 in patients with CR + PR (n = 6); 0.810, 1.005, and 1.095 in patients with SD (n = 6); and 1.170,1.210, and 1.900 in patients with PD + NE (n = 11), respectively (Figure 3a). Median AFP ratios in the CR + PR (8W-OR) group at weeks 4 and 8 were significantly lower than those in the SD + PD + NE (Non-8W-OR) group (p = 0.0020 and p = 0.0020, respectively) (Figure 3b). Median AFP ratios in the CR + PR + SD (8W-DC) group at weeks 2, 4 and 8 were significantly lower than those in the PD + NE (Non-8W-DC) group (p = 0.0112, p = 0.0016 and p = 0.0037, respectively) (Figure 3c).

3.5. DCP Ratios at 2, 4, and 8 Weeks after Dur/Tre Initiation, Stratified by 8W-RECIST

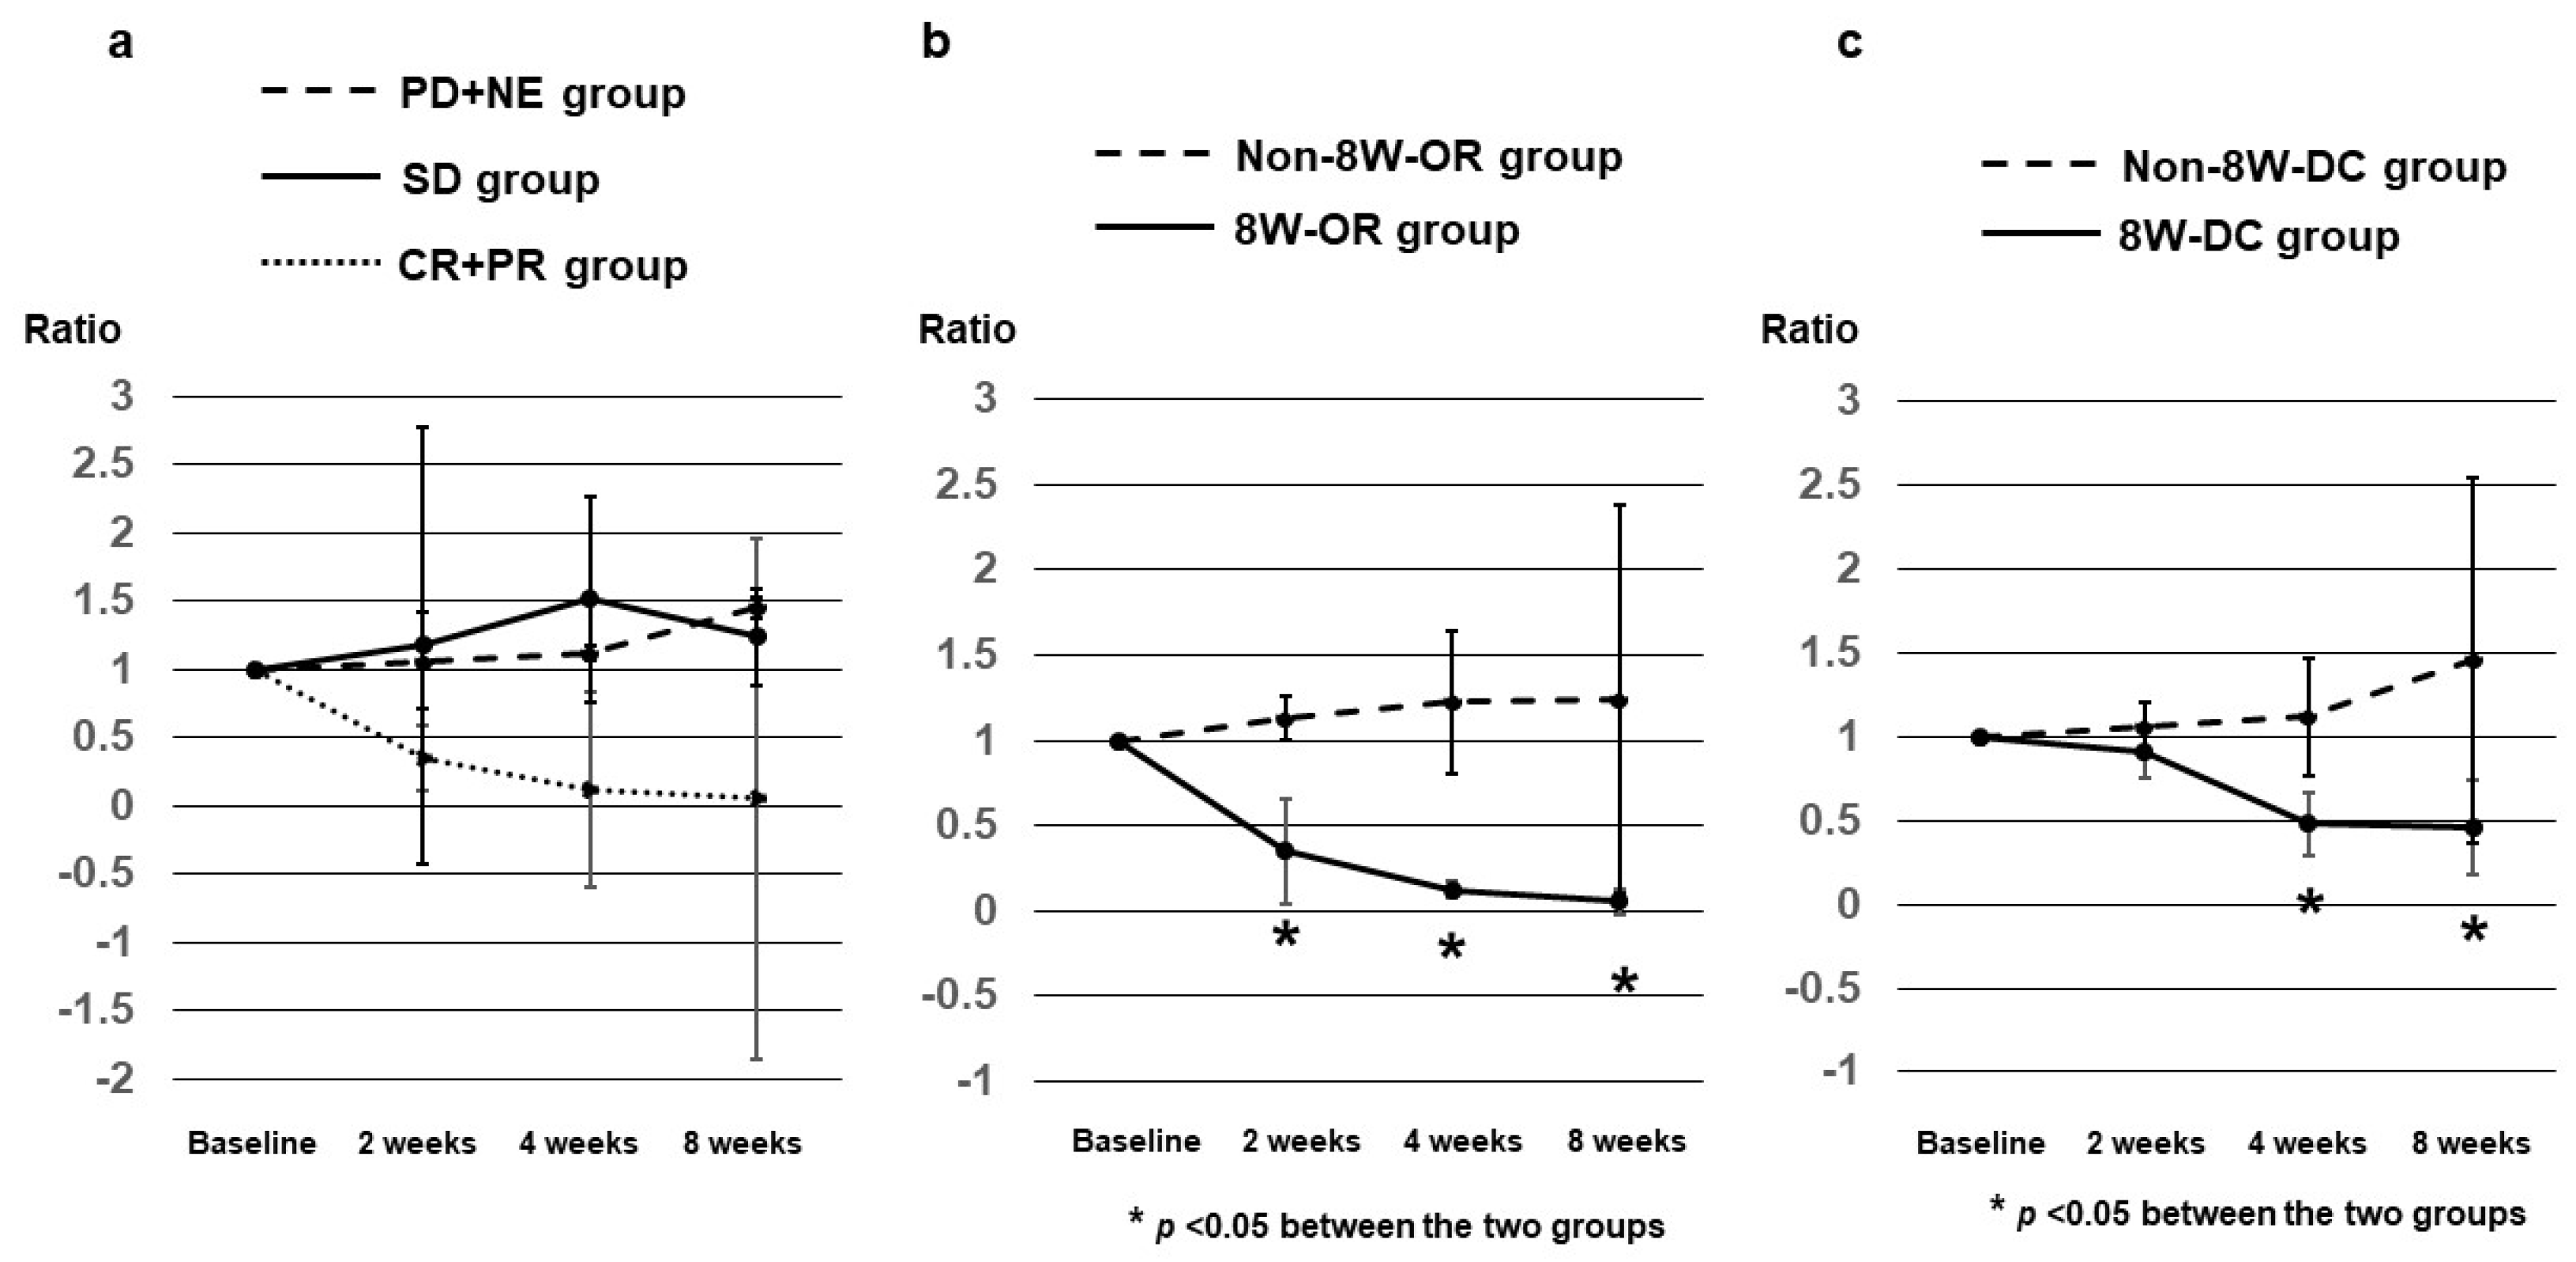
DCP ratios at 2, 4, and 8 weeks after Dur/Tre initiation, stratified according to the 8W-RECIST, in 27 patients with baseline DCP level ≥40 mAU/ml are shown in Table 4. Median DCP ratios at 2, 4 and 8 weeks were: 0.350, 0.125, and 0.055 in patients with CR + PR (n = 7); 1.180, 1.520, and 1.240 in patients with SD (n = 9); and 1.065, 1.120, and 1.455 in patients with PD + NE (n = 11), respectively (Figure 4a). Median DCP ratios in the 8W-OR group at weeks 2, 4 and 8 were significantly lower than those in the Non-8W-OR group (p = 0.0357, p = 0.0001, and p = 0.0001, respectively) (Figure 4b). Median DCP ratios in the 8W-DC group at weeks 4 and 8 were significantly lower than those in the Non-8W-DC group p = 0.0255 and p = 0.0147, respectively) (Figure 4c).

3.6. AFP-L3 Ratios at 4 and 8 Weeks after Dur/Tre Initiation, Stratified by 8W-RECIST

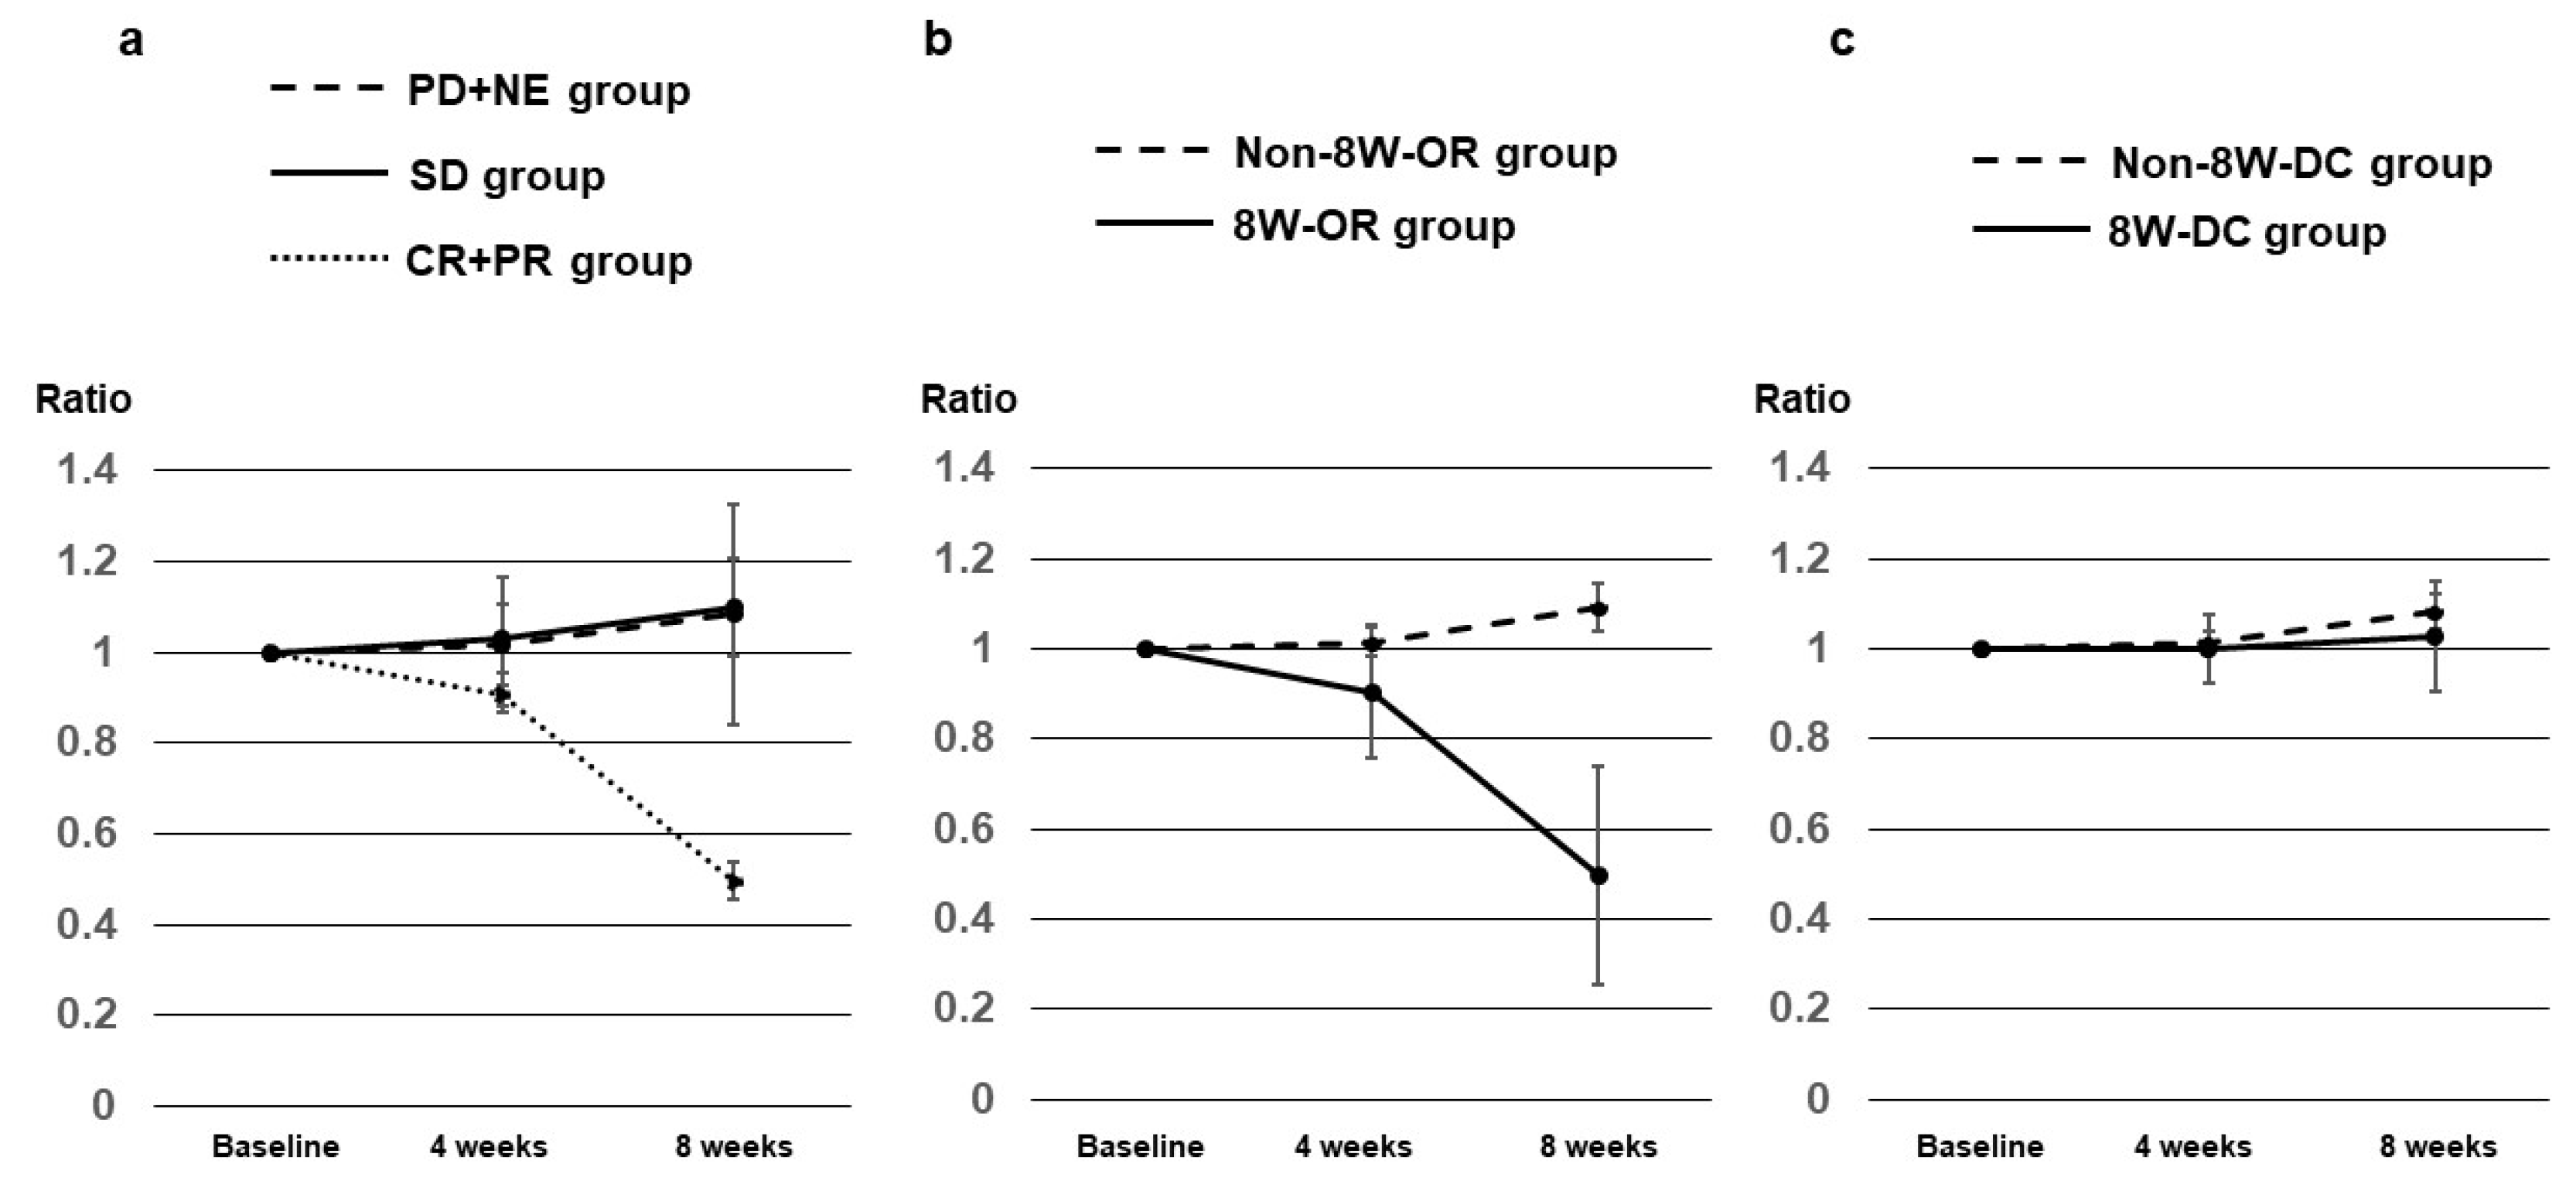
AFP-L3 ratios at 4 and 8 weeks after Dur/Tre initiation, stratified according to the 8W-RECIST, in 27 patients with a baseline AFP-L3 level ≥0.5% are shown in Table 5. Median AFP-L3 ratios at 4 and 8 weeks were: 0.905 and 0.496 in 7 patients with CR + PR; 1.031 and 1.099 in 9 patients with SD; and 1.016 and 1.084 in 11 patients with PD + NE, respectively (Figure 5a). No significant differences in median AFP-L3 ratio were evident between the 8W-OR and Non-8W-OR groups, and between the 8W-DC and Non-8W-DC groups (Figure 5b,c).

3.7. Prognostic Factors at Start of Dur/Tre Associated with Good PFS

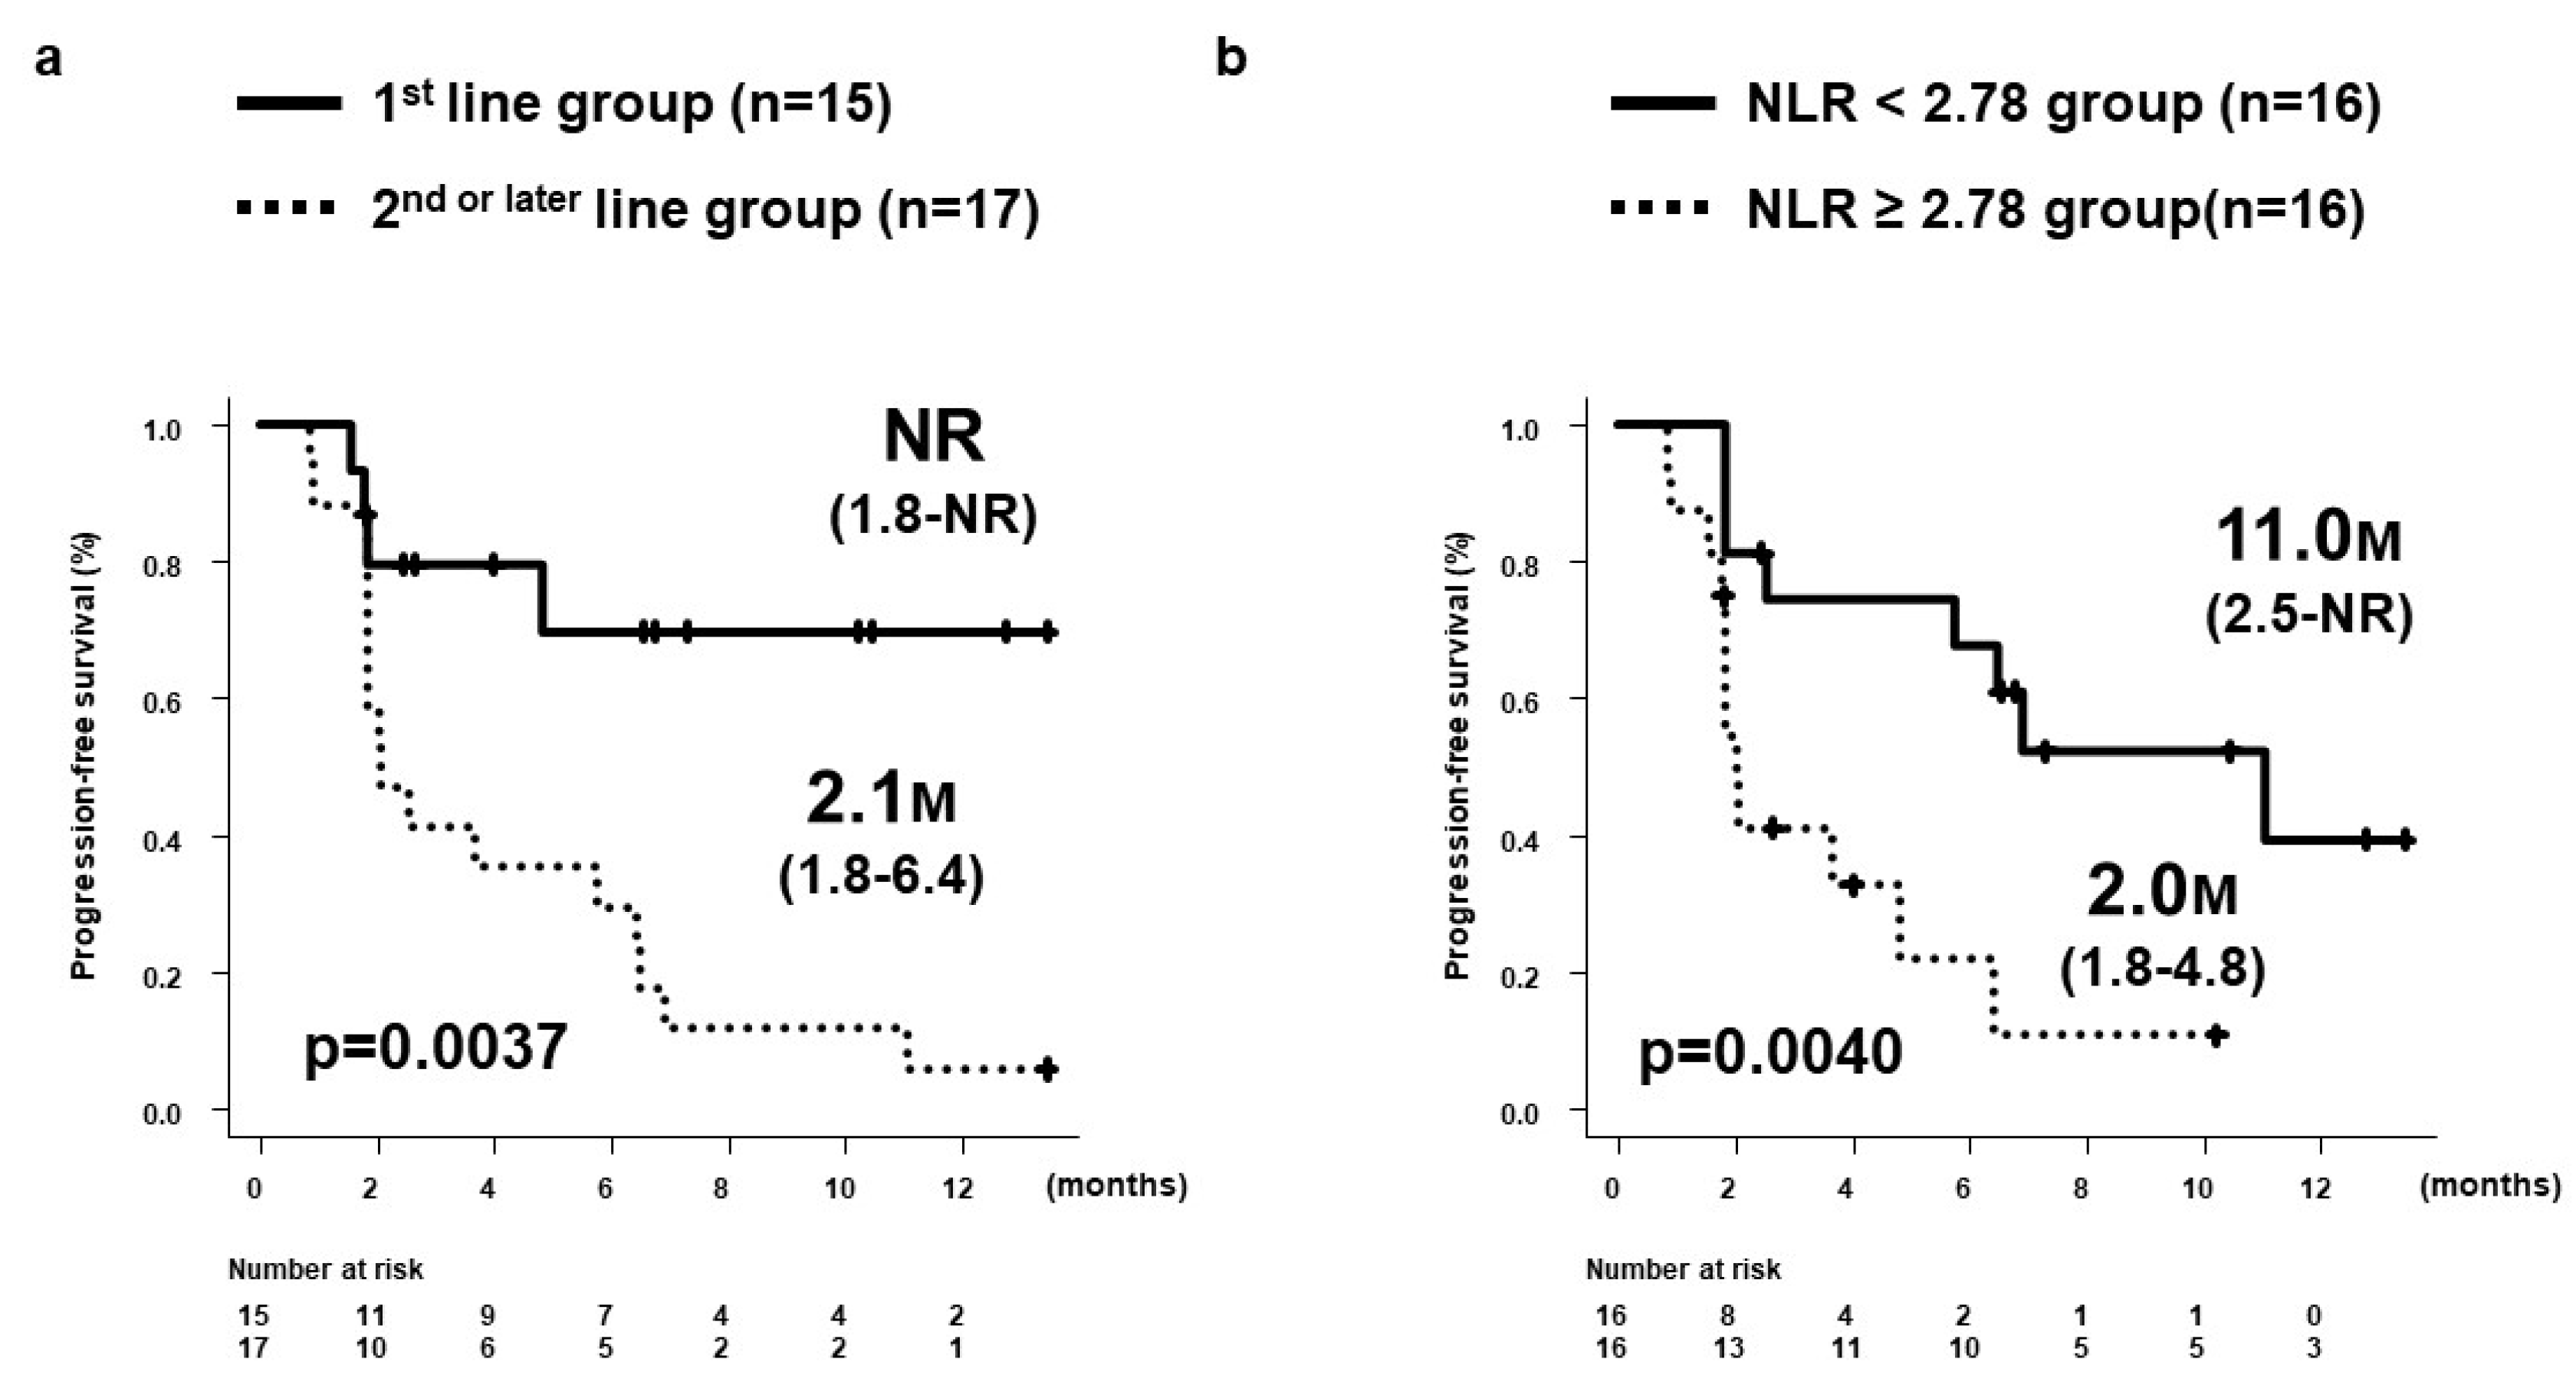
Table 6 shows prognostic factors at the start of Dur/Tre associated with good PFS. Multivariate analysis showed that 1st-line treatment (hazard ratio [HR] = 0.209, 95%CI, 0.069–0.637; p = 0.0059) and NLR < 2.78 (HR = 0.234; 95%CI, 0.085–0.647; p = 0.0051) were significant and independent predictors of good PPS.

3.8. PFS by Treatment Line and NLR

Median PFS in the 1st-line group was NR (1.8 months—NR), significantly longer than the 2.1 months (1.8–6.4 months) in the 2nd-line or later group (p = 0.0037) (Figure 6a). Median PFS in the NLR < 2.78 group was 11.0 months (2.5 months-NR), significantly longer than the 2.0 months (1.8-4.8 months) in the NLR ≥ 2.78 group (p = 0.0040) (Figure 6b).

3.9. Safety and Changes in Liver Function

Table 7 shows the incidence of AEs occurring within 8 weeks of Dur/Tre initiation. The most common AEs in all patients were anorexia, general fatigue, pruritus, fever, and diarrhea. Twenty-five percent of patients (n = 8) experienced grade 3 or higher AEs, with diarrhea being the most common in 4 patients (12.5%). Four patients (12.5%) required steroids as treatment for immune-related AEs. This included two patients with grade 3 enteritis and two patients with grade 2 skin rashes. The median duration of treatment with Dur/Tre was 7.6 months (95% CI: 1.9-11.0).
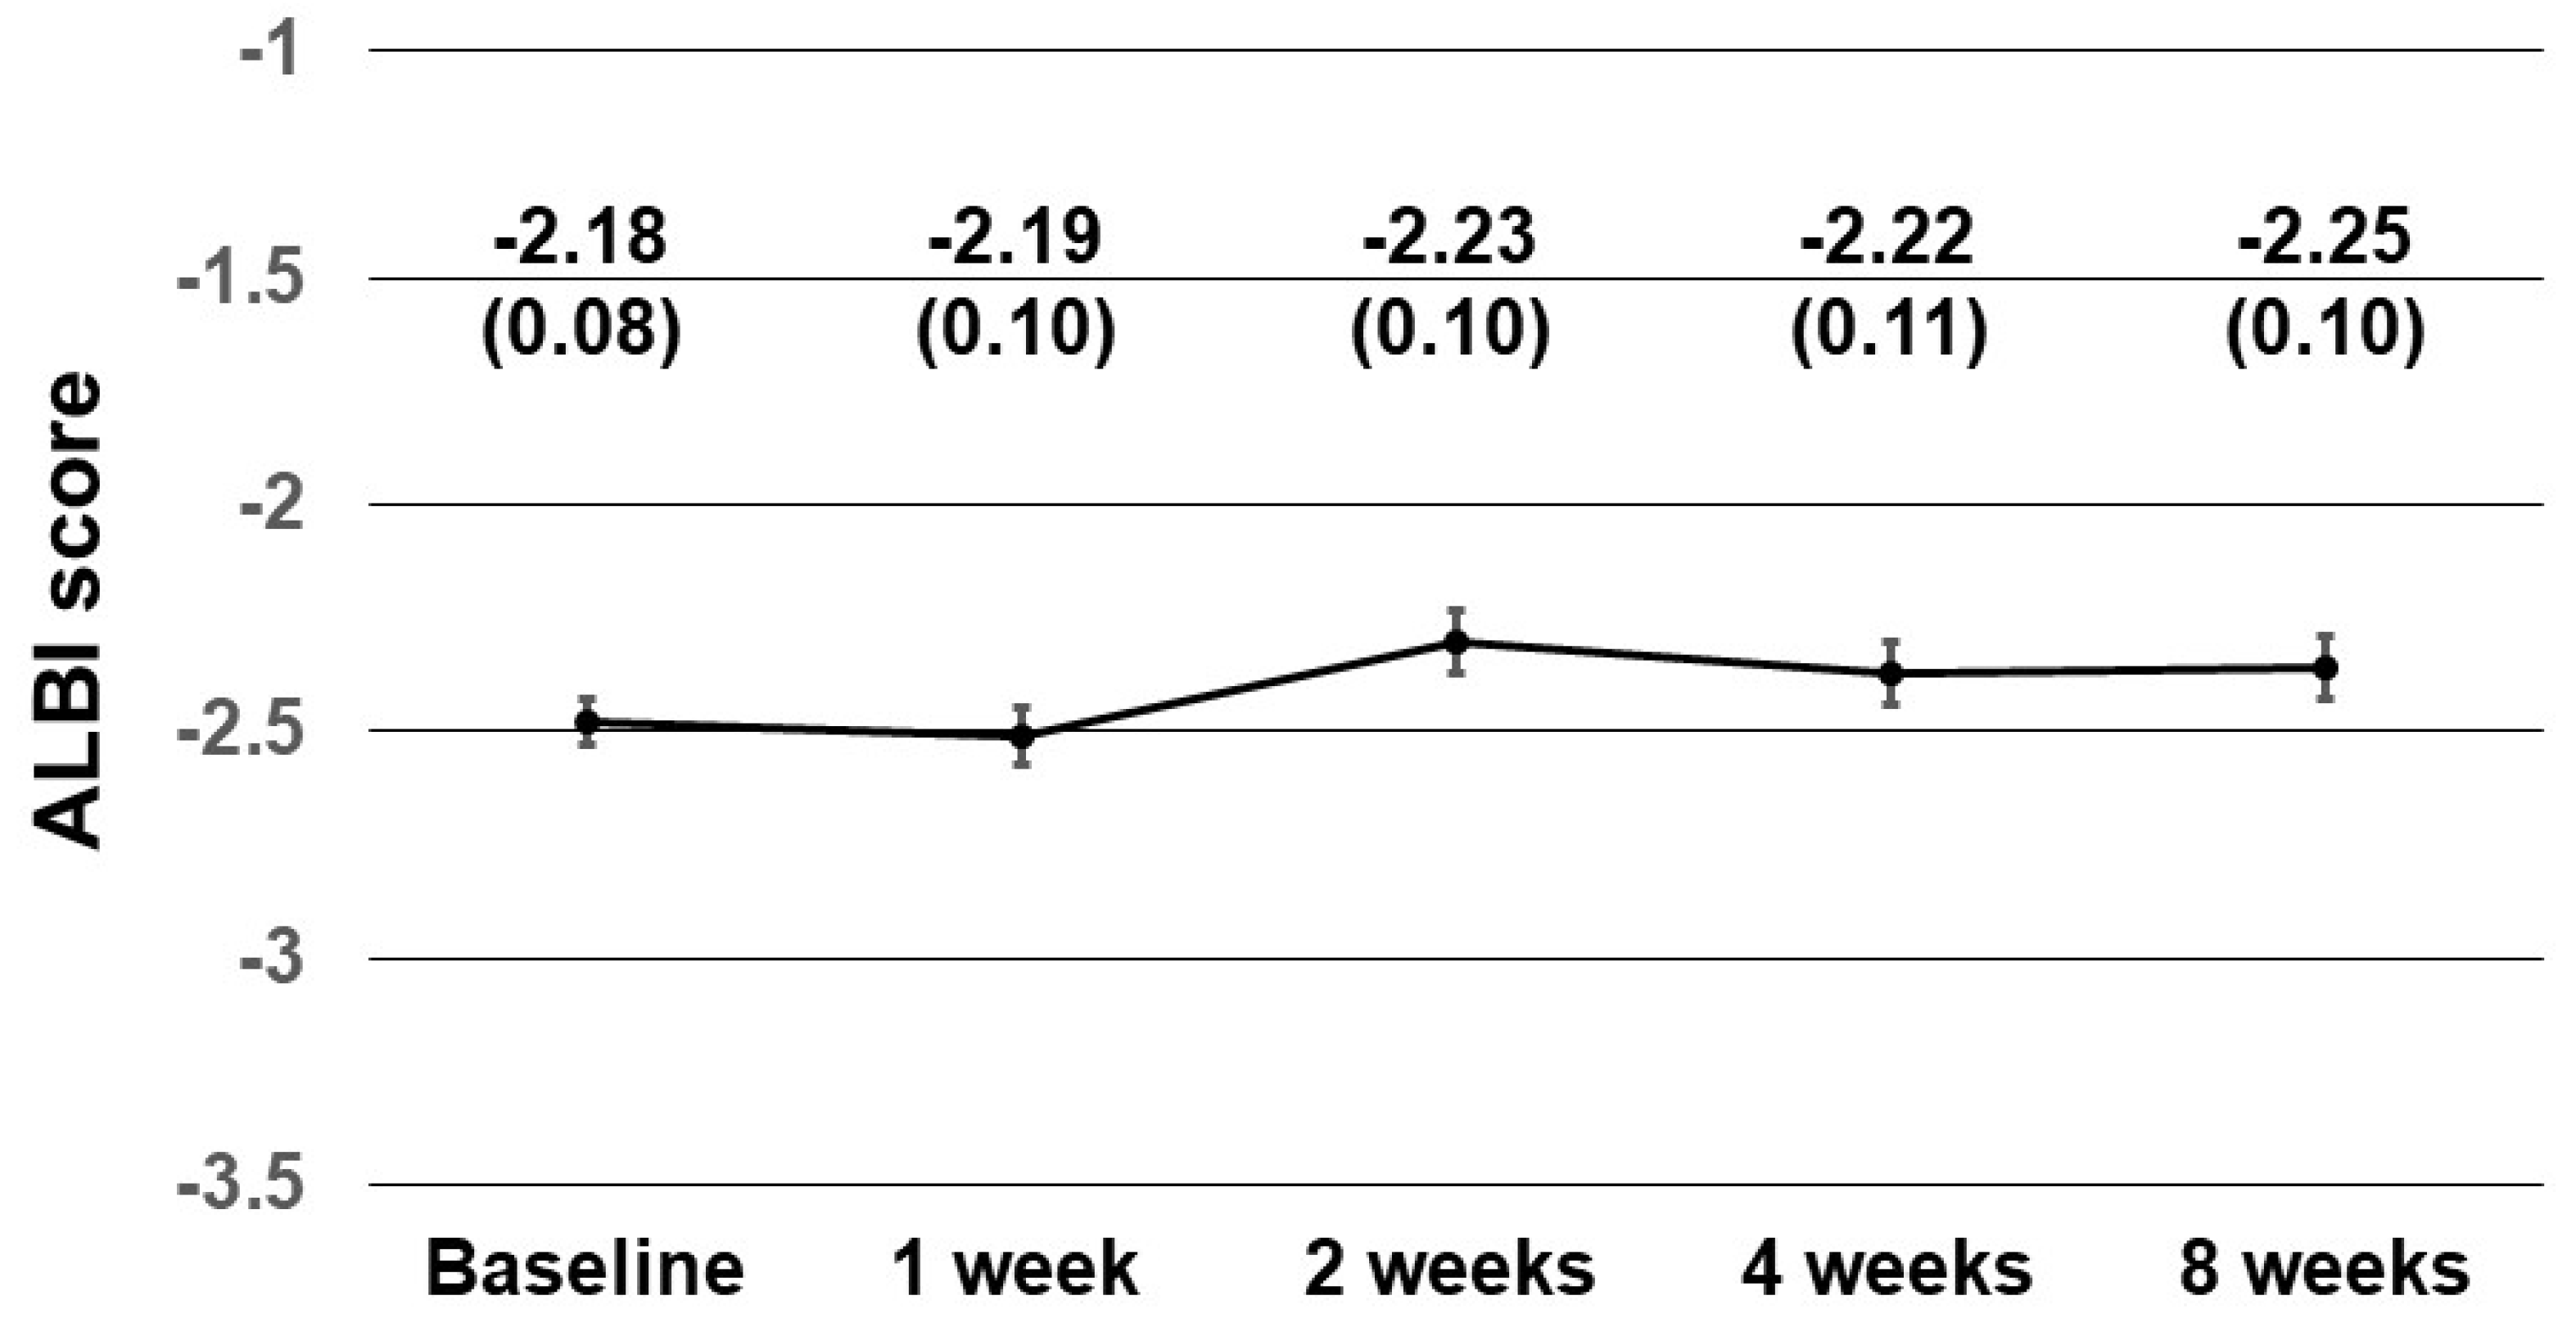
Changes in ALBI scores within 8 weeks were assessed in 32 patients (Figure 7). The ALBI scores (median ± standard error (SE)) at baseline, weeks 1, 2, 4, and 8 were -2.18 ± 0.08, -2.19 ± 0.10, -2.23 ± 0.10, -2.22 ± 0.11, and -2.25 ± 0.10, respectively. There was no worsening of the ALBI scores within 8 weeks.

3.10. Post-Progression Therapy

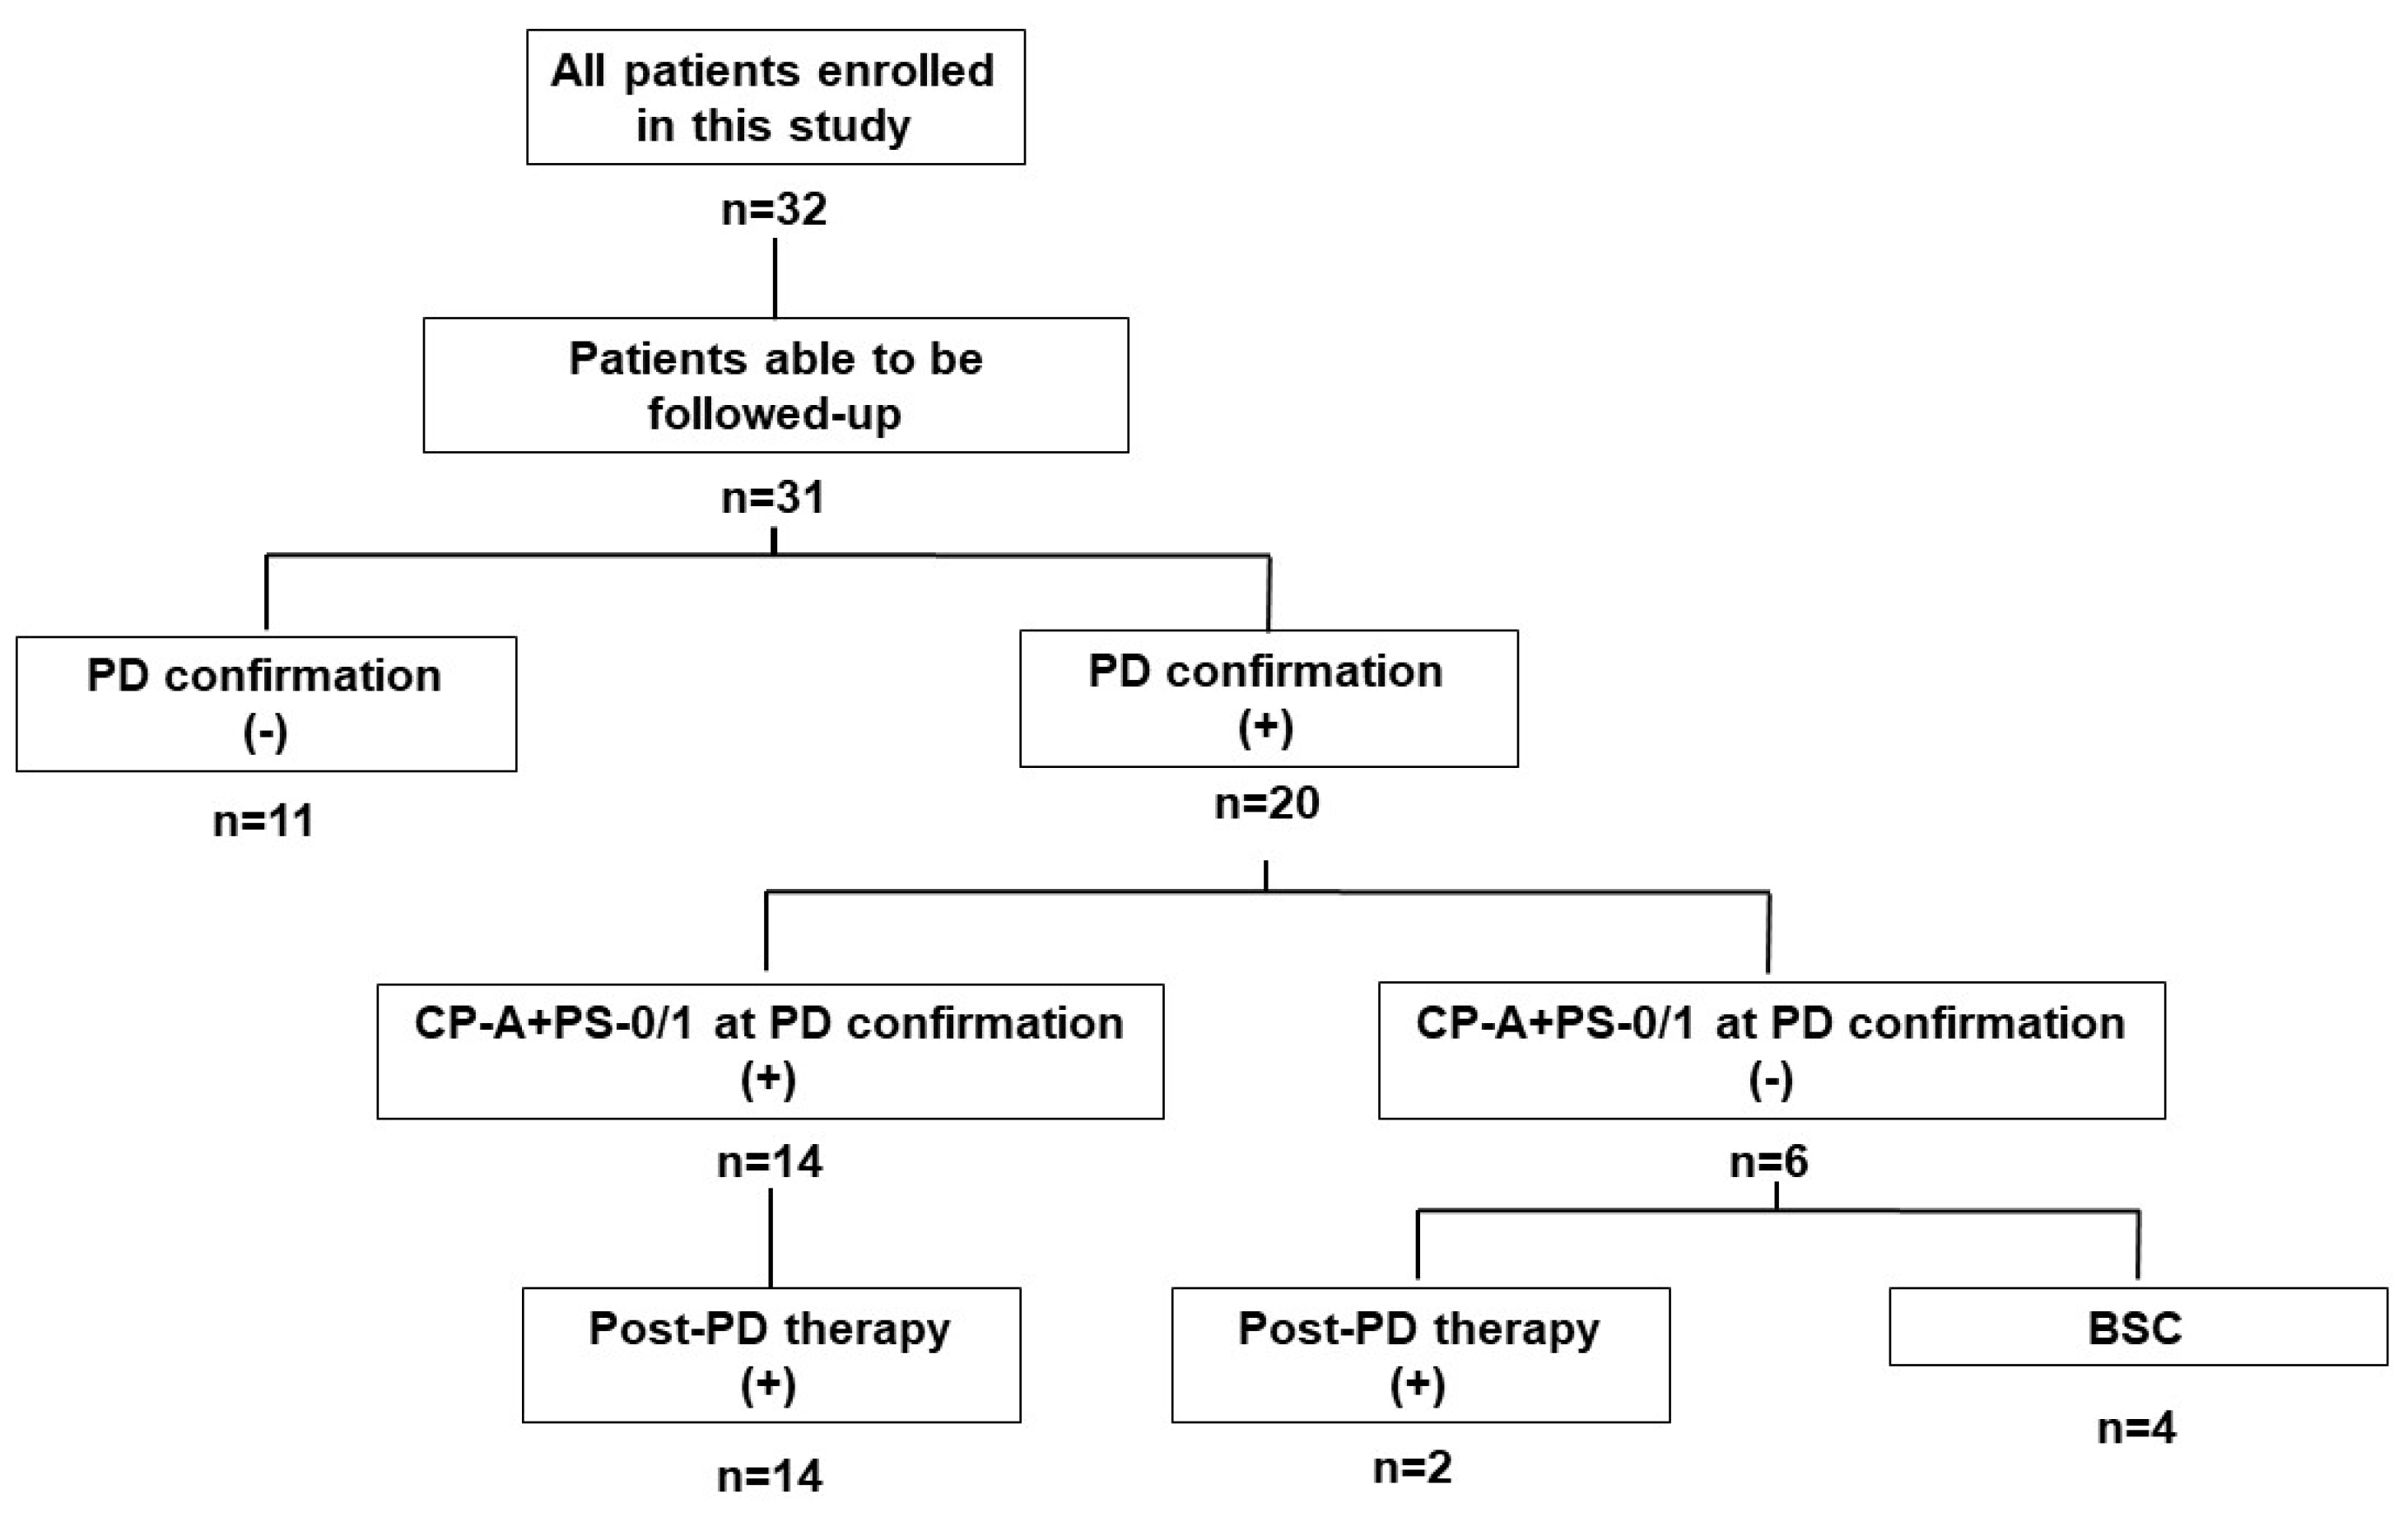
In 31 patients, excluding one patient who was transferred to another hospital within 8 weeks and whose post-transfer status was unknown, post-progression therapy (post-PD therapy) was investigated (Figure 8). Overall, 16 patients (80%) were switched to post-PD therapy. At the time of PD, 14 patients (70.0%) met both Child-Pugh A and ECOG-PS 0 or 1 (CP-A + PS-0/1 group), and the remaining 6 patients (non-CP-A + PS-0/1 group) did not meet both or either. In the CP-A + PS-0/1 group, all 14 patients (100%) were able to switch to post-PD therapy, while only 2 patients (33.3%) in the non-CP-A + PS-0/1 group were able to switch to post-PD therapy.

4. Discussion

This is the first study to focus on the correlation between early changes in tumor marker levels and antitumor response after Dur/Tre initiation in patients with advanced HCC in clinical practice. In particular, we found that early changes in AFP and DCP at 4 weeks after Dur/Tre initiation were both significantly associated with OR and DC according to RECIST at 8 weeks. Factors at the start of Dur/Tre that were associated with good PFS were 1st-line Dur/Tre treatment and NLR < 2.78.
Regarding the antitumor response of Dur/Tre according to RECIST, the HIMALAYA study reported an ORR of 20.1% and a DCR of 60.1% [1]. In the present study, antitumor response according to RECIST at 8 weeks was similar, with an 8W-ORR of 25.0% and an 8W-DCR of 56.3%. An updated analysis of the HIMALAYA trial reported a 3-year survival rate of 44.6% and a 4-year survival rate of 36.2% for patients who achieved DC with the best response (60.1%) [21]. Dur/Tre therapy is called the STRIDE regimen, and the anti-CTLA-4 antibody tremelimumab is administered only once at the first time. In the course of systemic therapy for HCC, an initial single dose of a CTLA-4 inhibitor can provide long-term prognosis for some patients. Although the follow-up period in the current study was too short to draw conclusions, no deaths were seen among patients who achieved DC (CR + PR + SD group) with Dur/Tre treatment, and if DC can be achieved as in this clinical trial, good prognosis can be expected.
Several reports have examined the relationship between changes in AFP levels and antitumor response and prognosis in patients with advanced HCC treated with MTA and Atz/Bev [6,7,8,9,10,11,12,13,14,15]. Patients with decreased AFP levels during treatment reportedly achieved better antitumor response and prognosis, whereas patients with increased AFP levels showed worse antitumor response and prognosis. In the current study, the median AFP ratio was significantly lower in the 8W-OR group than in the non-8W-OR group at 4 and 8 weeks after starting Dur/Tre treatment. On the other hand, median AFP ratio of the non-8W-DC group was significantly higher than that of the 8W-DC group at weeks 2, 4, and 8. These results suggest that in Dur/Tre therapy, as in other previously reported systemic therapy regimens, changes in AFP in the early treatment period may provide a useful predictor of antitumor response for both responsive cases and PD cases.
Several studies have also evaluated the relationship between changes in DCP after treatment initiation and antitumor efficacy and prognosis. Reports in MTA treatment have shown that, unlike AFP, early changes in DCP are not a useful predictor of antitumor efficacy or prognosis [6,22]. This is because some responders and SD patients who are considered to have achieved an antitumor effect also have elevated DCP, indistinguishable from the elevated DCP in PD. Tumor hypoxia due to anti-angiogenic therapy may lead to increased DCP production by the tumor itself [23]. In our own study, even with Atz/Bev treatment, early changes in DCP were not associated with antitumor efficacy [12]. In the present study, median DCP ratios among 8W-OR patients at weeks 2, 4 and 8 were significantly lower than those of non-8W-OR patients. DCP ratios at weeks 4 and 8 in the non-8W-DC group were also significantly higher than those in the 8W-DC group, suggesting that Dur/Tre treatment, unlike Atz/Bev treatment, does not involve VEGF inhibition and no mechanism may be needed for producing DCP from within the tumor due to hypoxia from inhibited angiogenesis. Therefore, in Dur/Tre treatment, changes in DCP as well as AFP changes may be associated with antitumor effects (response and PD cases).
Few reports have examined the relationship between changes in AFP-L3 and the efficacy of systemic therapy [13]. In the present study, AFP-L3 was unchanged in most patients after 4 weeks of treatment. After 8 weeks, a trend was seen toward a decrease in the 8W-OR group compared to the non-8W-OR group. With the advent of ICI therapy, including Atz/Bev, a small number of patients have been able to achieve clinical CR. In these patients, AFP-L3 eventually declines to normal levels. If a subsequent decrease in AFP-L3 is obtained, a favorable antitumor response can therefore be expected. However, based on the results of this study, AFP-L3, unlike AFP and DCP, may not offer a useful early predictor of antitumor response.
In this study, significant predictive factors at Dur/Tre initiation associated with good PFS were 1st-line Dur/Tre treatment and NLR < 2.78. Although the number of cases in this study was small and the ability to draw conclusions is limited, the results suggest that, at least when Dur/Tre is introduced as a first-line treatment, we could expect similar results to the HIMALAYA study. As for NLR, low NLR levels have been reported as predictive of good antitumor efficacy and favorable OS in ICI therapies, including Atz/Bev therapy for HCC [24,25,26,27,28,29]. Dur/Tre therapy is a combination of only two immune checkpoint inhibitors and, as with ICI therapy for other cancers, low NLR levels may provide a useful biomarker.
ALBI scores were virtually unchanged within 8 weeks and no decrease in hepatic function was seen. At the time PD was confirmed by RECIST, 70% of patients met the Child–Pugh A and ECOG-PS 0 or 1 requirements for recommended transition to subsequent systemic therapy. This is a higher percentage than has been reported for other MTA treatments [30,31,32]. In fact, all these patients were able to switch to post-PD therapy. Even if PD was found, favorable conditions (good hepatic function and general condition) could be expected to allow subsequent treatments to be fully effective and prolong prognosis. The median age of patients in this study was 75 years, 10 years older than in the HIMALAYA study (65 years), but the incidence of AEs was similar to that of the HIMALAYA study. Dur/Tre was considered a well-tolerated therapy in real clinical practice when AEs were detected and treated early.
This study showed several limitations. First, this was a retrospective, non-randomized study. Second, the sample size was small and the duration of follow-up was short. Additional studies with a larger number of patients in independent cohorts are thus needed to corroborate the findings of the current study.

5. Conclusions

In conclusion, early changes in tumor markers after initiation of Dur/Tre treatment were associated with antitumor response. In particular, changes in AFP and DCP at week 4 may be useful biomarkers for early prediction of both response and PD following initiation of Dur/Tre treatment.

Author Contributions

Conceptualization: Teiji Kuzuya; methodology: Teiji Kuzuya; formal analysis and investigation: Teiji Kuzuya and Naoto Kawabe; data curation: Teiji Kuzuya, Naoto Kawabe, Hisanori Muto, Yuryo Wada, Gakushi Komura, Takuji Nakano, Hiroyuki Tanaka, Kazunori Nakaoka, Eizaburo Ohno, Kohei Funasaka, Mitsuo Nagasaka, and Ryoji Miyahara; writing - original draft preparation: Teiji Kuzuya; writing - review and editing: Naoto Kawabe; supervision: Yoshiki Hirooka. All the authors have approved the final version of the manuscript and have agreed to take responsibility for all aspects of the work to ensure that any questions relating to the accuracy or completeness of any part of the work are properly investigated and resolved. All authors have read and agreed to the published version of the manuscript.

Funding

The authors have no funding sources to declare.

Institutional Review Board Statement

This study was approved by the Ethics Committee of the Fujita Health University School of Medicine (HM17-152) and was conducted in compliance with the 1975 Declaration of Helsinki.

Informed Consent Statement

Written informed consent for treatment was obtained from all patients. In this study, informed consent was waived because the analysis was retrospective.

Data Availability Statement

All data generated or analyzed in this study are included in this article. Please direct any inquiries to the corresponding author.

Conflicts of Interest

Teiji Kuzuya has received speaker fees from Eisai, Eli Lilly Japan, Chugai Pharmaceutical, and AstraZeneca. The other authors declare that they have no conflicts of interest.

References

  1. Abou-Alfa, G.K.; Lau, G.; Kudo, M.; Chan, S.L.; Kelley, R.K.; Furuse, J.; Sukeepaisarnjaroen, W.; Kang, Y.K.; Dao, T.V.; De Toni, E.N.; et al. Tremelimumab plus durvalumab in unresected hepatocellular carcinoma. N Eng J Med Evid 2022, 1, EVIDoa2100070. [Google Scholar]
  2. Reig, M.; Forner, A.; Rimola, J.; Ferrer-Fàbrega, J.; Burrel, M.; Garcia-Criado, Á.; Kelley, R.K.; Galle, P.R.; Mazzaferro, V.; Salem, R.; et al. BCLC strategy for prognosis prediction and treatment recommendation: the 2022 update. J Hepatol 2022, 76, 681–693. [Google Scholar] [CrossRef] [PubMed]
  3. Gordan, J.D.; Kennedy, E.B.; Abou-Alfa, G.K.; Beal, E.; Finn, R.S.; Gade, T.P.; Goff, L.; Gupta, S.; Guy, J.; Hoang, H.T.; et al. Systemic therapy for advanced hepatocellular carcinoma: ASCO guideline update. J Clin Oncol 2024, 42, 1830–1850. [Google Scholar] [CrossRef] [PubMed]
  4. Yeo, Y.H.; Lee, Y.T.; Tseng, H.R.; Zhu, Y.; You, S.; Agopian, V.G.; Yang, J.D. Alpha-fetoprotein: past, present, and future. Hepatol Commun 2024, 8, e0422. [Google Scholar] [CrossRef] [PubMed]
  5. Toyoda, H.; Kumada, T.; Tada, T.; Sone, Y.; Kaneoka, Y.; Maeda, A. Tumor markers for hepatocellular carcinoma: simple and significant predictors of outcome in patients with HCC. Liver Cancer 2015, 4, 126–136. [Google Scholar] [CrossRef] [PubMed] [PubMed Central]
  6. Kuzuya, T.; Asahina, Y.; Tsuchiya, K.; Tanaka, K.; Suzuki, Y.; Hoshioka, T.; Tamaki, S.; Kato, T.; Yasui, Y.; Hosokawa, T.; et al. Early decrease in α-fetoprotein, but not des-γ-carboxy prothrombin, predicts sorafenib efficacy in patients with advanced hepatocellular carcinoma. Oncology 2011, 81, 251–258. [Google Scholar] [CrossRef] [PubMed]
  7. Kuzuya, T.; Ishigami, M.; Ishizu, Y.; Honda, T.; Hayashi, K.; Katano, Y.; Hirooka, Y.; Ishikawa, T.; Nakano, I.; Goto, H. Early clinical response after 2 weeks of sorafenib therapy predicts outcomes and anti-tumor response in patients with advanced hepatocellular carcinoma. PLoS One 2015, 10, e0138776. [Google Scholar] [CrossRef] [PubMed] [PubMed Central]
  8. Sánchez, A.I.P.; Roces, L.V.; García, I.Z.; López, E.L.; Hernandez, M.A.C.; Parejo, M.I.B.; Peña-Díaz, J. Value of α-fetoprotein as an early biomarker for treatment response to sorafenib therapy in advanced hepatocellular carcinoma. Oncol Lett 2018, 15, 8863–8870. [Google Scholar] [CrossRef] [PubMed] [PubMed Central]
  9. Kuzuya, T.; Ishigami, M.; Ito, T.; Ishizu, Y.; Honda, T.; Ishikawa, T.; Fujishiro, M. Favorable radiological antitumor response at 2 weeks after starting lenvatinib for patients with advanced hepatocellular carcinoma. Hepatol Res 2020, 50, 374–381. [Google Scholar] [CrossRef] [PubMed]
  10. Kodama, K.; Kawaoka, T.; Namba, M.; Uchikawa, S.; Ohya, K.; Morio, K.; Nakahara, T.; Murakami, E.; Yamauchi, M.; Hiramatsu, A.; et al. Correlation between early tumor marker response and imaging response in patients with advanced hepatocellular carcinoma treated with lenvatinib. Oncology 2019, 97, 75–81. [Google Scholar] [CrossRef] [PubMed]
  11. Saeki, I.; Yamasaki, T.; Yamashita, S.; Hanazono, T.; Urata, Y.; Furutani, T.; Yokoyama, Y.; Oishi, T.; Maeda, M.; Kimura, T.; et al. Early predictors of objective response in patients with hepatocellular carcinoma undergoing lenvatinib treatment. Cancers 2020, 12, 779. [Google Scholar] [CrossRef] [PubMed] [PubMed Central]
  12. Kuzuya, T.; Kawabe, N.; Hashimoto, S.; Miyahara, R.; Sawaki, A.; Nakano, T.; Nakaoka, K.; Tanaka, H.; Miyachi, Y.; Mii, A.; et al. Early changes in alpha-fetoprotein are a useful predictor of efficacy of atezolizumab plus bevacizumab treatment in patients with advanced hepatocellular carcinoma. Oncology 2022, 100, 12–21. [Google Scholar] [CrossRef] [PubMed]
  13. Tanaka, K.; Tsuji, K.; Hiraoka, A.; Tada, T.; Hirooka, M.; Kariyama, K.; Tani, J.; Atsukawa, M.; Takaguchi, K.; Itobayashi, E.; et al. Usefulness of tumor marker score for predicting the prognosis of hepatocellular carcinoma patients treated with atezolizumab plus bevacizumab: a multicenter retrospective study. Cancers 2023, 15, 4348. [Google Scholar] [CrossRef] [PubMed] [PubMed Central]
  14. Kinami, T.; Amioka, K.; Kawaoka, T.; Uchikawa, S.; Yamasaki, S.; Kosaka, M.; Johira, Y.; Yano, S.; Naruto, K.; Ando, Y.; et al. Evaluation of response to atezolizumab plus bevacizumab in patients with advanced hepatocellular carcinoma using the combination of response evaluation criteria in solid tumors and alpha-fetoprotein. Cancers 2023, 15, 2304. [Google Scholar] [CrossRef] [PubMed] [PubMed Central]
  15. Campani, C.; Bamba-Funck, J.; Campion, B.; Sidali, S.; Blaise, L.; Ganne-Carrié, N.; Demory, A.; Sutter, O.; Larrey, E.; Evain, M.; et al. Baseline ALBI score and early variation of serum AFP predicts outcomes in patients with HCC treated by atezolizumab-bevacizumab. Liver Int 2023, 43, 708–717. [Google Scholar] [CrossRef] [PubMed]
  16. National Institutes of Health, National Cancer Institute, U.S. Department of Health and Human Services. Common Terminology Criteria for Adverse Events (CTCAE) version 5.0. Published 27 November 2017. Available online: https://ctep.cancer.gov/protocolDevelopment/electronic_applications/docs/CTCAE_v5_Quick_Reference_8.5x11.pdf (accessed on 20 June 2020).
  17. Johnson, P.J.; Berhane, S.; Kagebayashi, C.; Satomura, S.; Teng, M.; Reeves, H.L.; O’Beirne, J.; Fox, R.; Skowronska, A.; Palmer, D.; et al. Assessment of liver function in patients with hepatocellular carcinoma: a new evidence-based approach—the ALBI grade. J Clin Oncol 2015, 33, 550–558. [Google Scholar] [CrossRef] [PubMed] [PubMed Central]
  18. Eisenhauer, E.A.; Therasse, P.; Bogaerts, J.; Schwartz, L.H.; Sargent, D.; Ford, R.; Dancey, J.; Arbuck, S.; Gwyther, S.; Mooney, M.; et al. New response evaluation criteria in solid tumours: Revised RECIST guideline (version 1.1). Eur J Cancer 2009, 45, 228–247. [Google Scholar] [CrossRef]
  19. Lencioni, R.; Llovet, J.M. Modified RECIST (mRECIST) assessment for hepatocellular carcinoma. Semin Liver Dis 2010, 30, 52–60 . [Google Scholar] [CrossRef] [PubMed]
  20. Kanda, Y. Investigation of the freely available easy-to-use software 'EZR' for medical statistics. Bone Marrow Transplant 2013, 48, 452–458 . [Google Scholar] [CrossRef] [PubMed]
  21. Sangro, B.; Chan, S.L.; Kelley, R.K.; Lau, G.; Kudo, M.; Sukeepaisarnjaroen, W.; Yarchoan, M.; De Toni, E.N.; Furuse, J.; Kang, Y.K.; et al. Four-year overall survival update from the phase III HIMALAYA study of tremelimumab plus durvalumab in unresectable hepatocellular carcinoma. Ann Oncol 2024, 35, 448–457. [Google Scholar] [CrossRef] [PubMed]
  22. Ueshima, K.; Kudo, M.; Takita, M.; Nagai, T.; Tatsumi, C.; Ueda, T.; Kitai, S.; Ishikawa, E.; Yada, N.; Inoue, T.; et al. Des-γ-carboxyprothrombin may be a promising biomarker to determine the therapeutic efficacy of sorafenib for hepatocellular carcinoma. Dig Dis 2011, 29, 321–325. [Google Scholar] [CrossRef] [PubMed]
  23. Murata, K.; Suzuki, H.; Okano, H.; Oyamada, T.; Yasuda, Y.; Sakamoto, A. Cytoskeletal changes during epithelial-to-fibroblastoid conversion as a crucial mechanism of des-gamma-carboxy prothrombin production in hepatocellular carcinoma. Int J Oncol 2009, 35, 1005–1014. [Google Scholar] [CrossRef] [PubMed]
  24. Eso, Y.; Takeda, H.; Taura, K.; Takai, A.; Takahashi, K.; Seno, H. Pretreatment neutrophil-to-lymphocyte ratio as a predictive marker of response to atezolizumab plus bevacizumab for hepatocellular carcinoma. Curr Oncol 2021, 28, 4157–4166. [Google Scholar] [CrossRef] [PubMed] [PubMed Central]
  25. Wang, J.H.; Chen, Y.Y.; Kee, K.M.; Wang, C.C.; Tsai, M.C.; Kuo, Y.H.; Hung, C.H.; Li, W.F.; Lai, H.L.; Chen, Y.H. The prognostic value of neutrophil-to-lymphocyte ratio and platelet-to-lymphocyte ratio in patients with hepatocellular carcinoma receiving atezolizumab plus bevacizumab. Cancers 2022, 14, 343. [Google Scholar] [CrossRef] [PubMed] [PubMed Central]
  26. Tada, T.; Kumada, T.; Hiraoka, A.; Hirooka, M.; Kariyama, K.; Tani, J.; Atsukawa, M.; Takaguchi, K.; Itobayashi, E.; Fukunishi, S.; et al. Neutrophil-lymphocyte ratio predicts early outcomes in patients with unresectable hepatocellular carcinoma treated with atezolizumab plus bevacizumab: a multicenter analysis. Eur J Gastroenterol Hepatol 2022, 34, 698–706. [Google Scholar] [CrossRef] [PubMed]
  27. Ochi, H.; Kurosaki, M.; Joko, K.; Mashiba, T.; Tamaki, N.; Tsuchiya, K.; Marusawa, H.; Tada, T.; Nakamura, S.; Narita, R.; et al. Usefulness of neutrophil-to-lymphocyte ratio in predicting progression and survival outcomes after atezolizumab-bevacizumab treatment for hepatocellular carcinoma. Hepatol Res 2023, 53, 61–71. [Google Scholar] [CrossRef] [PubMed]
  28. Takenaka, Y.; Oya, R.; Takemoto, N.; Inohara, H. Neutrophil-to-lymphocyte ratio as a prognostic marker for head and neck squamous cell carcinoma treated with immune checkpoint inhibitors: Meta-analysis. Head Neck 2022, 44, 1237–1245. [Google Scholar] [CrossRef] [PubMed]
  29. Wang, H.; Yang, R.; Liu, D.; Li, W. Association of pretreatment neutrophil-to-lymphocyte ratio with clinical outcomes in cancer immunotherapy: an evidence synthesis from 30 meta-analyses. Int Immunopharmacol 2024, 132, 111936. [Google Scholar] [CrossRef] [PubMed]
  30. Kuzuya, T.; Ishigami, M.; Ito, T.; Ishizu, Y.; Honda, T.; Ishikawa, T.; Hirooka, Y.; Fujishiro, M. Clinical characteristics and outcomes of candidates for second-line therapy, including regorafenib and ramucirumab, for advanced hepatocellular carcinoma after sorafenib treatment. Hepatol Res 2019, 49, 1054–1065. [Google Scholar] [CrossRef] [PubMed]
  31. Hiraoka, A.; Kumada, T.; Fukunishi, S.; Atsukawa, M.; Hirooka, M.; Tsuji, K.; Ishikawa, T.; Takaguchi, K.; Kariyama, K.; Itobayashi, E.; et al. Post-progression treatment eligibility of unresectable hepatocellular carcinoma patients treated with lenvatinib. Liver Cancer 2020, 9, 73–83. [Google Scholar] [CrossRef] [PubMed] [PubMed Central]
  32. Persano, M.; Rimini, M.; Tada, T.; Suda, G.; Shimose, S.; Kudo, M.; Cheon, J.; Finkelmeier, F.; Lim, HY.; Presa, J.; et al. Sequential therapies after atezolizumab plus bevacizumab or lenvatinib first-line treatments in hepatocellular carcinoma patients. Eur J Cancer 2023, 189, 112933. [Google Scholar] [CrossRef] [PubMed]
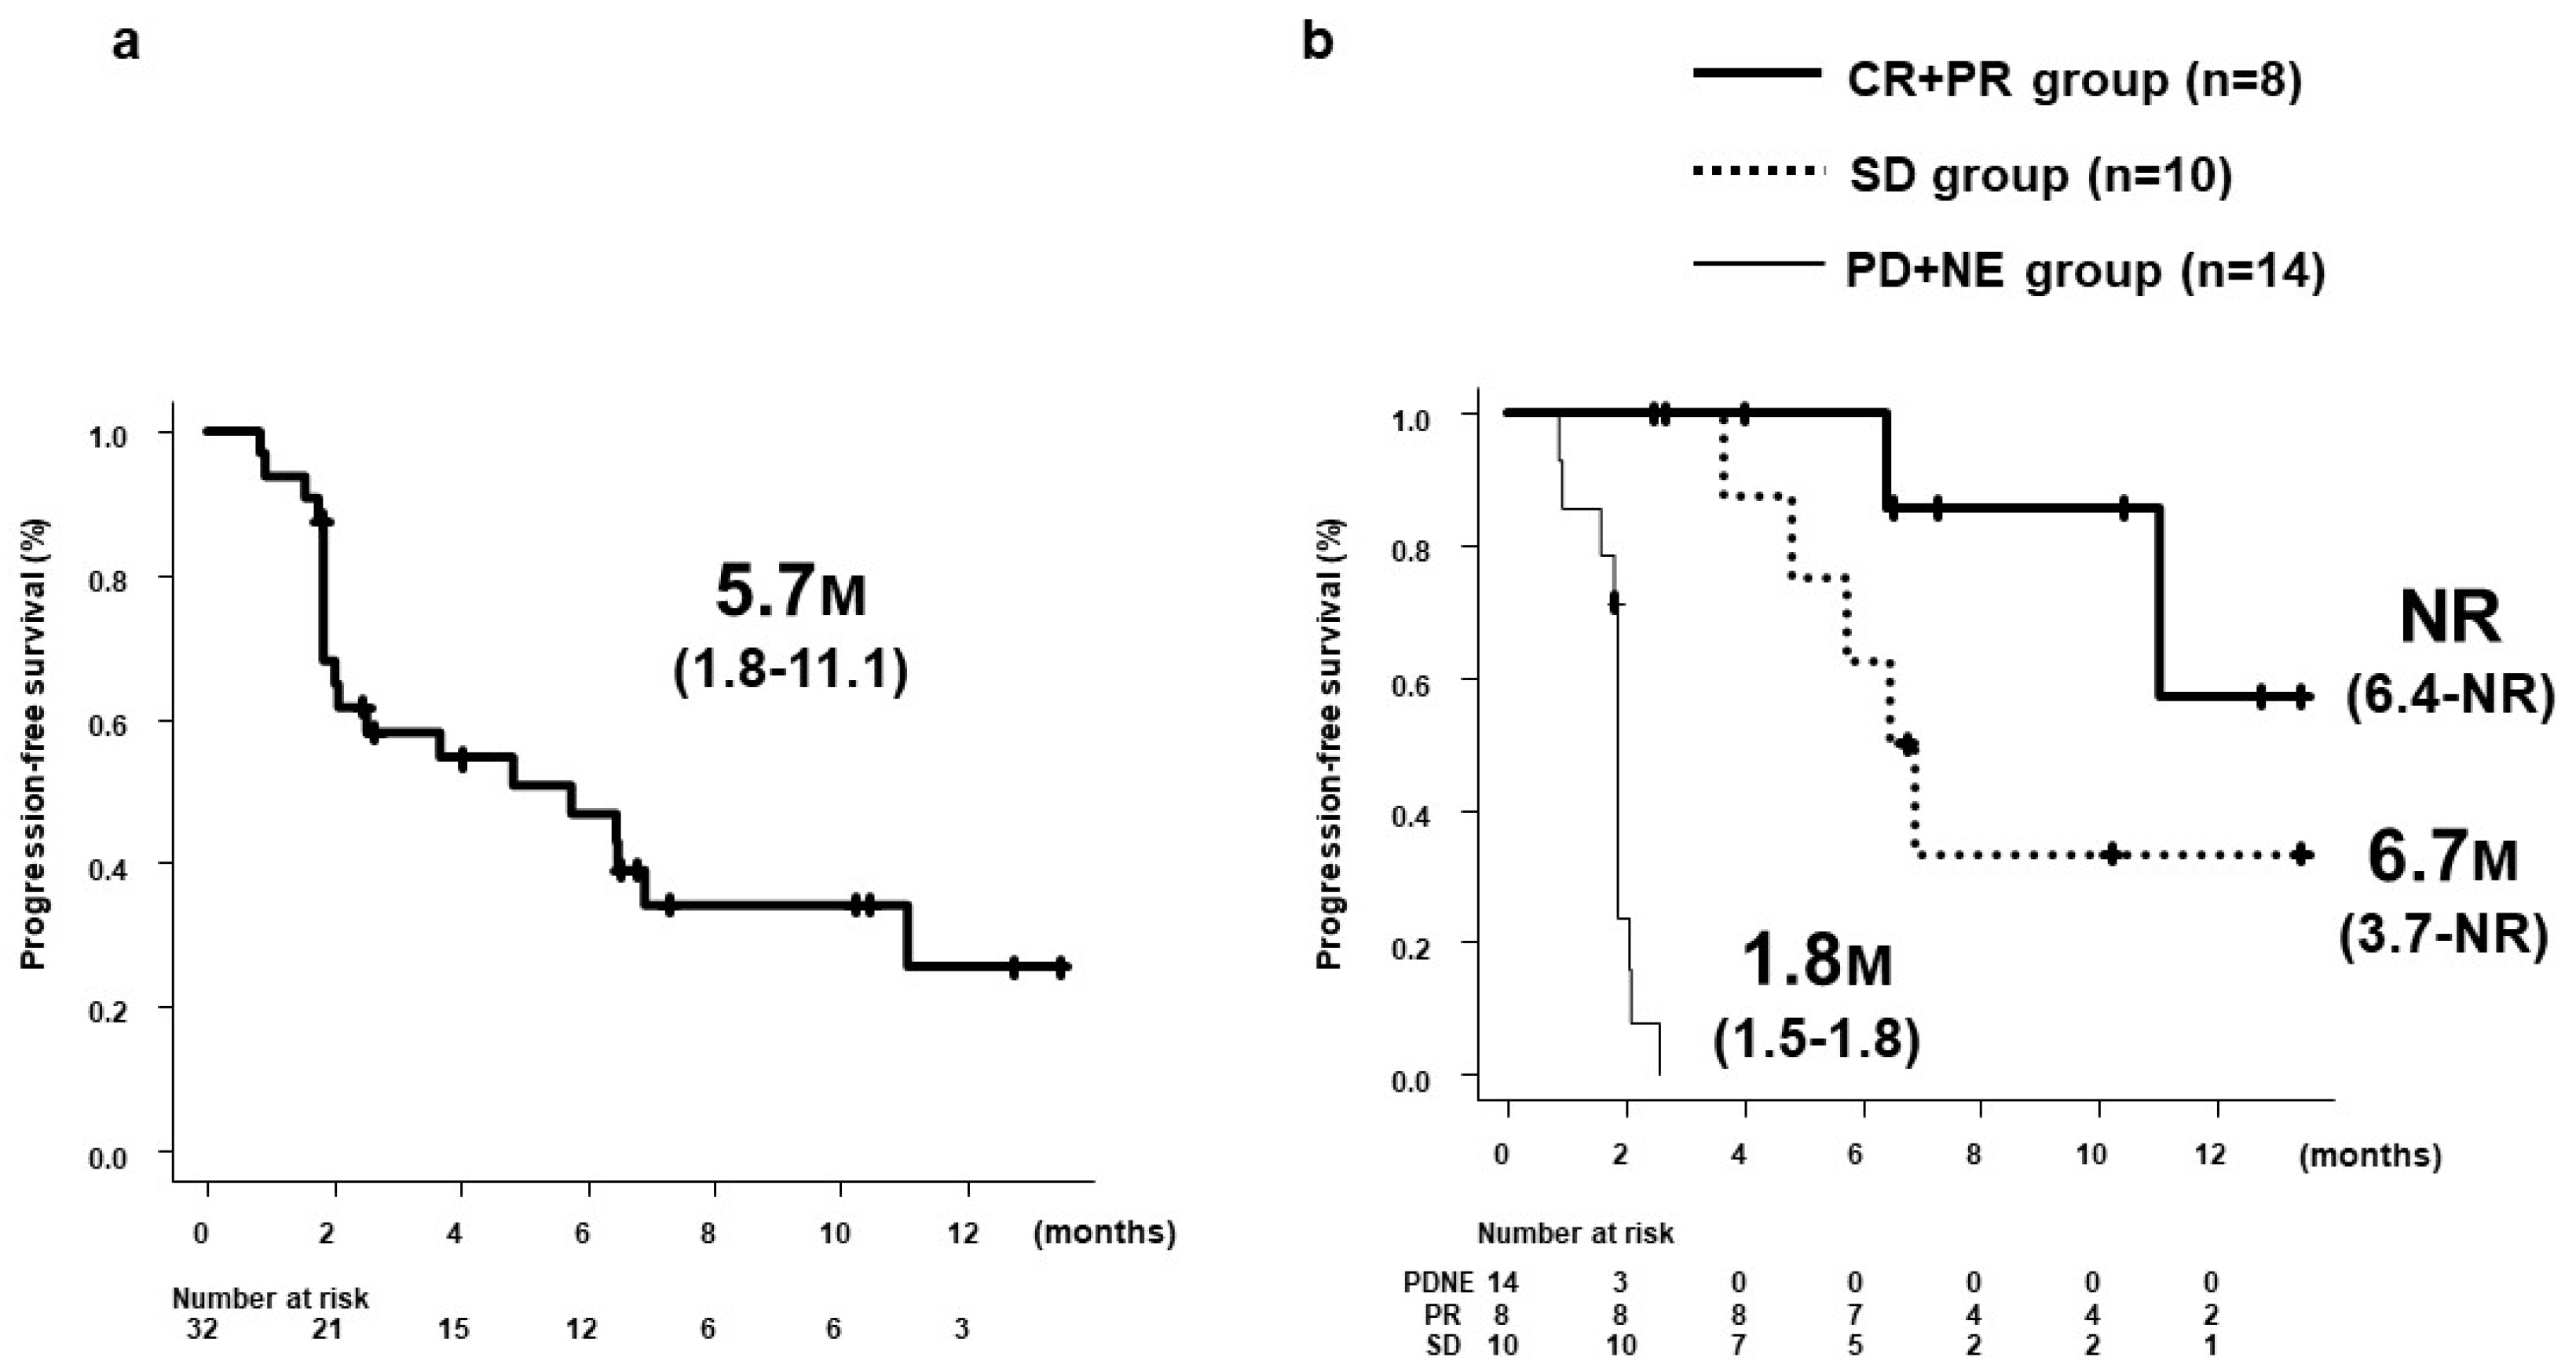
Figure 1. PFS in all patients and by 8W-RECIST. a) Median PFS in all 32 patients was 5.7 months (95%CI: 1.8-11.1). b) Median PFS by 8W-RECIST was NR (95%CI: 6.4-NR) for CR + PR group (n = 8), 6.7 months (95%CI: 3.7-NR) for SD group (n = 10) and 1.8 months (95%CI: 1.5-1.8) for PD + NE group (n = 14). PFS, progression-free survival; M, months; 8W-RECIST, Response Evaluation Criteria in Solid Tumors at 8 weeks after initiation; CR, complete response; PR, partial response; SD, stable disease; PD, progressive disease; NE, not evaluated; NR, not reached.
Preprints 110517 g001
Figure 2. OS in all patients and by 8W-RECIST. a) Median OS in all 32 patients was NR (95%CI: NR-NR). b) Median OS in the CR + PR + SD group was NR (95%CI: NR-NR), but significantly longer than the NR (95%CI: 2.9 months-NR) in the PD + NE group (p = 0.0035). OS, overall survival; M, months; 8W-RECIST, Response Evaluation Criteria in Solid Tumors at 8 weeks after initiation; CR, complete response; PR, partial response; SD, stable disease; PD, progressive disease; NE, not evaluated; NR, not reached.
Preprints 110517 g002
Figure 3. AFP ratios at 2, 4, and 8 weeks after Dur/Tre initiation, stratified by 8W-RECIST. a) Median AFP ratios at 2, 4 and 8 weeks were: 0.830, 0.310, and 0.16 in patients with CR + PR (n = 6); 0.810, 1.005, and 1.095 in patients with SD (n = 6); and 1.170, 1.210, and 1.900 in patients with PD + NE (n = 11), respectively; b) Median AFP ratios in the CR + PR (8W-OR) group (n = 6) at weeks 4 and 8 were significantly lower than those in the SD + PD + NE (Non-8W-OR) group (n = 17). c) Median AFP ratios in the CR + PR + SD (8W-DC) group (n = 12) at weeks 2, 4 and 8 were significantly lower than those in the PD + NE (Non-8W-DC) group (n = 11). AFP, alpha fetoprotein; 8W-RECIST, Response Evaluation Criteria in Solid Tumors at 8 weeks after initiation; CR, complete response; PR, partial response; SD, stable disease; PD, progressive disease; NE, not evaluated; OR, objective response; DC, disease control.
Preprints 110517 g003
Figure 4. DCP ratios at 2, 4, and 8 weeks after Dur/Tre initiation, stratified by 8W-RECIST. a) Median DCP ratios at 2, 4 and 8 weeks were: 0.350, 0.125, and 0.055 in patients with CR + PR (n = 7); 1.180, 1.520, and 1.240 in patients with SD (n = 9); and 1.065, 1.120, and 1.455 in patients with PD + NE (n = 11), respectively. b) Median DCP ratios in the 8W-OR group (n = 7) at weeks 2, 4 and 8 were significantly lower than those in the Non-8W-OR group (n = 20). c) Median DCP ratios in the 8W-DC group (n = 16) at weeks 4 and 8 were significantly lower than those in the Non-8W-DC group (n = 11). DCP, des-γ-carboxy prothrombin; 8W-RECIST, Response Evaluation Criteria in Solid Tumors at 8 weeks after initiation; CR, complete response; PR, partial response; SD, stable disease; PD, progressive disease; NE, not evaluated; OR, objective response; DC, disease control.
Preprints 110517 g004
Figure 5. AFP-L3 ratios at 4 and 8 weeks after Dur/Tre initiation, stratified by 8W-RECIST. a) Median AFP-L3 ratios at 4 and 8 weeks were: 0.905 and 0.496 in patients with CR + PR (n = 7); 1.031 and 1.099 in patients with SD (n = 9); and 1.016 and 1.084 in patients with PD + NE (n = 11), respectively. b) No significant differences in median AFP-L3 ratio were seen between the 8W-OR and Non-8W-PR groups. c) No significant differences in median AFP-L3 ratio were seen between the Non-8W-DC and 8W-DC groups. AFP-L3, lens culinaris agglutinin-reactive fraction of alpha-fetoprotein; 8W-RECIST, Response Evaluation Criteria in Solid Tumors at 8 weeks after initiation; CR, complete response; PR, partial response; SD, stable disease; PD, progressive disease; NE, not evaluated; OR, objective response; DC, disease control.
Preprints 110517 g005
Figure 6. PFS by treatment line and NLR level. a) Median PFS in the 1st-line group was NR (95%CI: 1.8 months-NR), but was significantly longer than the 2.1 months (95%CI: 1.8–6.4 months) in the 2nd-line or later group (p = 0.0037). b) Median PFS in the NLR < 2.78 group was 11.0 months (95%CI: 2.5 months—NR), significantly longer than the 2.0 months (95%CI: 1.8–4.8 months) in the NLR ≥ 2.78 group (p = 0.0040). PFS, progression-free survival; M, months; NR, not reached; NLR, neutrophil-to-lymphocyte ratio.
Preprints 110517 g006
Figure 7. Changes in ALBI scores within 8 weeks in 32 patients. ALBI scores (median ± standard error) at baseline and weeks 1, 2, 4, and 8 were -2.18 ± 0.08, -2.19 ± 0.10, -2.23 ± 0.10, -2.22 ± 0.11, and -2.25 ± 0.10, respectively. ALBI, albumin-bilirubin.
Preprints 110517 g007
Figure 8. Flowchart on post-PD therapy. For patients with both Child–Pugh classification A and ECOG-PS 0 or 1 at time of PD confirmation, all 14 (100%) were able to progress to post-PD therapy, whereas only 2 of the remaining 6 patients (33.3%) were able to progress to post-PD therapy. PD, progressive disease; ECOG, Eastern Cooperative Oncology Group; PS, performance status; BSC, best supportive care.
Preprints 110517 g008
Table 1. Baseline characteristics at initiation of durvalumab plus tremelimumab.
Patient characteristics n = 32
Age, years; median (range) 75 (40–89)
Sex, male/female 27/5
Etiology, HBV/HCV/non-viral 5/6/21
Treatment line, 1st/2nd/3rd/4th/5th 15/6/7/2/2
ECOG-PS, 0/1 28/4
Child–Pugh score, 5/6/7/8 16/11/4/1
mALBI grade, 1/2a/2b/3 7/8/16/1
BCLC stage, A/B/C 1/17/14
Intrahepatic tumor number, <4/≥4 6/26
Maximum intrahepatic tumor size, <50 mm/≥50 mm 20/12
Portal vein tumor thrombosis, 0/1/2/3/4 23/0/4/4/1
Extrahepatic metastasis, -/+ 22/10
AFP level, ng/mL; median (range) 138 (1.7–17,239)
DCP level, mAU/ml; median (range) 2068 (10–162,000)
AFP-L3 level, %; median (range) 19.1 (<0.5–88.1)
NLR; median (range) 2.73 (1.36–10.95)
Observation period, months; median (range) 8.0 (1.5–13.6)
HBV, hepatitis B virus; HCV, hepatitis C virus; non-viral, non-HBV and non-HCV; ECOG, Eastern Cooperative Oncology Group; PS, performance status; mALBI, modified albumin-bilirubin; BCLC, Barcelona Clinic Liver Cancer; AFP, alpha-fetoprotein; DCP, des-γ-carboxy prothrombin; AFP-L3, lens culinaris agglutinin-reactive fraction of alpha-fetoprotein; NLR, neutrophil-to-lymphocyte ratio.
Table 2. Antitumor response according to RECIST and mRECIST at 8 weeks after initiating durvalumab plus tremelimumab (n = 32).
CR
n (%)
PR
n (%)
SD
n (%)
PD
n (%)
NE
n (%)
CRR ORR DCR
8W-RECIST 0
(0)
8
(25.0)
10
(31.3)
13
(40.6)
1
(3.1)
0% 25.0% 56.3%
8W-mRECIST 3
(9.4)
7
(21.9)
8
(25.0)
13
(40.6)
1
(3.1)
9.4% 31.3% 56.3%
W, weeks; RECIST, Response Evaluation Criteria in Solid Tumors; mRECIST, modified RECIST; CR, complete response; PR, partial response; SD, stable disease; PD, progressive disease; NE, not evaluated; CRR, complete response rate; ORR, objective response rate; DCR, disease control rate.
Table 3. AFP ratio at 2, 4, and 8 weeks after initiating durvalumab and tremelimumab, stratified by 8W-RECIST (n = 23).
8W-RECIST AFP ratios, median (SE) p value
CR + PR
(8W-OR)
n = 6
SD
n = 6
PD + NE
(Non-8W-DC)
n = 11
CR + PR + SD
(8W-DC)
n = 12
SD + PD + NE
(Non-8W-OR)
n = 17
8W-OR
vs
Non-8W-OR
8W-DC
vs
Non-8W-DC
At 2W 0.830
(0.364)
0.810
(0.062)
1.170
(0.144)
0.830
(0.159)
1.105
(0.111)
0.2475 0.0112
At 4W 0.310
(0.142)
1.005
(0.149)
1.210
(0.349)
0.470
(0.120)
1.080
(0.254)
0.0020 0.0006
At 8W 0.160
(0.163)
1.095
(0.243)
1.900
(1.091)
0.735
(0.191)
1.500
(0.706)
0.0020 0.0037
AFP, alpha fetoprotein; 8W-RECIST, Response Evaluation Criteria in Solid Tumors at 8 weeks after initiation; SE, standard error; CR, complete response; PR, partial response; SD, stable disease; PD, progressive disease; NE, not evaluated; OR, objective response; DC, disease control; W, weeks.
Table 4. DCP ratio at 2, 4, and 8 weeks after initiating durvalumab and tremelimumab, stratified by 8W-RECIST (n = 27).
8W-RECIST DCP ratios, median (SE) p value
CR + PR
(8W-OR)
n = 7
SD
n = 9
PD + NE
(Non-8W-DC)
n = 11
CR + PR + SD
(8W-DC)
n = 16
SD + PD + NE
(Non-8W-OR)
n = 20
8W-OR
vs
Non-8W-OR
8W-DC
vs
Non-8W-DC
At 2W 0.350
(0.309)
1.180
(0.095)
1.065
(0.144)
0.910
(0.157)
1.130
(0.129)
0.0357 0.3550
At 4W 0.125
(0.0531)
1.520
(0.231)
1.120
(0.349)
0.480
(0.189)
1.225
(0.418)
0.0001 0.0255
At 8W 0.055
(0.073)
1.240
(0.440)
1.455
(1.0919
0.460
(0.284)
1.240
(1.145)
0.0001 0.0147
DCP, des-γ-carboxy prothrombin; 8W-RECIST, Response Evaluation Criteria in Solid Tumors at 8 weeks after initiation; SE, standard error; CR, complete response; PR, partial response; SD, stable disease; PD, progressive disease; NE, not evaluated; OR, objective response; DC, disease control; W, weeks.
Table 5. AFP-L3 ratio at 2, 4, and 8 weeks after initiating durvalumab and tremelimumab, stratified by 8W-RECIST (n = 27).
8W-RECIST AFP-L3 ratios, median (SE) p value
CR + PR
(8W-OR)
n = 7
SD
n = 9
PD + NE
(Non-8W-DC)
n = 11
CR + PR + SD
(8W-DC)
n = 16
SD + PD + NE
(Non-8W-OR)
n = 20
8W-OR
vs
Non-8W-OR
8W-DC
vs
Non-8W-DC
At 4W 0.905
(0.149)
1.031
(0.074)
1.016
(0.025)
1.000
(0.078)
1.016
(0.033)
0.0779 0.5858
At 8W 0.496
(0.242)
1.099
(0.106)
1.084
(0.040)
1.028
(0.122)
1.092
(0.052)
0.1213 0.3001
AFP-L3, lens culinaris agglutinin-reactive fraction of alpha-fetoprotein; 8W-RECIST, Response Evaluation Criteria in Solid Tumors at 8 weeks after initiation; SE, standard error; CR, complete response; PR, partial response; SD, stable disease; PD, progressive disease; NE, not evaluated; OR, objective response; DC, disease control; W, weeks.
Table 6. Uni- and multivariate survival analyses of factors at initiation of durvalumab plus tremelimumab associated with good PFS.
Univariate analysis Multivariate analysis
Factors HR (95%CI) p value HR (95%CI) p value
Age (<75 years) 0.913 (0.374-2.226) 0.8412
Sex (female) 1.531 (0.506-4.636) 0.4508
Etiology (HBV or HCV) 1.846 (0.749-4.552) 0.1830
Treatment line (1st) 0.233 (0.078-0.702) 0.0096 0.209 (0.069-0.637) 0.0059
ECOG-PS (0) 0.597 (0.173-2.059) 0.4141
Child–Pugh score (5) 0.655 (0.270-1.590) 0.3498
BCLC stage (A or B) 0.600 (0.247-1.459) 0.2603
Number of intrahepatic tumors (≥4) 1.111 (0.322-3.832) 0.8677
Maximum size of intrahepatic tumors (≥50 mm) 0.941 (0.374-3.372) 0.8978
Portal vein tumor thrombosis (+) 1.463 (0.577-3.707) 0.4224
Extrahepatic metastasis (+) 0.519 (0.211-1.277) 0.1534
AFP level (≥163ng/mL) 2.065 (0.822-5.191) 0.1230
DCP level (≥2294 mAU/ml) 2.010 (0.818-4.938) 0.1277
AFP-L3 level (≥43.4%) 2.206 (0.894-5.445) 0.0860
NLR (<2.78) 0.2680 (0.100-0.717) 0.0087 0.234 (0.085-0.647) 0.0051
PFS, progression-free survival; HR, hazard ratio; CI, confidence interval; HBV, hepatitis B virus; HCV, hepatitis C virus; ECOG, Eastern Cooperative Oncology Group; PS, performance status; BCLC, Barcelona Clinic Liver Cancer; AFP, alpha-fetoprotein; DCP, des-γ-carboxy prothrombin; AFP-L3, lens culinaris agglutinin-reactive fraction of alpha-fetoprotein; NLR, neutrophil-to-lymphocyte ratio.
Table 7. Adverse events within 8 weeks of initiating durvalumab plus tremelimumab (n = 32).
Adverse event Any grade
n (%)
Grade 1/2
n (%)
Grade 3/4
n (%)
Anorexia 7 (21.9) 6 (18.8) 1 (3.1)
General fatigue 7 (21.9) 7 (21.9) 0
Pruritus 7 (21.9) 7 (21.9) 0
Fever 7 (21.9) 7 (21.9) 0
Diarrhea 6 (18.8) 2 (6.3) 4 (12.5)
Skin rash 3 (9.4) 3 (9.4) 0
Deterioration of liver function 2 (6.3) 0 2 (6.3)
Reduced adrenal function 1 (3.1) 1 (3.1) 0
Elevated aspartate aminotransferase 2 (6.3) 1 (3.1) 1 (3.1)
Hypothyroidism 1 (3.1) 1 (3.1) 0
Disclaimer/Publisher’s Note: The statements, opinions and data contained in all publications are solely those of the individual author(s) and contributor(s) and not of MDPI and/or the editor(s). MDPI and/or the editor(s) disclaim responsibility for any injury to people or property resulting from any ideas, methods, instructions or products referred to in the content.
Copyright: This open access article is published under a Creative Commons CC BY 4.0 license, which permit the free download, distribution, and reuse, provided that the author and preprint are cited in any reuse.
Alerts
Prerpints.org logo

Preprints.org is a free preprint server supported by MDPI in Basel, Switzerland.

Subscribe

© 2025 MDPI (Basel, Switzerland) unless otherwise stated