1. Introduction
Biothiols, such as cysteine (Cys), homocysteine (Hcy), and glutathione (GSH), play crucial roles in various physiological processes including cellular defense against oxidative stress, enzyme regulation, and signal transduction [
1,
2]. These sulfur-containing compounds maintain redox homeostasis and facilitate numerous metabolic pathways. Dysregulation of biothiol levels is associated with a myriad of diseases, including cancer, and neurodegenerative disorders [
3], and cardiovascular diseases [
4,
5]. Consequently, the accurate and sensitive detection of biothiols is of paramount importance for both diagnostic and therapeutic purposes. Traditional methods for biothiol detection, such as chromatography [
6] and electrophoresis [
7], although effective, often require complex procedures and sophisticated instrumentation, limiting their practicality for routine clinical and field applications. Therefore, the development of simple, rapid, and cost-effective detection methods is highly sought after in biochemical research and clinical diagnostics.
One promising strategy that has gained significant attention is the Indicator Displacement Approach (IDA) [
8,
9]. This method leverages the competitive binding of biothiols to a metal complex or a supramolecular host system, which is initially associated with an indicator molecule. The presence of biothiols results in the displacement of the indicator, leading to a measurable change in the optical or fluorescent properties of the system. IDA offers several advantages, including high selectivity, sensitivity, and the potential for real-time monitoring. Furthermore, the simplicity of the assay design makes it an attractive alternative for on-site and high-throughput screening applications. Recently plasmonic materials such as gold nanoparticles (AuNPs), silver nanoparticles (AgNPs) and various quantum dots have shown promising results in the field of biothiol detection [
10,
11,
12]. The thiol group in biothiols shows a strong affinity towards Au and Ag which can induce changes in the surface plasmon resonance (SPR) absorption peaks of nanoparticles and this event can be easily monitored by optical spectroscopy techniques. Interaction of thiols or analytes with NPs results in a change of size, shape, and SPR properties, which can induce visible color changes. NPs-based detection showed high sensitivity, but due to unwanted interactions and complex sample matrices, selectivity towards analyte is still challenging in the field of detection of bithiols. Another interesting aspect of plasmonic nanomaterials such as Au and Ag is, that they possess surface-enhanced Raman Scattering properties (SERS) which have emerged as a powerful tool, offering unparalleled sensitivity and molecular specificity [
13,
14,
15]. The principle of SERS involves the enhancement of Raman scattering signals from molecules adsorbed on nanostructured metal surfaces, typically Au or Ag, leading to a dramatic improvement in detection limits. AuNPs serve as excellent SERS substrates due to their unique optical properties, facile synthesis, and biocompatibility, making them well-suited for biological applications and analyte detections. Recently plasmonic chiral Au nanomaterials have been used for the enantioselective recognition of Cysteine with high sensitivity and reproducibility using SERS technique [
16,
17].
Thus, herein we report an innovative approach in which IDA is coupled with SERS to detect biothiols. The IDA-SERS strategy combines the specificity and dynamic range of IDA with SERS's high sensitivity and molecular fingerprinting capabilities. For this we have synthesized a nanocomposite (1) from AuNPs and a dual BODIPY dye (DBDP). This method leverages the competitive binding of biothiols to AuNPs, displacing the pre-bound indicator DBDP whose release is then detected by fluorescence spectroscopy. The binding of biothiols caused a noticeable color change from pale purple to dark brown with a "turn-on" fluorescence in DBDP dye, which was nonfluorescent when on the surface of AuNPs. The lack of fluorescence is due to the strong coupling between the electronic states of DBDP and the surface plasmon of AuNPs, leading to the creation of hybrid states [
18,
19]. The AuNPs bound with biothiols were separated by simple centrifugation and were analyzed using Raman spectroscopy. The SERS technique provides an amplified Raman signal due to the localized surface plasmon resonance effect of metallic nanostructures, offering a powerful tool for the trace detection of biothiols. Thus, the detection of biothiols can be performed in multiple ways by monitoring the colorimetric response (daylight/UV light), emission spectroscopy, and precisely by the SERS measurements. Both solution and dry state mapping studies using Raman spectroscopy showed an attomolar detection limit for Cys with high sensitivity and reproducibility. Moreover, the nanocomposite allowed the detection of Cys in the cancer cells. It allowed a path for differentiating normal cells and cancer cells due to the overexpression of biothiol in the latter.
2. Materials and Methods
2.1. General Techniques
The experiments were conducted under controlled conditions at room temperature (25 ± 1 °C), utilizing doubly distilled water throughout. Experiments were performed either in a 3 mM acetate buffer at pH 9.5 or using a 10 mM phosphate-buffered saline at pH 7.4. Absorption spectra were meticulously recorded using a Shimadzu UV-Vis spectrophotometer within 3 mL quartz cuvettes with a path length of 1 cm. Fluorescence spectra, on the other hand, were captured using an Edinburgh FS5 spectrofluorometer. The limit of detection was computed following the methodology outlined in reference 52. For dynamic light scattering analysis, a Malvern Zetasizer 2000 DLS spectrometer equipped with a 633 nm CW laser was employed. The NPs were characterized using TEM (H-7100, Hitachi, Tokyo, Japan). Sample preparation involved depositing a droplet of nanocomposite suspension onto a 300 mesh TEM grid, followed by vacuum drying for 2 hours. Fluorescence microscopy studies were conducted using an Olympus IX73 microscope. Raman spectra were obtained using an inverted Raman microscope (NOST, South Korea) equipped with a 60× objective lens (0.6 N.A.) (Olympus, Tokyo, Japan). A 633 nm laser (CNI laser, China) was used to illuminate the solution. The scattered Raman signal was captured through a confocal motorized pinhole (100 μm) and directed towards a spectrometer (FEX-MD, NOST, South Korea) with a 1200 g/mm grating. Finally, the signal was recorded by a spectroscopy charge-modified device camera (Andor DV401A-BVF, Belfast, Northern Ireland).
2.2. Materials:
HAuCl4, L-amino acids, homocysteine, glutathione, phosphate-buffered saline, bovine serum albumin, fetal bovine serum albumin, human serum albumin, and sodium acetate, were purchased from Sigma-Aldrich.
2.3. Synthesis Procedures
2.3.1. Synthesis of DBDP
DBDP is synthesized as per the previous literature report with slight modification [
20]. Briefly, 1,3,5-benzenetricarbonyl trichloride (1 mmol, 0.265 g) was dissolved in dry CHCl
3 (50 mL) and stirred for 10 minutes. After this, a solution of 2,4-dimethylpyrrole (6 mmol, 0.57 g) in dry CHCl
3 (20 mL) was added dropwise and the mixture was stirred for 10 hours under a nitrogen atmosphere at room temperature. Triethylamine (2.8 mL) was then added dropwise over 5 minutes, followed by the addition of BF
3.Et
2O (3 mL) over another 5 minutes. The reaction was stirred for an additional 10 hours at 0°C. The mixture was washed with saturated brine solution and water, dried over Na
2SO
4, and evaporated under vacuum. The crude product was purified using column chromatography on silica gel with hexane and ethyl acetate as eluents, yielding DBDP as an orange-yellow solid (52 mg).
1H NMR (400 MHz, CDCl
3) 8.19 (s, 2H), 7.56 (s, 1H), 5.95 (m, 5H), 2.49 (s, 12H), 2.32 (s, 3H), 2.03 (s, 3H), 1.49 (s, 12H). HRMS calculated for C
39H
39B
2F
4N
5O 691.3279, obtained 691.3277.
2.3.2. Synthesis of AuNPs-DBDP Nanocomposite NC1
Nanocomposite
NC1 was prepared as per our previous reports [
18,
19]. To a stirred solution of L-tryptophan (25 mM) in 9 mL of water at 25 °C, 1 mL of an aqueous solution of HAuCl4 (5 mM stock solution) and a solution of DBDP (5 mM) in 1 mL of acetone was added simultaneously. The mixture turned brown-orange upon mixing and was stirred continuously for 16 hours at 25 °C. Afterward, the resulting precipitate was collected by centrifugation, washed with water (3 × 5 mL), dried, and re-dispersed in water. The formation of nanocomposite
NC1 was then monitored using UV-Vis absorption measurements and was further characterized by dynamic light scattering (DLS) and microscopy techniques.
2.3.3. Synthesis of DBDP Nanoparticles
A solution of DBDP in acetone (1mg/ml) was added dropwise to stirring water (9 ml), and the solution was stirred for 6 h at room temperature. Following this period, the particles were centrifuged (8000 rpm), and the residue obtained was redispersed and analyzed using spectroscopy and TEM measurements.
2.4. SERS-Based Detection of Biothiols
The nanocomposite NC1 (50 μg/ml) after incubated with various concentrations of biothiols (10-6 M to 10-21 M), centrifuged (8000 rpm, 5 minutes), and the residue was redispersed in water, drop cast on a glass slide using a silicone isolator. The Raman spectra were recorded for each sample solution using a 633 nm laser (exposure time; 10 s, 6.8 mW, 60x objective lens). The samples were dried, and the solid mass containing AuNPs and biothiols was analyzed for Raman mapping studies. About a 1.5–2.0 mm spot on the glass was scanned with a 60×objective for the 25 × 25 pixels (10 s exposure time per pixel). The Raman mapping images were based on the intensity of the Raman shift at 674 cm–1 for biothiols.
2.5 Cell Culture
The breast cancer cell line MDA-MB-231 and the mouse fibroblast cell line L929 were maintained in Dulbecco's Modified Eagle's Medium (DMEM, Himedia), supplemented with 10% fetal bovine serum (FBS, Himedia) and 1% antibiotics-antimycotic solution (Himedia). The cultures were incubated at 37 °C in a humidified atmosphere with 5% CO2 and subcultured twice a week.
2.6. Cellular Uptake Studies
The breast cancer cell line MDA-MB-231 and mouse fibroblast cell line L929 were seeded into a 12-well plate at a density of 1 × 10⁴ cells per well. These cells were then incubated with either a control or various concentrations of NC1 (0, 12.5, and 50 μg/mL). After 24 hours of incubation, the cells were fixed using a 4% paraformaldehyde solution for 10-12 minutes and washed three times with phosphate-buffered saline.
3. Results
3.1. Nanocomposite Preparation and Characterization
Dual bodipy (DBDP) was prepared per the previous reports and characterized using
1HNMR and mass spectroscopy (
Figure S1A-B). The nanocomposite was prepared using previous literature reports with slight modifications [
18,
19]. The formation of nanocomposite (
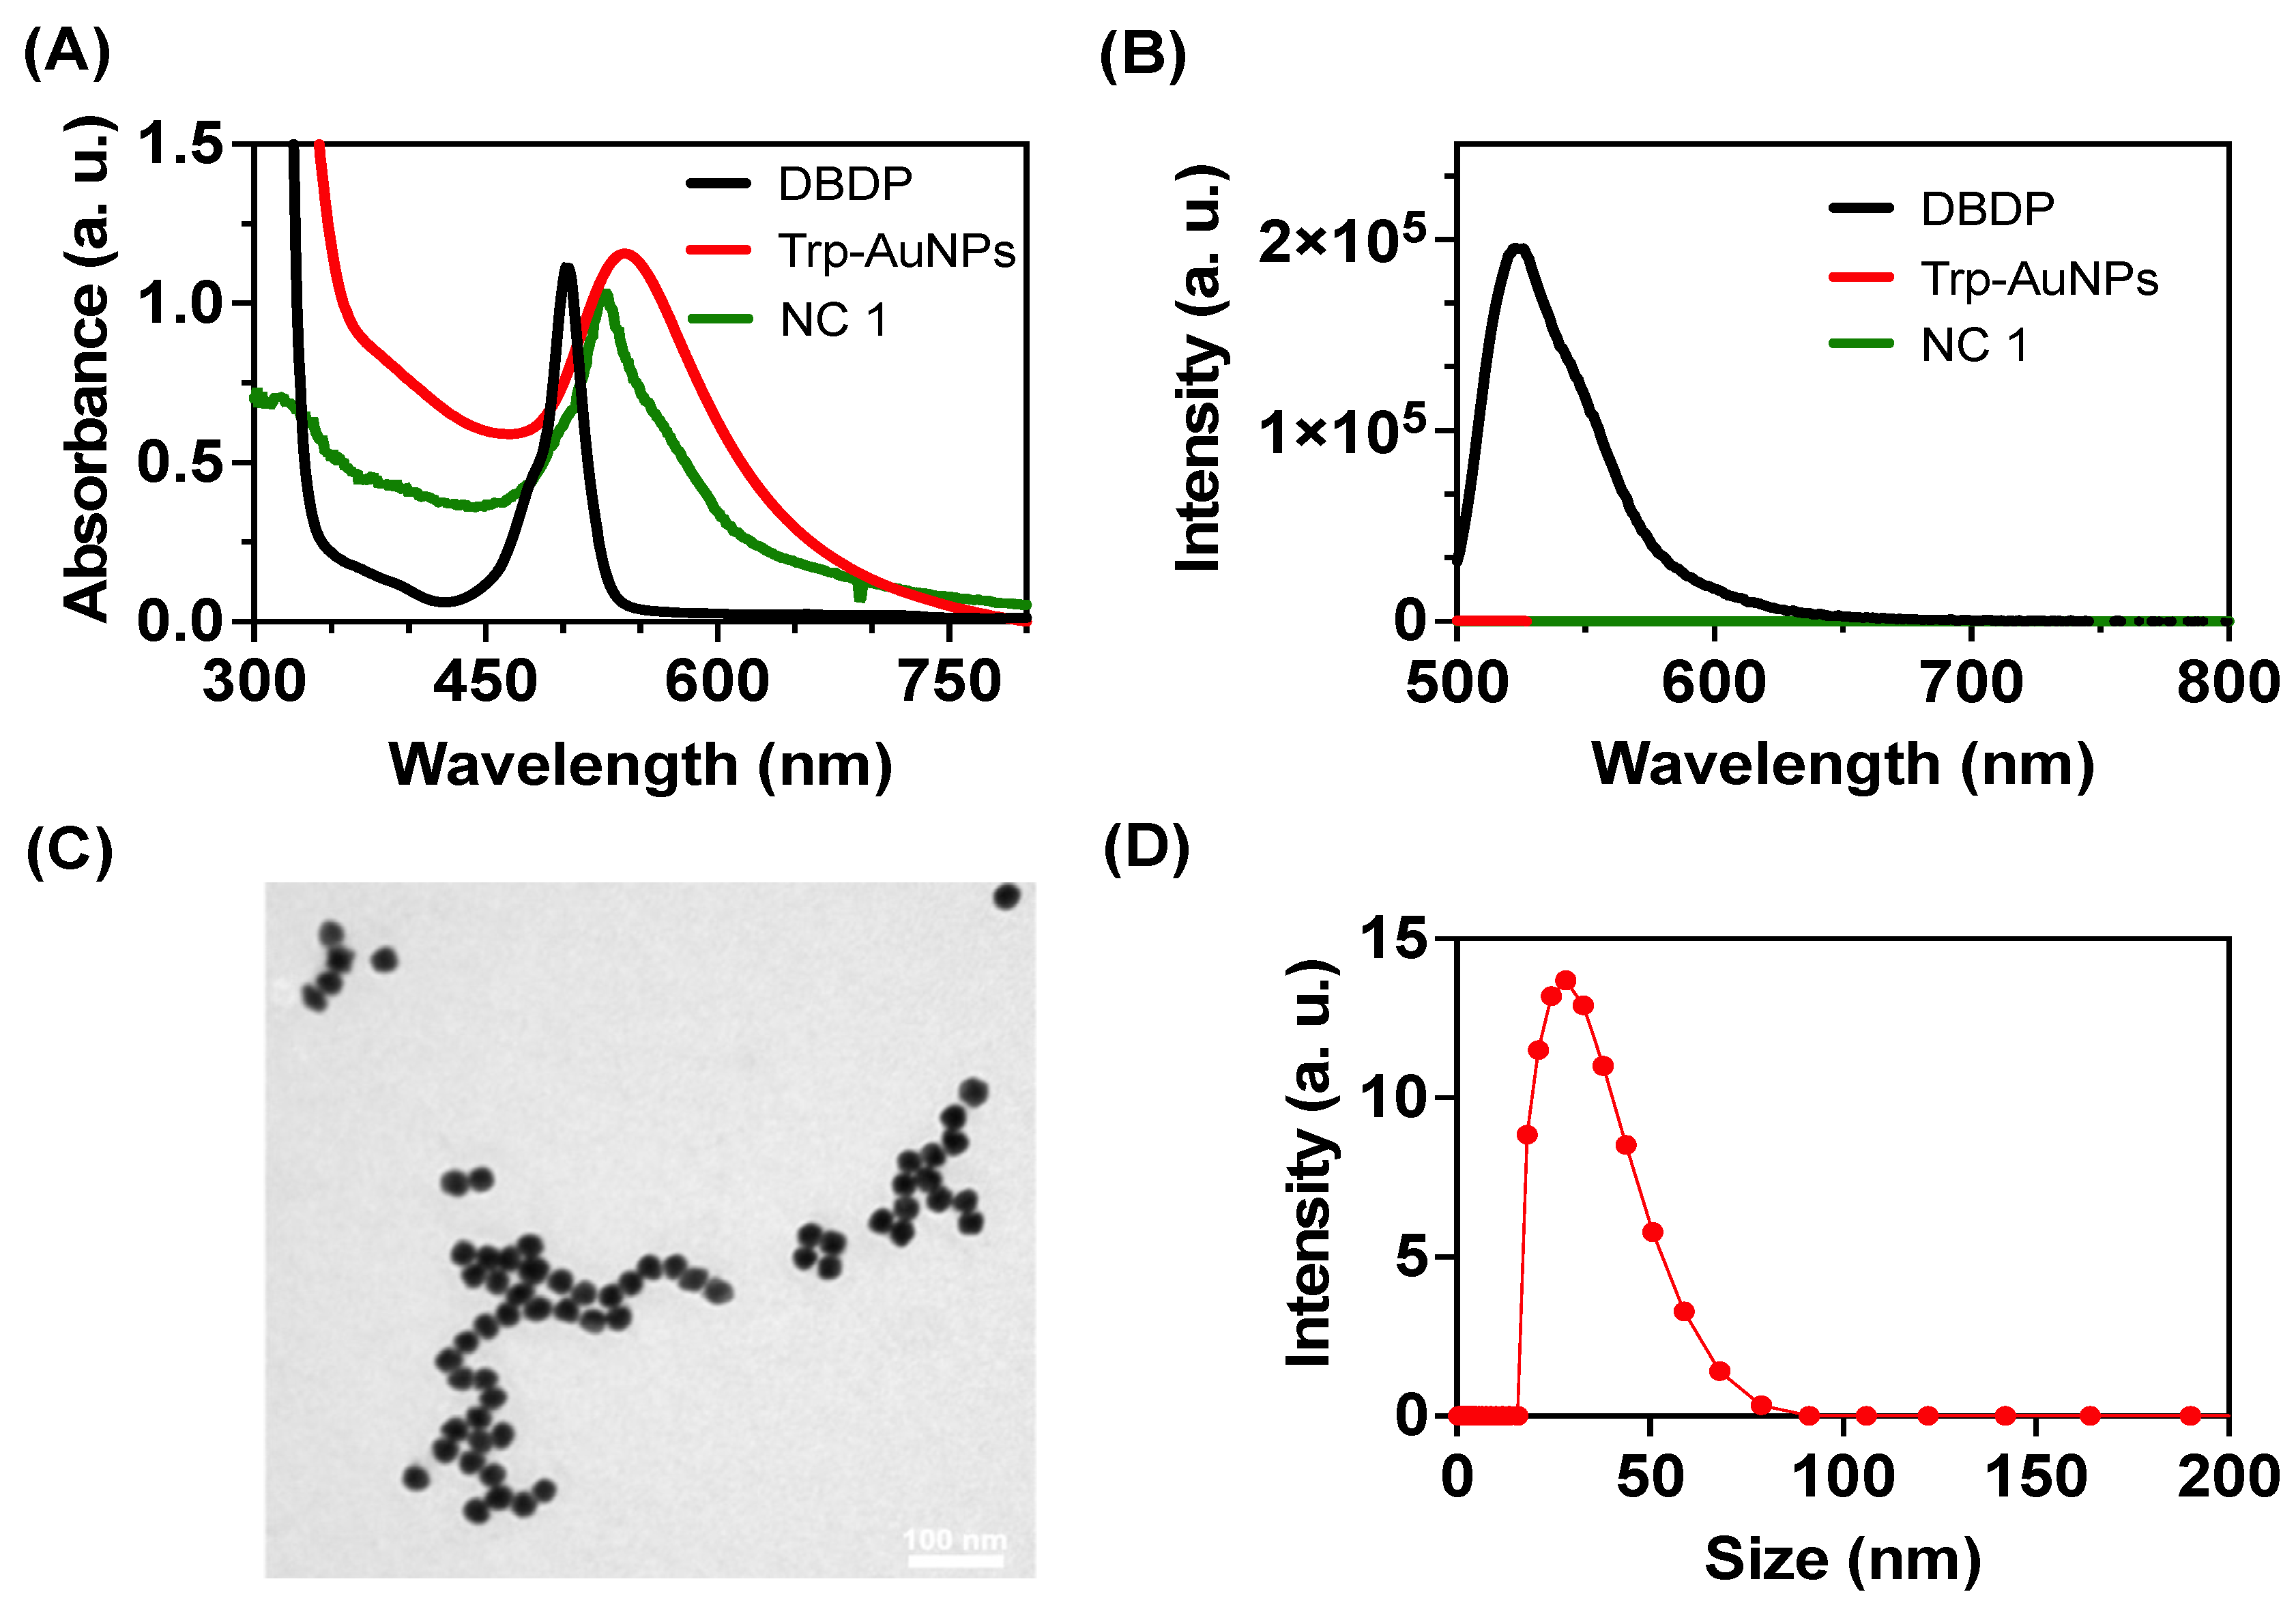
NC1) was confirmed using UV-visible spectroscopy studies. Tryptophan-reduced AuNPs showed an extinction peak at 530 nm, whereas the nanocomposite showed a red-shifted peak at 545 nm as a shoulder in the spectra. DBDP molecule showed an absorption peak at 505 nm in acetone but a redshifted absorption peak at 532 nm in the nanocomposite indicating an interaction between Au and DBDP (
Figure 1A). DBDP is emissive in acetone with an emission peak at 528 nm and it was reported previously that DBDP has a quantum yield of 0.006 in MeOH [
20]. After the formation of
NC1, the fluorescence from DBDP is quenched indicating a strong interaction between excited states of DBDP with AuNPs (
Figure 1B). From previous reports, the complex of BODIPY and Tryptophan reduced AuNPs is stabilized by various supramolecular interactions such as hydrogen bonding, Au-F
δ- bond, indole -NH-F
δ- bonds etc. [
18]. In the DBDP molecule, the additional pyrrole -NH in the core will further stabilize the nanocomposite. Transmission electron microscopy studies showed spherical particles with an average diameter of 25 ± 2.3 nm for
NC1 (
Figure 1C). The dynamic light scattering experiments showed a hydrodynamic size of 42 ± 4.1(
Figure 1D). The electron mapping studies further supported the incorporation of DBDP into the Au matrix (
Figure S2).
3.2. Investigation of Biothiol Interaction and IDA Principle
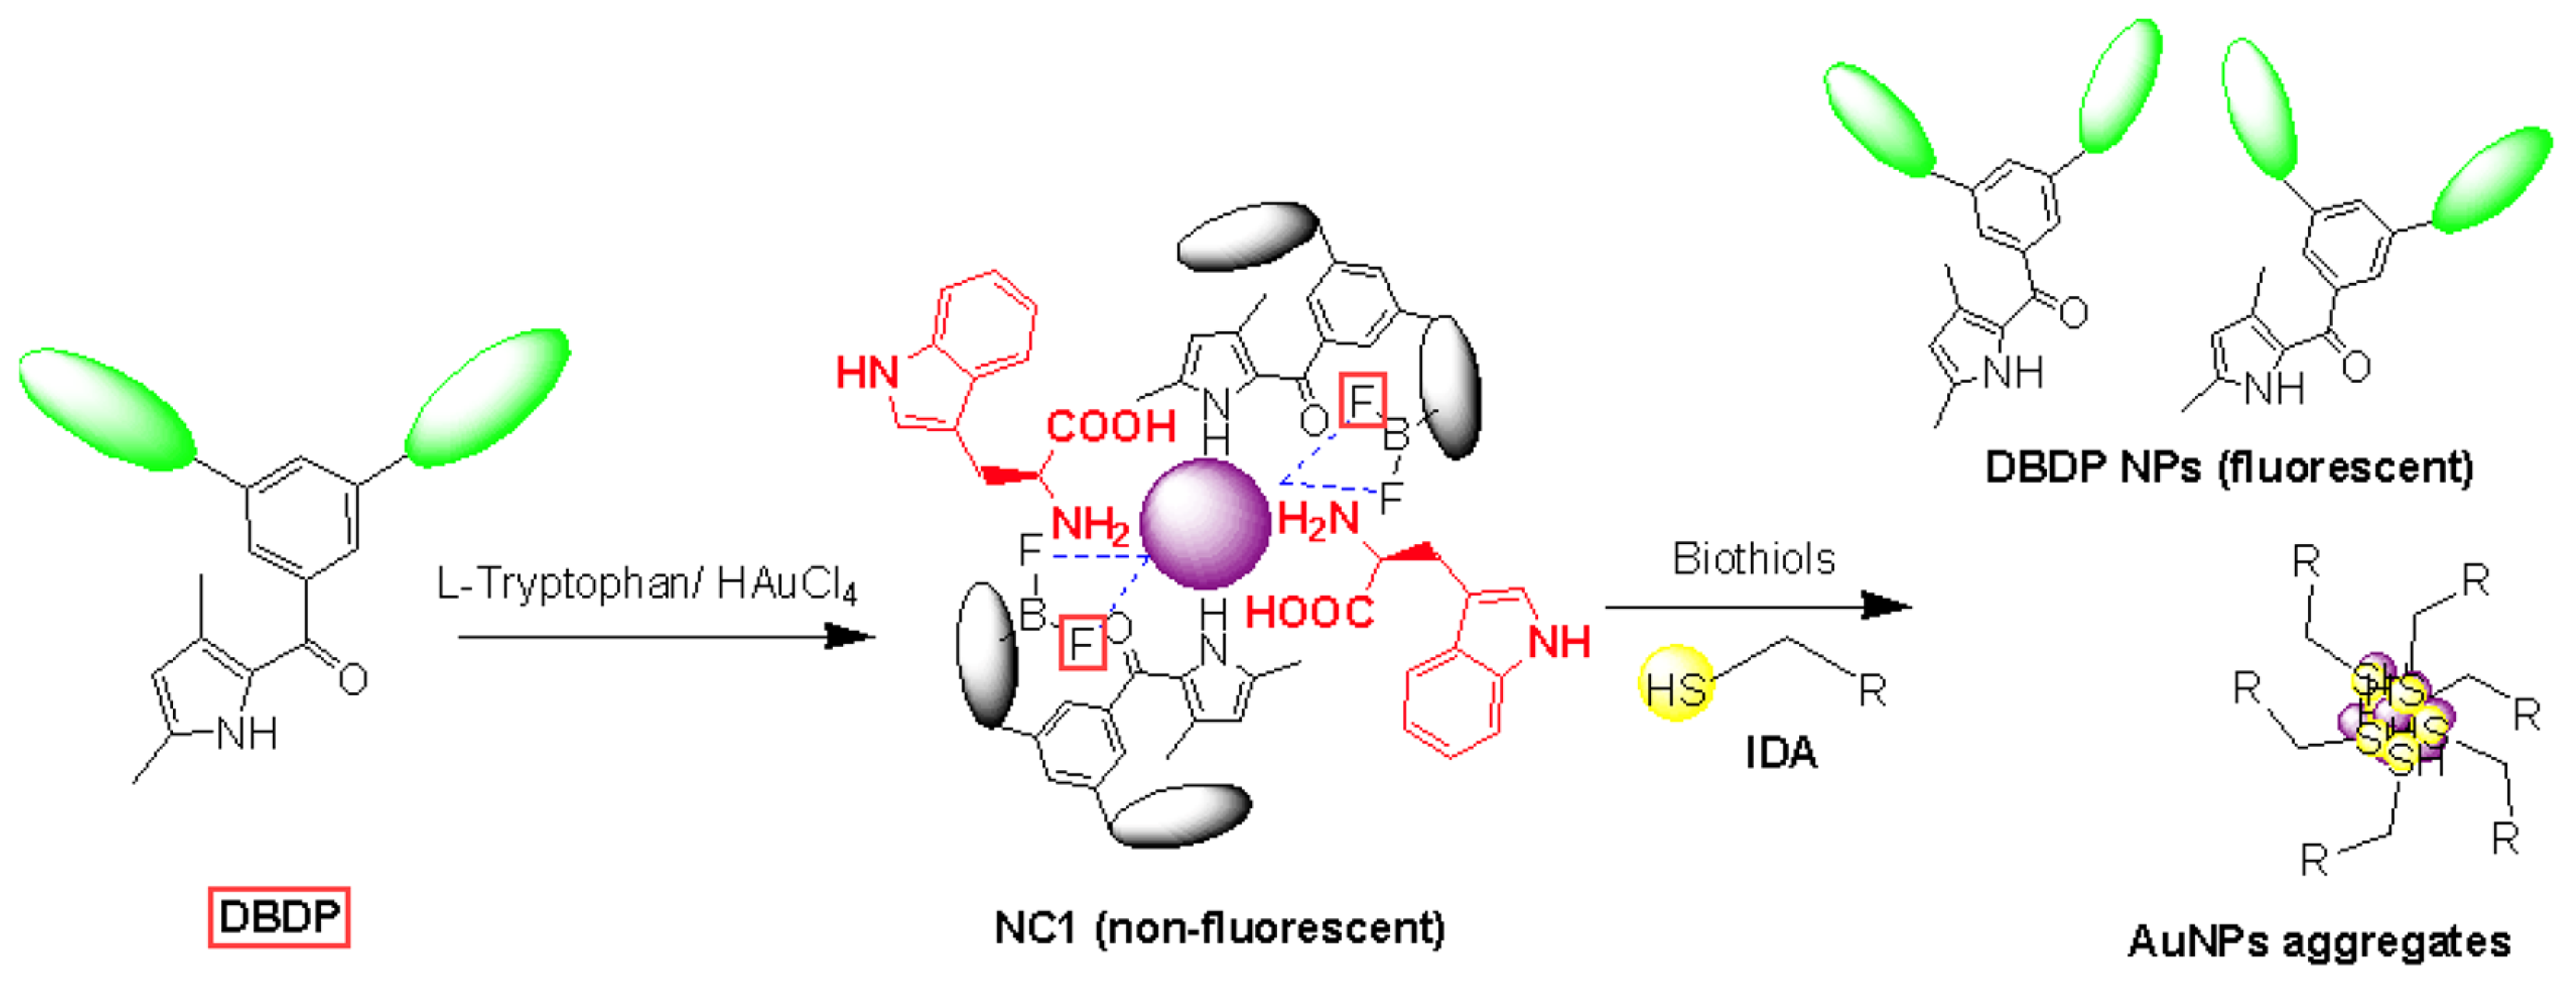
The thiol group possesses strong interaction with AuNPs and thus it can displace weakly bound surfactants from the surface of AuNPs. Here in
NC1, DBDP dye is weakly bound to AuNPs and is non-fluorescent in the supramolecular nanocomposite. The interaction of biothiols with AuNPs, makes a strong bond with Au, and displaces DBDP dye from its surface, and regains its emission property (
Scheme 1).
To test this hypothesis and whether our designed nanocomposite can show an indicator displacement property we have studied the interaction of
NC1 with various L-amino acids using optical spectroscopy techniques. As shown in
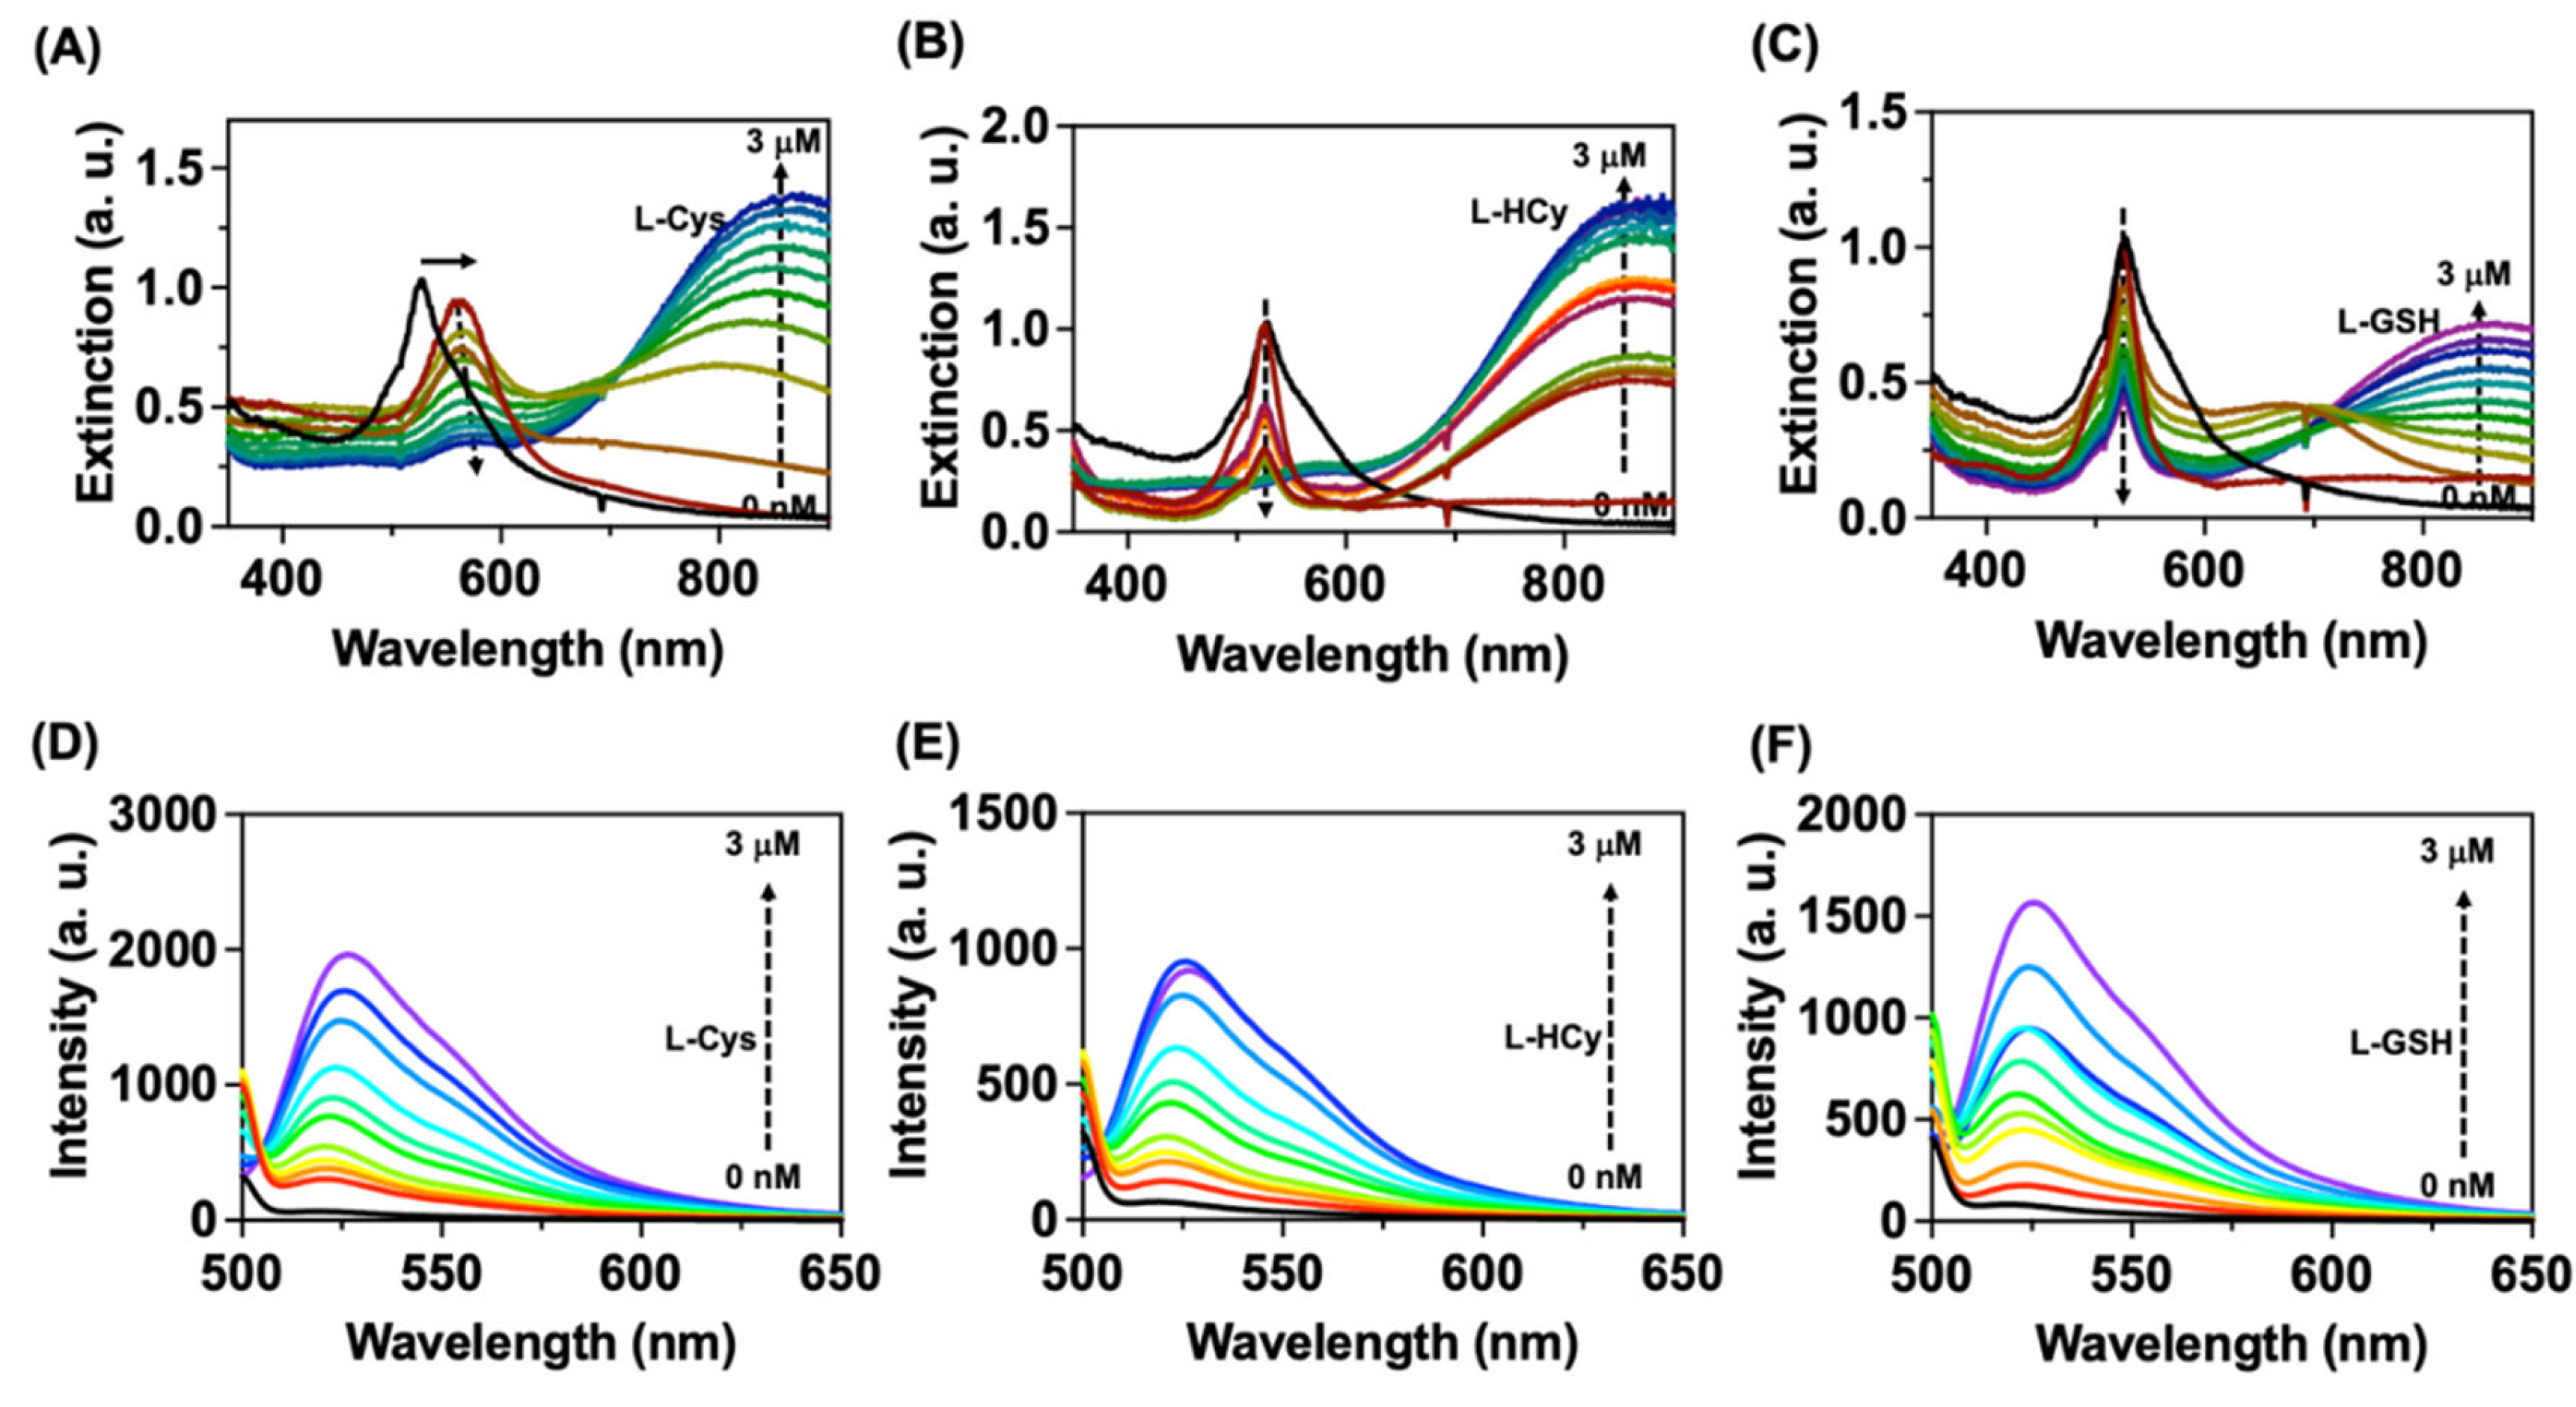
Figure 2A-C among the amino acids tested
NC1 showed dramatic changes in the absorption and emission spectra after adding L-Cys, L-Hcy, and L-GSH in acetate buffer. The addition of biothiols resulted in a peak broadening at 550 nm with the formation of new higher wavelength absorption bands for
NC1 (
Figure 2A-C). The higher wavelength absorption bands are due to the formation of AuNPs aggregates, as confirmed by the transmission electron microscopy studies (
Figure S3A-C). Whereas the peak intensity for DBDP molecule decreased with broadening in the peak indicating the formation of aggregates of DBDP molecule. As mentioned in section 3.1.;
NC1 was non-emissive, whereas the addition of biothiols showed a regular increase in the fluorescence of
NC1 indicating DBDP dye is displacing from the surface of AuNPs (
Figure 2D-F).
The optical response in
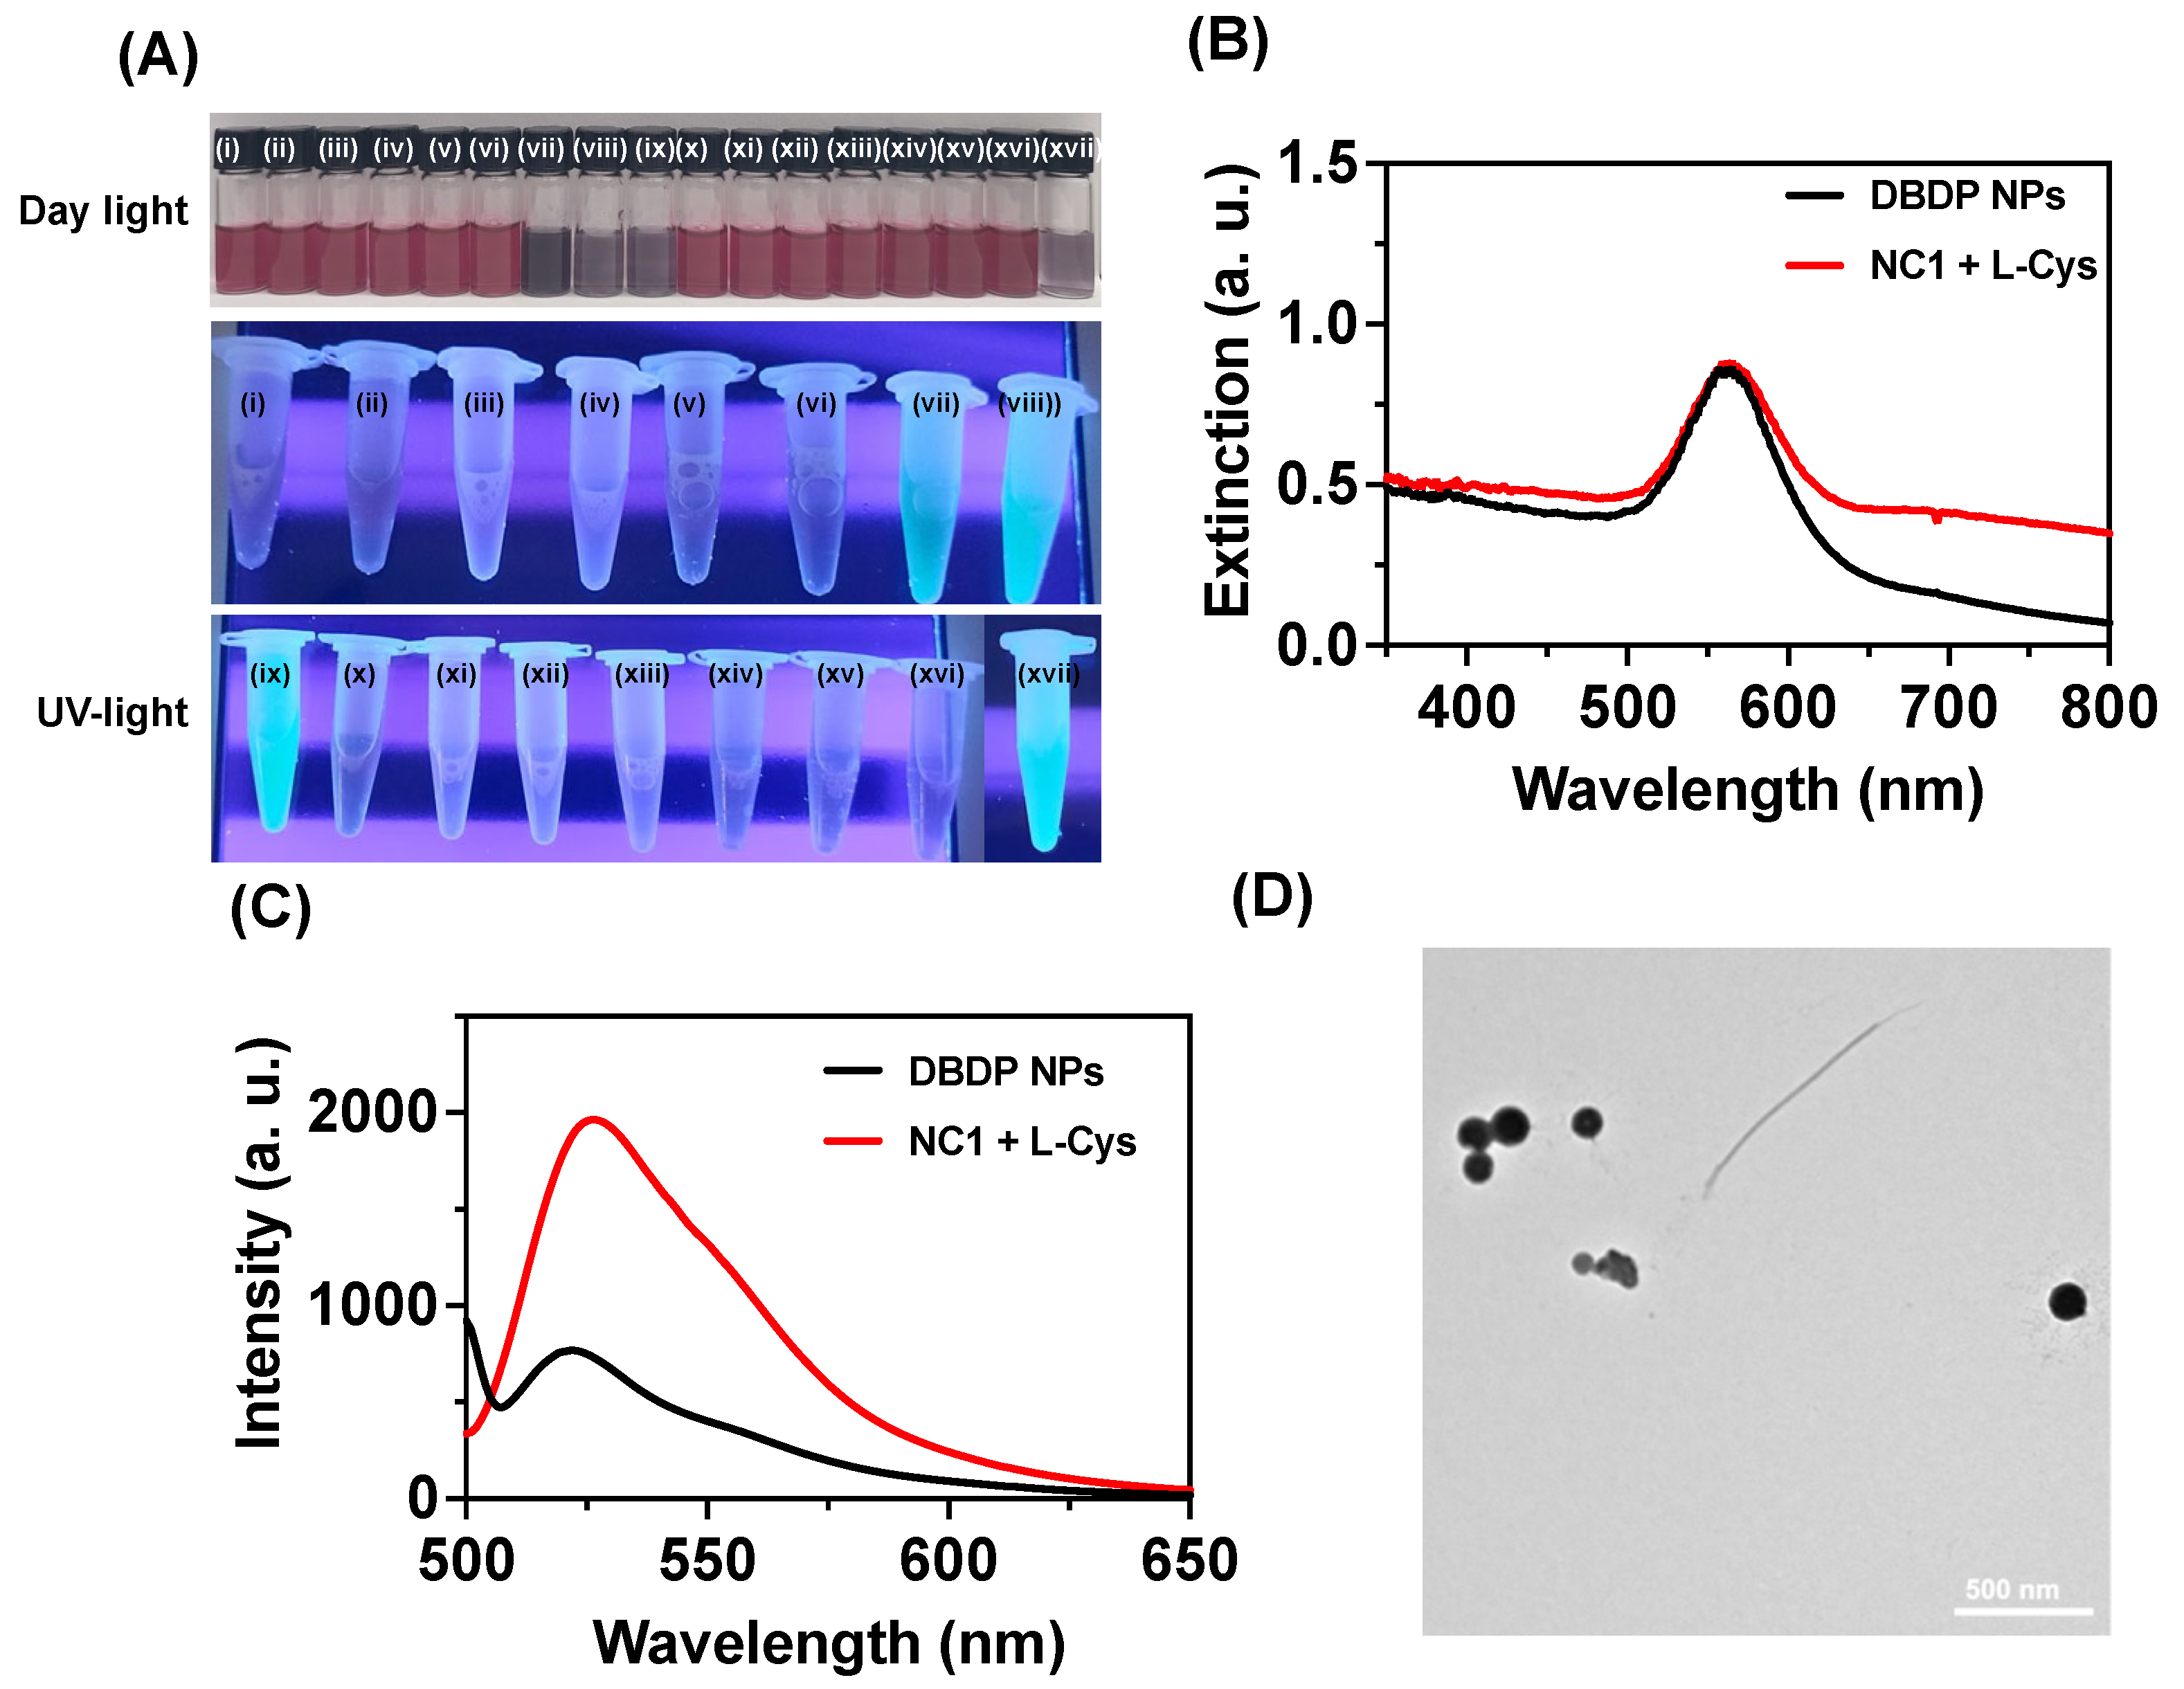
NC1 with biothiols was further supported by the observed visual color changes and the response under UV light. As shown in
Figure 3A, adding biothiols resulted in a color change from pale purple to brown in daylight, and under UV light these solutions showed green fluorescence. Among the biothiols, the changes were more prominent for Cys compared to Hcy and GSH, due to the difference in their acidity of thiol groups and steric effect from the peptide backbones [
21]. By adding L-Cys, the absorption spectra for
NC1 showed a new absorption peak at 570 nm with a higher wavelength band at 850 nm (
Figure 2A). To confirm the origin of this new band at 570 nm, we have studied the aggregation property of DBDP in acetone: water (1:9), and the optical spectra for DBDP NPs showed an absorption peak at 575 nm (
Figure 3C). Thus, with the addition of Cys, the new band at 570 nm is due to the aggregates or nanoparticle formation of DBDP. Transmission electron microscopy studies showed that DBDP NPs possess an average size of 135 ± 5.6 nm. The emission spectra obtained after biothiol addition showed similar emission characteristics as that of DBDP NPs, indicating biothiols induce displacement of DBDP, thereby making the DBDP molecule water insoluble and inducing aggregation-induced emission in the NPs (
Figure 3D).
Next, we studied the selectivity of
NC1 with thiols using various L-amino acids and sulfide-containing molecules. As shown in
Figure S4A-B, the other amino acids such as glycine (Gly), valine (Val), leucine (Leu), lysine (Lys), cystine (Cyst), histidine (His), aspartic acid (Asp), glutamic acid (Glu), tryptophan (Trp), threonine (Thr), alanine (Ala), methionine (Met) and proline (Pro) did not induce any changes in the absorption or emission spectra of
NC1. Sulfide ions changed the optical spectrum of
NC1 but with a lower magnitude than biothiols (
Figure S4A-B). A mixture of
NC1 with Cys, HCy, GSH, and S2- in acetate buffer showed similar changes in the spectrum, and the observed enhancement in the fluorescence from a solution of these mixtures was like that of
NC1 with Cys, indicating a higher selectivity for Cys than other bithiols and sulfide containing species (
Figure S4C-D). The detection limit for biothiols with
NC1 was calculated using their optical spectroscopic data. A linear correlation was obtained for the various concentrations of biothiols tested (10 nM to 3 M) (
Figure S5A-C). The nanocomposite
NC1 showed a detection limit of 3.2 nM for Cys with a detectable visual response under UV light. Whereas
NC1 showed a detection limit of 55.2 nM for Hcy and 37.5 nM for GSH respectively. The formation of nanoaggregates, and the observed optical response of biothiols with
NC1 were further tested using fluorescence microscopic images. The appearance of fluorescence from the aggregates of
NC1 after the addition of various biothiols supports the IDA-based approach and detection of biothiols using
NC1 (
Figure S6).
3.3. Biothiol Detection under Physiological Conditions
It is important to find the utility of our designed nanocomposite
NC1 for the detection of biothiols under biological conditions. To investigate this, we have studied the interaction of
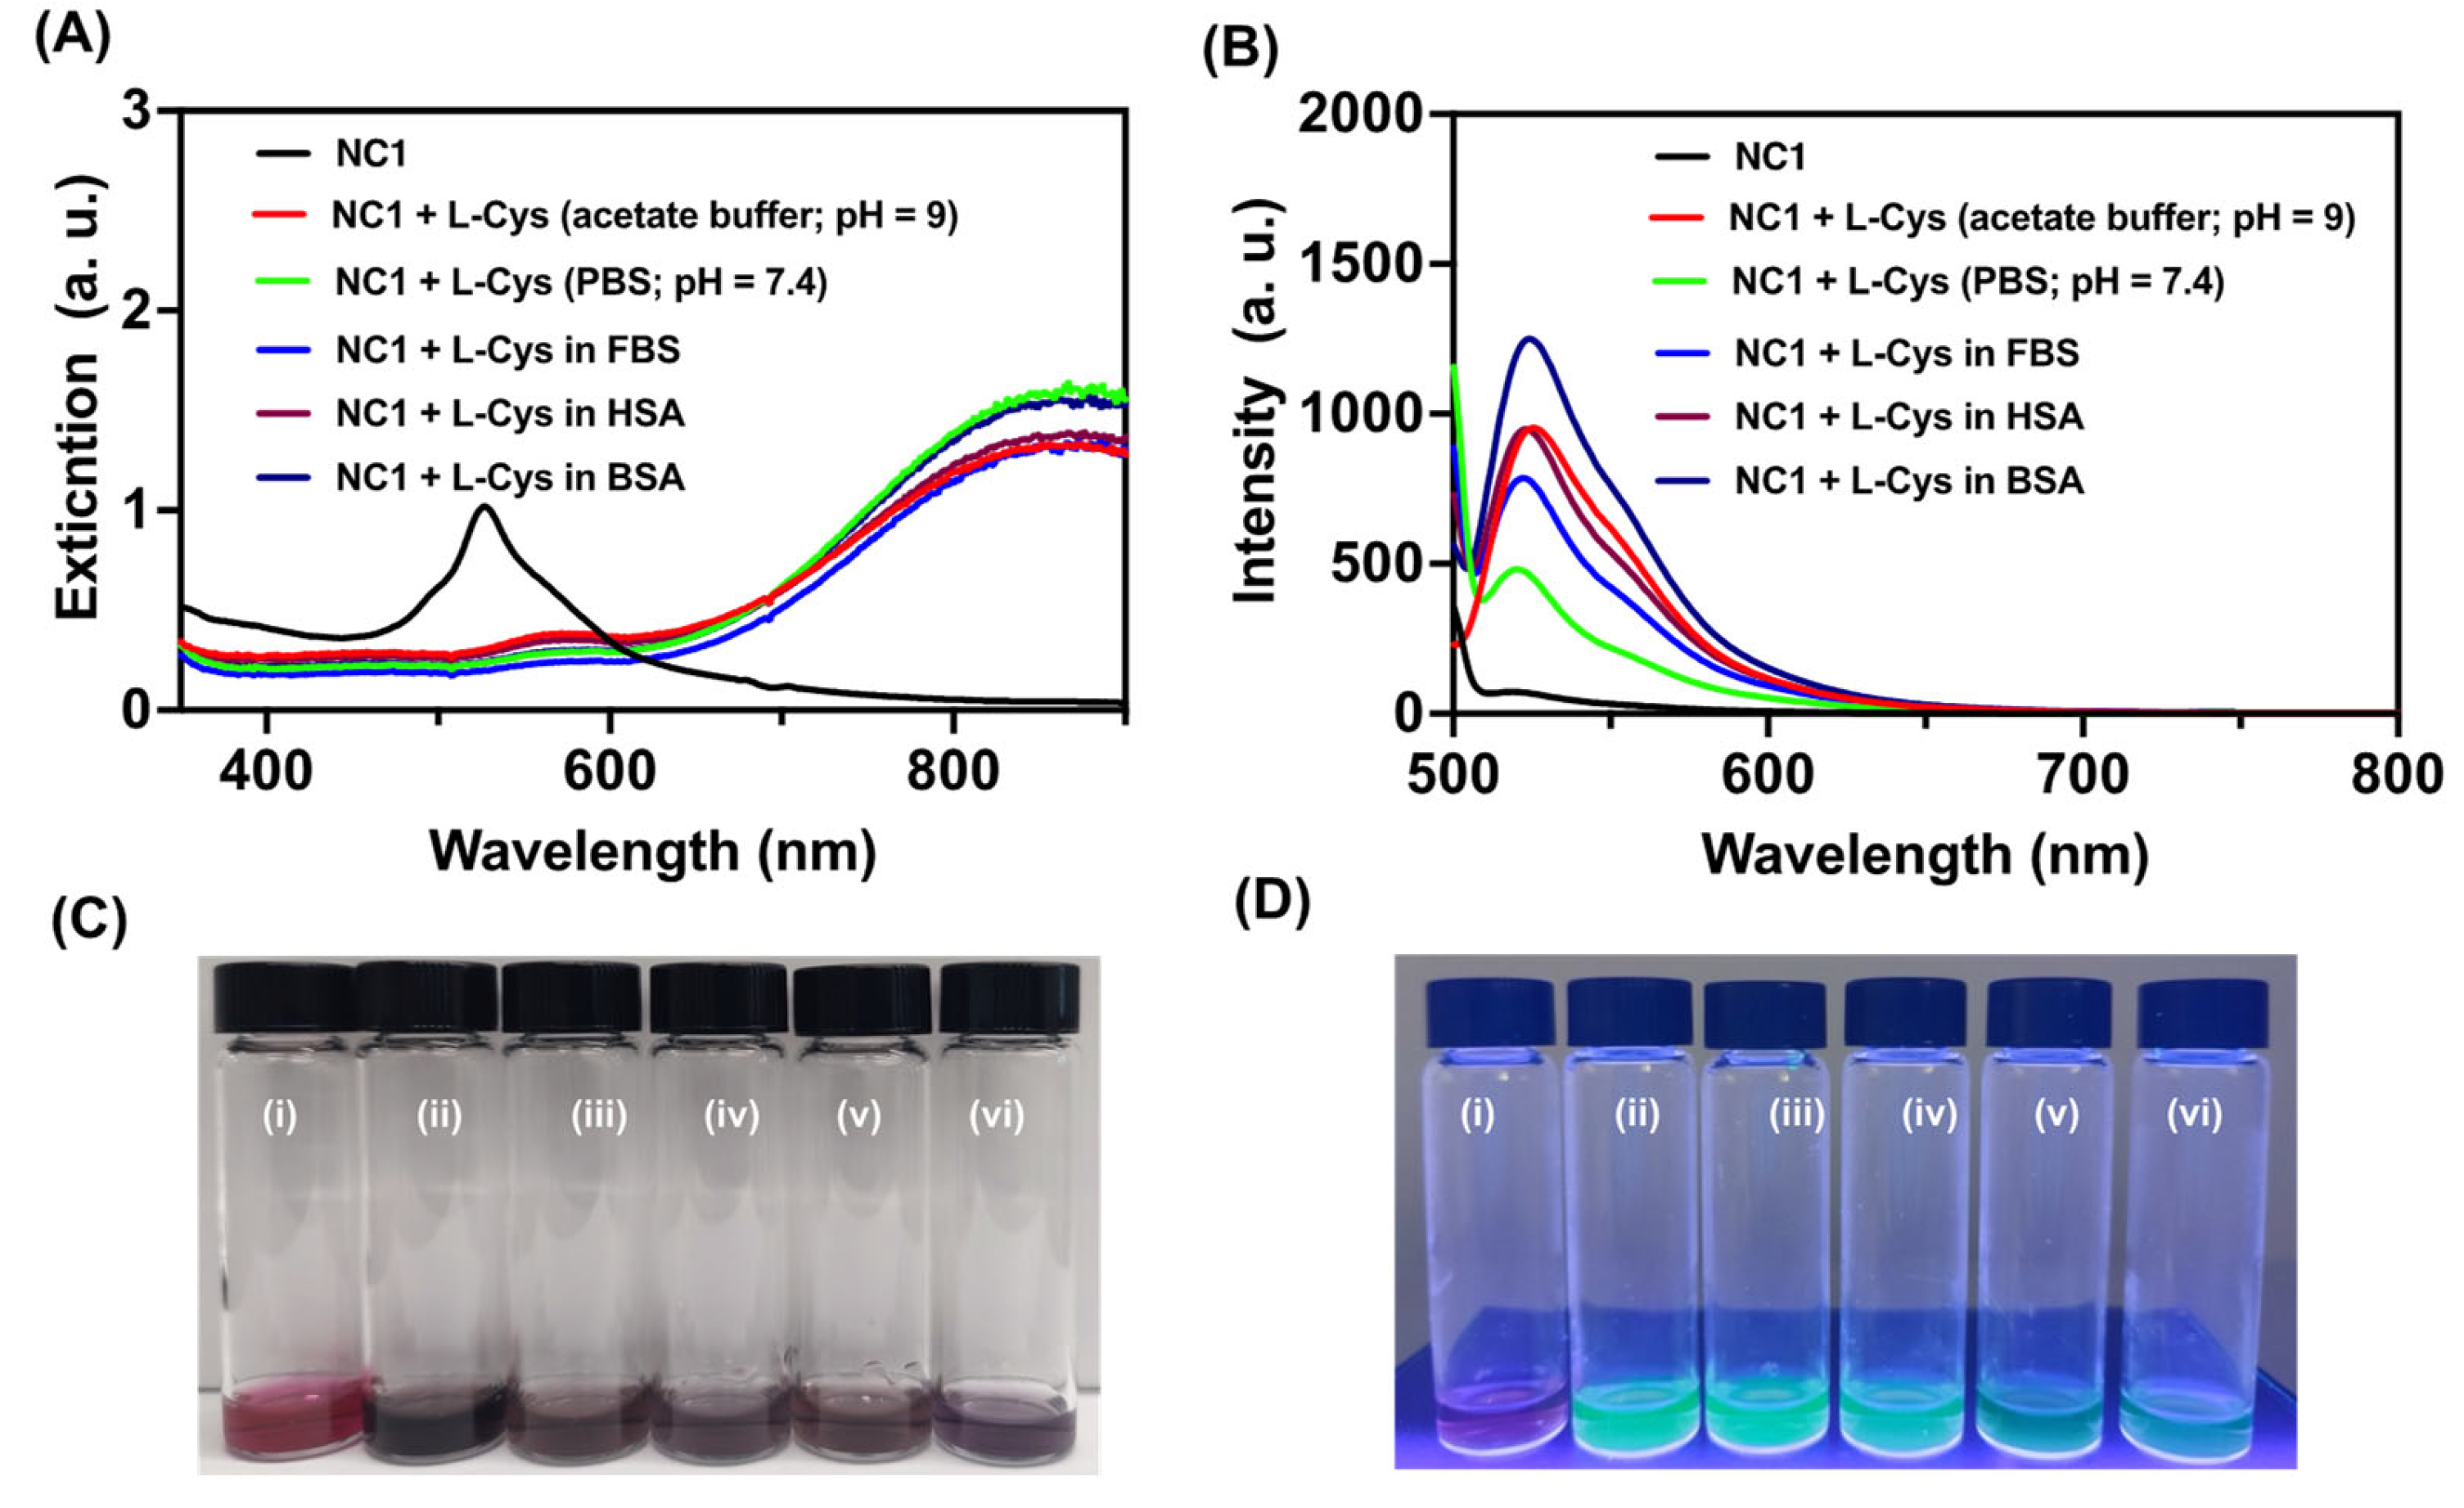
NC1 with biothiols under physiological conditions using phosphate-buffered saline (PBS) at pH 7.4, both alone and in the presence of several biomolecules. It was observed the absorption and emission spectra changes of
NC1 upon the addition of biothiols in PBS were consistent with those observed in acetate buffer at pH 9 (
Figure 4A-B). Titrations of
NC1 with biothiols in fetal bovine serum (FBS), as well as in the presence of human serum and bovine serum albumin, HSA and BSA) demonstrated that the fluorescence response of
NC1 with biothiols under these conditions matched the response seen in the acetate buffer (
Figure 4B). Under all these tested biological conditions,
NC1 showed a visual response similar to that observed in acetate buffer, indicating the effectiveness of our system in detecting biothiols under physiological conditions, even in the presence of potentially interfering biomolecules (
Figure 4C-D).
3.4. SERS-Based Detection of Biothiols
Next, we investigated the detection of biothiols using Raman spectroscopy analysis which shows high sensitivity for the analyte detection. Raman spectra show high selectivity in terms of the characteristic Raman peaks, which is a fingerprint for a particular molecule [
22,
23]. Using plasmonic nanomaterials the Raman response for various analytes can be enhanced by the so-called Surface-Enhanced Ramana Spectroscopy (SERS) principle [
24,
25,
26]. For SERS, the plasmonic nanomaterials should show enhanced electromagnetic fields at the interaction point with the analytes, called hot spots [
27,
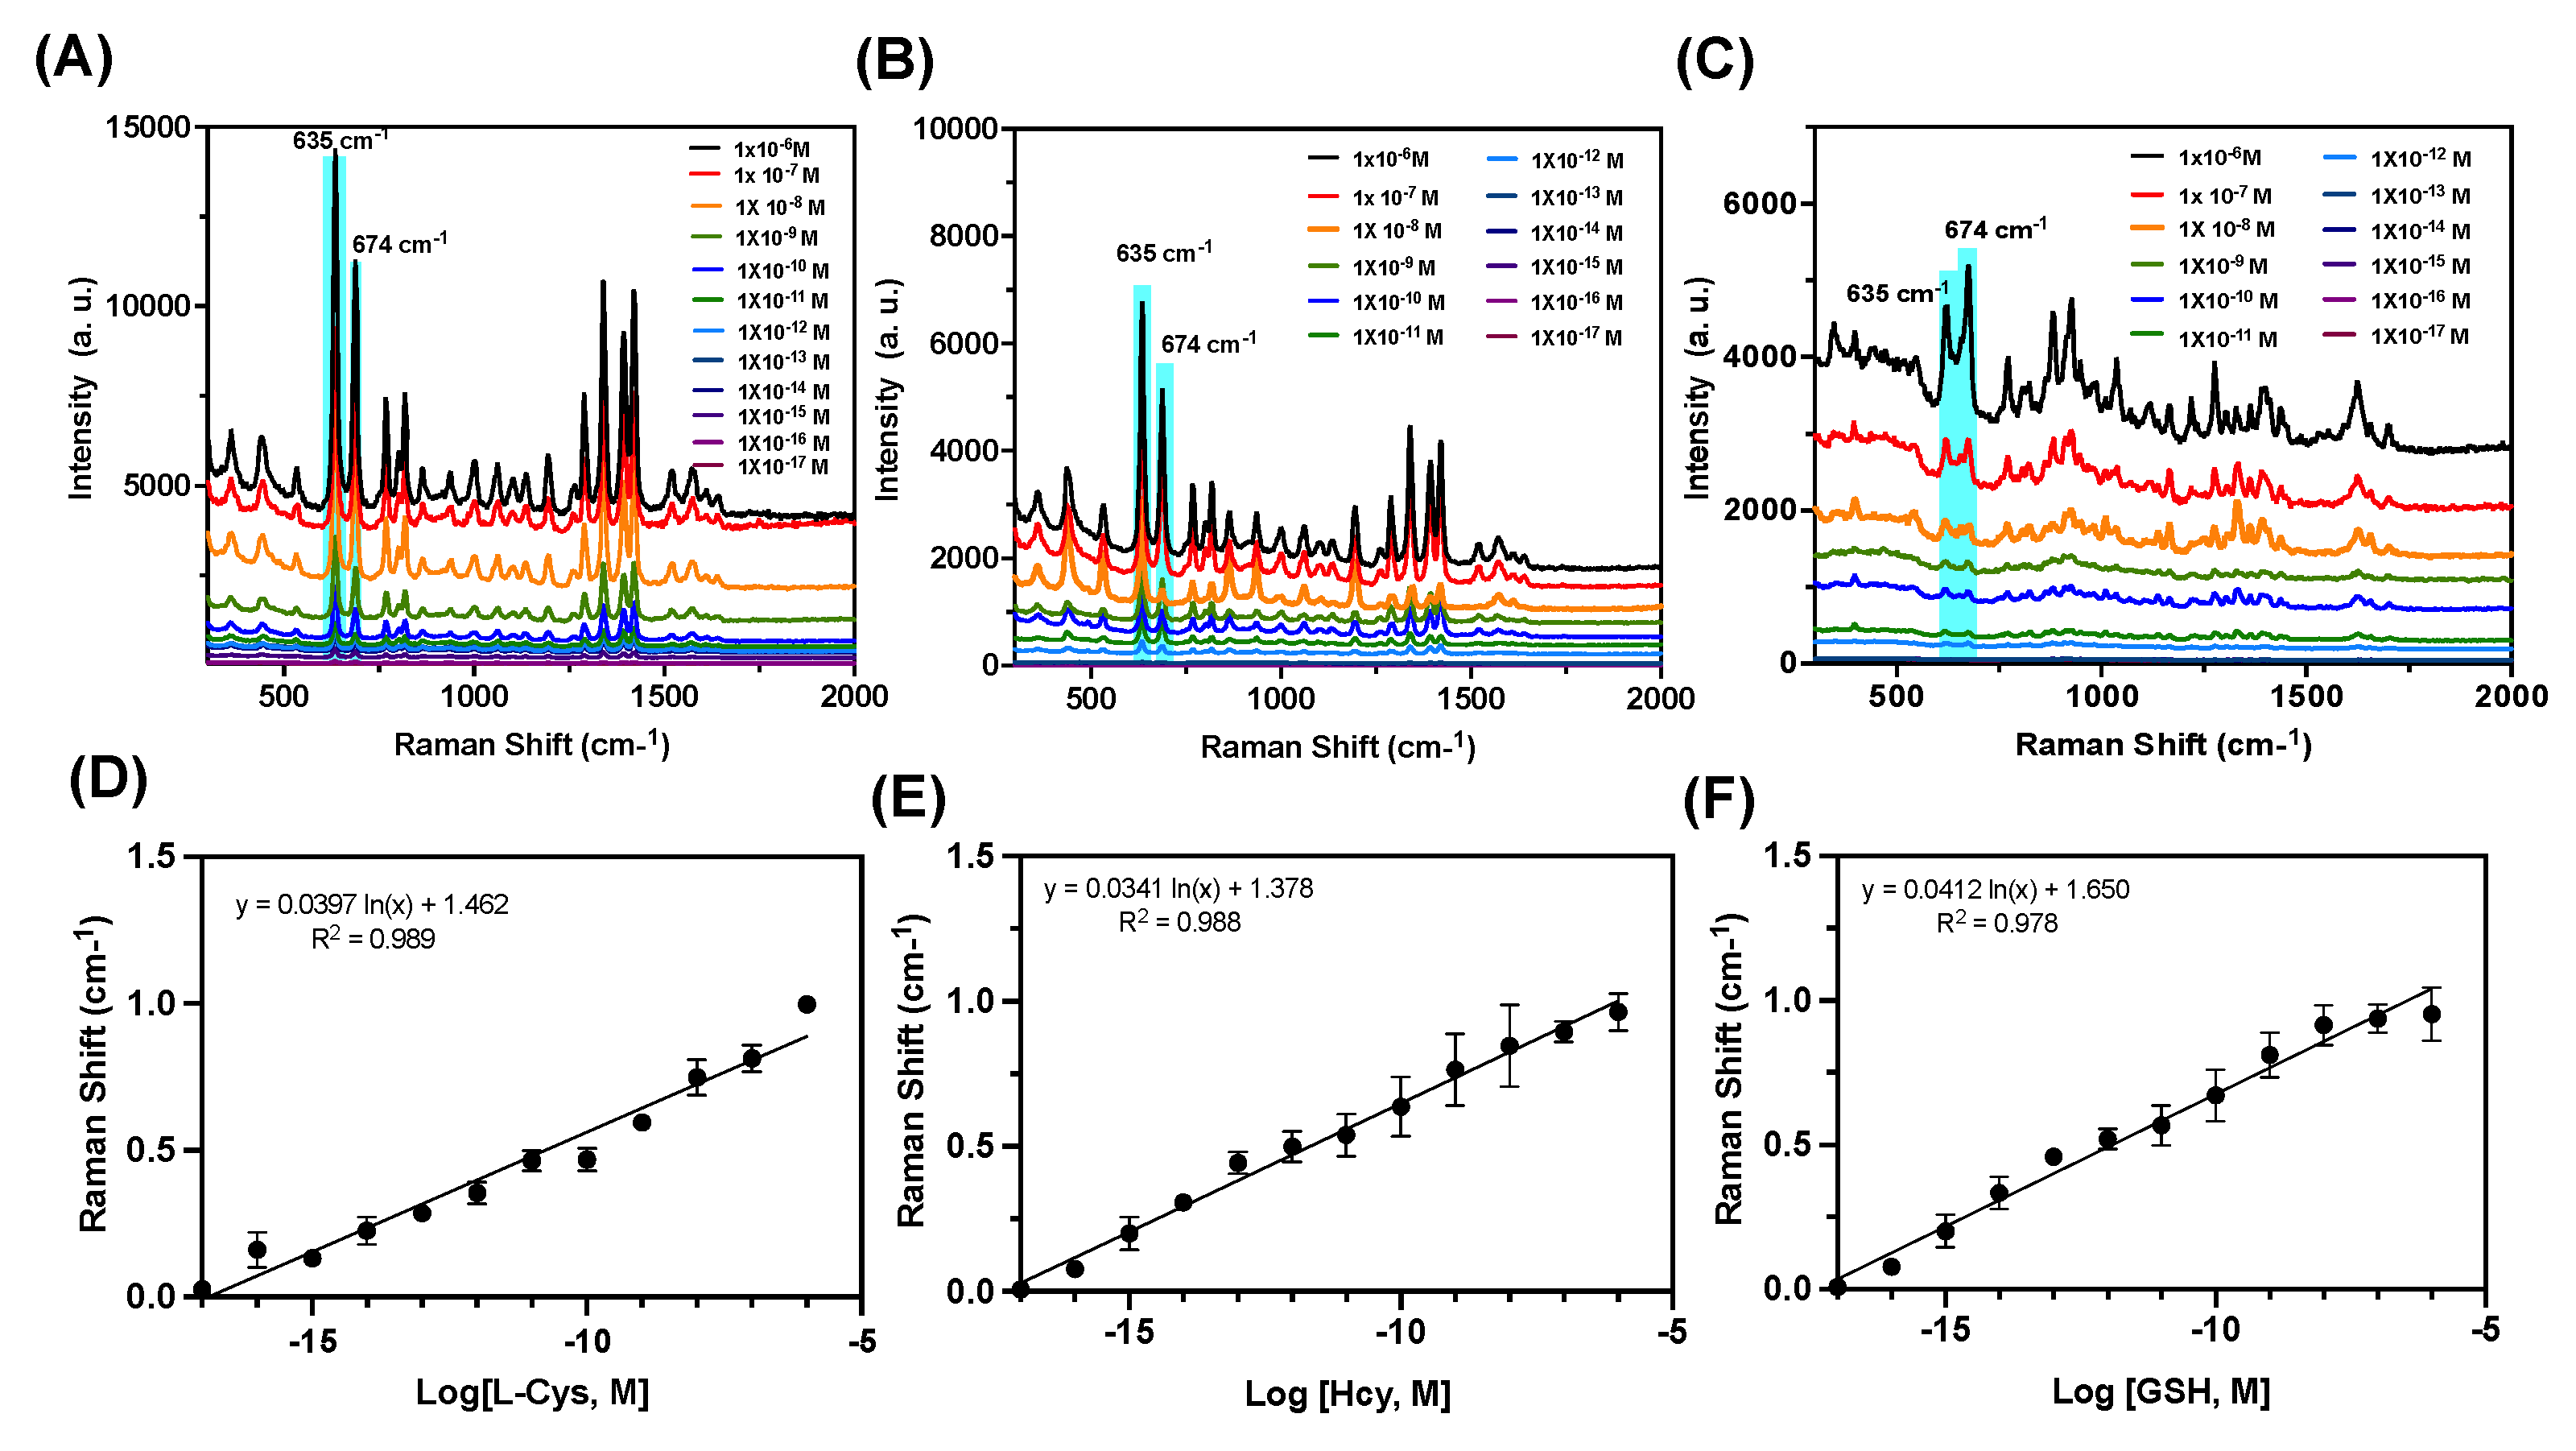
28]. The molecules which are trapped in these hot spots show a higher enhancement in the Raman signals. Interaction of biothiols with AuNPs resulted in the displacement of DBDP dye along with aggregation of AuNPs as confirmed by the TEM studies. Since thiols show strong affinity towards Au, after aggregation the thiol molecules can get trapped in the hot spots in AuNPs, thereby enhancing their Raman signal intensity which allows detection for a single molecular level. After the interaction with biothiols, the solutions of NPs with analyte were centrifuged, and the precipitated NPs were analyzed using Raman spectroscopy, in both solutions and Raman mapping studies for the dry samples. The characteristic Raman peak intensity for various biothiols was monitored as a function of the concentration of the biothiols. As shown in
Figure 5A-B, the NPs with Cys displacement showed Raman peaks at 635 and 674 cm
-1, corresponding to the -CH
2-S- bands in Cysteine [
29,
30]. As the concentration of Cys increased the peak intensity at 674 cm
-1 was enhanced indicating the formation of more hot spots in the aggregate. A linear correlation was observed with the concentration of Cys added to
NC1, with the peak intensity at 674 cm
-1 (
Figure 5B). SERS-based analysis showed a detection limit of femtomolar (10
-15 M) for Cys, showing a higher sensitivity than optical spectroscopic-based techniques (
Figure 5A-B). Similarly, for Hcy and GSH, the characteristic Raman peak at 674 cm
-1 (-CH
2-S- bond) was confirmed, and the SERS-based assay showed linearity with the concentrations and peak intensity at 674 cm
-1 (
Figure 5C-F) [
31]. The detection limit for Hcy and GSH showed a sensitivity up to picomolar (10
-12 M), much higher than the optical spectroscopy-based detection. Thus, the SERS-based assay further validated the detection of biothiols using our nanocomposite
NC1. The higher signal intensity and sharp Raman peaks for Cysteine indicate a higher degree of aggregation and hot-spot formation than GSH and Hcy with
NC1.
3.5. Raman Mapping-Based Detection of Biothiols
Raman mapping offers a powerful approach for the label-free and non-destructive detection of various analytes in complex systems. By exploiting the characteristic vibrational fingerprints of biothiols, Raman mapping can enable precise spatial localization and quantification of these molecules with high sensitivity and specificity. We have investigated the SERS-based Raman mapping of biothiols from our nanocomposite
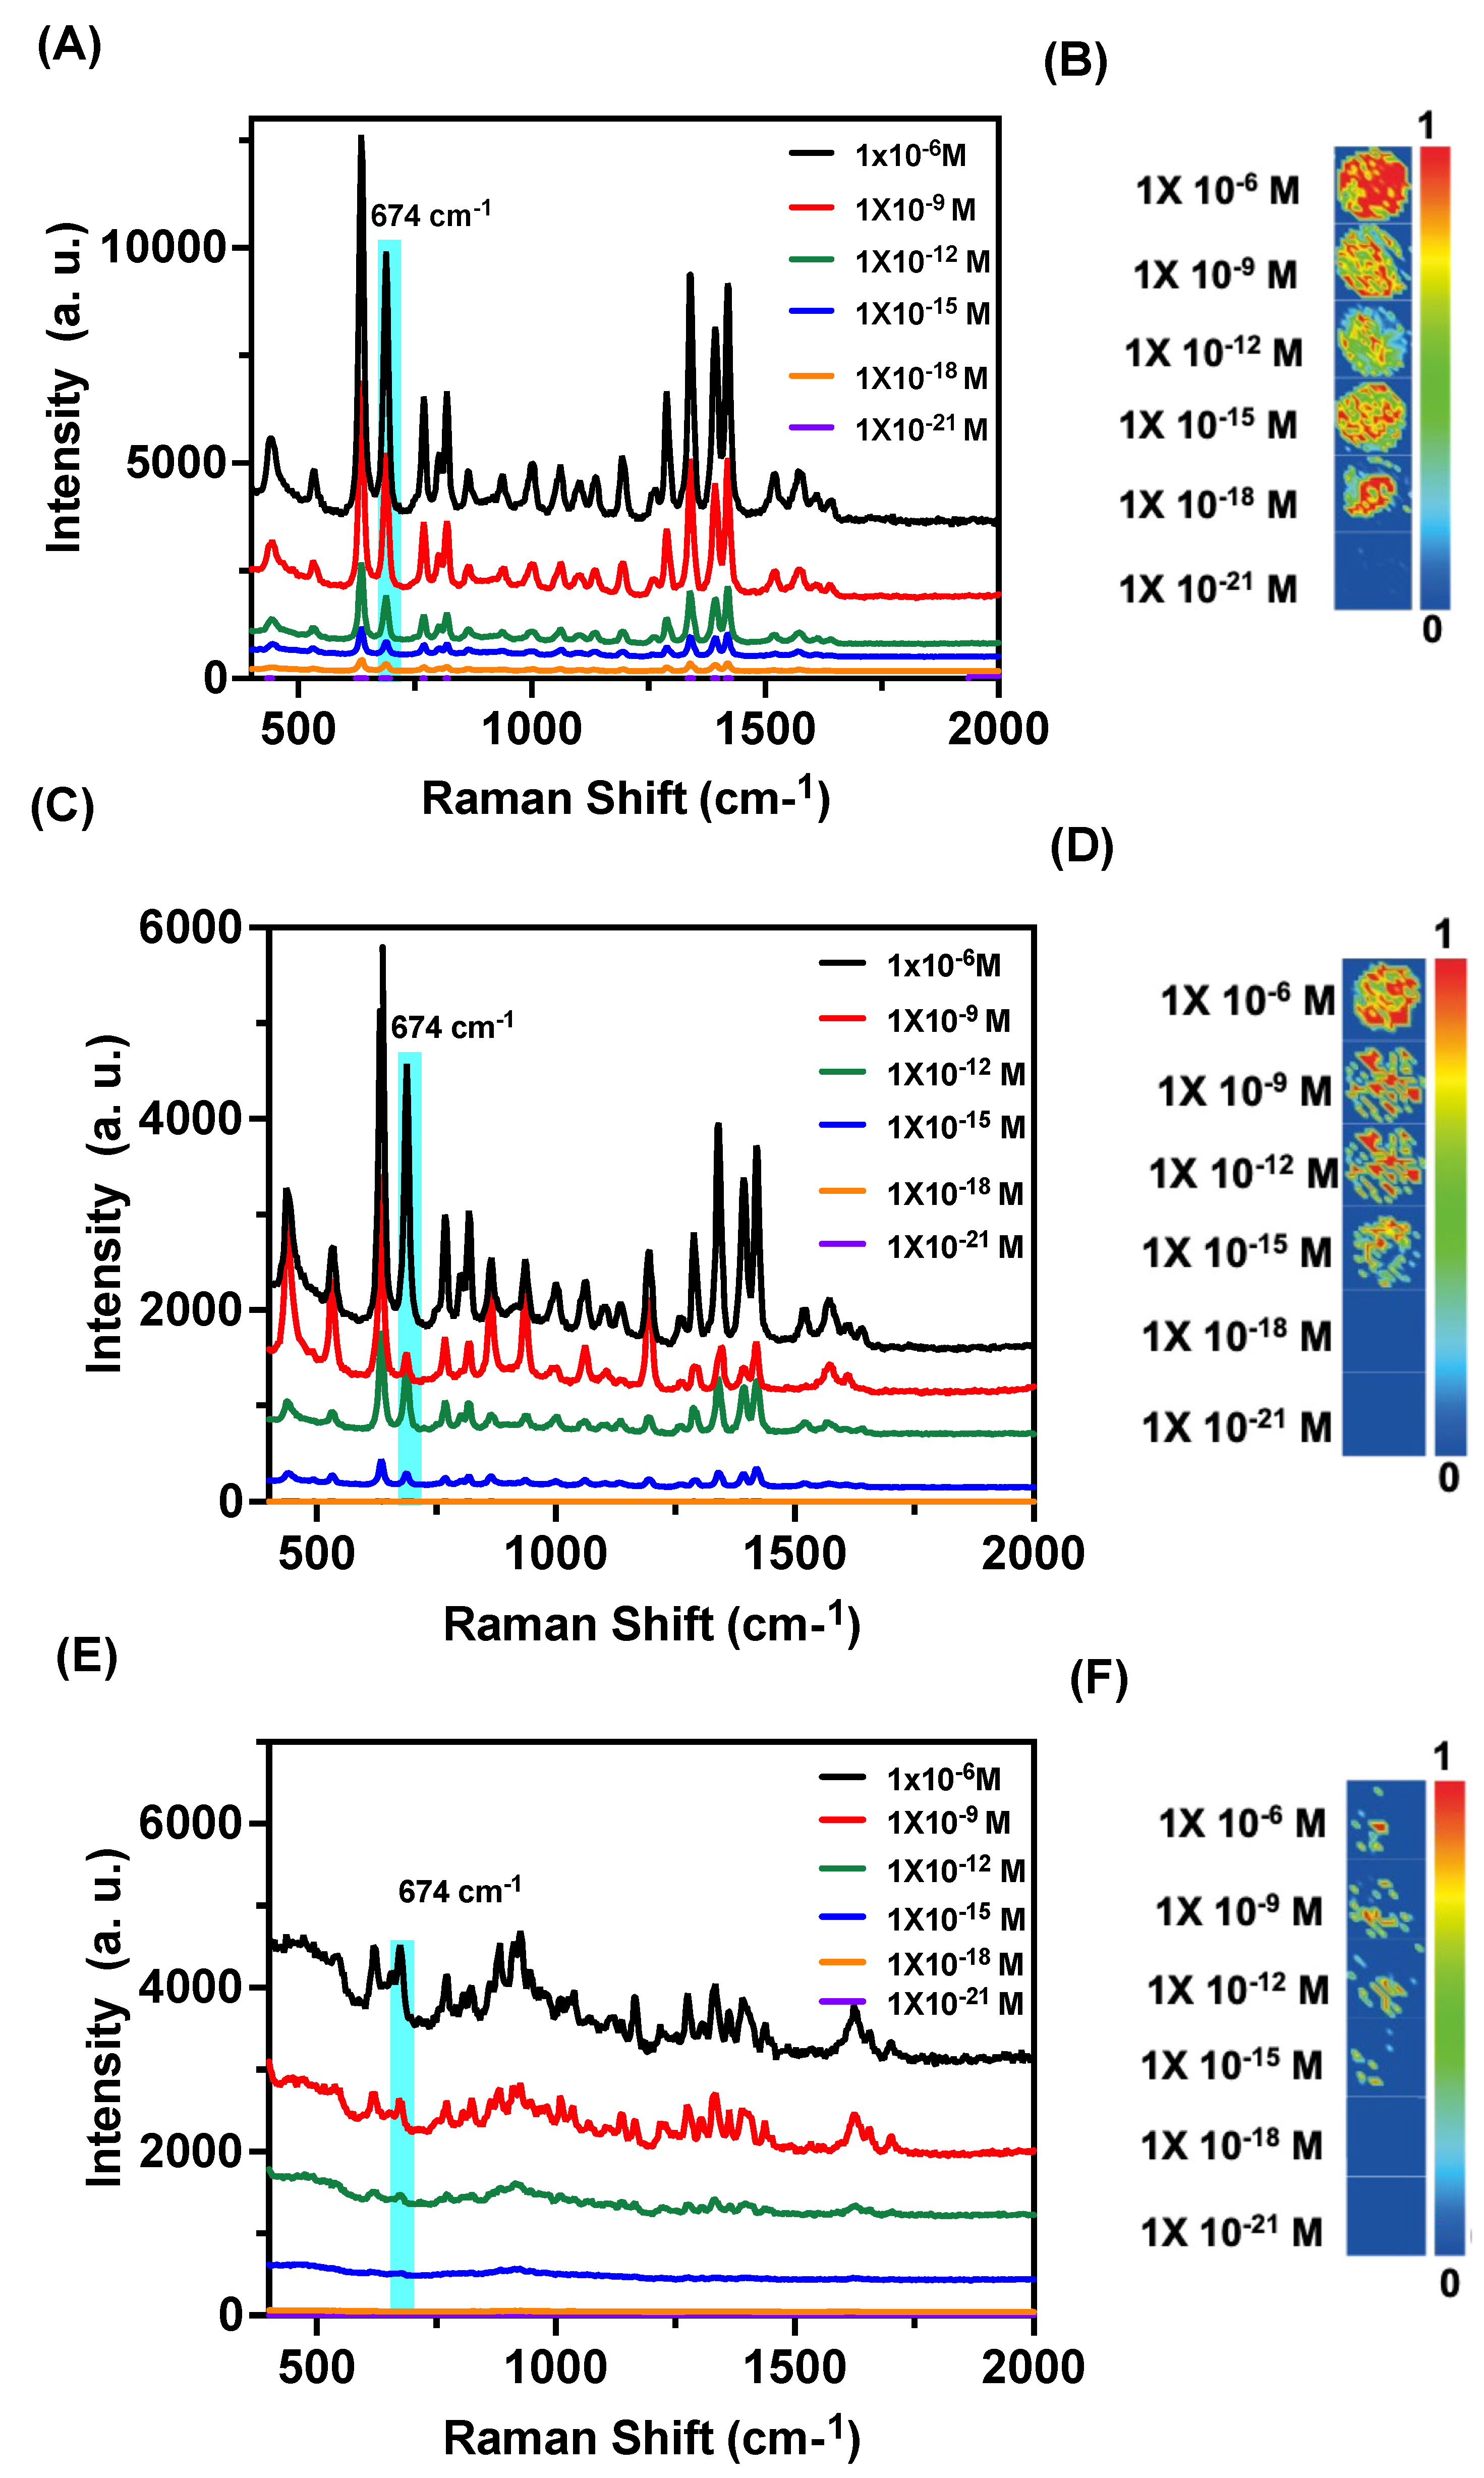
NC1. The biothiol-AuNPs after DBDP exchange were collected and drop-casted on a glass slide and allowed to dry. These dried spots were analyzed using Raman spectroscopy and the characteristic Raman peak at 674 cm
-1 was analyzed using mapping studies. As shown in Figure
6A-B, the Raman mapping analysis showed bright spots for a lower concentration up to 10
-18 M, for L-Cys indicating a single molecule detection for L-Cys. Similarly, for Hcy, and GSH, Raman mapping studies for the peak at 674 cm
-1 showed a detection limit of femtomolar (10
-15 M) allowing a high sensitivity in detection (
Figure 6C-F). The enhanced signal intensity can be correlated with the enhanced electromagnetic field generated in the dry state for the enhanced SERS response for the adsorbed materials on AuNPs. Because of IDA, the aggregation becomes more prominent because of various thermodynamic effects.
3.6. Cellular Imaging Studies
As part of the investigation, we next studied the use of our developed system for the detection of bitohiols in cancer cells. Since cancer cells show overexpressed cysteine content, our developed nanocomposite
NC1, can detect Cysteine in the cellular conditions [
32]. For this, we have checked the biocompatibility of
NC1 with L929 cell lines. It was shown that
NC1 is not cytotoxic up to 200 g/ml (
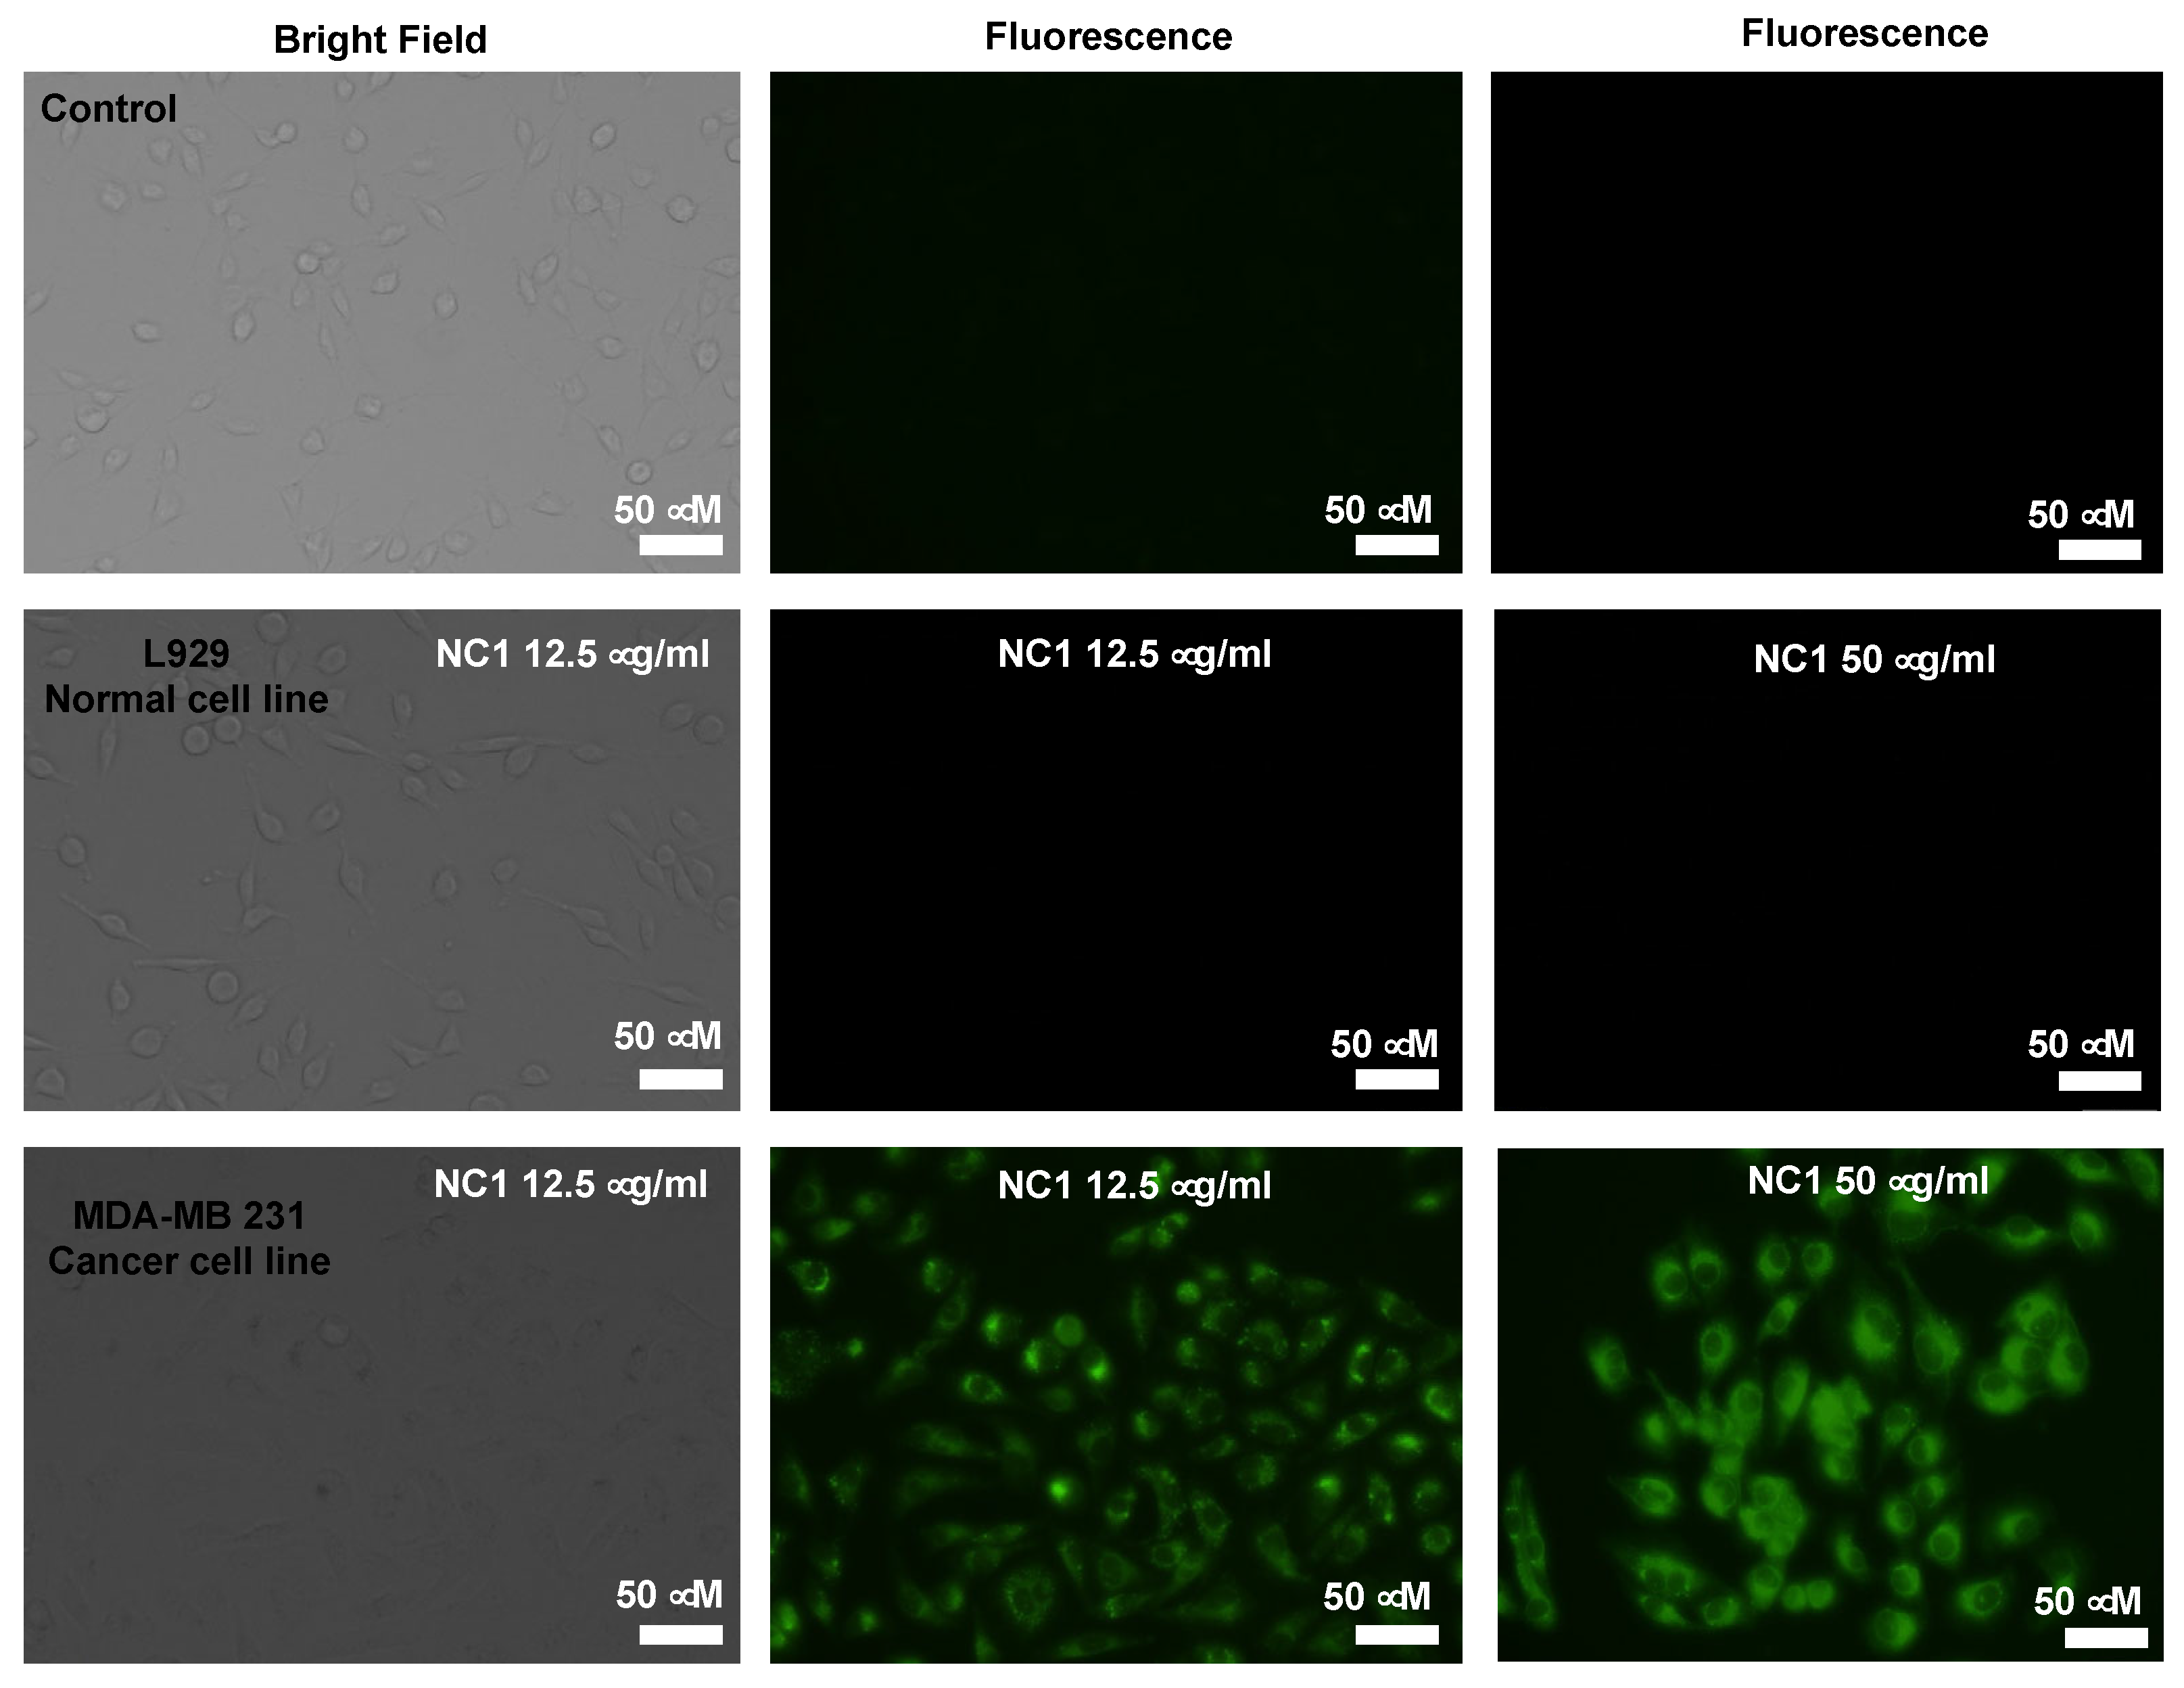
Figure S7). Next, we treated 12.5 and 50 g/ml of
NC1 with normal cell lines L929 and MDA-MB 231 cancer cell lines and imaged them using fluorescence microscopy. As shown in
Figure 7, the cancer cells showed green fluorescence as compared to the normal cells. As expected, owing to higher biothiol concentrations in cancer cells the IDA principle allowed DBDP NPs to displace from AuNPs and allowed enhanced cellular imaging. AuNPs act as carriers for the transport of DBDP dye and improve its water solubility for bioapplications. Thus, our developed system can differentiate cancer cells from normal cells.
3.7. Test Strips from NC1 for Biothiol Detection
Our goal was to explore the potential of casting the nanocomposite onto a solid support to enhance its practical applicability. To this end, we prepared test-paper strips of
NC1 by dip-coating Whatman filter papers with an aqueous solution of the nanocomposite. A solution of 150 μg of
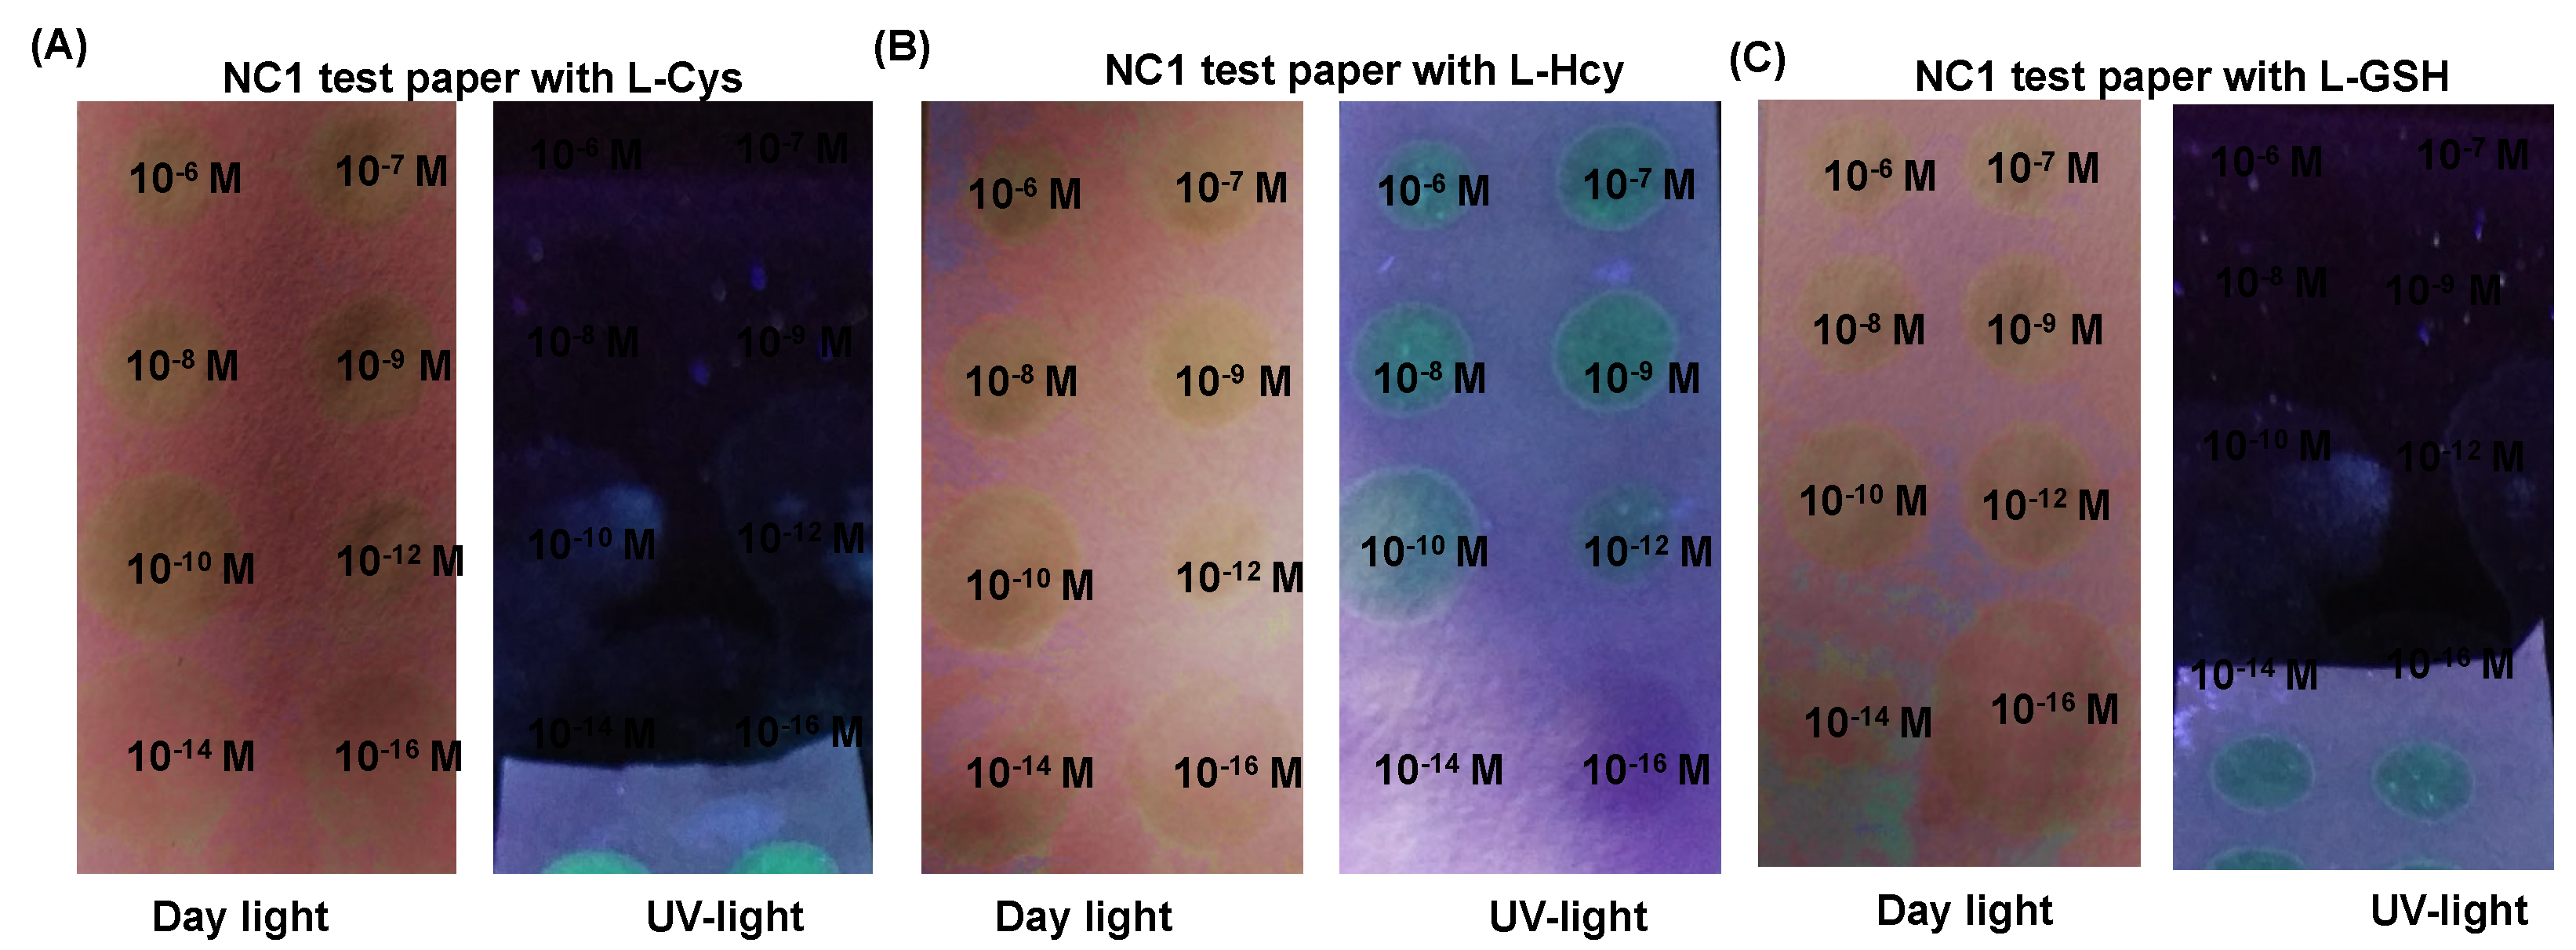
NC1 in 3 mL of water was prepared and the test strips were dipped into the solution for an hour. Afterward, the test strips were dried in an oven before use. Owing to the strong color of the nanocomposite from DBDY dye and AuNPs, the developed test strips showed a pale red color. Upon adding L-Cys, L-Hcy, and L-GSH to these strips, we observed an immediate color shift from pale red to pale yellow under ambient light. Interestingly, the test strips which were non-fluorescent showed a bright bluish-green fluorescence when exposed to UV light. This notable sensitivity allowed the test paper strips to detect biothiols across a broad concentration spectrum, ranging from molar to nanomolar levels. Such a wide detection range indicates the efficacy of the nanocomposite test strips in identifying biothiols, suggesting their potential utility in various practical applications where rapid and sensitive detection is crucial (
Figure 8A-C).
4. Discussion
The study presents a simple and easy way to detect biothiols with high accuracy and sensitivity using the displacement of DBDP dye from nanocomposite NC1. The nanocomposite is prepared in a one-step procedure, using Au (III) reduction followed by adsorption of DBDP dye on the surface of AuNPs. NC1 showed a brown-orange color which on interaction with biothiols showed a dark brown color. Even though biothiols play a key role in biological reactions, their elevated levels can induce certain diseases as well as they act as a key biomarker for tumors. Thus detection, and quantification of biothiols is important.
The formation of NC1 was confirmed by various optical spectroscopic, and microscopic studies. The nanocomposites were found to be stable for one month as confirmed by the changes in particle size. Owing to the surface plasmon resonance of AuNPs, and the aggregation-induced color changes of DBDP dye, the resultant NC1 showed a clear drastic orange-brown color, which can be easily used as a marker for biothiol detection owing to the rapid color change to dark brown. Moreover, under UV light addition of biothiols induced a green fluorescence from displaced DBDP dye. The nanocomposite NC1 can be coated with Whatman filter papers, and the resultant pale brown colored paper strips can be used for the on-site identification of biothiols. Thus, NC1-coated filter papers can be used as an indicator for biothiols from the visual color changes, and with the aid of proper modifications and supporting materials, NC1 can be used as an indicator material for biothiols with varying concentrations.
The detection of biothiols was not only performed using colorimetric changes from NC1 and DBDP dye but was validated using various optical spectroscopic techniques. The designed IDA platform offered a sensitive detection up to nanomolar concentrations with high reproducibility. Sensitivity in the detection of biothiols was further validated under biological conditions, and the fluorescence from DBDP dye, after displacement from AuNPs was monitored as a measure for the detection of biothiols.
Lastly, along with IDA, the detection of biothiols was performed using a more sensitive technique like Raman Spectroscopy. Since Raman spectra offer a fingerprint for the identification of various analytes, the nanoaggregates from AuNPs after IDA, were analyzed. Both solution and solid-state Raman analysis for biothiols offered a high sensitivity up to femtomolar for GSH and Hcy, whereas an attomolar sensitivity for L-Cys.
The developed nanocomposite materials displace DBDP dye from the AuNPs and give a turn-on fluorescence for DBDP NPs, we studied the application of NC1 for bioimaging applications. Since cancer cells possess an elevated level of biothiols, especially cysteine, the IDA approach can be used for differentiating cancer and normal cells. NC1 showed strong fluorescence in the cancer cells (MDA-MB 231) for the tested concentrations, whereas for normal cell line L929, there was no fluorescence at the same concentrations of NC1. Moreover, we prepared test strips from NC1 for the detection of biothiols for on-site applications. The visual colorimetric response from the test strips allowed the detection of biothiols with a concentration from micromolar to nanomolar.
The combination of the indicator displacement approach (IDA) and surface-enhanced Raman scattering (SERS) presents a promising strategy for the sensitive and selective detection of biothiols. For the enhanced sensitivity and selectivity, development of new nanostructured materials with optimized surface properties and indicator dye molecules are important. For enhancing the SERS signals, exploring different metals, such as silver or gold, and various nanostructures like nanostars, nanoflowers, or core-shell nanoparticles can be performed. Customized indicators with higher binding affinities and selectivity for biothiols can be studied. Molecular modeling and computational chemistry could assist in predicting and optimizing these interactions. Expand the system to simultaneously detect multiple biothiols by using a combination of different indicators, each specific to a particular biothiol, along with distinct SERS-active nanomaterials. This could be facilitated by spectral separation in the SERS readout. Implement ratiometric approaches where the relative intensities of different SERS peaks provide a quantitative measure of multiple biothiols in a single assay.
Developing systems capable of real-time monitoring of biothiol concentrations in biological samples can be a future goal. This would require advances in the stability and reproducibility of the SERS substrates and the displacement indicator dye molecules. Explore biocompatible SERS substrates and indicators that can be safely used for in vivo applications. This could involve creating nanoparticles that can circulate in the bloodstream and target specific tissues or cells. Combine SERS-based IDA with microfluidic platforms to create portable, point-of-care devices for rapid and on-site biothiol detection. This would enhance the practicality and accessibility of this technique in clinical and field settings.
5. Conclusions
In summary, we have designed a nanocomposite NC1 from AuNPs and BODIPY dye for the detection of biothiols using various detection platforms. The incorporation of BODIPY dye to the AuNPs allowed the detection of biothiols using an indicator displacement approach via turn-on fluorescence from the nanocomposite. This method allowed a visual colorimetric response under daylight and a clear fluorescence response under UV light. This method allows a simple and easy detection platform for biothiols. The investigation was further extended using Raman spectroscopy, and which allowed detection of Cysteine up to femtomolar detection with high sensitivity in the solution state. Whereas a single molecule detection upto 10-18 M was achieved for the dried samples of AuNPs with L-Cysteine after the displacement of DBDP dye. Moreover, the IDA-based strategy is applied to distinguish cancer and normal cells, using the turn-on fluorescence from the dye. The present study opens design strategies for the multimode detection of various analytes or biothiols with high sensitivity and accuracy. The work can be further extended in the future for the in vivo applications and detection of tumors using Raman spectroscopy. Owing to the photosensitization and surface functionalization properties of AuNPs, these nanomaterials can be used for therapeutical applications.
Supplementary Materials
The following supporting information can be downloaded at the website of this paper posted on Preprints.org.
Author Contributions
Conceptualization, methodology, and experiments were performed by PK. Writing original draft preparation, review, and editing was done by PK.
Funding
KU-KIST Graduate School of Converging Science and Technology, Korea University, and the BK21 fellowship program.
Acknowledgments
PK shows sincere gratitude to Prof. Dong-Kwon Lim, KUKIST, S. Korea, for allowing a short visit to Dr. Prakash P. Neelakandan, and his research group at INST, Mohali, India, as a part of the BK21 fellowship program. PK acknowledges Dr. Prakash P. Neelakandan, INST, Mohali, Punjab, India, for accepting the short-term visit to his lab and the help provided by him for the synthesis of DBDP dye. Acknowledge the instrumentation facilities in KUKIST and INST Mohali for this work.
Conflicts of Interest
Declare conflicts of interest or state
References
- Smeyne, M.; Smeyne, R.J. Glutathione Metabolism and Parkinson’s Disease. Free. Radic. Biol. Med. 2013, 62, 13–25. [Google Scholar] [CrossRef]
- Hand, C.E.; Honek, J.F. Biological Chemistry of Naturally Occurring Thiols of Microbial and Marine Origin. J. Nat. Prod. 2005, 68, 293–308. [Google Scholar] [CrossRef] [PubMed]
- McBean, G.J.; Aslan, M.; Griffiths, H.R.; Torrão, R.C. Thiol Redox Homeostasis in Neurodegenerative Disease. Redox Biol. 2015, 5, 186–194. [Google Scholar] [CrossRef] [PubMed]
- Yang, X.; Guo, Y.; Strongin, R.M. Conjugate Addition/Cyclization Sequence Enables Selective and Simultaneous Fluorescence Detection of Cysteine and Homocysteine. Angew. Chem. Int. Ed. 2011, 50, 10690–10693. [Google Scholar] [CrossRef] [PubMed]
- Lin, W.; Long, L.; Yuan, L.; Cao, Z.; Chen, B.; Tan, W. A Ratiometric Fluorescent Probe for Cysteine and Homocysteine Displaying a Large Emission Shift. Org. Lett. 2008, 10, 5577–5580. [Google Scholar] [CrossRef] [PubMed]
- Özyürek, M.; Baki, S.; Güngör, N.; Çelik, S.E.; Güçlü, K.; Apak, R. Determination of Biothiols by a Novel On-Line HPLC-DTNB Assay with Post-Column Detection. Analytica. Chimica. Acta. 2012, 750, 173–181. [Google Scholar] [CrossRef]
- Vandeberg, P.J.; Johnson, D.C. Pulsed Electrochemical Detection of Cysteine, Cystine, Methionine, and Glutathione at Gold Electrodes Following Their Separation by Liquid Chromatography. Anal. Chem. 1993, 65, 2713–2718. [Google Scholar] [CrossRef]
- Praveen Kumar, P.P.; Kaur, N.; Shanavas, A.; Neelakandan, P.P. Nanomolar Detection of Biothiols via Turn-ON Fluorescent Indicator Displacement. Analyst 2020, 145, 851–857. [Google Scholar] [CrossRef] [PubMed]
- Qian, S.; Lin, H. A Colorimetric Indicator-Displacement Assay Array for Selective Detection and Identification of Biological Thiols. Anal. Bioanal. Chem. 2014, 406, 1903–1908. [Google Scholar] [CrossRef]
- Li, P.; Lee, S.M.; Kim, H.Y.; Kim, S.; Park, S.; Park, K.S.; Park, H.G. Colorimetric Detection of Individual Biothiols by Tailor Made Reactions with Silver Nanoprisms. Sci. Rep. 2021, 11, 3937. [Google Scholar] [CrossRef]
- Markina, M.; Stozhko, N.; Krylov, V.; Vidrevich, M.; Brainina, Kh. Nanoparticle-Based Paper Sensor for Thiols Evaluation in Human Skin. Talanta 2017, 165, 563–569. [Google Scholar] [CrossRef]
- Li, L.; Li, B. Sensitive and Selective Detection of Cysteine Using Gold Nanoparticles as Colorimetric Probes. Analyst 2009, 134, 1361. [Google Scholar] [CrossRef]
- Zhang, C.; Chen, S.; Jiang, Z.; Shi, Z.; Wang, J.; Du, L. Highly Sensitive and Reproducible SERS Substrates Based on Ordered Micropyramid Array and Silver Nanoparticles. ACS Appl. Mater. Interfaces 2021, 13, 29222–29229. [Google Scholar] [CrossRef]
- Langer, J.; Jimenez De Aberasturi, D.; Aizpurua, J.; Alvarez-Puebla, R.A.; Auguié, B.; Baumberg, J.J.; Bazan, G.C.; Bell, S.E.J.; Boisen, A.; Brolo, A.G.; et al. Present and Future of Surface-Enhanced Raman Scattering. ACS Nano 2020, 14, 28–117. [Google Scholar] [CrossRef] [PubMed]
- Tim, B.; Błaszkiewicz, P.; Kotkowiak, M. Recent Advances in Metallic Nanoparticle Assemblies for Surface-Enhanced Spectroscopy. Int. J. Mol. Sci. 2021, 23, 291. [Google Scholar] [CrossRef] [PubMed]
- Sun, X.; Kong, H.; Zhou, Q.; Tsunega, S.; Liu, X.; Yang, H.; Jin, R.-H. Chiral Plasmonic Nanoparticle Assisted Raman Enantioselective Recognition. Anal. Chem. 2020, 92, 8015–8020. [Google Scholar] [CrossRef] [PubMed]
- Kumar, P.P.P.; Kim, M.; Lim, D. Amino Acid-Modulated Chirality Evolution and Highly Enantioselective Chiral Nanogap-Enhanced Raman Scattering. Adv. Opt. Mater. 2023, 11, 2301503. [Google Scholar] [CrossRef]
- Kumar, P.P.P.; Yadav, P.; Shanavas, A.; Thurakkal, S.; Joseph, J.; Neelakandan, P.P. A Three-Component Supramolecular Nanocomposite as a Heavy-Atom-Free Photosensitizer. Chem. Commun. 2019, 55, 5623–5626. [Google Scholar] [CrossRef] [PubMed]
- Rahman, A.; Praveen Kumar, P.P.; Yadav, P.; Goswami, T.; Shanavas, A.; Ghosh, H.N.; Neelakandan, P.P. Gold–BODIPY Nanoparticles with Luminescence and Photosensitization Properties for Photodynamic Therapy and Cell Imaging. ACS Appl. Nano Mater. 2022, 5, 6532–6542. [Google Scholar] [CrossRef]
- Liu, Y.; Song, N.; Chen, L.; Xie, Z. Triple-BODIPY Organic Nanoparticles with Particular Fluorescence Emission. Dyes and Pigments 2017, 147, 241–245. [Google Scholar] [CrossRef]
- Chu, C.; Stamatelatos, D.; McNeill, K. Aquatic Indirect Photochemical Transformations of Natural Peptidic Thiols: Impact of Thiol Properties, Solution pH, Solution Salinity and Metal Ions. Environ. Sci.: Processes Impacts 2017, 19, 1518–1527. [Google Scholar] [CrossRef]
- Pérez-Jiménez, A.I.; Lyu, D.; Lu, Z.; Liu, G.; Ren, B. Surface-Enhanced Raman Spectroscopy: Benefits, Trade-Offs and Future Developments. Chem. Sci. 2020, 11, 4563–4577. [Google Scholar] [CrossRef] [PubMed]
- Lin, C.; Li, Y.; Peng, Y.; Zhao, S.; Xu, M.; Zhang, L.; Huang, Z.; Shi, J.; Yang, Y. Recent Development of Surface-Enhanced Raman Scattering for Biosensing. J. Nanobiotechnol. 2023, 21, 149. [Google Scholar] [CrossRef] [PubMed]
- Cialla-May, D.; Zheng, X.-S.; Weber, K.; Popp, J. Recent Progress in Surface-Enhanced Raman Spectroscopy for Biological and Biomedical Applications: From Cells to Clinics. Chem. Soc. Rev. 2017, 46, 3945–3961. [Google Scholar] [CrossRef] [PubMed]
- Fleischmann, M.; Hendra, P.J.; McQuillan, A.J. Raman Spectra of Pyridine Adsorbed at a Silver Electrode. Chem. Phys. Lett. 1974, 26, 163–166. [Google Scholar] [CrossRef]
- Kumar, P.P.P.; Kaushal, S.; Lim, D.-K. Recent Advances in Nano/Microfabricated Substrate Platforms and Artificial Intelligence for Practical Surface-Enhanced Raman Scattering-Based Bioanalysis. Trends Anal. Chem. 2023, 168, 117341. [Google Scholar] [CrossRef]
- Lim, D.-K.; Jeon, K.-S.; Kim, H.M.; Nam, J.-M.; Suh, Y.D. Nanogap-Engineerable Raman-Active Nanodumbbells for Single-Molecule Detection. Nat. Mater. 2010, 9, 60–67. [Google Scholar] [CrossRef]
- Ou, F.S.; Hu, M.; Naumov, I.; Kim, A.; Wu, W.; Bratkovsky, A.M.; Li, X.; Williams, R.S.; Li, Z. Hot-Spot Engineering in Polygonal Nanofinger Assemblies for Surface Enhanced Raman Spectroscopy. Nano Lett. 2011, 11, 2538–2542. [Google Scholar] [CrossRef] [PubMed]
- Parker, S.F. Assignment of the Vibrational Spectrum of L-Cysteine. Chem. Phys. 2013, 424, 75–79. [Google Scholar] [CrossRef]
- Lomont, J.P.; Smith, J.P. In Situ Raman Spectroscopy for Real Time Detection of Cysteine. Spectrochimica Acta Part A: Molecular and Biomolecular Spectroscopy 2022, 274, 121068. [Google Scholar] [CrossRef]
- Kuligowski, J.; EL-Zahry, M.R.; Sánchez-Illana, Á.; Quintás, G.; Vento, M.; Lendl, B. Surface Enhanced Raman Spectroscopic Direct Determination of Low Molecular Weight Biothiols in Umbilical Cord Whole Blood. Analyst 2016, 141, 2165–2174. [Google Scholar] [CrossRef]
- Combs, J.A.; DeNicola, G.M. The Non-Essential Amino Acid Cysteine Becomes Essential for Tumor Proliferation and Survival. Cancers 2019, 11, 678. [Google Scholar] [CrossRef] [PubMed]
Figure 1.
Characterization of NC1. (A) UV-visible and (B) emission spectra for DBDP in acetone (50 μM), L-Tryptophan AuNPs (50 μg/mL), and nanocomposite NC1 (50 μg/mL) in acetate buffer. λexc = 490 nm. (C) and (D) represents the transmission electron microscopy and dynamic light scattering experiments for NC1.
Scheme 1.
Working principle for the prepared nanocomposite from DBDP dye and AuNPs for the detection of biothiols using IDA principle.
Scheme 1.
Working principle for the prepared nanocomposite from DBDP dye and AuNPs for the detection of biothiols using IDA principle.
Figure 2.
Interaction of biothiols with NC1. (A-C) Represents the changes in extinction spectra for NC1 after the interaction with various amounts of L-Cysteine, L-Homocysteine, and L-glutathione respectively. (D-F) Represents the changes in the emission spectra of NC1 with the addition of L-Cysteine, L-Homocysteine, and L-Glutathione respectively. Where [NC1= 50 μg/mL]. Studies were performed in acetate buffer pH = 9. Emission spectra were collected by exciting the samples at 490 nm (λexc = 490 nm).
Figure 3.
(A) Photographs for the visual color changes of NC1 under ambient and UV light in acetate buffer (pH 9.0) with various L-amino acids and S2- ions at 25 °C. Where (i) NC1 (ii) NC1+ L-Gly (100 μM), (iii) NC1+ L-Val (100 μM), (iv) NC1+ L-leu(100 μM), (v) NC1+ L-Lys (100 μM), (vi) NC1+ L-Cyst (100 μM), (vii) NC1+ L-Cys (3 μM), (viii) NC1+ L-Hcy (3 μM), (ix) NC1+ L-GSH (3 μM), (x) NC1+ L-His (100 μM), (xi) NC1+ L-Asp (100 μM), (xii) NC1+ L-Glu (100 μM), (xiii) NC1+ L-Trp(100 μM), (xiv) NC1+ L-Thr (100 μM), (xv) NC1+ L-Ala (100 μM), (xvi) NC1+ L-Met (100 μM), (xvii) NC1+ L-Pro (100 μM), (NC1+ H2S (100 μM). (B)-(C) represents the extinction and emission spectra for DBDP NPs (50 μg/ml) and NC1 (50 μg/ml) + 3 μM L-Cys respectively. (D) transmission electron microscopy images for DBDP NPs.
Figure 4.
(A) UV-visible and (B) emission spectra for NC1 (50 μg/ml) with L-Cys (3 μM) alone, and in different pH (9, 7.4) conditions, and with various interfering biological molecules such as FBS, HSA, and BSA. (C-D) represents the visual colorimetric response for (i) NC1 (50 μg/ml) alone (ii) NC1 + L-Cys in pH = 9, (iii) NC1 + L-Cys in pH = 7.4, (iv) NC1 + L-Cys in FBS, (v) NC1 + L-Cys in HAS, and (vi) NC1 + L-Cys in BSA respectively. λexc = 490 nm.
Figure 5.
(A, B, C) SERS spectra of NC1 after interaction with various concentrations of L-Cys, L-Hcy, and L-GSH respectively. Where the thiols were added from (10-6 M to 10-17 M) to NC1 (50 μg/mL) (D-F) Linear relationship between SERS peak intensities at 674 cm−1 and biothiol concentrations (L-Cys, L-Hcy, and L-GSH) respectively. Excitation: 633 nm laser (6.8 mW); Exposure time: 10 s.
Figure 6.
Surface-enhanced Raman scattering spectra for the dried samples of NC1 with biothiols. (A) SERS spectra for dried samples of NC1 with various concentrations of L-Cys. (B) SERS Raman mapping for NC1 with various concentrations of L-Cys. (C-D) represents the SERS spectra and Raman mapping images for NC1 with various concentrations of L-Hcy respectively. (E-F) SERS and Raman mapping images for the dried samples from NC1 with various concentrations of L-GSH.
Figure 7.
Bright-field and fluorescence microscopy images of L929 (normal) cell lines and MDA-MB 231 (cancer) cell lines following a 24-hour incubation with NC1 at a concentration of 12.5 and 50 μg/mL.
Figure 7.
Bright-field and fluorescence microscopy images of L929 (normal) cell lines and MDA-MB 231 (cancer) cell lines following a 24-hour incubation with NC1 at a concentration of 12.5 and 50 μg/mL.
Figure 8.
Developed paper strips from NC1 for the detection of biothiols. Where the images represents the color changes from NC1 paper strips by addition of various amounts of L-Cys (A), (B) color changes by the addition of L-Hcy, and (C) the observed color change by the addition of L-GSH under daylight and UV light conditions respectively.
|
Disclaimer/Publisher’s Note: The statements, opinions and data contained in all publications are solely those of the individual author(s) and contributor(s) and not of MDPI and/or the editor(s). MDPI and/or the editor(s) disclaim responsibility for any injury to people or property resulting from any ideas, methods, instructions or products referred to in the content. |
© 2024 by the authors. Licensee MDPI, Basel, Switzerland. This article is an open access article distributed under the terms and conditions of the Creative Commons Attribution (CC BY) license (http://creativecommons.org/licenses/by/4.0/).
