1. Introduction
A considerable incentive for taking into account disease mapping as an integral part of the process of development, emanates from the WHO (2006) strategic and operational framework (SOF). Disease mapping has long been regarded as one of the most essential public health challenges, stemming from a knowledge of the link between health and geographical location. Understanding this association has long piqued the interest of scientists and academics (Geraghty, 2016, Krieger, 2003 and GISGeography 2015). The disease mapping approach was first used in 1854, when Dr. Snow mapped a cholera epidemic throughout the city of London, England (Geraghty, 2016, Krieger, 2003 and GISGeography 2015). However, mapping results from GIS are one of the most useful uses of GIS in public health (Wilkinson, Grundy, Landon, Stevenson and 1998). One of the most essential GIS technologies, disease mapping technology, has been rapidly evolving (Kirby, Delmelle and Eberth, 2016). GIS is increasingly using this technology as a useful tool in disease surveillance (Fletcher-Lartey and Caprarelli, 2016).
A basic overview of the illness status in a certain geographic area is provided by disease mapping, which uses disease maps as visual representations of complex geographic data (Dlamini, 2020). Investigating the causes of diseases is the focus of epidemiology, and these causes frequently vary in frequency and spatial distribution. Because of this fluctuation in space, remote sensing was able to find a niche in the field of public health as disease researchers looked into the climatic and environmental elements that might be causing an illness. Studies have shown that the application of remote sensing to disease mapping and epidemiology, as well as to enhance surveillance and control efforts, has great potential (ibd).
The majority of epidemiological studies that had mapped vector-borne diseases in the context of environmental factors associated with those diseases (Tran, Ippoliti, Balenghien, Conte, Gely, and Calistri, et al. 2013) had made assumptions based on established scientific evidence that those environmental factors were associated with the disease outcome of interest. To date, a growing number of disease mapping and epidemiology studies have used environmental and climatic data to map and forecast disease spread in specific geographic areas. Such studies were frequently used to assist direct and focus the deployment of health treatments to regions identified as having a high burden of the mapped disease.
Disease mapping, disease clustering, and ecological analysis are the three primary types of studies on the geographical distribution of diseases. GIS-based disease mapping relies on identifying a number of factors, the most important of which are disease occurrence locations, patterns of disease spread, environmental risk factors that lead to disease spread, and socioeconomic data, in order to analyze spatial relationships within the affected area (Murad, 2005).
GIS-based disease clustering studies try to determine if a disease is spatially grouped and, if so, where the clusters are located. Furthermore, these investigations are based on an analysis of prospective environmental risk factors that may exist at a given area and constitute a potential hazard (Lawson, Browne and Vidal-Rodeiro, 2003) Ecological analysis studies are significant in epidemiological research because they focus on examining illness distribution in connection to explanatory factors, often at an aggregated spatial level (Maheswaran and Craglia, 2004). Healthcare research depend largely on GIS-based mapping and clustering technologies to provide a broad visualization aimed at controlling disease transmission and identifying disadvantaged people on a regional level (Koch, 2005 and American Hospital Association, 2005).
Several studies have proven that GIS is an effective tool for disease mapping and clustering. For example, people in the 1980s in the United States plotted the sites of disease presence and possible dissemination pathways. They also attempted to manage the illness by clustering. To really appreciate the role of GIS, Braga et al (1998) used Kernel and Bayesian approaches to map lung cancer illness in two Italian cities and establish disease rates at the level of urban clusters. Eisen and Eisen (2011) also examined the use of geographic information systems (GIS) to detect and control illnesses such as malaria and West Nile virus. In the same vein, Rasam, Ghazali, Noor, Mohd, Hamid, Bazlan and Ahmad, (2014), employed GIS-based cholera disease mapping to determine disease distribution patterns in Malaysia’s Sabah region. To assess the pattern of illness spread, the disease mapping relied on the cohort approach. As a result, it was evident that the disease was being passed from person to person via polluted water.
Furthermore, a GIS-based measles disease mapping approach was employed in the United States to locate disease incidence areas and establish distribution patterns. In a more generic sense, it became evident that illness rates were high in places where children had not received disease immunization. The disease mapping approach aided in identifying regions in need of health services and determining the optimal sites for these services, particularly once the maps displayed the locations and quantity of illness cases, as well as the time period associated with disease transmission (Sones, 2019).
To obtain precise disease mapping outputs, the quality of the spatial data used in the analysis should be evaluated at the analysis level based on a number of elements, including (1) positional accuracy, (2) thematic accuracy, (3) temporal accuracy, (4) completeness, (5) logical consistency, and (6) usability (Santos, Medeiros, dos Santos, and Filho, 2017) When mapping illness cases or counts inside tracts, disease incidence data may be portrayed differently than when mapping disease structures based mostly on estimates of sophisticated models (Maheswaran, Craglia, 2004). The geographical incidence of illness employs the locations of disease cases as the primary unit of observation. Residential addresses can provide important statistics and information about environmental dangers and possible exposure (Lawson and Kleinman, 2005). The portrayal of illness rates at specified sets of places is the most basic feasible mapping form. The locations of case events should be mapped for events. To count inside tracts, a representation of the number of events within tracts of arbitrary regions with the locations and quantities of case events should be provided (Lawson and Cressie, 2000).
GIS software can conduct a variety of analytical and statistical procedures for disease mapping and grouping. By integrating and modeling geographical data, these approaches can assist pinpoint cases and exposures, define spatial patterns, identify illness clusters, connect multiple sets of spatial data, and test statistical hypotheses (Carroll, Au, ADetwiler, Fu, Painter, and Abernethy2014)
The most important analytical and statistical methods of disease mapping and clustering within GIS software are: (1) a kernel density estimation method, which is used to produce spatial distribution maps of epidemic diseases by modeling disease risk prediction (Gatrell, and Senior, 1999), (2) a weighted standard deviational ellipses method, which can compare the spatial distributions of the diseases and identify their possible spatial directions, and (3) a hotspot analysis method, which is used to identify hotspots of disease transmission.
In many studies, several analytical and statistical tools were used to analyze health services using GIS. Murad (2008) for example, explored the use of GIS to establish health center catchment areas using the straight-line allocation (SLA) strategy, which determines health center catchment areas based on a closest proximity approach. Murad (2014) used the Euclidean distance and drive-time methodologies to assess the accessibility of public health clinics in Jeddah. A cumulative model was developed to measure the amount of accessibility in each municipal area based on estimated distances from a road and health services. In this vein, Euclidean distance was also used (Murad and Khashoggi, 2020).
The purpose of this paper is to answer the questions of how GIS can be used to map disease locations in the southern Malawi and how this technology can be used to analyze spatial clustering and determine whether any unusual clusters of health conditions exist, as well as which places have high or low disease prevalence.
Methods And Materials
The study used Getis-Ord Gi* statistic to determine spatial distribution of diseases. This is based on hotspot analysis and it is one of the analytical methods used to determine spatial diffusion of diseases (Murad and Khashoggi, 2020). For example, Saxena, Nagpal, Das, Srivastava, Gupta, Kumar, Jeyaseelan, and Baraik, (2012) defined a geographical distribution pattern, identified hotspots, and mapped a directional distribution trend of Plasmodium vivax (Pv) and Plasmodium falciparum (Pf) occurrences in Ranchi, India, using the Getis-Ord Gi* and Standard Deviational Ellipse techniques. The study depended on malaria epidemiology data from 328 subcenters of the district’s 14 primary health centers (PHCs) from 2007 to 2009.
In this study, a GIS was utilized to estimate the prevalence of five chosen illnesses using data from Demographic Health Survey (DHS). To predict the spatial spread of health problems in the Malawi’s southern region, the Getis-Ord Gi* statistic model was applied. The Getis-Ord Gi* statistic was calculated for each feature in each dataset using ArcGIS’ hotspot analysis tool.
Data analysis was done using a spatial statistic function known as standard deviational ellipses, which quantifies the orientation and direction of features and provides a tool for abstracting spatial patterns. This form of study is useful for comparing the distributions of health condition groups (Murad and Khashoggi, 2020). Although placing elements on a map in GIS analysis might convey a feeling of direction, calculating the standard deviational ellipse explains the trend. This tool calculated the standard deviational ellipse using either the feature locations or the locations modified by an attribute value linked with the features. This is known as a "weighted standard deviational ellipse (Murad and Khashoggi, 2020).
Many satellite studies have emphasized the necessity of assessing the geographical distribution of health condition categories using the function of standard deviational ellipses (Murad and Khashoggi, 2020). Eryando, Susanna, Pratiwi, and Nugraha, (2012) for example, employed the standard deviational ellipse function, statistical analysis, overlap analysis, and environmental factors to map the geographical distribution of malaria in Sukabumi, Indonesia, where a malaria outbreak occurred from 2004 to 2012. The study focused on data gathering by Global Positioning System (GPS) plotting and field surveys based on data from Sukabumi district healthcare clinics on positive malaria cases. Nevertheless, the distribution of standard deviation ellipses was biased toward the northwest and southeast. Malaria was spread by environmental conditions such as an abnormality in rainfall and temperatures, particularly in warm and high places (Murad and Khashoggi, 2020).
The physical environment of the area understudy, aided vector growth and metabolism. Mapping the geographical distribution of malaria gives an initial visualization that might aid in the development of potential intervention priorities. As a result, the application of the standard deviational ellipse function aided in identifying the geographical elements that contributed to the incidence of malaria, as well as establishing prevalence trends based on specific geographic patterns. Similarly, Dong, Yang, Xu, Liu, and Chen, (2017), employed the standard deviational ellipse function to evaluate the directional trend and existence of spatial-temporal clustering of influenza A(H7N9) in China between March 2013 and December 2014.
In this study, standard deviational ellipse function was used to evaluate the directional trend and existence of spatial-temporal clustering of hypertension, malaria, diabetes, cholera and asthma in the southern region of Malawi.
Study Site
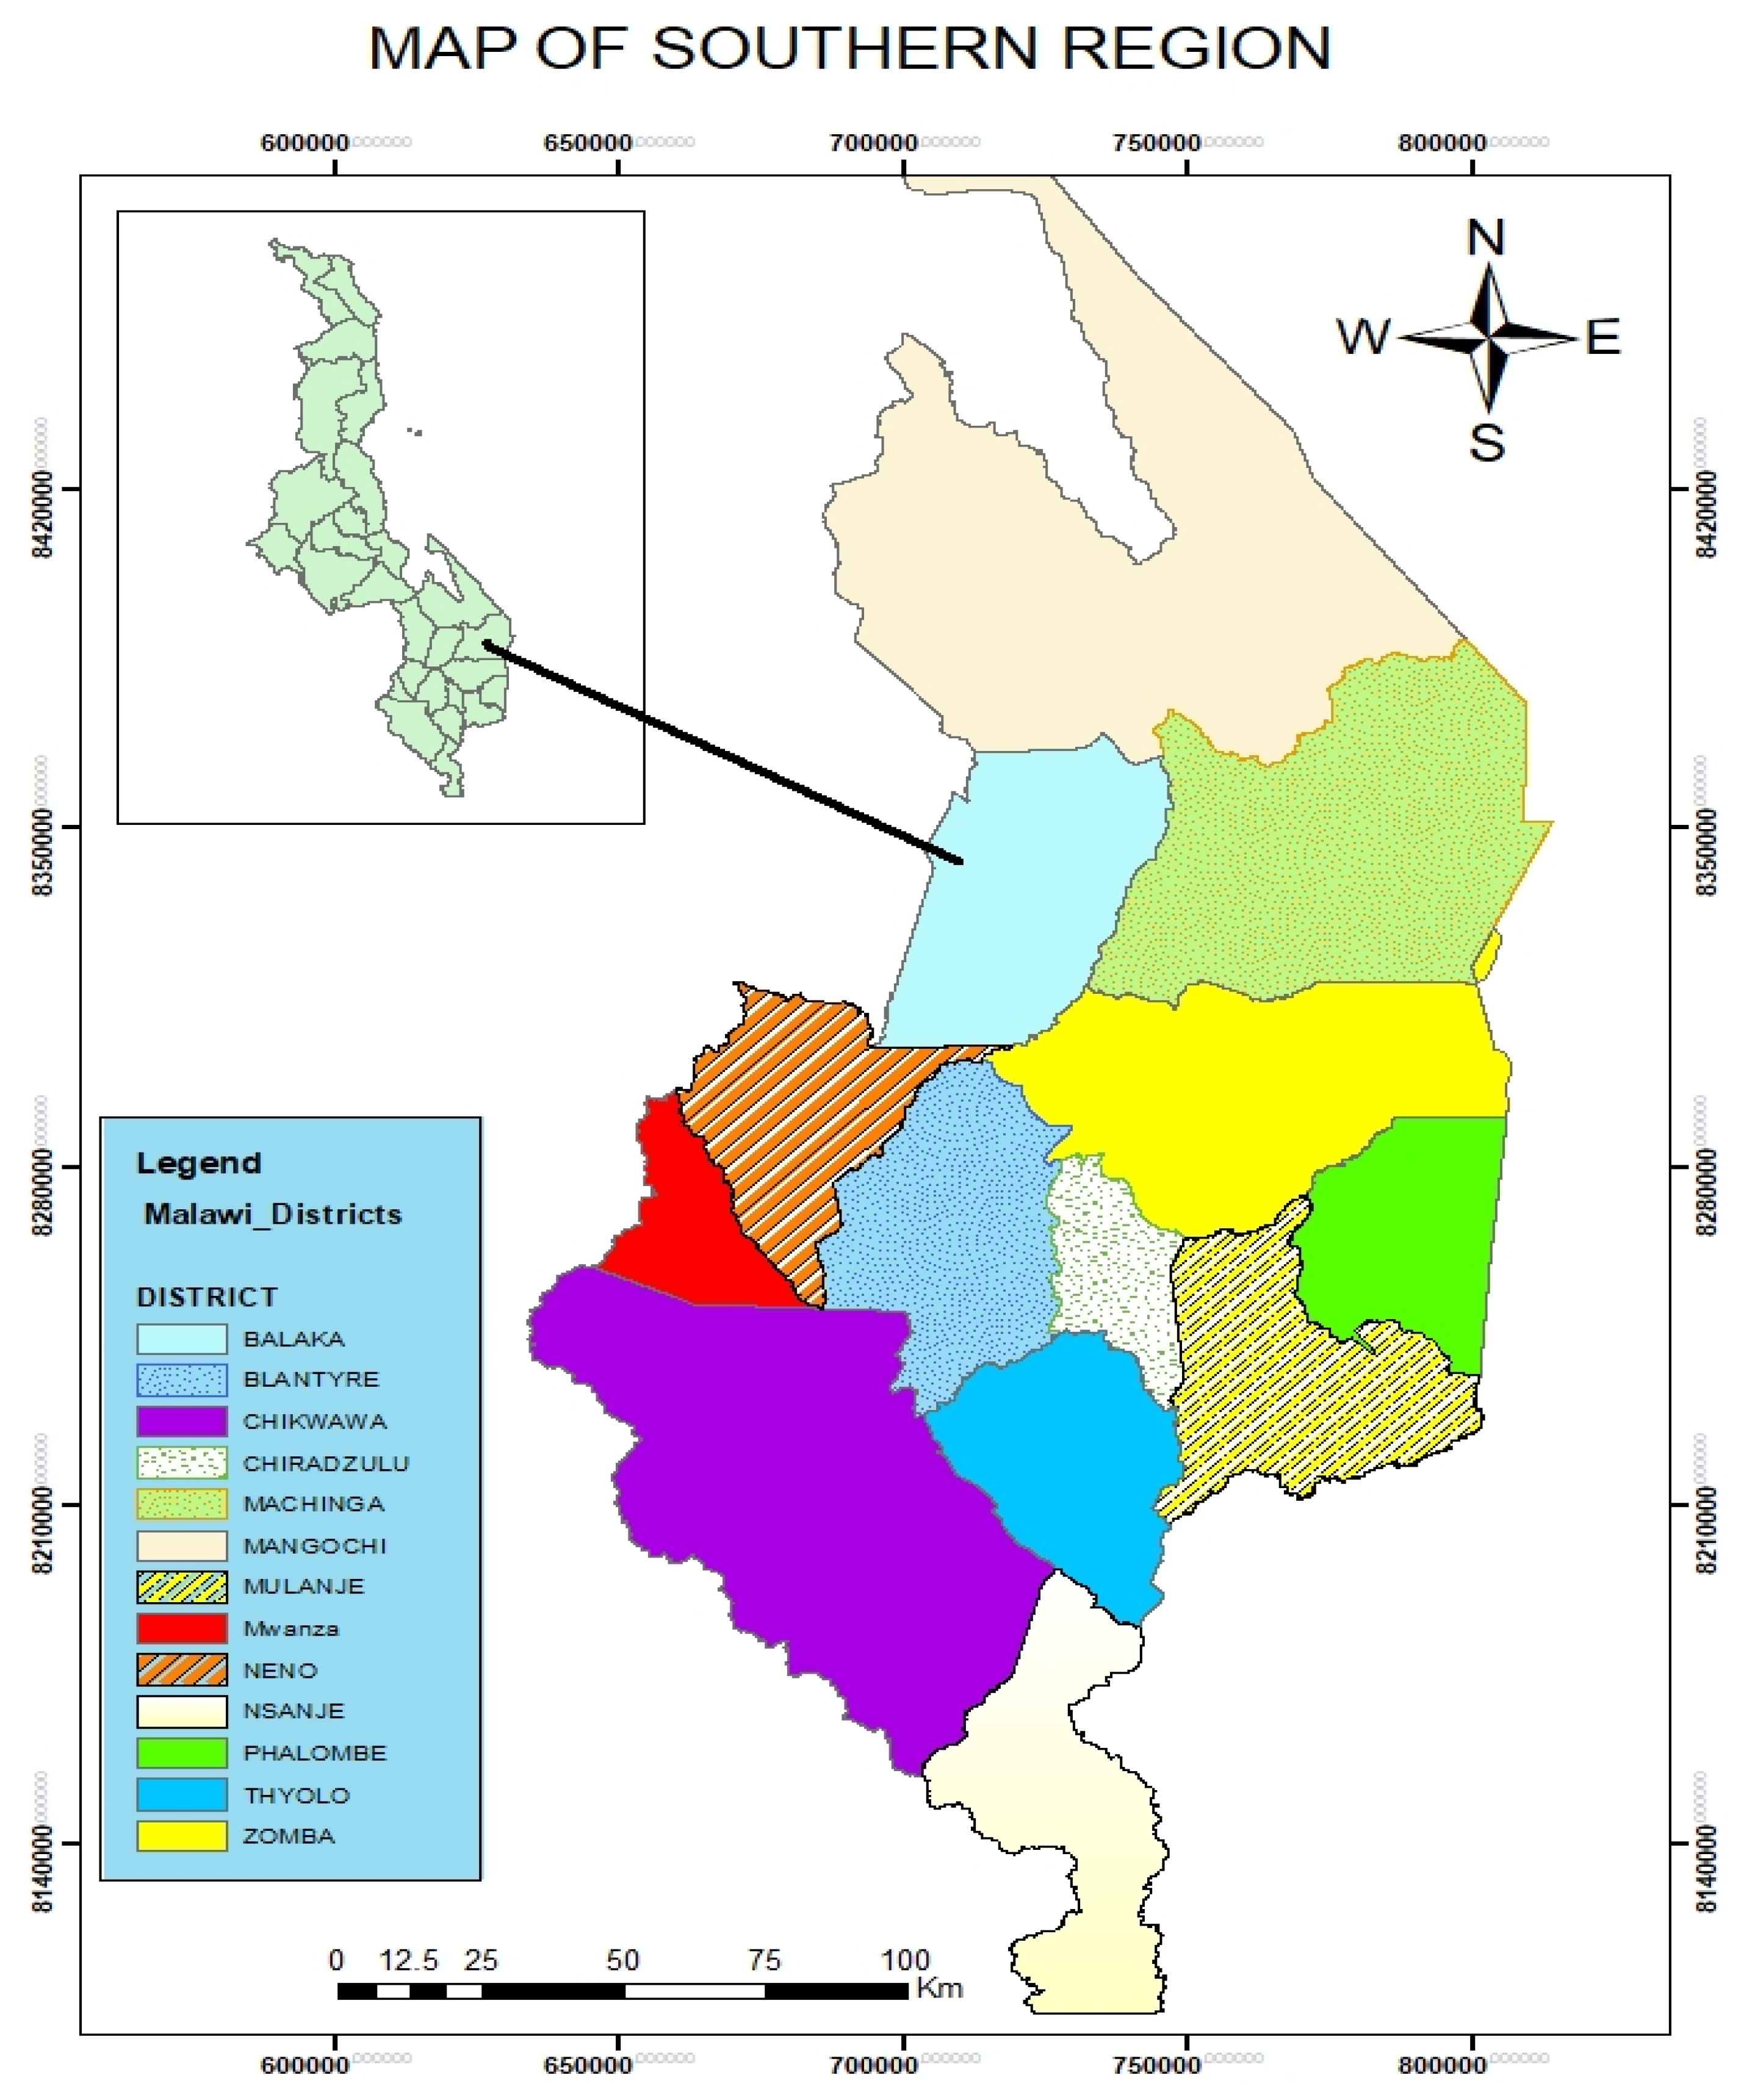
Malawi’s southern area, which covers around one-third of the country, is the most developed and has the biggest population of 7,750,000 of the country’s 19 million inhabitants. Thirteen of Malawi’s 28 districts are situated in the Southern Region. These include Balaka, Blantyre, Chikhwawa, Chiradzulu, Machinga, Mangochi, Mulanje, Mwanza, Neno, Nsanje, Phalombe, Thyolo, and Zomba. Malawi’s southern area is home to some of the greatest wildlife parks in the country, as well as the second-highest mountain peak in the southern hemisphere. These are Majete game reserve, which is located southwest of Blantyre and is home to an estimated 4,000 animals, Lengwe National Park, which is located 80 kilometers south of Blantyre, and Liwonde National Park, which is located 120 kilometers north of Blantyre on the Shire River. Malawi’s elephant population is concentrated in Liwonde. The Mulanje Massif peaks are quite stunning. They are Malawi’s highest peak, rising to 3,0002 m (9,824 ft). They are 65 kilometers east of Blantyre. Yao, Sena, Nyanja and Lhomwe are the native languages spoken in the southern part of the country (The Malawi Project, 2022).
Results
Spatial Distribution of Hypertension Disease
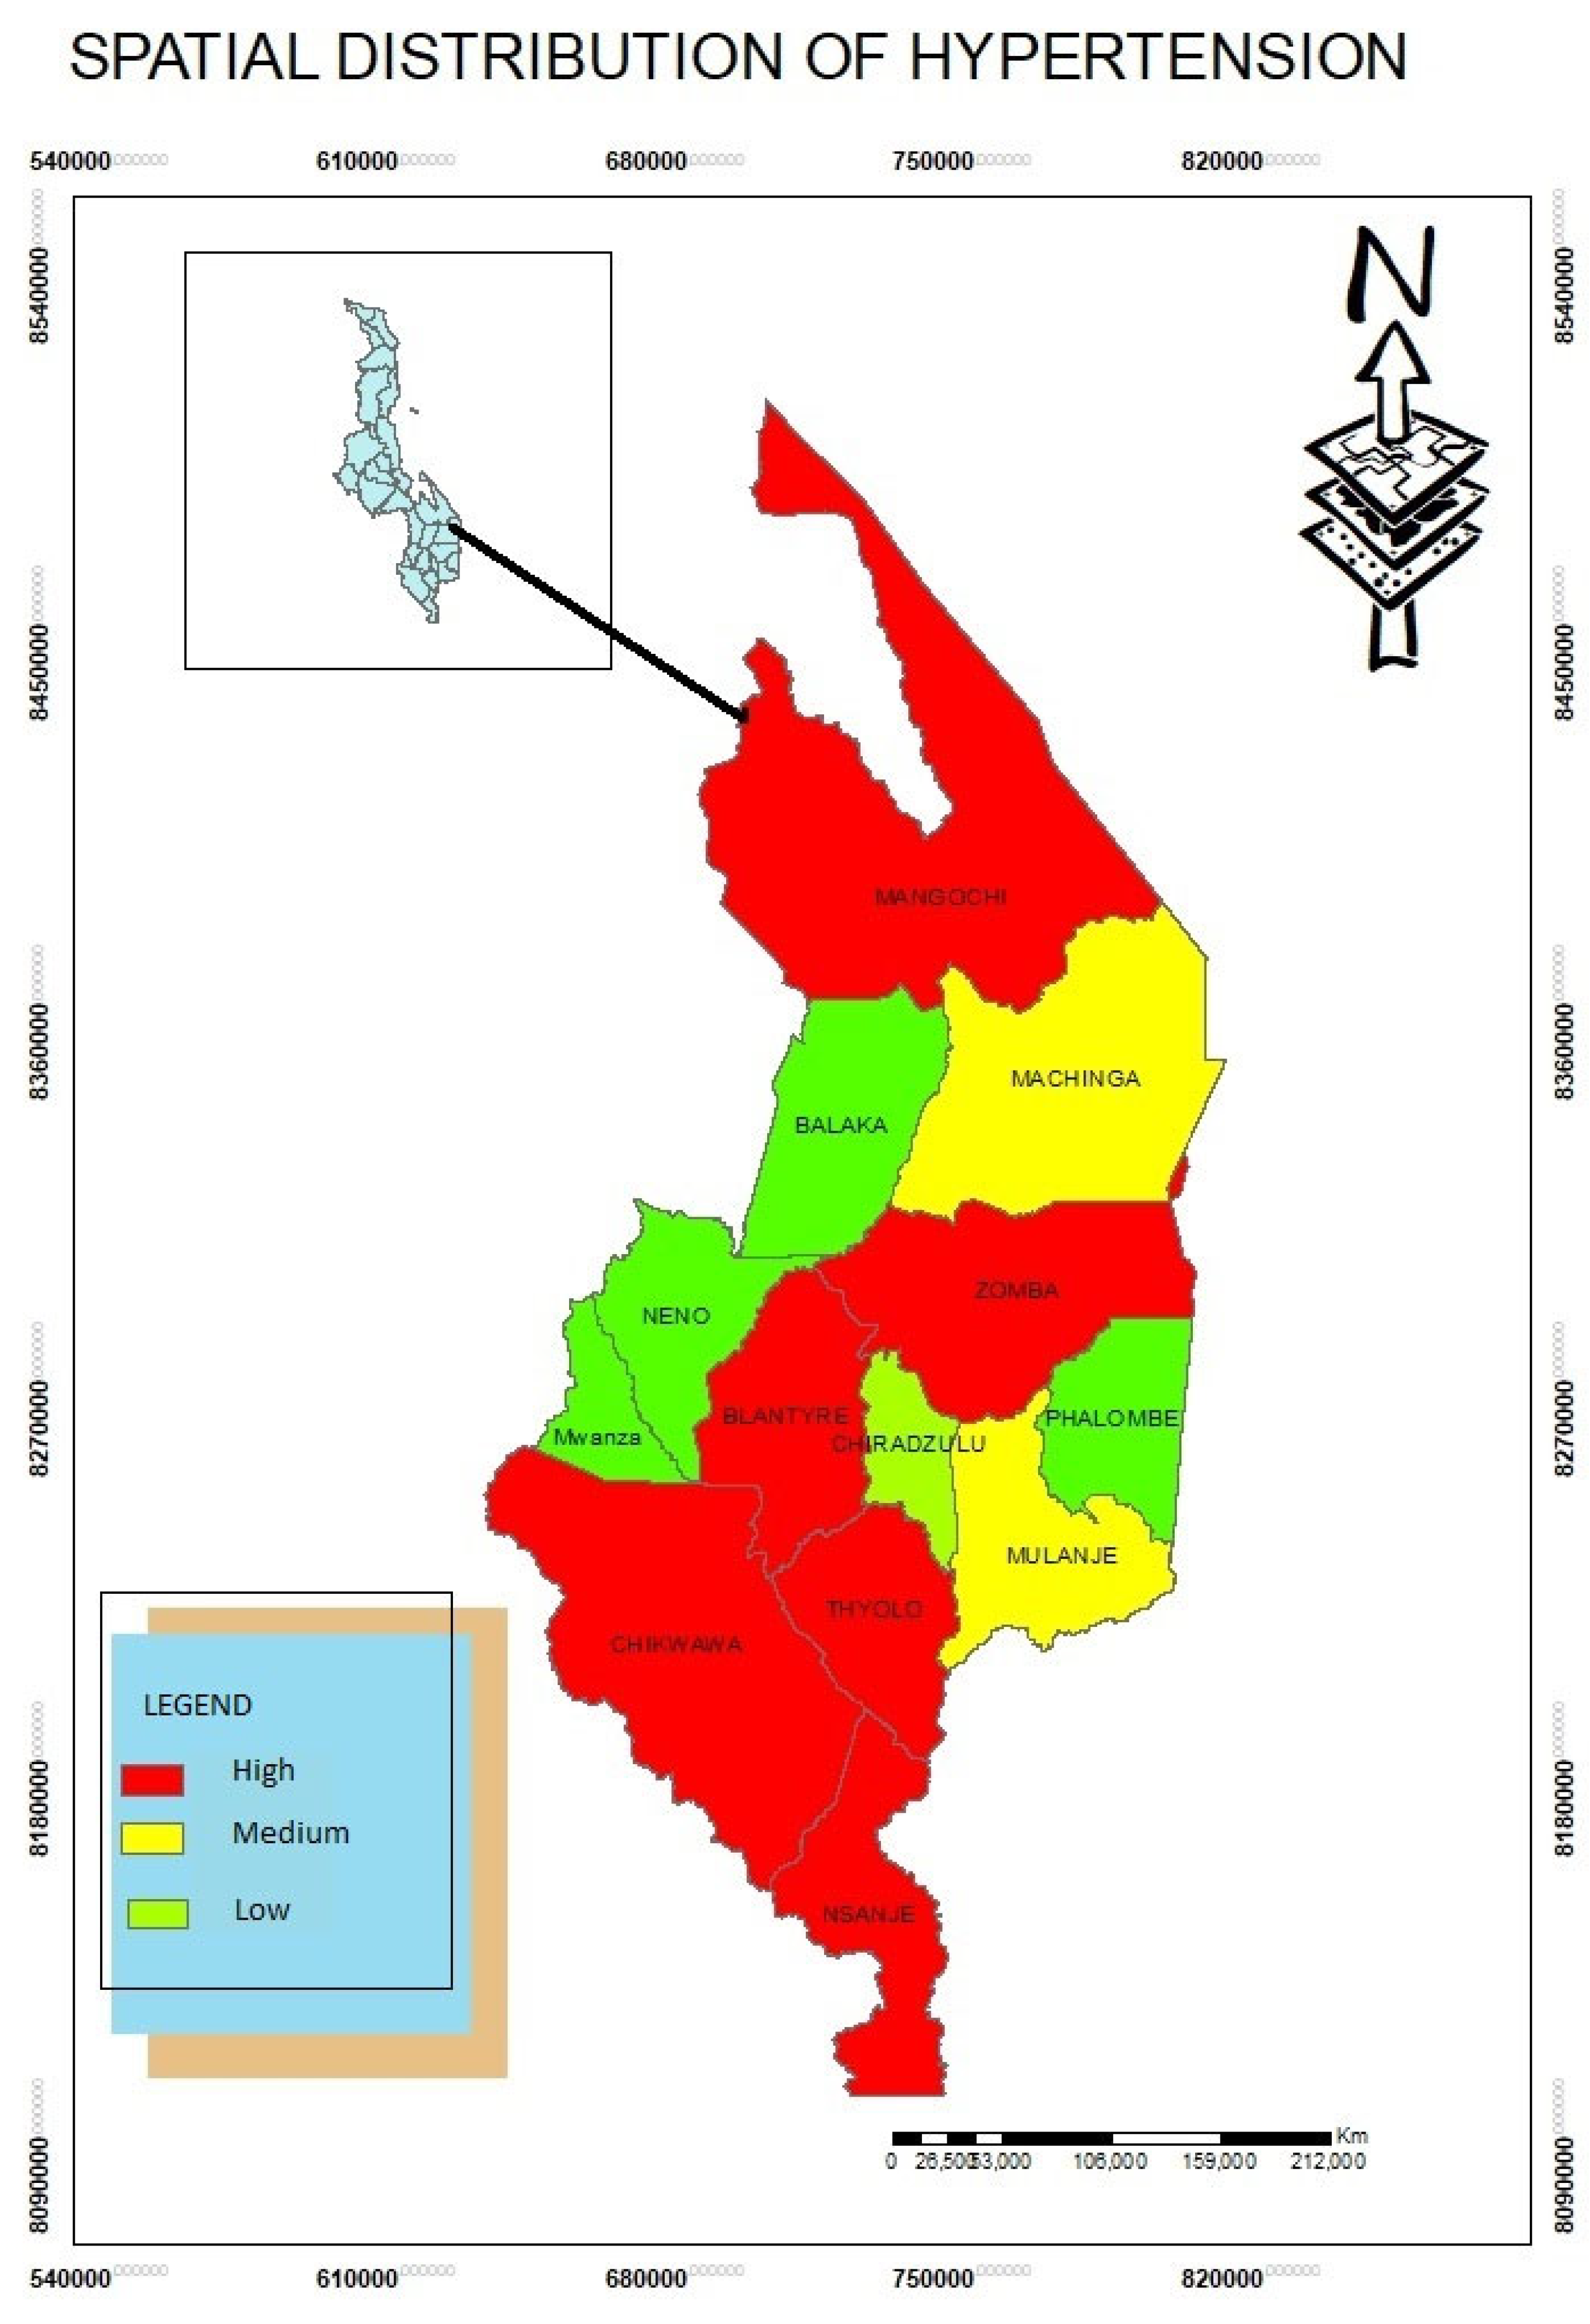
The study found that hypertension patients were highly concentrated in Blantyre, Thyolo, Chikwawa, Zomba, Mangochi and Nsanje Districts (
Figure 1). Through in-depth interviews, the study established that in urban areas many people have hypertension due to lifestyles choices of foods for example. Some districts such as Chikwawa, Nsanje, Mangochi have high temperatures. These areas are also densely populated. This demonstrates that hypertension patients follow population density patterns.
The study also used (SDE) to detect stages of hypertension. The standard deviational ellipse was employed at each phase to study the directional trend of hypertension using statistical scans to discover its spatial-temporal clusters. This is also in line with study conducted by Dong et al (2017) in China. The study discovered that A(H7N9) was in China particularly in central and western regions. As a result, identifying the spatial-temporal patterns of the epidemic revealed broad insights into the mechanics of the virus’s propagation throughout China. In the southern region of Malawi, a weighted standard deviational ellipse was employed based on the number of patients with hypertension.
Spatial Distribution of Malaria Disease
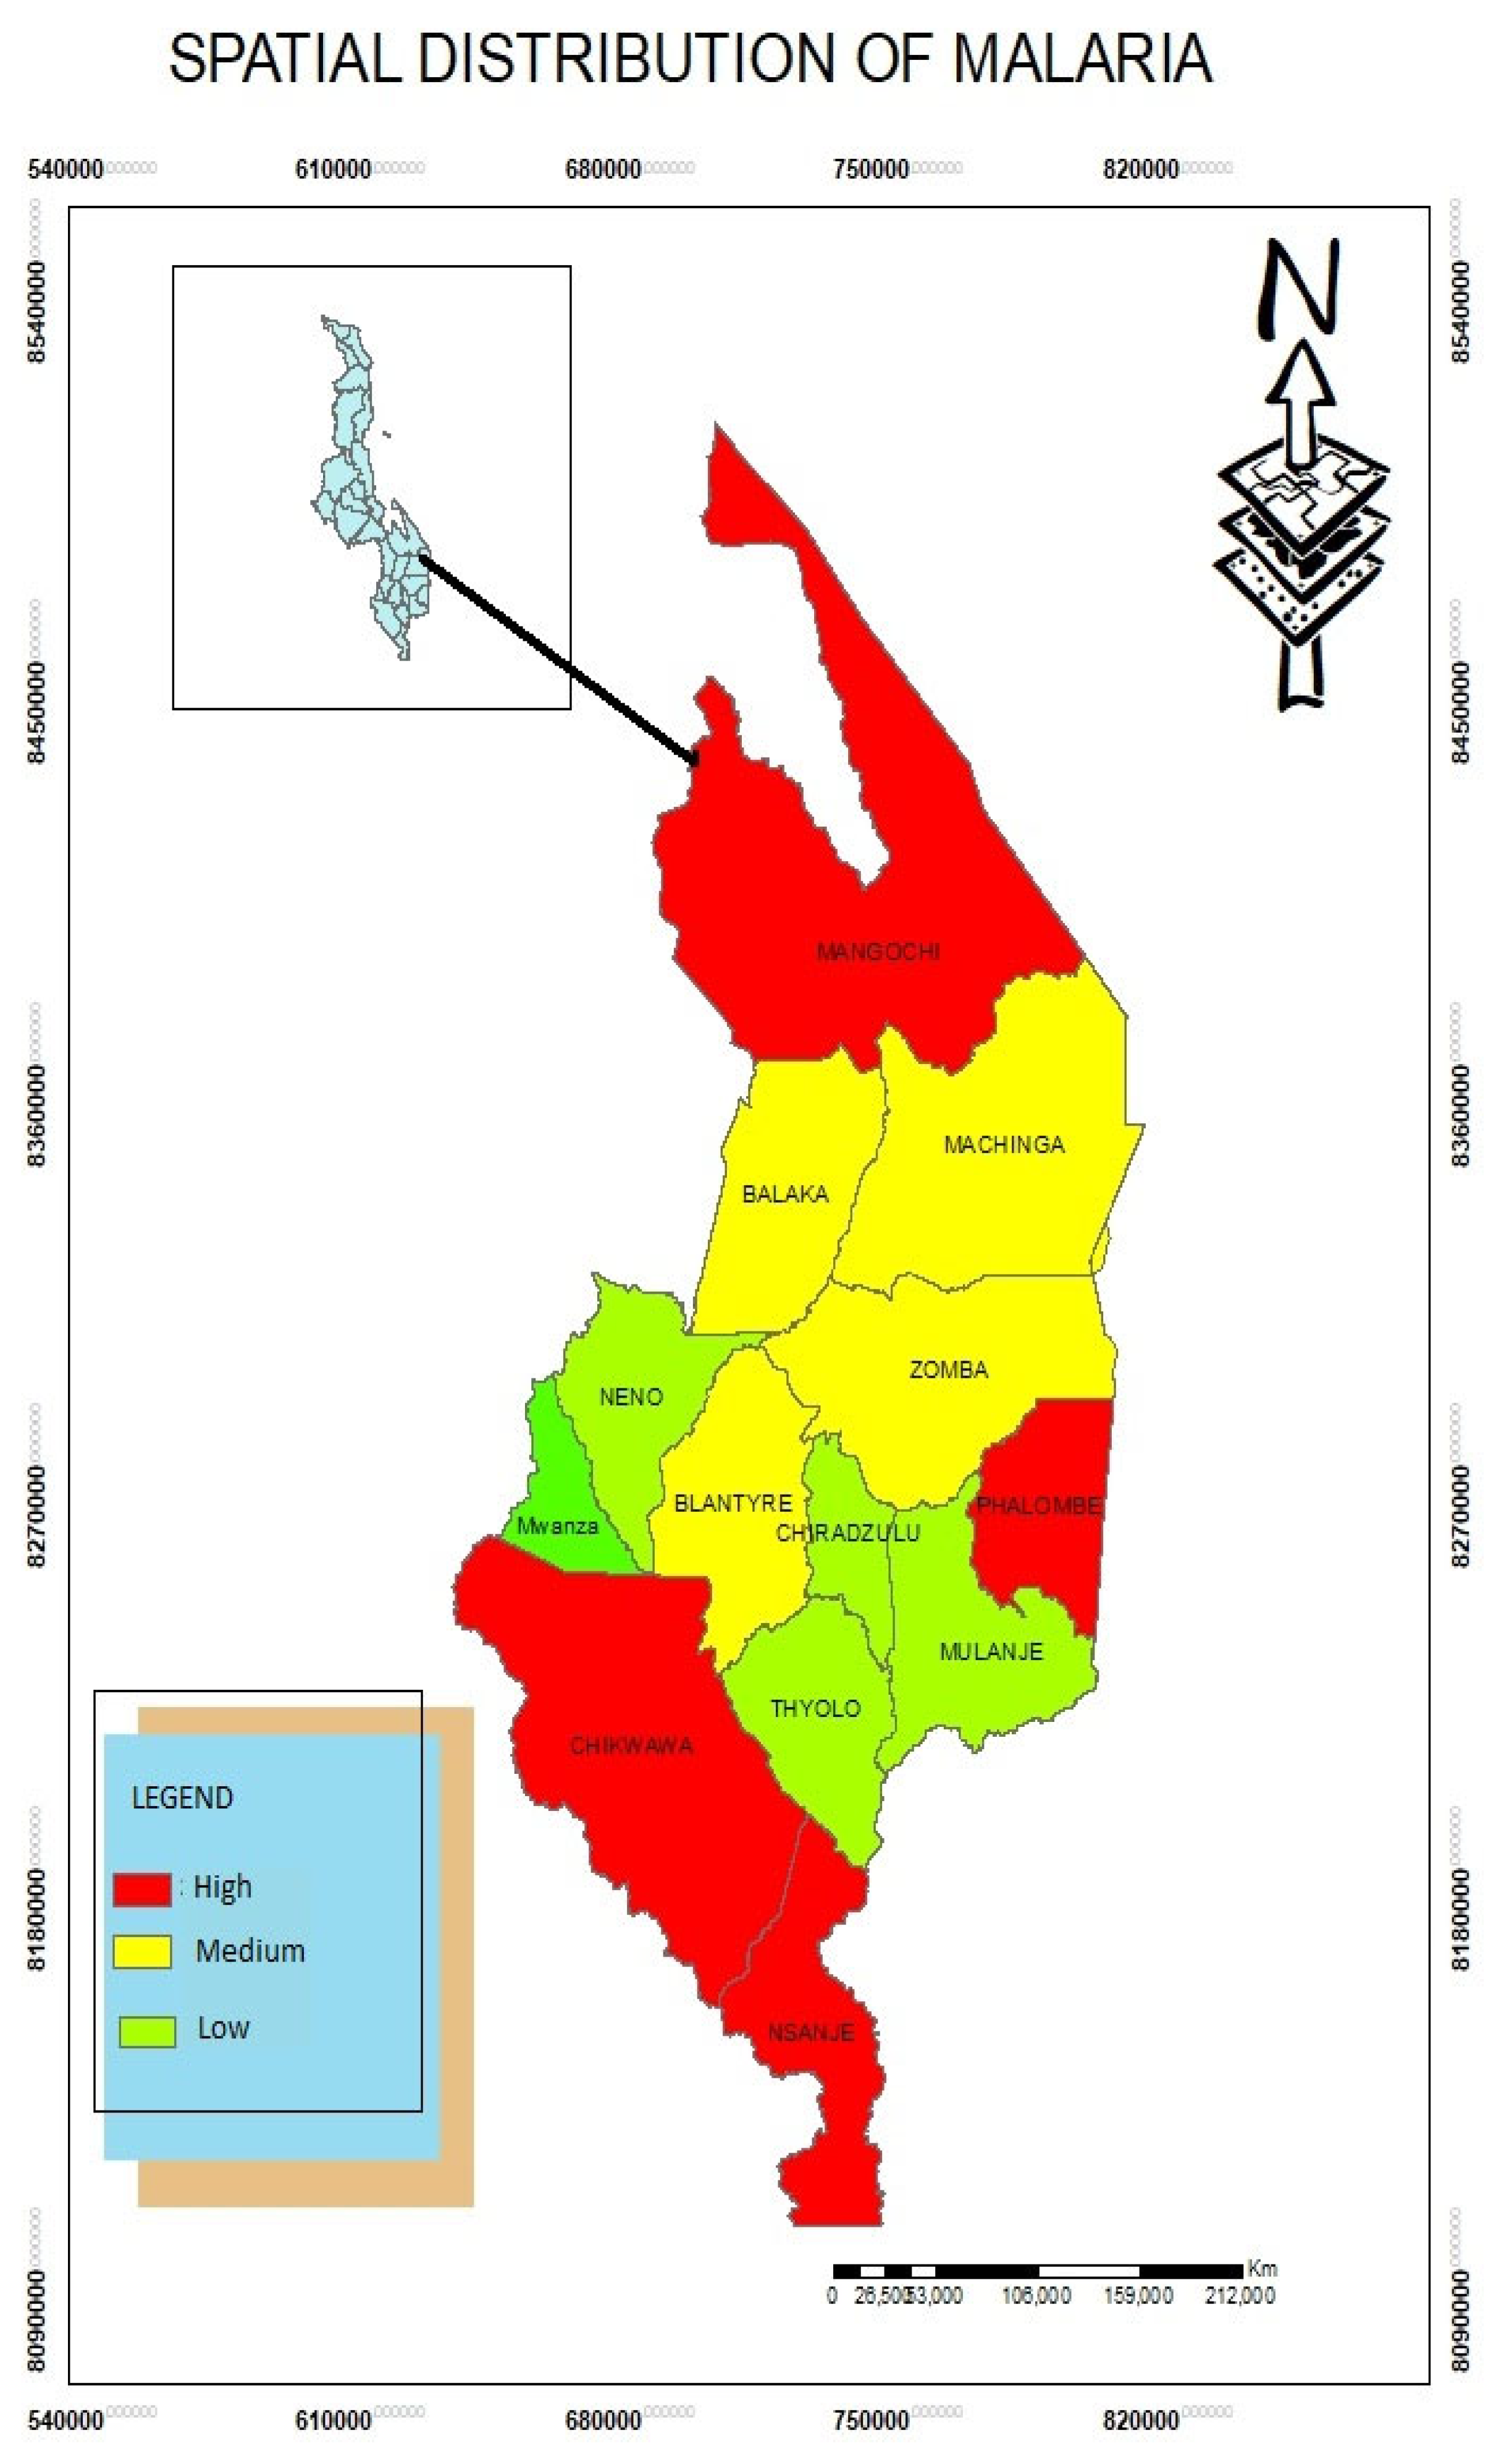
The study found that Mangochi, Phalombe, Nsanje and Chikwawa are high risk areas of Malaria while Balaka, Machinga, Zomba and Blantyre have moderate incidents of Malaria. Through Focus group discussion, the study found that malaria occurrence is so alarming due to water bodies that host mosquitoes. The standard deviational ellipse was employed to evaluate the directional trend of Malaria in the southern region districts of Malawi. Dong et al (2017) in China also used SDE to detect the spread of A(H7N9) where this disease spread rapidly in the central and western regions of China posing substantive threat to the inhabitants.
Figure 3.
Spatial Distribution of Malaria.
Figure 3.
Spatial Distribution of Malaria.
Spatial Distribution of Diabetes in the Southern Region of Malawi
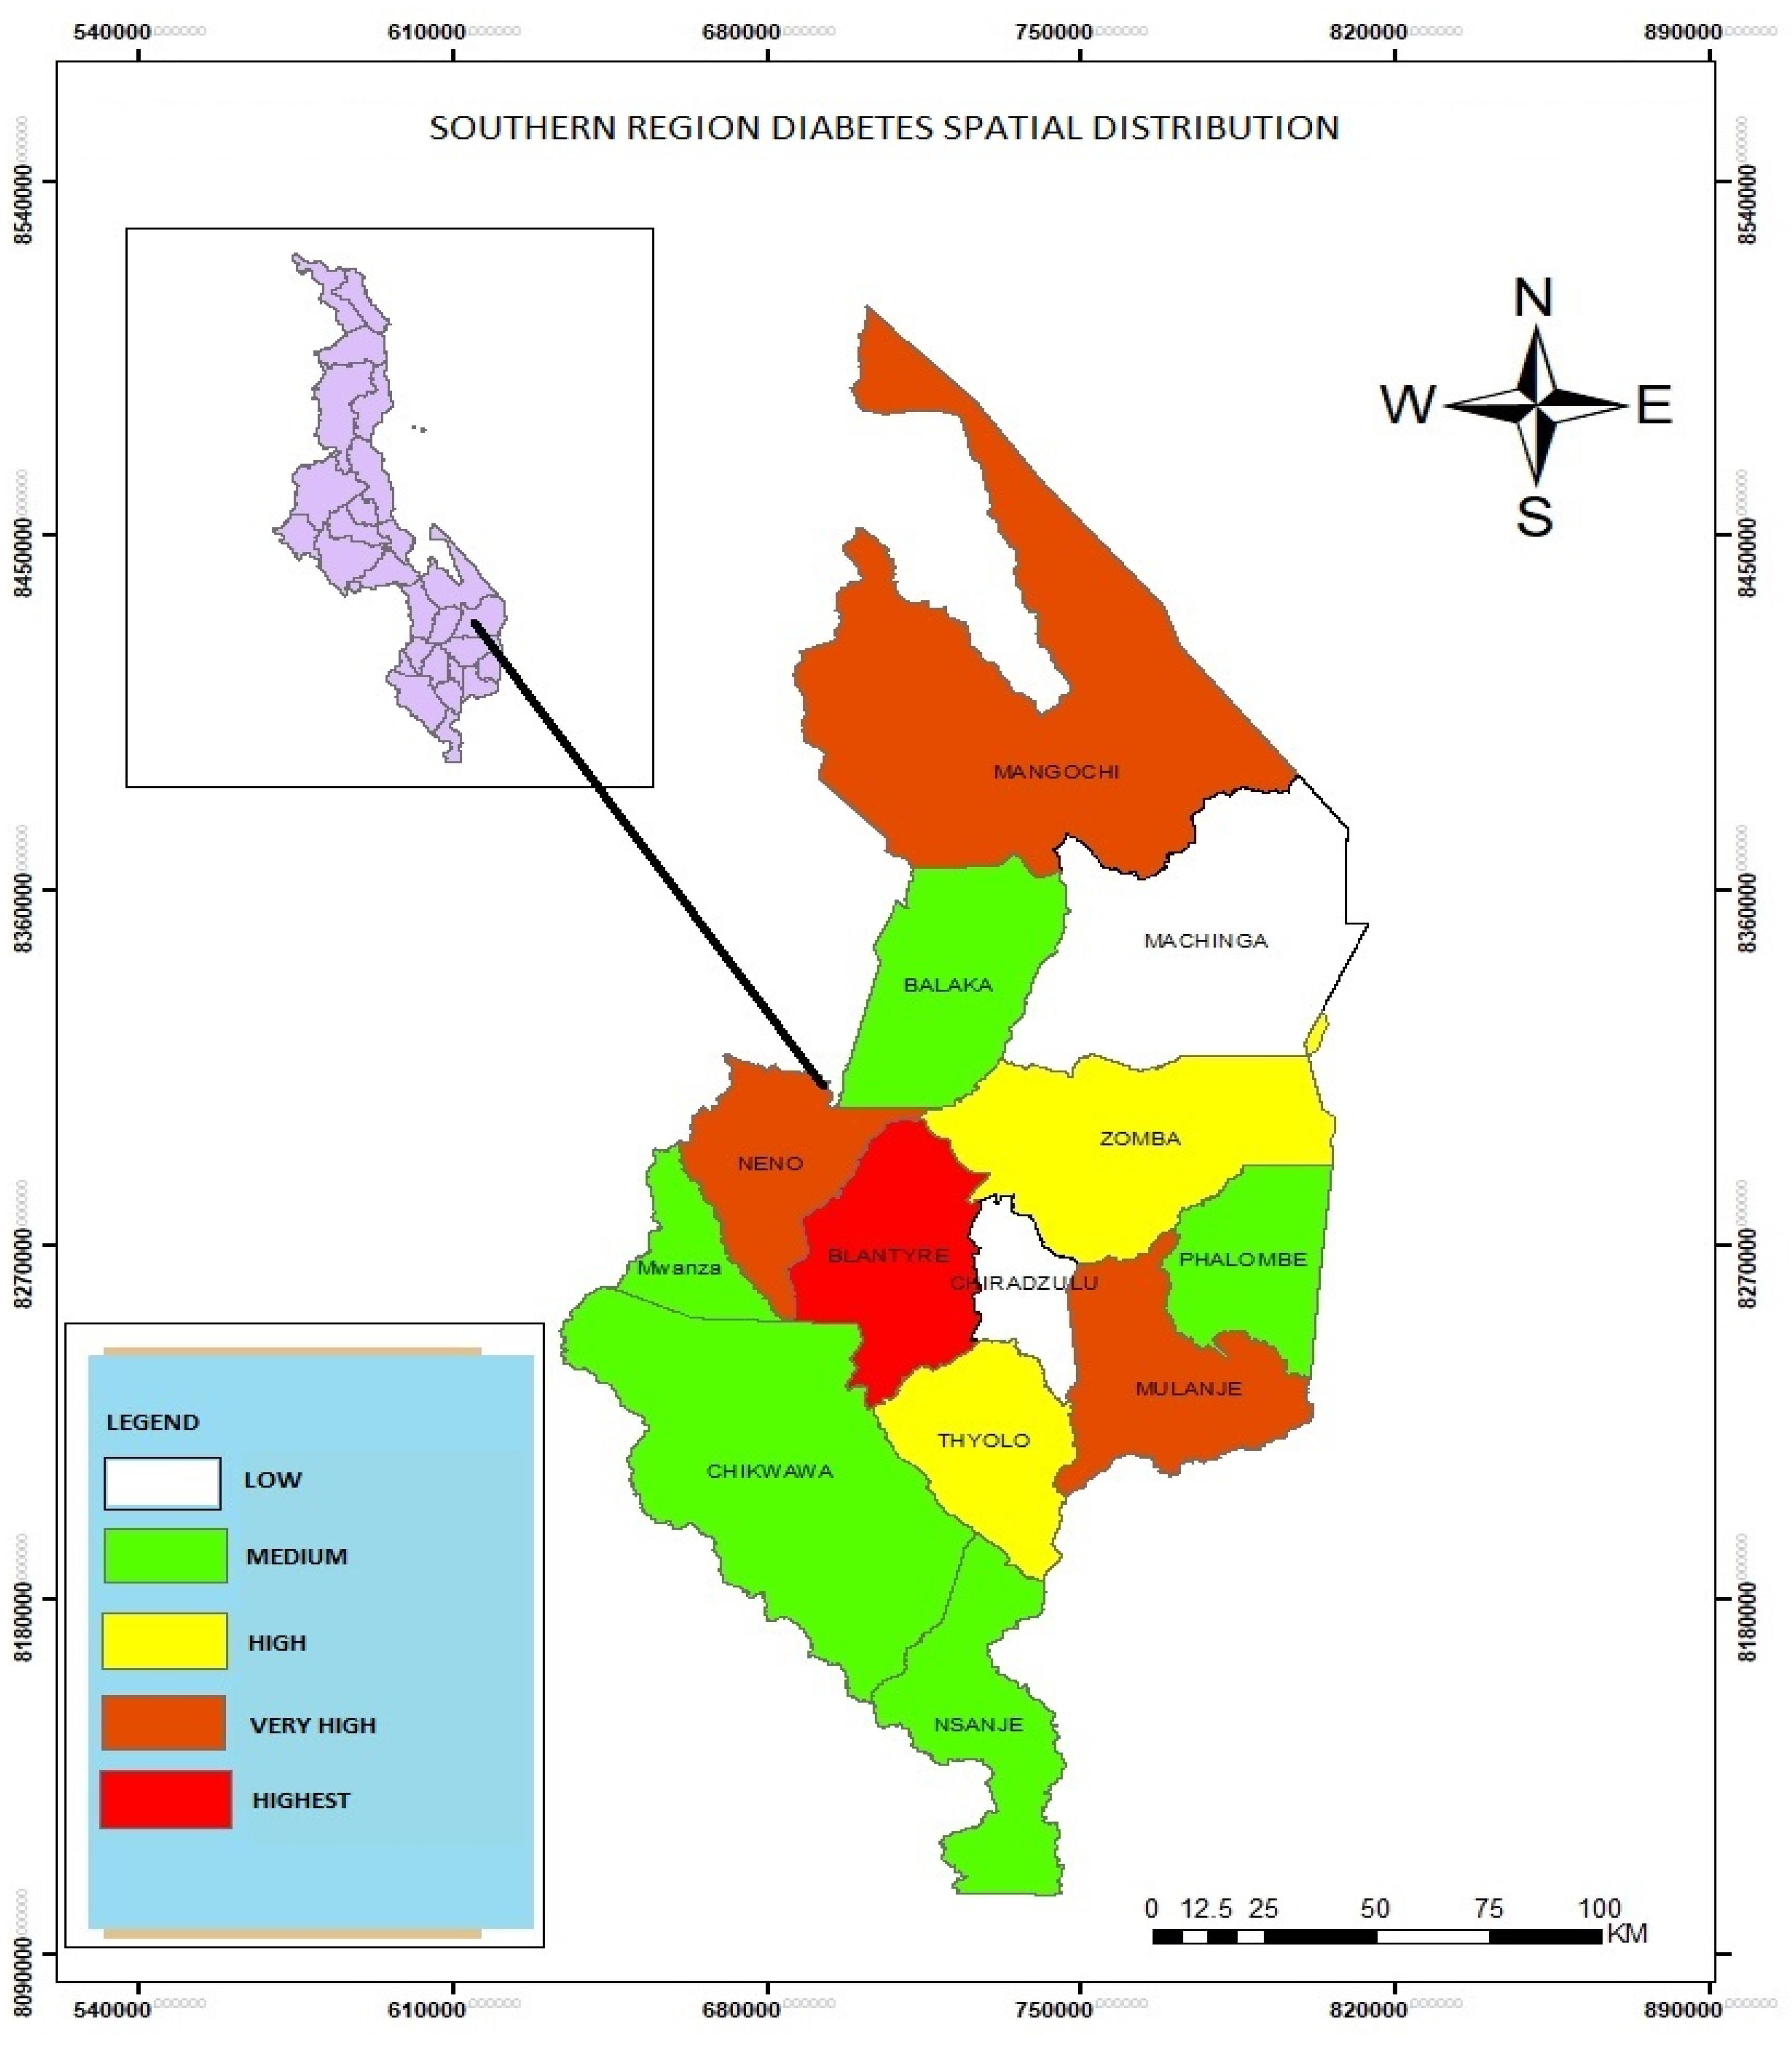
The study found that diabetes is highest in Blantyre as compared to Mangochi, Neno and Mulanje and other districts in the southern region. The study found that lifestyles led to the occurrence of diabetes. The study also used SDE to detect the distribution pattern of diabetes clusters.
Spatial Distribution of Asthma Disease
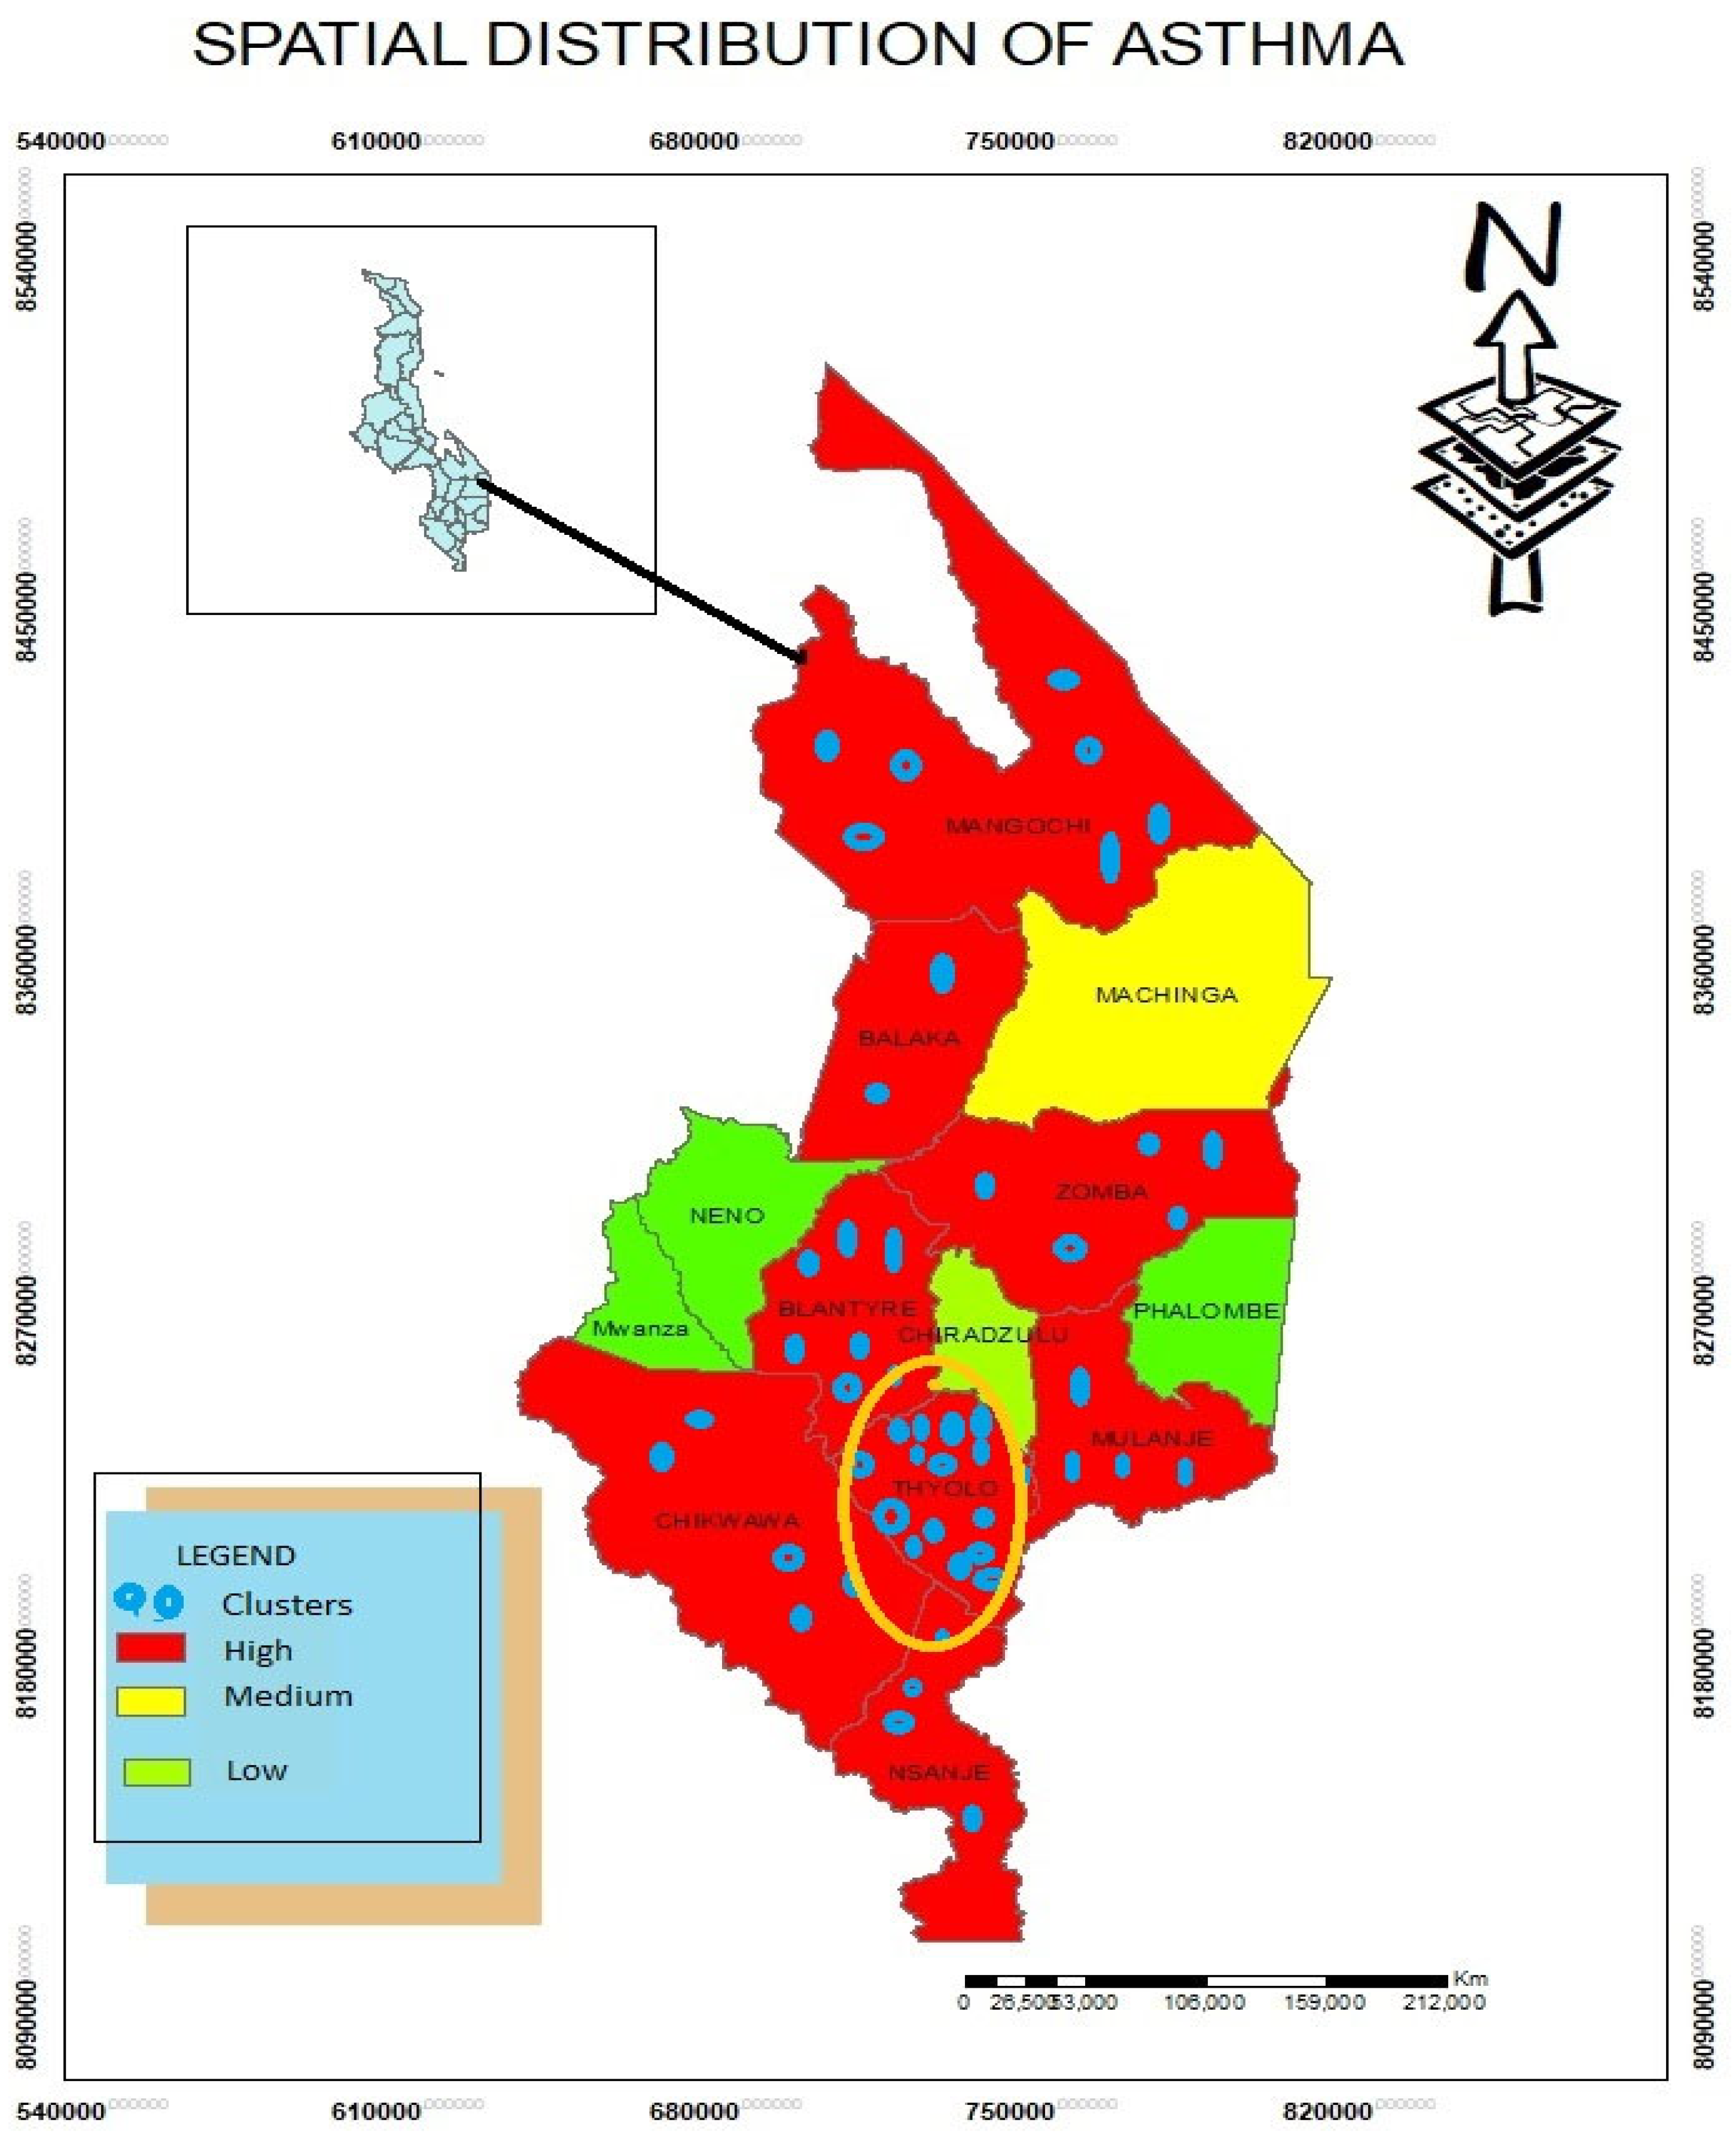
Based on findings, asthma is high in Mangochi, Balaka, Blantyre, Thyolo, Mulanje, Chikwawa and Nsanje districts. The study found that climatic variables led to the incidents of asthma. For example, districts such as Mangohi, Chikwawa, Balaka, and Nsanje are dusty due to arid conditions while Thyolo, Mulanje and Blantyre are cool areas. In addition, Blantyre is highly industrialized where a lot more carbons are produced affecting the inhabitants in these areas.
Spatial Distribution of Cholera Disease
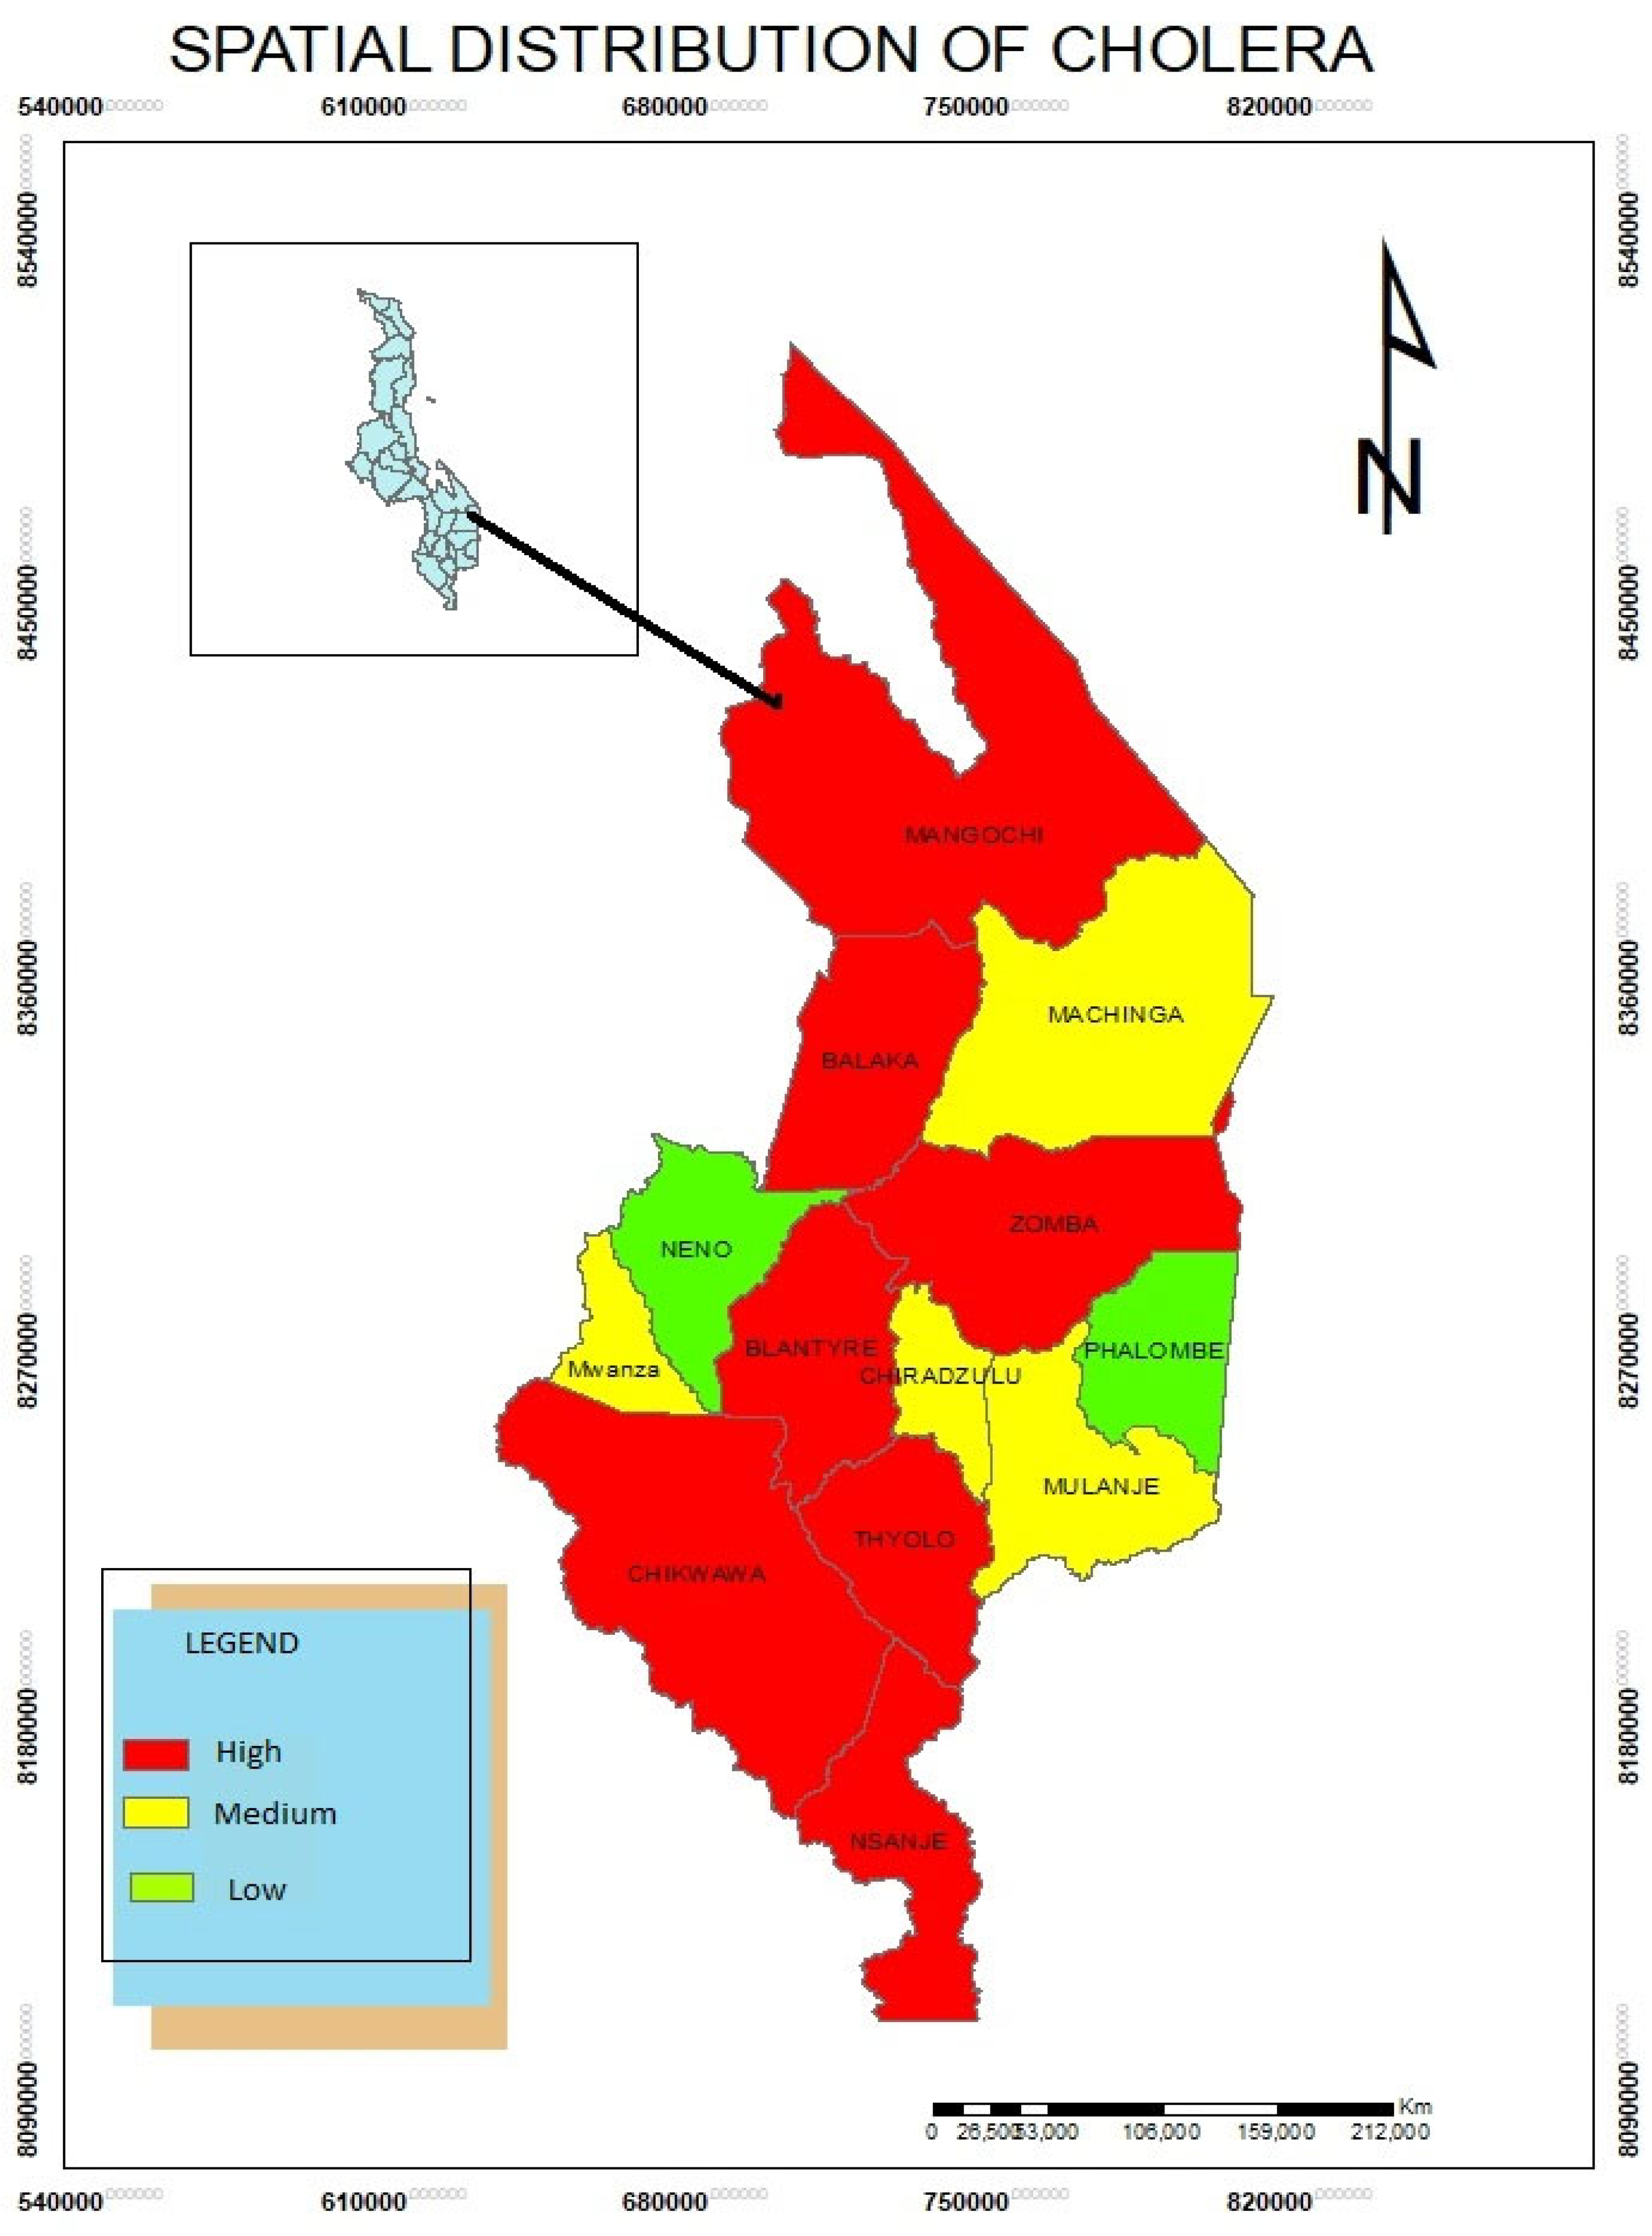
The study results show that cholera, a waterborne disease is also high in Mangochi, Balaka, Blantyre, Thyolo, Mulanje, Chikwawa and Nsanje districts. The study found that due to poor sanitation, cholera spreads rapidly in these areas.
Modelling the spatial diffusion of Diseases
Health practitioners can utilize GIS software to anticipate the geographical location and spread of health conditions. Knowledge on how and where infectious diseases spread requires an understanding of the spatial patterns of contacts between infected and vulnerable individuals. The movement of events, people, products, ideas, inventions, and infections over space and time is referred to as spatial diffusion. Diseases can sometimes spread in a contagious pattern, moving progressively outward from a site of origin to neighboring areas. Diseases travel across the urban hierarchy through hierarchical diffusion, beginning in major cities and spreading over time to medium-sized cities before reaching in smaller cities and villages.
The transmission of illness via transportation or networks is referred to as network diffusion. Network diffusion, like the other forms of diffusion, reflects the geographical and social structure of human relationships. Through the use of agent-based modeling, the growing tendency in epidemic modeling is to focus on people rather than larger populations or nodes. To develop insights into populations and communities, agent-based models replicate individual behavior and interactions.
Discussion
The geographical inequalities of the aforementioned health problems in Malawi’s southern region were utilized to define clusters using kernel density estimation in the ArcGIS software. This tool was effective for detecting high-risk locations and visualizing disease transmission, which helped to formulate appropriate intervention priorities relating to the availability of health-care resources. This is also similar to study conducted by Murad and Khashoggi, (2020). The kernel density estimation method was used to represent the density of service providers as a continuous geographical variable, with areas of high access and of poor access (ibd).
The following procedure was used to establish the kernel model’s default search radius, commonly known as the bandwidth as also used by Murad and Khashogg (2020).
- i.
Determine the average center of the input points. If a population field other than 0 was
- ii.
chosen, the values in that field were used to weight this and any subsequent computations.
- iii.
For each location, the distance from the (weighted) mean center was computed.
- iv.
Then the (weighted) median of these distances (Dm) was found.
- v.
The (weighted) standard distance (SD) was then determined.
- vi.
To compute the bandwidth, the following formula was used:
Based on the preceding formula, n denotes the number of points if no population field is used or if a population field is given, and n denotes the sum of the population field values.
Many studies have stressed the relevance of employing kernel density estimation to detect disease risk regions and geographical inequities. Latif (2015), as quoted by Murad and Khashoggi, (2020) for example, employed Kernel density estimation to map a dengue epidemic in Selangor, Malaysia, in order to create a risk map. The goal of this strategy was to find hotspots. According to the findings, eight places might be designated as high-risk. Furthermore, Chaikaew, Tripathi, and Souris (2009) employed GIS-based spatial analysis to uncover patterns of diarrhea illness prevalence in Chiang Mai region, Northern Thailand. To show the geographical patterns of illness in the province, the investigation relied on a set of analytical and statistical tools such as quadrant analysis (QA), closest neighbor analysis (NNA), and spatial autocorrelation analysis (SAA).
Furthermore, kernel density estimation was utilized to identify diarrhea hotspots based on patient data collected at the village level and population censuses from 2001 to 2006. Hotspot maps based on kernel density estimation indicated cluster patterns as well as the geographic direction of illness prevalence. As a result, the strategy can help to establish a system for monitoring and preventing disease outbreaks.
The findings of the kernel density services for the specified kinds of diseases such as asthma and diabetes in the southern Malawi are shown in
Figure 4 and
Figure 5.
The use of Geographic Information Systems (GIS) in health care research has grown, and its applications have gotten increasingly complex. For example, GIS may be used to examine cancer incidence in a community exposed to airborne dioxins by exposure modeling. In order to examine the link between the environment and health, statistical tools and epidemiological approaches capable of extensive analysis and visualization must be developed. Nonetheless, current GIS technologies have aided in disease control and decision-making by effectively updating, mapping, and monitoring illness.
Furthermore, GIS can map illness transmission patterns and offer a representation of how diseases develop by modeling the environmental risk variables that cause the disease.
Based on practical evidences, the conventional technique of disease control is arduous, costly, and time-consuming. The fundamental causes of illnesses and sources of infection, on the other hand, can be established by using GIS techniques to map disease prevalence, density, and geographic distribution. For example, Srinath, Szonyi, Esteve-Gassent, Lupiani, Gautam, (2013) used GIS to evaluate and map illness distribution in the US state of Texas, as well as explore environmental variables that contribute to disease spread. They stressed in their study that there is a strong association between disease distribution and environmental variables, necessitating the creation of new spatial methodologies to improve epidemiological research (Murad and Khashoggi, 2020).
According to Geanuracos (2011), public health experts are progressively changing their focus away from disease etiology models that focus solely on individual risk factors and toward models that take into account the complex and strong influences of the socio-physical environment. Many diseases, such as sexually transmitted infections (STIs) and HIV/AIDS, have been seen to spread excessively inside endemic regions or cores. These neighborhoods are frequently marked by high degrees of racial segregation, poor socioeconomic position, and high rates of homicide and other criminal activity.
Epidemiology is founded on the investigation of disease clusters to determine whether such clusters require further investigation, whether they are likely to be chance occurrences, or whether they reflect a rational interpretation of the spatial distribution of the at-risk population (Murad and Khashoggi, 2020). Spatial clustering algorithms are exploratory tools that aid academics and policymakers in comprehending complicated geographical patterns. Knowing whether or not clusters exist and where they are situated is critical for health research and policy development. Responding to community concerns, on the other hand, targets just a subset of possible clusters and is likely to overlook clusters in groups with less political and economic clout (Murad and Khashoggi, 2020).
Spatial clustering analysis is an excellent tool in public health monitoring, especially when spatial clustering approaches are combined; this will certainly contribute to uncovering the sources and causes of health concerns through more exploratory and investigative analyses (Murad and Khashoggi, 2020).
In the southern Malawi, GIS was used to describe and simulate the geographical clusters of five diseases namely diabetes, hypertension, cholera, malaria and asthma. The kernel model and the Getis-Ord Gi* statistic model was used to accomplish this.
Conclusions
GIS technology has been used to map many diseases in the public health sector. GIS technology advancements have aided in the improvement of healthcare by allowing for disease mapping and clustering, the detection of disease transmission patterns, the identification of the geographical and temporal distribution of infection vectors, and the management and monitoring of infectious diseases. Diabetes, hypertension, malaria, cholera and asthma were chosen for examination in this study in the southern region districts of Malawi. Data about these disorders was gathered from health centers data and DHS. The locations of clusters of the selected diseases were defined using GIS-based clustering methods, including kernel and Getis-Ord Gi* statistic models. The findings demonstrate separate clusters for each disease, which will help Malawi’s southern region health practitioners optimize the availability of health services in the resultant cluster locations.
Acknowledgments
I would like to thank the University of Livingstonia for financial support.
Conflict of Interest
The authors have no conflict of interest.
Abbreviations and Acronyms
GIS: Geographical Information Systems.
References
- American Hospital Association (2014). Mapping Medicare Disparities. 2018. Available online: and analytics tools for infectious disease epidemiology: A systematic review. J. Biomed. Inform., 51, 287–298.
- Braga, M.; Cislaghi, C.; Luppi, G.; Tasco, C. A (2014). Multipurpose, interactive mortality atlas care facilities in Jeddah City, Saudi. Geospat. Health, 8, 661–669.
- Carnes, A.; Ogneva-Himmelberger, Y. (2018). Temporal variations in the distribution of west And geographical information system. In Proceedings of the 2nd International asthma and associated factors in Saudi Arabia: A systematic review and meta-analysis. Biomed Res. Int., 9.
- Carroll, L.N.; Au, A.P.; Detwiler, L.T.; Fu, T.; Painter, I.S.; Abernethy, N.F. Visualization.
- Chaikaew, N.; Tripathi, N.; Souris, M (2014). Exploring spatial patterns and hotspots of diarrhea cholera mapping and analysis towards a local scale predictive modelling. IOP Conf. Ser. Earth Environ. Sci.
- Dong, W.; Yang, K.; Xu, Q.; Liu, L.; Chen, J. Spatio-temporal pattern analysis for Eds.; Tylor and Francis: Abingdon, UK, 1998; pp. 179–189.
- Eryando, T.; Susanna, D.; Pratiwi, D.; Nugraha, F (2020). Standard deviational ellipse (SDE) ESRI. GIS for Public Health Today and Tomorrow. 2020. Available online:.
- Esri. How Directional Distribution Standard Deviational Ellipse Works. 2020. Available Esri. How Hot Spot Analysis (Getis-Ord Gi*) Works. 2020. Available online: evaluation of the spread of human infections with avian influenza A(H7N9) virus in China, 2013–2014. BMC Infect. Dis. 2017, 17, 704.
- Fletcher-Lartey, S.M.; Caprarelli, G. Application of GIS technology in public health: for the prediction, prevention, and control of vector-borne diseases. Annu. Rev. Entomol. 2011, 56, 41–61.
- Gatrell, A.; Senior, M. Health and health care application. In Geographical Information .
- Geanuracos, C. Use of geographic information systems for planning HIV prevention.
- Geraghty, E. Why Health is so Spatial. 2016. Available online:.
- GISGeography. The Remarkable History of GIS. 2015. Available online: Handb. Stat. 2000, 18, 357–396.
- Hassan AN, Beck LR, Dister S. Prediction of villages at risk for filariasis transmission in Health Inform. 2013, 5.
- Hussain, S.; Farhan, S.; Alnasser, S. Time trends and regional variation in prevalence of in Chiang Mai, Thailand. Int. J. Health Geogr. 2009, 8, 36.
-
Indian J. Med Res.2012, 136, 776–782. information system-based multicriteria evaluation to map areas at risk for Rift Valley fever vector-borne transmission in Italy. Transboundary and Emerging Diseases. 2013;60(Suppl 2):14-23 information systems. Ann. Epidemiol.2016, 27, 1–9.
- information systems: A tool to map and analyze disease spread. Online J. Public .
- interventions for high-risk youths. Am. J. Public Health 2011, 97, 1974–1981.
- Kirby, R.; Delmelle, E.; Eberth, J. Advances in spatial epidemiology and geographic.
- Koch, T. Cartographies of Disease: Maps, Mapping, and Medicine; ESRI Press: Redlands, CA.
- Krieger, N. Place, space, and health: GIS and epidemiology. Epidemiology 2003, 14, 384.
- Latif,Z.A.;Mohamad,M.H.Mappingofdengueoutbreakdistributionusingspatialstatisticsa.
- Lawson, A.; Browne, W.; Vidal-Rodeiro, C. Disease Mapping with Winbugs and Mlwin; John.
- Lawson, A.; Cressie, N. Spatial statistical methods for environmental epidemiology.
- Lawson, A.; Kleinman, K. Spatial and Syndromic Surveillance for Public Health; John Wiley.
- Maheswaran, R.; Craglia, M. GIS in Public Health Practice; CRC Press: New York, NY.
- models for malaria surveillance, case study: Sukabumi district-Indonesia, in 2012. Malar. J. 2012, 11, P130.
- Malawi Project (2022). https://www.malawiproject.org/malawis-southern-region/.
- Murad, A. Defining health catchment areas in Jeddah city, Saudi Arabia: An example.
- Murad, A. Using geographical information systems for defining the accessibility to health.
- Murad, A. Using GIS for planning public general hospitals at Jeddah city. Environ. Des.
- Photis, Y.N. Disease and health care geographies: Mapping trends and patterns in a GIS.
- positional accuracy assesment of geospatial data. Bull. Geod. Sci. 2017, 23, 405–413.
- priority control in Ranchi district, Jharkhand.
- Rasam, A.; Ghazali, R.; Noor, A.; Mohd, W.; Hamid, J.; Bazlan, M.; Ahmad, N. Spatial.
- Santos, A.S.; Medeiros, N.G.; dos Santos, G.R.; Filho, J.L. Use of geostatistics on absolute.
- Saxena, R.; Nagpal, B.; Das, M.; Srivastava, A.; Gupta, S.; Kumar, A.; Jeyaseelan, A.; Baraik, V. A spatial statistical approach to analyze malaria situation at micro level for Sci. 2005, 3, 3–22.
- Sones, M. Reveal: Mapping and Tracking the Spread of Deadly Diseases. 2019. Available.
- Srinath, I.; Szonyi, B.; Esteve-Gassent, M.; Lupiani, B.; Gautam, R. Geographical Successes and challenges. Parasitology 2016, 143, 1–15.
-
System Principles and Application; Longley, P., Goodchild, M., Maguire, D., Rhind, D., Eds.; John Wiley & Sons: Chichester, UK, 1999; pp. 925–938.
- the Nile Delta using remote sensing and geographic information system technologies. Journal of the Egyptian Society of Parasitology. 1998;28(1):75-.
- Tran A, Ippoliti C, Balenghien T, Conte A, Gely M, Calistri P, et al. A geographical USA, 2004; pp. 32–34. Wiley & Sons: Chichester, UK, 2003.
|
Disclaimer/Publisher’s Note: The statements, opinions and data contained in all publications are solely those of the individual author(s) and contributor(s) and not of MDPI and/or the editor(s). MDPI and/or the editor(s) disclaim responsibility for any injury to people or property resulting from any ideas, methods, instructions or products referred to in the content. |
© 2024 by the authors. Licensee MDPI, Basel, Switzerland. This article is an open access article distributed under the terms and conditions of the Creative Commons Attribution (CC BY) license (http://creativecommons.org/licenses/by/4.0/).
