Preprint
Article

Genome-Wide Association Analysis Identifies Candidate Loci for the Callus Induction in Rice (Oryza sativa L.)

Altmetrics

Downloads

114

Views

83

Comments

0

A peer-reviewed article of this preprint also exists.

Submitted:

01 July 2024

Posted:

02 July 2024

You are already at the latest version

Alerts
Abstract
Callus induction (CI) is the critical trait for the transformation of desirable genes in plants. A genome-wide association study (GWAS) analysis was conducted on the rice germplasm of 110 diverse indica rice accessions. Three tissue culture media, including B5, MS, and N6, were used for CI in those rice panels. Seven quantitative trait loci (QTLs) on chromosomes 2, 6, 7, and 11 were found to confer a CI percentage in these three media. For the B5 medium, one QTL (qCI-B5-Chr6) was identified on the rice chromosome 6. For the MS medium, two QTLs were identified on the rice chromosomes 2 and 6 (qCI-MS-Chr2 and qCI-MS-Chr6, respectively). For the N6 medium, four QTLs were identified on the rice chromosomes 6, 7, and 11 (qCI-N6-Chr6.1, qCI-N6-Chr6.2, qCI-N6-Chr7, and qCI-N6-Chr11, respectively). Fifty-five genes were identified within the haplotype blocks corresponding to these QTLs. Thirty-one genes showed haplotypes associated with different CI in those media. The qCI-B5-Chr6 was located in the same region as the qCI-N6-Chr6.2. The caleosin-related family protein was identified in this region. Analysis of the gene-based haplotype reveals the association of this gene with different CI in both B5 and N6 media, suggesting that the gene may play a critical role in the CI mechanism. Moreover, several genes, including the beta-tubulin, the zinc finger proteins, the RNP-1 domain-containing protein, and the Lysophosphatidic acid acyltransferase, were associated with different CI in the N6 media. Results from this study provide insight into the potential QTLs and candidate genes for callus induction in rice that will fulfill the understanding of the physiological and biochemical processes involved in callus formation, which is an essential tool in the molecular breeding of rice.
Keywords: 
Subject: Biology and Life Sciences  -   Plant Sciences

1. Introduction

Tissue culture technology is integral to plant genomic research, genetic engineering, genome editing, and breeding. Tissue culture systems for japonica and indica rice combined with Agrobacterium transformation allow functional genomics studies and the generation of new rice cultivars through genetic engineering and genome editing [1,2]. The formation of a callus, a disorganized amorphic mass of rapidly dividing cells, is an essential step in plant transformation and greatly influences transformation and regeneration efficiency. Callus can be produced from seeds and other plant organs such as shoots, roots, and leaves [3] and regenerated into whole plants under suitable stimuli [4]. Molecular mechanisms of callus formation included induction and repression. The induction was auxin induction, cytokinin induction, wound induction, and the reacquisition of embryonic or meristematic fate. The repression included inhibiting cell wall biogenesis and several epigenetic mechanisms [5]. Auxin and cytokinin are necessary for callus formation. Depending on circumstances, they could function in synergistic, additive, or antagonistic modes. 2,4-Dichlorophenoxyacetic acid (2,4-D) and 1-Naphthaleneacetic acid (NAA) are forms of auxin, while benzyl adenine (BA), zeatin, or kinetin are forms of cytokinin commonly used for callus induction and plant regeneration [5]. There were studies of rice callus induction from mature seeds from japonica [6,7,8] and indica [9,10]. The concentration of 2,4-D, NAA, BA, carbon sources, and basal media were compared for rice callus induction and regeneration optimization in japonica and indica rice [11,12].
Identifying QTLs/genes associated with callus induction could elevate the callus induction rate and reduce the needed time period. Wu et al. (2022) showed that Pseudo-Response Regulators (PRR) located in chromosome 3 regulated rice callus formation [13]. This gene reportedly involved circadian clock components [14]. Taguchi-Shiobara et al. (2006) identified two QTLs, qIc4 and qIc9, associated with induced callus color, and the QTL qSc4 related to the color of subcultured callus in BC1F3 lines derived from japonica Koshihikari and indica Kasalath rice [15]. Thirty quantitative trait loci associated with callus browning, the common phenomenon causing lower regeneration, poor multiplication, and death of callus, were mapped into chromosomes 1, 2, 3, 4, 8, 9, and 12 in Dongxiang wild rice [16]. A QTL, qcir9.1, associated with callus induction rate in anther culture was identified in chromosome 9 with Os090551600 encoding a high-mobility group (HMG) protein, most likely a candidate gene [17]. Guo et al. (2023) investigated gene expression changes during rice callus formation [18]. Genes related to auxin signaling pathways, such as auxin signaling F-box protein (AFR2), leaf cotyledon 1 (LEC1), and wuschel-related homeobox protein (WOX), were highly expressed during scutellum-derived callus development.
Genome-wide association studies (GWAS) using a massive number of single nucleotide polymorphisms (SNPs) are popularly used to identify genomic regions associated with various plant traits. GWAS analysis in 510 rice accessions revealed 21 associated loci in rice callus induction QTLs, such as callus weight, color, and size [19]. Genes within these loci included CRL1, OsBMM1, OsSET1, and OsIAA10. The functions of OsIAA10 were auxin perception and activation of downstream genes, such as CRL1, causing callus formation. GWAS analysis and functional annotation were used to identify chromatin-enriched noncoding RNAs (cheRNAs) in rice callus that functioned in chromatin remodeling. The loss of function of two cheRNAs resulted in damage of cell dedifferentiation and plant regeneration [20].
This study performed a GWAS analysis on a diverse Thai rice varieties germplasm panel to identify genomic regions associated with callus induction in three tissue culture media. Additionally, loci and candidate genes conferring callus induction were proposed.

2. Results

2.1. Callus Induction in the Rice Germplasm Collection

We assessed the callus induction (CI) trait of 110 rice accessions in three tissue culture media: B5, MS, and N6. For each tissue culture media, the distribution of CI percentage among the 110 accessions indicated that the majority of rice varieties were 20%, 40%, and 20% for B5, MS, and N6 media, respectively (Figure 1). Among these rice accessions, two rice varieties, including Niaw Ubon 1 and Chum Phae 60, showed high CI (≥ 60 %CI) to all three media (Niaw Ubon 1 = 77.8, 86.7, 60.0 and Chum Phae = 62.2, 73.3, 60.0 for B5, MS, and N6 respectively) (Supplementary Table S1). One rice variety, Kiaw, showed a high CI in B5 (64.4) and MS (66.7) media, and one variety, Luang Thong, showed a high CI in MS (73.3) and N6 (64.4) media. In addition, JHN-5 showed the highest CI in the N6 media (91.1).
When all 110 rice varieties were grown on three types of solid media (N6, B5, and MS), supplemented with the hormone 2,4-D at a concentration of 2 mg/l, and cultured in the dark at 25°C for three weeks, all varieties successfully developed callus on the different media formulations. On N6 solid medium, 38 rice strains exhibited a callus induction percentage greater than 50%. Jao Hom Nin (JHN) showed the highest callus induction at 97.78%±3.85, followed by Phitsanulok 60-1 (84.44%±3.85), HomMali801 (77.78%±10.18), and Homnaypol (76.67%±4.71).
On the B5 solid medium, 27 strains demonstrated a high percentage of callus formation, with the induction rates ranging between 50% and 78%, though these differences were not statistically significant. For the rice strains grown on MS solid medium, 48 strains exhibited callus percentages ranging from 50% to 89% without statistically significant differences.

2.2. Genotype Data and Analysis of Population Structure, Relative Kinship, and the Linkage Disequilibrium (LD)

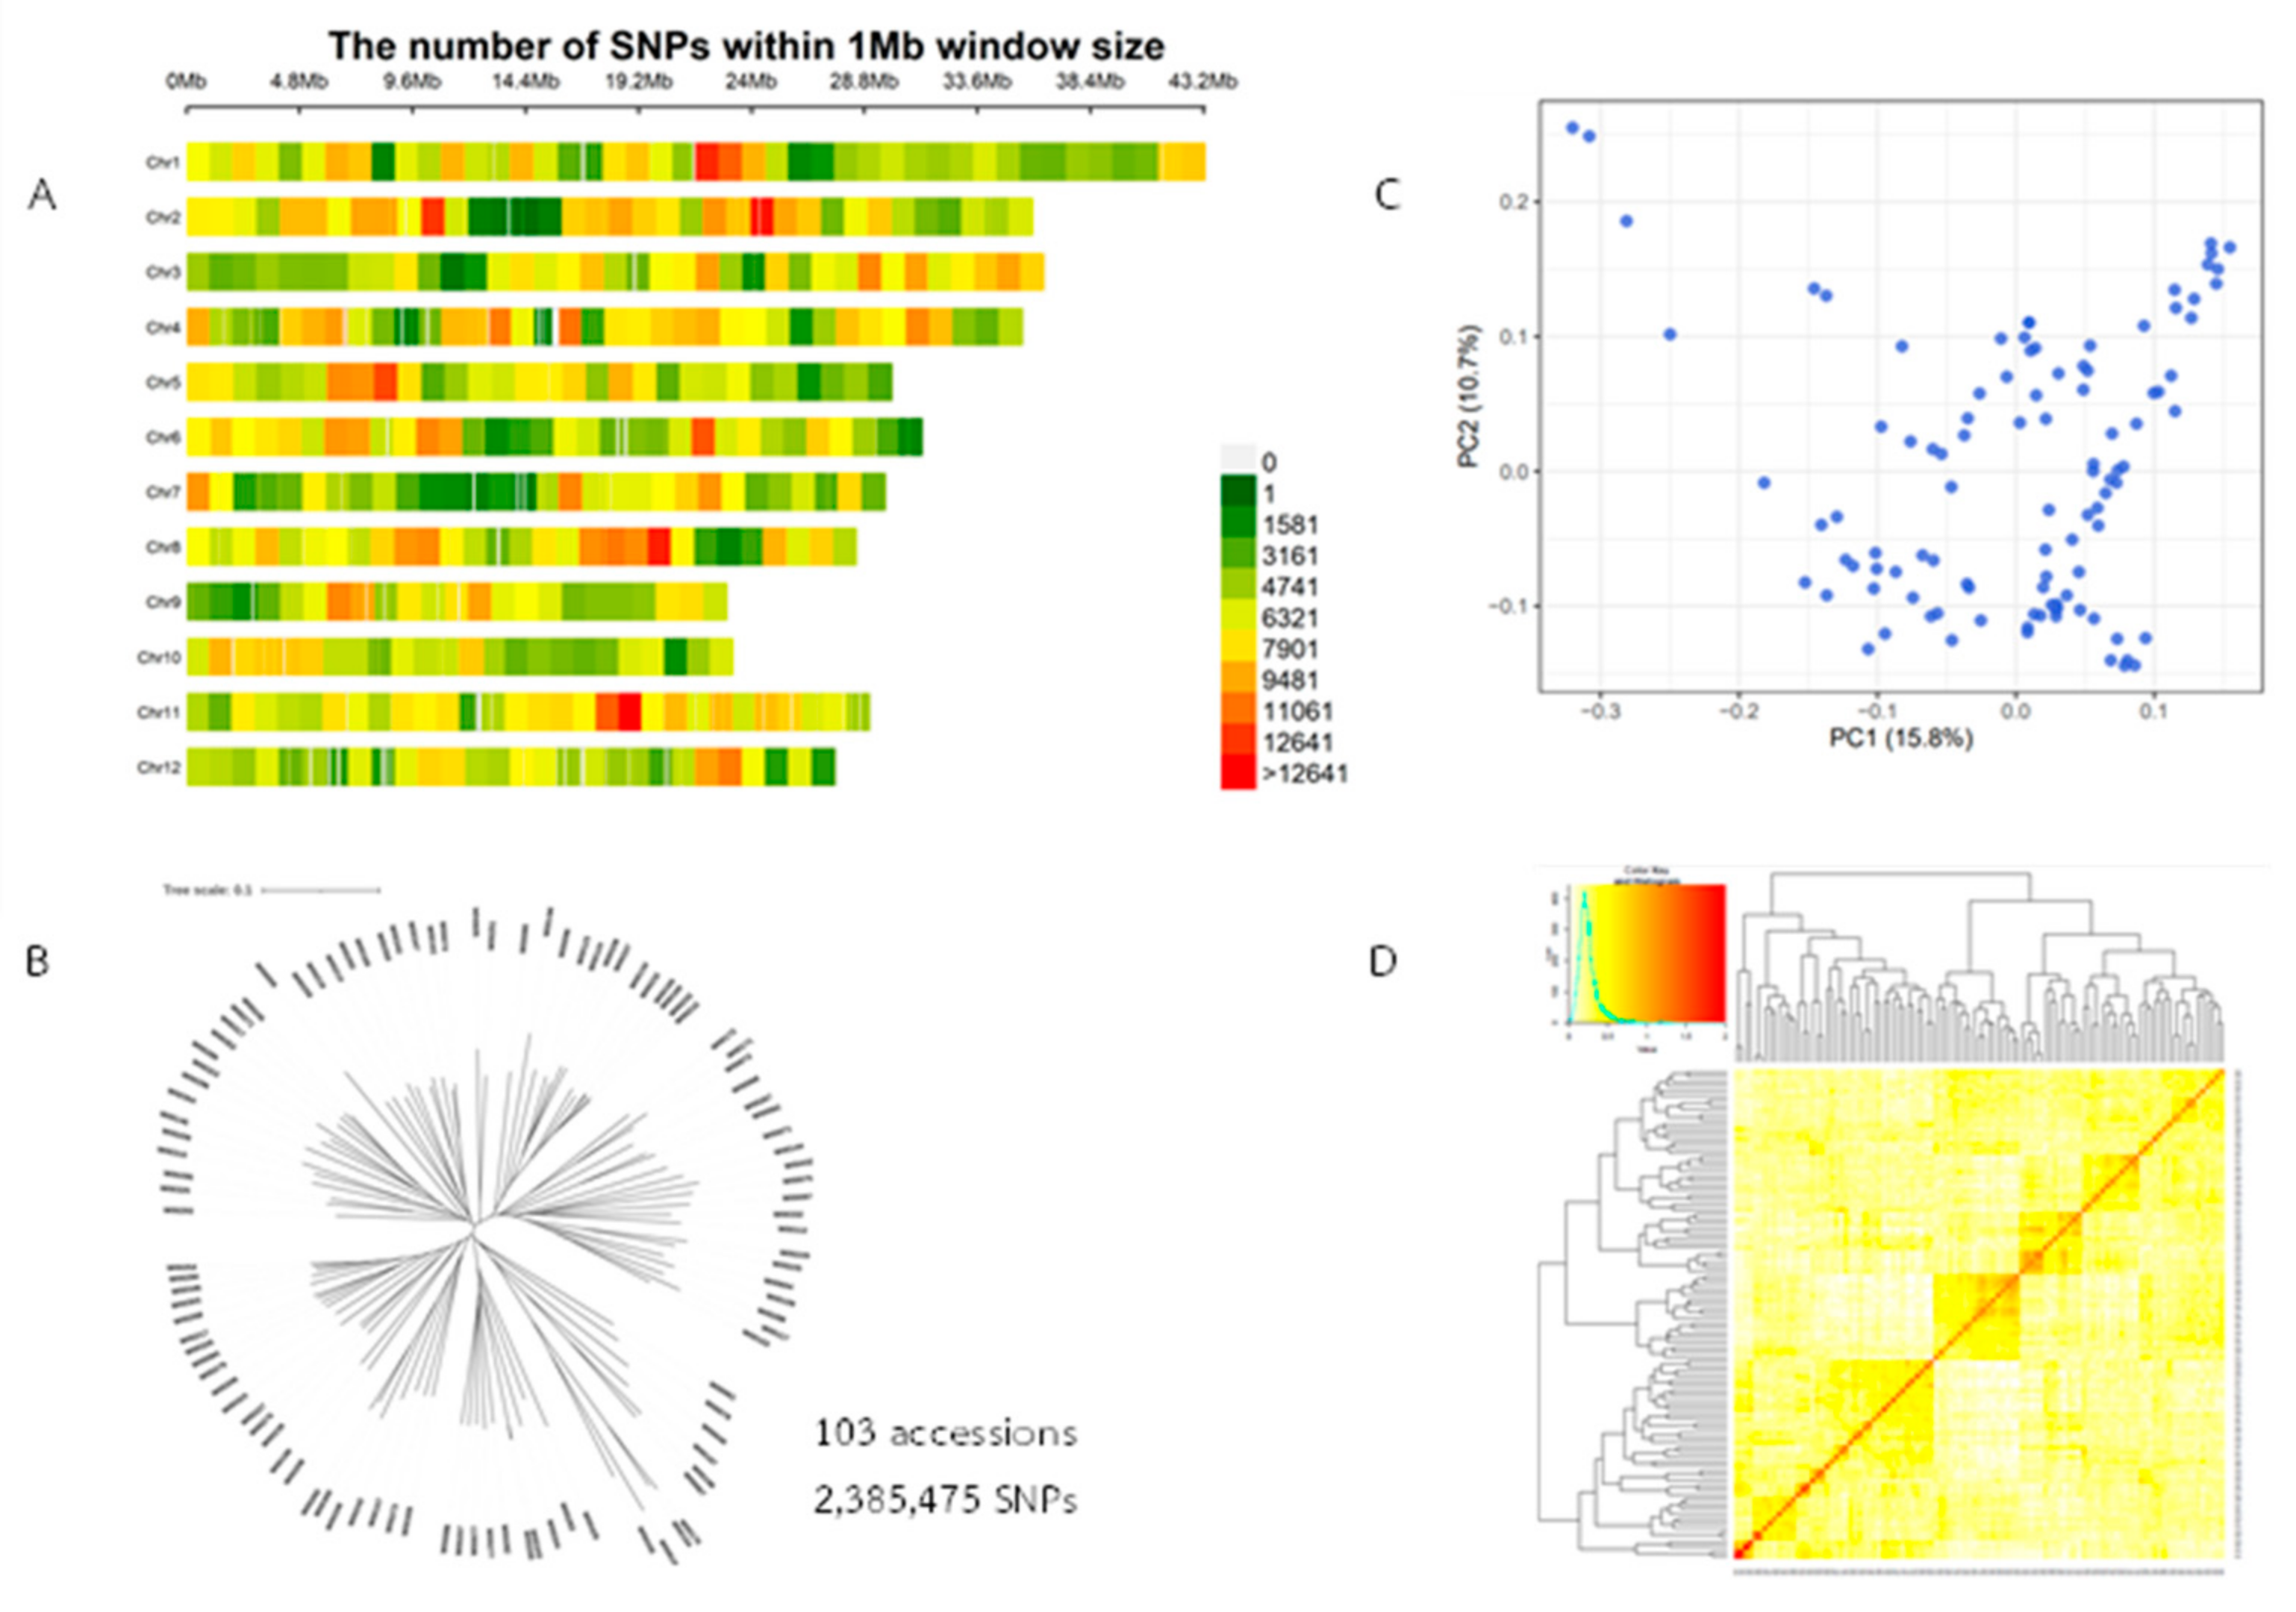
The study used 2,385,475 single-nucleotide polymorphisms (SNPs) as genotype data, averaging 198,790 SNPs per chromosome. The SNP density on each chromosome is shown in Figure 2. All SNPs had a minor allele frequency (MAF) greater than 0.05. To investigate the population structure and cryptic relationships among the 110 rice accessions, a kinship matrix and Principal Component Analysis (PCA) were employed. The results of the PCA and kinship analyses revealed some degree of population structure within this rice diversity panel. The majority of rice accessions in the panel, which included landraces and improved varieties from Thailand, could be classified into a large group.
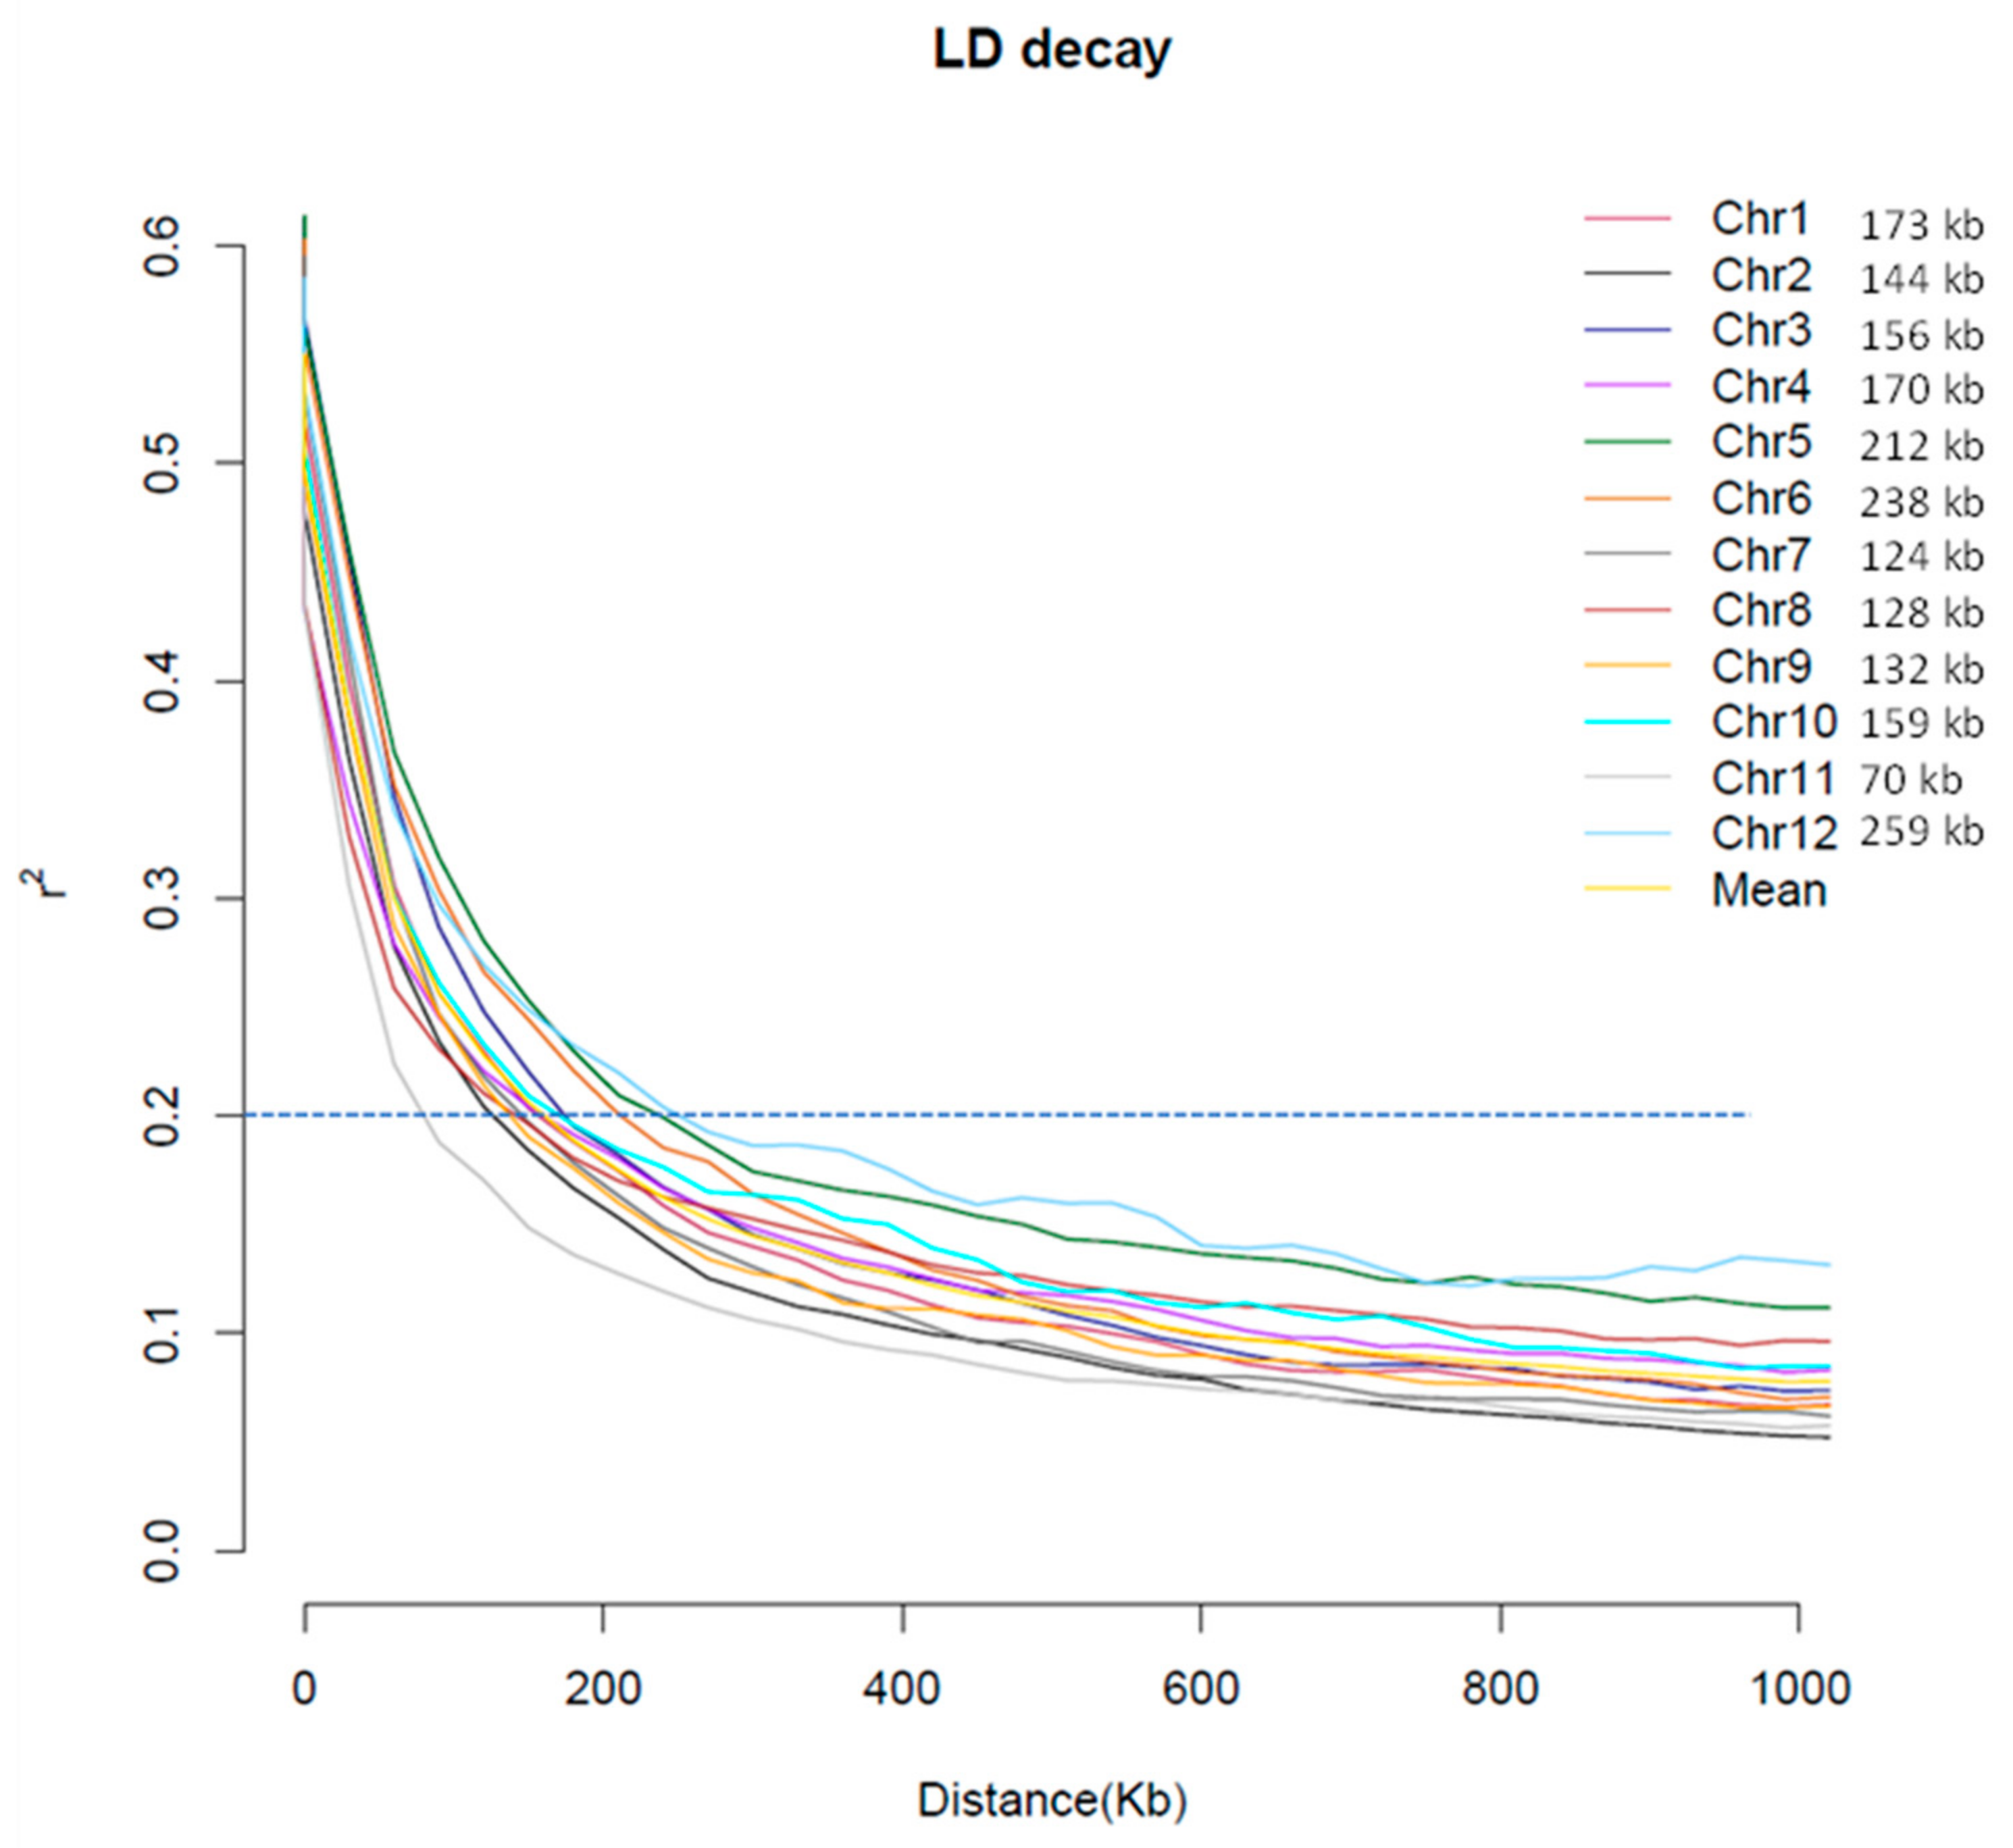
Linkage disequilibrium (LD) decay analyses were conducted to evaluate chromosomal signatures of recombination patterns (Figure 3). The mean LD decay values within intra-chromosomal distance bins dropped below a threshold mean r2 value of 0.2 between 70 and 259 Kb across all 12 chromosomes, with an average of 163.75 kb. The LD decay signatures were similar for all chromosomes except for chromosome 11, which exhibited a markedly lower threshold crossover point at 70 Kb.

2.3. Identification of the QTLs Associated with Callus Induction by GWAS

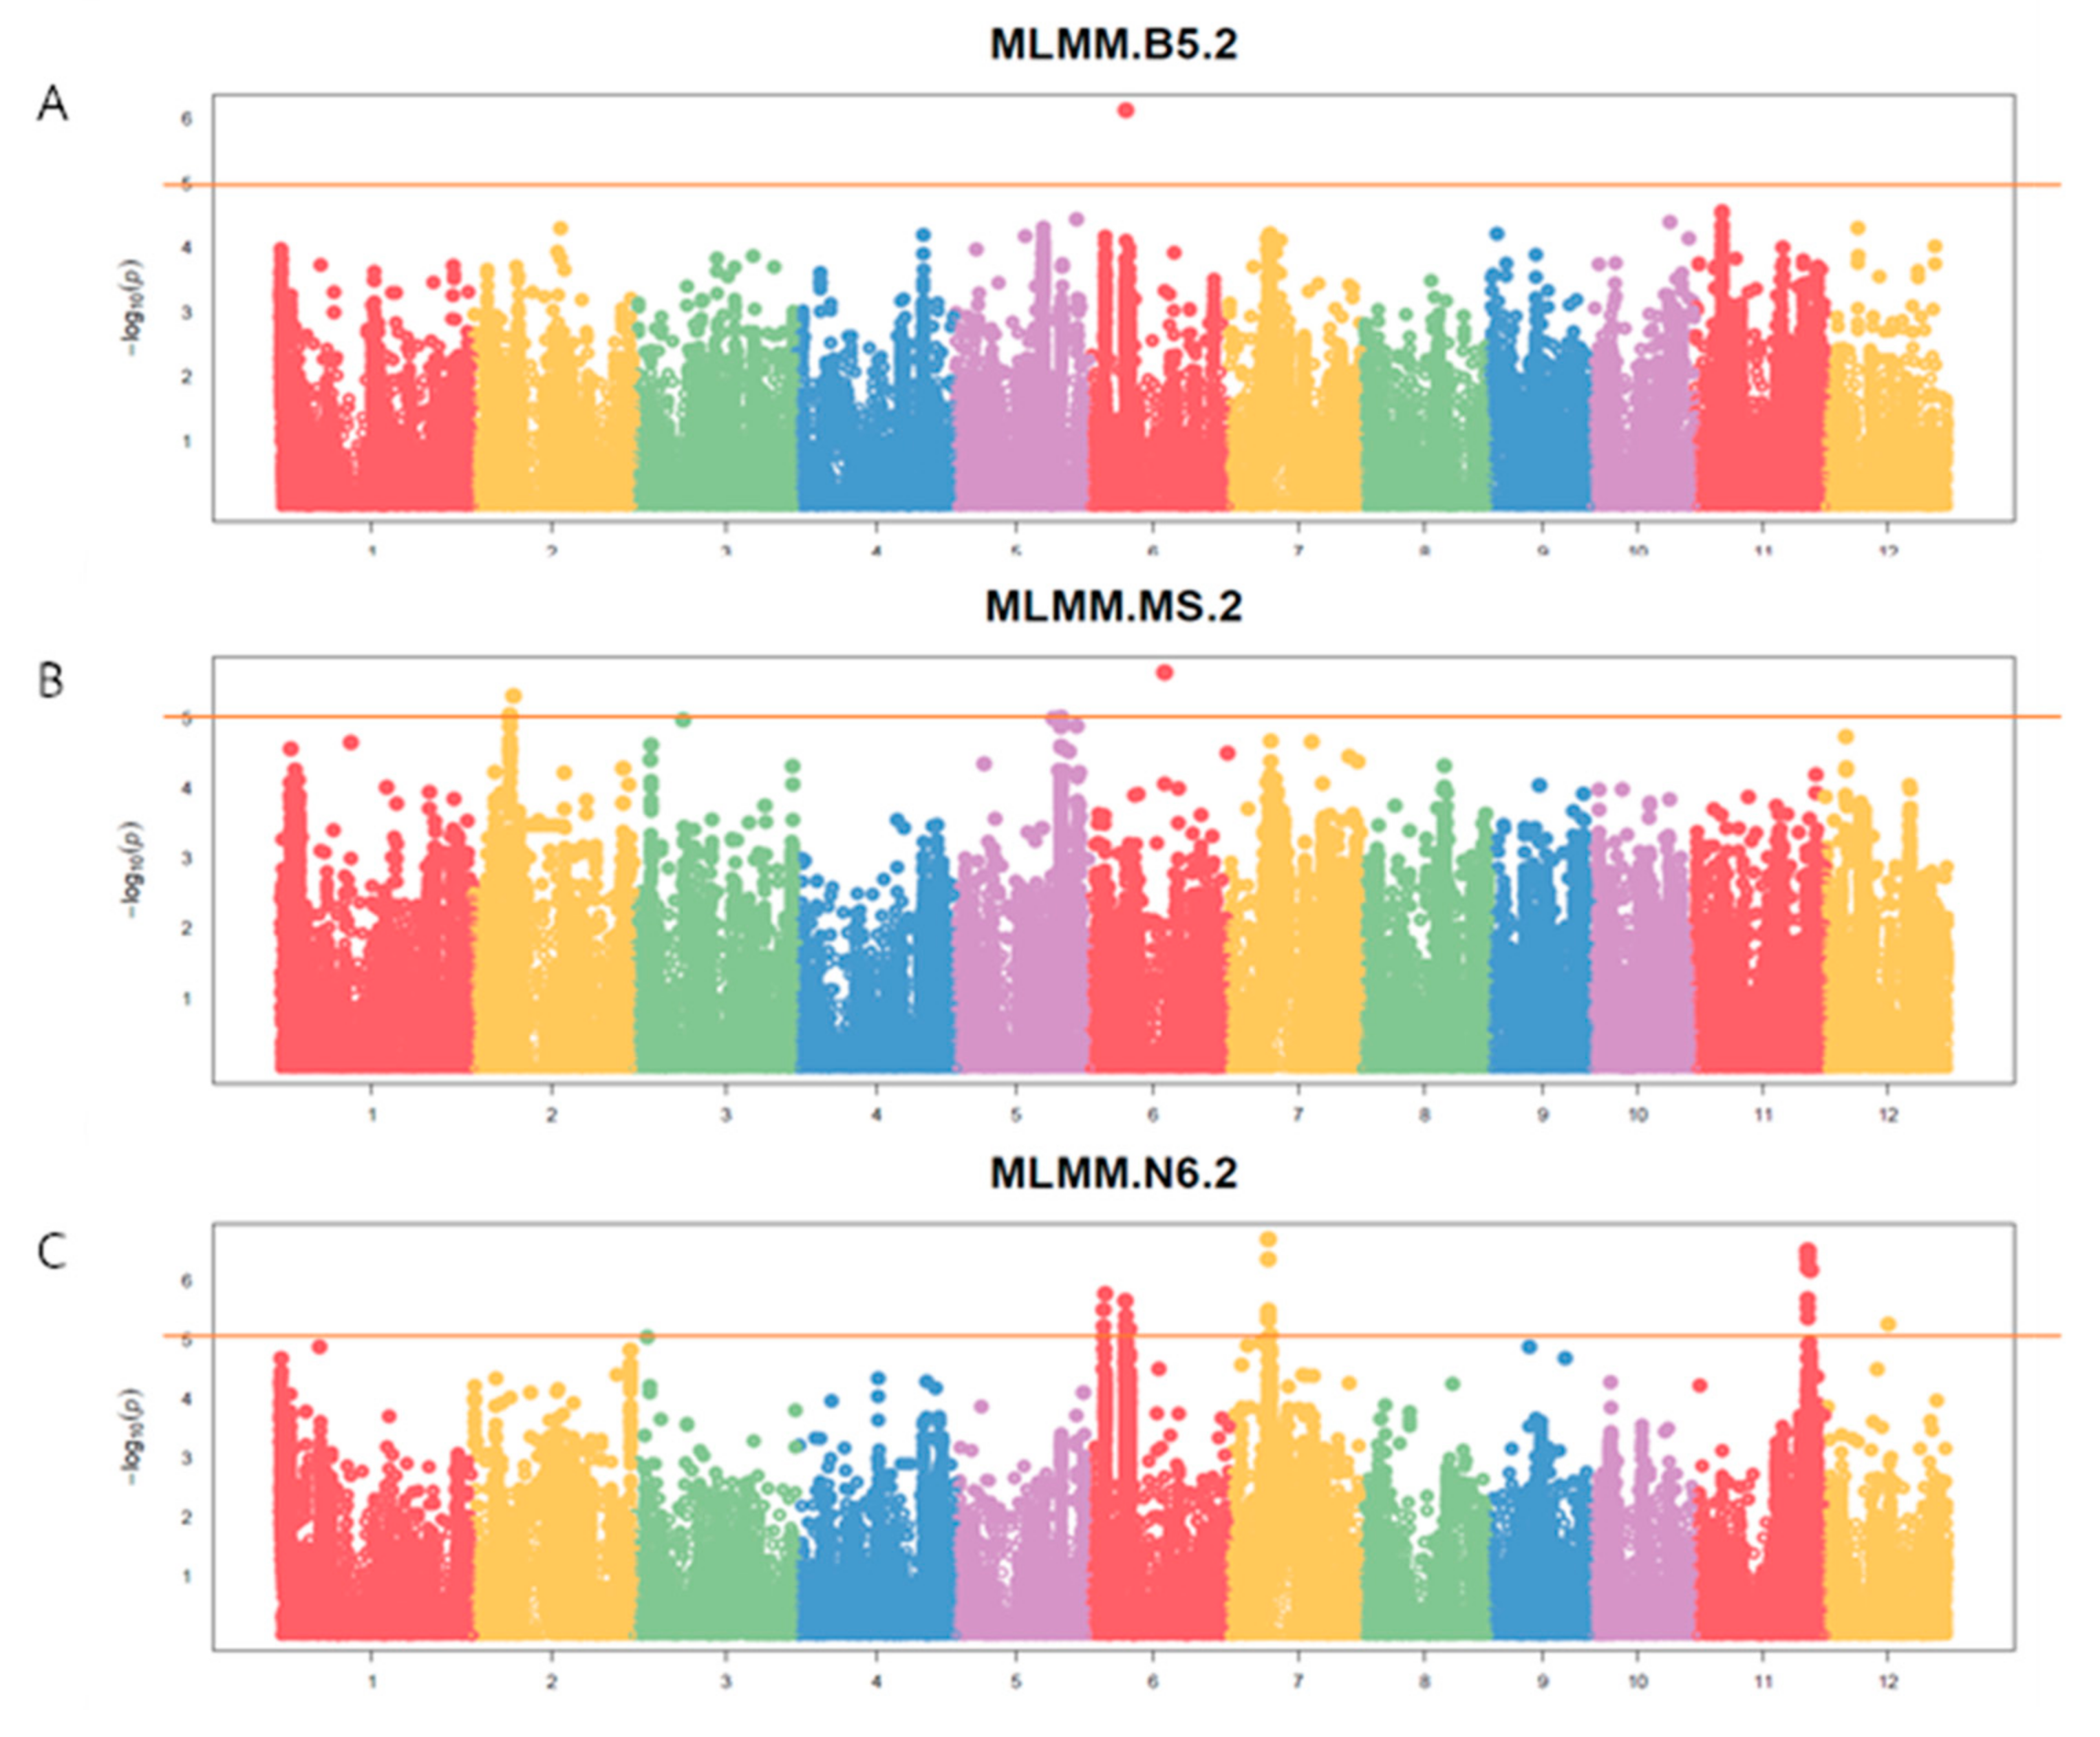
We performed a genome-wide association analysis (GWAS) on the 110 rice accessions to identify genomic regions associated with callus induction (CI) in rice. The GWAS analysis, featuring a multi-locus mixed-model analysis (MLMM), identified seven regions associated with CI traits (Figure 4). These regions were located on chromosomes 2, 6, 7, and 11. Regions containing adjacent associated SNPs within an LD block (r2 > 0.2) were combined, resulting in 7 final QTLs: qCI-B5-Chr6, qCI-MS-Chr2, qCI-MS-Chr6, qCI-N6-Chr6.1, qCI-N6-Chr6.2, qCI-N6-Chr7, and qCI-N6-Chr11 (Table 1)

2.4. Haplotype Block Analysis and Candidate Gene Identification

Candidate genes within each QTL were identified using adjusted LD blocks, inferred significant variants, and gene-based haplotype analysis. The number of candidate genes differentiating between phenotypes varied from 0 to 16 per QTL (Table 2). The highest number of candidate genes was identified in the B5 medium, whereas none were found in the MS medium. Notably, the gene Os06g0254600, which encodes a Caleosin-related family protein, was identified in the B5 and N6 media, corresponding to qCI-B5-Chr6 and qCI-N6-Chr6.2, respectively.
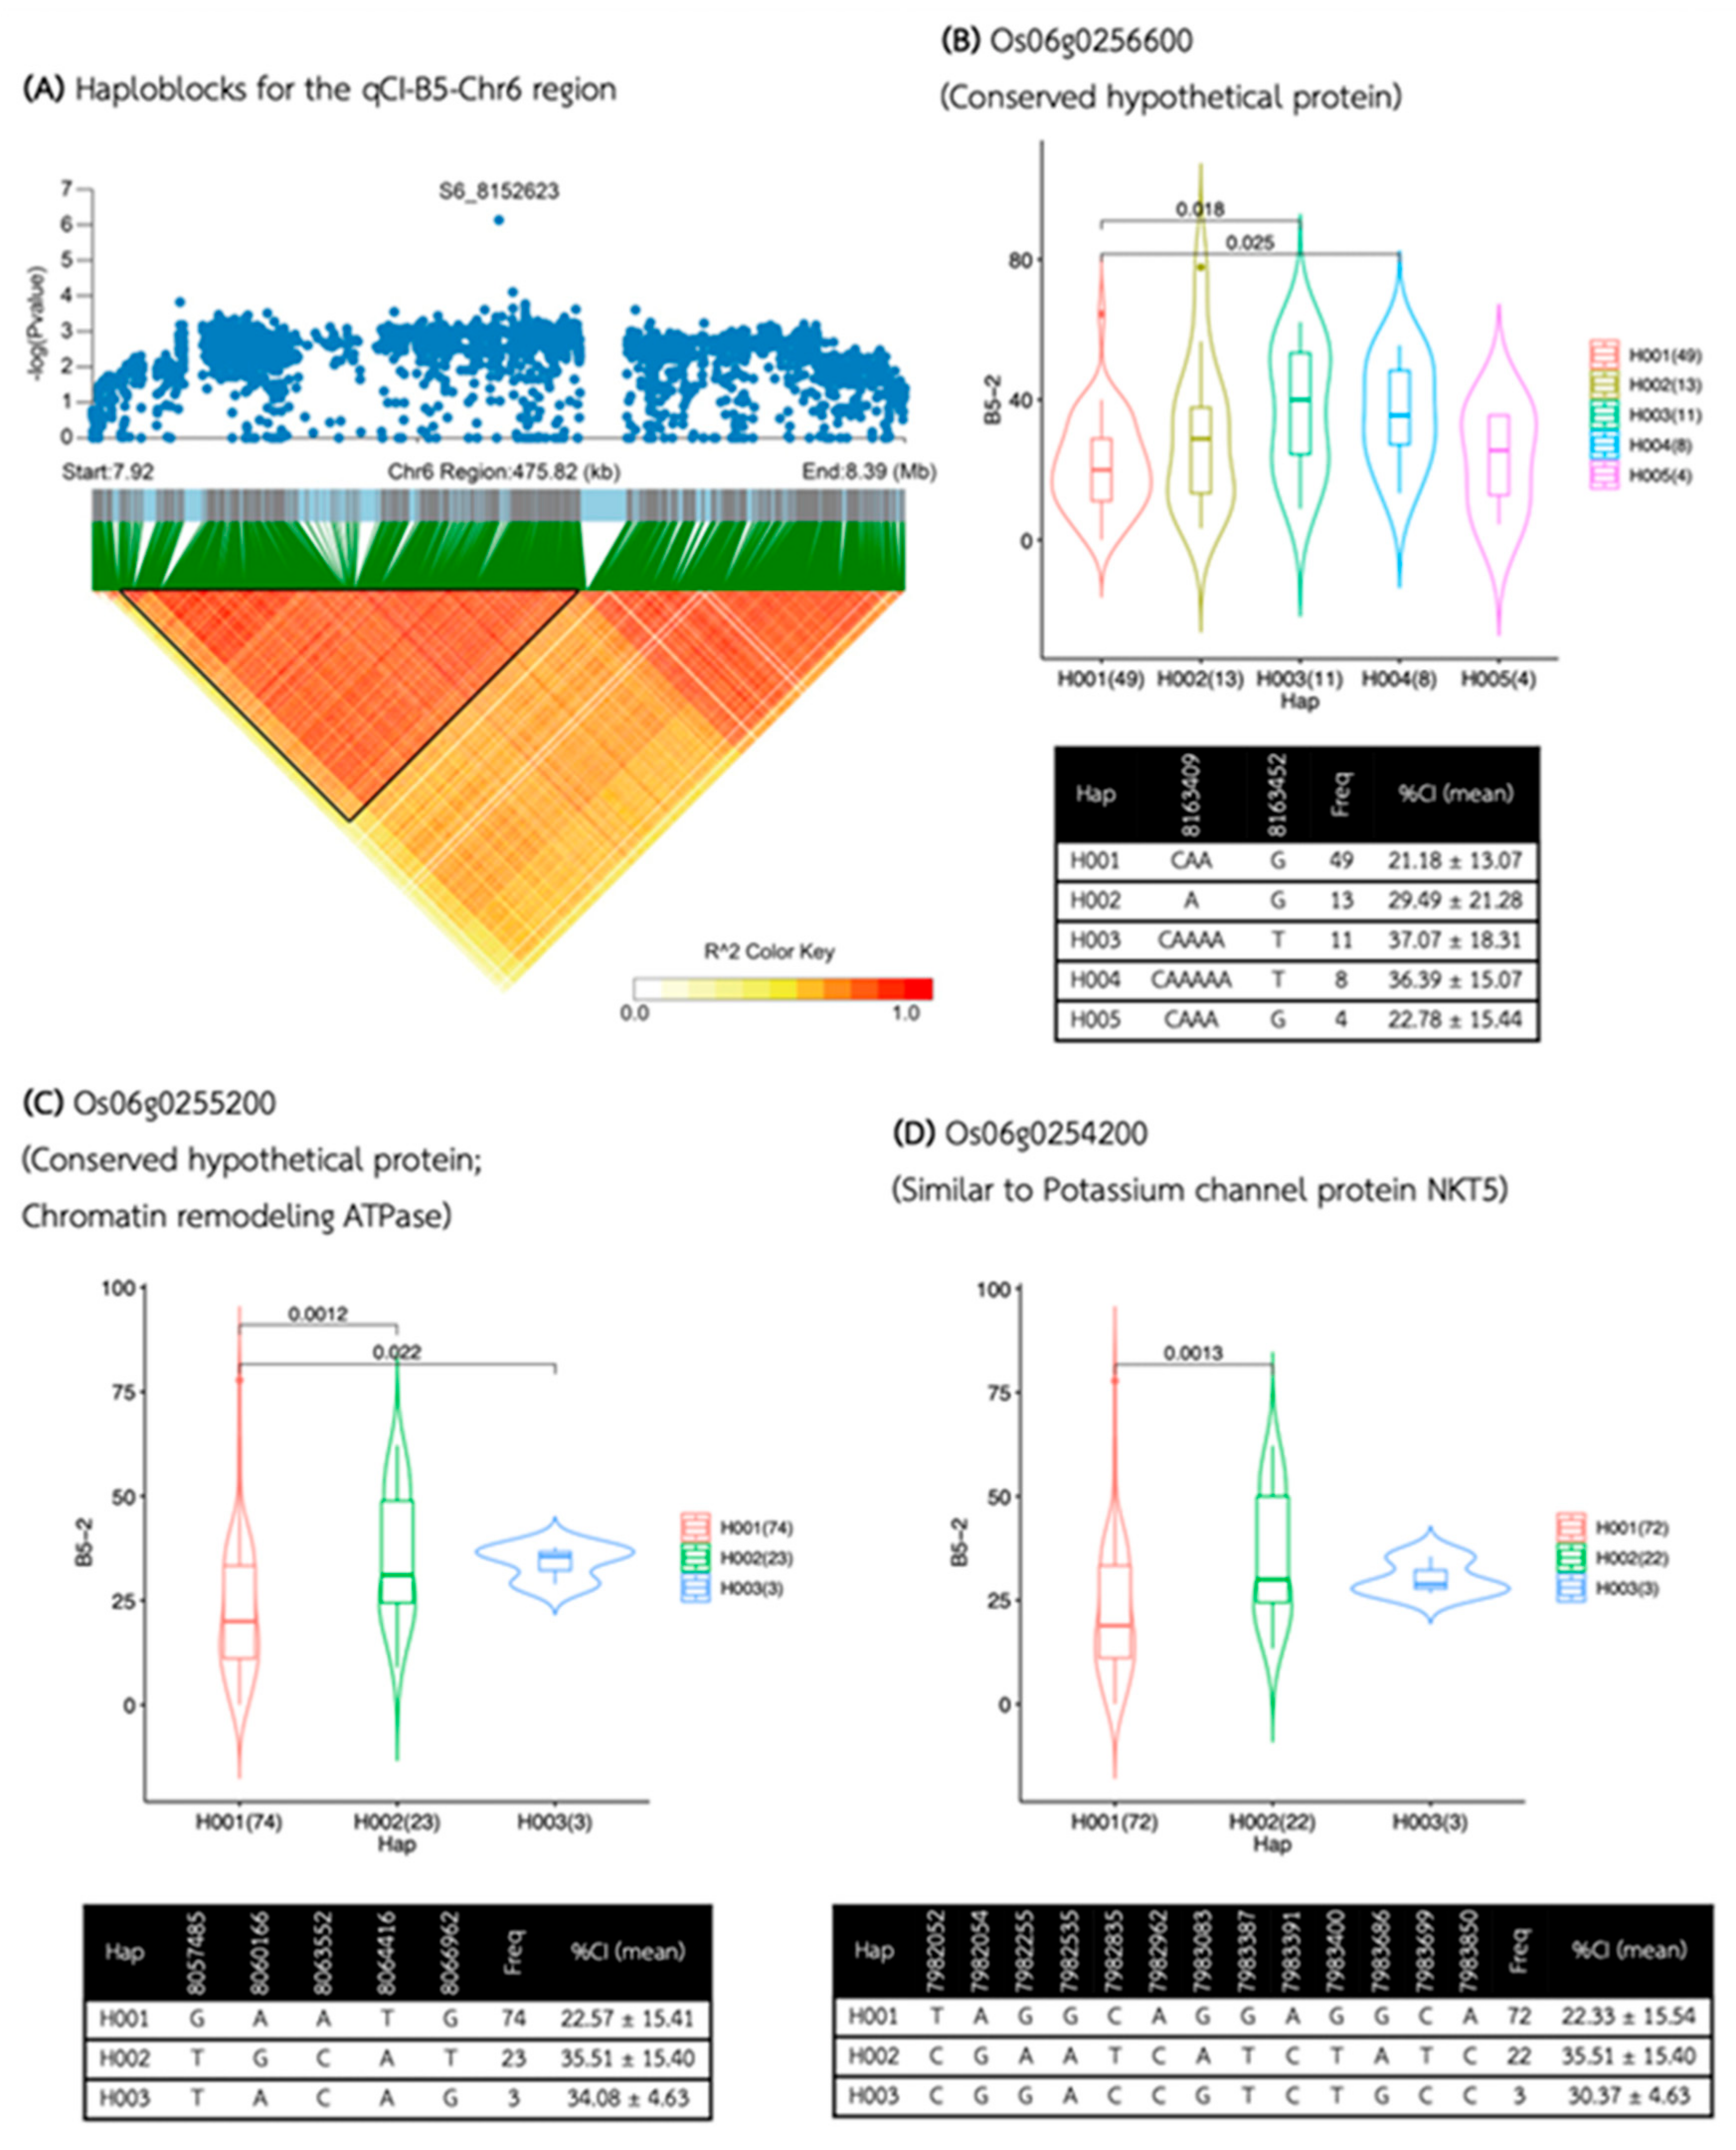
For the qCI-B5-Chr6 region, five haplotype blocks were defined within the 475-kb flanking region spanning from 7.915 to 8.390 Mb, based on analysis of 1,390 SNPs. Within this region, 28 genes were annotated (Supplementary Table S2), and sixteen genes were specifically identified within the candidate haploblock located between 7.934 and 8.198 Mb (Figure 5A, Table 2).
Using gene-based haplotype analysis, all sixteen genes were found to contain haplotypes associated with different callus induction (CI) levels. Notably, the gene Os06g0256600 (Figure 5B) exhibited the most significant association, with two haplotypes, Hap I (n = 49) and Hap V (n = 4), associated with lower CI (averaging 21.18% and 22.78% callus induction, respectively). In comparison, Hap III (n = 11) and Hap IV (n = 8) were associated with higher CI (averaging 37.07% and 36.39% callus induction, respectively). The gene was annotated as a conserved hypothetical protein.
Genes Os06g0255200 and Os06g0254200 each contained three haplotypes, showing a similar pattern in their association with CI (Figure 5C and 5D). Hap I for both genes was consistently associated with lower CI (averaging 22.57% and 22.33% callus induction, respectively), while Hap II was associated with higher CI (averaging 35.51% callus induction for both genes). Os06g0255200 is annotated as a conserved hypothetical protein involved in chromatin remodeling ATPase function, potentially influencing embryo development. Meanwhile, Os06g0254200 was annotated similarly to Potassium channel protein NKT5. Interestingly, two annotated Caleosin-related family proteins, Os06g0254300 and Os06g0254600, known for their role in lipid degradation during seed germination, were identified to have haplotypes associated with CI (data not shown).
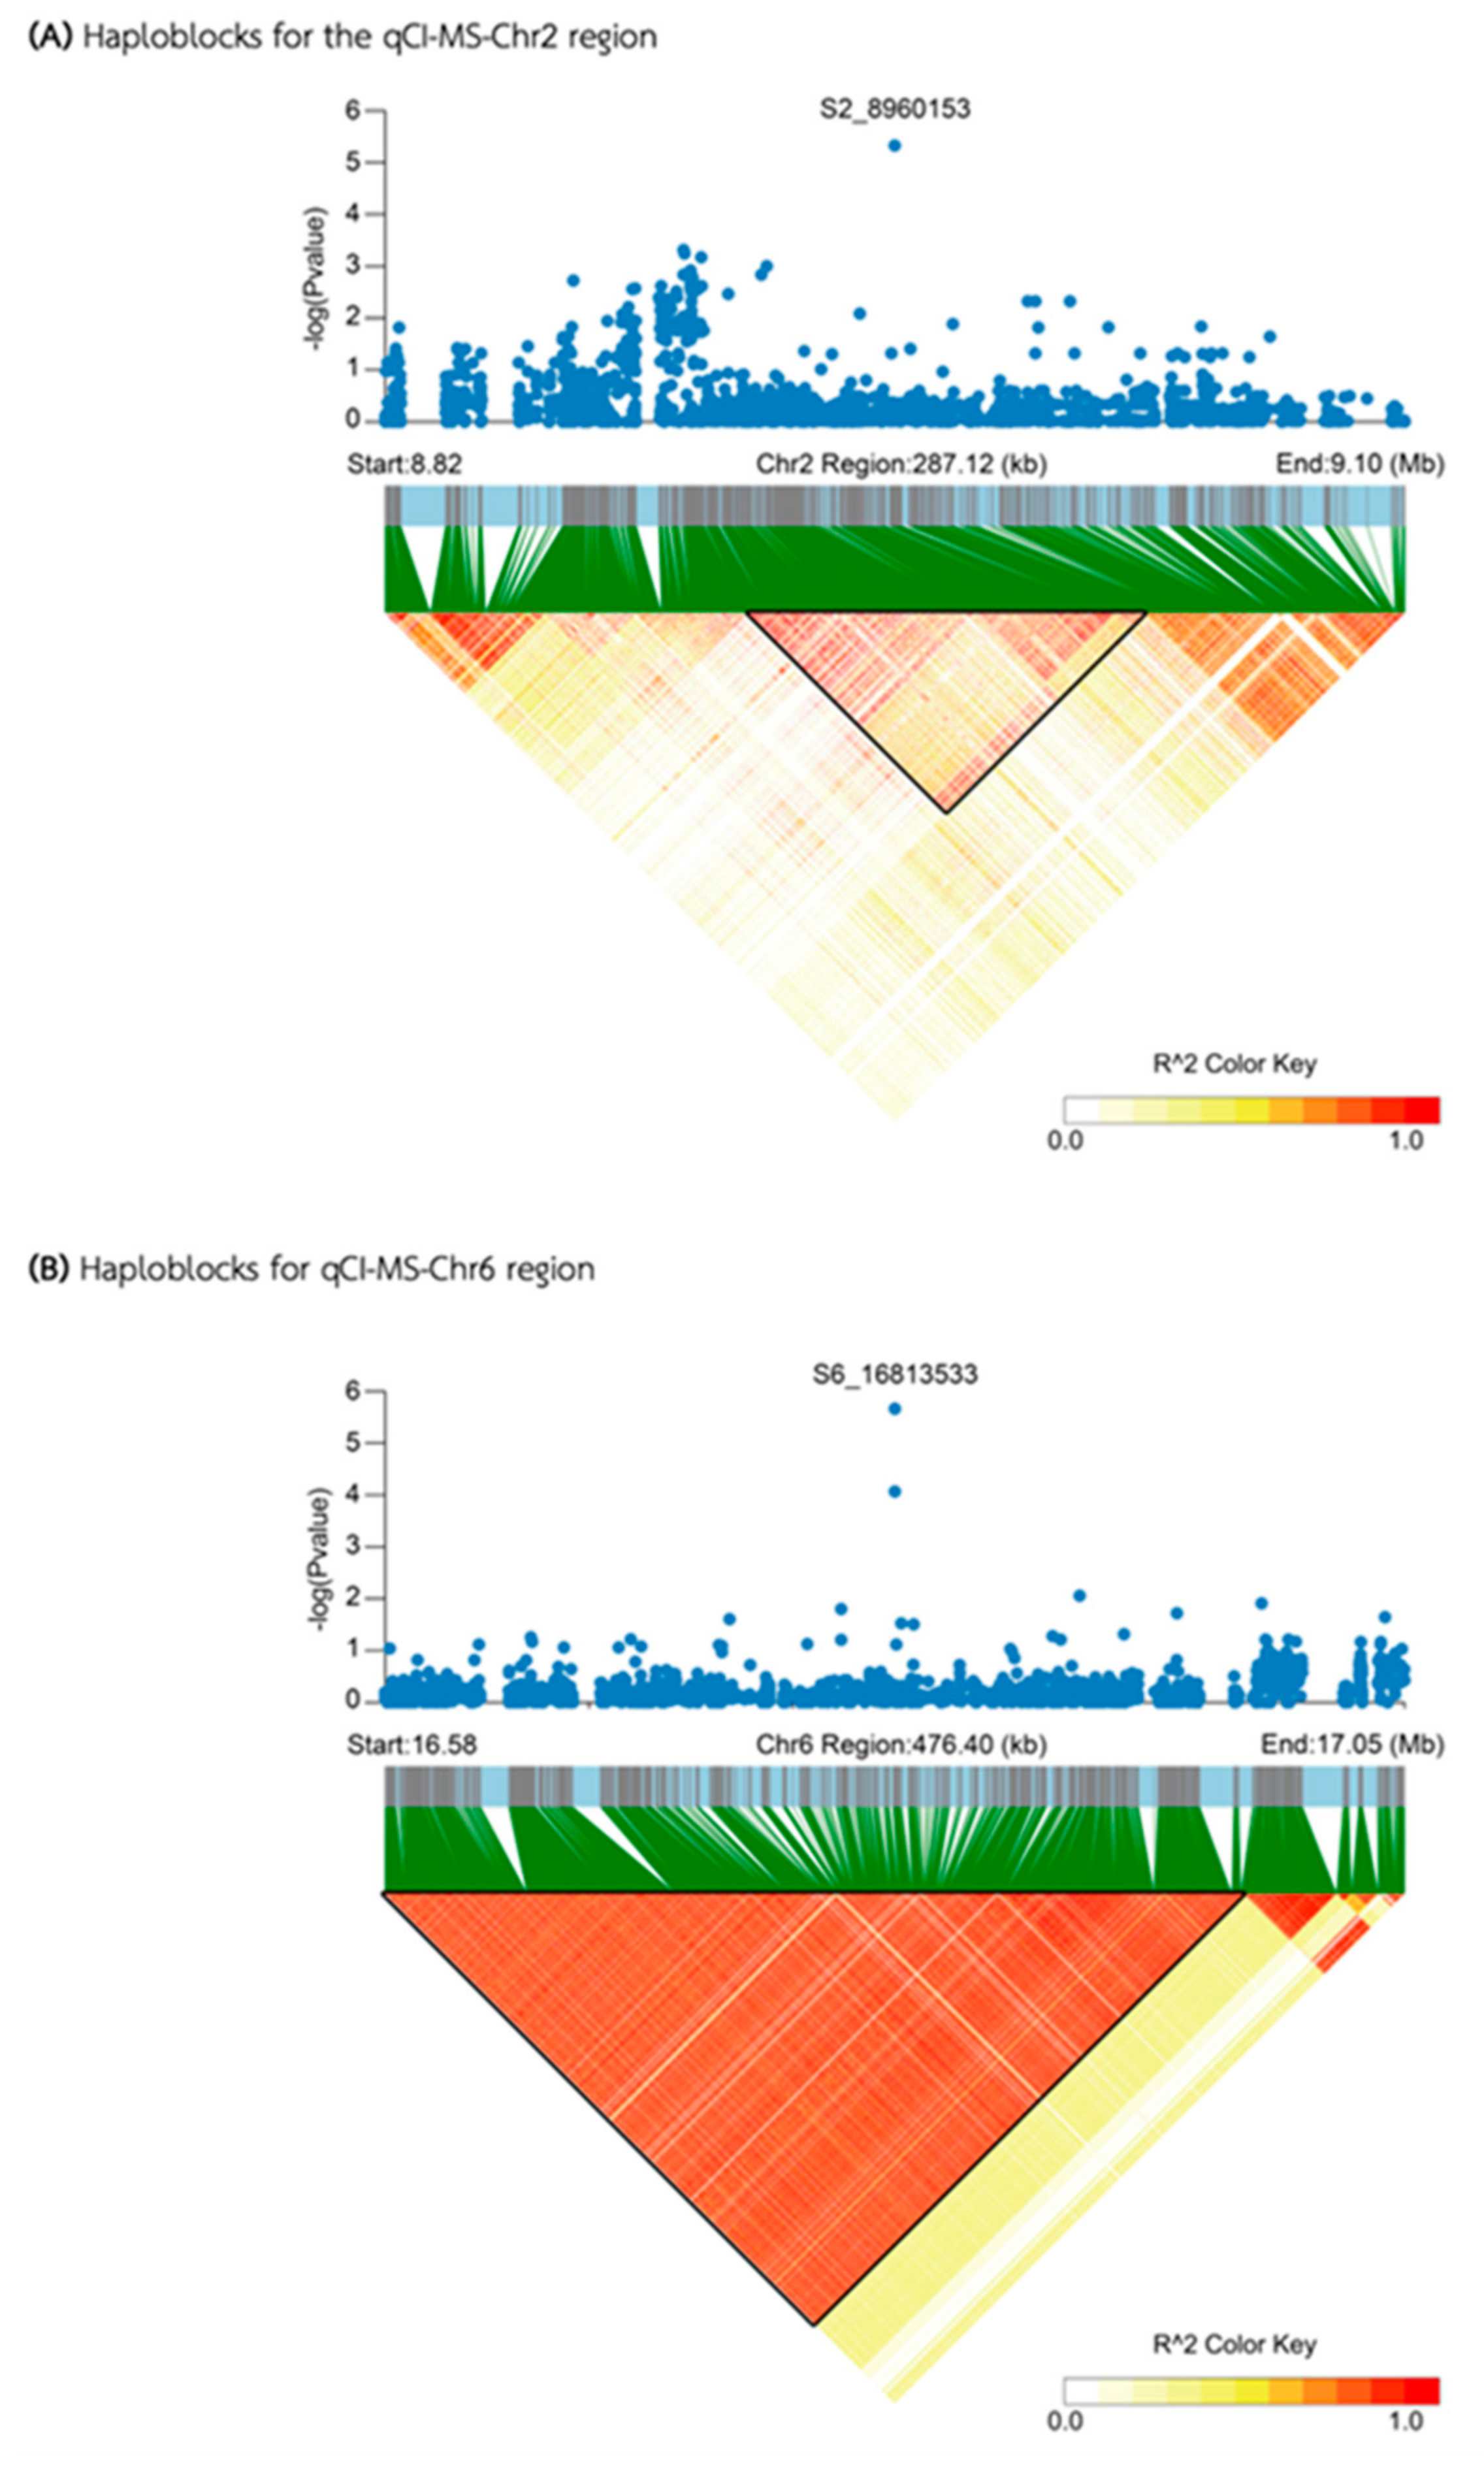
For the MS media, two QTLs were identified: qCI-MS-Chr2 and qCI-MS-Chr6. The first QTL, qCI-MS-Chr2, spans a 287-kb region from 8.817 to 9.104 Mb on chromosome 2 (Figure 6A). Within this region, thirty genes were annotated (Supplementary Table S3), and four genes were located in the candidate haploblock between 8.906 and 8.968 Mb. However, none of these four genes showed haplotypes significantly associated with different levels of CI.
The second QTL, qCI-MS-Chr6, is located in the 477-kb region from 16.575 to 17.052 Mb on chromosome 6 (Figure 6B). The region contains twenty-six annotated genes (Supplementary Table S4). Within the spaning 406 kb from 16.575 to 16.981 Mb., thirteen annotated genes were identified. Unfortunately, similar to qCI-MS-Chr2, none of these genes exhibited haplotypes significantly associated with varying CI levels.
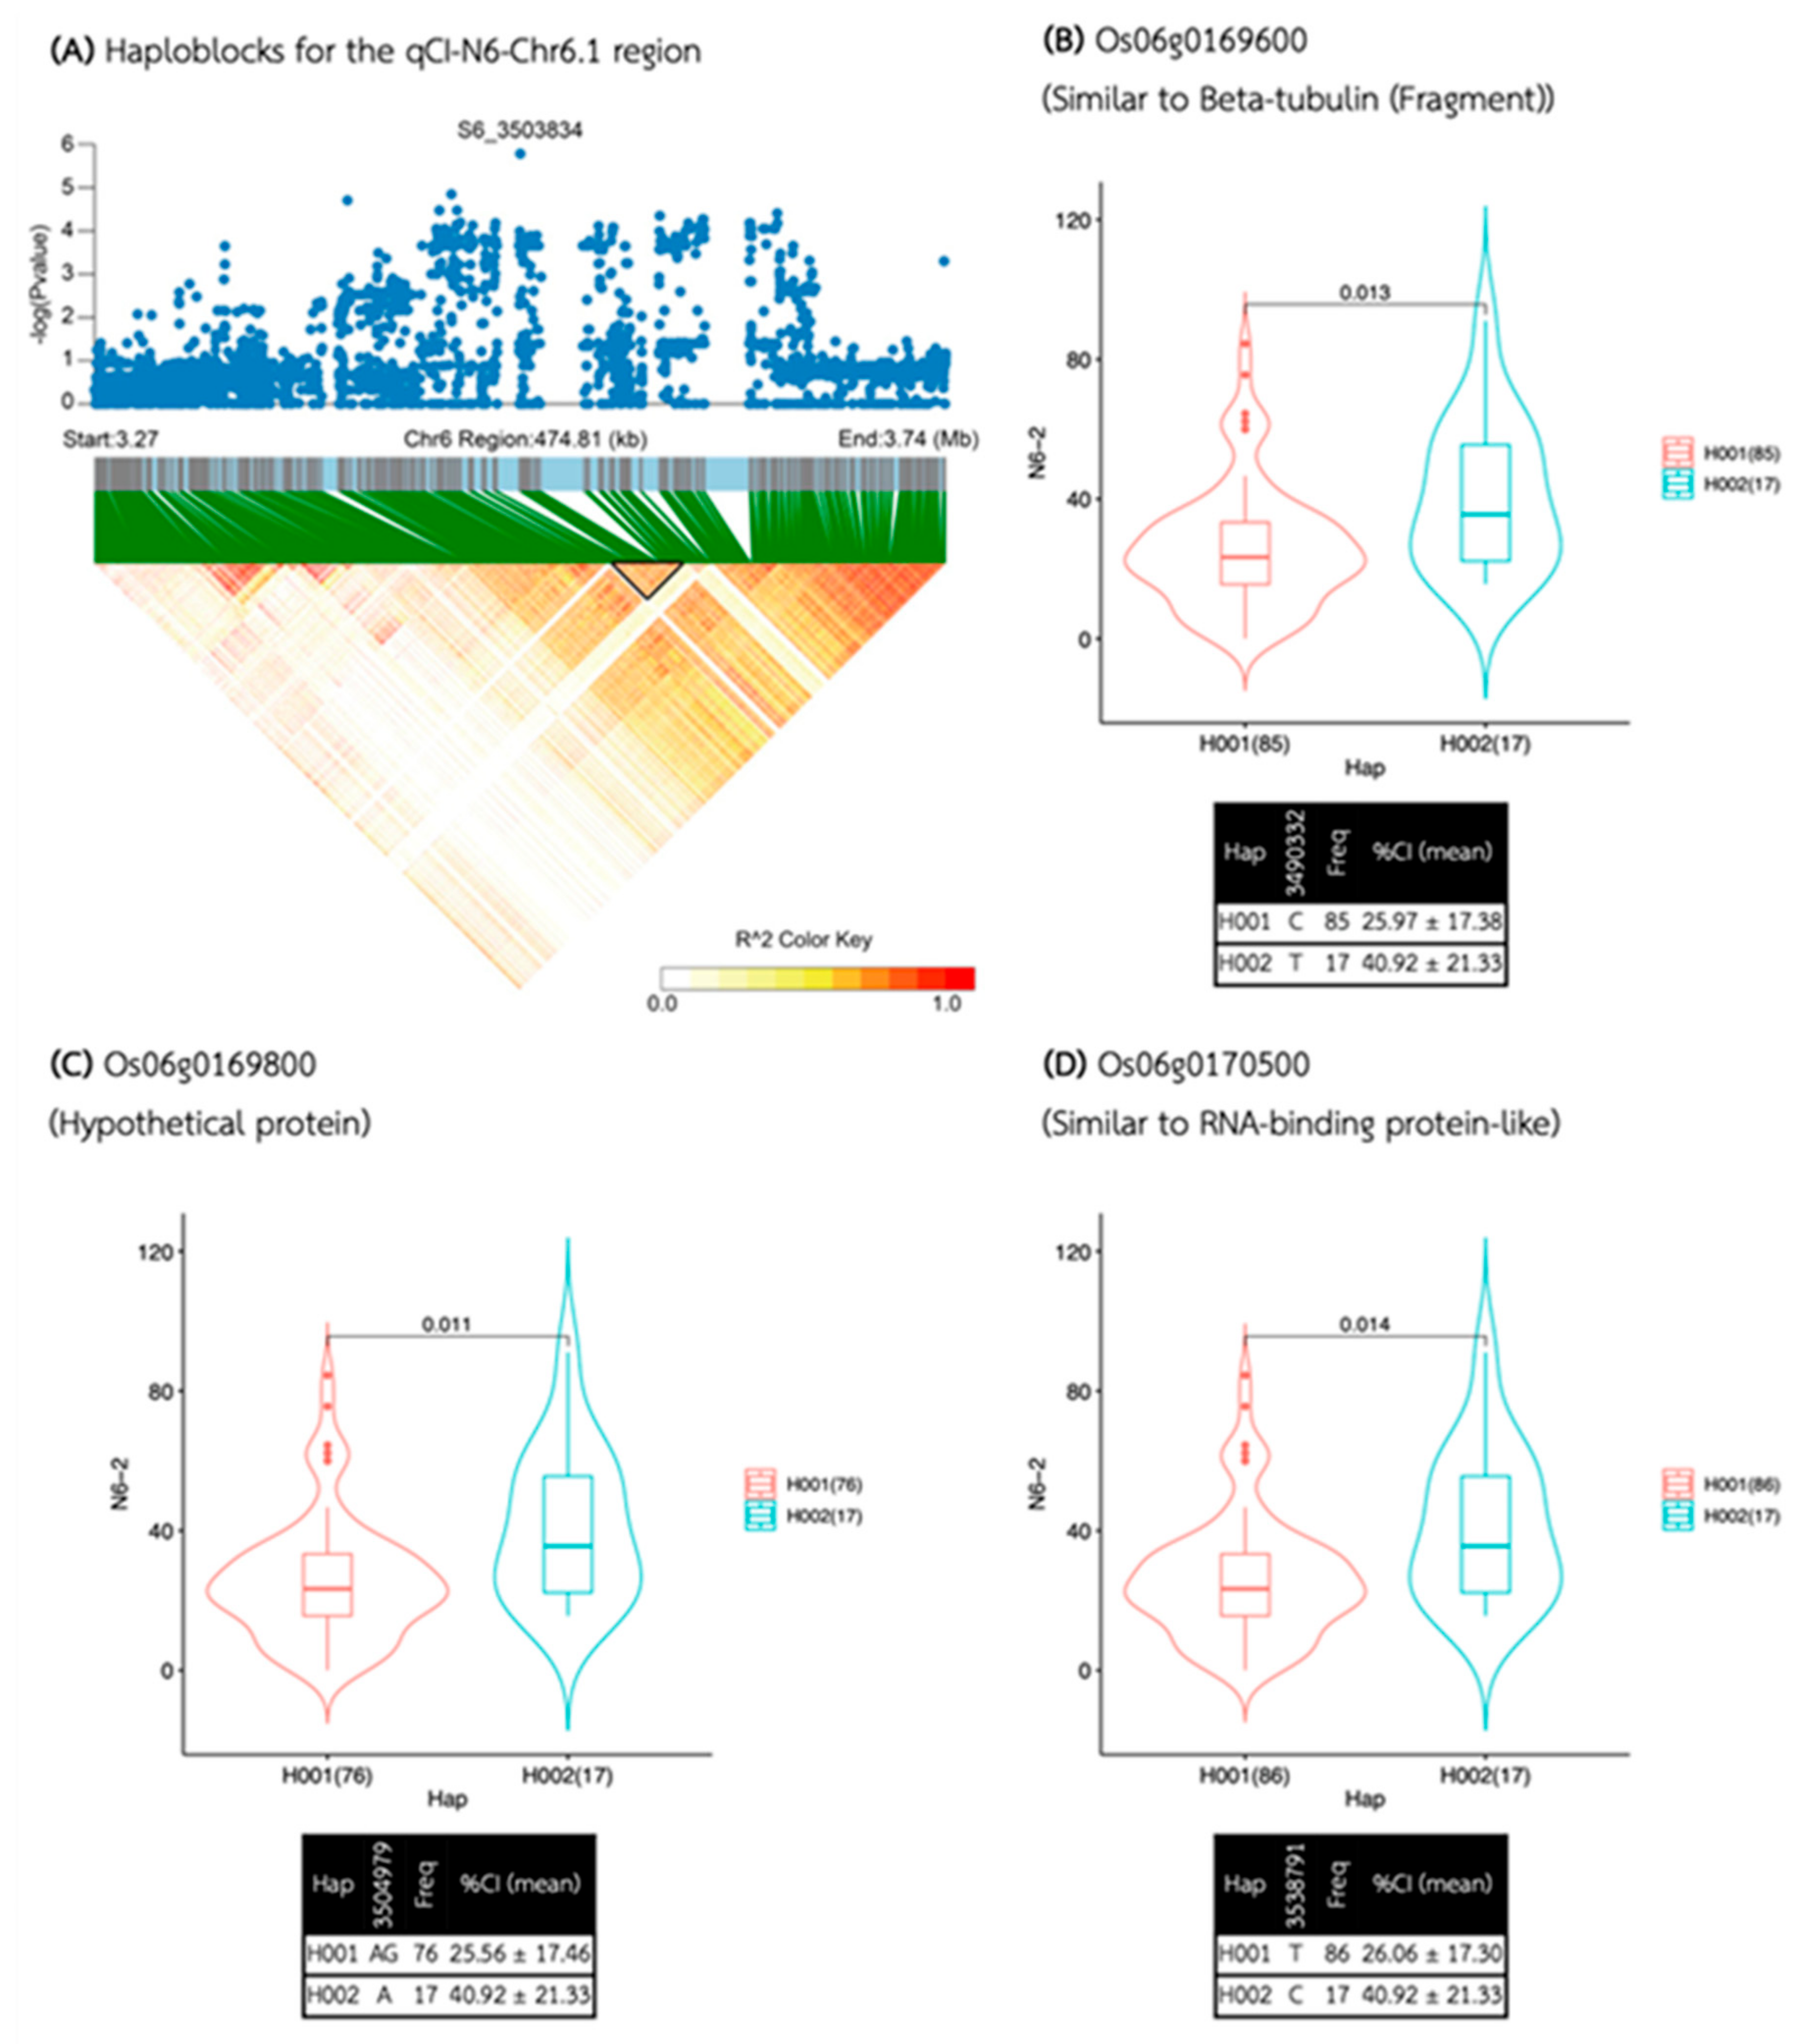
For the N6 media, four QTLs were identified, including qCI-N6-Chr6.1 and qCI-N6-Chr6.2 on chromosome 6, qCI-N6-Chr7 on chromosome 7, and qCI-N6-Chr11 on chromosome 11. The first QTL, qCI-N6-Chr6.1, spans the 475-kb region between 3.266 and 3.741 Mb on chromosome 6 (Figure 7A), encompassing fifty-three annotated genes (Supplementary Table S5), with four genes located in the candidate haploblock between 3.483 and 3.555 Mb. These candidate genes include Os06g0169600, Os06g0169800, Os06g0169900, and Os06g0170500. Only Os06g0169600, Os06g0169800, and Os06g0170500 contained haplotypes associated with different CI (Figure 7B – 7D). Hap I (n = 85, 76, and 86, respectively) was associated with lower CI (averaging 25.96%, 25.56%, and 26.06% callus induction, respectively), while Hap II (n = 17 for all three genes) was associated with higher CI (40.92% callus induction, on average, for all three genes). These genes were annotated similarly to beta-tubulin (fragment) (Os06g0169600), the hypothetical protein. (Os06g0169800), and similar to RNA-binding protein-like (Os06g0170500), respectively.
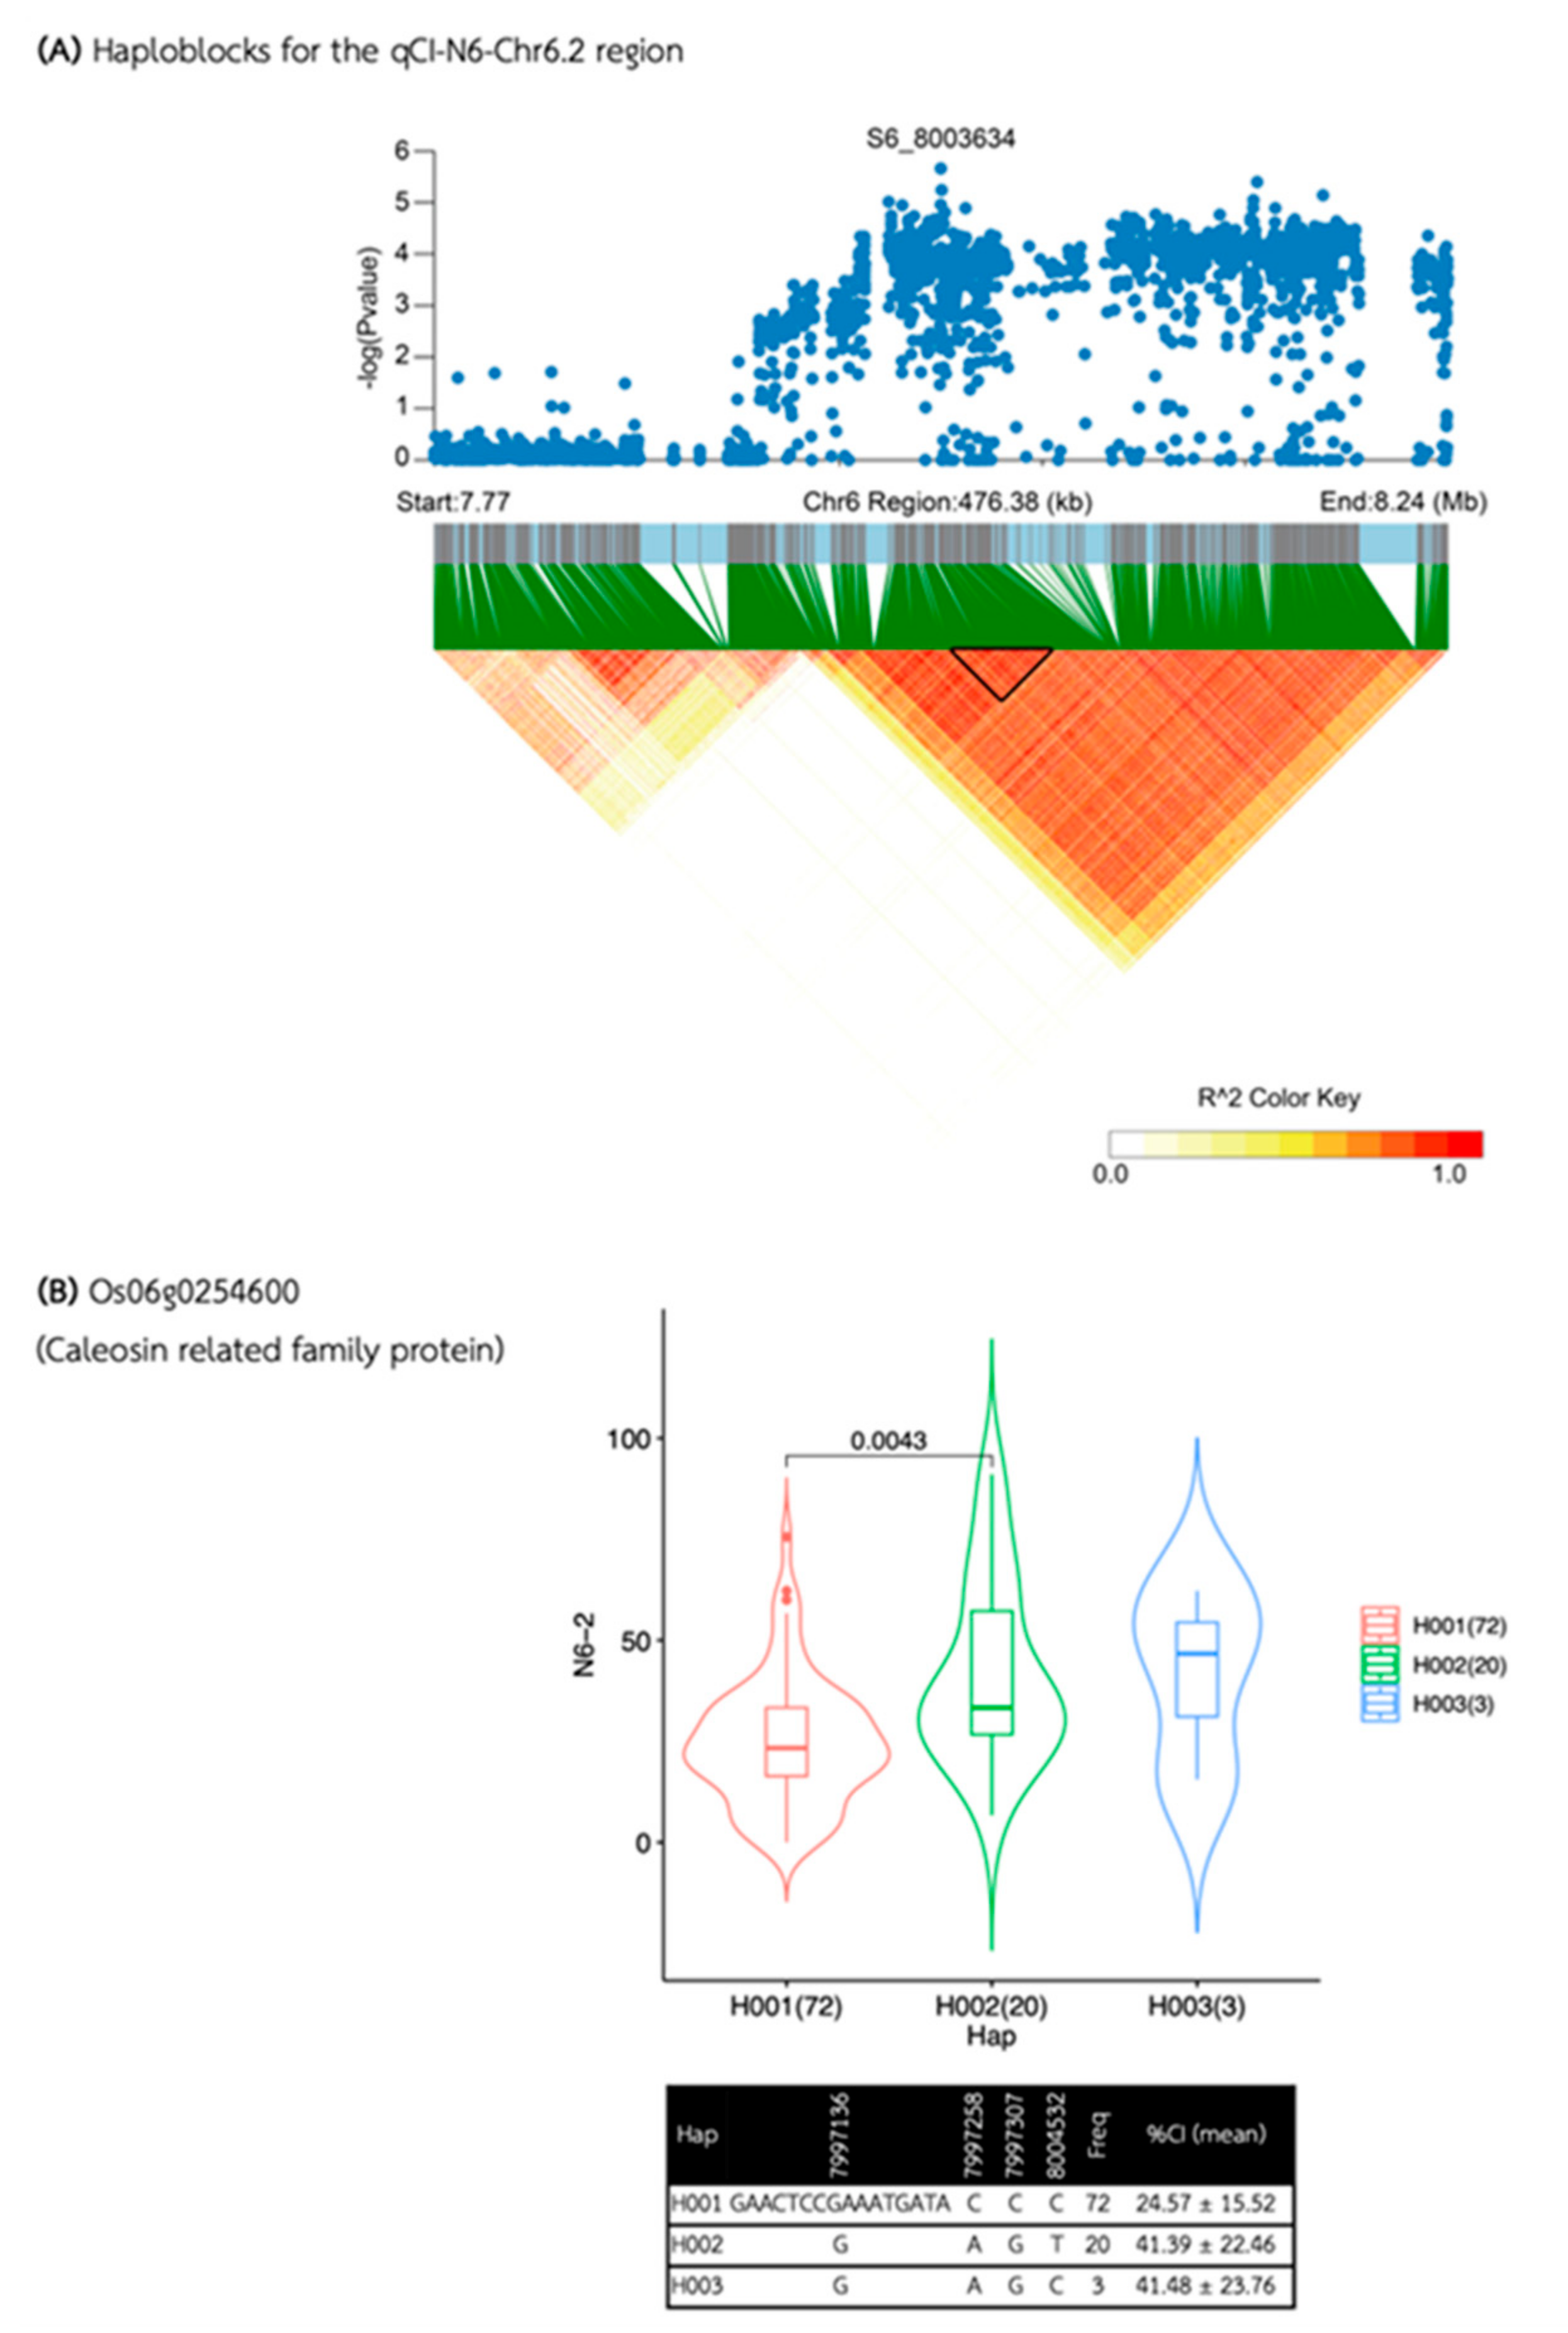
The second QTL, qCI-N6-Chr6.2, is also located on chromosome 6, comprising a 476-kb region between 7.766 and 8.242 Mb (Figure 8A). The region contained thirty-one annotated genes (Supplementary Table S6), but only one candidate gene, Os06g0254600, was identified within the candidate haploblock between 7.995 and 8.014 Mb. Gene-based haplotype analysis revealed that Os06g0254600, which encodes a Caleosin-related family protein, had haplotypes associated with different CI levels. Hap I (n = 72) was associated with a lower CI, averaging 24.57%, while Hap II (n = 20) and Hap III (n = 3) were associated with a higher CI, averaging 41.39% and 41.48%, respectively (Figure 8B).
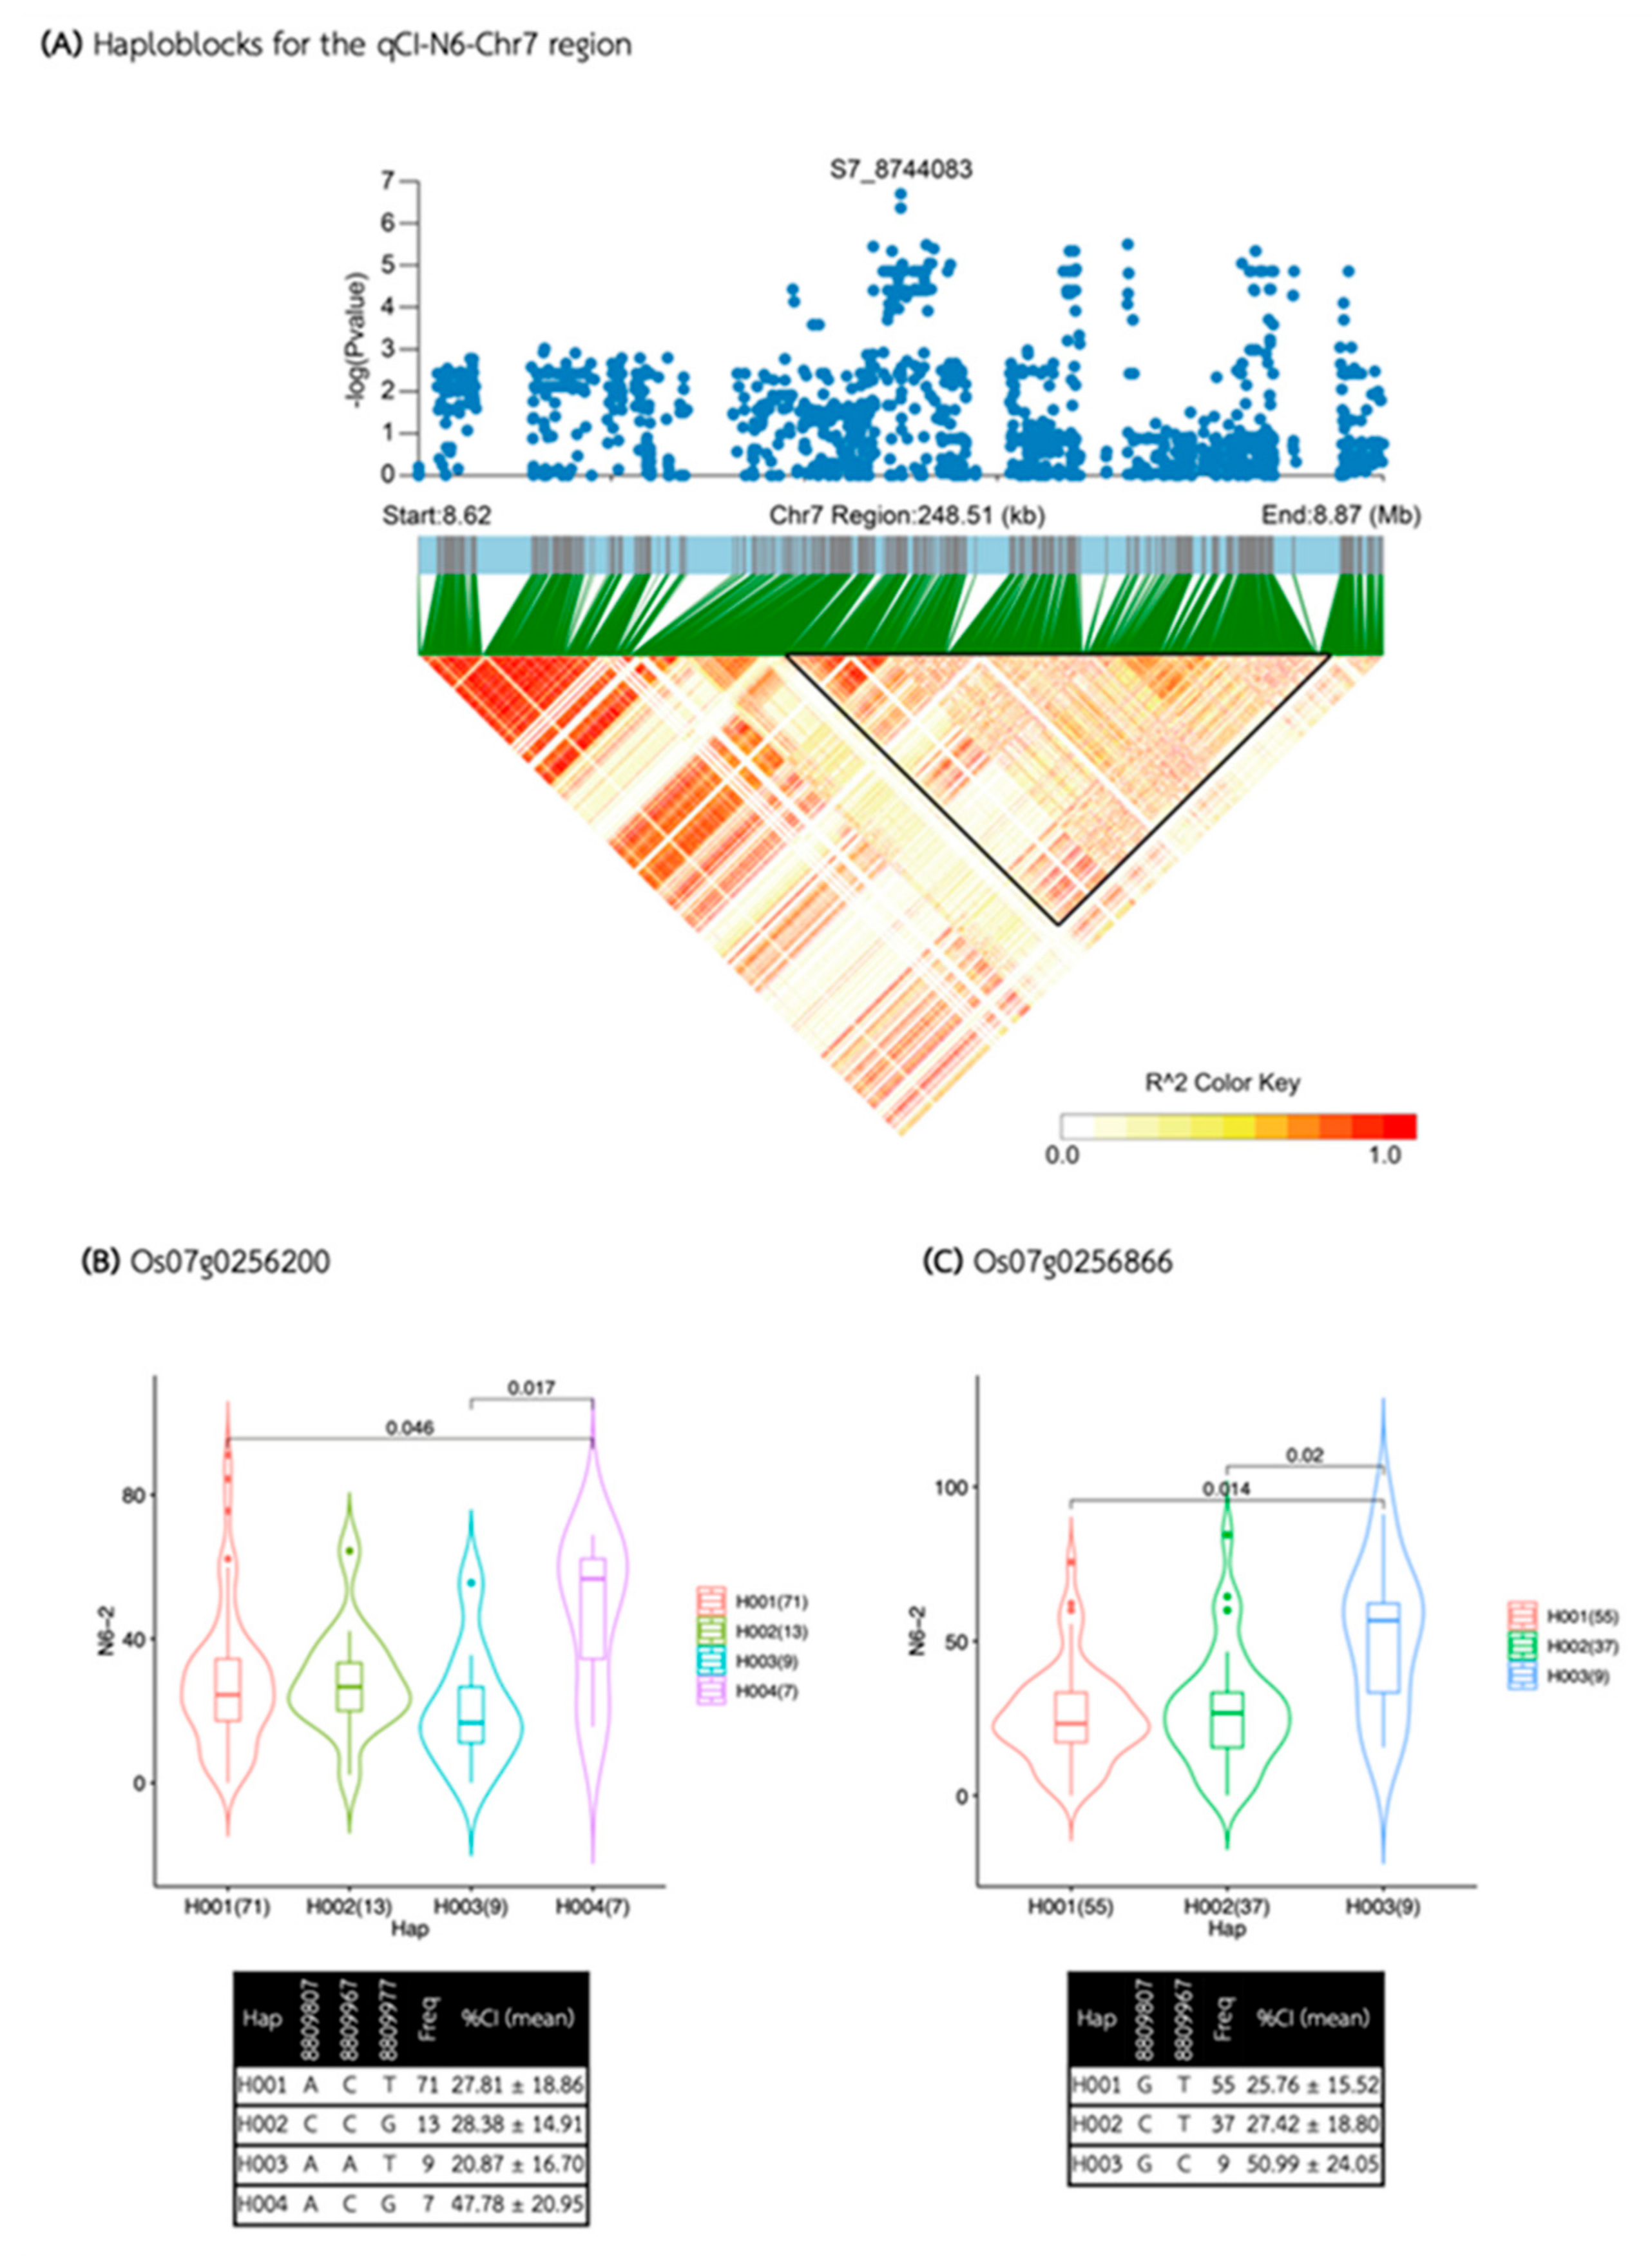
The third QTL, qCI-N6-Chr7, was identified within a 248-kb region between 8.620 and 8.868 Mb (Figure 9A). This region contained seven annotated genes (Supplementary Table S7). Five of these genes, located within a 124-kb candidate haploblock from 8.734 to 8.858 Mb, included Os07g0255900 and Os07g0256700 (annotated as the gene with the domain of unknown function DUF231), Os07g0256300, and Os07g0256866 (annotated as hypothetical protein), and Os07g0256200 (annotated as the gene with the RNA recognition motif, RNP-1 domain-containing protein). Gene-based haplotype analysis revealed that only two genes, Os07g0256200 and Os07g0256866, had haplotypes associated with different CI levels in the N6 media (Figure 9B and 9C). For Os07g0256200, among the four haplotypes, Hap IV was associated with a higher CI (average 47.78% callus induction), while Hap III was associated with a lower CI (average 20.87% callus induction). The other two haplotypes, Hap I and Hap II, were associated with medium CI levels (average 27.81% and 28.38% callus induction, respectively). For Os07g0256866, three haplotypes were identified, with Hap III was associated with higher CI (average 50.99% callus induction), and Hap I and Hap II were associated with lower CI (average 25.76 and 27.42 % callus induction, respectively).
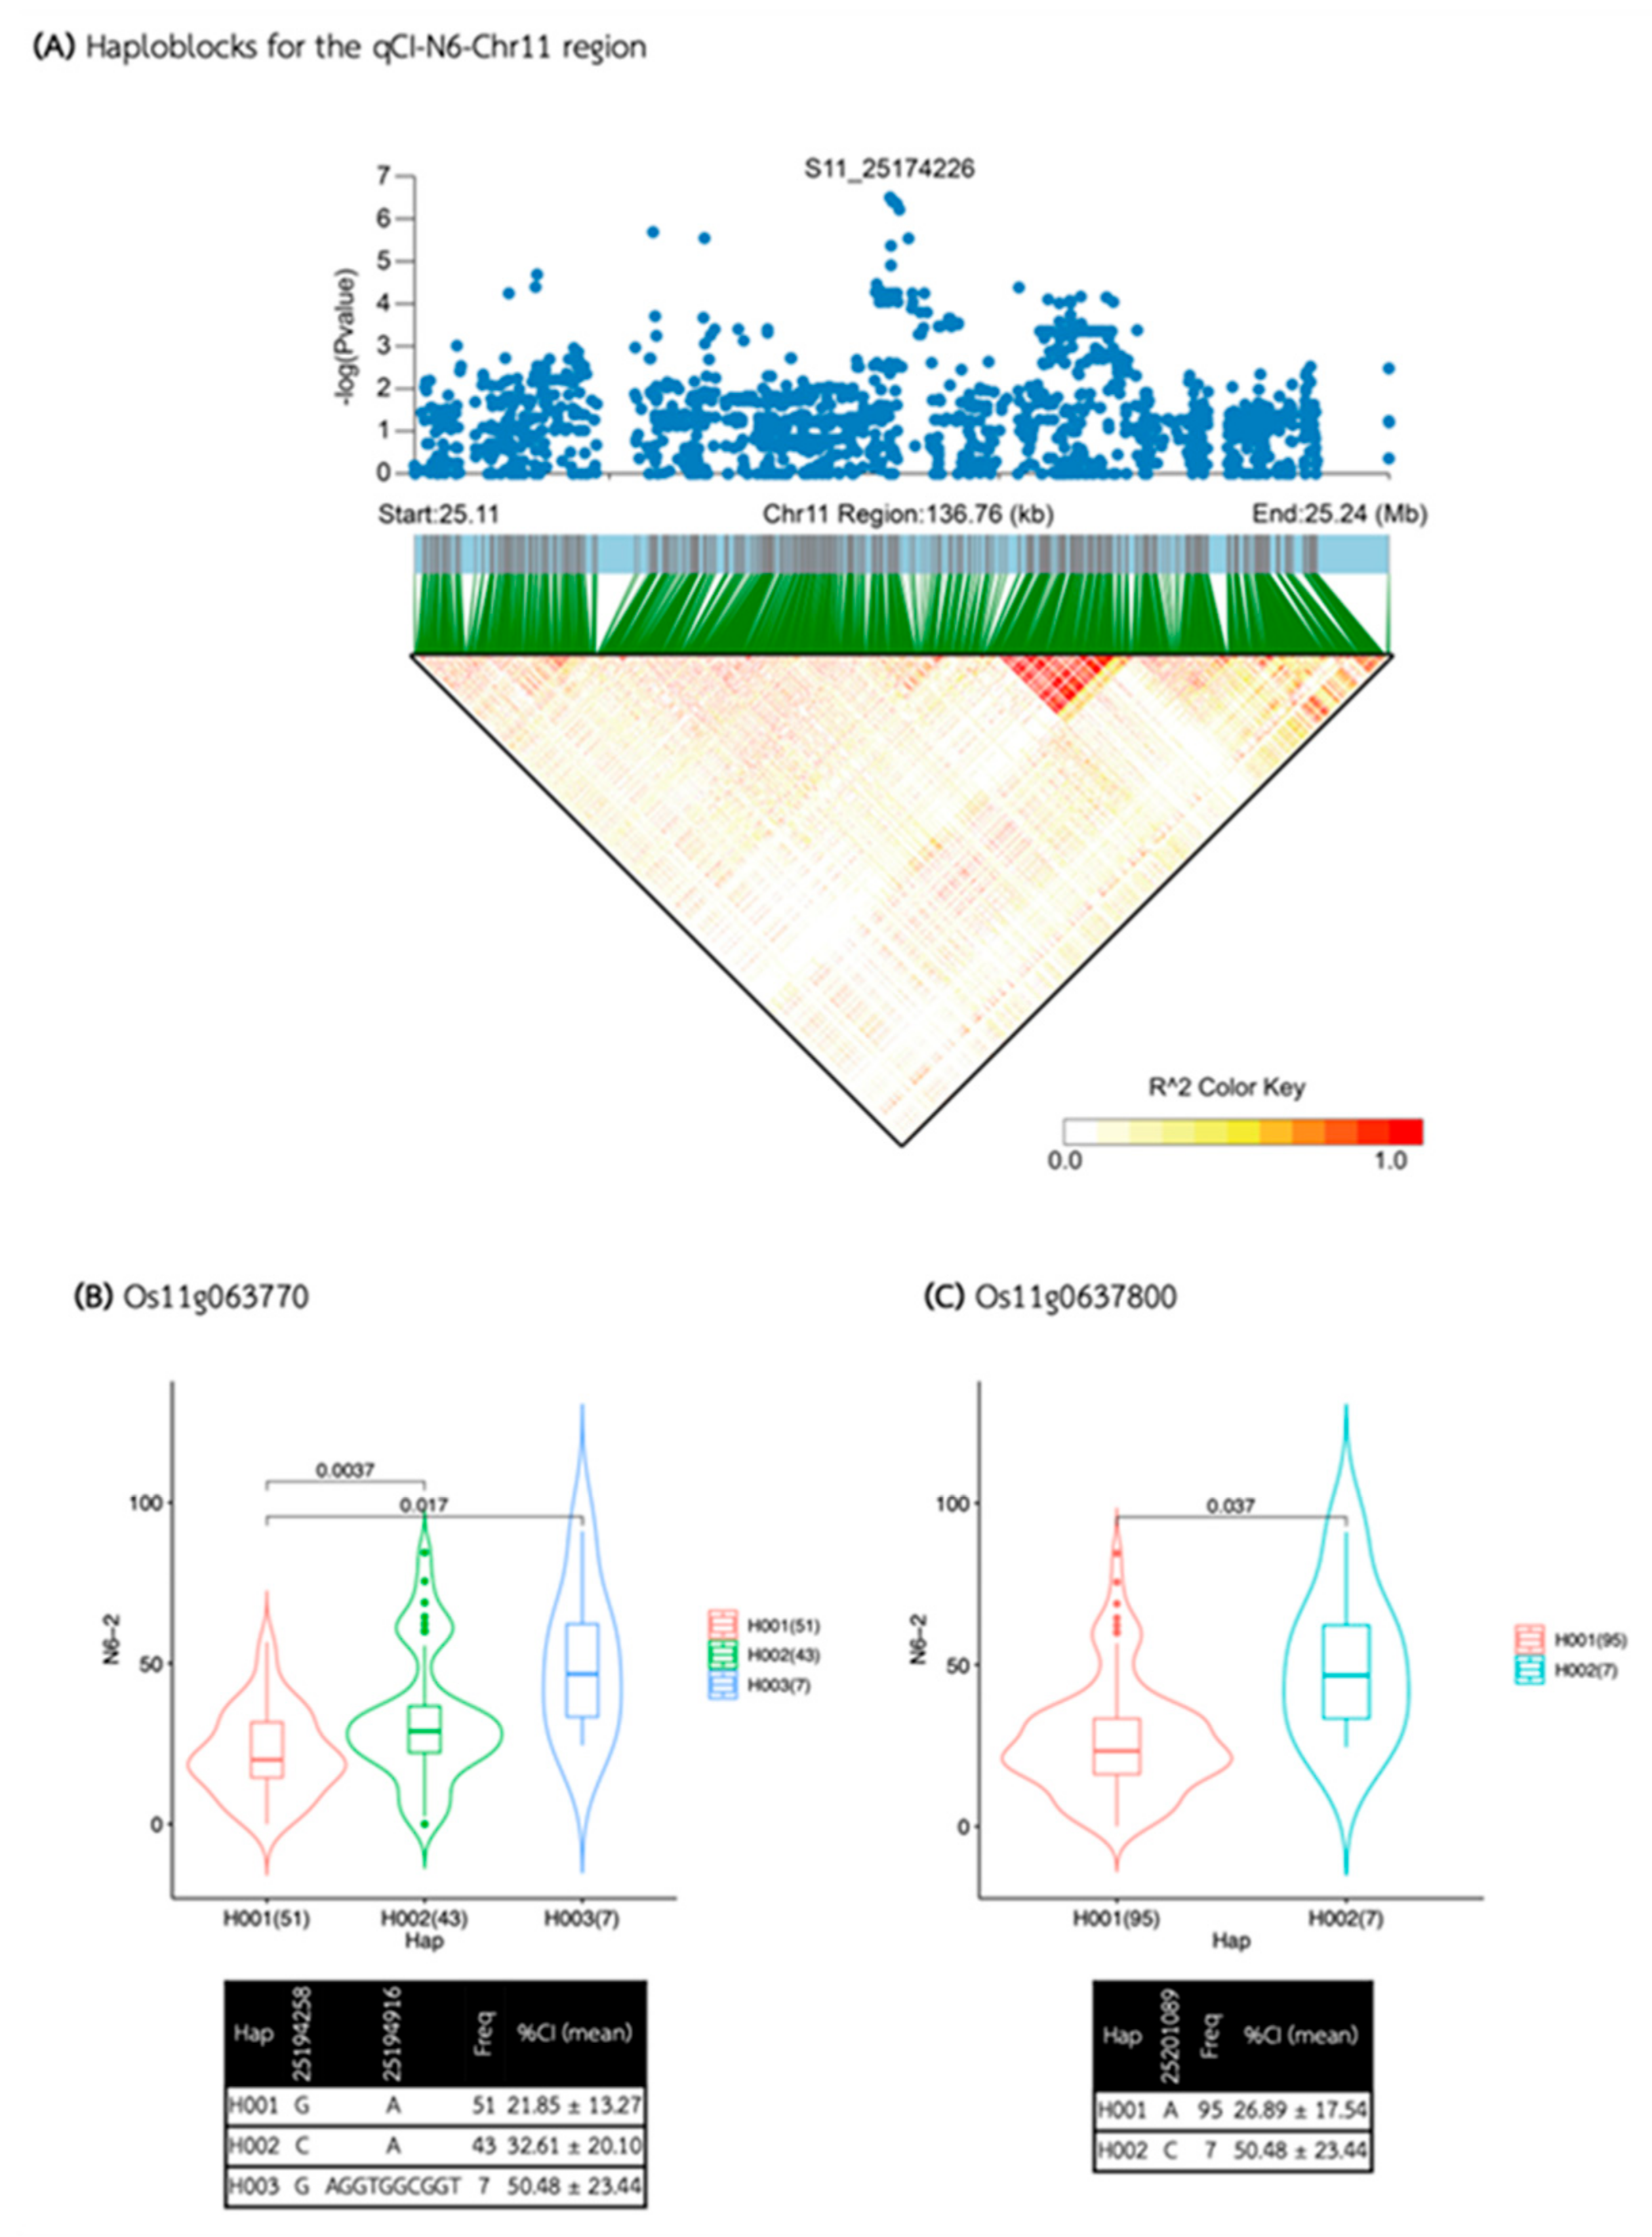
The last QTL of the N6 media, qCI-N6-Chr11, is situated within a 136-kb region spanning from 25.108 to 25.244 Mb (Figure 10A). Within this region, seventeen genes were annotated (Supplementary Table S8), with thirteen genes forming the candidate haploblock between 25.148 and 25.223 Mb. Gene-based haplotype analysis identified ten genes whose haplotypes were associated with different CI levels in the N6 media. These genes include Os11g0637050, Os11g0637900, and Os11g0638200 (annotated as hypothetical protein), Os11g0637000, Os11g0637100, and Os11g0637200 (annotated as monosaccharide transporter (PLT subfamily), PLT protein 10), Os11g0637600 (similar to potyvirus VPg interacting protein), Os11g0637700 (RNA-binding protein) and Os11g0637800 (Lysophosphatidic acid acyltransferase 2). Among these, Os11g0637700 exhibited the most significant difference in CI associated with its haplotypes (Figure 10B). Hap III (n = 7) was associated with a higher CI (average 50.48% callus induction), while Hap I (n = 51) was associated with a lower CI (average 21.85% callus induction). Similarly, Os11g0637800 also showed notable variation in CI between haplotypes (Figure 10C). Hap I (n = 95) was associated with a lower CI (average 26.89% callus induction), whereas Hap II (n = 7) was associated with a higher CI (average 50.48% callus induction).

3. Discussion

Callus induction is a technique used in plant tissue culture where plant cells are stimulated to generate a mass of undifferentiated cells called callus [5]. This callus can be used for various purposes, such as genetic transformation, mutation breeding, and somatic embryogenesis in plant breeding programs. Callus induction is often used in rice breeding to introduce desired traits into rice plants through genetic modification or to regenerate whole plants from callus cultures. This technique allows breeders to rapidly propagate specific plants and create new rice varieties with desirable traits such as disease resistance, drought tolerance, or increased yield [21].
This study found that the three media, B5, MS, and N6, combined with 2,4-D hormone at a concentration of 2 mg/l, had varying efficiencies in inducing callus formation in rice, influenced by several other factors. Josefina and Kazumi (2010) observed differences in callus formation characteristics among Indica, Japonica, and Javanica rice groups [22]. Chu. et al. (1975) noted that N6 media effectively induce callus in rice [23]. In addition, 2,4-D has been reported as the most popular and effective growth regulator among auxins for inducing monocot tissues to form callus [24]. Callus formation in Jasmine rice and Pathum Thani 1 could be induced in media supplemented with 2,4-D at a concentration of 2 mg/L.
The genetic regulation of callus induction in rice involves multiple genes and pathways [25]. Several essential genes have been identified that are crucial in controlling callus formation and regeneration in rice. These include OsLEC1 (LEAFY COTYLEDON1), which is involved in maintaining embryonic characteristics in callus cells and is essential for somatic embryogenesis in rice [18]; OsWOX11 (WUSCHEL-RELATED HOMEOBOX 11), a crucial regulatory gene of stem cell maintenance and vital for callus induction and subsequent shoot regeneration in rice [26]; OsPLT (PLETHORA) genes, members of the OsPLT family involved in maintaining stem cell populations in root and shoot meristems, crucial for callus induction and regeneration processes [27]; and OsARF (AUXIN RESPONSE FACTOR) and OsAux/IAA (AUXIN/INDOLE-3-ACETIC ACID), genes involved in auxin signaling pathways that centrally regulate cell division and differentiation during callus formation in rice [28].
Genome-wide association studies (GWAS) have pinpointed several candidate genes associated with callus induction in rice [19]. DRO1 (DEEP ROOT 1) has been associated with enhanced root growth and development, potentially influencing callus induction efficiency by facilitating better nutrient and hormone uptake [29]. OsRRMh (Rice RECEPTOR-LIKE PROTEIN KINASE HOMOLOG) influences rice's callus induction and regeneration processes by regulating stress responses and hormone signaling pathways [30,31]. OsCYP94C2 (Rice CYTOCHROME P450 MONOOXYGENASE) plays a role in plant hormone biosynthesis and metabolism, particularly affecting auxins and cytokinins crucial for callus induction and regeneration [32]. OsGH3.8 (GRETCHEN HAGEN3.8) contributes to auxin homeostasis and signaling, essential for regulating cell division and differentiation during callus formation in rice [33].
The B5 medium is a commonly used plant tissue culture medium developed by Gamborg et al. (1968) [34]. It is a versatile medium that supports the growth and development of various plant species. B5 medium contains essential nutrients, vitamins, and growth regulators required for plant cell growth and differentiation. By optimizing the culture conditions and growth regulator combinations, researchers can achieve efficient callus induction and utilize the callus for plant regeneration or other purposes. In this study, Two candidate genes in the qCI-B5-Chr6, Os06g0254300, and Os06g0254600, were related to Caleosin. Caleosin is a lipid droplet (LD) associated protein. LD is an organelle that consists of a densely packed hydrophobic core of neutral lipids surrounded by a phospholipid monolayer. The LD served two functions: initial energy source for seed germination and cellular processes such as stress responses, lipid metabolism, and organ development [35]. Caleosin is embryo-specific and is a developmental mediator in lipid intracellular trafficking and metabolism [36,37,38]. Lipid metabolism is critical in reproductive development and callus formation [39,40]. Os06g0255200 and Os06g0255700 were chromatin remodeling proteins. Chromatin remodelers such as CHD chromatin remodeler PKL prevent induced callus formation. The Arabidopsis mutants with defective chromatin remodeling ATPase are hypersensitive to cytokinin and display enhanced callus greening [41,42]. Os06g0256000 identified as Condensin complex subunit III. Condensin-2 complex subunit H2 expression significantly increases during cotton embryogenic transdifferentiation [43]. It could function similarly in rice calli. The qCI-B5-Chr6 was located in the same region as the qCI-N6-Chr6.2, including the Os06g0254600 gene. This region may be considered a promising QTL for universal callus induction.
The Murashige and Skoog (MS) medium, developed in 1962, is a widely used plant tissue culture medium supporting various plant species' growth and development [44]. Rice callus induction in MS media is a valuable tool for rice improvement, enabling rapid propagation, genetic modification, and disease resistance studies. In this study, two genomic regions on rice chromosomes 2 and 6 were associated with different % CI of rice accessions in the MS media. Unfortunately, no annotated genes containing haplotype associated with % CI in rice accessions were identified. Even four and thirteen genes were located in the candidate haploblocks of those regions. The reason why no candidate genes with haplotype associated with the trait were identified in the candidate haploblock may be that the sample size used in this study was too small to detect a statistically significant association between the haplotype and the trait [45] or the trait may be complex and influenced by multiple genes and environmental factors [46].
N6 medium is a specialized plant tissue culture medium developed by Chu et al.(1975), particularly suited for the culture of cereal grains like rice [23]. Rice callus induction in the N6 medium is a valuable tool for rice improvement, enabling rapid propagation and genetic modification. In this study, four genomic regions on rice chromosomes 6, 7, and 11 were associated with different % CI of rice accessions in the N6 media. For the qCI-N6-Chr6.1, Os06g0169600, annotated as the beta-tubulin containing GTPase domain, was found to have the haplotype associated with different CI. Beta-tubulin is a protein essential in forming microtubules necessary for cell division and growth [47]. It is involved in callus induction in soybeans [48]. Studies have shown that the expression of beta-tubulin genes increases in plant cells during callus induction, suggesting that beta-tubulin plays a role in cell division and growth. The Os06g0170500, annotated as the OsC3H40 gene, encodes zinc finger proteins containing the motif with three cysteines and one histidine residue [49]. The expression analysis indicated that the genes in this family are regulated by abiotic or biotic stresses, suggesting that they could have an influential role in stress tolerance. Moreover, the gene was found to be expressed in root, inflorescence, and seed. The role of OsC3H40 in callus induction still has not been previously reported. Therefore, the functional impact of this gene on callus induction in rice still needs to be confirmed.
For the qCI-N6-Chr7, two candidate genes with haplotypes associated with different CI were identified: Os07g0256200 and Os07g0256866. While Os07g256866 was annotated as the hypothetical protein whose function was not reported, Os07g0256200 was recently cloned as OsTIF1 (tilling number 1 (TN1) interaction factor 1) [50]. The gene positively regulates D14 expression and modulates axillary bud outgrowth, ultimately affecting tiller development. The role of the OsTIF1 gene in callus induction still needs to be elucidated.
For the qCI-N6-Chr11, ten candidate genes with haplotypes associated with different CI were identified. Os11g0637700, which haplotypes showed the highest CI difference among ten candidate genes, was annotated as the nucleotide-binding, alpha-beta plait domain-containing protein. The gene was found to play a crucial role in callus development in Arabidopsis [51]. Another interesting candidate gene was Os11g0637800, annotated as the Lysophosphatidic acid acyltransferase 2 (OsLPAT2) gene. OsLPAT2 is essential for rice's salt and drought stress tolerance [52]. Phosphatidic acid (PA) is an important signaling molecule in various cellular processes, including plant development, stress responses, and callus induction. OsLPAT2 may influence callus induction through several mechanisms, such as cell signaling pathways, influencing membrane stability, interacting with auxin, ensuring proper distribution and activity of auxin within the cells, enabling cells to cope with stress conditions, and maintaining optimal growth for callus induction.

4. Materials and Methods

4.1. Association Mapping Panel and Callus Induction Evaluation

Our association mapping panel comprises 110 indica rice accessions with a 100% germination rate, including Thai landraces, improved rice varieties, and international varieties (Supplementary Table S1). Callus induction of these rice accessions was evaluated using three media: Gamborg B5 (B5) [34], Murashige and Skoog (MS) [44], and Chu N6 (N6) [23], at the Rice Science Center, Kasetsart University, Thailand. Mature seeds from the 110 rice cultivars served as the explant source. The dehusked seeds were surface-sterilized in sterile distilled water for 5 minutes, repeated 3-4 times, followed by a 5-minute rinse in 70% ethanol. Subsequently, the seeds were shaken in 20% sodium hypochlorite for 20 minutes, followed by an additional 10 minutes. The seeds were then rinsed three times in sterile distilled water, dried on a clean filter paper in a sterile Petri dish, and cultured on N6 medium, B5 medium, and MS medium. These media were supplemented with 2 mg/l 2,4-D, 2.87 g/l L-proline, 30 g/l sucrose, and 3.0 g/l phytagel, with the pH adjusted to 5.8 before autoclaving. Seeds were maintained in the dark at 25±2 ºC for three weeks. Each treatment included 15 seeds and three replications. After three weeks, the callus induction frequency was recorded as a percentage. In addition, sterilized seeds were cultured on an N6 medium without hormones as a control and germination percentages were calculated.

4.2. Genome-Wide Association Analysis

GWAS was carried out on 2,385,475 SNP markers using GAPIT (Genome Association and Prediction Integrated Tool) software version 3 [53]. The analysis employed various models, including GLM, MLM, CMLM, MLMM, and FarmCPU. The SNP data for GWAS consisted of homozygous genotypes with a call rate of 90% or higher and a minor allele frequency (MAF) greater than 5%. These SNPs were derived from a whole-genome re-sequencing project at the National Center for Genetic Engineering and Biotechnology (BIOTEC), Thailand (unpublished data). They were aligned using the Nipponbare IRGSP 1.0 rice reference genome.
Principal component (PC) and kinship analyses were performed using TASSEL based on LD-pruned SNPs to generate PC and kinship matrices. The STRUCTURE algorithm [54] was employed with a model incorporating admixture and correlated allele frequencies. Three independent replicates were run for each genetic cluster (K) value, ranging from K=1 to K=8, with a burn-in of 10,000 steps and a run length of 10,000 Markov Chain Monte Carlo (MCMC) iterations. PCA plots and the kinship heatmap were generated by GAPIT [55]. The SNP density of each chromosome was visualized using the R package RIdeogram [56].
Significant associated SNPs were identified using a threshold of –log10 (p-value) ≥ 5.0 based on a formula that considers marker-based heritability [57]. The Manhattan and quantile-quantile plots for the GWAS results were created using the R package qqman [58].

4.3. Haplotype Block Analysis and Candidate Gene Identification

The haplotype block analysis for all QTLs was conducted using LDBlockShow, applying an LD decay rate threshold of 0.2 for each chromosome [59]. These blocks were subsequently adjusted to align with the identified QTLs. Within these blocks, SNPs were filtered to retain only the significant variants utilizing the Ensembl Variant Effect Predictor (VEP), focusing on six specific variant types: frameshift variants, inframe insertions/deletions, stop gained mutations, missense variants, and missense variants in splice region variant [60].
The SNPs for each identified gene were then employed to construct haplotypes for phenotype differentiation using the geneHapR package in R [61]. The annotation of genes located within each QTL region was identified using the database from the Rice genome annotation project (http://rice.plantbiology.msu.edu) [62]. Candidate genes were determined based on their biological relevance.

5. Conclusions

Callus induction is a pivotal trait for transforming desirable genes into plants. This study conducted a genome-wide association study (GWAS) on 110 diverse indica rice accessions using three media types: B5, MS, and N6. Seven quantitative trait loci (QTLs) on chromosomes 2, 6, 7, and 11 significantly affected the callus induction rate across these media. Results from this study provide insight into the potential QTLs and candidate genes for callus induction in rice. The qCI-B5-Chr6 was located in the same region as the qCI-N6-Chr6.2. The region may be considered promising QTLs for callus induction in general. The candidate gene that haplotypes associated with different CI in both media in this region is Os06g0254600, the caleosin-related family protein. Caleosin proteins have been shown to play a crucial role in mediating lipid droplet degradation via microautophagy during seed germination in Arabidopsis [63]. In rice, a caleosin family gene, OsClo5 (Os04g0511200), has been identified recently [64]. The gene was found to be involved in cold response by the jasmonic acid signaling pathway. Further research is needed to confirm the roles of Os06g0254600 in callus induction and unravel the complex genetic networks that control callus induction and regeneration in rice.

Supplementary Materials

The following supporting information can be downloaded at: Preprints.org, Table S1: A list of 110 indica rice accessions and their callus induction percentage in three different media used for GWAS analysis; Table S2: A list of candidate genes for the callus induction in the qCI-B5-Chr6; Table S3: A list of candidate genes for the callus induction in the qCI-MS-Chr2; Table S4: A list of candidate genes for the callus induction in the qCI-MS-Chr6; Table S5: A list of candidate genes for the callus induction in the qCI-N6-Chr6.1; Table S6: A list of candidate genes for the callus induction in the qCI-N6-Chr6.2; Table S7: A list of candidate genes for the callus induction in the qCI-N6-Chr7; Table S8: A list of candidate genes for the callus induction in the qCI-N6-Chr11.

Author Contributions

Y.D., and P.B. conceived and designed the work. W.K., and P.B. supervised the research. Y.D., and A.J. performed the experiments. B.T., W.P., and S.W. conducted the GWAS analysis. W.K., W.P., and P.B. wrote and revised the manuscript. T.T. funding acquisition. V.R. project administration. All authors contributed to the article. All authors have read and agreed to the published version of the manuscript.

Funding

This research was funded by National Science and Technology Development Agency (NSTDA), grant numbers P1951789, and P2351460. Also, the National Science, Research and Innovation Fund, Thailand Science Research and innovation (TSRI).

Data Availability Statement

All the relevant data have been provided as Tables and Figures in the text and the Supplementary Materials.

Acknowledgments

This research was conducted at the Rice Science Center (RSC), Kasetsart University, Thailand. We thank the Rice Department, the Ministry of Agriculture and Cooperatives, and the RSC for providing the rice materials used in this study.

Conflicts of Interest

The authors declare no conflicts of interest.

References

  1. Zafar SA, Zaidi SS, Gaba Y, Singla-Pareek SL, Dhankher OP, Li X, Mansoor S, Pareek A. Engineering abiotic stress tolerance via CRISPR/ Cas-mediated genome editing. J Exp Bot. 2020 Jan 7;71(2):470-479.
  2. Sukegawa S, Nureki O, Toki S, Saika H. Genome editing in rice mediated by miniature size Cas nuclease SpCas12f. Front Genome Ed. 2023 Mar 13;5:1138843.
  3. Fehér A. Callus, Dedifferentiation, Totipotency, Somatic Embryogenesis: What These Terms Mean in the Era of Molecular Plant Biology? Front Plant Sci. 2019 Apr 26;10:536.
  4. Espinosa-Leal CA, Puente-Garza CA, Garc?a-Lara S. In vitro plant tissue culture: means for production of biological active compounds. Planta. 2018 Jul;248(1):1-18.
  5. Ikeuchi M, Sugimoto K, Iwase A. Plant callus: mechanisms of induction and repression. Plant Cell. 2013 Sep;25(9):3159-73.
  6. Lee K.S., Jeon H.S., Kim M.Y. Optimization of a mature embryos-based in vitro culture system for high frequency somatic embryogenic callus induction and plant regeneration form japonica rice cultivar. Plant Cell Tissue Organ Cult. 2002;71:9-13.
  7. Main, M., Frame, B., & Wang, K. Rice, japonica (Oryza sativa L.). Agrobacterium Protocols: Volume 1, 2015, 169-180.
  8. Sah, S. K., Kaur, A., & Sandhu, J. S. High frequency embryogenic callus induction and whole plant regeneration in japonica rice Cv. Kitaake. J. Rice Res. 2014, 2(2), 1-5.
  9. Lin YJ, Zhang Q. Optimising the tissue culture conditions for high efficiency transformation of indica rice. Plant Cell Rep. 2005 Jan;23(8):540-7.
  10. Ge X, Chu Z, Lin Y, Wang S. A tissue culture system for different germplasms of indica rice. Plant Cell Rep. 2006 May;25(5):392-402.
  11. Ho TL., Te-chato S., Yenchon S. Callus induction and plantlet regeneration systems in indica rice (Oryza sativa L.) cultivar Sangyod. Walailak J Sci & Tech 2018; 15(10): 753-763.
  12. Binte Mostafiz S, Wagiran A. Efficient Callus Induction and Regeneration in Selected Indica Rice. Agronomy. 2018; 8(5):77.
  13. Wu J, Chang X, Li C, Zhang Z, Zhang J, Yin C, Ma W, Chen H, Zhou F, Lin Y. QTLs Related to Rice Callus Regeneration Ability: Localization and Effect Verification of qPRR3. Cells. 2022 Dec 19;11(24):4125.
  14. Koo BH, Yoo SC, Park JW, Kwon CT, Lee BD, An G, Zhang Z, Li J, Li Z, Paek NC. Natural variation in OsPRR37 regulates heading date and contributes to rice cultivation at a wide range of latitudes. Mol Plant. 2013 Nov;6(6):1877-88.
  15. Taguchi-Shiobara F, Yamamoto T, Yano M, Oka S. Mapping QTLs that control the performance of rice tissue culture and evaluation of derived near-isogenic lines. Theor Appl Genet. 2006 Mar;112(5):968-76.
  16. Wang Y, Yang X, Xu G, Ye X, Ji Y, Lou X, Su J, Sun C, Fu Y, Zhang K. Mapping quantitative trait loci associated with callus browning in Dongxiang common wild rice (Oryza rufipogon Griff.). Mol Biol Rep. 2023 Apr;50(4):3129-3140.
  17. Huang C, Zhang J, Zhou D, Huang Y, Su L, Yang G, Luo W, Chen Z, Wang H, Guo T. Identification and candidate gene screening of qCIR9.1, a novel QTL associated with anther culturability in rice (Oryza sativa L.). Theor Appl Genet. 2021 Jul;134(7):2097-2111.
  18. Guo F, Wang H, Lian G, Cai G, Liu W, Zhang H, Li D, Zhou C, Han N, Zhu M, Su Y, Seo PJ, Xu L, Bian H. Initiation of scutellum-derived callus is regulated by an embryo-like developmental pathway in rice. Commun Biol. 2023 Apr 25;6(1):457.
  19. Zhang Z, Zhao H, Li W, Wu J, Zhou Z, Zhou F, Chen H, Lin Y. Genome-wide association study of callus induction variation to explore the callus formation mechanism of rice. J Integr Plant Biol. 2019 Nov;61(11):1134-1150.
  20. Zhang, YC., Zhou, YF., Cheng, Y, Huang JH, Lian JP, Yang L, He RR, Lei MQ, Liu YW, Yuan C, Zhao WL, Xiao S, Chen YQ. Genome-wide analysis and functional annotation of chromatin-enriched noncoding RNAs in rice during somatic cell regeneration. Genome Biol. 2022, 23: 28.
  21. Oladosu Y, Rafii MY, Samuel C, Fatai A, Magaji U, Kareem I, Kamarudin ZS, Muhammad I, Kolapo K. Drought Resistance in Rice from Conventional to Molecular Breeding: A Review. Int J Mol Sci. 2019 Jul 18;20(14):3519.
  22. Josefina O. Narciso and Kazumi Hattori. Genotypic differences in morphology and ultrastructures of callus derived from selected rice varieties. Philippine Science Letters. 2010, 3:1.
  23. Chu, C.C., Wang, C.S., Sun, C.C., Hsu, C., Yin, K.C. and Chu, C.Y. Establishment of an efficient medium for anther culture of rice through comparative experiments on the nitrogen sources, Rice research strategies for the future, IRRI. 1975, 610 p.
  24. Ling, D.H. and Yoshida, S. Study of some factors affecting somatic embryogenesis in I.R. lines of rice (Oryza sativa L.), Acta Bot. Sinica 1987, 29: 1-8.
  25. Indoliya Y, Tiwari P, Chauhan AS, Goel R, Shri M, Bag SK, Chakrabarty D. Decoding regulatory landscape of somatic embryogenesis reveals differential regulatory networks between japonica and indica rice subspecies. Sci Rep. 2016 Mar 14;6:23050.
  26. Zhao Y, Hu Y, Dai M, Huang L, Zhou DX. The WUSCHEL-related homeobox gene WOX11 is required to activate shoot-borne crown root development in rice. Plant Cell. 2009 Mar;21(3):736-48.
  27. Kareem A, Durgaprasad K, Sugimoto K, Du Y, Pulianmackal AJ, Trivedi ZB, Abhayadev PV, Pinon V, Meyerowitz EM, Scheres B, Prasad K. PLETHORA Genes Control Regeneration by a Two-Step Mechanism. Curr Biol. 2015 Apr 20;25(8):1017-30.
  28. Qiao J, Zhang Y, Han S, Chang S, Gao Z, Qi Y, Qian Q. OsARF4 regulates leaf inclination via auxin and brassinosteroid pathways in rice. Front Plant Sci. 2022 Sep 30;13:979033.
  29. Kim Y, Chung YS, Lee E, Tripathi P, Heo S, Kim KH. Root Response to Drought Stress in Rice (Oryza sativa L.). Int J Mol Sci. 2020 Feb 22;21(4):1513.
  30. Nguyen D, Rieu I, Mariani C, van Dam NM. How plants handle multiple stresses: hormonal interactions underlying responses to abiotic stress and insect herbivory. Plant Mol Biol. 2016 Aug;91(6):727-40.
  31. Suzuki, N. Hormone signaling pathways under stress combinations. Plant Signal Behav. 2016 Nov;11(11):e1247139.
  32. Dar SA, Nawchoo IA, Tyub S, Kamili AN. Effect of plant growth regulators on in vitro induction and maintenance of callus from leaf and root explants of Atropa acuminata Royal ex Lindl. Biotechnol Rep (Amst). 2021 Nov 14;32:e00688.
  33. Jin J, Essemine J, Duan JL, Xie QJ, Zhu J, Cai WM. Regeneration of active endogenous IAA in rice calli following acclimation to 2,4-D free medium. Plant Growth Regul. 2021;93:203-220.
  34. Gamborg OL, Miller RA, Ojima K. Nutrient requirements of suspension cultures of soybean root cells. Exp Cell Res. 1968 Apr;50(1):151-8.
  35. Shao Q, Liu X, Su T, Ma C, Wang P. New Insights Into the Role of Seed Oil Body Proteins in Metabolism and Plant Development. Front Plant Sci. 2019 Dec 10;10:1568.
  36. Saadat, F. A computational study on the structure-function relationships of plant caleosins. Sci Rep. 2023; 13, 72.
  37. Chen DH, Chyan CL, Jiang PL, Chen CS, Tzen JT. The same oleosin isoforms are present in oil bodies of rice embryo and aleurone layer while caleosin exists only in those of the embryo. Plant Physiol Biochem. 2012 Nov;60:18-24.
  38. Hanano A, Bl?e E, Murphy DJ. Caleosin/peroxygenases: multifunctional proteins in plants. Ann Bot. 2023 Apr 4;131(3):387-409.
  39. Shang B, Xu C, Zhang X, Cao H, Xin W, Hu Y. Very-long-chain fatty acids restrict regeneration capacity by confining pericycle competence for callus formation in Arabidopsis. Proc Natl Acad Sci U S A. 2016 May 3;113(18):5101-6.
  40. Wan X, Wu S, Li Z, An X, Tian Y. Lipid Metabolism: Critical Roles in Male Fertility and Other Aspects of Reproductive Development in Plants. Mol Plant. 2020 Jul 6;13(7):955-983.
  41. Furuta K, Kubo M, Sano K, Demura T, Fukuda H, Liu YG, Shibata D, Kakimoto T. The CKH2/PKL chromatin remodeling factor negatively regulates cytokinin responses in Arabidopsis calli. Plant Cell Physiol. 2011 Apr;52(4):618-28.
  42. Xiao J, Jin R, Wagner D. Developmental transitions: integrating environmental cues with hormonal signaling in the chromatin landscape in plants. Genome Biol. 2017 May 10;18(1):88.
  43. Guo H, Guo H, Zhang L, Fan Y, Wu J, Tang Z, Zhang Y, Fan Y, Zeng F. Dynamic Transcriptome Analysis Reveals Uncharacterized Complex Regulatory Pathway Underlying Genotype-Recalcitrant Somatic Embryogenesis Transdifferentiation in Cotton. Genes (Basel). 2020 May 7;11(5):519.
  44. Murashige, T. and Skoog, F. A revised method for rapid growth and bioassays with tobacco tissue cultures. Physiologia Plantarum 1962, 15: 473-479.
  45. Osabe D, Tanahashi T, Nomura K, Shinohara S, Nakamura N, Yoshikawa T, Shiota H, Keshavarz P, Yamaguchi Y, Kunika K, Moritani M, Inoue H, Itakura M. Evaluation of sample size effect on the identification of haplotype blocks. BMC Bioinformatics. 2007 Jun 14;8:200.
  46. Sun B, Ding X, Ye J, Dai Y, Cheng C, Zhou J, Niu F, Tu R, Hu Q, Xie K, Qiu Y, Li H, Feng Z, Shao C, Cao L, Zhang A, Chu H. Unveiling the Genetic Basis Underlying Rice Anther Culturability via Segregation Distortion Analysis in Doubled Haploid Population. Genes (Basel). 2023 Nov 17;14(11):2086.
  47. Chun HJ, Baek D, Jin BJ, Cho HM, Park MS, Lee SH, Lim LH, Cha YJ, Bae DW, Kim ST, Yun DJ, Kim MC. Microtubule Dynamics Plays a Vital Role in Plant Adaptation and Tolerance to Salt Stress. Int J Mol Sci. 2021 May 31;22(11):5957.
  48. Park JS, Choi Y, Jeong MG, Jeong YI, Han JH, Choi HK. Uncovering transcriptional reprogramming during callus development in soybean: insights and implications. Front Plant Sci. 2023 Aug 4;14:1239917.
  49. Wang D, Guo Y, Wu C, Yang G, Li Y, Zheng C. Genome-wide analysis of CCCH zinc finger family in Arabidopsis and rice. BMC Genomics. 2008 Jan 27;9:44.
  50. Zhang Q, Xie J, Zhu X, Ma X, Yang T, Khan NU, Zhang S, Liu M, Li L, Liang Y, Pan Y, Li D, Li J, Li Z, Zhang H, Zhang Z. Natural variation in Tiller Number 1 affects its interaction with TIF1 to regulate tillering in rice. Plant Biotechnol J. 2023 May;21(5):1044-1057.
  51. Liu L, Trendel J, Jiang G, Liu Y, Bruckmann A, Küster B, Sprunck S, Dresselhaus T, Bleckmann A. RBPome identification in egg-cell like callus of Arabidopsis. Biol Chem. 2023 Sep 29;404(11-12):1137-1149.
  52. Shaikh AA, Alamin A, Jia C, Gong W, Deng X, Shen Q, Hong Y. The Examination of the Role of Rice Lysophosphatidic Acid Acyltransferase 2 in Response to Salt and Drought Stresses. Int J Mol Sci. 2022 Aug 29;23(17):9796.
  53. Wang, J. and Zhang, Z. GAPIT Version 3: boosting power and accuracy for genomic association and prediction. Genomics, proteomics & bioinformatics 2021, 19(4), pp.629-640.
  54. Evanno G, Regnaut S, Goudet J. Detecting the number of clusters of individuals using the software STRUCTURE: a simulation study. Mol Ecol. 2005 Jul;14(8):2611-20.
  55. Lipka AE, Tian F, Wang Q, Peiffer J, Li M, Bradbury PJ, Gore MA, Buckler ES, Zhang Z. GAPIT: genome association and prediction integrated tool. Bioinformatics. 2012 Sep 15;28(18):2397-9.
  56. Hao Z, Lv D, Ge Y, Shi J, Weijers D, Yu G, Chen J. RIdeogram: drawing SVG graphics to visualize and map genome-wide data on the idiograms. PeerJ Comput Sci. 2020 Jan 20;6:e251.
  57. Kaler AS, Purcell LC. Estimation of a significance threshold for genome-wide association studies. BMC Genomics. 2019 Jul 29;20(1):618.
  58. Turner, S.D. qqman: An R package for visualizing GWAS results using QQ and manhattan plots. bioRxiv 2014, 005165. [Google Scholar]
  59. Dong SS, He WM, Ji JJ, Zhang C, Guo Y, Yang TL. LDBlockShow: a fast and convenient tool for visualizing linkage disequilibrium and haplotype blocks based on variant call format files. Brief Bioinform. 2021 Jul 20;22(4):bbaa227.
  60. McLaren W, Gil L, Hunt SE, Riat HS, Ritchie GR, Thormann A, Flicek P, Cunningham F. The Ensembl Variant Effect Predictor. Genome Biol. 2016 Jun 6;17(1):122.
  61. Zhang R, Jia G, Diao X. geneHapR: an R package for gene haplotypic statistics and visualization. BMC Bioinformatics. 2023 May 15;24(1):199.
  62. Kawahara Y, de la Bastide M, Hamilton JP, Kanamori H, McCombie WR, Ouyang S, Schwartz DC, Tanaka T, Wu J, Zhou S, Childs KL, Davidson RM, Lin H, Quesada-Ocampo L, Vaillancourt B, Sakai H, Lee SS, Kim J, Numa H, Itoh T, Buell CR, Matsumoto T. Improvement of the Oryza sativa Nipponbare reference genome using next generation sequence and optical map data. Rice (N Y). 2013 Feb 6;6(1):4.
  63. Miklaszewska M, Zienkiewicz K, Klugier-Borowska E, Rygielski M, Feussner I, Zienkiewicz A. CALEOSIN 1 interaction with AUTOPHAGY-RELATED PROTEIN 8 facilitates lipid droplet microautophagy in seedlings. Plant Physiol. 2023 Nov 22;193(4):2361-2380.
  64. Zeng X, Jiang J, Wang F, Liu W, Zhang S, Du J, Yang C. Rice OsClo5, a caleosin protein, negatively regulates cold tolerance through the jasmonate signalling pathway. Plant Biol (Stuttg). 2022 Jan;24(1):52-61.
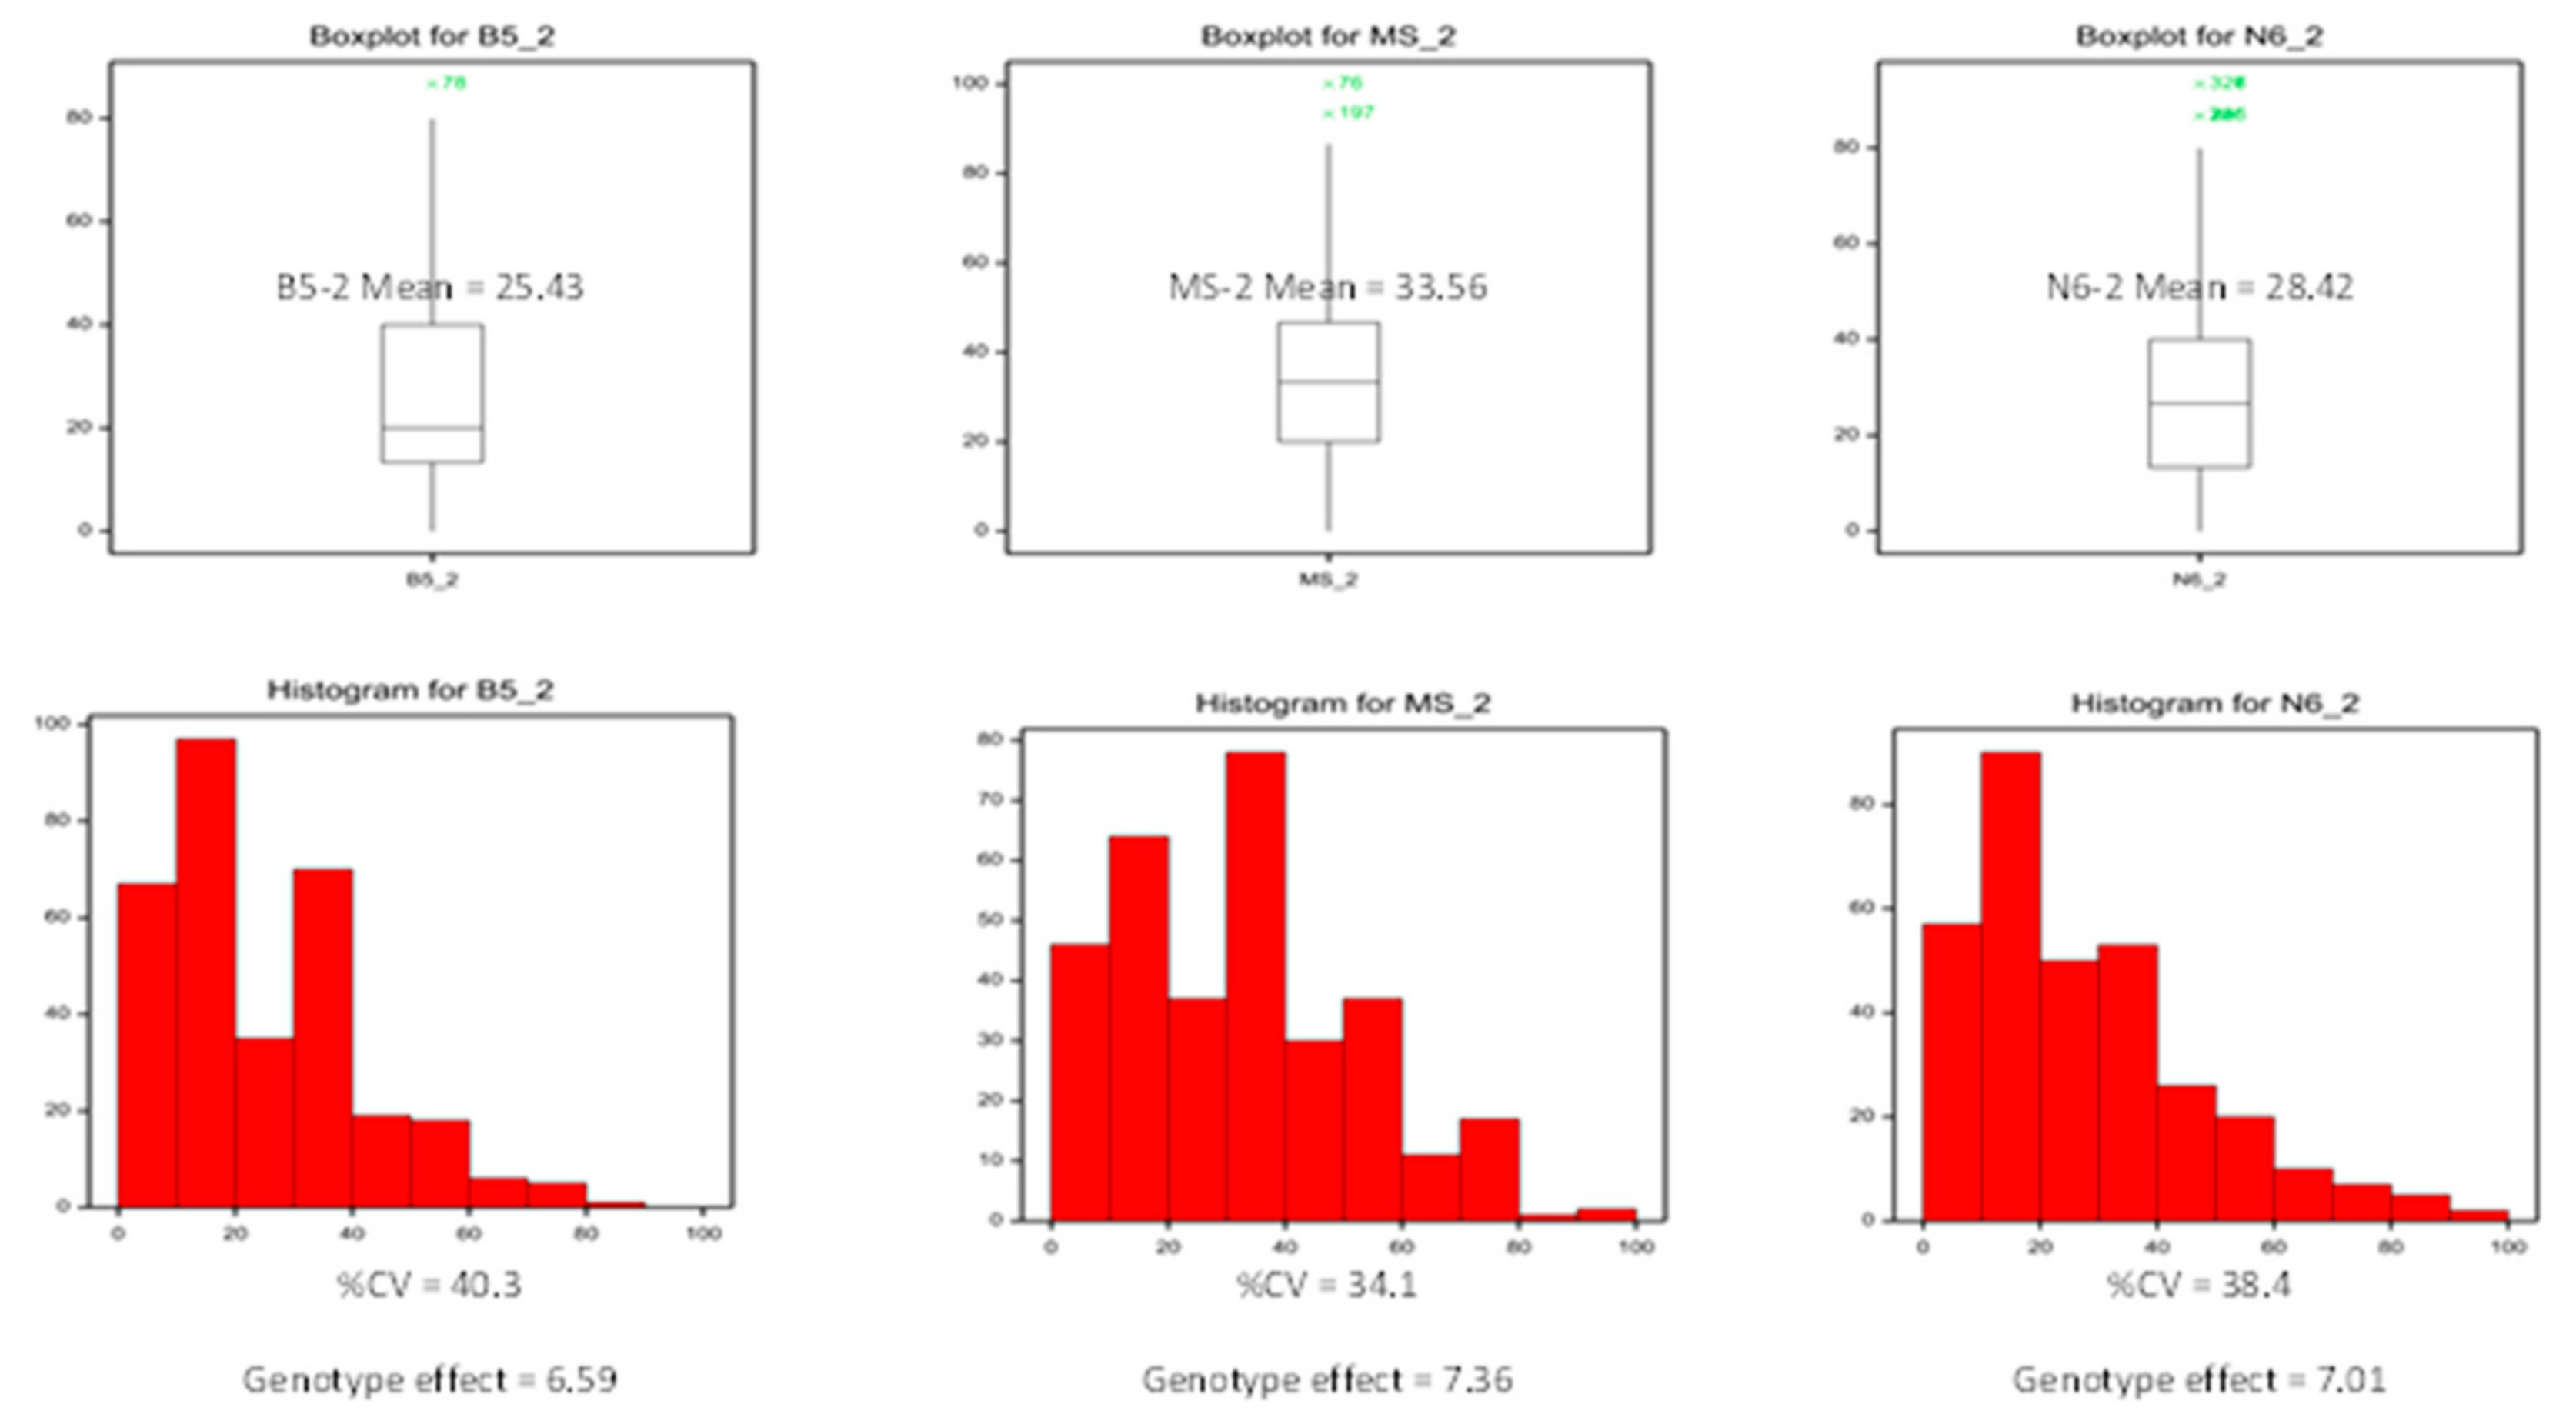
Figure 1. The CI of 110 rice accessions in three tissue culture media, including B5, MS, and N6. The Boxplots and Histogram columns showed the distribution of % CI for each medium of 110 rice accessions.
Preprints 110871 g001
Figure 2. A) The SNP density on rice chromosomes, B) the population structure of 110 rice accessions, C) the Principal component analysis (PCA) and kinship relatedness analysis of 110 genotypes, and D) the Kinship matrix of 110 individuals displayed as a heatmap.
Preprints 110871 g002
Figure 3. Linkage disequilibrium decay across 12 chromosomes in 110 O. sativa accessions. Mean LD decay ranges between 70–259 Kb.
Preprints 110871 g003
Figure 4. Manhattan plots resulting from the genome-wide association study (GWAS) results for the CI in three tissue culture media: (A) B5, (B) MS, and (C) N6. Red lines indicate the cut-off threshold at −log10 (p) of 5.0.
Preprints 110871 g004
Figure 5. Analysis of associated regions and haplotype analysis within the qCI-B5-Chr6 region. (A) Manhattan plots and LD heatmap across the 475-kb region surrounding the significant SNP. The black triangle in the LD heatmap indicates the candidate haploblock. (B) – (D) Boxplots show the distribution of %CI and haplotype analysis for the genes Os06g0256600, Os06g0255200, and Os06g0254200.
Preprints 110871 g005
Figure 6. Analysis of associated regions and haplotypes within the qCI-MS-Chr2 (A) and qCI-MS-Chr6 (B) regions.
Preprints 110871 g006
Figure 7. Analysis of associated regions and haplotypes within the qCI-N6-Chr6.1 region. (A) Manhattan plot and LD heatmap across the 475-kb region surrounding the significant SNP. The black triangle in the LD heatmap indicates the candidate haploblock. (B) – (D) Boxplots show the distribution of %CI and haplotype analysis for the genes Os06g0169600, Os06g0169800, and Os06g0170500.
Preprints 110871 g007
Figure 8. Analysis of associated regions and haplotype analysis within the qCI-N6-Chr6.2 region. (A) Manhattan plot and LD heatmap across the 476-kb region surrounding the significant SNP. The black triangle in the LD heatmap indicates the candidate haploblock. (B) Boxplot shows the distribution of %CI and haplotype analysis for the Os06g0254600 gene.
Preprints 110871 g008
Figure 9. Analysis of associated regions and haplotype analysis within the qCI-N6-Chr7 region. (A) Manhattan plot and LD heatmap across the 248-kb region surrounding the significant SNP. The black triangle in the LD heatmap indicates the candidate haploblock. (B) – (C) Boxplots show the distribution of %CI and haplotype analysis for the genes Os07g0256200 and Os07g0256866.
Preprints 110871 g009
Figure 10. Analysis of associated regions and haplotype analysis of the qCI-N6-Chr11 region. (A) Manhattan plot and LD heatmap across the 136-kb region surrounding the significant SNP. The black triangle in the LD heatmap indicates the candidate haploblock. (B) – (C) Boxplots show the distribution of %CI and haplotype analysis for the genes Os11g0637700 and Os11g0637800.
Preprints 110871 g010
Table 1. The single-nucleotide polymorphisms (SNPs) that are associated with callus induction (CI) in three tissue culture media and annotated genes located in the 400-kb regions.
Media QTL SNP id. Chr Pos P.value MAF Effect
B5 qCI-B5-Chr6 S6_8152623 6 8,152,623 1.75E-06 0.17 -13.81
MS qCI-MS-Chr2 S2_8960153 2 8,960,153 4.74E-06 0.13 -13.38
qCI-MS-Chr6 S6_16813533 6 16,813,533 2.19E-06 0.06 23.91
N6 qCI-N6-Chr6.1 S6_3503834 6 3,503,834 1.67E-06 0.17 15.15
qCI-N6-Chr6.2 S6_8003634 6 8,003,634 2.20E-06 0.26 -10.82
qCI-N6-Chr7 S7_8744083 7 8,744,083 2.00E-07 0.21 16.03
qCI-N6-Chr11 S11_25174226 11 25,174,226 3.13E-07 0.47 9.94
Table 2. Summary of the identified genes within each QTL.
QTLs block start (bp) block end (bp) block size (bp) #SNPs #genes #candidate genes Annotation of the candidate genes
qCI-B5-Chr6 7,934,342 8,198,412 264,070 56 21 16 Os06g0252800, Os06g0253100, Os06g0253350, Os06g0253600, Os06g0254200, Os06g0254300, Os06g0254600, Os06g0255200, Os06g0255700, Os06g0255900, Os06g0256000, Os06g0256500, Os06g0256600, Os06g0256800, Os06g0257050, Os06g0257200
qCI-MS-Chr2 8,906,794 8,968,876 62,082 12 4 0
qCI-MS-Chr6 16,575,366 16,981,445 406,079 31 13 0
qCI-N6-Chr6.1 3,483,450 3,555,107 71,657 7 4 3 Os06g0169600, Os06g0169800, Os06g0170500
qCI-N6-Chr6.2 7,995,999 8,014,002 18,003 4 1 1 Os06g0254600
qCI-N6-Chr7 8,734,157 8,858,375 124,218 11 5 2 Os07g0256200, Os07g0256866
qCI-N6-Chr11 25,104,139 25,244,312 140,173 56 13 10 Os11g0636900, Os11g0637050, Os11g0637000, Os11g0637100, Os11g0637200, Os11g0637600, Os11g0637700, Os11g0637800, Os11g0637900, Os11g0638200
Disclaimer/Publisher’s Note: The statements, opinions and data contained in all publications are solely those of the individual author(s) and contributor(s) and not of MDPI and/or the editor(s). MDPI and/or the editor(s) disclaim responsibility for any injury to people or property resulting from any ideas, methods, instructions or products referred to in the content.
Copyright: This open access article is published under a Creative Commons CC BY 4.0 license, which permit the free download, distribution, and reuse, provided that the author and preprint are cited in any reuse.
Prerpints.org logo

Preprints.org is a free preprint server supported by MDPI in Basel, Switzerland.

Subscribe

© 2024 MDPI (Basel, Switzerland) unless otherwise stated