1. Introduction
Okra, scientifically known as *
Abelmoschus esculentus*, belongs to the mallow family and is renowned for its semi-fibrous nature. Grown primarily in warm regions as an annual crop, and as a perennial in hotter climates, okra is valued not only for its edible fruit but also for its leaves, seeds, flower parts, and stems. This versatile vegetable is cultivated across tropical, subtropical, and temperate regions worldwide, making it a staple in various cuisines [
1]. Known by different names such as bhindi, okura, quimgombo, bamia, and gombo [
2], okra has found global popularity. Although traditionally not a major crop in most European countries due to its preference for warm climates, some Southern European countries are experimenting with its cultivation due to changing agricultural practices and climate conditions. Despite being less commonly grown in Europe and North America, okra is gaining popularity in these regions due to its high nutritional value, which includes vitamins and other beneficial compounds [
3]. Globally, okra production is estimated at approximately 9.96 million tons, with India leading at 6.18 million tons, followed by Nigeria with 1.82 million tons [
4]. India is a significant exporter, sending substantial quantities to the Middle East, the United Kingdom, Western Europe, and the United States [
5]. Okra pods are rich in calcium, dietary fiber, vitamins, polyphenols, and other bioactive compounds, offering numerous health benefits, including anti-inflammatory, antioxidant, anti-carcinogenic, anti-obesity, anti-diabetic, and anti-cardiovascular properties. [
6,
7]
However, the freshness loss during transportation poses significant waste and economic challenges. Okra quality is influenced by factors such as variety, growth environment, maturity stage, and harvesting and storage methods, leading to national economic challenges [
8]. Fresh okra has a limited shelf life and is prone to water loss, with optimal sensory quality typically observed around six days post-harvest. Assessing okra tenderness is crucial for evaluating its quality, traditionally done through manual observation and destructive means, which are time-consuming, prone to errors, and can lead to harvest losses [
9,
10,
11]. Okra’s desirable qualitative attributes include length, diameter, greenness, mucilage, and fiber content. Medium-sized fruits (8.9–12.7 cm) are preferred by industry and commerce, although smaller fruits are also often accepted. Certain levels of greenness and fruit diameter are necessary, but these are frequently assessed arbitrarily [
12].
Traditional methods of assessing tenderness involve manual observation of pod size, color, and tip flexibility, performed by experts. These methods are labor-intensive, tedious, prone to errors, and can cause harvest losses. Early harvesting results in low yield, while late harvesting causes browning and fibrosis, rendering the okra inedible [
13,
14]. Destructive mechanical hardness is frequently measured using a texture analyzer. As fruits mature, texture changes occur, particularly during ripening, leading to softer produce. Additionally, moisture loss can impact texture. To overcome the limitations of traditional methods, non-destructive techniques have been developed for fruit and vegetable quality assessment. These methods examine internal and external characteristics without causing harm, thus preserving the product’s integrity [
15]. Grading lines equipped with sensors for external parameters such as color, size, and appearance have become commonplace [
16]. Visible and near-infrared (Vis-NIR) hyperspectral imaging is a non-destructive tool used to evaluate maturity and moisture content in okra, aiding in determining the optimal harvest time [
17].
In the agri-food sector, advancements in tactile sensors and manufacturing methods have led to the development of robotic systems capable of non-destructive quality assessment. Tactile sensors enable robots to gently handle delicate foods, assess ripeness, and sort produce based on texture [
18]. Texture recognition is critical for robotic systems, allowing them to differentiate between diverse surface properties [
19]. Impact analysis has been applied to various fruits and vegetables, including mangos [
20], peaches [
21], apples [
22], kiwis [
23],and dragon fruit [
24].
This study aims to evaluate the freshness and tenderness of okra using a non-destructive impact device attached to a robotic arm. By leveraging advanced sensor technology, we seek to provide a more efficient, accurate, and non-damaging method of quality assessment, thereby reducing waste and improving supply chain efficiency.
2. Materials and Methods
The description outlines an experiment involving the evaluation of ‘Clemson’ variety fresh okra pods sourced from a local trader in Valencia, Spain.
2.1. Sample Selection
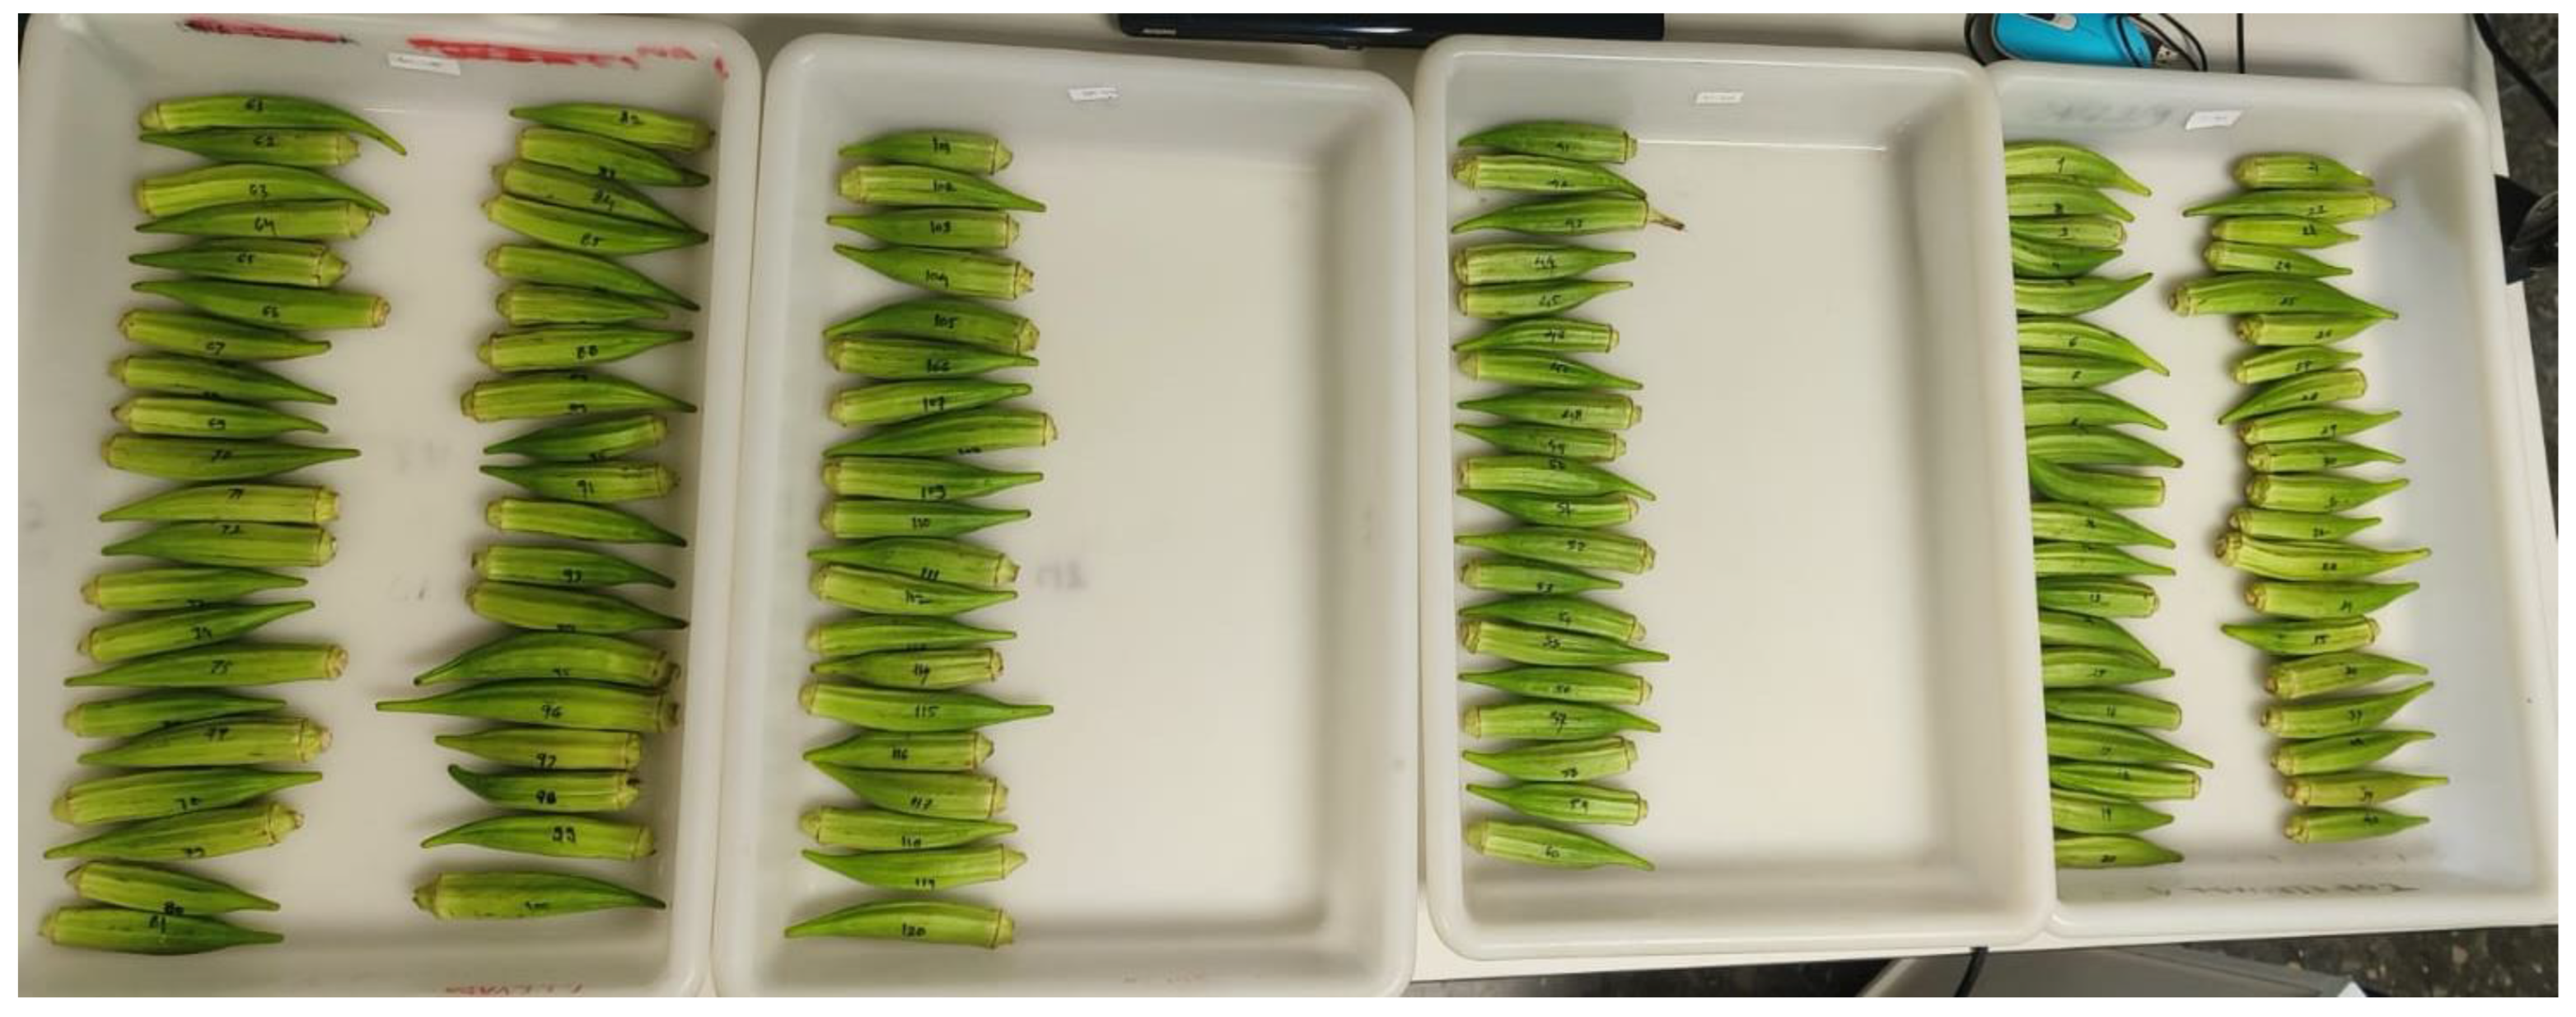
Initially, 120 okra pods were chosen based on criteria such as homogeneity in size and color, absence of physical damage, and the lack of diseases or infections. Each pod was individually numbered from 1 to 120.
Figure 1.
Distribution of 120 Okra Pods two groups of 60 similar okra pods each for storage in a cold chamber (Group A) and ambient conditions (Group B), respectively.
Figure 1.
Distribution of 120 Okra Pods two groups of 60 similar okra pods each for storage in a cold chamber (Group A) and ambient conditions (Group B), respectively.
2.2. Group Division
The 120 pods were then randomly split into two groups, each consisting of 60 similar okra pods. In order to produce a set of products with acceptable quality conditions and another set with unacceptable quality conditions., one group was stored in a cold chamber condition for 24 hours (“Acquired pods”, tender set), while the other group was stored at ambient conditions for two days and then shifted to a cold environment for five more days (“Stored pods” not tender set).
2.3. Assessment and Timing
The pods from both sets (Acquired and Stored) were evaluated using two distinct methods - a non-destructive method and a destructive method. The assessment for the “Acquired pods” took place on December 13, 2023, while the evaluation for the “Stored pods” occurred on December 19, 2023.
The assessment involves both non-destructive and destructive methods to analyze the pods.
2.4. Non-Destructive Methods for Assessing Tenderness
On December 13, 2023, fruits from the “Acquired pods” set were brought to the robotics laboratory and tested with the robotic impact device [
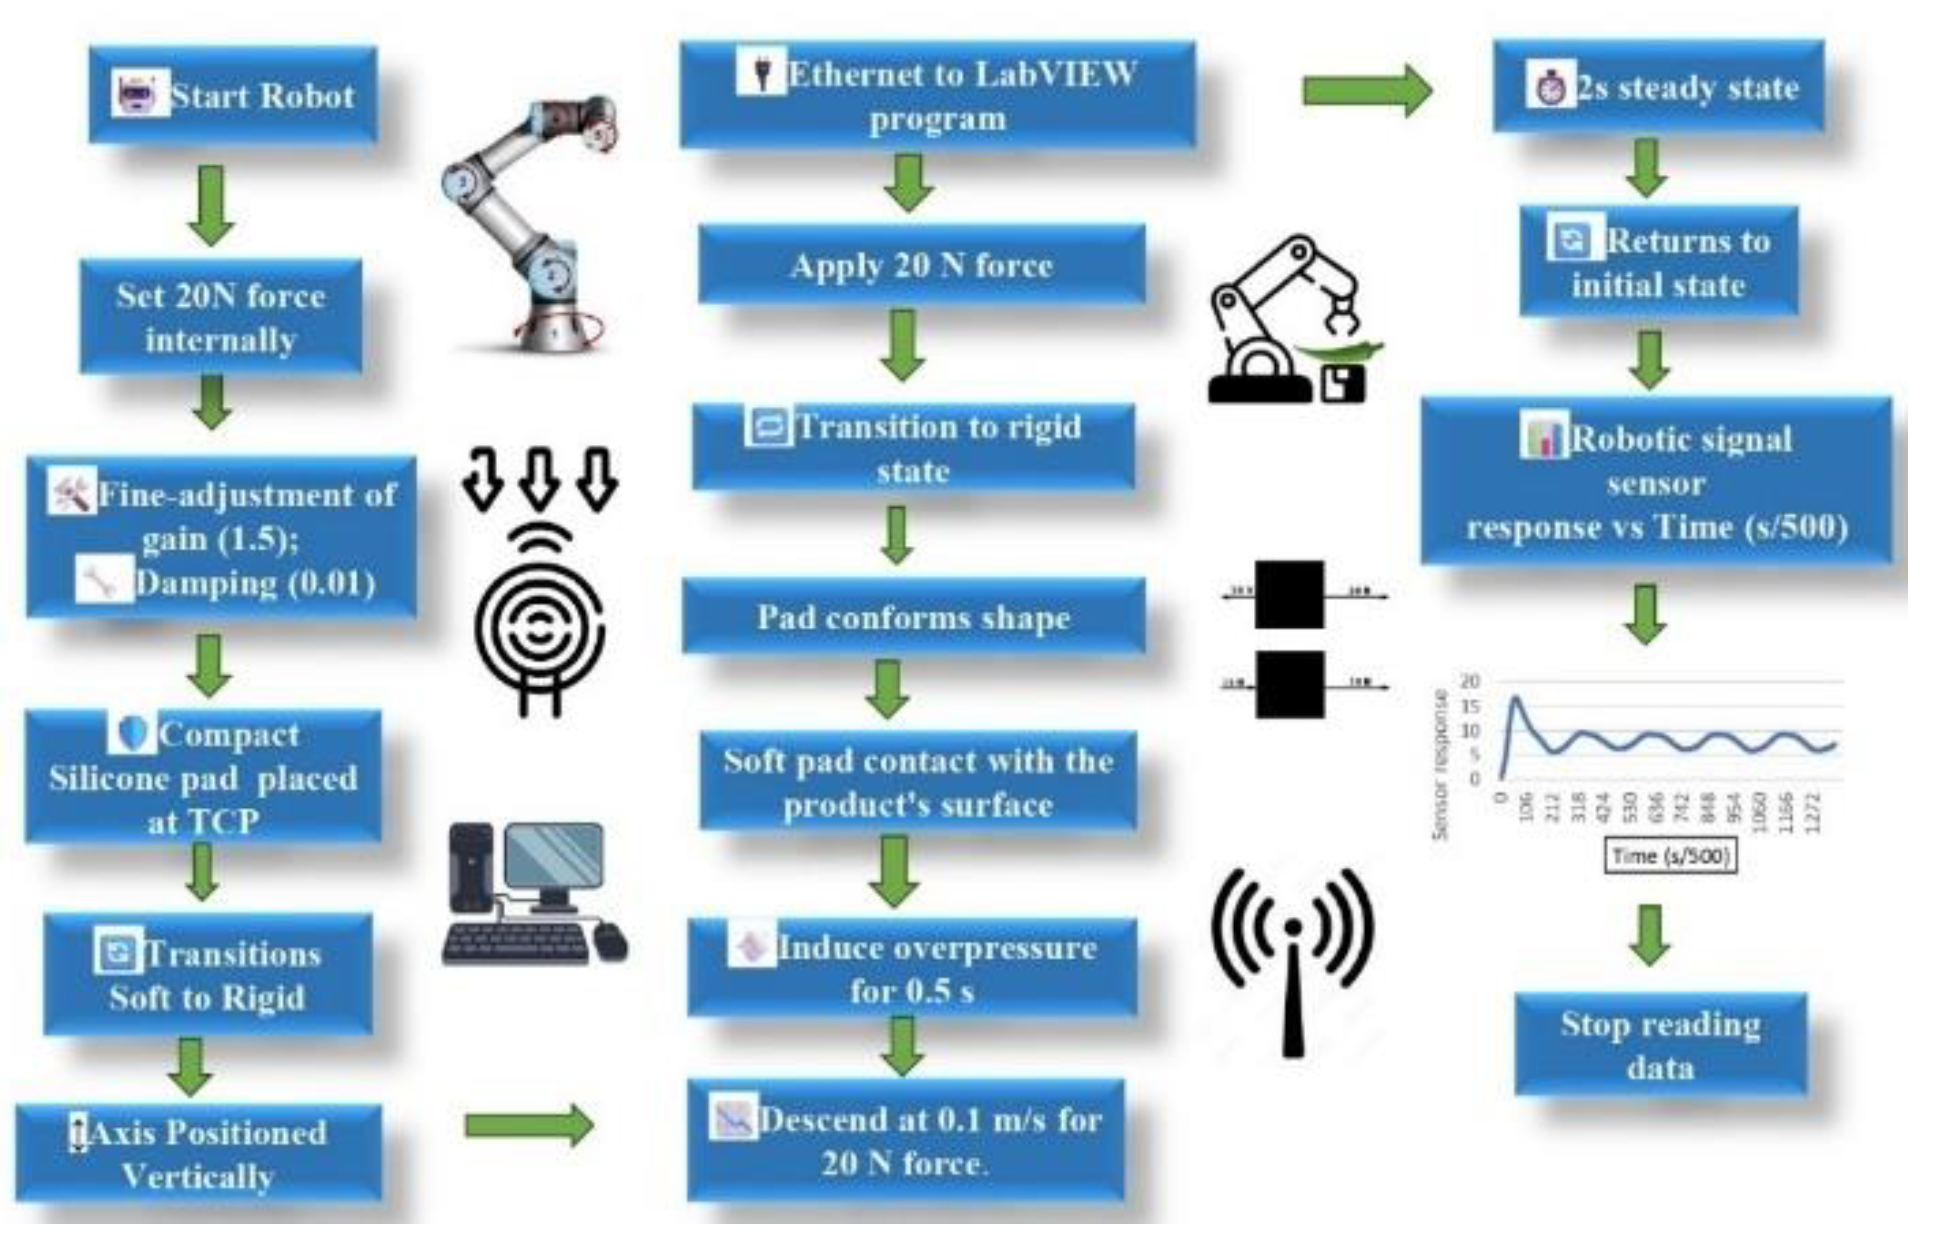
24]. The Universal Robot UR5e’s internal force sensor, located just before the Tool Center Point (TCP) in Odense, Denmark, served as a tactile sensor for assessing product conditions. With six degrees of freedom, this sensor enabled precise force control. Achieving the target force of 20 N involved utilizing internal motion control functionalities at the TCP, incorporating a gain adjustment of 1.5 and damping at 0.01, fine-tuned through experimentation to achieve an underdamped response. To safeguard the product from potential damage, the robot’s TCP featured a compact silicone pad filled with granular fluid. This pad seamlessly transitioned from a soft (quasi-liquid) to a rigid state (quasi-solid) by regulating internal pressure. Control of the pad was orchestrated by a Festo vacuum generator (VADMI-300-LS-P, Esslingen, Germany). The operational sequence initiated by positioning the robot’s sixth axis vertically above the product involved descending at a controlled rate of 0.1 m/s in force control mode to reach a force of 20 N. Just before contact, the vacuum generator induced overpressure in the pad for 0.5 seconds, ensuring a soft pad upon contact.
Upon achieving the target force, the pad’s surface conformed to the specific shape of the product. Activating the vacuum caused the pad to transition to a rigid state, molding to the contact area on the product. The subsequent vertical ascent by 50 millimeters, followed by descent in force control mode to apply a 20 N force on the product, was accompanied by the transmission of the vertical force signal via Ethernet to a LabVIEW program by National Instruments in Austin, TX, USA. Signal stabilization typically occurred after about 2 seconds, reaching a steady state. The robot then returned to its initial position, concluding the information transmission.
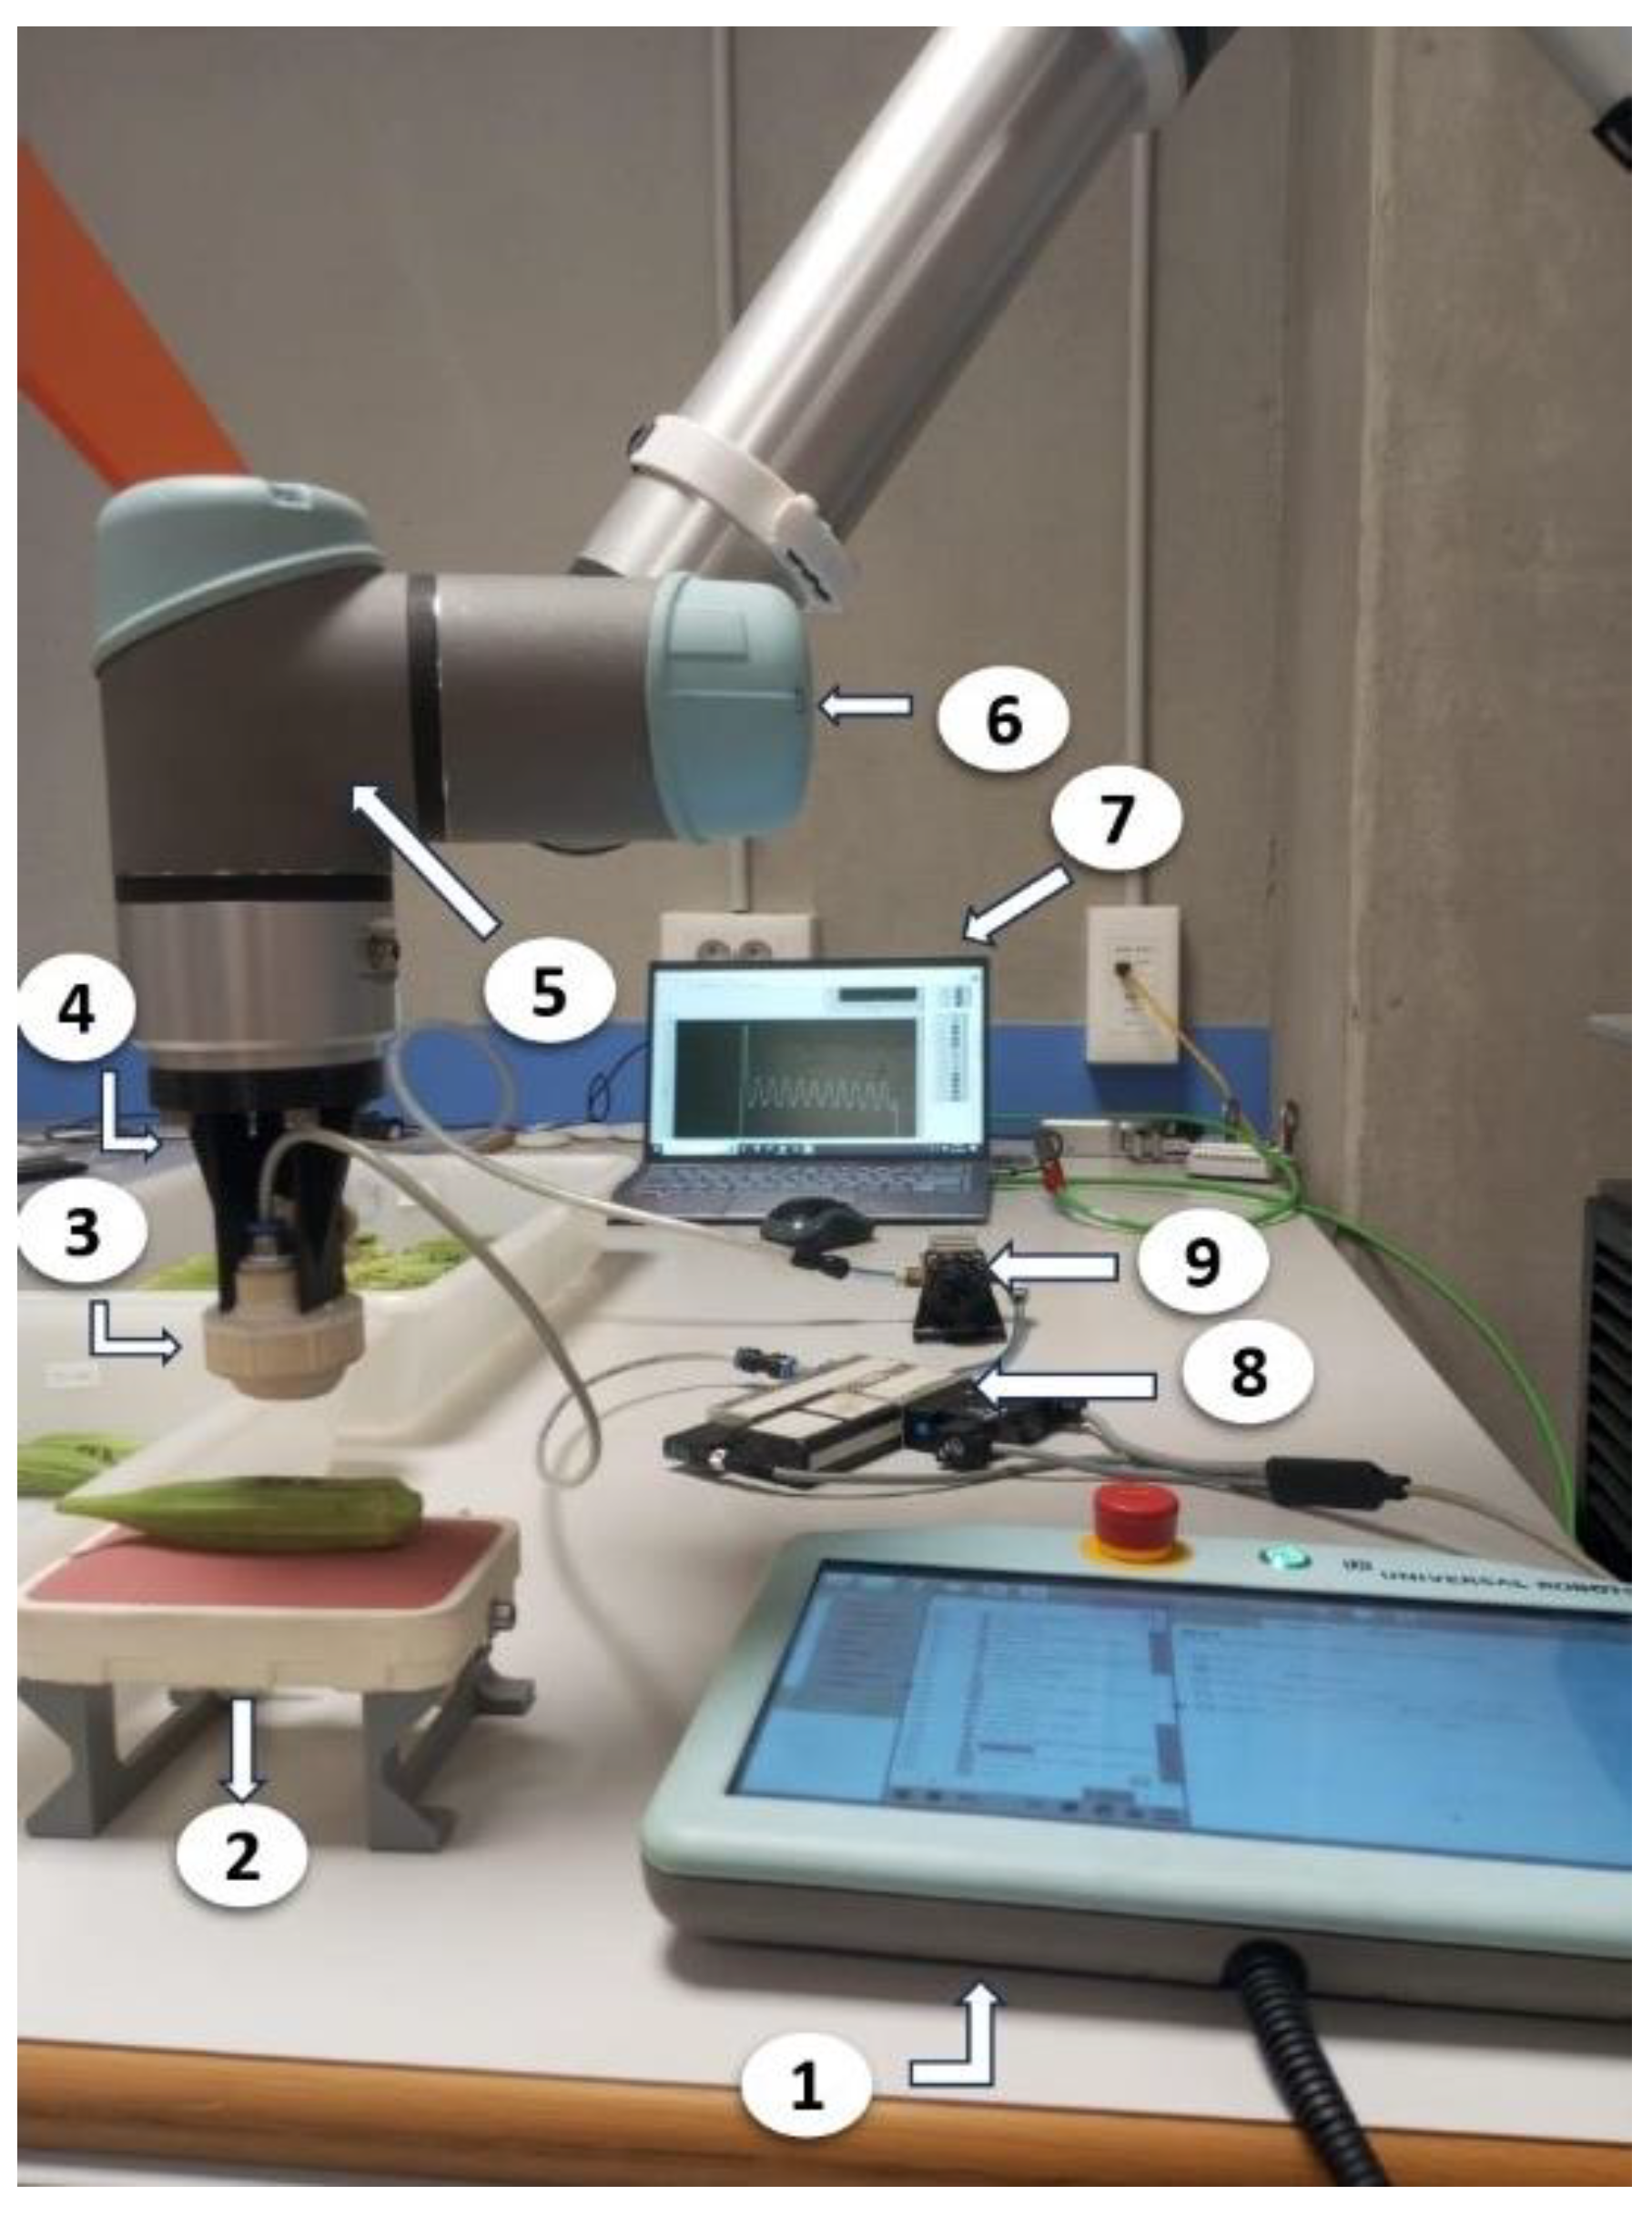
Figure 2 provides a visual representation of the complete process, detailing the devices used and communication pathways. A similar process was conducted on December 19, 2023, specifically for the “Stored pods” set.
Based on previous studies [
24] the parameters extracted from the robotic sensor signal were: maximum force (
Fmax), first slope (
S1), second slope (
S2), the first overshoot (
Os), and the steady-state (
Ss),
Figure 2 and Equation (1).
Os=(Fmax−Ss)/Ss (1)
Figure 3.
Robot Components 1) Teach Pendant 2) Bottom Jamming Pad 3) Upper Jamming Pad 4) PLA 3D printed adapter 5) Wrist 1 of the UR5e 6) Wrist 2 of the UR5e 7) PC, connected with the UR with Ethernet 8) Vacuum generator 9) Pressure Regulator.
Figure 3.
Robot Components 1) Teach Pendant 2) Bottom Jamming Pad 3) Upper Jamming Pad 4) PLA 3D printed adapter 5) Wrist 1 of the UR5e 6) Wrist 2 of the UR5e 7) PC, connected with the UR with Ethernet 8) Vacuum generator 9) Pressure Regulator.
2.5. Destructive Methods for Assessing Tenderness
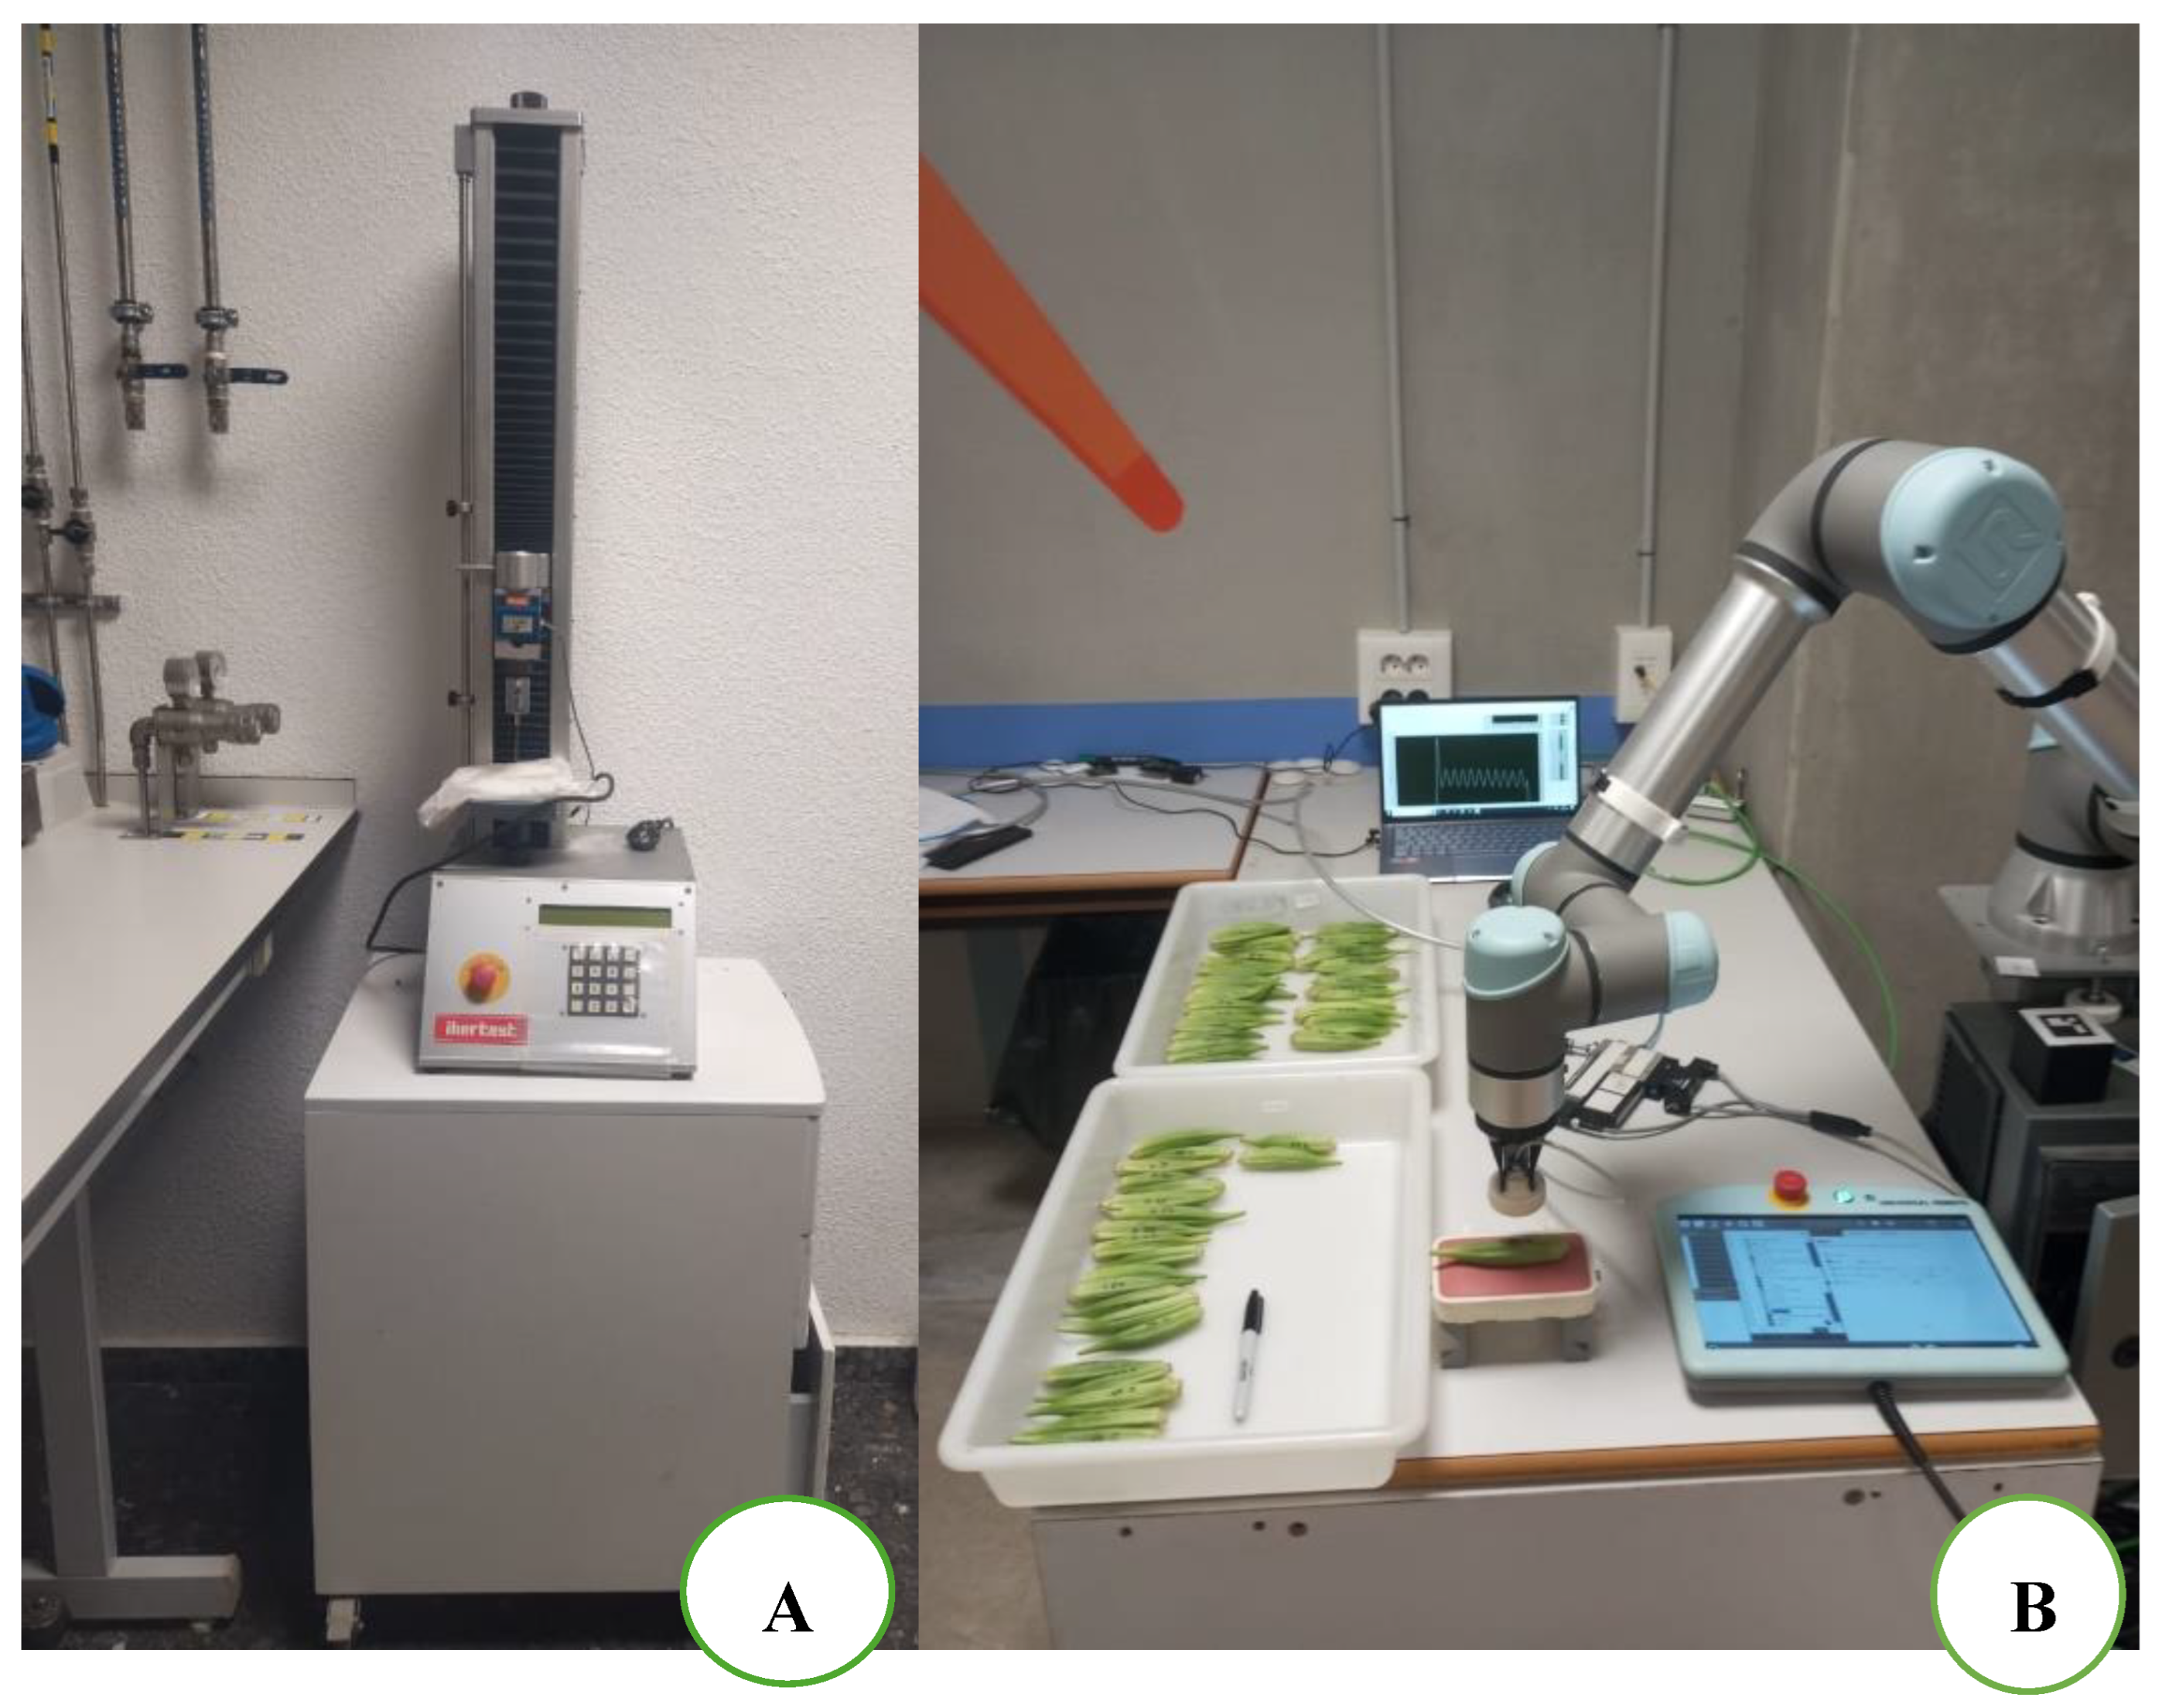
Individual pod weight measurements were performed following the completion of the non-destructive robotic measurements. Initial weight (12/12/2023 and 13/12/2023) of pods and final weight at (19/12/2023) (before the destructive firmness test) was measured for the two sets. “The weight measurement is non-destructive. A universal stress strain machine (Ibertest, model IBTH 2730,
www.ibertest.es was used to assess the firmness at a constant speed of 1.67 ms−1. The tenderness of each pod was assessed at two different locations throughout the equatorial area using two different tests, puncture compression test of 0.006 m (using a cylindrical needle of 0.001 m diameter) and compression test 6 mm (using a Magness-Taylor rod of 0.008 m diameter). Every fruit’s firmness was assessed twice at equatorial region. similar process used for okra which from the “Stored pods” set on December 19, 2023. Non-destructive variables to the destructive tenderness, the destructive tenderness will serve as the reference tenderness value. An expert assessed other maturity parameters visually (cutting edge of okra).
Figure 4.
(A) Universal Stress-Strain Machine: Assessing Tenderness and Texture of Okra Pods (B) Universal Robot UR5e’s Impact Sensor for Assessing Okra Pod Tenderness” tenderness.
Figure 4.
(A) Universal Stress-Strain Machine: Assessing Tenderness and Texture of Okra Pods (B) Universal Robot UR5e’s Impact Sensor for Assessing Okra Pod Tenderness” tenderness.
3. Results
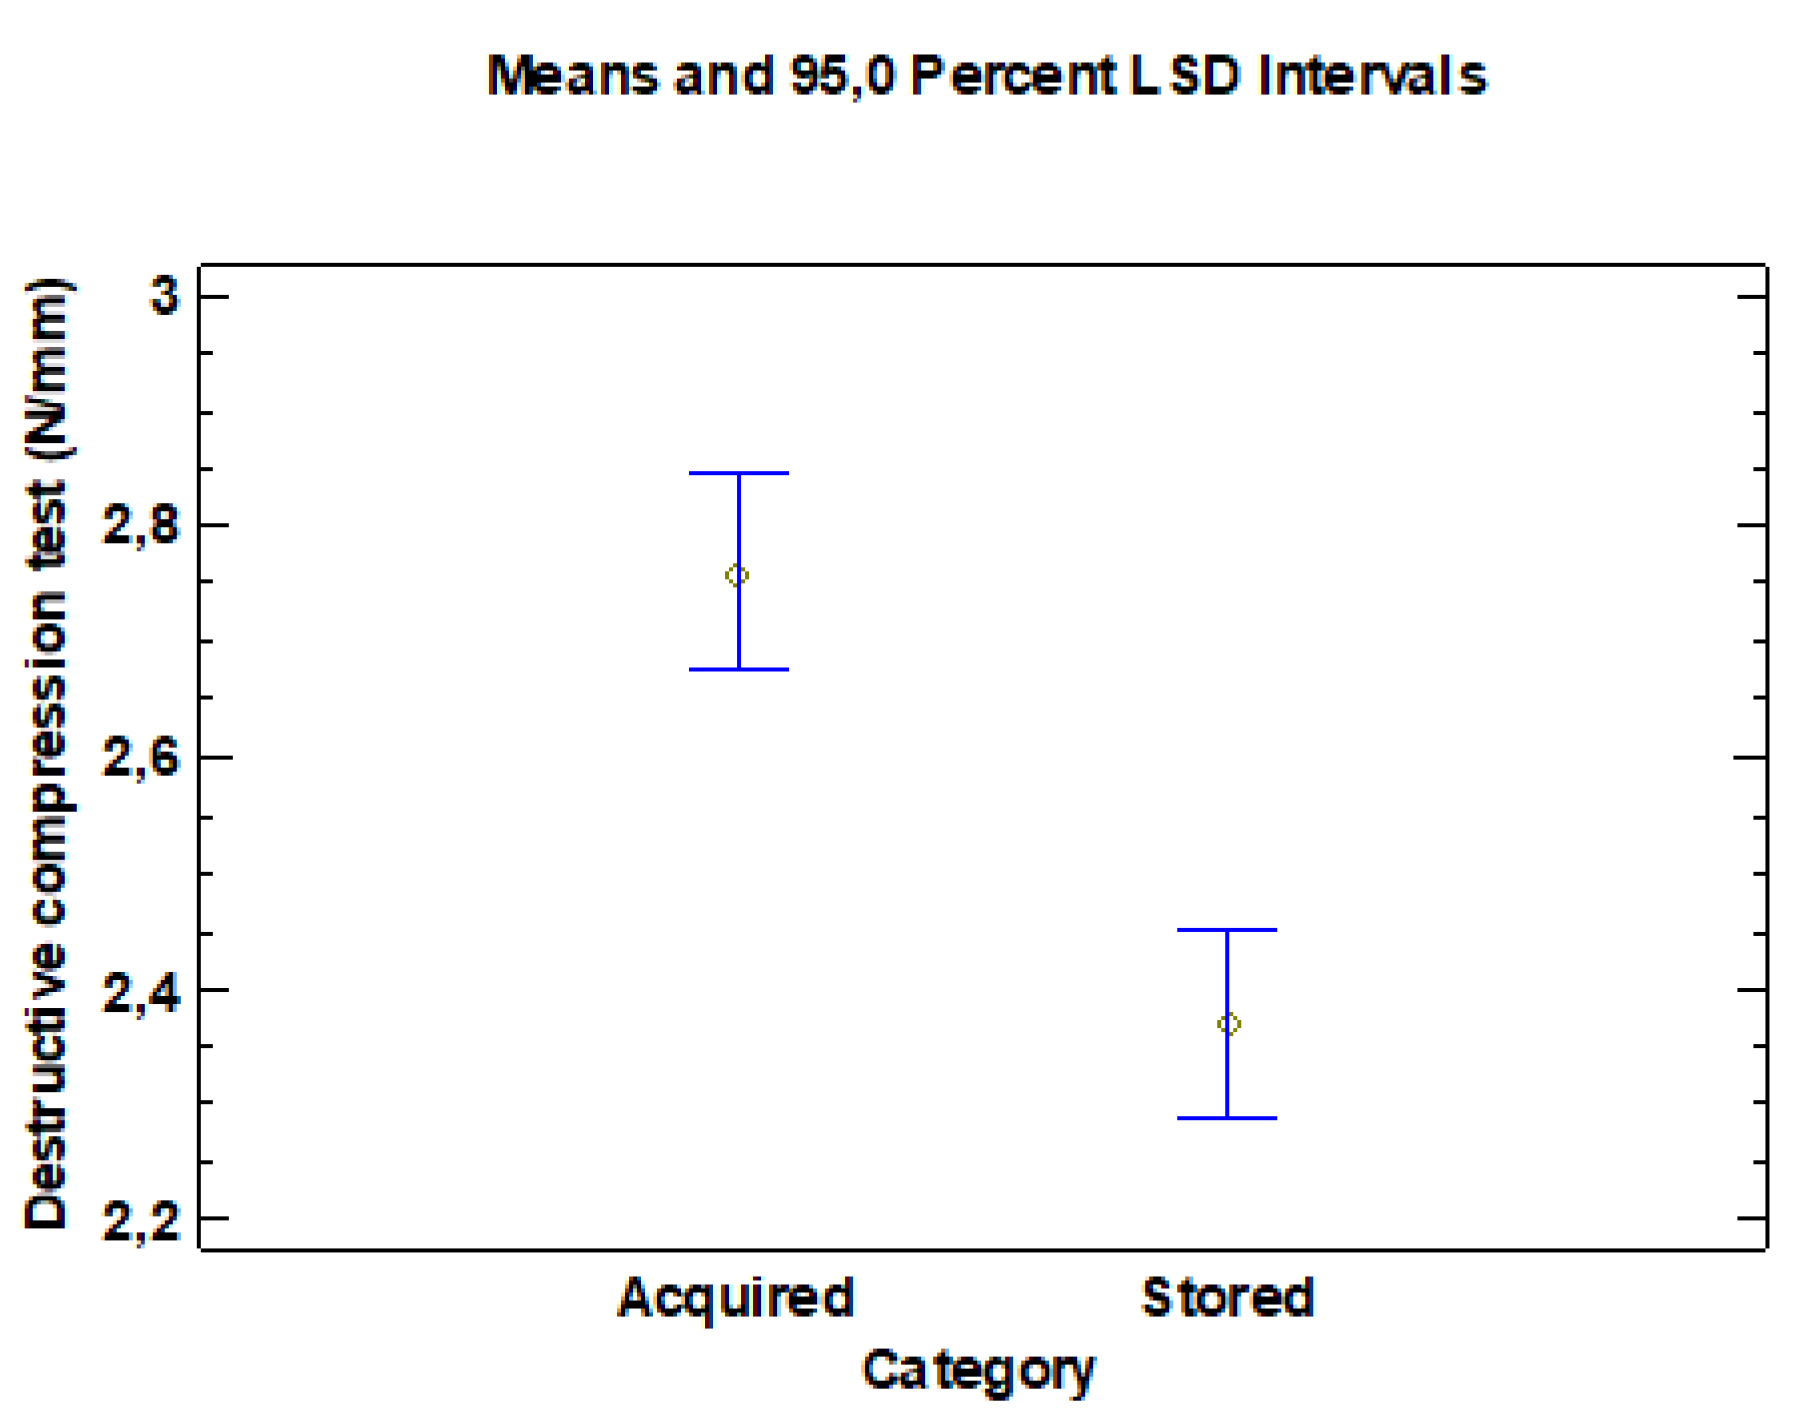
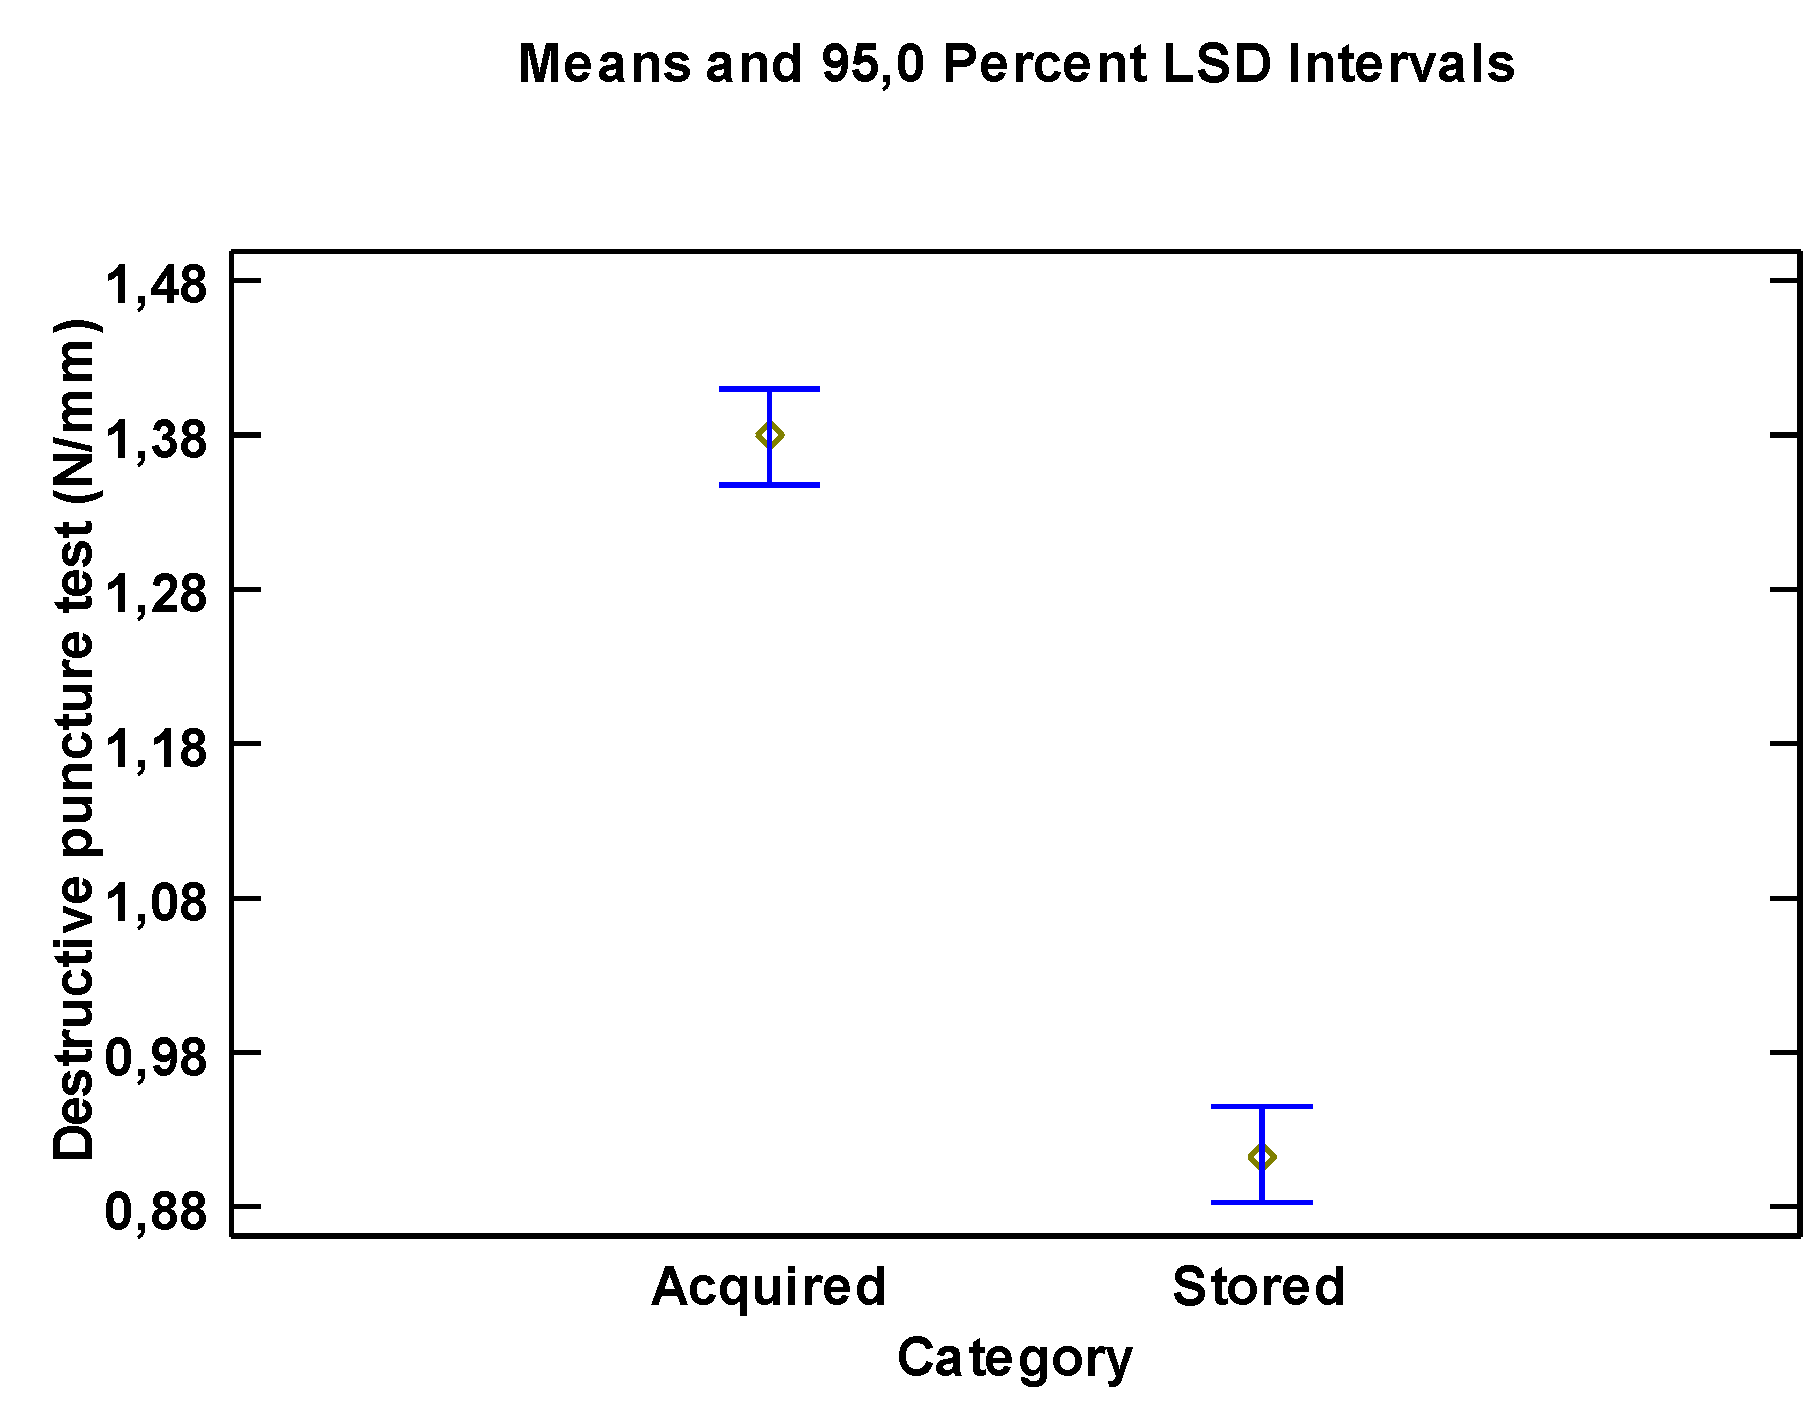
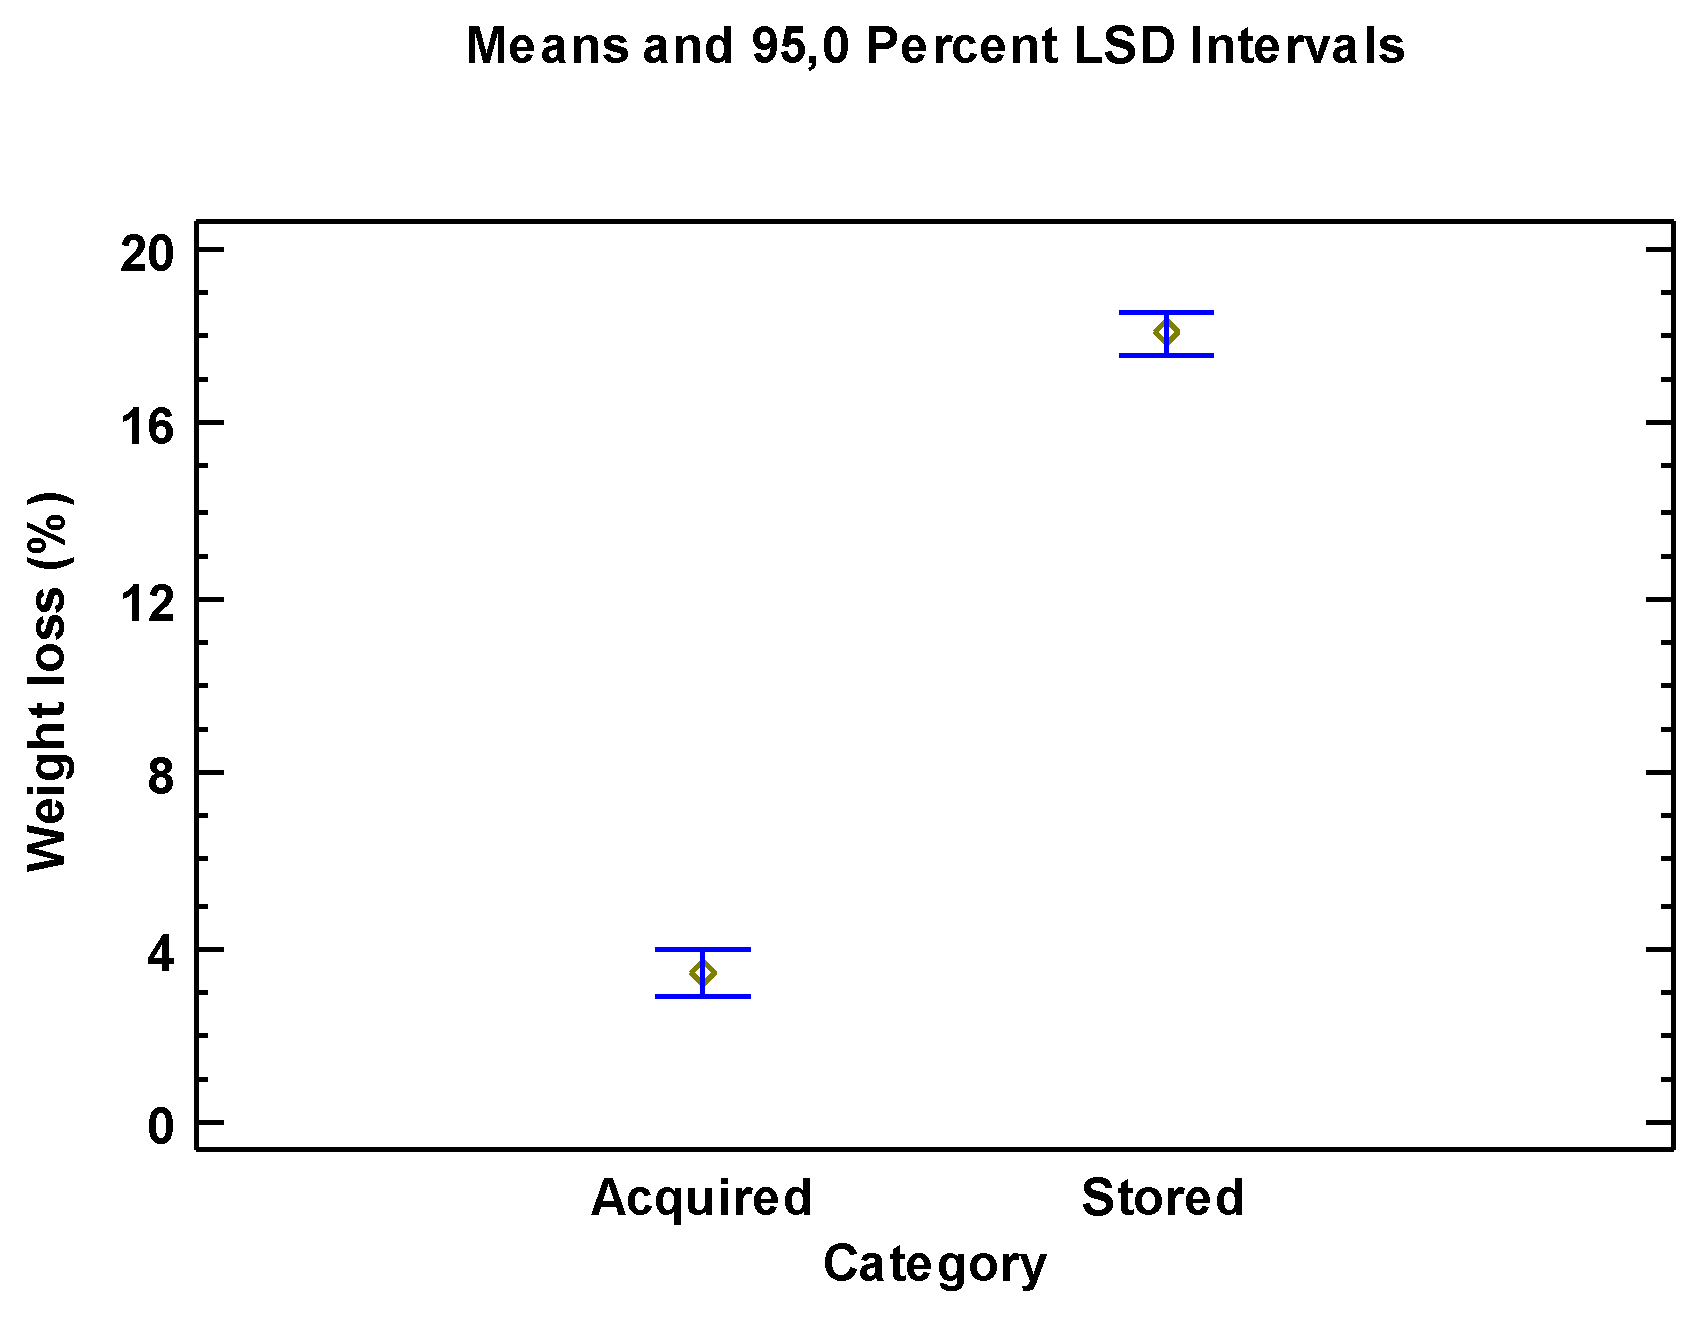
The loss of tenderness of the okra pods was confirmed destructively measuring texture and weight loss differences in the two sets (“Acquired pods” and “Stored pods”).The texture change was assessed by the texture analysis tests (puncture test and compression test) and the loss of weight was assessed measuring initial weight and weight at the moment of the destructive test As expected, results from the destructive compression test and puncture compression test were significantly different in both sets, the okras from the stored set had lost tenderness compared to the acquired set (
Figure 5 and
Figure 6). In the same line, the weight loss was significantly higher for the two sets (
Figure 5).
Figure 5.
Destructive Compression Test Results (N/mm) for Acquired Set and Stored Set Categories; mean values of the destructive compression test for each category, and 95.0% Least Significant Difference (LSD) intervals.
Figure 5.
Destructive Compression Test Results (N/mm) for Acquired Set and Stored Set Categories; mean values of the destructive compression test for each category, and 95.0% Least Significant Difference (LSD) intervals.
Figure 6.
Destructive Puncture Test Results (N/mm) for Acquired Set and Stored Set Categories; mean values of the destructive puncture test for each category, and 95.0% Least Significant Difference (LSD) intervals.
Figure 6.
Destructive Puncture Test Results (N/mm) for Acquired Set and Stored Set Categories; mean values of the destructive puncture test for each category, and 95.0% Least Significant Difference (LSD) intervals.
Figure 7.
Weight Loss (%) for Acquired Set and Stored Set Categories.; mean values of weight loss for each category, 95.0% Least Significant Difference (LSD) intervals.
Figure 7.
Weight Loss (%) for Acquired Set and Stored Set Categories.; mean values of weight loss for each category, 95.0% Least Significant Difference (LSD) intervals.
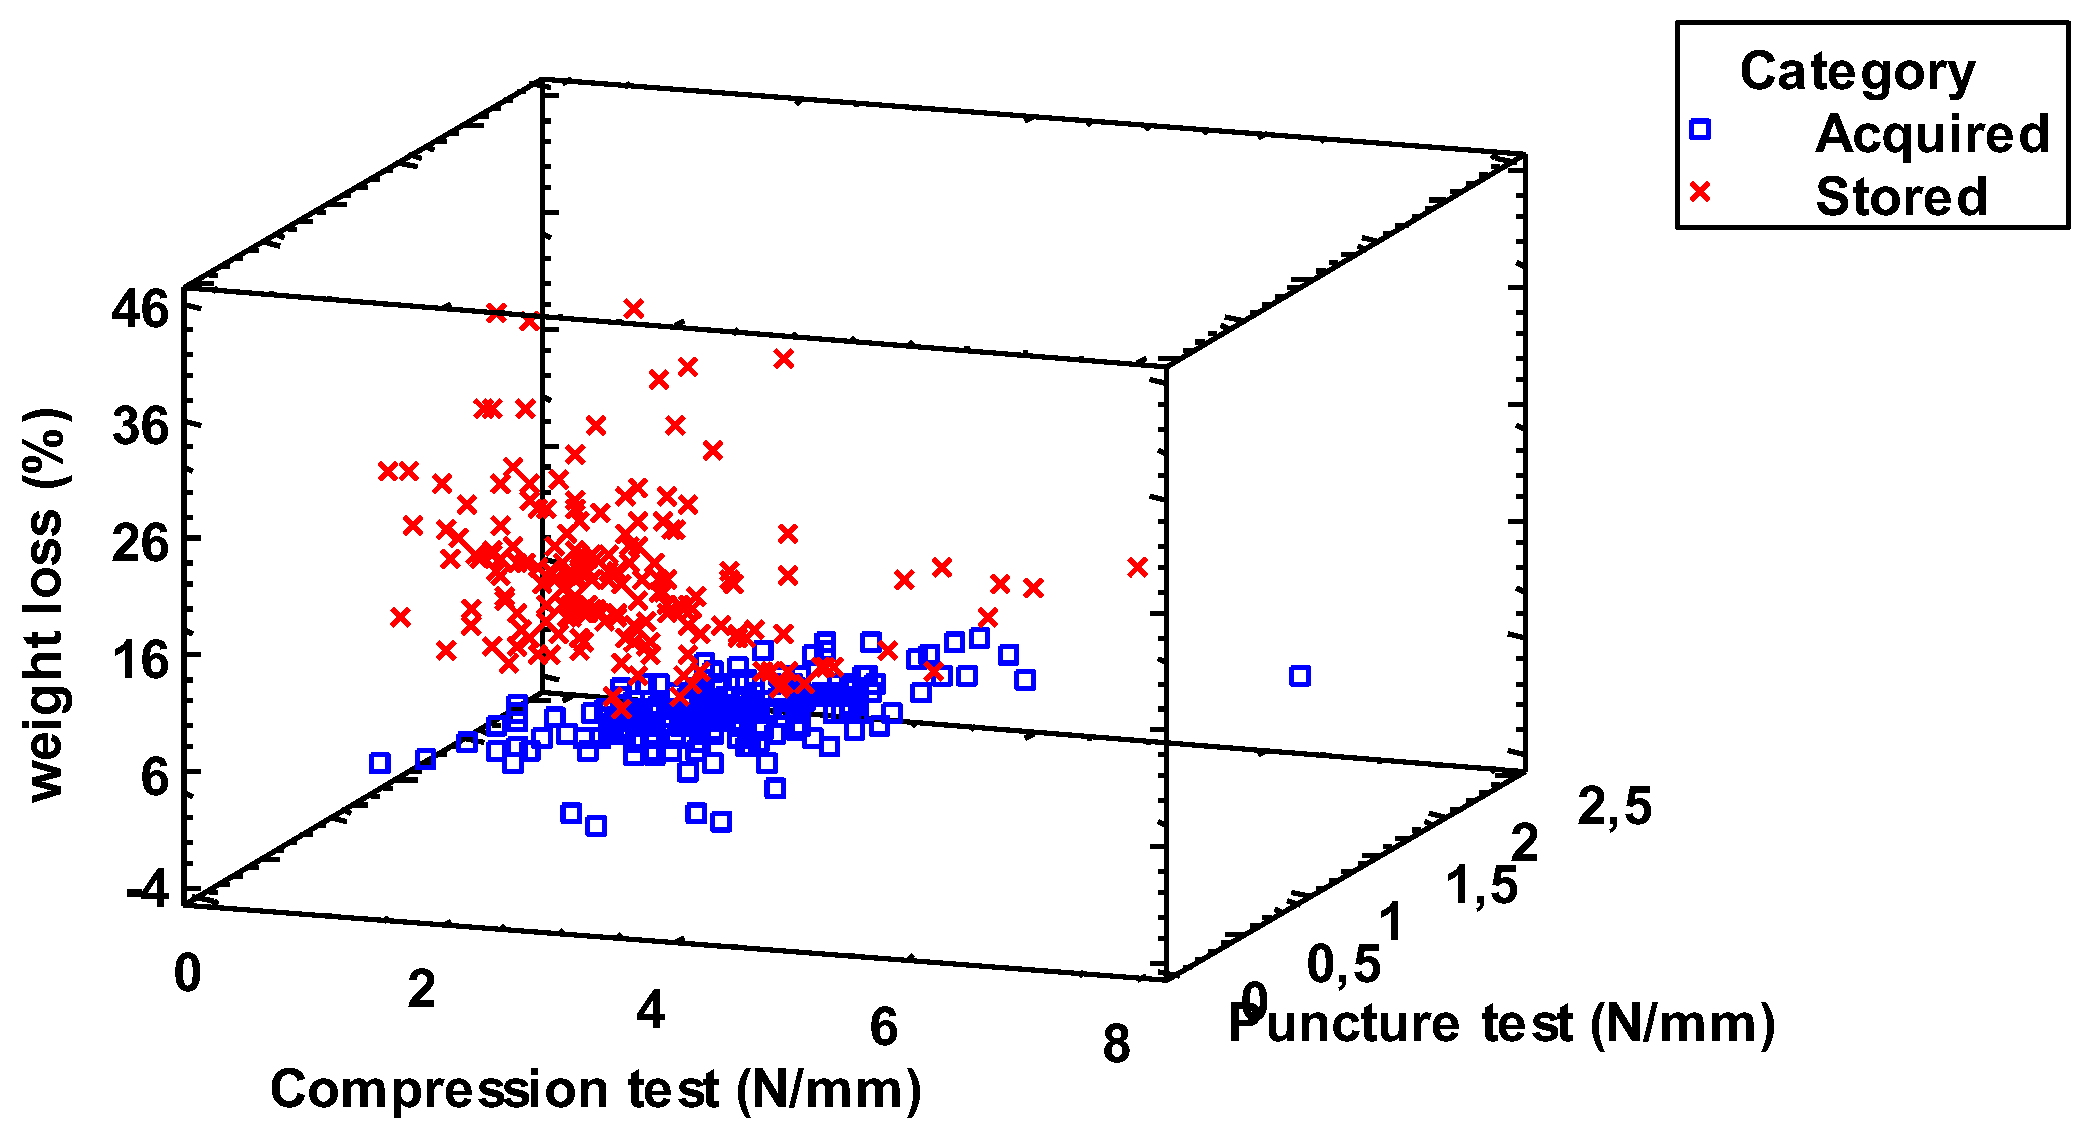
In order to validate the capability of the destructive variables in correctly segregating the okra pods into the established categories (acquired and stored, corresponding to tender pods a non-tender pods), a discriminant analysis was carried out two separates into the two categories according to percentage of weight loss, compression test and puncture test,
Figure 8. percentage of well classified product of 95.5 % was obtained.
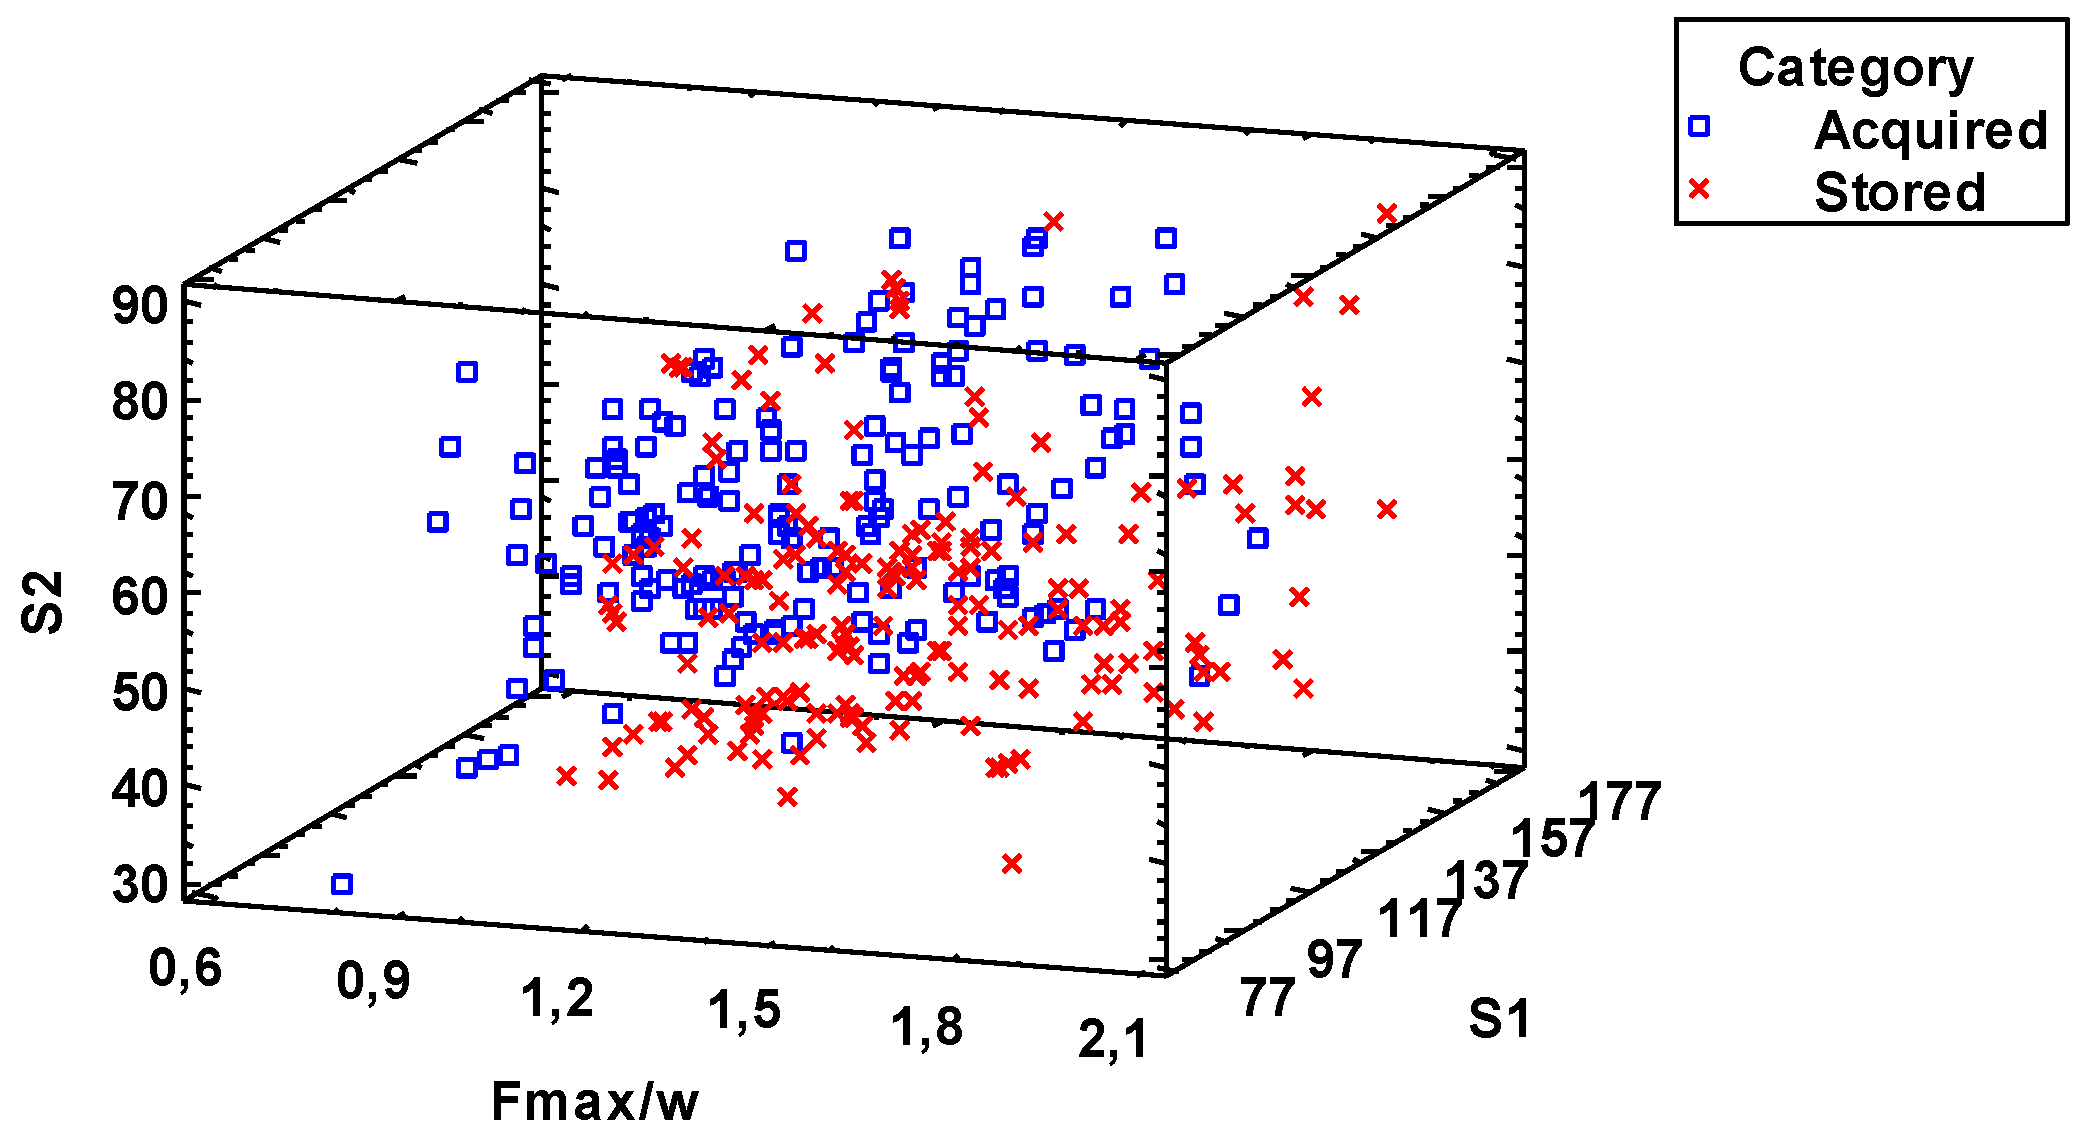
destructive variables and weight loss) of the two established categories of okra pods, neural network analysis was developed to segregate into the two categories based on the non-destructive variables extracted from the robot impact sensor,
Figure 9. The variables used were: first slope (
S1), second slope (
S2), first overshoot (
Os) and maximum force over weight while performing the non-destructive impact (
Fmax/w). 78.59 % of well classified okra pods was found (
Table 1).
From the category of “Acquired pods” 9 pods were wrongly classified as “Stored pods”. On the other hand, from the category of “Stored pods” 16 pods were wrongly classified as “Acquired”.
5. Conclusions
In conclusion, this research paper presents a comprehensive investigation into the assessment of okra pod tenderness and freshness using both destructive and non-destructive methods. The study demonstrated that destructive tests, including compression and puncture tests, along with weight loss measurements, were effective in assessing the tenderness of okra pods with a high degree of accuracy, achieving a 95.5% classification rate for well-segregated pods based on storage conditions. However, it’s crucial to acknowledge the potential limitations of this method, particularly regarding the initial conditions of the okra pods sourced from the local market. Variations in the initial state of the pods could have influenced the speed of deterioration, leading to discrepancies in classification. Despite this, destructive methods remain valuable for assessing okra tenderness and could serve as a reliable reference for quality evaluation. On the other hand, non-destructive techniques, utilizing a robotic impact device and extracting variables such as first slope, second slope, first overshoot, and maximum force over weight, demonstrated promising results in classifying okra pods into tender and non-tender categories. However, the classification rate was slightly lower at approximately 78.59%, with some misclassifications observed. In practical applications, a combination of both destructive and non-destructive methods could offer a comprehensive approach to evaluating okra quality. Destructive tests provide a reliable benchmark for tenderness assessment, while non-destructive methods offer efficiency and potential for automation, albeit with a slightly lower accuracy rate. By integrating these approaches, it’s possible to enhance quality control processes and minimize waste in the okra supply chain. Furthermore, this study contributes to the broader field of food quality assessment, highlighting the importance of innovative techniques such as robotic impact devices in agricultural research. Continued exploration and refinement of both destructive and non-destructive methods will further advance our ability to ensure food quality and safety in agricultural production and distribution systems.
