Preprint
Article

Charge Phenomena in the Elastic Backscattering of Electrons from Insulating Polymers

This version is not peer-reviewed.

Submitted:

01 July 2024

Posted:

02 July 2024

You are already at the latest version

A peer-reviewed article of this preprint also exists.

Abstract
Elastic peak electron spectroscopy, abbreviated EPES, involves ana- lyzing the line shape found in the elastic peak. The reduction in the energy of electrons of the elastic peak is a result of energy transfer to the target atoms, a phenomenon known as recoil energy. EPES differs from other electron spectroscopies in its unique ability to identify hydrogen in polymers and hydrogenated carbon-based materials. This feature is particularly noteworthy because lighter elements exhibit stronger energy shifts. The energy difference between the positions of the elastic peak of carbon and the elastic peak of hydrogen tends to increase as the kinetic energy of the incident electrons increases. If, during electron irradiation of an insulating polymer, the number of secondary electrons emitted by the surface is less than the number of electrons absorbed in the sample, the surface floats energetically until it stabilizes at a potential energy eVs. As a result, the interaction energy changes and modifies the energy difference between the elastic peaks of hydrogen and carbon. In this study, the charge effects are evaluated using the Monte Carlo method to simulate the EPES spectra of electrons interacting with polystyrene and polyethylene.
Keywords: 
Subject: 
Physical Sciences  -   Applied Physics

1. Introduction

The phenomenon of recoil energy can be observed in various spectroscopy experiments [1,2]. The study of recoil energy is particularly valuable because it can be important for the detection of mobile hydrogen in various compounds.
The elastic scattering of electrons from solid targets produces a distinct peak in the electron energy spectra, known as the elastic peak. The analysis of the line shape of this peak is called elastic peak electron spectroscopy (EPES), also known as electron Compton scattering (ECS) [3,4,5,6,7,8,9,10,11,12]. The intensity of the elastic peak results from the interaction of elastic and inelastic scattering processes. Consequently, EPES is a technique used to determine the inelastic mean free path of electrons, as emphasized, for example, in Refs. [13,14].
It is important to note that the energy transferred to the target atoms reduces the energy of the elastically scattered electrons, shifting the elastic peak away from the exact center of the beam’s initial kinetic energy. In addition, the recoil effect also leads to a broadening (changes in the width of the peaks) in the spectra of the elastically backscattered electrons. These effects have been investigated in detail in both experimental and theoretical studies.
A very important area that needs further research concerns the effects of charging. Materials such as polystyrene and polyethylene, which have dielectric properties, tend to charge when exposed to electron irradiation. Modeling these charging effects is a challenging matter.
Cazaux [15] evaluated the components of the electric field related to the charge distribution induced by electron irradiation in insulators using Maxwell’s equations and taking into account the image effects. In addition, Cazaux introduced the "total yield approach" to study charging effects and determine the sign of charging [16,17]. Joy and colleagues [18,19,20] investigated charging phenomena in low-voltage scanning electron microscopes.
To investigate the measurement of line-width using critical dimension scanning electron microscopy, Ciappa et al. [21] and Koschik et al. [22] investigated secondary electron imaging, which modeled adjacent PMMA lines with and without charge effects.
Miotello [23] and Miotello and Dapor [24] developed a model to study the surface electric field of electron irradiated SiO2 targets and its evolution over time. These authors discussed in particular the diffusion of the implanted electrons to the surface by ordinary and electric field assisted diffusion processes and the recombination with positive charges near the irradiated surface.
As for the evaluation of the electric field induced on the surface by electron irradiation, it is possible to measure the surface potential experimentally by observing the energy shift of the secondary electron peak. Another way to measure the surface potential is based on the fact that the incident electrons are slowed down by the surface potential energy induced by the irradiation and the interaction energy decreases, so that the energy difference between the elastic hydrogen and carbon peaks also decreases.

2. Electron-Induced Charging Phenomena in Insulting Materials

Charge phenomena in insulators, as induced by electron irradiation, can be studied theoretically if the absorbed charge and its depth distribution are known. The evaluation of the transport processes of the injected electrons is essential for the calculation of the temporal evolution of the electric field both at the surface and in the depth of the irradiated insulator. Charge diffusion processes generally depend on the electric field, the sample temperature and the electron mobility in the insulator, whereby the electron mobility is a decisive parameter. Another important process is the recombination of charges near the surface, where positive charges remain after the emission of secondary electrons. Since the injected electrons are not simply implanted into the dielectric, but diffuse to the surface by typical diffusion processes supported by the electric field, they can recombine with the positive charges left near the irradiated surface after secondary emission. Using a realistic distribution of injected electrons in an insulator, the electric field of the surface of the electron-irradiated solid can be calculated using Gauss’s law. In the continuity equation for the ordinary and electric field assisted diffusion process, three terms contribute to the time evolution of the space charge: the ordinary diffusion determined by Fick’s first law, the drift velocity of the electrons induced by the electric field, and the deposition function of the injected particles. Finally, the boundary condition is set at the surface of the target to account for the recombination of the injected electrons with the positive charges of the surface (i.e., trapped holes) generated by the secondary electron emission. Therefore, the value of the surface potential e V s as well as the interval time necessary to attain stationary conditions, depend on many parameters: in particular, on the diffusion coefficient, on the number of trapped electrons, on the charge-space distribution, and on the number of secondary electrons emitted from the region near the surface of the material. In Ref. [24], the time evolution of the electric field at the surface for electrons of a few keV impinging on SiO2 was studied by integrating the continuity equation and assuming as charge source term the depth distribution of the trapped electron obtained by Monte Carlo simulations. The authors showed that the time interval required to reach a steady state is limited to a time interval that is negligible on the time scale typical for the analysis.
In general, according to Joy and Joy, if an insulating material absorbs more electrons than it releases or, conversely, releases more electrons than it absorbs, it becomes electrically charged [20]. The electrical charge influences the energy of the incident and secondary electrons and in the event of a dielectric breakdown [15], the sample is damaged.
The total emission (secondary electron yield δ plus backscattering coefficient η ) is a function of the energy of the primary beam. Due to the initial increase and subsequent decrease of the total electron yield δ + η as a function of the energy of the incident electrons, in a typical situation there are two values for this energy, E 1 (between 50 and 150 eV) and E 2 (between 500 and 3000 eV) for which δ + η = 1 applies. At these two energies, a dynamic charge equilibrium is established [20,25].
However, if the primary energy of the incident electron beam is higher than E 2 , then the sample charges negatively because the number of secondary electrons emitted from the surface is lower than the number of electrons absorbed in the sample, i.e., δ < 1 η . According to a simple model proposed by Thornton, the specimen surface continues to float up in energy up to a potential energy e V s and, as a result, if we indicate with E 0 the energy of the incident electrons, the effective landing energy decreases until E 0 e V s = E 2 , when the electric field of the surface reaches a stationary value [20] (we have indicated with e the electron charge).
Thus, according to the Thornton’s simple model, the value of the steady-state potential energy e V s can be calculated by [16,25]
e V s = E 0 E 2 .
This last equation is actually only valid for
e I R ( 1 δ η ) E 0 E 2 ,
where I is the incident beam current [20]. This condition is particularly fulfilled with a high-quality insulator, i.e., if the leakage resistance R is very high. If this is not the case, Joy and Joy state that the effective landing energy is greater than E 2 [20]. Please also note that E 2 (and thus e V s ) varies with the angle of incidence and the surface topography.

3. Measuring the Surface Potential V s

A possible way to experimentally evaluate e V s is based on the measurement of the secondary electron peak. If the primary energy of the incident electron beam is higher than E 2 , then the specimen becomes negatively charged during electron irradiation. As a result, the electrons are decelerated when approaching the sample and accelerated when leaving it. The estimation of e V s can therefore be done experimentally by measuring the shift of the secondary electron peak (or the Auger peak) to higher energies in the spectrum of the outgoing electrons [16].
It seems that the charging of the sample should have no influence on the elastic peak. This is because the incident electrons are slowed down by the surface potential V s when they approach the sample and accelerated by the same potential V s when they leave the sample, which means that the elastic peak does not change. However, this would only be the case if the recoil energy could be neglected. In fact, recoil energy is a phenomenon observed in various spectroscopy experiments. Since the incident electrons are slowed down by the surface potential energy e V s induced by the irradiation, the interaction energy changes and modifies the energy difference between the elastic hydrogen and carbon peaks.

4. Elastic Peak and Recoil Energy. Theory and Simulation

The recoil energy E r is given by
E r = E r + Δ ,
where E r represents the mean recoil energy
E r = q 2 2 M
and q is the transferred momentum for a target atom with mass M. Δ is the spread in the recoil energy due to atomic vibrations. A Gaussian distribution can therefore be observed, whose standard deviation σ is given by [5,11,26]
σ = 4 3 E r E k ,
where we have specified the mean kinetic energy of the target atoms with E k .
If E is the energy of an electron impinging on an atom, m the electron mass, and θ the scattering angle, then E r is given by
E r = 4 m M E sin 2 θ 2 .
As far as the Monte Carlo method is concerned, it is well known [12,27,28] and therefore we limit ourselves here to the description of its main features. An electron beam irradiates the target surface (which lies in the plane z = 0 ) with the primary energy E 0 and the angle of incidence θ 0 . The elastic scattering cross-section σ el is calculated by σ el = n C σ C + n H σ H . In this equation, σ C stands for the elastic scattering cross-sections of carbon, σ H for the elastic scattering cross-sections of hydrogen and n C and n H for their respective atomic concentrations. The inelastic scattering cross section σ inel is calculated by σ inel = ( N λ inel ) 1 . In this equation, λ inel is the inelastic mean free path of the electrons and N is the number of molecules per unit volume. The probabilities of elastic and inelastic scattering are given by p el = σ el / ( σ el + σ inel ) and p inel = σ inel / ( σ el + σ inel ) = 1 p el , respectively. Having calculated the mean free path of the electrons as λ = [ N ( σ el + σ inel ) ] 1 , we can obtain the step length Δ s between the collisions by
Δ s = λ ln ( μ 1 )
where μ 1 is a random number that is sampled with a uniform distribution between 0 and 1. The scattering angle θ is determined by
μ 2 = P el ( θ ) ,
where P el ( θ ) is the cumulative probability of elastic scattering. The azimuth angle ϕ is sampled uniformly between 0 and 2 π . For the choice between elastic or inelastic collisions, a random number μ 3 is generated, which is sampled with a uniform distribution between 0 and 1. If p el > μ 3 , the collision is inelastic. In this case, the simulation of the electron’s trajectory is finished, as it is no longer of interest to follow the trajectory of this electron. If, on the other hand, p el μ 3 , then the collision is elastic. If this is the case, another random number μ 4 is sampled uniformly between 0 and 1 to determine the type of elastic collision and the recoil energy. If, in particular,
0 μ 4 n C σ C σ el ,
then an electron-carbon collision takes place and the recoil energy is given by
E r = 4 m M C E sin 2 θ 2 + Δ C .
If
n C σ C σ el < μ 4 1 ,
then an electron-hydrogen collision takes place and the recoil energy is given by
E r = 4 m M H E sin 2 θ 2 + Δ H .
The quantities Δ C and Δ H describe the Doppler broadening. Since they are determined using random numbers derived from a Gaussian distribution with the standard deviation calculated according to Equation (5), they can be positive or negative. Please note that M C and M H represent the atomic masses of carbon and hydrogen, respectively. m stands for the electron mass and E for the electron energy.

5. Elastic and Inelastic Scattering Cross-Sections

5.1. Elastic Scattering

Both the elastic scattering cross-section and the cumulative probabilities can be obtained once the differential elastic scattering cross-section has been calculated [29,30]. The differential elastic scattering cross sections of electrons in hydrogen and carbon were calculated using the relativistic partial wave expansion method. By integrating the differential elastic scattering cross sections, we obtained the total elastic scattering cross sections [12]. The integration of the differential elastic scattering cross sections also allows us to calculate the cumulative probabilities of elastic scattering [12]. These are monotonically increasing functions that allow us to calculate the scattering angle before each elastic scattering using random variables that are uniformly distributed in the interval between 0 and 1.

5.2. Inelastic Scattering

The inelastic mean free path can be calculated using Ritchie’s dielectric theory [31], which requires knowledge of the energy loss function of the electrons. Once the energy loss function is known as a function of energy loss and momentum transfer, the inelastic mean free path can be calculated [32].

6. Moving Atoms

The atoms move around their equilibrium position. The kinetic energy depends on the type of atom and the bond. The moving target atoms scatter the distribution of recoil energies, which leads to a broadening of the elastic peak known as Doppler broadening [5]. To calculate the standard deviation of the Gaussian distribution describing the Doppler broadening – according to Equation (5) – we used the values of the average kinetic energies of carbon and hydrogen in amorphous hydrogenated carbon reported by Mayers at al. [33], i.e., 103.9 meV for carbon and 145.7 meV for hydrogen.

7. Electron-Induced Hydrogen Desorption

As far as concerns the hydrogen peak intensity in the EPES spectra, electron beam-induced damage represents a critical aspect, as hydrogen desorbs under electron irradiation. In fact, the hydrogen content refers to the surface and it will be smaller than the hydrogen content of the bulk of the material. In the simulations presented in this work we assumed that a small fraction of the hydrogen was desorbed from the surface by the electron irradiation. In particular, a 5% of hydrogen desorption was assumed for the case of polystyrene [12] and a 2.2% of hydrogen desorption was assumed for the case of polyethylene [13].

8. Simulating Elastic Peak Spectra

Figure 1 shows the Monte Carlo simulation of the EPES of 1500 eV electrons impinging on polystyrene. Two values of the surface energy potential e V s , i.e., 100 eV and 200 eV, were considered and the corresponding MC spectra of the hydrogen elastic peak were compared with the spectrum obtained without considering the charge effects ( e V s = 0 eV).
In the same figure, the experimental data from Filippi and Calliari [11] are shown in order to compare them with the results of the simulations.
According to Joy and Joy [20], the value of E 2 of polystyrene is 1300 eV, so that using the simple model represented by Equation (1) for the case of E 0 = 1500 eV gives e V s = 200 eV.
As already discussed, typical values of e V s can be smaller than E 0 E 2 for many reasons. According to a simple model proposed by Joy and Joy [20],
e V s = e I R f ( E 0 E 2 ) E 0 E 2 + e I R f ,
where
f = 1 ( δ + η ) ,
I is the incident beam current, and R is the leakage resistance. In addition, E 2 also depends on the angle of incidence [20].
Consequently, the interval of possible values of e V s , for a given primary energy, angle of incidence, incident beam current, and material can range from a few eV (see, e.g., the case of 3 keV electrons impinging on SiO2discussed in detail in [24]) up to several keV [20]. In the case shown in Figure 1 it appears that e V s = 100 eV provides a reasonable agreement with the experimental data considered.
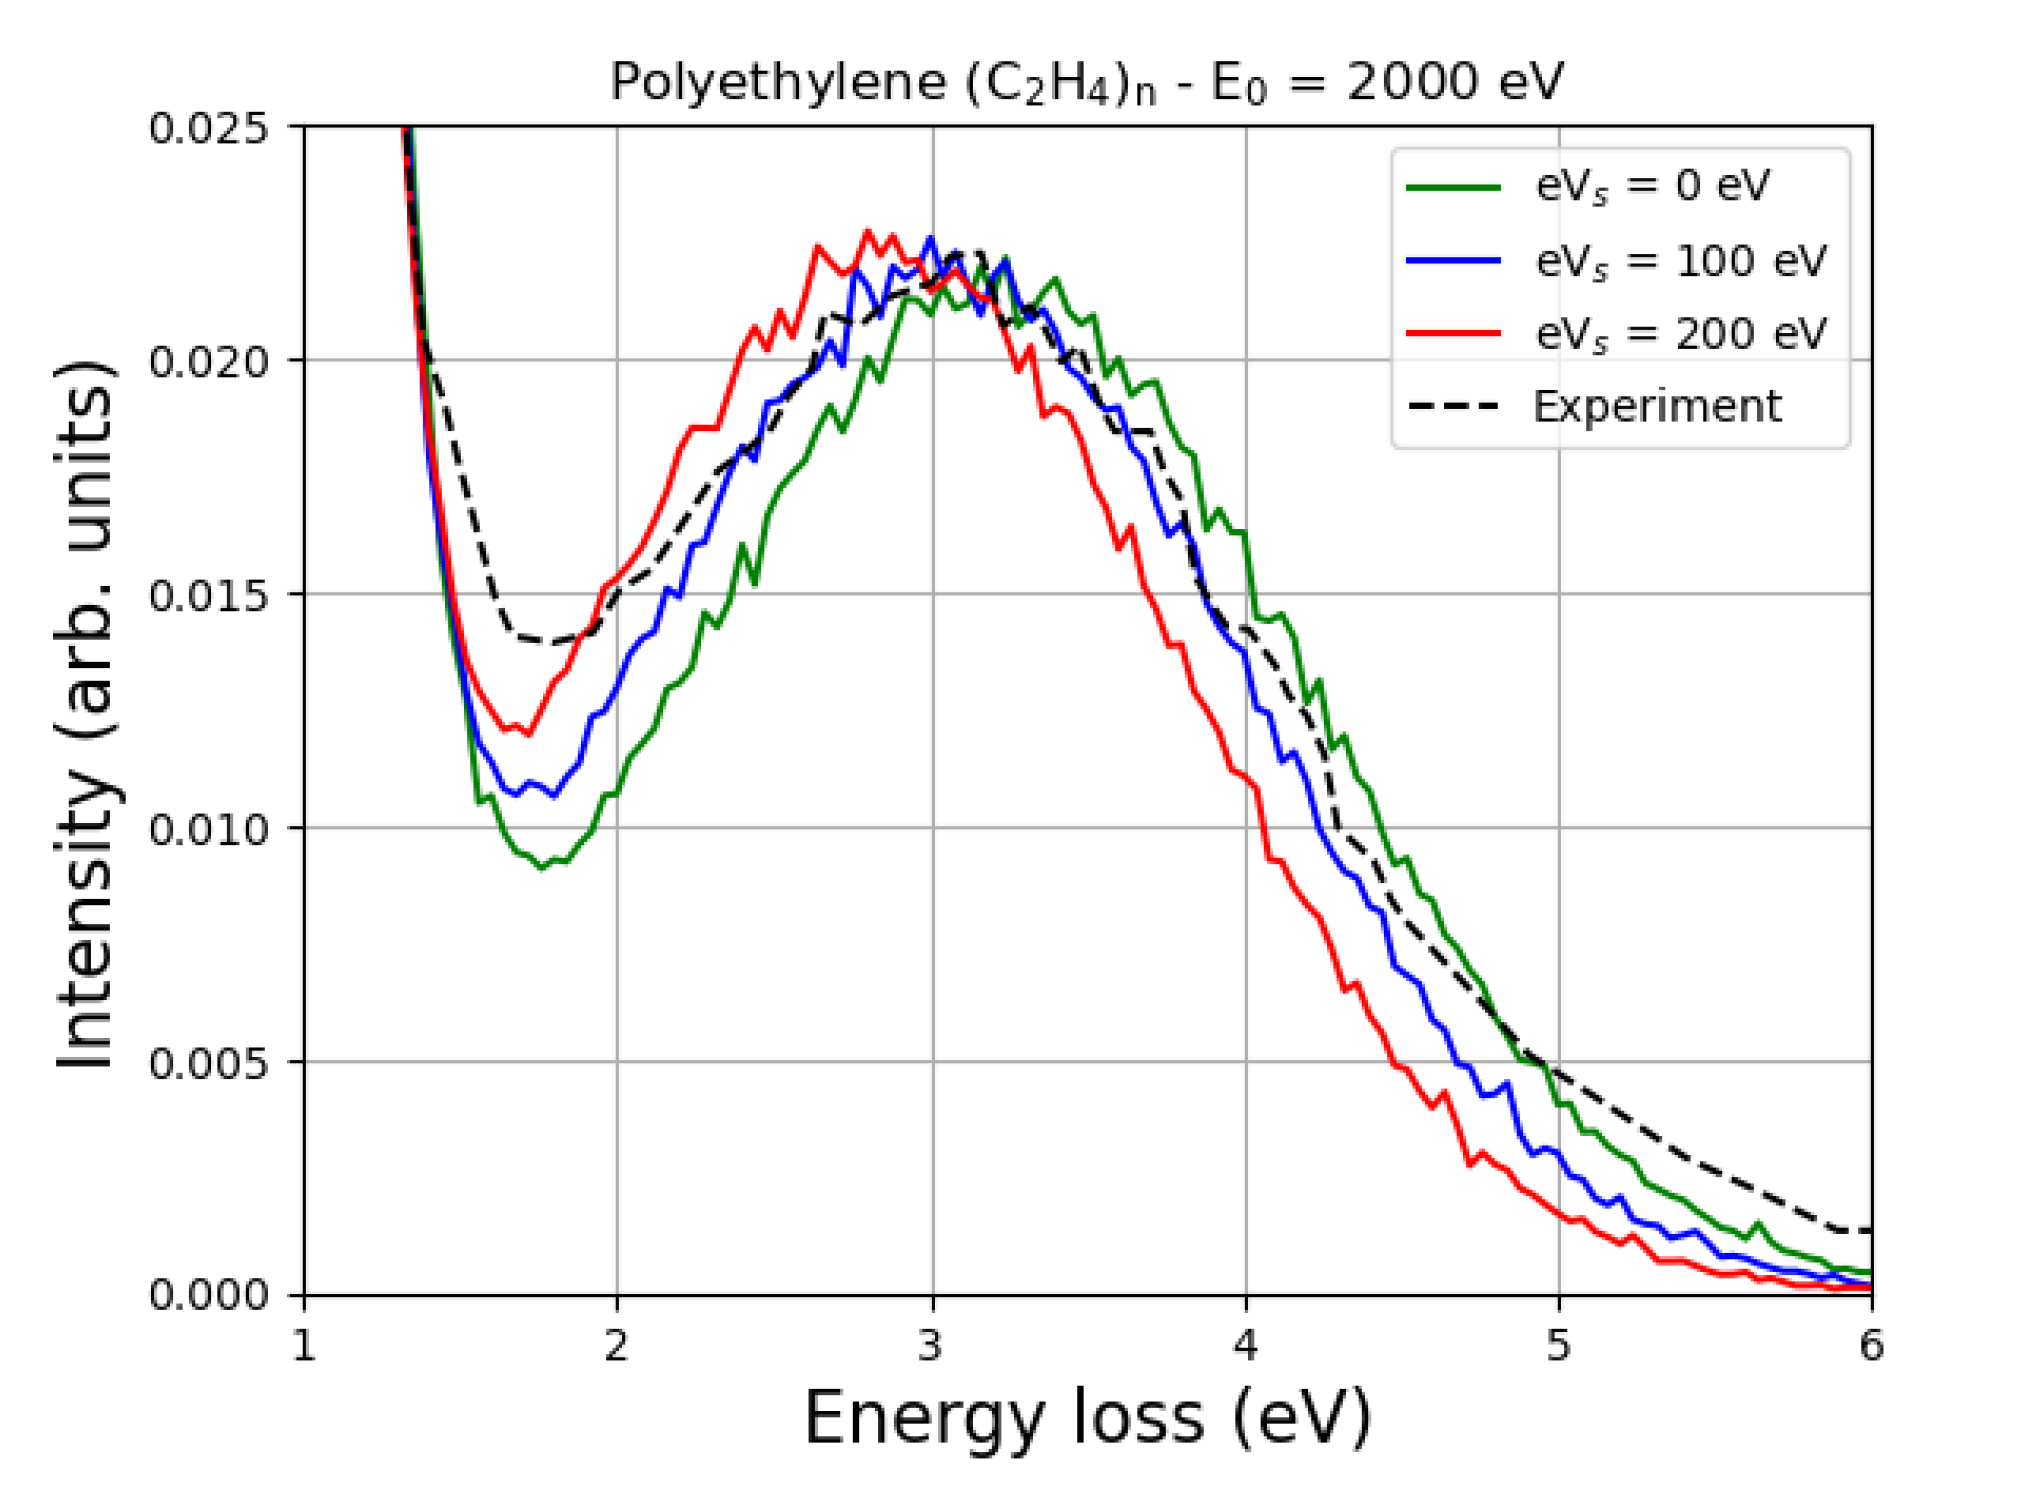
Monte Carlo simulations of the EPES of 2000 eV electrons impinging on polyethylene are shown in Figure 2 and compared with the experimental data of Orosz et al. [13]. Also in this case, although the value of E 2 of polyethylene, according to Joy and Joy, is 1500 eV [20], a reasonable agreement with the experiment, for this particular sample and experimental conditions, is achieved with e V s = 100 eV.
It is known that, as the primary energy decreases, the energy difference between the carbon elastic peak and the hydrogen elastic peak also decreases [12]. This is clearly confirmed in the two figures presented. An increase of e V s indeed means a decrease of the landing energy, i.e., the energy of the impact, which is smaller than the primary energy due to the charge effects.

9. Conclusions

The charge effects caused by electron irradiation of dielectric polymers were evaluated using the Monte Carlo method. Simulations of EPES spectra of keV electrons interacting with polystyrene and polyethylene were presented and compared with experimental data. In the Monte Carlo calculations, Doppler broadening was taken into account to describe the elastic collision with moving carbon and hydrogen atoms. In addition, electron-induced hydrogen desorption was taken into account. The method made it possible to evaluate the potential surface energy.

Acknowledgments

I would like to thank Maria Del Huerto Flammia (Fondazione Bruno Kessler) for her support in proofreading this article.

References

  1. Berger, P.; Raepsaet, C.; Khodja, H. Elastic Recoil Detection Analysis. In Neutron Scattering and Other Nuclear Techniques for Hydrogen in Materials; Springer International Publishing: Cham, 2016; pp. 277–314. [Google Scholar]
  2. Chatzidimitriou-Dreismann, C.A.; Vos, M.; Kleiner, C.; Abdul-Redah, T. Comparison of Electron and Neutron Compton Scattering from Entangled Protons in a Solid Polymer. Phys. Rev. Lett. 2003, 91, 057403 1-4. [Google Scholar] [CrossRef] [PubMed]
  3. Varga, D.; Tökési, K.; Berényi, Z.; Tóth, J.; Kövér, L.; Gergely, G.; Sulyok, A. Energy Shift and Broadening of the Spectra of Electrons Backscattered Elastically from Solid Surfaces. Surf. Interface Anal. 2001, 31, 1019–1026. [Google Scholar] [CrossRef]
  4. Kwei, C.M.; Li, Y.C.; Tung, C.J. Energy Spectra of Electrons Quasi-Elastically Backscattered from Solid Surfaces. J. Phys. D: Appl. Phys. 2004, 37, 1394–1399. [Google Scholar] [CrossRef]
  5. Vos, M. Observing Atom Motion by Electron-Atom Compton Scattering. Phys. Rev. A 2001, 65, 012703 1-5. [Google Scholar] [CrossRef]
  6. Vos, M.; Went, M.R. Elastic electron scattering at high momentum transfer: A possible new analytic tool. J. Electron Spectrosc. Relat. Phenomena 2006, 155, 35–39. [Google Scholar] [CrossRef]
  7. Vos, M.; Marmitt, G.G.; Grande, P.L. A Comparison of ERBS Spectra of Compounds with Monte Carlo Simulations. Surf. Interface Anal. 2016, 48, 415–421. [Google Scholar] [CrossRef]
  8. Yubero, F.; Rico, V.J.; Espinós, J.P.; Cotrino, J.; González-Elipe, A.R. Quantification of the H Content in Diamond-Like Carbon and Polymeric Thin Films by Reflection Electron Energy Loss Spectroscopy. Appl. Phys. Lett. 2005, 87, 084101 1-3. [Google Scholar] [CrossRef]
  9. Yubero, F.; Pauly, N.; Dubus, A.; Tougaard, S. Test of Validity of the V-type Approach for Electron Trajectories in Reflection Electron Energy Loss Spectroscopy. Phys. Rev. B 2008, 77, 245405 1-11. [Google Scholar] [CrossRef]
  10. Alvarez, R.; Yubero, F. Interpretation of Electron Rutherford Backscattering Spectrometry for Hydrogen Quantification. Surf. Interface Anal. 2014, 46, 812–816. [Google Scholar] [CrossRef]
  11. Filippi, M.; Calliari, L. On the Use of Elastic Peak Electron Spectroscopy (EPES) to Measure the H Content of Hydrogenated Amorphous Carbon Films. Surf. Interface Anal. 2008, 40, 1469–1474. [Google Scholar] [CrossRef]
  12. Dapor, M. Electron-induced Hydrogen Desorption from Selected Polymers (Polyacetylene, Polyethylene, Polystyrene, and Polymethyl-methacrylate). Phys. Scr. 2024, 99, 0659b4. [Google Scholar] [CrossRef]
  13. Orosz, G.T.; Gergely, G.; Menyhard, M.; Tóth, J.; Varga, D.; Lesiak, B.; Jablonski, A. Hydrogen and Surface Excitation in Electron Spectra of Polyethylene. Surf. Sci. 2004, 566–568, 544–548. [Google Scholar] [CrossRef]
  14. Werner, W. Electron Beams Near Surfaces: The Concept of Partial Intensities for Surface Analysis and Perspective on the Low Energy Regime. Front. Mater. 2023, 10, 1202456 1–23. [CrossRef]
  15. Cazaux, J. Some Considerations on the Electric Field Induced in Insulators by Electron Bombardment. J. Appl. Phys. 1986, 59, 1418–1430. [Google Scholar] [CrossRef]
  16. Cazaux, J. Charging in Scanning Electron Microscopy “from Inside and Outside”. Scanning 2004, 26, 181–203. [Google Scholar] [CrossRef] [PubMed]
  17. Cazaux, J. A New Model of Dependence of Secondary Electron Emission Yield on Primary Electron Energy for Application to Polymers. J. Phys. D: Appl. Phys. 2005, 38, 2433–2441. [Google Scholar] [CrossRef]
  18. Joy, D.C. A Model for Calculating Secondary and Backscattered Electron Yields. J. Microsc. 1987, 147, 51–64. [Google Scholar] [CrossRef]
  19. Joy, D.C. Control of Charging in Low-Voltage SEM. Scanning 1989, 11, 1–4. [Google Scholar] [CrossRef]
  20. Joy, D.C.; Joy, C.S. Low Voltage Scanning Electron Microscopy. Micron 1996, 27, 247–263. [Google Scholar] [CrossRef]
  21. Ciappa, M.; Koschik, A.; Dapor, M.; Fichtner, W. Modeling secondary electron images for linewidth measurement by critical dimension scanning electron microscopy. Microelectron. Reliab. 2010, 50, 1407–1412. [Google Scholar] [CrossRef]
  22. Koschik, A.; Ciappa, M.; Holzer, S.; Dapor, M.; Fichtner, W. A Novel Monte Carlo Simulation Code for Linewidth Measurement in Critical Dimension Scanning Electron Microscopy. Proc. of SPIE 2010, 7729, 1–12. [Google Scholar]
  23. Miotello, A. Mobility and Surface Recombination Process of Primary Electrons in Dielectric System during Auger Electron Spectroscopy. Phys. Lett. 1984, 103A, 279–282. [Google Scholar] [CrossRef]
  24. Miotello, A.; Dapor, M. Slow Electrons Impinging on Dielectric Solids. II. Implantation Profiles, Electron Mobility, and Recombination Processes. Phys. Rev. B 1997-II, 56, 2241–2247.
  25. Frank, L.; Müllerová, I.; Delong, A. Microscopy with slow electrons. Czech. J. Phys. 1994, 44, 195–238. [Google Scholar] [CrossRef]
  26. Paoli, M.; Holt, R. Anisotropy in the Atomic Momentum Distribution of Pyrolytic Graphite. J. Phys. C: Solid State Phys. 1988, 21, 3633–3639. [Google Scholar] [CrossRef]
  27. Shimizu, R.; Ding, Z.J. Monte Carlo Modelling of Electron-Solid Interactions. Rep. Prog. Phys. 1992, 55, 487–531. [Google Scholar] [CrossRef]
  28. Dapor, M. Transport of Energetic Electrons in Solids; Vol. 290, Springer Tracts in Modern Physics, Springer Nature Switzerland AG, 2023.
  29. Mayol, R.; Salvat, F. Total and Transport Cross Sections for Elastic Scattering of Electrons by Atoms. At. Data Nucl. Data Tables 1997, 65, 55–154. [Google Scholar] [CrossRef]
  30. Dapor, M. Electron-Atom Collisions. Quantum-Relativistic Theory and Exercises; De Gruyter, Berlin, Boston, 2022.
  31. Ritchie, R.H. Plasma Losses of Fast Electrons in Thin Films. Phys. Rev. 1957, 106, 874–881. [Google Scholar] [CrossRef]
  32. Tanuma, S.; Powell, C.J.; Penn, D.R. Calculation of Electron Inelastic Mean Free Paths. Surf. Interface Anal. 1993, 21, 165–176. [Google Scholar] [CrossRef]
  33. Mayers, J.; Burke, T.M.; Newport, R.J. Neutron Compton Scattering from Amorphous Hydrogenated Carbon. J. Phys.: Condens. Matter 1994, 6, 641–658. [Google Scholar] [CrossRef]
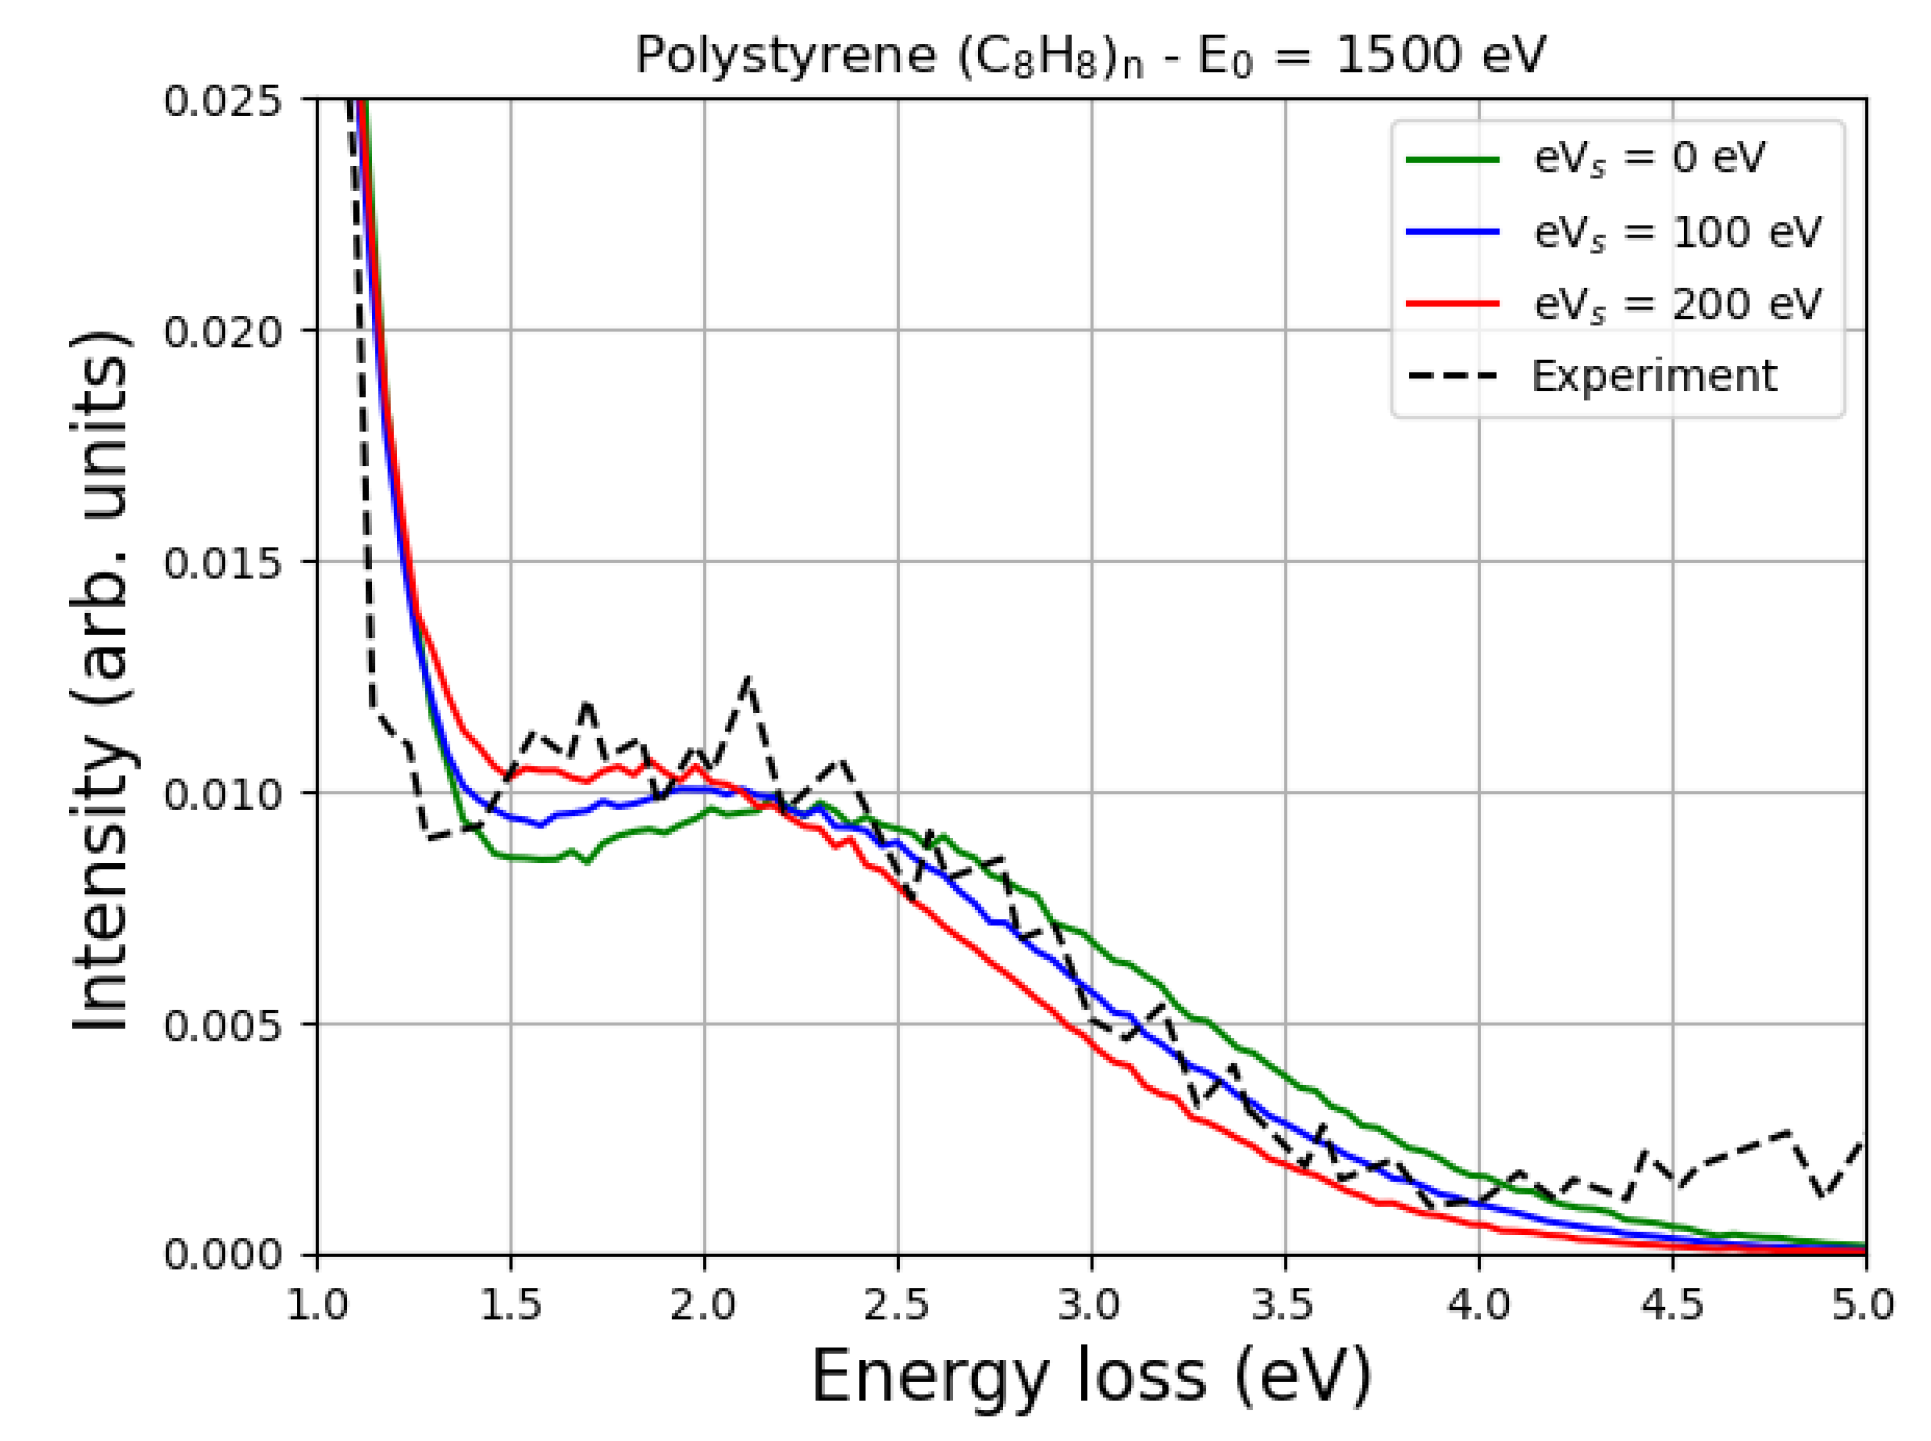
Figure 1. Monte Carlo simulation of the EPES of 1500 eV electrons impinging on polystyrene, taking charge effects into account. Two values of the surface energy potential e V s , i.e., 100 eV and 200 eV, are considered and the corresponding MC spectra are compared with the spectrum obtained without considering the charge ( e V s = 0 eV). The experimental data of Filippi and Calliari [11] are also presented. The simulations were performed reproducing the experimental conditions, i.e., the electron beam hit the sample surface at an angle of 30° in the surface normal direction and the acceptance scattering angle was 138 ± 6 . The MC simulation was performed assuming a 5% hydrogen desorption (induced by the electron irradiation) and taking into account the Doppler broadening (with an average kinetic energy of carbon of 103.9 meV and an average kinetic energy of hydrogen of 145.7 meV, according to [33]). The spectra shown here as a function of energy loss were normalized to a common height of the elastic carbon peak and aligned so that the elastic carbon peak is at 0 energy loss.
Preprints 110905 g001
Figure 2. Monte Carlo simulation of the EPES of 2000 eV electrons impinging on polyethylene, taking charge effects into account. Two values of the surface energy potential e V s , i.e., 100 eV and 200 eV, are considered and the corresponding MC spectra are compared with the spectrum obtained without considering the charge ( e V s = 0 eV). The experimental data of Orosz et al. [13] are also presented. The simulations were performed reproducing the experimental conditions, i.e., the electron beam hit the sample surface at an angle of 50° in the surface normal direction and the detection scattering angle was 0° in the surface normal direction. The MC simulation was performed assuming a 2.2% hydrogen desorption (induced by the electron irradiation) and taking into account the Doppler broadening (with an average kinetic energy of carbon of 103.9 meV and an average kinetic energy of hydrogen of 145.7 meV, according to [33]). The spectra shown here as a function of energy loss were normalized to a common height of the elastic carbon peak and aligned so that the elastic carbon peak is at 0 energy loss.
Preprints 110905 g002
Disclaimer/Publisher’s Note: The statements, opinions and data contained in all publications are solely those of the individual author(s) and contributor(s) and not of MDPI and/or the editor(s). MDPI and/or the editor(s) disclaim responsibility for any injury to people or property resulting from any ideas, methods, instructions or products referred to in the content.
Copyright: This open access article is published under a Creative Commons CC BY 4.0 license, which permit the free download, distribution, and reuse, provided that the author and preprint are cited in any reuse.
Alerts
Prerpints.org logo

Preprints.org is a free preprint server supported by MDPI in Basel, Switzerland.

Subscribe

© 2025 MDPI (Basel, Switzerland) unless otherwise stated