Preprint
Article

Transcriptomic Analysis across Crayfish (Cherax quadricarinatus) Claw Regeneration Reveals Potential Stem Cell Sources for Cultivated Crustacean Meat

Altmetrics

Downloads

204

Views

183

Comments

0

A peer-reviewed article of this preprint also exists.

Submitted:

29 June 2024

Posted:

03 July 2024

You are already at the latest version

Alerts
Abstract
In the face of rising global demand and unsustainable production methods, cultivated crustacean meat (CCM) is proposed as an alternative means to produce delicious lobster, shrimp and crab products. Cultivated meat requires starting stem cells that may vary in terms of potency, and propensity to proliferate or differentiate into myogenic (muscle-related) tissues. We suggest that regenerating crustacean limbs harbor a range of stem cells suitable for cultivated meat production and present a humane tissue source because they can be accessed non-lethally. To investigate stem cell activity in this model, we have conducted RNA-Seq analysis across six stages of claw regeneration in the crayfish Cherax quadricarinatus (four pre-molt and two post-molt stages), along with histology and real time quantitative PCR (qPCR). Differential expression analysis revealed expression patterns of significantly up- or down-regulated genes in 14 functional categories. Relative expression of select stem cell target genes (including endocrine, myogenic, cell cycle and pluripotency factors) highlighted two growth peaks during pre-molt regeneration and limited stem cell activity after the molt. Histology and qPCR results support the overall finding that pre-molt limb regeneration stages harbor more stem cell activity, likely making them a more prolific cell source for CCM development.
Keywords: 
Subject: Biology and Life Sciences  -   Cell and Developmental Biology

1. Introduction

1.1. Cultivated Crustacean Meat

The cultivation of crustacean meat directly from stem cells may allow us to produce delicious seafood without having to farm or fish animals such as lobster, shrimp, crabs, and crayfish. As global demand for these products grows [1], aspects of their current production have become more concerning. Many wild-caught crustacean enterprises are responsible for over-fishing and by-catch in the seas, and products can be contaminated with heavy metals or microplastics [2,3,4,5]. Although intended as a more sustainable alternative, aquaculture farming of crustaceans is also faced with environmental challenges. It has been linked to excessive greenhouse gas production and coastal effluent pollution, and is increasingly vulnerable to disease outbreaks and the warming climate [1,6,7,8,9,10]. Furthermore, as crustaceans are becoming recognized as sentient, current fishing and farming methods are unlikely to meet emerging animal welfare standards [11,12,13]. Alternative and complementary production methods, such as cell cultivation, are needed to ensure we have a more sustainable and ethical global supply of these foods.

1.2. Stem Cells and Myogenic Factors

The development of cultivated meat (CM) requires careful selection of starting stem cells which need to proliferate sufficiently and differentiate into meat-relevant tissues such as muscle and fat. Stem cells that are commonly targeted for CM production range in their ability to proliferate and differentiate and include pluripotent stem cells (PSCs) such as embryonic or induced PSCs, multipotent mesenchymal stem cells and fibro-adipogenic progenitors, or unipotent muscle stem cells (MSCs) including myoblasts and satellite cells [14,15,16,17]. Like vertebrates, crustaceans possess a diverse array of stem cells that are likely to range in their proliferative and myogenic abilities [18]. To date, no crustacean cell lines have been developed, so cultivated crustacean meat (CCM) research must rely on primary sources of stem cells, which, due to the crustacean exoskeleton, can be difficult to obtain non-lethally [15]. As the development of CM seeks to reduce reliance on animals and improve animal welfare outcomes, avoiding euthanasia as practicably as possible is warranted. Therefore, we have decided to investigate the regenerating limb as a non-lethal source of stem cells for CCM.

1.3. Regenerating Limb Bud Model

Utilizing a process called autotomy, many crustaceans can eject their limbs at a preformed breakage plane (Figure 1) with minimal blood loss or tissue damage and regrow them to a pristine state over successive molt events. Underneath the breakage plane, a blastema forms from migrating and dedifferentiating cells and subsequently undergoes epimorphic regeneration, which is thought to be replicative of embryogenesis [19,20,21,22,23]. A recent analysis, however, suggests that there are distinct temporal differences between primordial and regenerative limb development [24]. Nonetheless, crustacean limb regeneration clearly involves proliferation of undifferentiated (PSC-like) stem cells and their subsequent myogenic differentiation into MSCs and muscle tissue. Identifying when pluripotent (or multipotent) and myogenic stem cell activity is more prevalent during the limb regeneration process would be useful for CCM research and starting cell selection.

1.4. Molecular Factors Relevant to CM and CCM Research

Numerous molecular factors related to stem cell proliferation and myogenic differentiation, including classic markers of PSCs and MSCs, have been identified as potentially relevant to CM and CCM research [15,16,17]. Compared to vertebrate models, there is considerably less known about these in crustacean species. To shed light on this, and to begin investigating the usefulness of the regenerating limb model for CCM development, we have conducted RNA-Seq analysis across six stages of claw regeneration in the Australian Redclaw crayfish, Cherax quadricarinatus. We present here first a broad-spectrum analysis of differential gene expression across the six stages to highlight the most prominent molecular changes involved during claw regeneration. Specific focus was given to evidence of stem cell activity such as cell proliferation and classic markers of PSCs and MSCs. We also present relative expression analysis of key target genes identified as endocrine factors, myogenic factors, cell cycle factors and pluripotency factors. After isolating two particular regeneration stages as worthy of further investigation, we conducted histology and real-time quantitative PCR (qPCR) to compare evidence of stem cell activity between the two stages. Our findings demonstrate clear differences between all stages, highlighting those with molecular activity indicative of cell types suited to CCM development [15].

2. Results

2.1. Stage Allocation and Sample Preparation

Based on limb regeneration studies of the fiddler crab Uca pugilator [19,20,25] and the crayfish Cherax destructor [26], as well as our own observations of morphology and allometric growth, regenerating and regenerated claws of C. quadricarinatus adults were grouped into one of six stages: Stage 1- post autotomy with no observable growth; Stage 2 - emergence of an unsegmented papilla; Stage 3 - beginnings of segmentation with a closed dactyl; Stage 4 - almost fully segmented half-size limb immediately pre-molt; Stage 5 - a full-sized post-molt limb with fully segmented but soft cuticle; and Stage 6 - the cuticle-hardened and fully regenerated intermolt limb (Figure 1). RNA was extracted from each regenerate or full claw and quality assessed. Two of the 24 RNA samples failed initial library preparation quality control. Individual samples, their stages, R-values and QC status are detailed in Table 1.

2.2. Transcriptome Sequencing, Assembly and Quantification

A total of 22 RNA-Seq libraries were sequenced with Illumina NextGen sequencing, resulting in a minimum of 39 million cleaned reads per library. Six of these libraries (one per stage) were trimmed, then de novo assembled and clustered into a transcriptome resulting in 55,018 transcripts. Quantification was performed at the transcript level and then aggregated to 29,542 gene-level counts, which were subsequently normalized. BUSCO scores are presented in Table 2. The assembled transcriptome, quantification output files and normalized gene counts are provided in Supplementary Data Files SF1, SF2 and SF3 respectively.

2.3. Annotation of the Reference Transcriptome

Annotation of the initial reference assembly was conducted using top BLASTx hits from SwissProt (Accessed May 1st, 2023). This resulted in 39, 360 ORFs with Gene Ontology (GO), Evolutionary Genealogy of Genes: Non-supervised Orthologous Groups, Clusters of Orthologous Genes (eggnog COG), Kyoto Encyclopedia of Genes and Genomes (KEGG) pathways, and protein families (PFAM) domains and/or BLAST annotations (Table 3). The annotation output file is provided in Supplementary Data File SF4.

2.4. Principal Component Analyis

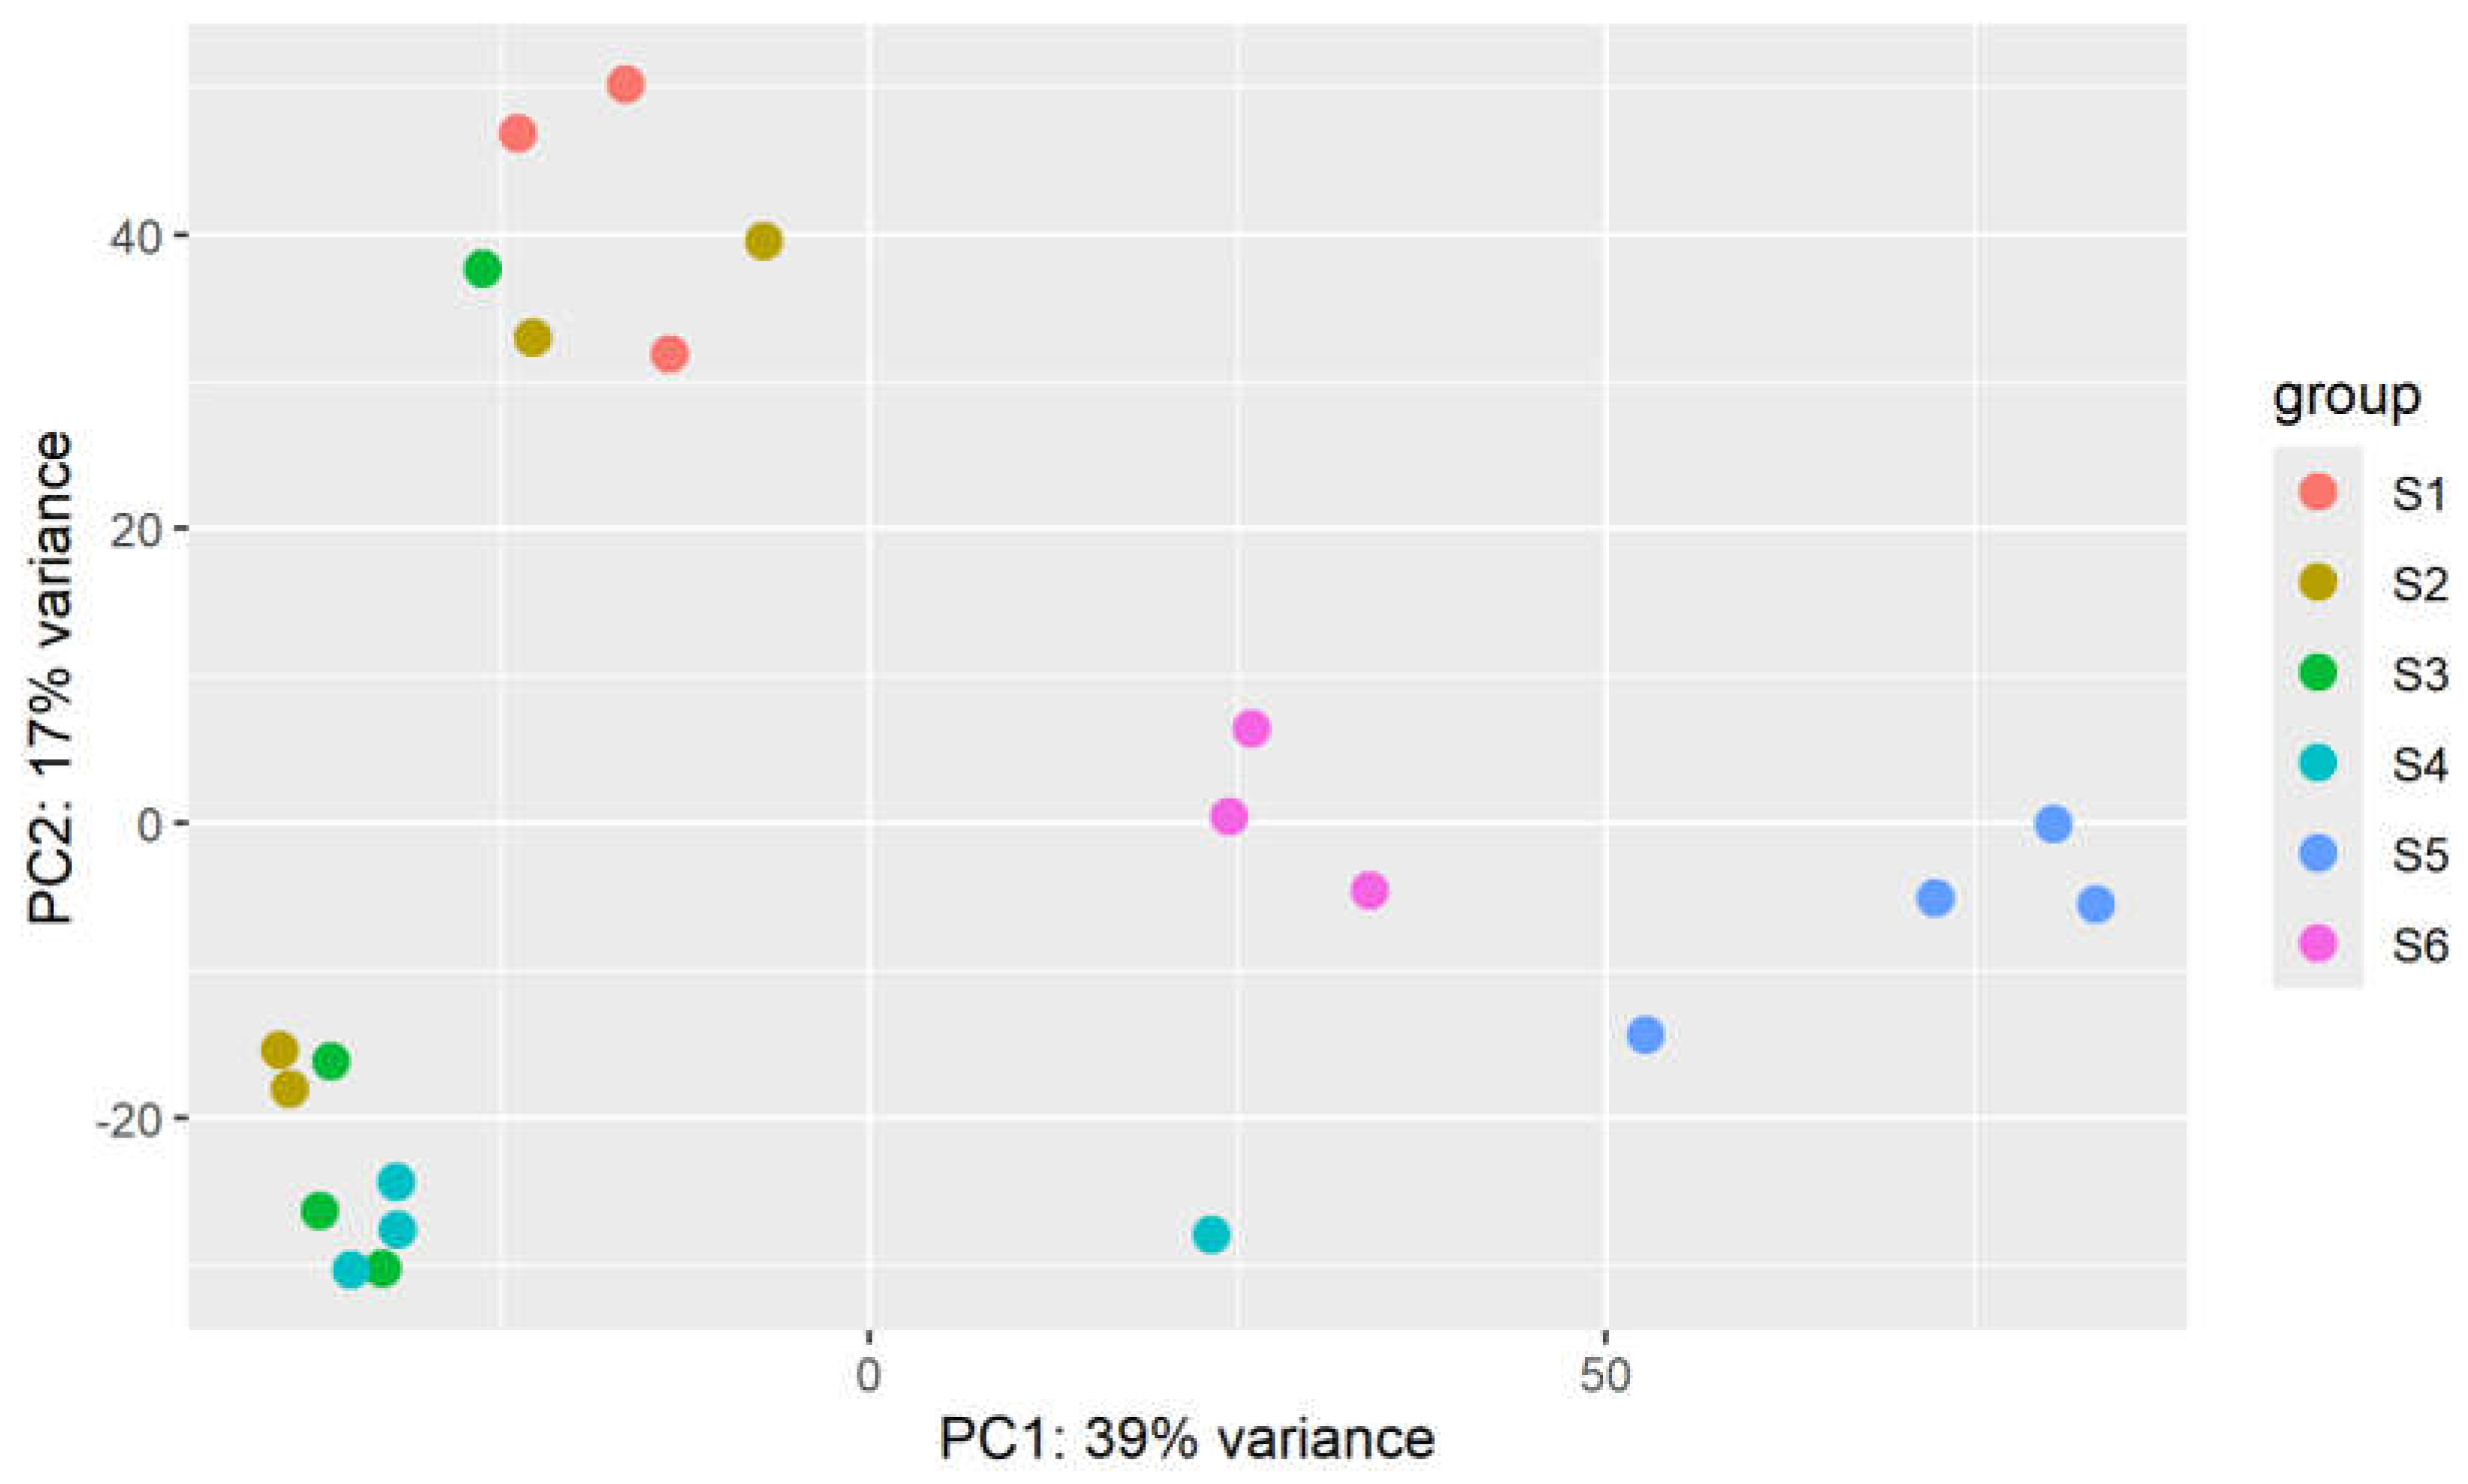
A principal component analysis was conducted on the top 500 genes, selected by highest row variance (Figure 2). While showing clear grouping for Stages 1, 5 and 6, stages 2, 3 and 4 shared some cross-over.

2.5. Selection of Differentially Expressed Genes

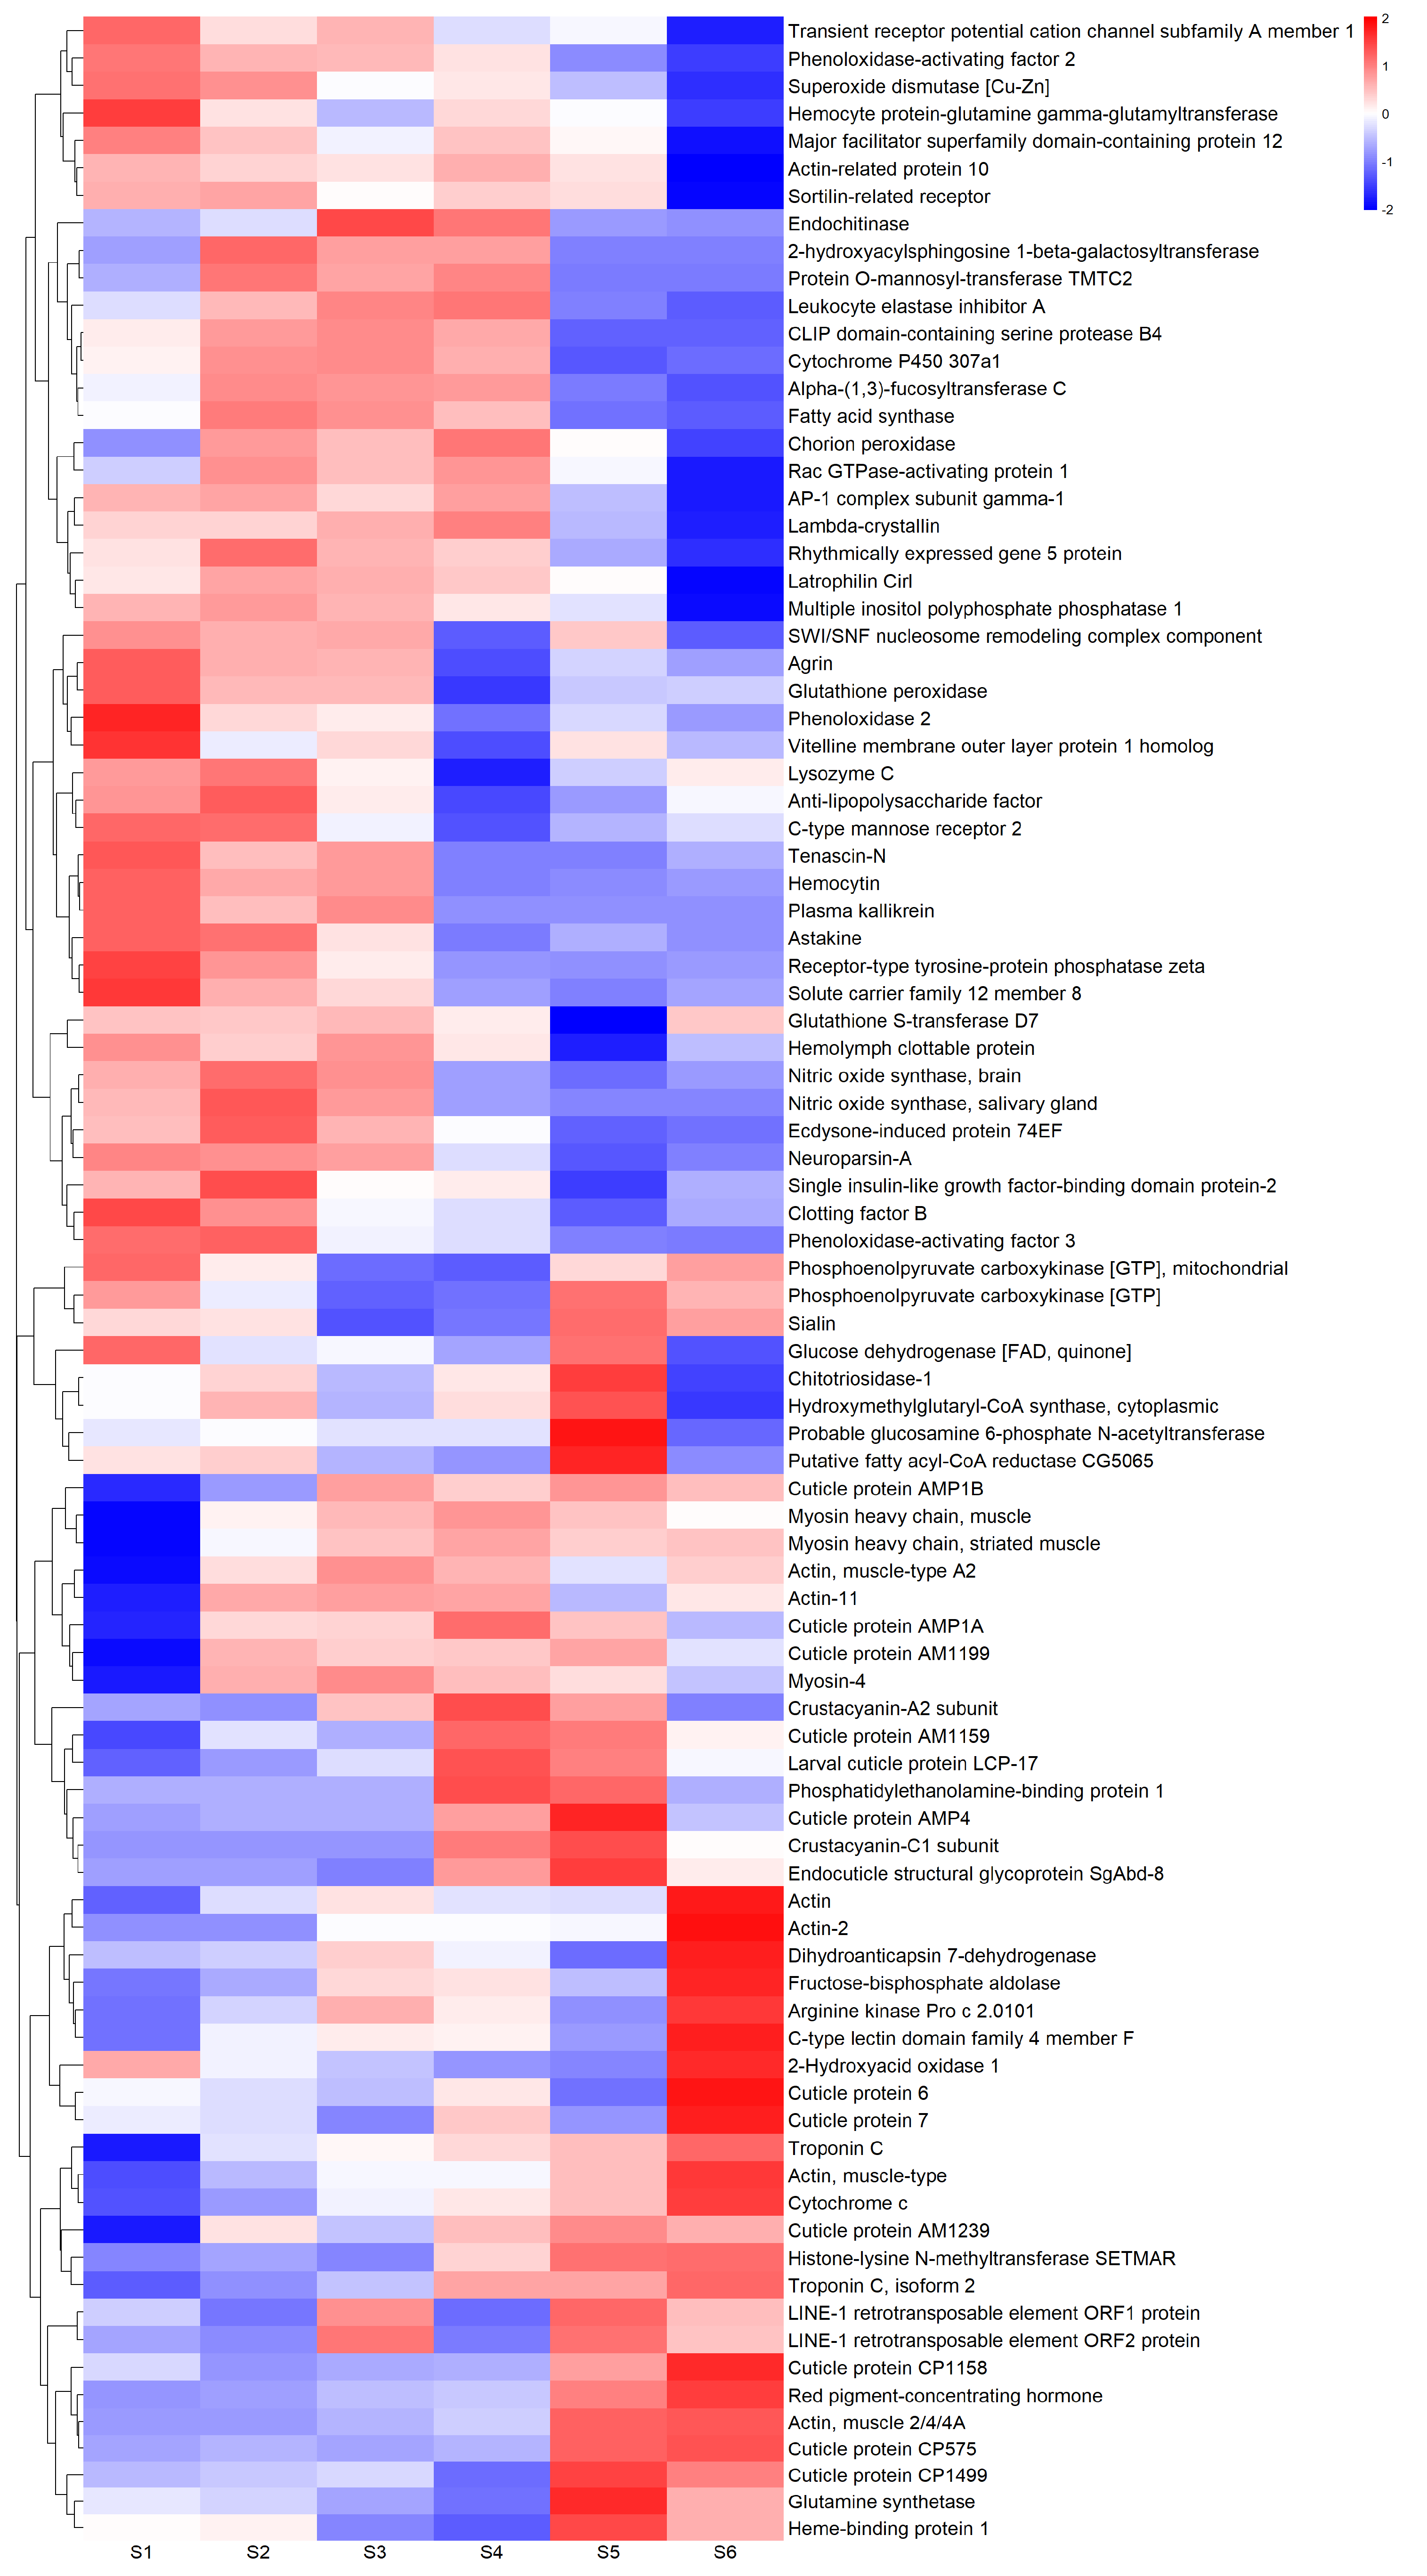
Transcript-level quantification was aggregated to gene-level abundance before differential expression analysis was conducted on all 15 pair-wise comparisons among the six regeneration stage groups, resulting in 16,450 differentially expressed genes (DEGs). Of those with SwissProt annotations, the top ten upregulated and top ten downregulated DEGs in each comparison group were collated and cleared of duplicates. Normalized gene counts for DEGs with the same gene name were averaged, as were sample counts for each regeneration stage. This resulted in 92 unique annotated DEG records which were plotted in a heatmap (Figure 3). A list of all DEG transcripts, their gene counts, statistical scores, and SwissProt annotations for each of the 15 pair-wise comparisons is found in Supplementary Data File SF5.

2.6. GO Enrichment of Differentially Expressed Genes

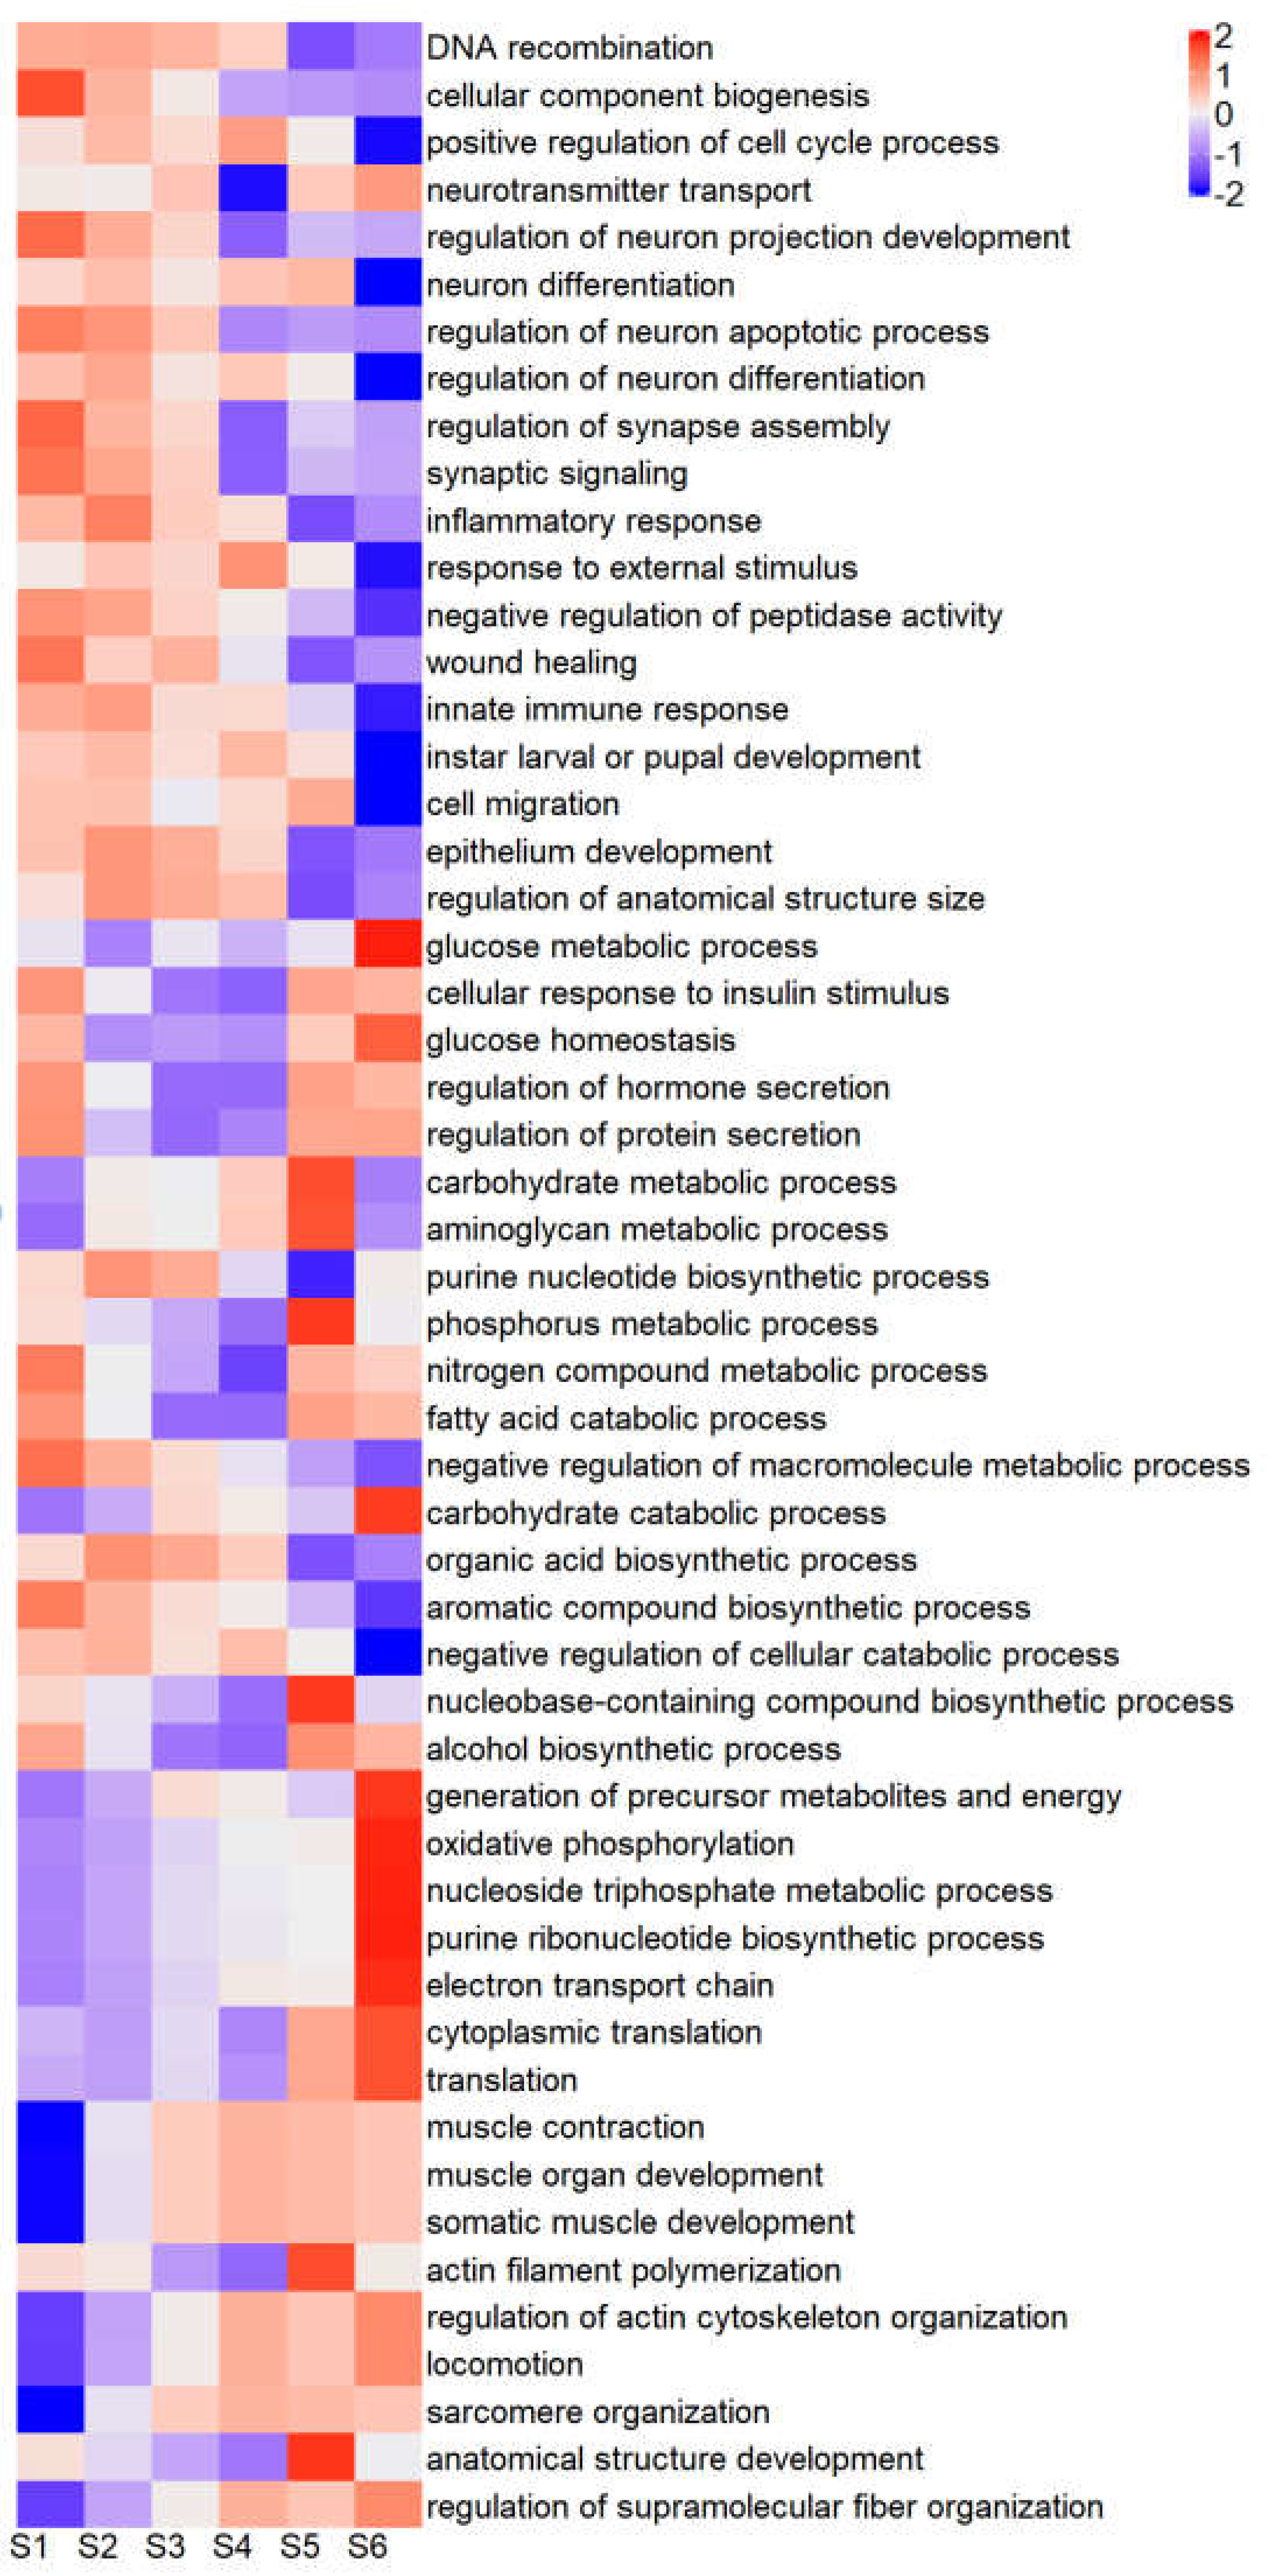
The GO term annotations of the DEGs were subject to enrichment analysis, with the 10 most significant annotations for each comparison (node size 70) returning 227 biological process (BP), 126 cellular compartment and 123 molecular function GO terms. Significantly enriched annotations of DEGs with all three GO term categories can be found in Supplementary Data File SF6. The 227 BP GO terms were curated to exclude duplicates and uninformative terms. Relative expression of the resulting 53 enriched BP GO terms, across six regeneration stages, was calculated by summing the normalized gene counts of all contigs contributing to that GO term (Figure 4).

2.7. Functional Characterization of Differentially Expressed Genes and GO Terms

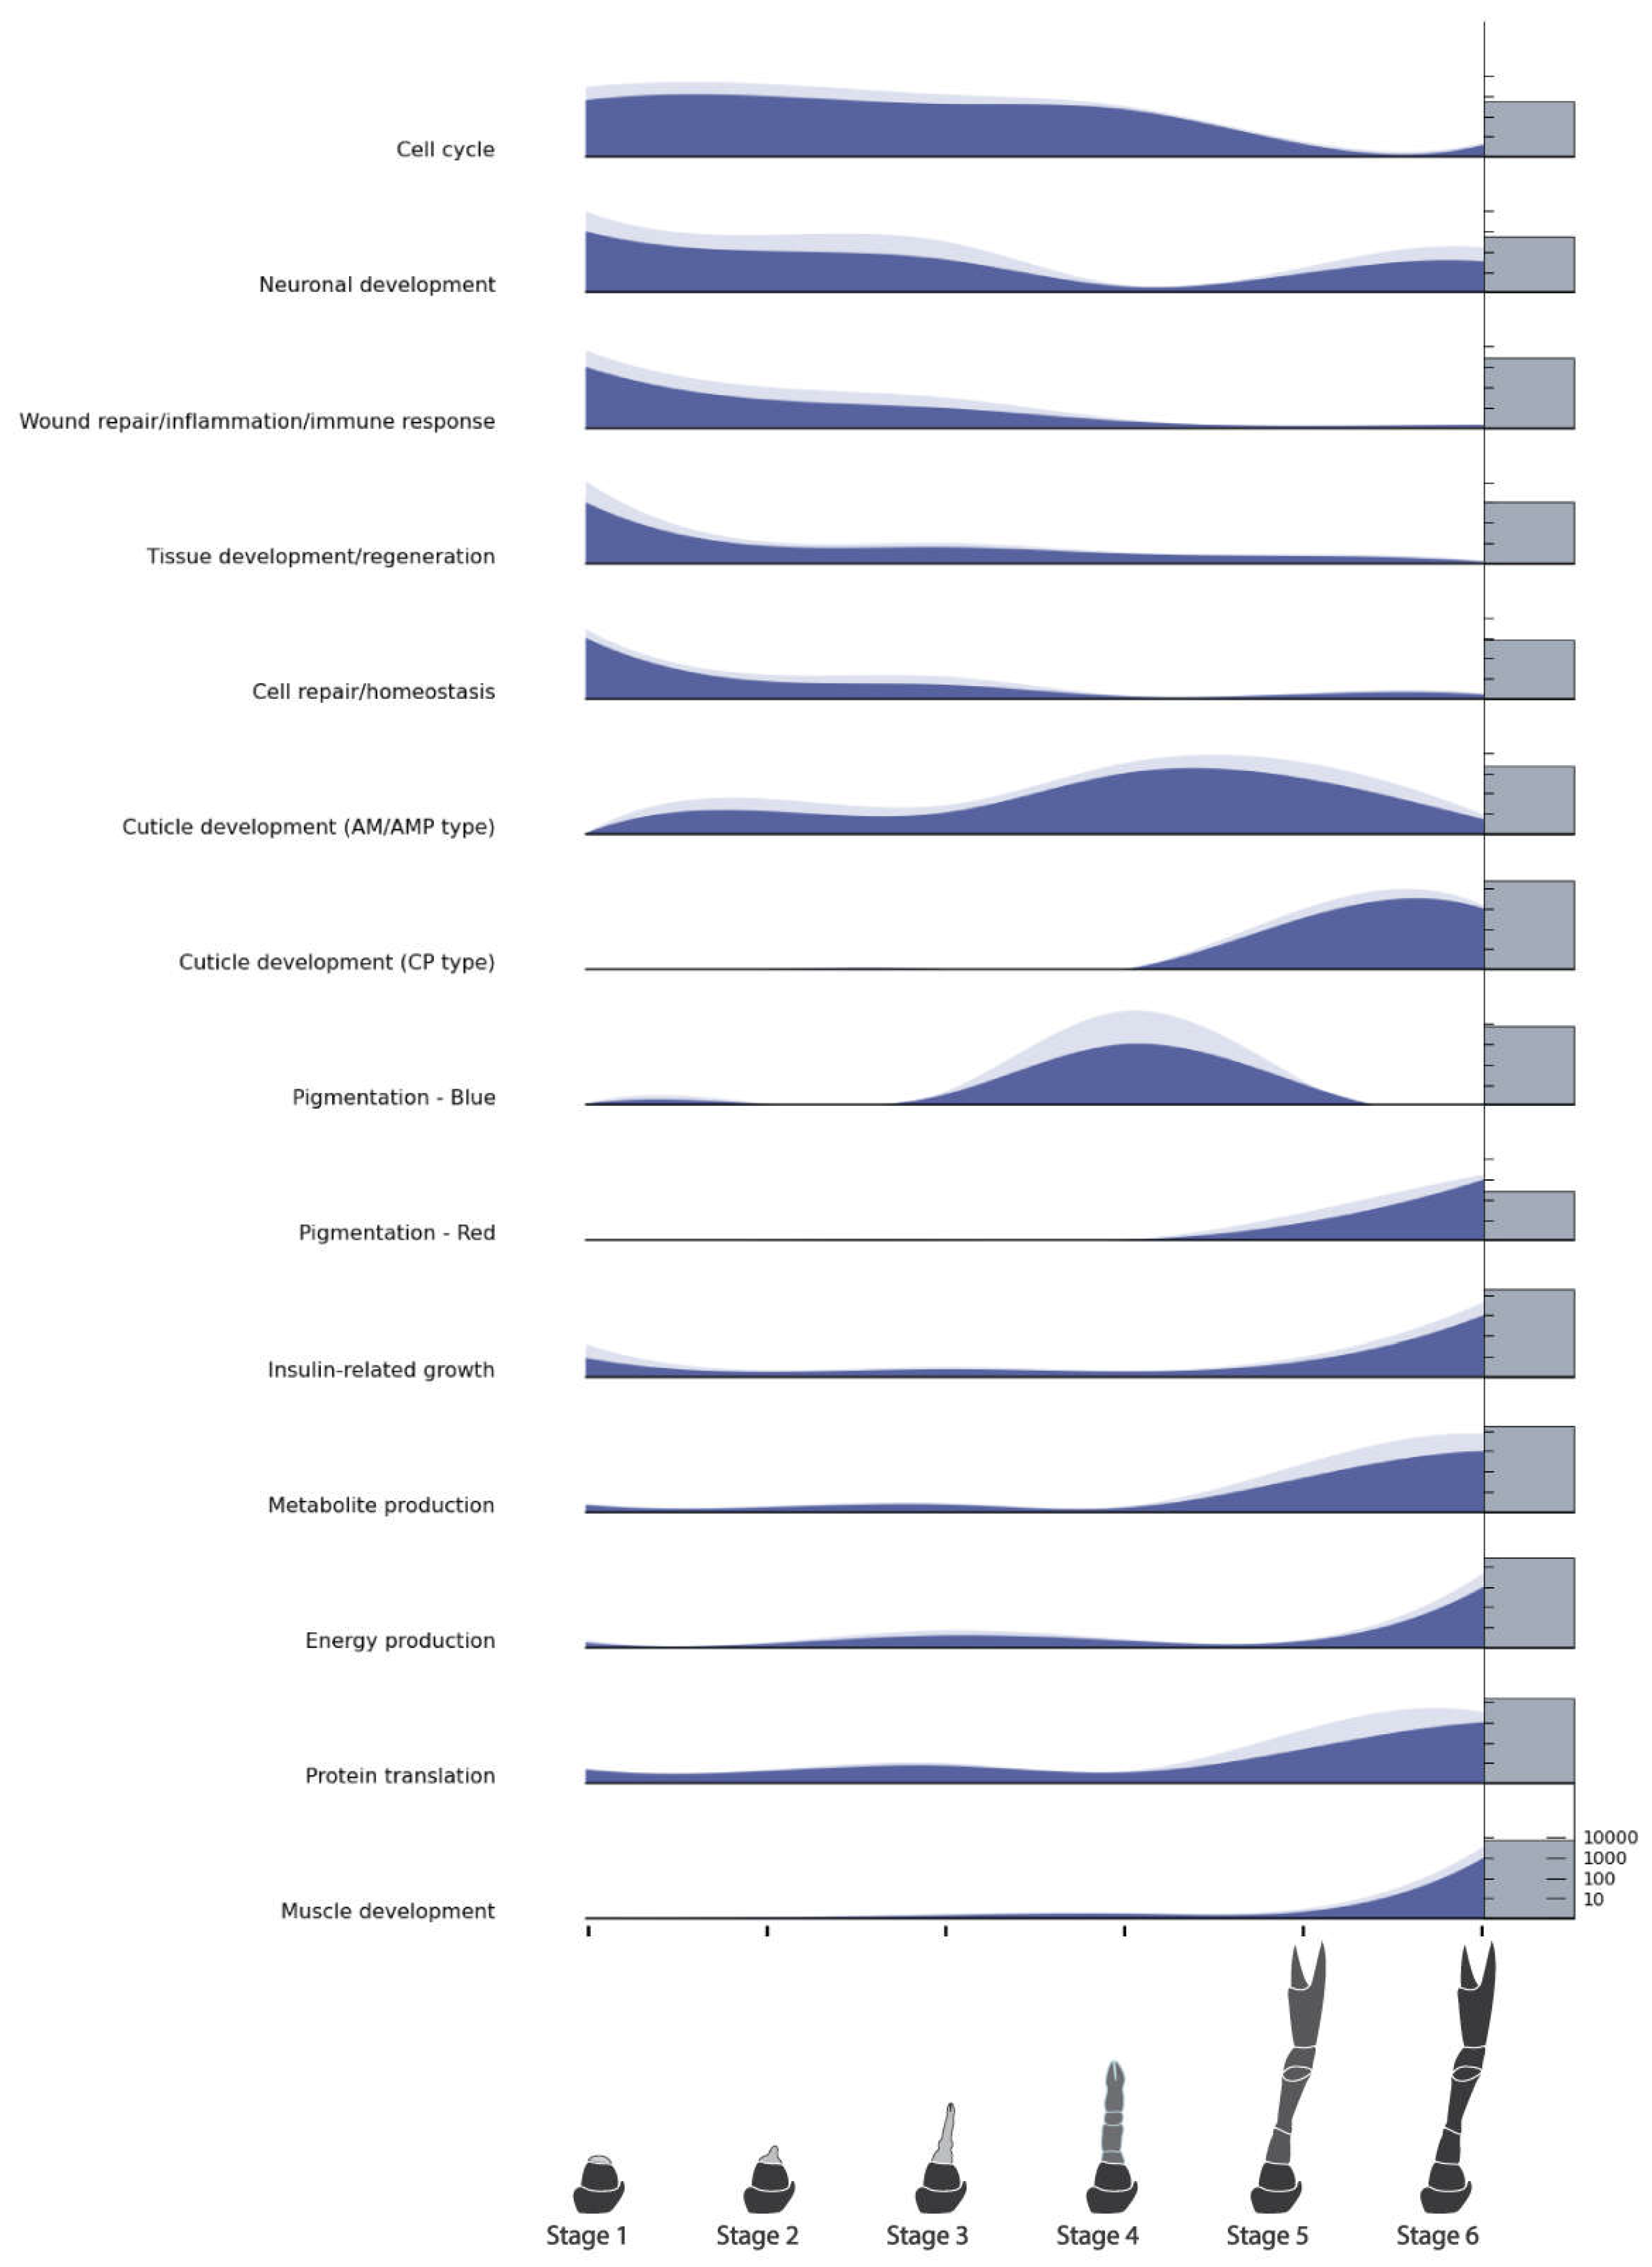
Cross-checking of gene function at www.uniprot.org and www.ncbi.nlm.nih.gov enabled grouping of the top 92 annotated DEGs into 12 functional categories, and the 53 enriched GO terms into nine functional categories (Table 4). GO term categories were based on functions inferred from the GO terms themselves, as well as annotation of the DEGs contributing to the GO terms. Merging the two category lists resulted in 14 functional categories. Normalized gene counts of all transcripts in each category were averaged, and relative expression of each category was plotted across the six stages (Figure 5). Six categories evident in both analyses are ‘Neuronal development’, ‘Wound repair/immune response’, ‘Tissue regeneration’, ‘Energy production’, ‘Metabolism/metabolite production’, and ‘Muscle development’. Those unique to the top 92 DEGs are ‘Cuticle development’, ‘Pigmentation’ (Blue and Red), and ‘Cell repair/homeostasis’ and those unique to the GO enrichment analysis are ‘Cell cycle activity’, ‘Insulin-related growth’, and ‘Protein translation’.
Functions which dominate in the earliest stages are wound repair/inflammation, tissue development and cell repair. Those mostly in the post-molt stages are muscle development, protein translation, energy production, metabolite production, CP type cuticle proteins (related to hard exoskeletons) [27] and red pigmentation. In the immediate pre-molt (Stage 4), AM/AMP type cuticle proteins (related to flexible, membranous cuticles) [27] and blue pigmentation dominate.
As expected, wound repair and immune response genes showed higher expression in the earliest stages. Tissue development and cell repair/homeostasis genes showed similar expression. Neuronal development and cell cycle activity showed continual expression across the regeneration process albeit with less in the post-molt stages, particularly for the cell cycle genes. Upregulation in middle stages (mostly Stage 4) was dominated by arthrodial membrane cuticle proteins (AM/AMP type) and blue cuticle pigmentation. In contrast, structural cuticle proteins (CP type) were expressed in the post-molt stages when the exoskeleton is hardening. As expected, the majority of muscle fiber development is upregulated after the molt when the newly enlarged limb fills with muscle tissue. In line with this intense anabolic activity, both metabolite synthesis and energy production are upregulated at the same time. Interestingly, there seemed to be a high presence of genes related to insulin metabolism and growth which occurred mostly at both ends of the regeneration process.

2.8. Identification and Relative Expression Analysis of Target Homologs

A list of target genes potentially relevant to CCM production from regenerating tissues was compiled based on our previous analyses [15] and grouped into four categories: endocrine factors, myogenic factors, cell cycle factors and pluripotency factors. TransPi annotation results and BLAST searches with well characterized orthologs of model organisms (human, mouse and fruit fly), were used to identify target factors in the present transcriptome. Putative orthologs were then cross-checked for appropriate domains using SMART (http://smart.embl-heidelberg.de/) and relevant top BLAST hits on NCBI (https://blast.ncbi.nlm.nih.gov/Blast.cgi) and UniProt (https://www.uniprot.org/blast). A number of target factors could not be confidently identified (Table 4). For those orthologs that were confidently identified, their relative expression across the limb regeneration stages was plotted in stacked curve graphs, one for each category: Endocrine factors (Figure 6), myogenic factors (Figure 8), cell cycle factors (Figure 9), and pluripotency factors (Figure 10).

2.8.1. Endocrine Factors

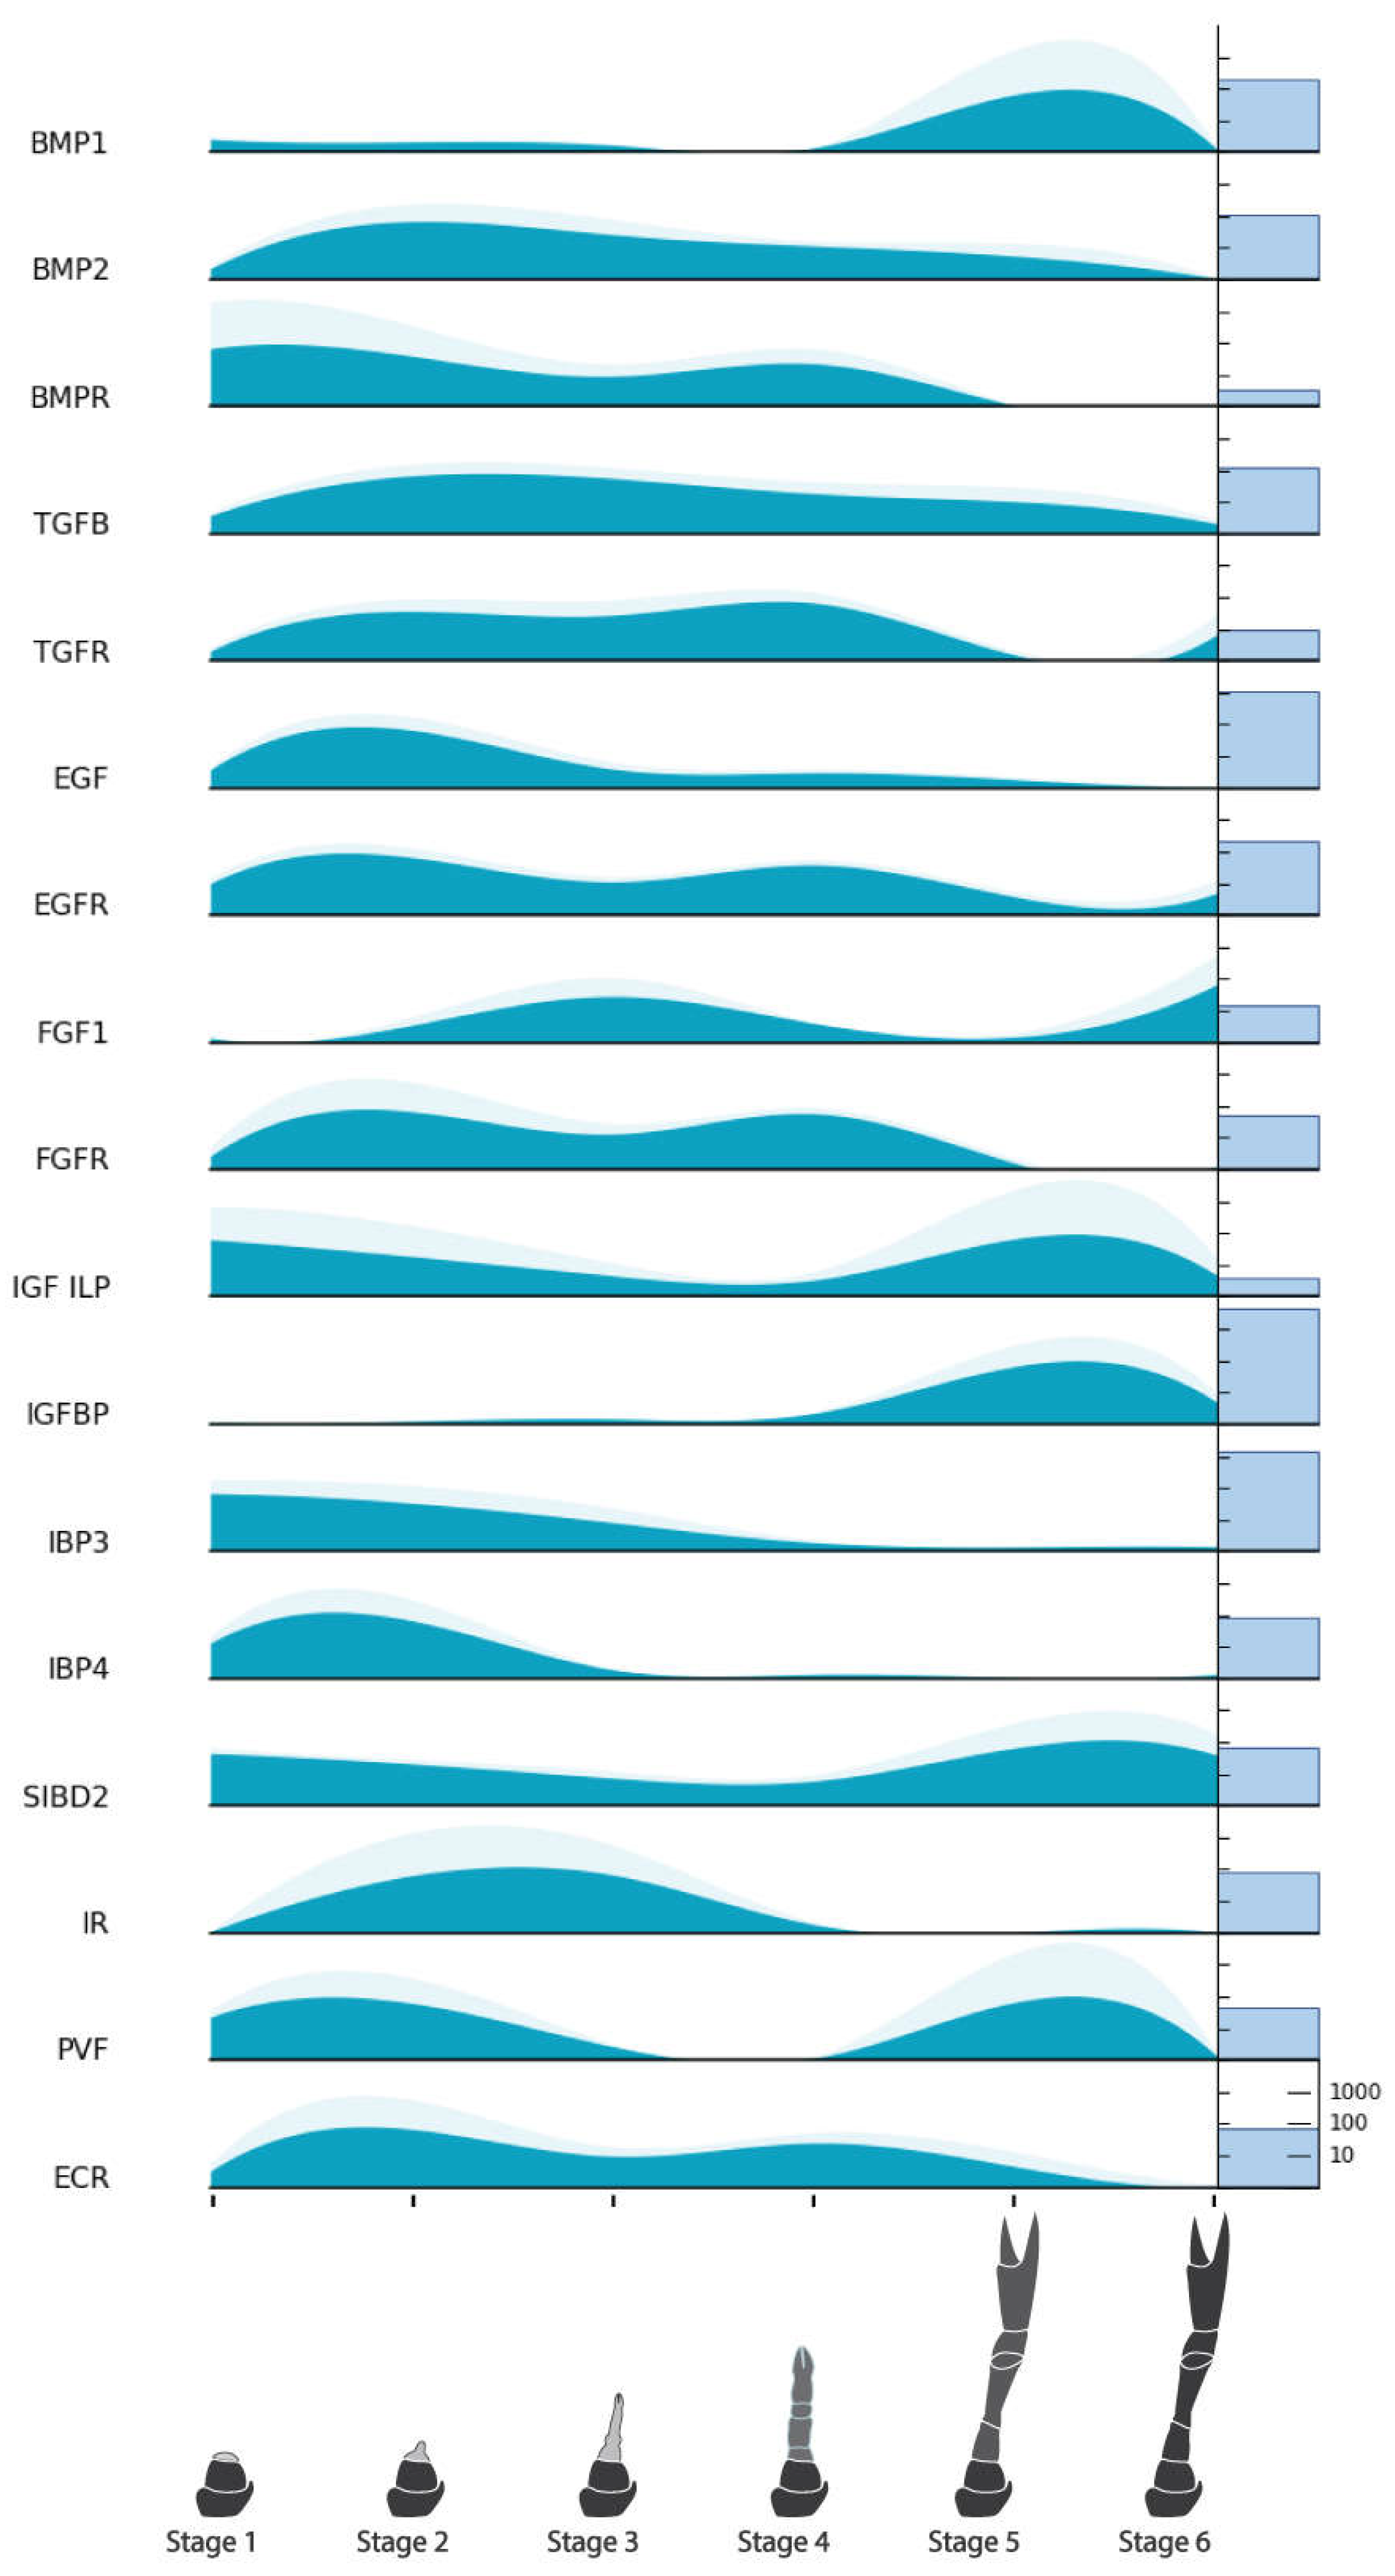
A number of endocrine factors and their receptors were identified with varying expression across the limb regeneration process (Figure 6). Most notably, the ecdysone receptor (EcR) and all growth factor receptors (except the insulin receptor) display a two-peaked expression pattern prior to the molt in Stages 2 and 4. Ligands BMP2 and TGFb share reasonably continual expression with gradual decline from a Stage 2 peak down to low expression in Stage 6. BMP1 by contrast, is more upregulated in Stage 5. EGF expression is greater in Stage 2 with some continuation in Stage 4 and none in the post-molt stages. The FGF homolog is upregulated in Stages 3 and 6 which is opposite to its supposed receptor. Numerous IGF-related proteins were identified, with varying expression but overall concurring with the DEG analysis which showed insulin-related growth occurring in the earliest and latest stages. The only insulin-related receptor (IR) to be confidently identified showed greater upregulation in Stages 2 and 3. The PVF homolog shows similar expression to insulin-related genes (IGF/ILP and SIBD2). The PVF receptor (PVR), HGF, its receptor, and myostatin were not confidently identified in the current dataset.
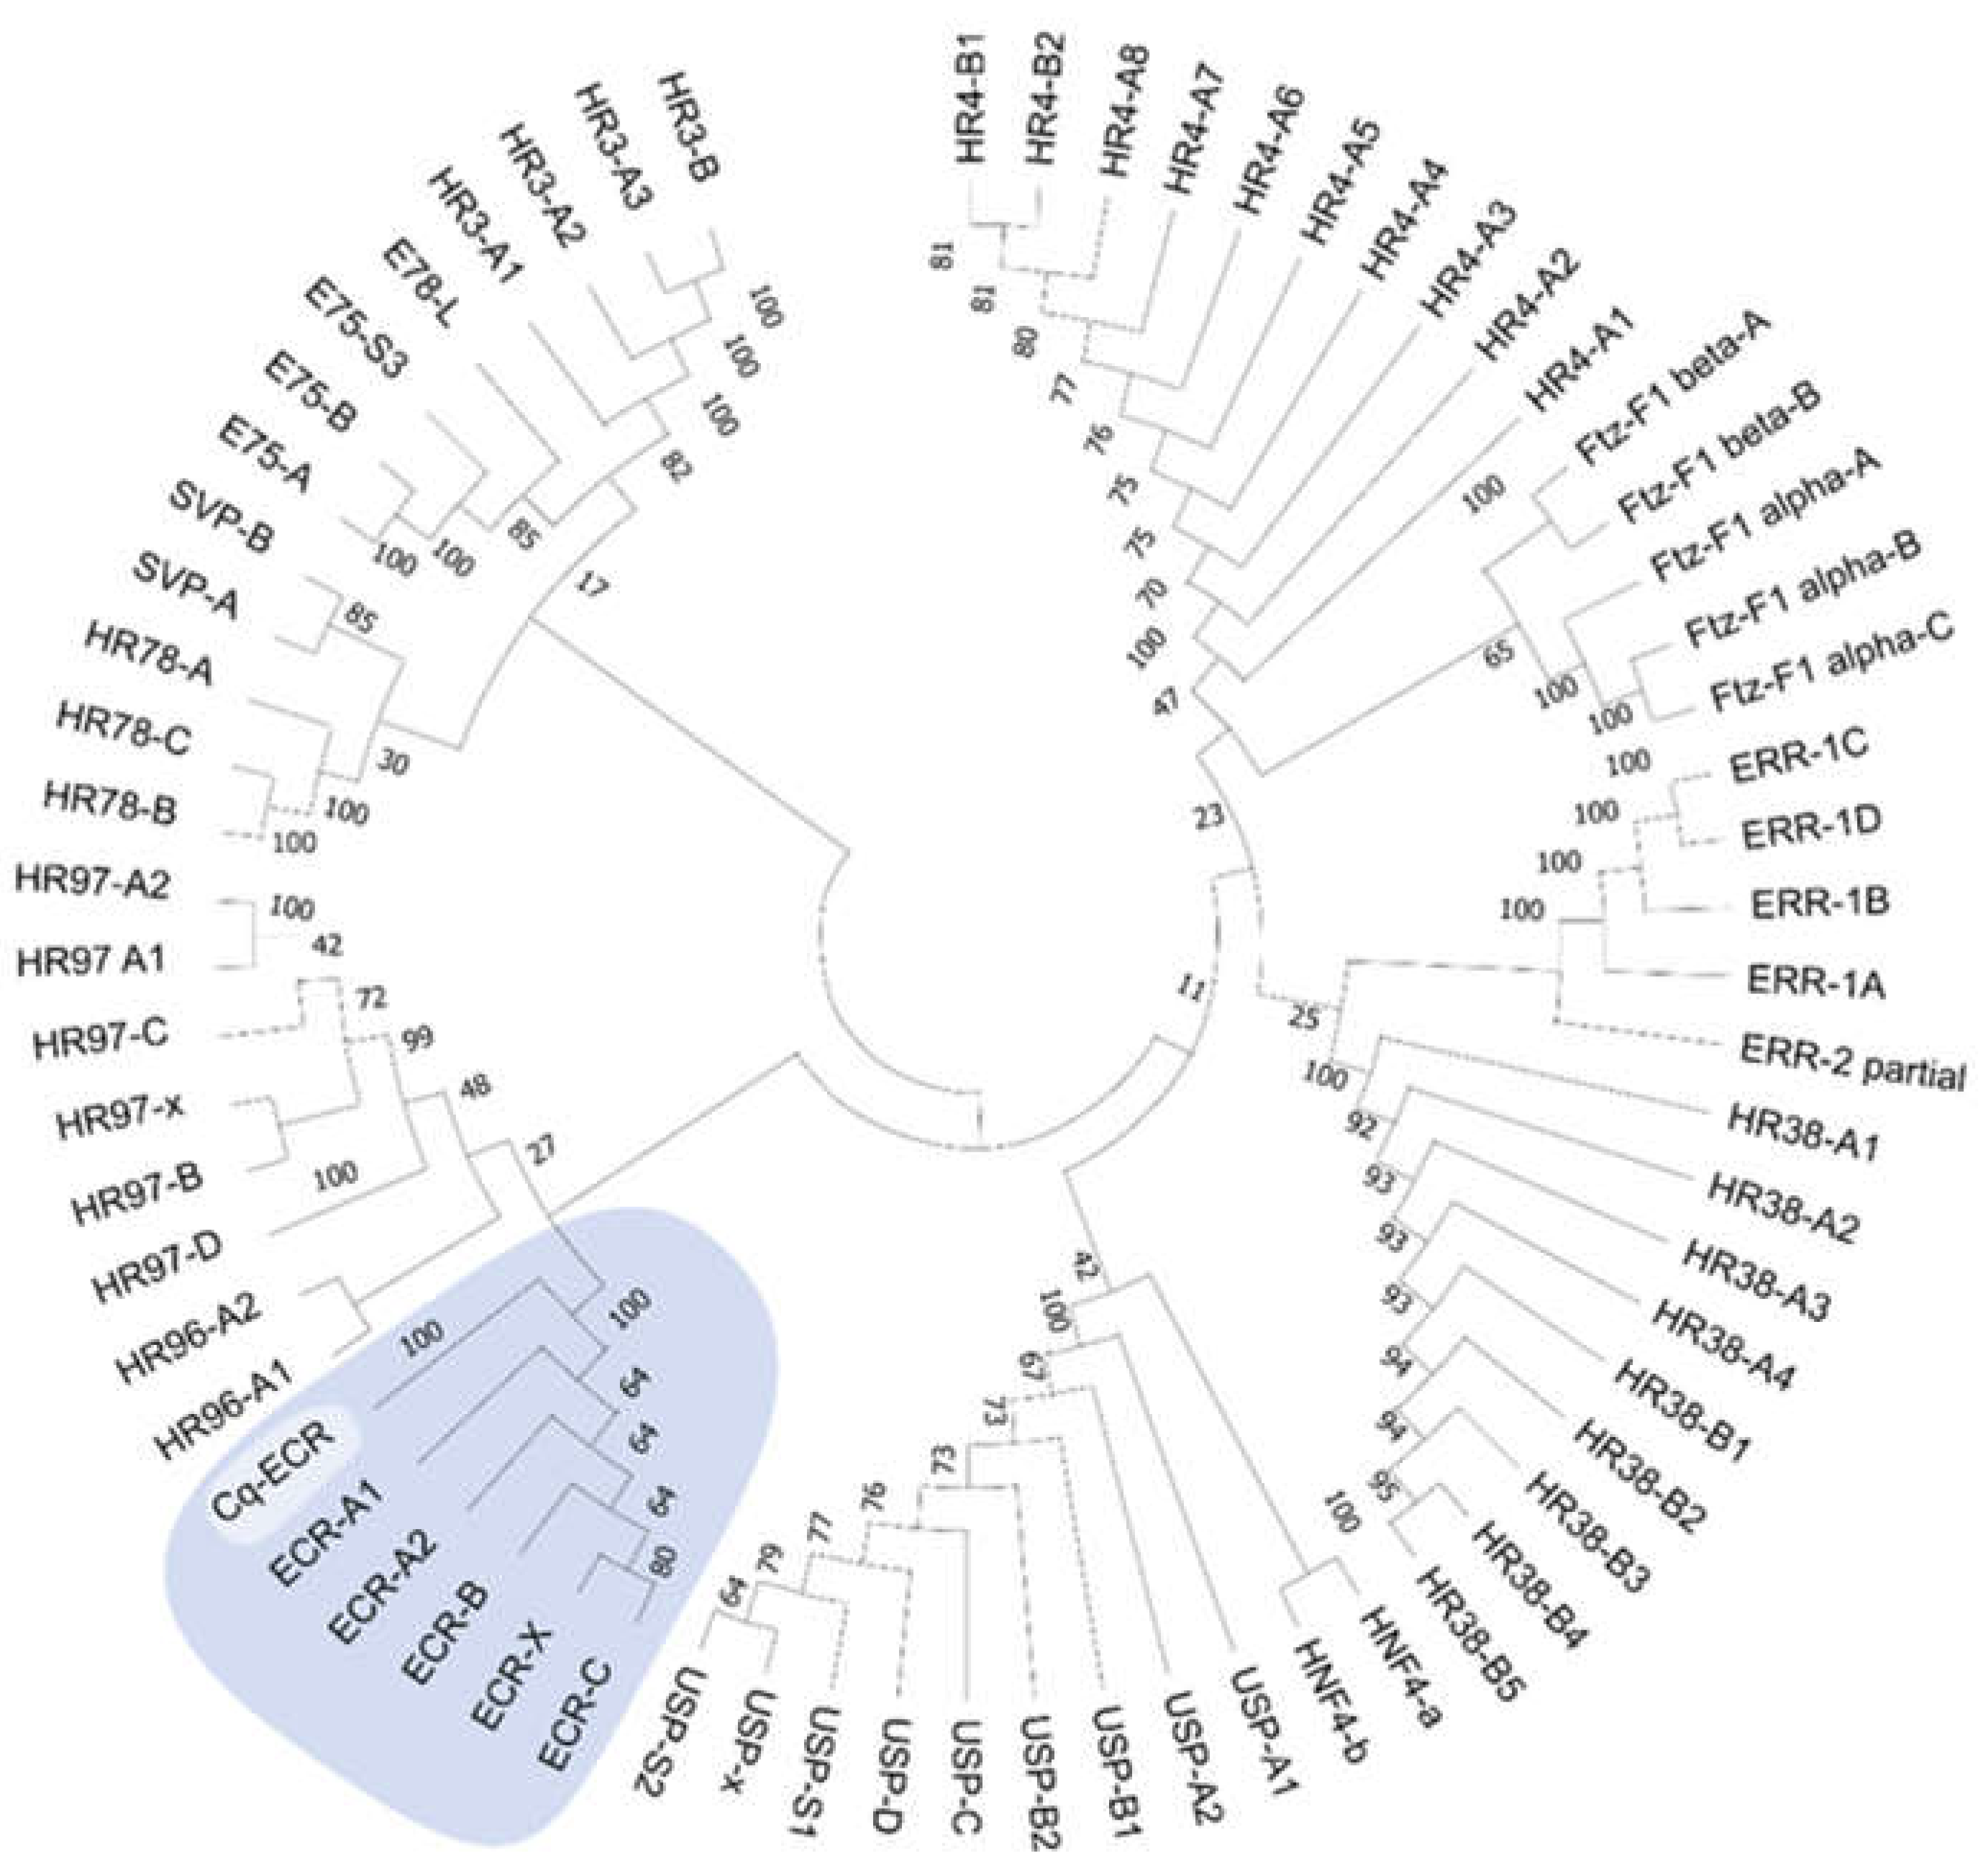
Nuclear receptor families have recently been characterized in the tropical spiny lobster Panulirus ornatus [28] so there was opportunity to further annotate the C. quadricarinatus EcR with phylogeny. Neighbor-Joining tree construction of receptor DNA binding domains shows the C. quadricarinatus receptor clearly clusters with the EcR family, providing further evidence of its expected function (Figure 7).

2.8.2. Myogenic Factors

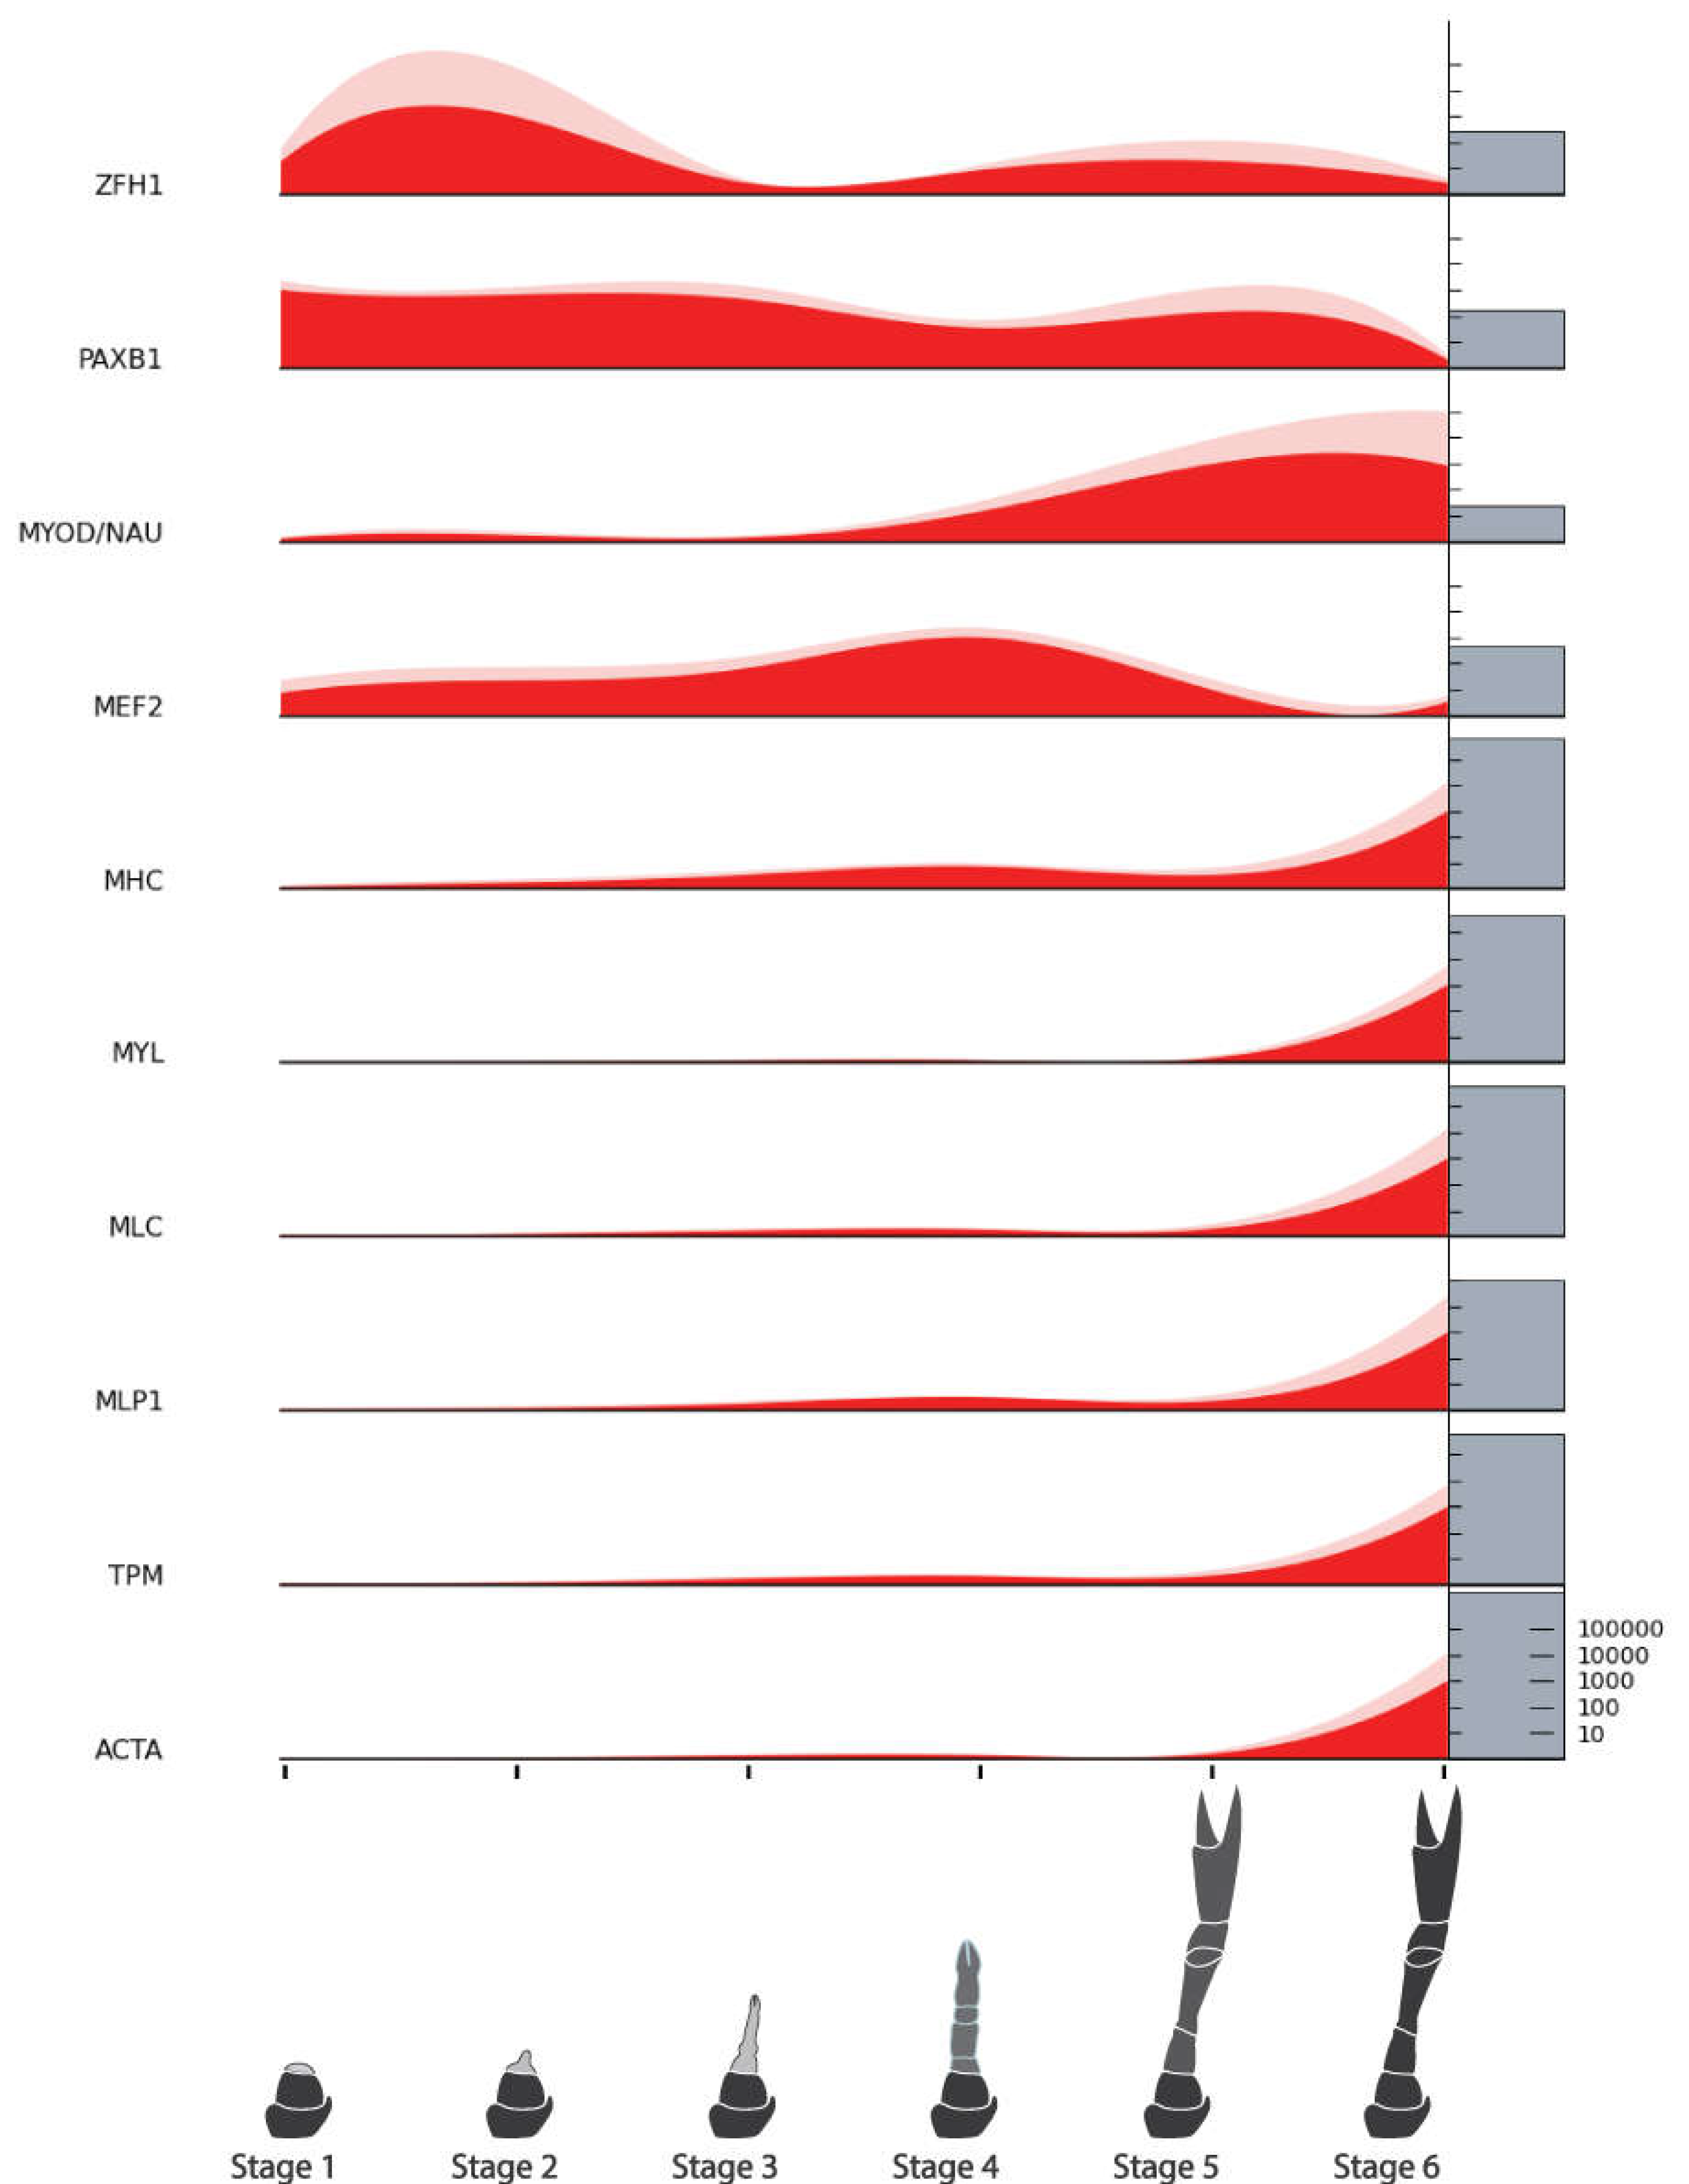
The myogenic factors investigated are those known to be involved in embryonic or adult myogenesis and myofibrillar proteins associated with hypertrophy. The D. melanogaster satellite cell marker, Zfh1, showed upregulation during the Stage 2 growth peak and again during Stages 4 and 5. Clear homologs of the vertebrate satellite cell markers Pax 3 and Pax 7 could not be identified, but a Pax3/7-related protein PaxB1 shows upregulation across all stages except Stage 6, like Zfh1. The gene most commonly associated with myogenesis downstream from the Pax3/7 is MyoD and its D. melanogaster equivalent Nautilus (Nau). The closest Nau homolog in the current data shows clear upregulation in Stage 6. Mef2 which is known to work synergistically with other myogenic factors is primarily upregulated prior to the molt, peaking in Stage 4. As expected, and in concurrence with the DEG analysis, all myofibrillar proteins are almost exclusively upregulated in Stage 6 with some slight uplift in Stage 4.
Figure 8. Relative expression of myogenic factors across limb regeneration of Cherax quadricarinatus. Mean normalized gene count, standard error and absolute gene counts calculated and represented as for Figure 5. Gene names are abbreviated. For full gene names, refer to Table 5 and section above.
Preprints 110733 g008

2.8.3. Cell Cycle Genes

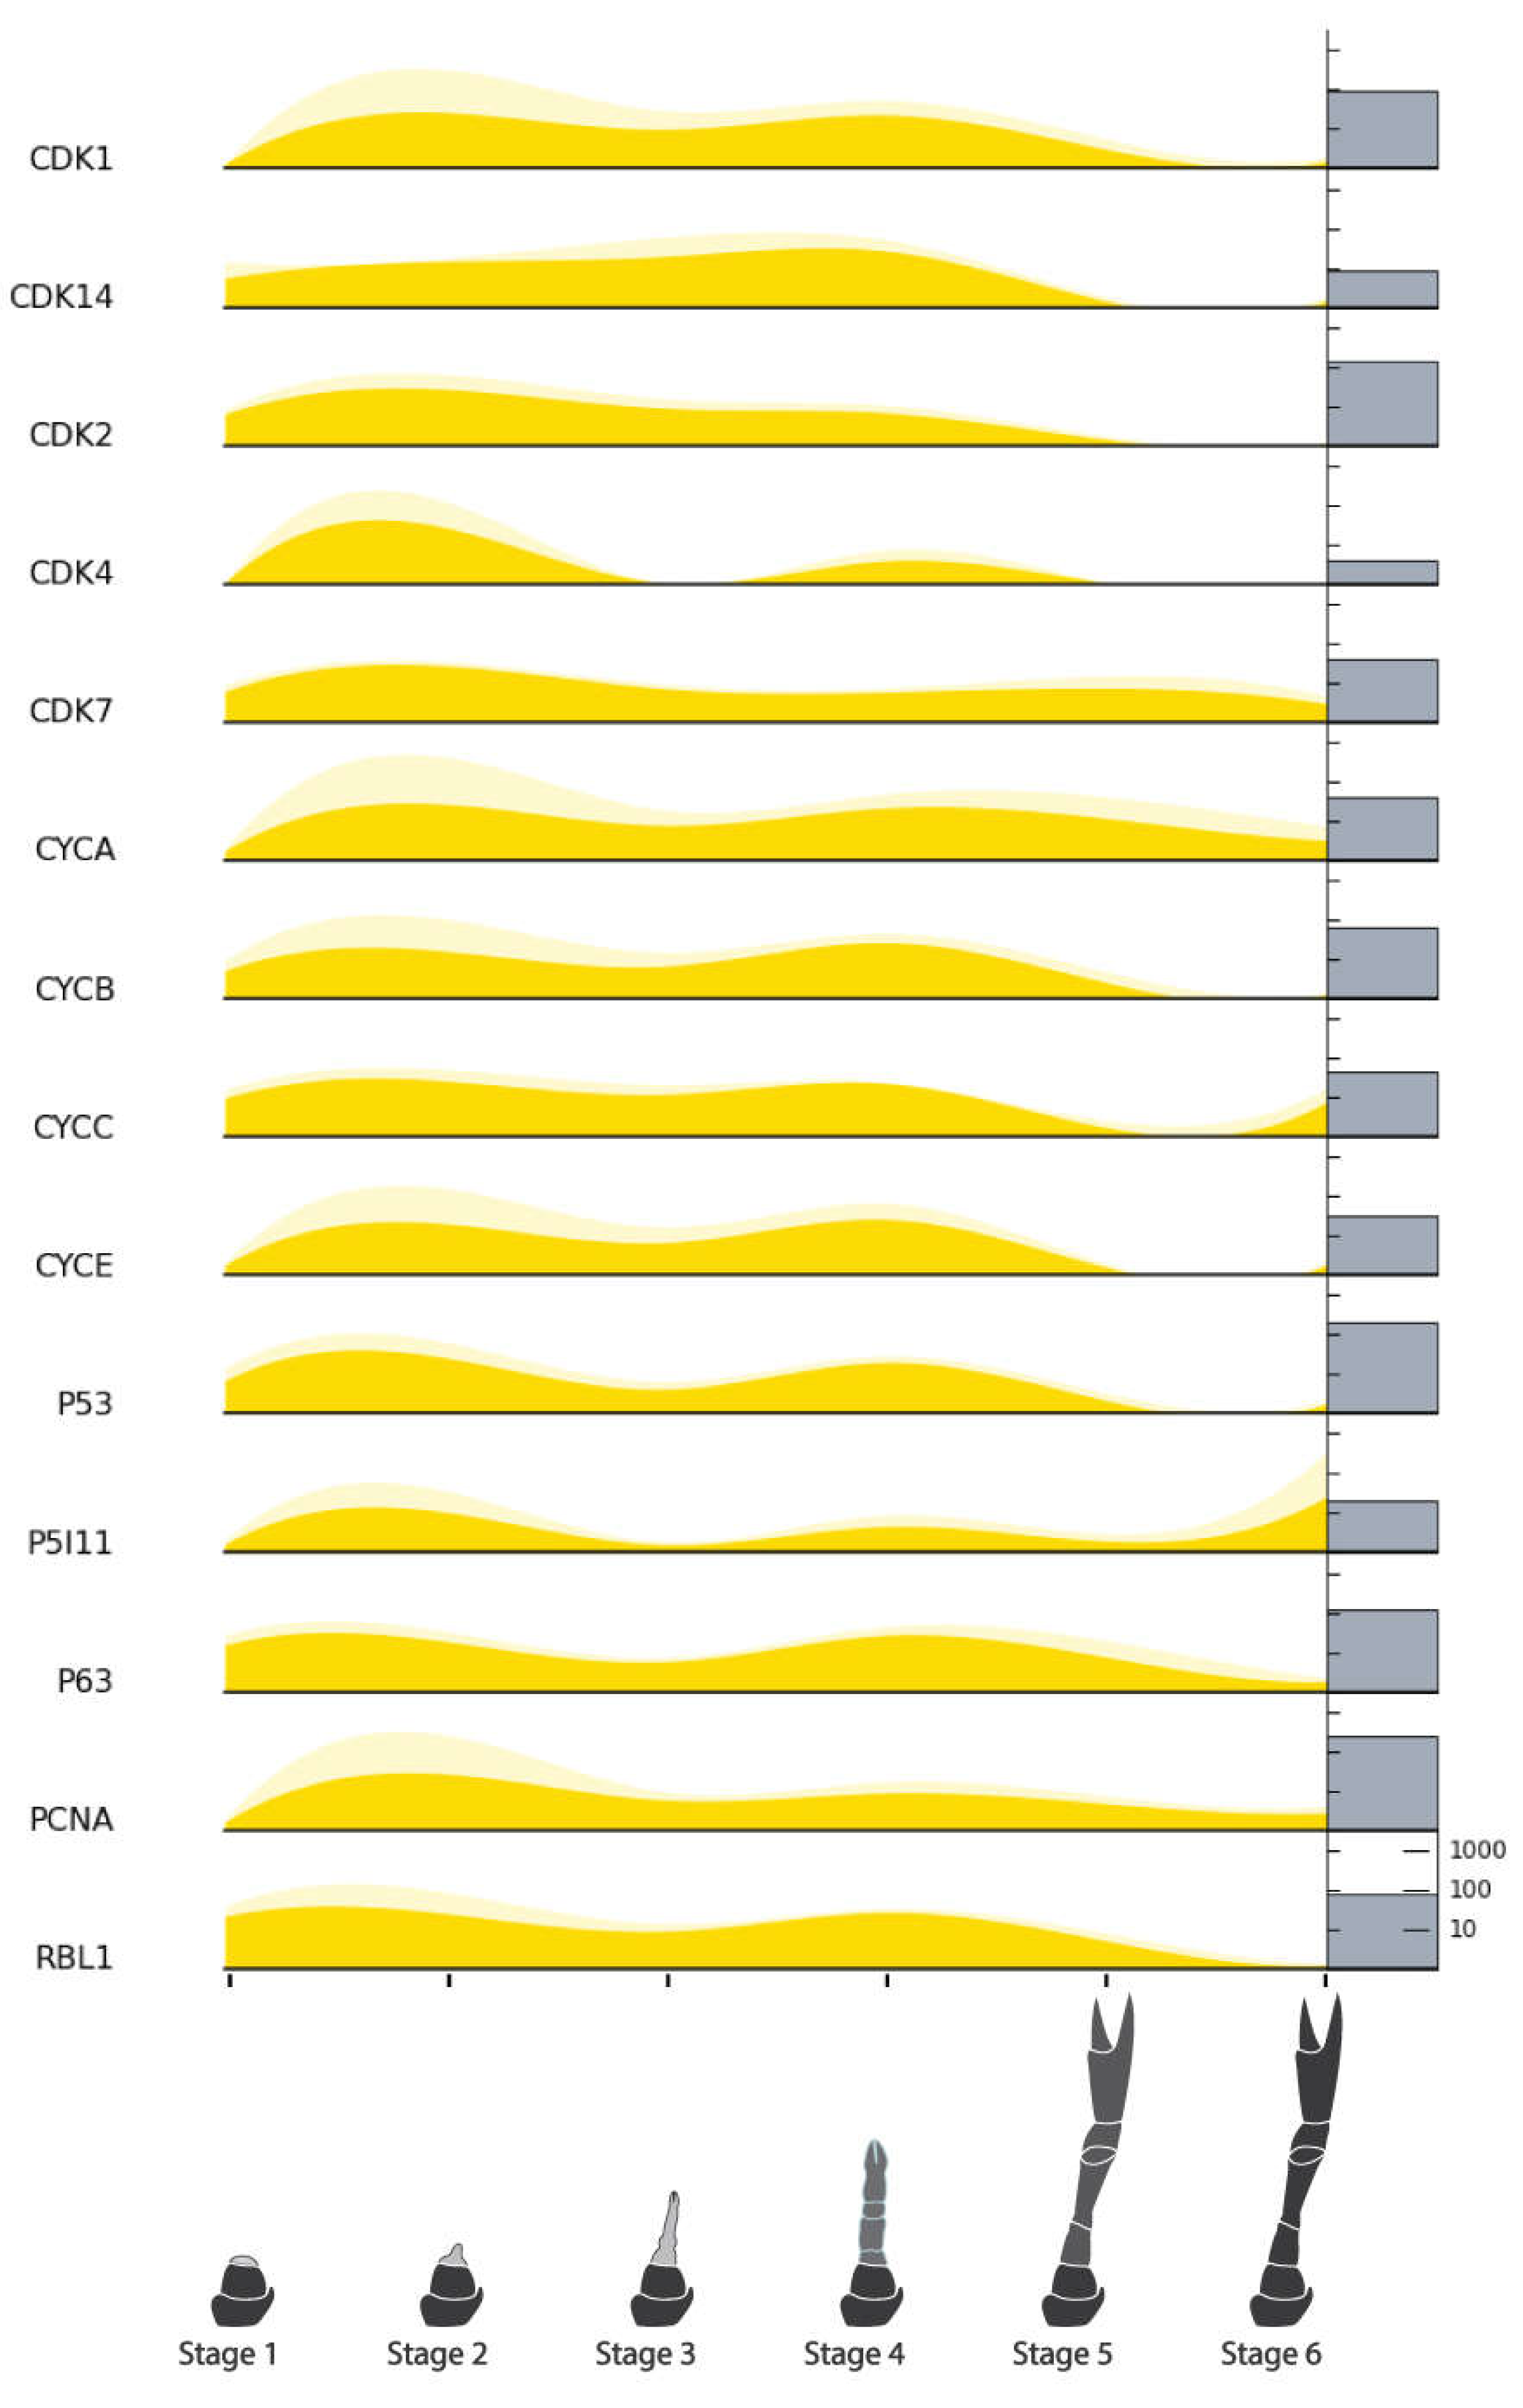
The cell cycle genes show mostly coincidental expression which largely follows the two-peak pre-molt pattern observed for the endocrine receptors. Only CDK7, Cyclin A, Cyclin C, and the p53-inducible protein (P5I11) show either upregulation or very minimal downregulation in the post-molt stages. The overall pattern concurs with the cycle activity observed in the DEG analysis (Figure 5).
Figure 9. Relative expression of cell cycle factors across limb regeneration of Cherax quadricarinatus. Mean normalized gene count, standard error and absolute gene counts calculated and represented as for Figure 5. Gene names are abbreviated. For full gene names, refer to Table 5 and section above.
Preprints 110733 g009

2.8.4. Pluripotency Factors

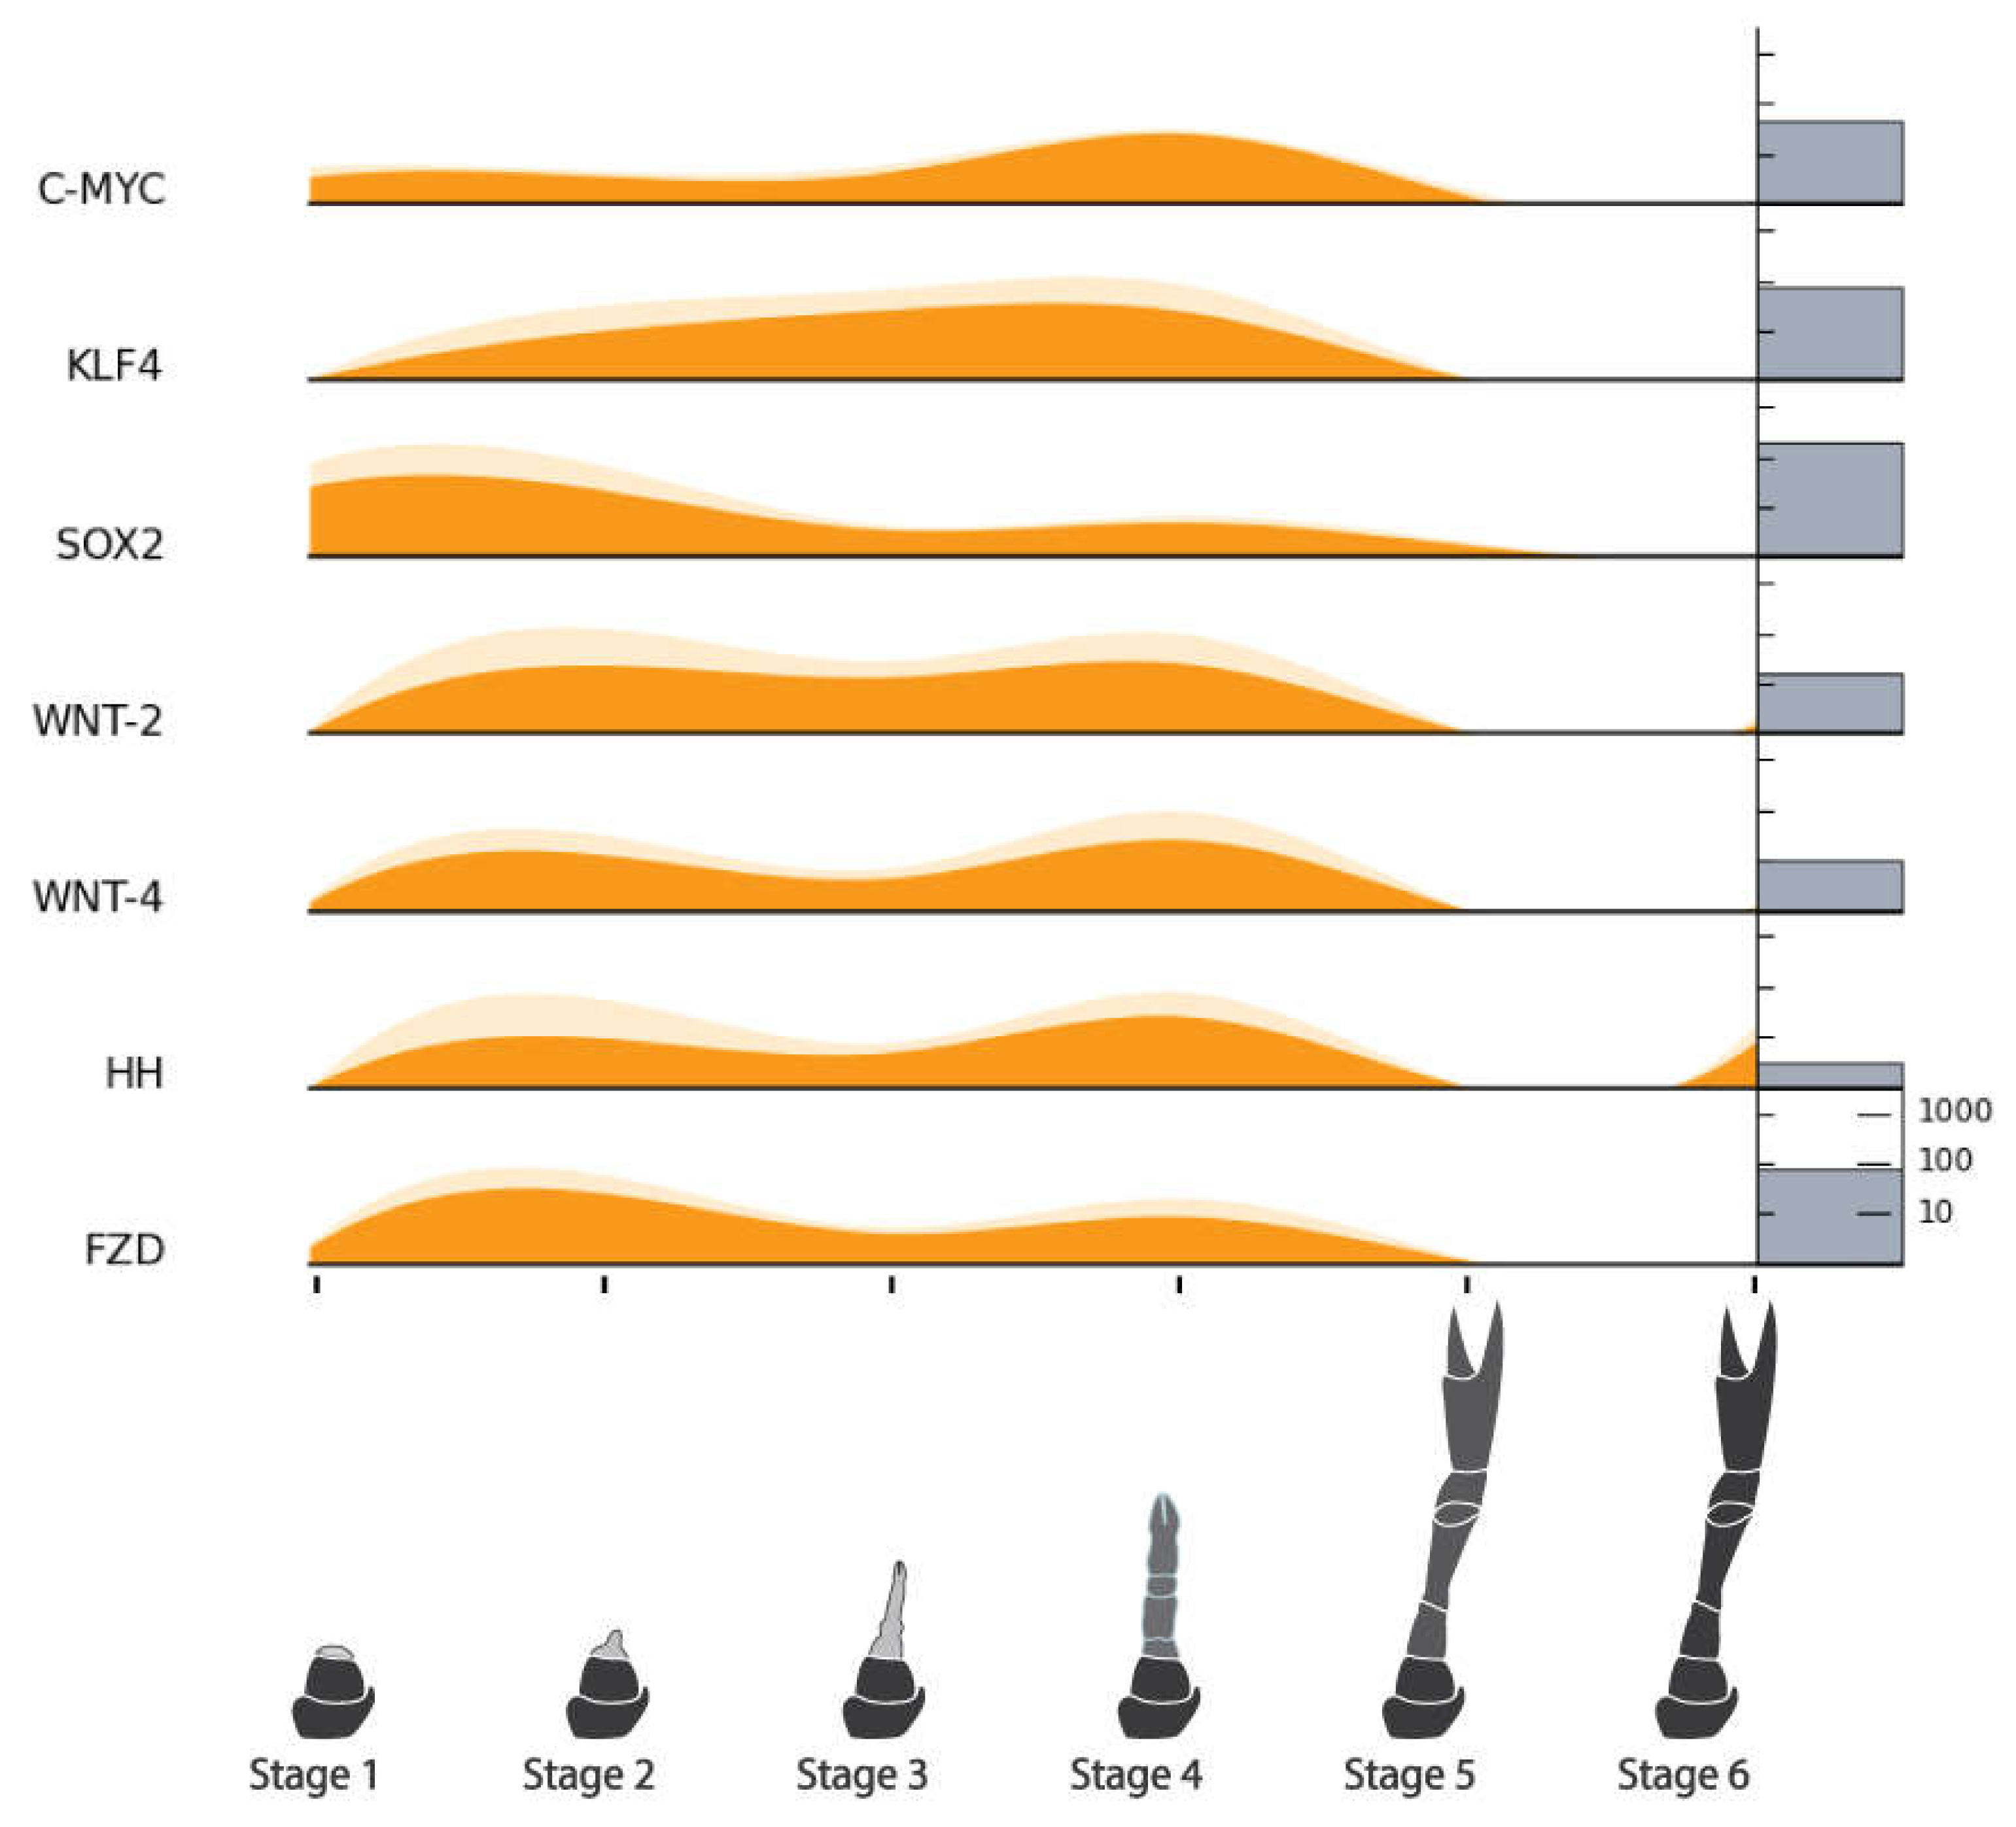
The pluripotency factors show similar expression to the cell cycle genes which aligns with greater proliferative qualities of the more pluripotent stem cells. Most show the same two-peak pattern to varying degrees and all but Hedgehog are not expressed after the molt.
Figure 10. Relative expression of pluripotency factors across limb regeneration of Cherax quadricarinatus. Mean normalized gene count, standard error and absolute gene counts calculated and represented as for Figure 5. Gene names are abbreviated. For full gene names, refer to Table 5 and section above.
Preprints 110733 g010

2.9. Stage 4 vs Stage 6 Tissues as Potential Stem Cells Sources for CCM Development

The primary intention of this transcriptomic analysis was to identify optimal tissue sources of starting stem cells for CCM development. Full grown intermolt claw tissue (akin to Stage 6) has been identified previously as a potential source of MSCs including satellite cells [30], however the present analysis suggests that tissues collected during pre-molt regeneration, are undergoing more proliferative activity and may be a more viable source. Although such activity appears to peak equally in Stages 2 and 4, Stage 4 limbs are considerably larger and more accessible so are potentially a more productive source of stem cells. For this reason, Stage 4 tissues were selected for further comparative analysis against those of Stage 6.

2.9.1. Histological Analysis

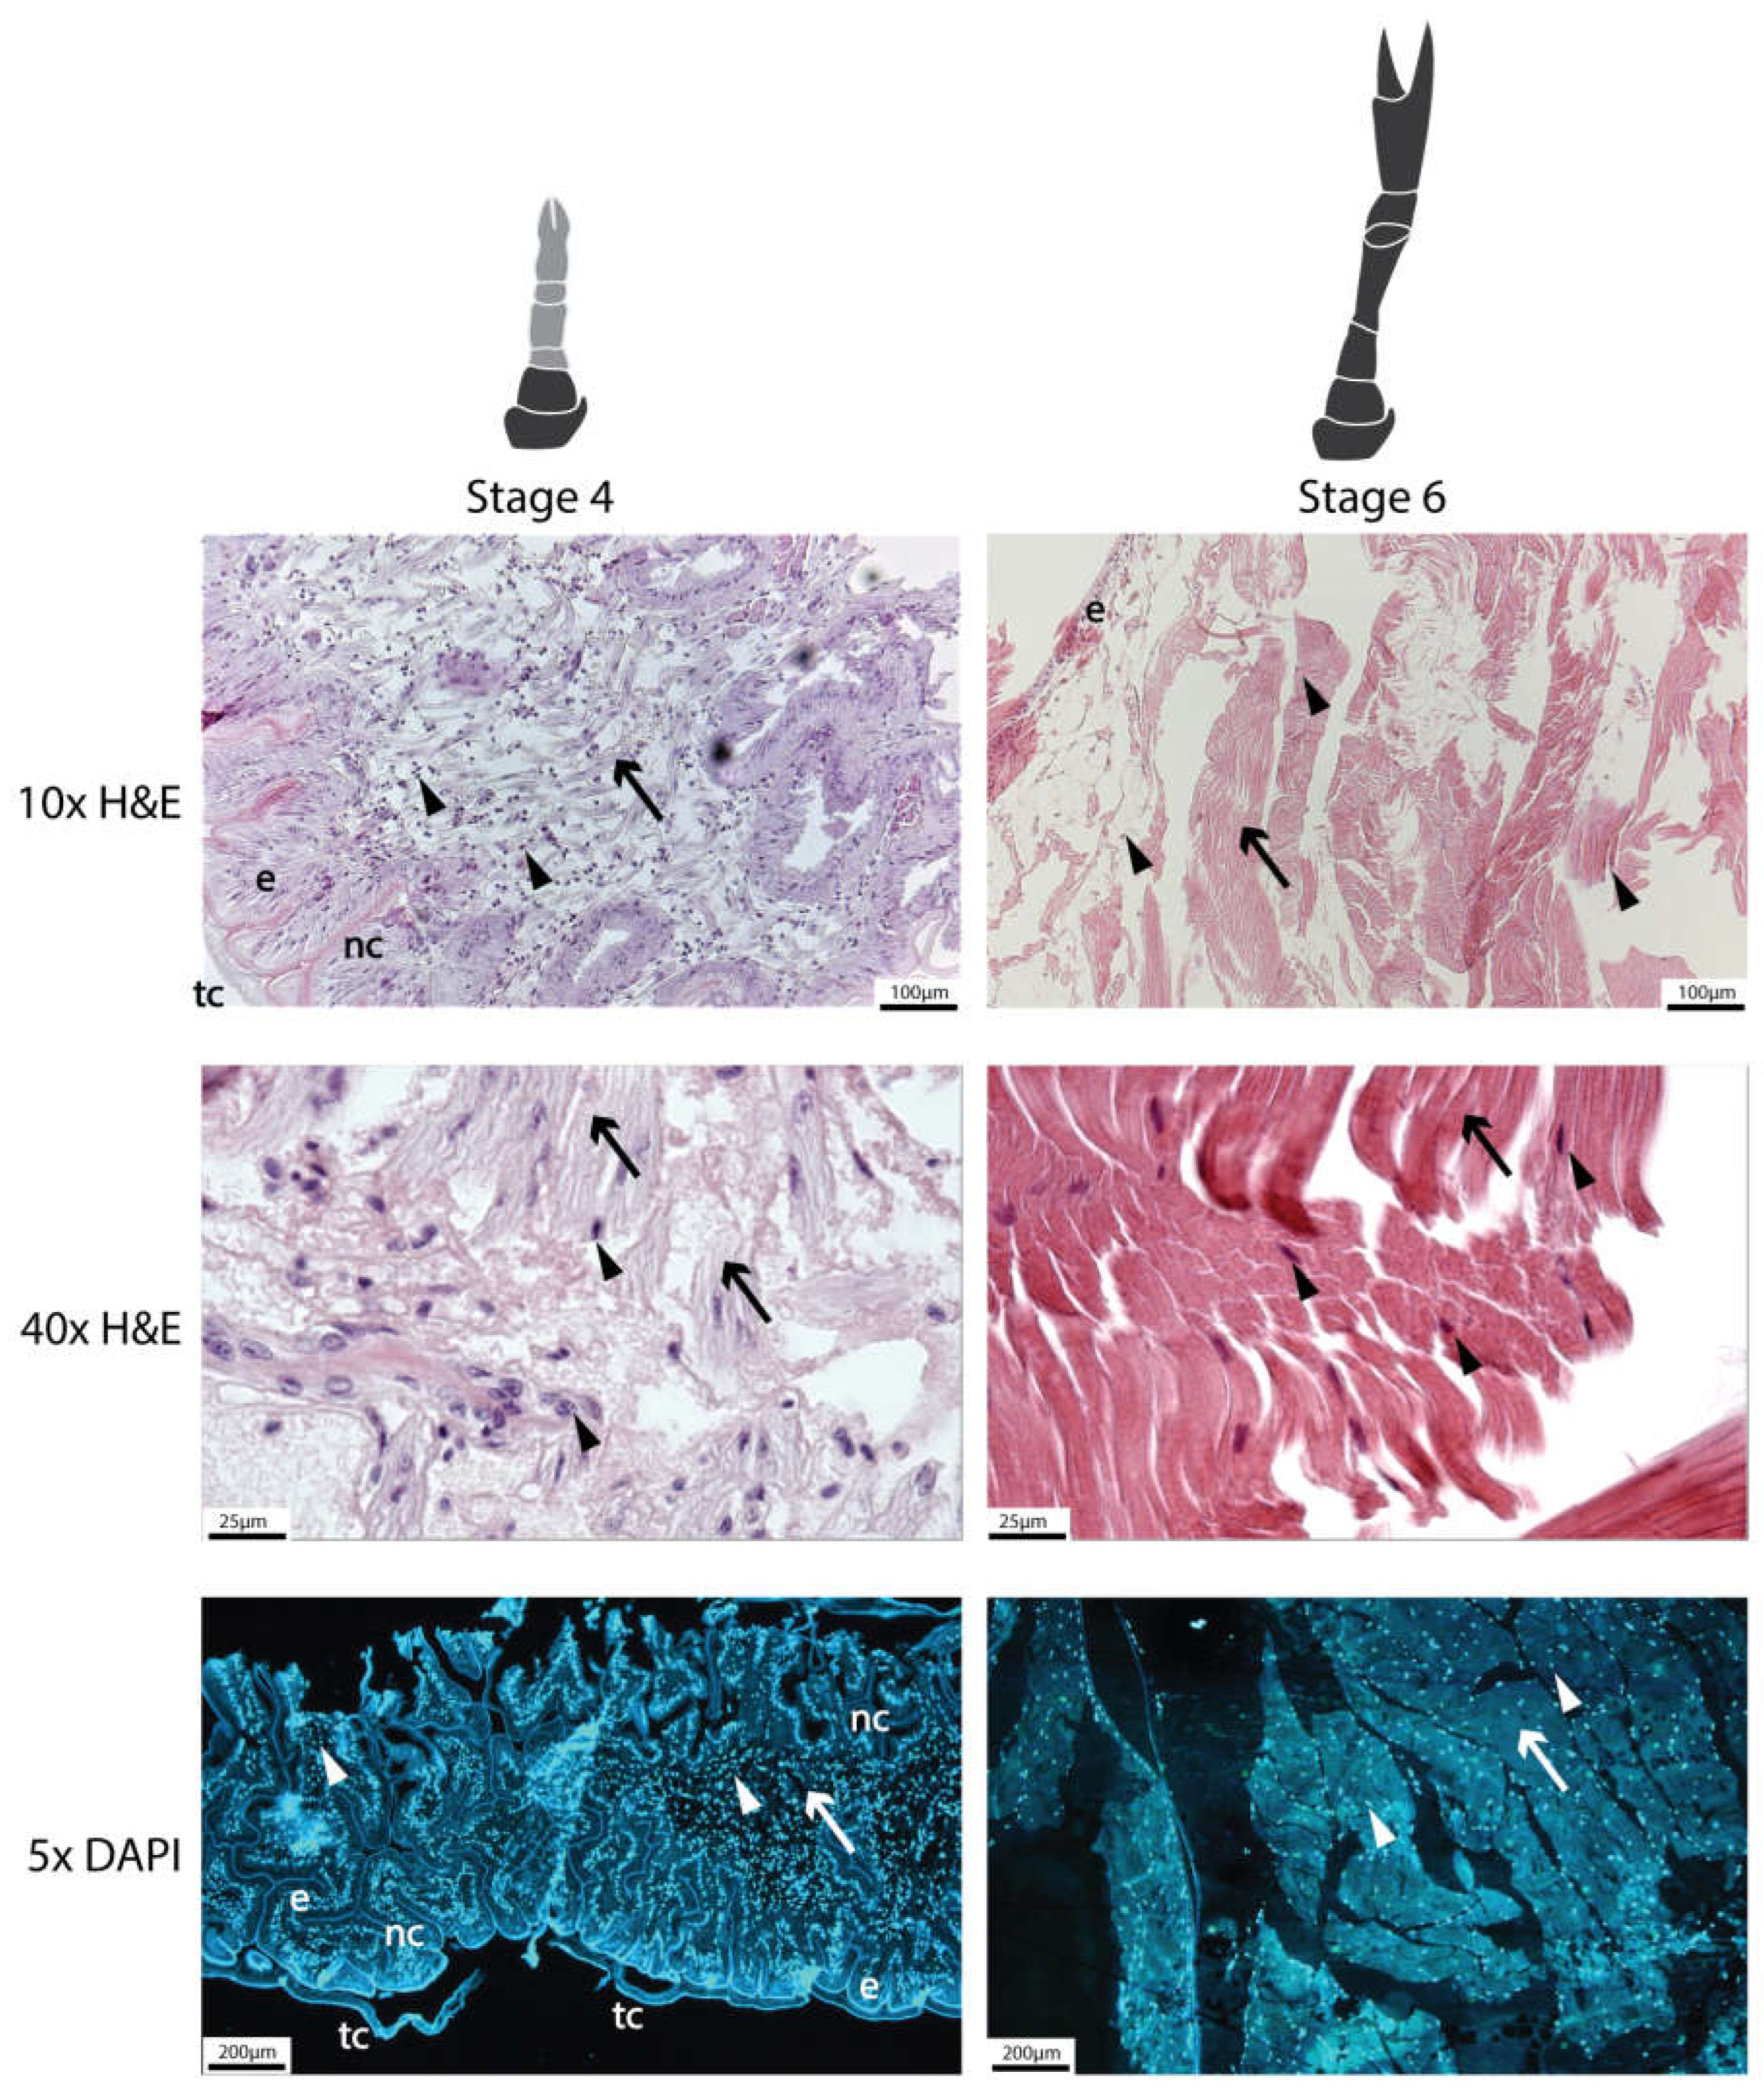
Hematoxylin and eosin, and DAPI staining revealed some distinct differences between Stage 4 and 6 tissues (Figure 11). In the Stage 4 images, the new regenerating cuticle can be seen convoluted and compressed within the temporary cuticle, encasing what appears to be an outer layer of epithelial cells and immature muscle fibers within with many visible nuclei. Without confirmation through immunohistochemistry (IHC) it is hard to distinguish between myonuclei and putative MSCs in Stage 4 tissues. The Stage 6 tissue also has an epithelial layer, but the muscle fibers are much larger and less nucleated. As expected, there seems to be a much higher ratio of nuclei to fibers in the Stage 4 tissues.

2.9.2. Real-Time Quantitative PCR

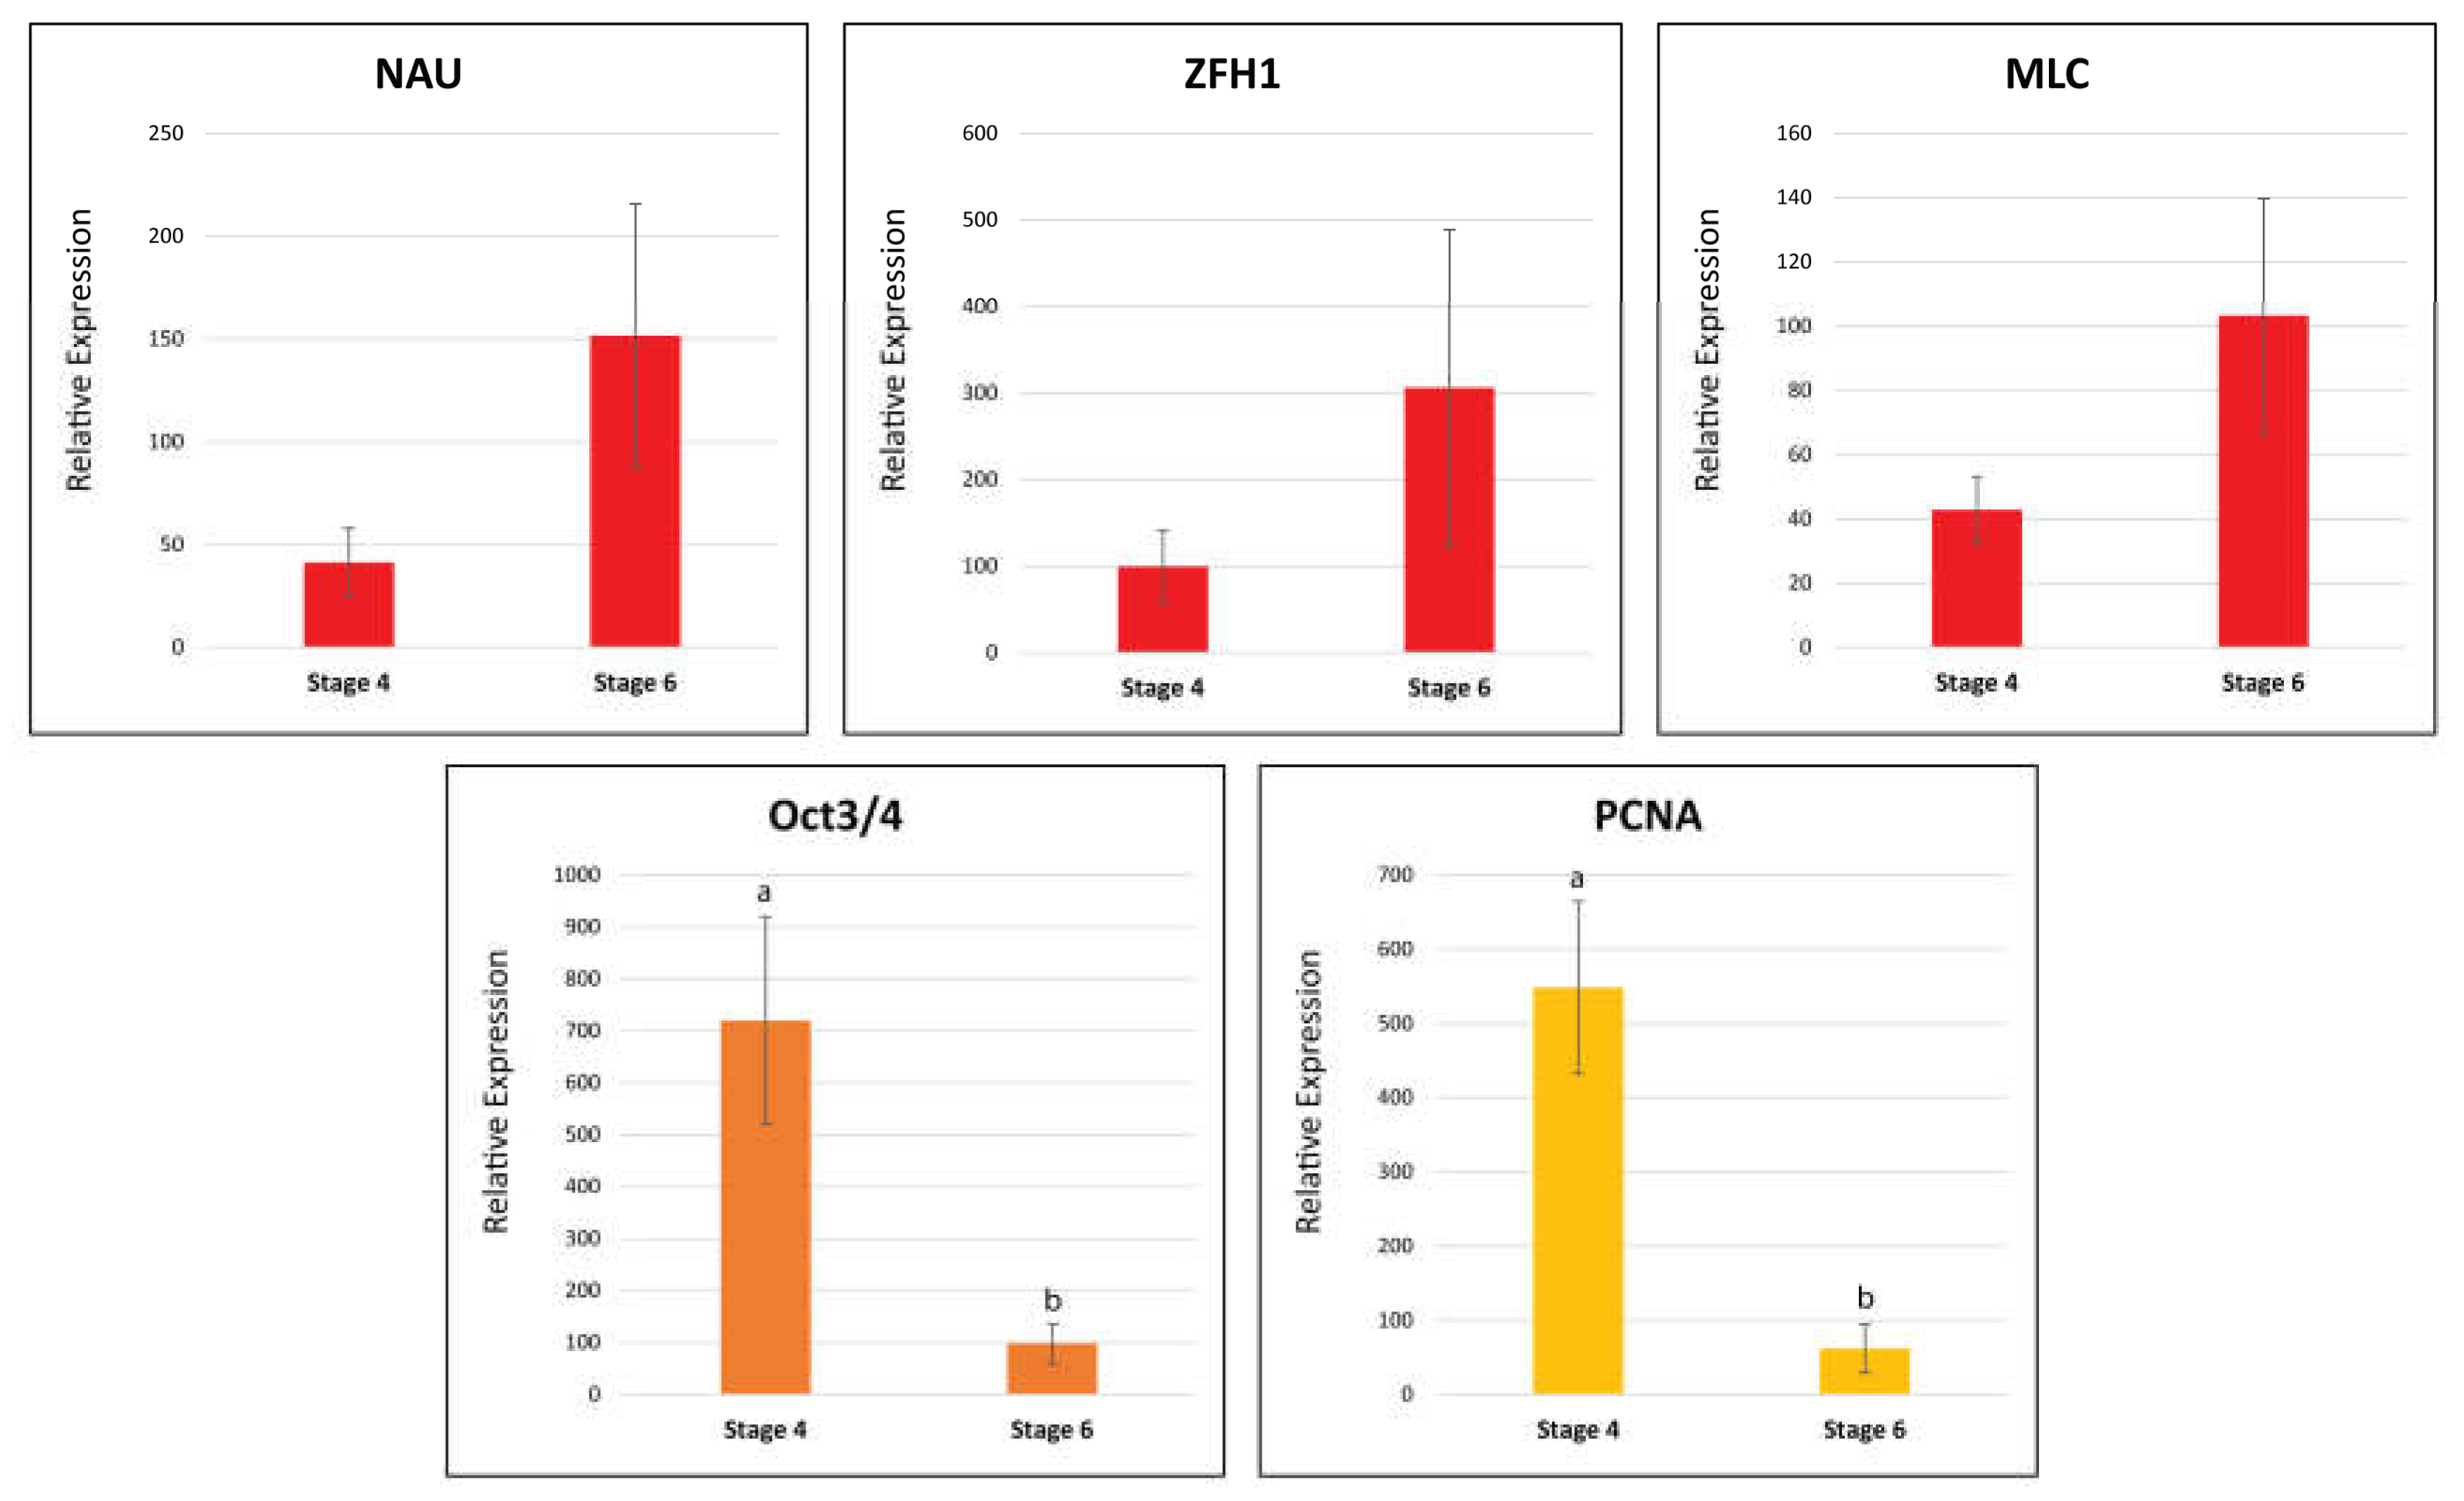
To further validate the observed transcriptomic differences between Stage 4 and Stage 6 tissues, real-time quantitative PCR (qPCR) was conducted with five C. quadricarinatus genes: MLC (mature muscle protein), Nau (myogenesis marker), Oct3/4 (pluripotency marker), Zfh1 (putative satellite cell marker) and PCNA (cell cycle marker). The housekeeping gene Cq-18S was used as a positive control and to normalize expression of the other genes. The qPCR trends largely reflect the RNA-Seq data with all but Zfh1 showing the same expression (Figure 12). Statistical tests revealed significant differences only in the Oct3/4 and PNCA samples, thus more replicates will be needed to confirm significance in trends for the other target genes.

3. Discussion

The primary objective of this study was to evaluate regenerating crustacean limb tissue as a potential stem cell source for CCM. Because crustacean limbs can regenerate, they offer a non-lethal and more accessible alternative to abdominal muscle or other internal crustacean tissues [15]. As the regeneration process relies on stem cell activity, these tissues are potentially more productive for CCM development than non-regenerating tissues. By investigating gene expression across six stages of claw regeneration we aimed to identify which stage, if any, harbored the most stem cell activity. Markers known to be specific to PSCs and MSCs were of most interest.

3.1. Differentially Expressed Genes (DEG) Analysis

A DEG analysis was conducted between all pair-wise comparisons among the six stages; that is, each stage was compared to every other stage to see if there were any standout patterns in gene expression. Results reveal distinct patterns of molecular and cellular activity across the six stages. Based on previous limb regeneration studies in U. pugilator [19,20,25] and C. destructor [26], we expected most wound healing, and signs of PSCs to occur in the earlier stages, followed by initial myogenic determination and differentiation activity of MSCs, then some mature muscle protein synthesis (hypertrophy) just prior to the molt event. Although increased cell cycle activity is a feature of PSCs [14,17] we expected mitosis to continue in party-differentiated stem cells throughout pre-molt tissue development. We expected that after the molt, all stem cell activity, including mitosis, would have ceased, and fully differentiated tissues would continue to grow via extensive myofibrillar protein synthesis (hypertrophy), which is required to fill the newly enlarged cuticle with muscle tissue.
This hypothesis was mostly borne out by the DEG results. As expected, wound healing is clearly shown to be an early phenomena and muscle hypertrophy predominates in the post-molt stages, with some uplift in the immediate pre-molt Stage 4. Also as expected, cell proliferation appears to be uniformly present right up until the molt event. There is some uplift in Stage 6, though this is comparatively minimal. Neuronal development is seemingly required throughout the whole regeneration process, except for Stage 4. As discussed further below, Stage 4 is a highpoint for membranous cuticle development which may require less neuronal involvement compared to developing muscle tissue. However, there is still muscle development occurring in Stage 4, so this intriguing absence warrants further investigation.
Genes associated with tissue regeneration and cell repair follow the wound repair/inflammation pattern. This is supported by a well-established link between muscle tissue regeneration and the immune system in many animals [15]. In particular, a distinct role for immune-related hemocytes in crustacean muscle regeneration has previously been outlined, with a number of reports suggesting these cells may act as initiating stem cells in new muscle growth [21,23,31,32]. The coincidental upregulation of these three functional categories (wound repair, cell repair, tissue regeneration) may therefore be directly related to hemocyte participation, suggesting that this cell type and the genes that drive their nuanced involvement should also be a point of focus for in vitro crustacean muscle development.
The functional categories of metabolite production, energy production and protein synthesis all follow muscle development closely and can be easily explained by the increased energy and building blocks required for extensive structural protein synthesis occurring during the hypertrophic phase.
The insulin-related growth category is upregulated in the earliest and latest stages. This is likely due to the variety of roles for IGFs in tissue growth. For instance, different studies have shown that while both IGF1 and 2 have roles in myogenic differentiation and fusion, IGF1 is also required for proliferation of myogenic stem cells [33,34,35]. A previous C. quadricarinatus study showed that IGF is correlated to increased overall body size and required for hypertrophic activity of muscle tissue explants [36] which could support the greater expression of insulin-related growth during Stage 6 hypertrophy. Furthermore, IGF1 and 2 were shown to significantly increase proliferation of hemocyte precursors (hematopoietic stem cells) in the prawn Penaeus monodon [37]. If hemocyte activity is responsible for the Stage 1 upregulation of the wound repair, tissue regeneration and cell repair categories mentioned earlier, this could also explain the concurrent uptick in insulin-related activity there.
We had not intended to highlight cuticle development or coloration as these are not directly related to growing muscle tissue in vitro, however their expression was so dominating during certain stages of the limb regeneration process we opted to include them. During Stage 4, there were no other genes as differentially expressed than those relating to blue pigmentation and the soft, membranous AM/AMP cuticle protein types. As shown in Figure 1, this stage is when the regenerating limb begins to turn deep blue and is the largest of those with pliable, temporary cuticles, clearly explaining the upregulation of these gene categories. Contrary to this, but also expectedly, the exoskeletal CP cuticle protein types are upregulated in the post-molt stages when the cuticle has hardened. The red pigmentation uptick in Stage 6 is interesting considering female C. quadricarinatus do not have any red coloration like their male counterparts. It is therefore likely the red pigment gene has alternative functions, either relating to cuticle development or other processes. Its significant differential expression in Stage 6 potentially warrants further investigation.
The overall pattern observed in the DEG analysis largely concurs with a recent analysis of limb regeneration in the amphipod Parhyale hawaiensis which determined that, unlike in embryonic limb development, the earliest stages are dominated by wound healing/immune response activity, and cell proliferation activity occurs right up to the late pre-molt stages, alongside muscle tissue modeling activity [24]. They also noted, like us, that very little cell proliferation activity occurs after the molt. One observed difference, however, was the absence of cell proliferation in the very earliest regeneration stages shown in the P. hawaiensis study. Our study showed cell cycle activity occurring at its highest levels right from Stage 1. This could potentially be explained by the differing methods of limb ablation. Where the other study cut the limbs mid segment, ours utilized autotomy, a process that involves considerably less tissue damage. Our process likely required a much shorter healing period, allowing proliferation to begin immediately.

3.2. Target Gene Analysis

3.2.1. Endocrine Factors

Based on previous crustacean studies involving growth factors [19,25,36,37,38] we expected growth factor activity to be present early in the regeneration process and were interested to see where else they might be active. Activity of most of the receptors (BMPR, TGFR, EGFR, FGFR and EcR) show a two-peak expression pattern, largely in Stages 2 and 4 (Figure 6). Studies on limb regeneration of the fiddler crab U. pugilator have shown the molt hormone receptor EcR is upregulated during two high-growth periods which occur before the molt event [20,25]. Because the putative C. quadricarinatus EcR in our data was confidently identified based on close homology and phylogenetic clustering among lobster nuclear receptors (Figure 7), it can be presumed that our two observed peaks likely reflect these other known high-growth phases. Although, many of the growth factor ligands and the IR do not follow this two-peak pattern, a number of cell cycle (Figure 9) and pluripotency (Figure 10) target genes do. Taken together, these results suggest Stage 2 and Stage 4 in our transcriptome, are likely key stages for stem cell activity.
Interestingly, there are notable differences between ligand and receptor expression for several growth factors. For BMP2, TGFb and EGF, the variance could be explained by particular expression level nuances between the pairs, or the presence of alternative ligands and receptors at certain times. For instance, previous studies have shown that circulating ecdysteroid titers do not correspond directly with EcR expression levels during limb regeneration [20]. The contrast between FGF and its receptor, however, is quite stark with completely opposing patterns. This may suggest that, although the identified genes showed the greatest homology with their model organism counterparts, these two homologs may not be a bona fide ligand-receptor pair. Alternatively, after transcription, the ligand may be translated and stored in vesicles for later release, or negative feedback systems may be regulating receptor transcription, as has been shown in other growth factor ligand-receptor pairs [39]. Further investigation to detect protein expression with mass spectrometry or IHC would help to elucidate this.
There were numerous insulin-like growth factor-related genes identified including a IGF/ILP homolog, Cq-ILP1, (AIU40992.1) [40], a known insulin-like growth factor binding protein, Cq-IGFBP, (AGS78412.1) [41], several other putative binding proteins (IBPs) and an IR (SF4). A previously identified insulin-like androgenic gland factor, Cq-IAG (ABH07705.1) [42], and Cq-ILP2 (AIU40993.1) [40] could not be located in the current dataset, implying these particular insulin-related genes are not involved in limb regeneration. In concurrence with the DEG analysis, the insulin-related genes show upregulation either at the earlier or the later stages rather than in the two pre-molt growth peaks observed for other target genes. The receptor and two IBPs are expressed earlier, with the former coinciding with just the Stage 2 growth peak, while the other IGFBP is expressed mostly in Stage 5. The IGF/ILP and a single insulin-like growth factor binding protein (SIBD2) are expressed across the whole process, though with highest peaks at Stages 1 and 5. The later stage upregulation likely points to involvement in hypertrophy and related metabolic activity, whereas the earlier upregulation could indicate involvement in cell proliferation and immune response.
A myostatin (MSTN) homolog could not be found in the current dataset, although one has been computationally identified (XP_053657516.1). The closest match was the more confidently identified BMP2 (Table 5). Although there has been some contention around whether MSTN is a negative or positive regulator of crustacean muscle growth, the evidence seems weighted towards the negative role that it has in vertebrates [15,43]. Its absence in the current limb regeneration dataset might support this, implying it may have no role in a situation requiring rapid and extensive muscle growth. However, although MSTN is produced primarily in skeletal muscle in vertebrates, in crustaceans it is also produced in other tissues, including the Y organ, [43] suggesting that its involvement cannot be excluded.

3.2.2. Myogenic Factors

As expected, and in line with the DEG analysis, all myofibrillar proteins (MHC, MLC, MYL, TPM and ACTA) are significantly upregulated in Stage 6 when the majority of hypertrophy is thought to occur (Figure 8). We were particularly interested in several myogenic transcription factors that could be used as MSC markers and also potentially in molecular experiments to drive myogenic differentiation, which has been done previously in CM research [44]. In vertebrates, key myogenic factors are the satellite cell markers, Pax3 and Pax7, and the myogenic regulatory factors (MRFs) MyoD, Myf, Mrf4 and Myogennin [45,46]. In D. melanogaster the main factors are Mef2, Nautilus (Nau) and Twist, where Mef2 is important for fusion, Nau is closest to MyoD in sequence but has only a restricted somatic myogenic function, and Twist is the most likely equivalent of MyoD in terms of embryonic myogenesis [47,48]. Similar relationships between these transcription factors have also been suggested in crustacean species. In P. hawaiensis embryonic development Twist and Mef2 expression have been shown to be somewhat similar to the D. melanogaster model with Twist appearing first (although not as early) and seemingly required for Mef2, which again, is required for later muscle determination and differentiation [49]. Like MSTN, a Cq-Twist has been computationally identified (XP_053656043.1) but was not identified in the current dataset, suggesting its embryonic role may not be a feature of limb regeneration. The D. melanogaster homologs of Pax3 include Paired and Gooseberry but these share its embryonic patterning role rather than its other vertebrate role as a satellite cell marker [50,51]. Zfh1 appears to be a better candidate in that respect [52,53]. Interestingly, although Pax3 and Gooseberry homologs have been found in regenerating limbs of other crustaceans [26,54], we were unable to identify them here. It remains to be seen, however, if these or Zfh1 are better markers of crustacean satellite cells.
We expected all of the myogenic transcription factors to be down regulated after the molt, presumably when fully differentiated muscle tissue has replaced differentiating tissues. Only Mef2 showed the expected pattern with upregulation in Stage 4 and very limited expression in Stages 5 and 6. The two potential satellite cell related genes, Zfh1 and PaxB1 show continuous expression throughout the regeneration process, albeit slightly higher in the earlier stages. This may represent the continued presence of satellite cells in mature muscle tissue. As Twist could not be located in the current transcriptome, we had hoped the other MyoD homolog, Nau, might prove to be a potential myoblast marker, however it shows most expression after the molt (Figure 8 and Figure 12), indicating it has a role in more developed muscle tissue. In D. melanogaster Nau is actually considered an equivalent of the whole MRF suite rather than just MyoD [47] and as Mrf4 is known to be expressed in mature muscle tissue [55], expression of Nau here may be more representative of its role than MyoD’s. To our knowledge, apart from a computationally identified myogenic determination protein-like record (XP_053654763.1), no crustacean equivalent of Nau has been characterized. Thus, Mef2 may be a better MSC marker here. Identifying clear markers of proliferating MSCs such as myoblasts is of key importance to CCM development, particularly for stem cell characterization and isolation, so further investigation of these putative myogenic factors is critical.

3.2.3. Cell Cycle and Pluripotency Factors

The RNA-Seq results show very little PSC activity appears to be present after the molt (Figure 10), as expected. This is supported by the qPCR results which show significantly higher expression in Stage 4 than Stage 6, for both Oct3/4 and PCNA (Figure 12). As has been noted, the RNA-Seq results also show the majority of cell cycle and pluripotency factors follow the same two-peak pre-molt expression pattern as the growth factor receptors. The fact that some pluripotency genes are expressed equally in both stages might suggest one of two things: that these genes are also being expressed by more differentiated stem cells present in more developed tissues (i.e., not true PSCs), or that populations of true PSCs can be accessed at both stages. This does warrant further study, however, in either scenario both stages should be earmarked as potential sources of proliferative and ‘somewhat’ potent stem cells for CCM development. As mentioned however, due to the greater size of Stage 4 limbs and likely abundance of stem cells, it may be a more practical source.

3.3. Limitations

Our results have highlighted some limitations in the experimental process. Most notably, as shown in the PCA in Figure 1, there is considerable cross-over in gene expression among the earlier stages which suggests our approach to stage allocation might not have been the most appropriate. Rather than trying to group limbs into a minimal number of stages based mostly on morphology, a more uniform sampling of R-values may have been better. Regeneration, like all biological processes, is graduated; there may be peaks and troughs, but it is not conducted in succinct steps. Thus, expecting to see uniformity within our designated stages might be unrealistic. While two different limb buds may look morphologically similar, molecular activity (mRNA levels) within could be vastly different, particularly due to molt stage. Although extremely important to the regeneration process, molt stage could not be accounted for in the earlier stages, as this is extremely difficult in our species without dissection.
Another limitation was the absence of pre-regeneration tissues in the RNA-Seq samples. The Stage 6 samples, which were considered representative of intermolt, non-regenerating tissues, were taken 2-3 weeks after the molt and may still have been undergoing some level of regeneration. In contrast, the Stage 6 tissues for qPCR analysis were taken from separate animals that had not undergone recent limb regeneration. RNA taken from fully grown limbs prior to autotomy may have better represented non-regenerating tissues for both the RNA-Seq and qPCR work.

4. Materials and Methods

4.1. Animal Handling

Twenty-four adult female Australian Redclaw crayfish, Cherax quadricarinatus, were purchased from a farm in Tarome, Queensland (Freshwater Australian Crayfish Traders). Crayfish ranged from 30 to 60gm in weight. They were maintained at the University of the Sunshine Coast aquaculture facility with constant freshwater exchange and fed thrice weekly with commercial fish food pellets (Aquamunch – African Attack) purchased from an online supplier (Aquaholics Aquarium Supplies https://www.aquaholicsonline.com.au/). Crayfish were encouraged to autotomize claws through the simultaneous application of pressure to the propodus and dactyl on each appendage, while allowing the crayfish to tail-flip and swim backwards, releasing the claw in the process. Coxa segments were observed in each individual to be clean and sealed within seconds.

4.2. Regeneration Assessment

Over seven months regeneration of the claws was photographed every four to ten days and measured with ImageJ software (https://imagej.nih.gov/ij/). Measurement data was used to calculate the R-value, a measure of allometric growth found by dividing the length of the limb by the width of the carapace and multiplying by 100 [19,20]. Based on morphological observations, the regrowing claws of the 24 individuals, were identified over several months, as being at one of six regeneration stages and selected for surgical removal or re-autotomy (four for each stage).

4.3. Anesthetic

A combination of temperature cooling and the anesthetic/analgesic product Aqui-S (https://www.aqui-s.com/products/aqui-s-aquatic-anaesthetic) was used to anaesthetize crayfish before tissue removal. This approach was based on studies on crustacean response to analgesia and previous treatment with Aqui-S [12,56]. Anesthesia was considered effective when crayfish remained motionless despite pressure being applied to their highly innervated anal region. Sufficient concentration was 500ppm or 915 µl/L of Aqui-S with optimal temperature being between 5 and 14°C, and time taken for crayfish to reach complete anesthesia varied from 14 to 28 minutes.

4.4. Sample Preparation

One tissue sample (0.1 – 1.0 grams) was taken from each of the 24 individuals. Regrowing limb tissues at stages 1 to 4 were re-automized or, under anesthesia described above, removed with sterile surgical scissors, placed into sterile, RNAse free Eppendorf tubes then snap frozen in liquid nitrogen before being stored at -80°C. Stage 5 and 6 limbs were re-autotomized with tissues immediately extracted from the cuticle, collected, frozen and stored as above. Surgery sites were treated with alcohol wipes and sealed with Liquid Skin® (https://liquid-skin.com/). Crayfish were monitored in recovery tanks until fully recovered and placed back into their home compartments. Once regrowth of limbs was observed (between one and five weeks), crayfish were placed back into the general population.

4.5. RNA Extraction, Quantification, and Sequencing

RNA was extracted from the 24 tissue samples using RNAzol ® RT as previously described (Hyde et al. 2019). Quality and quantity of all samples were confirmed with NanoDrop 2000 (Thermofisher, Australia). All samples measured at least 4µg of RNA. Samples were then stored in RNAse free Eppendorf tubes at -80°C until being sent in dry ice to Novogene (Singapore) for quality control (Bioanalyzer Agilent 2100), library preparation (Illumina, TruSeq kit) and RNA-Seq with the Illumina HiSeq2500 platform with paired-end 150bp sequencing. Two samples (one from Stage 1 and one from Stage 6) failed quality control (QC) and the remaining 22 were sequenced, adaptor-trimmed, and returned as a minimum of 39 million cleaned reads each. All raw read FASTQ files were uploaded to NCBI SRA (https://www.ncbi.nlm.nih.gov/sra) under BioProject number PRJNA780617.

4.6. Transcriptome Assembly and Quantification

Based on QC read reports from Novogene (Singapore), all reads were further trimmed of 5 nucleotides from the 5’ end only, using BBduk (BBMap – Bushnell B. - https://sourceforge.net/projects/bbmap/). Trimmed reads from six samples (one from each stage) were de novo assembled using Trinity (version 2.12.0) [57] (https://github.com/trinityRNA-Seq/trinityRNA-Seq/wiki) with default paired read parameters except strand-specific settings (RF) and minimum contig length (400bp), resulting in an initial assembly FASTA file, containing 144,049 contigs. Evidential Gene’s tr2aacds tool (version 2023jul15) (http://arthropods.eugenes.org/EvidentialGene/evigene/), was then used to remove redundancies, resulting in a final reference assembly of 55,018 contigs (SF1). BUSCO (version 5.4.3) [58] and rnaQUAST (version 2.2.3) [59] were also used to obtain metrics for assessing assembly quality.
Before performing quantification, raw reads were trimmed using fastp (version 0.23.4) [60] by trimming 15 nucleotides from the 5’ end. SortMeRNA (version 4.3.5) [61] was used to remove rRNA from bacteria, archaea, and crustaceans. This involved using rRNA databases that are provided by SortMeRNA (silva-arc-16s-id95, silva-arc-23s-id98, silva-bac-16s-id90), as well as a custom database which contained deduplicated crustacean rRNA sequences from RefSeq. Salmon (version 1.10.1) [62] was used for quantification (SF2).

4.7. Data Upload into CrustyBase.org

The final reference assembly was initially imported into CLC Genomics Workbench 8.0.3 (CLC; Qiagen, Australia) for quantification. The 22 trimmed read files were then quantified relative to library size (calculated as reads per kilobase per million reads; RPKM) by mapping them to the imported reference transcriptome with CLC’s RNA-Seq Analysis tool, using default parameters. The RNA-Seq results and the final reference assembly were uploaded to the public database CrustyBase.org (http://crustybase.org) [63]. For CrustyBase to calculate standard error, all features (Stages) must contain the same number of replicates so only three replicates of each stage were uploaded. In this instance, S2.2, S3.4, S4.2 and S5.2 were removed in order for Stages 2, 3, 4 and 5 to have equal replicates (n=3) with Stages 1 and 6. Uploading the data into this public platform provided a second BLAST-searchable database and allowed for easy visualization of domain prediction and contig expression across the six stages.

4.8. Differential Expression Analysis

Python (3.9.18) was used to generate transcript to gene mappings based on the transcript IDs outputted by Evidential Gene. Transcript level abundance was aggregated to gene level abundance with tximport (version 1.30.0) [64] (SF3). DESeq2 (version 1.42.0) [65] was used for performing differential expression analysis. Log2 fold changes (LFC) were shrunk with the ‘ashr’ method [66]. Differentially expressed genes (DEGs) were those with p-adjusted < 0.01 and absolute LFC >= 1. Only genes with average expressed level >= 20 were included. The PCA plot was created after applying the regularized log transformation to counts in DESeq2. Statistical analyses results can be found in SF5.

4.9. Reference Assembly Annotation

Annotation of the reference assembly was conducted with the TransPi pipeline (version 1.3.0-rc) using default parameters [67]. This yielded annotations from the SwissProt database (accessed May 1st, 2023) as well as information on Gene Ontology (GO), Evolutionary Genealogy of Genes: Non-supervised Orthologous Groups (eggNOG), Kyoto Encyclopedia of Genes and Genomes (KEGG) pathways, and protein families (PFAM) domains (SF4). Heatmaps of all annotated DEGs in all pair-wise comparisons were created with pheatmap (version 1.0.12) in R (version 4.3.2). An additional heatmap was created of the top 10 (greatest fold change) up- and downregulated DEGs from each comparison. In this heatmap, duplicates (contigs with the same SwissProt annotation) were condensed into one record by averaging their normalized counts from DESeq2.

4.10. Gene Ontology Enrichment Analysis

GO enrichment analysis was performed using the GO terms identified by TransPi and the list of DEGs. For each comparison, DEGs were separated into lists of up- and down-regulated genes. Then, the topGO package (version 2.54.0) [68] was utilized with the default “weight01” algorithm and Fisher's exact test (p<0.01). Summary statistics (number of unique GO IDs in each GO category) were calculated in Python (3.9.18) (SF6). From the 227 enriched BP GO terms among each pair-wise comparison, a list of 53 unique terms was created by selecting the one containing the highest number of significant DEGs, then removing terms unrelated to crustacean limbs (e.g., human health-specific) and generic (uninformative) cellular process terms. For visualization using a heatmap, the normalized counts of the contributing DEGs for each GO term were obtained from DESeq2. For each DEG, expression was averaged across replicates in each stage. Then, the expression from all contributing DEGs for that term was summed. Visualization was done with ComplexHeatmap (version 2.20.0) [69].

4.11. Graphical Representation of the Functional DEG and GO Term Categories

After the top 92 DEGs and enriched GO terms were categorized into 14 categories (Table 4, Section 2.7), the average gene count value for each category was parsed in Python 3.8 to average per stage data and convert the absolute expression values into log-scaled columns to compare absolute expression between the graphs using the matplotlib library matplotlib [70].

4.12. Target gene Analysis

UniProt and Flybase (http://www.flybase.org), amino acid sequences of well annotated D. melanogaster, Mus musculus, and Homo sapiens proteins were selected to tBLASTn search against the transcriptome in CLC and CrustyBase. Top hits for each homolog were annotated with NCBI BLAST search and domain prediction with SMART and CrustyBase and selected based on combined lowest E-value, highest expression values and the presence of at least one predicted domain. Normalized gene count data were parsed in Python 3.8 and plotted as for the DEG and GO Term function categories.

4.13. Phylogeny

Phylogeny was conducted to compare the Redclaw EcR with P. ornatus nuclear receptors (Figure 7). Amino acid sequences were aligned by ClustalW [71] in MEGA X 10.1.7 [29] with default parameters then subject to phylogenetic analysis using the Neighbor-Joining method with p-distance model, and bootstrap consensus tree was inferred from 1000 replicates.

4.14. Histology

Tissue samples from Stage 4 and Stage 6 claws were collected, fixed, sectioned and stained for histological analysis as previously detailed [72]. Briefly, tissues were fixed in Bouin’s Fixative Solution (Sigma, Melbourne, Australia), dehydrated in sequentially concentrated ethanol (50%-100%), followed by two washes in xylene, embedded in paraffin and sectioned into 5µm slices. Slides were then deparaffinized in xylene and rehydrated in sequentially reduced ethanol concentrations (100-50%), followed by deionized water. One slide of each sample stage was stained with haematoxylin (4 minutes) and eosin (3 minutes), then dehydrated in ethanol and xylene again, air-dried in a fume hood and sealed with xylene glue and a coverslip before being photographed with a compound light microscope. Additional slides of each sample stage after rehydration were washed in PBS (2 x 5 minutes), stained with DAPI nuclear stain, sealed with a coverslip, then photographed with a confocal microscope (Figure 11).

4.15. Real-Time Quantitative PCR

RNA was extracted from new Stage 4 and Stage 6 samples (six samples/animals per stage) as outlined in sections 4.4 and 4.5 above. Concentration and quality were checked with Nanodrop 2000 (Thermofisher, Australia) and 1µg samples were used to synthesize cDNA with the Tetro cDNA kit (Bioline) as detailed previously [73]. Briefly, each 1µg RNA sample was used to synthesize cDNA mixed with 1µl dNTPs and 1µl random hexamers before being heated at 70°C for 5 minutes. Samples were then mixed with 4:1:1 ratio of kit supplied buffer, RNAse inhibitor and Reverse Transcriptase and heated at 45°C for 45 minutes, then 85°C for five minutes, and checked for cDNA quality and concentration before being stored at -20°C.
For qPCR, primers appropriate for the Universal Probe Library (previously supplied by Roche, no longer available) for select target genes were designed using the Neoform primer application (http://www.primers.neoformit.com) (Table 5). Cq-18S primers were used as a positive control and to normalize relative expression of the target genes. cDNA samples for target genes were mixed with a 1:1:0.05:5:9 ratio of forward primer, reverse primer, Roche Universal Probe, FastStart Universal Probe Master (Rox) (Sigma/Merck, Australia) and ultra-pure water, and run in a qPCR machine (Rotor-Gene, Qiagen) for 45 cycles. cDNA samples for the 18S reactions were diluted 1:100 with ultra-pure water.
Relative expression was calculated as described previously [74] using the formula 2-ΔΔCT, where CT was the cycle threshold before amplicon concentration fluorescence plateaued. 18S expression was used to normalize and calculate the relative expression values for the gene targets. The mean values ± standard error of the mean (SEM) were subjected to a Kruskal-Wallis test to identify significant differences between Stage 4 and 6 for all target genes (P < 0.05, Test Statistic = 21.043) (IBM SPSS Statics, version 29).

5. Conclusion

The overriding picture which emerged from the RNA-Seq, histological and qPCR results presented here, suggests pre-molt regenerating tissues are likely a greater source of stem cells than post-molt or fully developed limb tissue for CCM development. Isolating MSCs like satellite cells, from mature muscle tissue is a commonly utilized and valid approach however, so further work should focus on comparing stem cell isolation and culture from both Stage 4 (pre-molt) and Stage 6 (post-molt) limb regeneration tissues.

Supplementary Materials

The following supporting information can be downloaded at the website of this paper posted on Preprints.org, Supplementary Data File 1 (SF1): Transcriptome assembly; SF2: Salmon output files; SF3: Normalized gene counts; SF4: Trinotate annotation report; SF5: Differentially expressed genes; SF6: GO Enrichment statistics.

Author Contributions

Conceptualization, Lisa Musgrove and Tomer Ventura; Data curation, Lisa Musgrove and Avani Bhojwani; Funding acquisition, Lisa Musgrove and Tomer Ventura; Investigation, Lisa Musgrove, Avani Bhojwani, Susan Glendinning, Josephine Nocillado and Fraser Russell; Methodology, Lisa Musgrove, Avani Bhojwani, Cameron Hyde and Tomer Ventura; Software, Avani Bhojwani and Cameron Hyde; Supervision, Tomer Ventura; Visualization, Lisa Musgrove, Avani Bhojwani and Cameron Hyde; Writing – original draft, Lisa Musgrove; Writing – review & editing, Lisa Musgrove, Avani Bhojwani, Fraser Russell and Tomer Ventura.

Funding

This study forms part of a PhD project. Lisa Musgrove and Avani Bhojwani were supported by the Australian Government’s Research Training Program (RTP) Scholarship. Funding was also provided by New Harvest and Shiok Meats during some of the research and writing of this manuscript.

Animal Ethics

At the time of this research, in the state of Queensland, and as per the Australian Government’s Australian code for the care and use of animals for scientific purposes (the Code) 8th Edition, (https://www.https://www.nhmrc.gov.au/about-us/publications/australian-code-care-and-use-animals-scientific-purposes) animal ethics approvals are not required for non-cephalopod invertebrates. However, the authors recognize the sentience of adult decapods and have applied the governing principles of the Australian code to our research. The present work does not involve euthanasia of crayfish but has required the use of anesthetic during some limb tissue sampling. Anesthesia protocols used successfully on C. quadricarinatus previously, and consultation with aquaculture industry experts determined the methods used here.

Conflicts of Interest

The authors declare no conflicts of interest. The funders had no role in the design of the study; in the collection, analyses, or interpretation of data; in the writing of the manuscript; or in the decision to publish the results.

References

  1. FAO. The State of World Fisheries and Aquaculture 2020; 978-92-5-132692-3; United Nations Food and Agriculture Organisation: Rome, Italy, 2020 2020. [Google Scholar]
  2. Baechler, B.R.; Stienbarger, C.D.; Horn, D.A.; Joseph, J.; Taylor, A.R.; Granek, E.F.; Brander, S.M. Microplastic occurrence and effects in commercially harvested North American finfish and shellfish: Current knowledge and future directions. Limnology & Oceanography Letters 2020, 5, 113–136. [Google Scholar] [CrossRef]
  3. Baki, M.A.; Hossain, M.M.; Akter, J.; Quraishi, S.B.; Haque Shojib, M.F.; Atique Ullah, A.K.M.; Khan, M.F. Concentration of heavy metals in seafood (fishes, shrimp, lobster and crabs) and human health assessment in Saint Martin Island, Bangladesh. Ecotoxicology & Environmental Safety 2018, 159, 153–163. [Google Scholar] [CrossRef]
  4. Fatema, U.K.; Faruque, H.; Salam, M.A.; Matsuda, H. Vulnerability assessment of target shrimps and bycatch species from industrial shrimp trawl fishery in the bay of Bengal, Bangladesh. Sust. 2022, 14. [Google Scholar] [CrossRef]
  5. Lira, A.S.; Le Loc'h, F.; Andrade, H.A.; Lucena-Frédou, F.; Zhou, S. Vulnerability of marine resources affected by a small-scale tropical shrimp fishery in northeast Brazil. ICES Journal of Marine Science 2022, 79, 633–647. [Google Scholar] [CrossRef]
  6. Ahmed, N.; Cheung, W.W.L.; Thompson, S.; Glaser, M. Solutions to blue carbon emissions: Shrimp cultivation, mangrove deforestation and climate change in coastal Bangladesh. Marine Policy 2017, 82, 68–75. [Google Scholar] [CrossRef]
  7. Barraza-Guardado, R.H.; Arreola-Lizarraga, J.A.; Lopez-Torres, M.A.; Casillas-Hernandez, R.; Miranda-Baeza, A.; Magallon-Barrajas, F.; Ibarra-Gamez, C. Effluents of shrimp farms and its influence on the coastal ecosystems of Bahia de Kino, Mexico. The Scientific World Journal 2013, 2013, 306370. [Google Scholar] [CrossRef]
  8. Boone Kauffman, J.; Arifanti, V.B.; Hernández Trejo, H.; Carmen Jesús García, M.; Norfolk, J.; Cifuentes, M.; Hadriyanto, D.; Murdiyarso, D. The jumbo carbon footprint of a shrimp: Carbon losses from mangrove deforestation. Frontiers in Ecology & the Environment 2017, 15, 183–188. [Google Scholar] [CrossRef]
  9. Macusi, E.D.; Estor, D.E.P.; Borazon, E.Q.; Clapano, M.B.; Santos, M.D. Environmental and socioeconomic impacts of shrimp farming in the Philippines: A critical analysis using PRISMA. Sust. 2022, 14. [Google Scholar] [CrossRef]
  10. Rubio, N.; Datar, I.; Stachura, D.; Kaplan, D.; Krueger, K. Cell-Based Fish: A novel approach to seafood production and an opportunity for cellular agriculture. Frontiers in Sustainable Food Systems 2019, 3, 43. [Google Scholar] [CrossRef]
  11. Albalat, A.; Zacarias, S.; Coates, C.J.; Neil, D.M.; Planellas, S.R. Welfare in farmed decapod crustaceans, with particular reference to Penaeus vannamei. Frontiers in Marine Science 2022, 9, 886024. [Google Scholar] [CrossRef]
  12. Elwood, R.W.; Barr, S.; Patterson, L. Pain and stress in crustaceans? Applied Animal Behaviour Science 2009, 118, 128–136. [Google Scholar] [CrossRef]
  13. Passantino, A.; Elwood, R.W.; Coluccio, P. Why Protect Decapod Crustaceans Used as Models in Biomedical Research and in Ecotoxicology? Ethical and Legislative Considerations. Animals 2021, 11. [Google Scholar] [CrossRef] [PubMed]
  14. Reiss, J.; Robertson, S.; Suzuki, M. Cell sources for cultivated meat: Applications and considerations throughout the production workflow. Int. J. Mol. Sci. 2021, 22. [Google Scholar] [CrossRef] [PubMed]
  15. Musgrove, L.; Russell, F.D.; Ventura, T. Considerations for cultivated crustacean meat: Potential cell sources, potential differentiation and immortalization strategies, and lessons from crustacean and other animal models. Critical Reviews in Food Science and Nutrition 2024, 1–25. [Google Scholar] [CrossRef] [PubMed]
  16. Post, M.J.; Levenberg, S.; Kaplan, D.L.; Genovese, N.; Fu, J.; Bryant, C.J.; Negowetti, N.; Verzijden, K.; Moutsatsou, P. Scientific, sustainability and regulatory challenges of cultured meat. Nature Food 2020, 1, 403–415. [Google Scholar] [CrossRef]
  17. Bomkamp, C.; Musgrove, L.; Marques, D.M.C.; Fernando, G.F.; Ferreira, F.C.; Specht, E.A. Differentiation and maturation of muscle and fat cells in cultivated seafood: Lessons from developmental biology. Marine Biotechnology 2023, 25, 1–29. [Google Scholar] [CrossRef] [PubMed]
  18. Vogt, G. Cytology, function and dynamics of stem and progenitor cells in decapod crustaceans. Biological Reviews 2022, 97, 817–850. [Google Scholar] [CrossRef] [PubMed]
  19. Hopkins, P.M.; Chung, A.C.K.; Durica, D.S. Limb regeneration in the fiddler crab, Uca pugilator: Histological, physiological and molecular considerations. American Zoologist 1999, 39, 513–526. [Google Scholar] [CrossRef]
  20. Hopkins, P.M.; Das, S. Ch6 Regeneration in Crustaceans. In Physiology: Crustacea, Chang, E.S., Thiel, M., Eds.; Oxford University Press: Oxford, England, 2015; pp. 168–198. [Google Scholar]
  21. Uhrík, B.; Rýdlová, K.; Zacharová, D. The roles of haemocytes during degeneration and regeneration of crayfish muscle fibres. Cell Tissue Res. 1989, 255, 443–449. [Google Scholar] [CrossRef]
  22. Das, S. Morphological, molecular, and hormonal basis of limb regeneration across Pancrustacea. Integrative & Comparative Biology 2015, 55, 869–877. [Google Scholar] [CrossRef]
  23. Read, A.T.; Govind, C.K. Cell types in regenerating claws of the snapping shrimp, Alpheus heterochelis. Canadian Journal of Zoology 1998, 76, 1080–1090. [Google Scholar] [CrossRef]
  24. Sinigaglia, C.; Almazan, A.; Lebel, M.; Semon, M.; Gillet, B.; Hughes, S.; Edsinger, E.; Averof, M.; Paris, M. Distinct gene expression dynamics in developing and regenerating crustacean limbs. Proc. Natl. Acad. Sci. USA 2022, 119, e2119297119. [Google Scholar] [CrossRef] [PubMed]
  25. Hopkins, P.M. Limb regeneration in the fiddler crab, Uca pugilator: Hormonal and growth factor control. American Zoologist 2001, 41, 389–398. [Google Scholar] [CrossRef]
  26. White, R.B.; Lamey, T.M.; Ziman, M.; Koenders, A. Isolation and expression analysis of a Pax group III gene from the crustacean Cherax destructor. Development Genes & Evolution 2005, 215, 306–312. [Google Scholar] [CrossRef]
  27. Andersen, S.O. Exoskeletal proteins from the crab, Cancer pagurus. Comparative Biochemistry and Physiology Part A: Molecular & Integrative Physiology 1999, 123, 203–211. [Google Scholar] [CrossRef]
  28. Hyde, C.J.; Fitzgibbon, Q.P.; Elizur, A.; Smith, G.G.; Ventura, T. Transcriptional profiling of spiny lobster metamorphosis reveals three new additions to the nuclear receptor superfamily. BMC Genomics 2019, 20, 531. [Google Scholar] [CrossRef]
  29. Kumar, S.; Stecher, G.; Li, M.; Knyaz, C.; Tamura, K. MEGA X: Molecular Evolutionary Genetics Analysis across Computing Platforms. Mol Biol Evol 2018, 35, 1547–1549. [Google Scholar] [CrossRef] [PubMed]
  30. Sriram, S.; Ling, K.Y. Isolation and cultivation of muscle and fat cells from crustaceans. WO2020149791A1, Jan 13, 2020 2020.
  31. Babu, D.E. Histological and histochemical studies on regeneration and tissue differentiation in the crab Menippe rumphii (Fabricius) (Crustacea: Brachyura). Journal of Experimental Marine Biology & Ecology 1987, 111, 213–230. [Google Scholar] [CrossRef]
  32. Novotová, M.; Uhrik, B. Structural characteristics and distribution of satellite cells along crayfish muscle fibers. Experientia 1992, 48, 593–596. [Google Scholar] [CrossRef]
  33. O'Neill, E.N.; Cosenza, Z.A.; Baar, K.; Block, D.E. Considerations for the development of cost-effective cell culture media for cultivated meat production. Comprehensive Reviews In Food Science & Food Safety 2021, 20, 686–709. [Google Scholar] [CrossRef]
  34. Jiwlawat, N.; Lynch, E.; Jeffrey, J.; Van Dyke, J.M.; Suzuki, M. Current progress and challenges for skeletal muscle differentiation from human pluripotent stem cells using transgene-free approaches. Stem Cells International 2018, 2018, 6241681. [Google Scholar] [CrossRef] [PubMed]
  35. Kolkmann, A.M.; Van Essen, A.; Post, M.J.; Moutsatsou, P. Development of a Chemically Defined Medium for in vitro Expansion of Primary Bovine Satellite Cells. Front Bioeng Biotechnol 2022, 10, 895289. [Google Scholar] [CrossRef] [PubMed]
  36. Chaulet, A.; Medesani, D.A.; Freitas, J.; Cervino, A.; Cervino, N.; Rodríguez, E.M. Induction of somatic growth in juvenile crayfish Cherax quadricarinatus (Decapoda, Parastacidae), by ecdysone and insulin growth factor. Aquaculture 2012, 370-371, 1–6. [Google Scholar] [CrossRef]
  37. Jayesh, P.; Philip, R.; Bright Singh, I.S. Multifactorial interaction of growth factors on Penaeus monodon lymphoid cells and the impact of IGFs in DNA synthesis and metabolic activity in vitro. Cytotechnology 2015, 67, 559–571. [Google Scholar] [CrossRef] [PubMed]
  38. Shinji, J.; Gotoh, H.; Miyanishi, H.; Lavine, M.D.; Lavine, L.C. The activin signaling transcription factor Smox is an essential regulator of appendage size during regeneration after autotomy in the crayfish. Evol Dev 2019, 21, 44–55. [Google Scholar] [CrossRef] [PubMed]
  39. Morris, B.J. Control of receptor sensitivity at the mRNA level. Molecular Neurobiology 1993, 7, 189–205. [Google Scholar] [CrossRef] [PubMed]
  40. Chandler, J.; Gandhi, N.; Mancera, R.; Smith, G.; Elizur, A.; Ventura, T. Understanding insulin endocrinology in decapod crustacea: Molecular modelling characterization of an insulin-binding protein and insulin-like peptides in the eastern spiny lobster, Sagmariasus verreauxi. Int. J. Mol. Sci. 2017, 18, 1832. [Google Scholar] [CrossRef] [PubMed]
  41. Rosen, O.; Weil, S.; Manor, R.; Roth, Z.; Khalaila, I.; Sagi, A. A crayfish insulin-like-binding protein: Another piece in the androgenic gland insulin-like hormone puzzle is revealed. Journal of Biological Chemistry 2013, 288, 22289–22298. [Google Scholar] [CrossRef] [PubMed]
  42. Manor, R.; Weil, S.; Oren, S.; Glazer, L.; Aflalo, E.D.; Ventura, T.; Chalifa-Caspi, V.; Lapidot, M.; Sagi, A. Insulin and gender: an insulin-like gene expressed exclusively in the androgenic gland of the male crayfish. General and Comparative Endocrinology 2007, 150, 326–336. [Google Scholar] [CrossRef]
  43. Mykles, D.L. Signaling pathways that regulate the crustacean molting gland. Frontiers in Endocrinology 2021, 12. [Google Scholar] [CrossRef]
  44. Genovese, N.J.; Domeier, T.L.; Telugu, B.P.V.L.; Roberts, R.M. Enhanced development of skeletal myotubes from porcine induced pluripotent stem cells. Scientific Reports 2017, 7, 41833. [Google Scholar] [CrossRef] [PubMed]
  45. Chal, J.; Pourquié, O. Making muscle: Skeletal myogenesis in vivo and in vitro. Development 2017, 144, 2104–2122. [Google Scholar] [CrossRef] [PubMed]
  46. Kodaka, Y.; Rabu, G.; Asakura, A. Skeletal Muscle Cell Induction from Pluripotent Stem Cells. Stem Cells International 2017, 2017, 1376151. [Google Scholar] [CrossRef] [PubMed]
  47. Taylor, M.V. Comparison of muscle development in Drosophila and vertebrates. Madame Curie Bioscience Database [Internet], 2006. [Google Scholar]
  48. Baylies, M.K.; Bate, M.; Gomez, M.R. Myogenesis: A view from Drosophila. Cell 1998, 93, 921–927. [Google Scholar] [CrossRef] [PubMed]
  49. Price, A.L.; Patel, N.H. Investigating divergent mechanisms of mesoderm development in arthropods: The expression of Ph-twist and Ph-mef2 in Parhyale hawaiensis. Journal of Experimental Zoology Part B: Molecular & Developmental Evolution 2008, 310, 24–40. [Google Scholar] [CrossRef]
  50. Miskiewicz, P.; Morrissey, D.; Lan, Y.; Raj, L.; Kessler, S.; Fujioka, M.; Goto, T.; Weir, M. Both the paired domain and homeodomain are required for in vivo function of Drosophila Paired. Development 1996, 122, 2709–2718. [Google Scholar] [CrossRef] [PubMed]
  51. Xue, L.; Li, X.; Noll, M. Multiple protein functions of paired in Drosophila development and their conservation in the Gooseberry and Pax3 homologs. Development 2001, 128, 395–405. [Google Scholar] [CrossRef] [PubMed]
  52. Boukhatmi, H.; Bray, S. A population of adult satellite-like cells in Drosophila is maintained through a switch in RNA-isoforms. eLife 2018, 7, e35954. [Google Scholar] [CrossRef] [PubMed]
  53. Chaturvedi, D.; Reichert, H.; Gunage, R.D.; VijayRaghavan, K. Identification and functional characterization of muscle satellite cells in Drosophila. eLife 2017, 6, e30107. [Google Scholar] [CrossRef]
  54. Konstantinides, N.; Averof, M. A common cellular basis for muscle regeneration in arthropods and vertebrates. Science 2014, 343, 788–791. [Google Scholar] [CrossRef]
  55. Zammit, P.S. Function of the myogenic regulatory factors Myf5, MyoD, Myogenin and MRF4 in skeletal muscle, satellite cells and regenerative myogenesis. Semin Cell Dev Biol 2017, 72, 19–32. [Google Scholar] [CrossRef] [PubMed]
  56. Ghanawi, J.; Saoud, G.; Zakher, C.; Monzer, S.; Saoud, I.P. Clove oil as an anaesthetic for Australian redclaw crayfish Cherax quadricarinatus. Aquaculture Research 2019, 50, 3628–3632. [Google Scholar] [CrossRef]
  57. Grabherr, M.G.; Haas, B.J.; Yassour, M.; Levin, J.Z.; Thompson, D.A.; Amit, I.; Adiconis, X.; Fan, L.; Raychowdhury, R.; Zeng, Q.; et al. Full-length transcriptome assembly from RNA-Seq data without a reference genome. Nat Biotechnol 2011, 29, 644–652. [Google Scholar] [CrossRef] [PubMed]
  58. Simao, F.A.; Waterhouse, R.M.; Ioannidis, P.; Kriventseva, E.V.; Zdobnov, E.M. BUSCO: assessing genome assembly and annotation completeness with single-copy orthologs. Bioinformatics 2015, 31, 3210–3212. [Google Scholar] [CrossRef] [PubMed]
  59. Bushmanova, E.; Antipov, D.; Lapidus, A.; Suvorov, V.; Prjibelski, A.D. rnaQUAST: a quality assessment tool for de novo transcriptome assemblies. Bioinformatics 2016, 32, 2210–2212. [Google Scholar] [CrossRef] [PubMed]
  60. Chen, S.; Zhou, Y.; Chen, Y.; Gu, J. fastp: an ultra-fast all-in-one FASTQ preprocessor. Bioinformatics 2018, 34, i884–i890. [Google Scholar] [CrossRef] [PubMed]
  61. Kopylova, E.; Noe, L.; Touzet, H. SortMeRNA: fast and accurate filtering of ribosomal RNAs in metatranscriptomic data. Bioinformatics 2012, 28, 3211–3217. [Google Scholar] [CrossRef] [PubMed]
  62. Patro, R.; Duggal, G.; Love, M.I.; Irizarry, R.A.; Kingsford, C. Salmon provides fast and bias-aware quantification of transcript expression. Nat. Methods 2017, 14, 417–419. [Google Scholar] [CrossRef]
  63. Hyde, C.J.; Fitzgibbon, Q.P.; Elizur, A.; Smith, G.G.; Ventura, T. CrustyBase: An interactive online database for crustacean transcriptomes. BMC Genomics 2020, 21, 637. [Google Scholar] [CrossRef]
  64. Soneson, C.; Love, M.I.; Robinson, M.D. Differential analyses for RNA-seq: transcript-level estimates improve gene-level inferences. F1000Res 2015, 4, 1521. [Google Scholar] [CrossRef]
  65. Love, M.I.; Huber, W.; Anders, S. Moderated estimation of fold change and dispersion for RNA-seq data with DESeq2. Genome Biol. 2014, 15, 550. [Google Scholar] [CrossRef] [PubMed]
  66. Stephens, M. False discovery rates: a new deal. Biostatistics 2017, 18, 275–294. [Google Scholar] [CrossRef] [PubMed]
  67. Rivera-Vicens, R.E.; Garcia-Escudero, C.A.; Conci, N.; Eitel, M.; Worheide, G. TransPi-a comprehensive TRanscriptome ANalysiS PIpeline for de novo transcriptome assembly. Mol Ecol Resour 2022, 22, 2070–2086. [Google Scholar] [CrossRef] [PubMed]
  68. Alexa, A.; Rahnenfuhrer, J. topGO: Enrichment Analysis for Gene Ontology., Bioconductor version: Release (3.18) R package version 2.54.0; 2023.
  69. Gu, Z. Complex heatmap visualization. Imeta 2022, 1, e43. [Google Scholar] [CrossRef] [PubMed]
  70. Hunter, J.D. Matplotlib: A 2D Graphics Environment. Computing in Science & Engineering 2007, 9, 90–95. [Google Scholar] [CrossRef]
  71. Thompson, J.D.; Higgins, D.G.; Gibson, T.J. CLUSTAL W: improving the sensitivity of progressive multiple sequence alignment through sequence weighting, position-specific gap penalties and weight matrix choice. Nucleic Acids Res. 1994, 22, 4673–4680. [Google Scholar] [CrossRef]
  72. Smith, G.; Glendinning, S.; Ventura, T. Transcriptomic changes following induced de-masculinisation of Australian red claw crayfish Cherax quadricarinatus. Internatinoal Journal of Molecular Sciences 2023, 24. [Google Scholar] [CrossRef] [PubMed]
  73. Ventura, T.; Fitzgibbon, Q.P.; Battaglene, S.C.; Elizur, A. Redefining metamorphosis in spiny lobsters: molecular analysis of the phyllosoma to puerulus transition in Sagmariasus verreauxi. Scientific Reports 2015, 5. [Google Scholar] [CrossRef]
  74. Glendinning, S.; Fitzgibbon, Q.P.; Smith, G.G.; Ventura, T. Unravelling the neuropeptidome of the ornate spiny lobster Panulirus ornatus: A focus on peptide hormones and their processing enzymes expressed in the reproductive tissues. Gen Comp Endocrinol 2023, 332, 114183. [Google Scholar] [CrossRef]
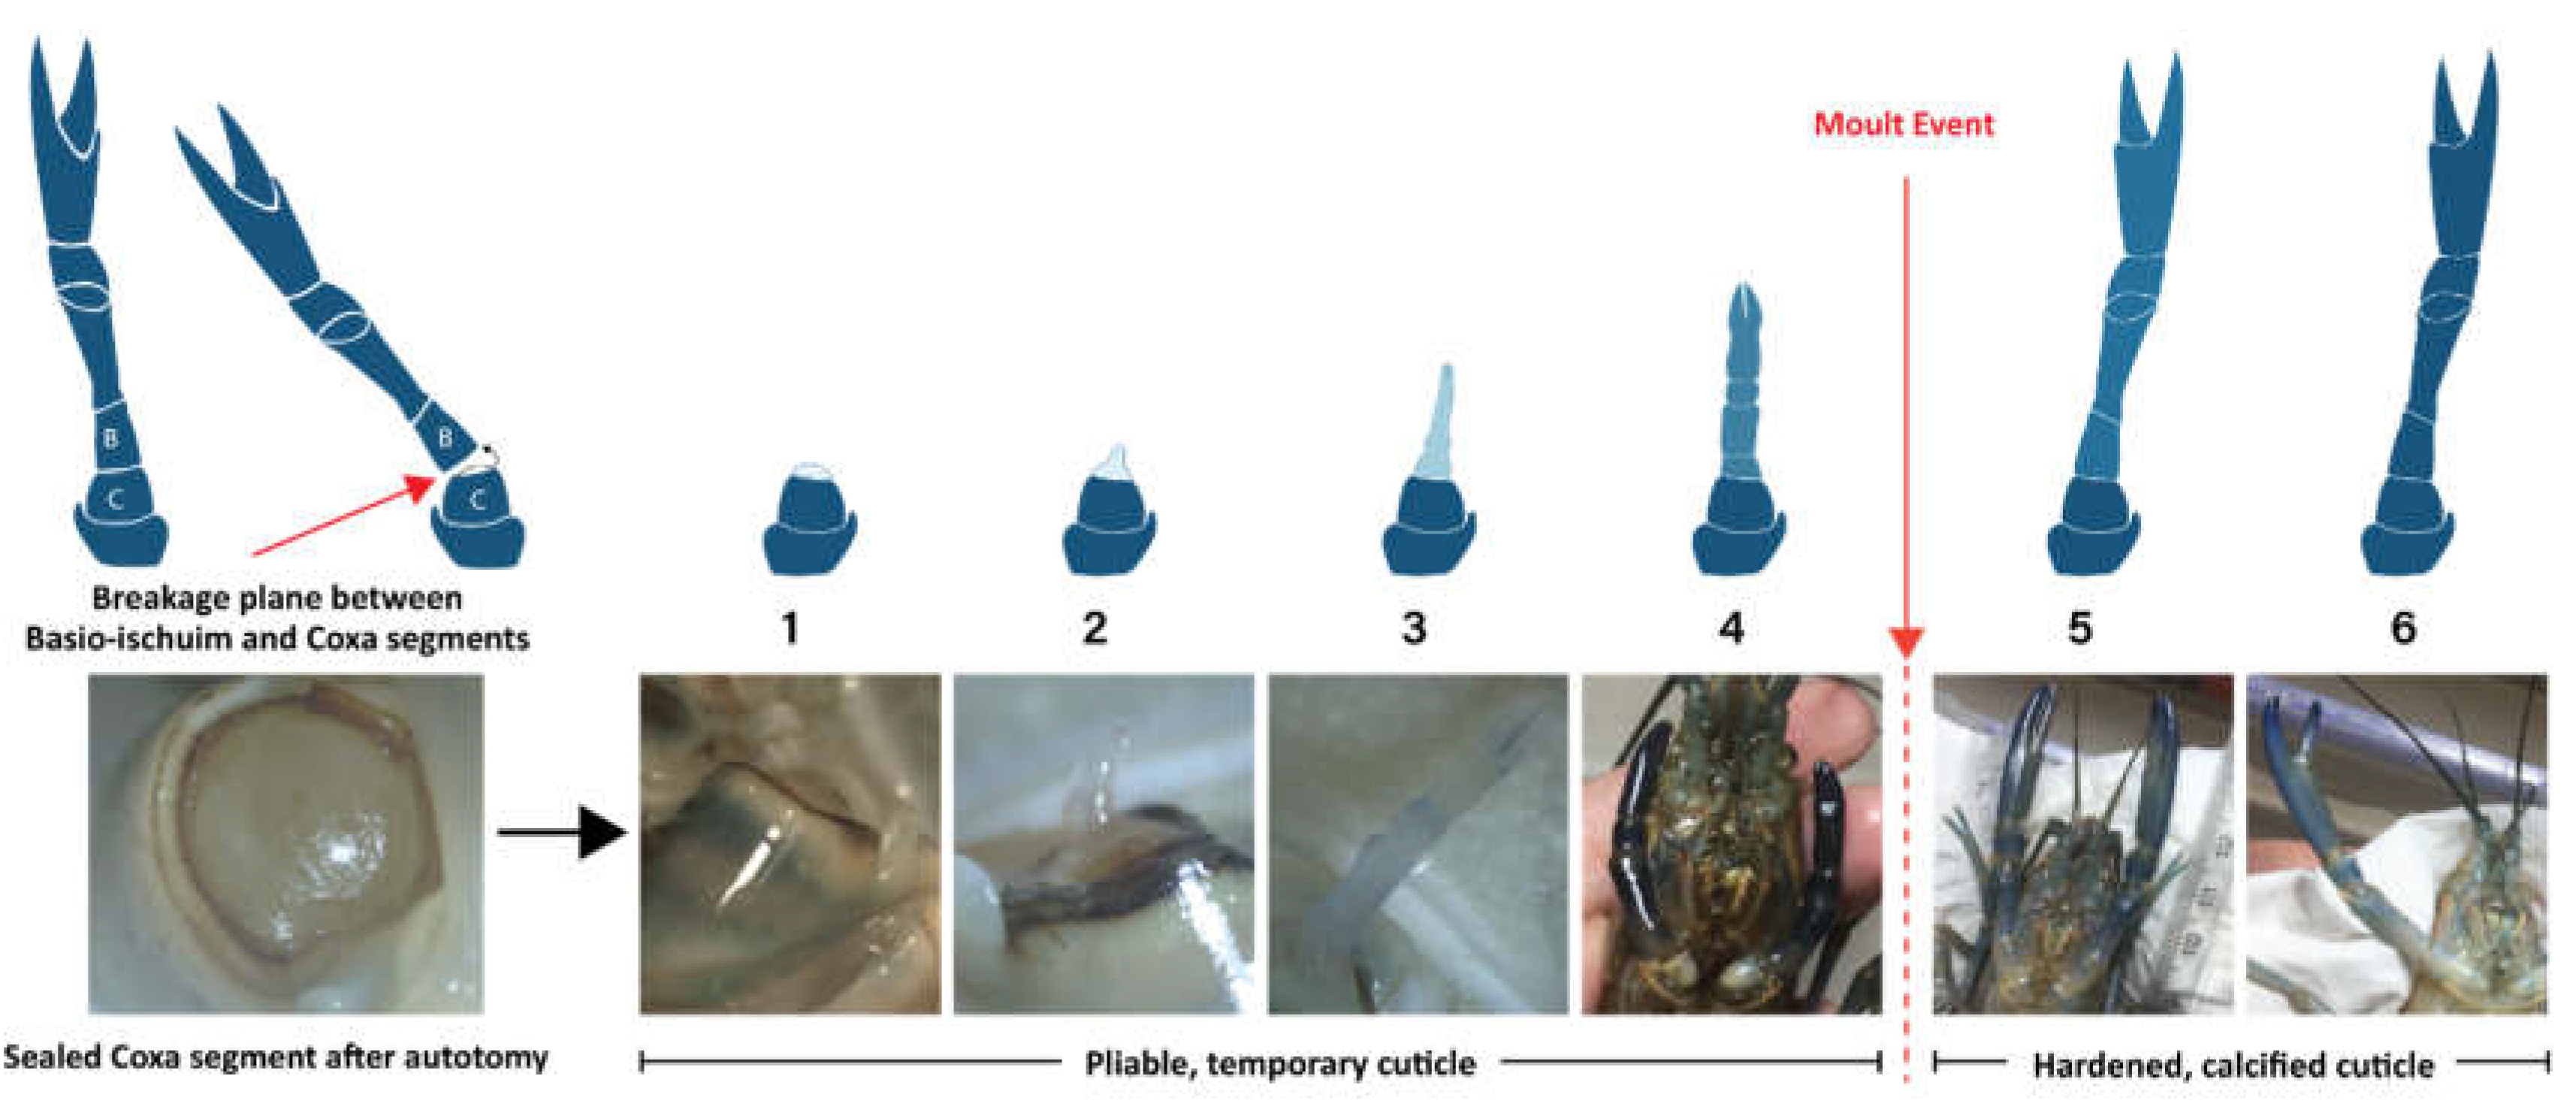
Figure 1. Graphical depiction and photographs of six stages of Cherax quadricarinatus claw re-generation in relation to molt cycle. Allocation of stage was based on observed morphology (shape, segmentation, allometric growth, and pigment). Source: [15].
Preprints 110733 g001
Figure 2. Principal component analysis of top 500 genes with highest row variance across six stages of crayfish claw regeneration.
Preprints 110733 g002
Figure 3. Heat map of the top 10 up and down-regulated differentially expressed genes (DEGs) with SwissProt annotations within all 15 pair-wise comparisons between six different stages of crayfish claw regeneration (S1 to S6 on the X axis). Scale bar represents log2 (normalized counts+1).
Preprints 110733 g003
Figure 4. Heatmap of normalized gene counts of all differentially expressed genes (DEGs) contributing to unique enriched GO terms. Scale bar represents log2(normalized counts+1).
Preprints 110733 g004
Figure 5. Relative expression of differentially expressed genes (DEGs) and enriched GO terms across six limb regeneration stages in the crayfish Cherax quadricarinatus grouped into 14 functional categories. Each level of the plot represents the average relative expression of genes in each category, measured as mean normalized gene count (dark blue area) for each stage, with standard error (pale blue area). The absolute gene count is shown as a log-scaled grey column on the right-hand edge of each expression plot; the first level includes a scale bar which applies to all levels.
Preprints 110733 g005
Figure 6. Relative expression of endocrine factors across limb regeneration of Cherax quadricarinatus. Mean normalized gene count, standard error and absolute gene counts calculated and represented as for Figure 5. Gene names are abbreviated. For full gene names, refer to Table 5 and section above.
Preprints 110733 g006
Figure 7. Phylogenetic analysis showing Cherax quadricarinatus ecdysone receptor (Cq-ECR) clusters with ECRs amongst several Panulirus ornatus nuclear receptor families. P. ornatus nuclear receptor sequences were obtained from publicly available supplementary data [28]. The analyses were conducted with the Neighbor-Joining method using the p-distance model, and bootstrap consensus tree was inferred from 1000 replicates. Bootstrap percentage values are shown at each node. Evolutionary analyses were conducted in MEGA X 10.1.7 [29].
Preprints 110733 g007
Figure 11. Histological analysis showing greater ratio of nuclei to fiber/tissue in Stage 4 vs Stage 6 regenerating limbs. Hematoxylin & eosin (H&E) images are at 10x and 40x magnification and DAPI staining is at 5x magnification. Notations include nuclei (arrowheads), muscle fibers (arrows), epithelial tissue (e), temporary cuticle (tc) and new cuticle (nc).
Preprints 110733 g011
Figure 12. Real-time quantitative PCR results showing relative expression between Stage 4 and Stage 6 tissues for five tested target genes: three myogenic factors (red) Nau, MLC and Zfh1, a pluripotency factor (orange) Oct3/4, and a cell cycle factor (yellow) PCNA. Data represent mean +/- SEM, n = 6. Letters (a, b) denote significant difference in expression after a pair-wise comparison Kruskal-Wallis test (p<0.05).
Preprints 110733 g012
Table 1. Twenty-four tissue samples categorized into six stages of claw regeneration showing R-value (Rv) which is a measure of allometric growth (regenerating limb length divided by carapace length x 100) to account for whole body size differences among individuals. Rv for Stage 6 individuals was not measured. Stages 5 and 6 include number of days post molt (dpm). Italicized red text denotes two RNA samples which failed initial quality control and were not included in subsequent analyses.
Stage Sample R-value* Avg Rv Stage Sample R-value* Avg Rv
Stage 1 S1.1 1.21 0.89 Stage 4 S4.1 29.95 49.49
S1.2 1.17 S4.2 68.31
S1.3 0.23 S4.3 36.24
S1.4 0.97 S4.4 26.45
Stage 2 S2.1 2.37 3.41 Stage 5 S5.1 138.59 136.36(1-3 dpm)
S2.2 4.81 S5.2 145.60
S2.3 3.62 S5.3 158.20
S2.4 2.85 S5.4 103.05
Stage 3 S3.1 24.83 22.85 Stage 6 S6.1 NA NA (18-21 dpm)
S3.2 20.93 S6.2 NA
S3.3 21.47 S6.3 NA
S3.4 24.19 S6.4 NA
*R-value at time of tissue extraction; Avg Rv = average R-value of four samples.
Table 2. Final reference assembly quality statistics after redundancy reduction.
Complete 85.1%
Single and complete BUSCO 44.1%
Duplicated and complete BUSCO 41.0%
Fragmented BUSCO 6.9%
Missing BUSCO 8.0%
Transcripts 55 018
Transcripts > 500 bp 44 584
Transcripts > 100 bp 25 516
Average length of assembled transcripts 1 488.461
Longest transcript 22 480
Total length 81 892 142
Transcript N50 2 242
Table 3. Summary of reference assembly annotation.
Number of transcripts 55 018
Total number of ORFs 43 515
ORFs with annotations 39 360
ORFs without annotations 4 155
ORFs complete 17 773
ORFs complete with annotations 16 223
Transcripts with eggNOG COG 79
Transcripts with GO 23 105
Transcripts with KEGG 18 749
Transcripts with PFAM 23 635
Transcripts with BLAST 21 444
Table 4. Functional categorization of top differentially expressed genes (DEGs) and those contributing to the top enriched GO terms, resulting in 14 combined categories.
DEG Categories GO Term Categories Combined Categories
Neuronal development Cell cycle Cell cycle
Wound repair/inflammation/immune response Neuronal development Neuronal development
Tissue development/regeneration Wound repair/inflammation/immune response Wound repair/inflammation/immune response
Cell repair/homeostasis Tissue development/regeneration Tissue development/regeneration
Cuticle development (AM/AMP type) Insulin-regulated growth Cell repair/homeostasis
Cuticle development (CP type) Metabolite production Cuticle development (AM/AMP type)
Pigmentation - Blue Energy production Cuticle development (CP type)
Pigmentation - Red Protein translation Pigmentation - Blue
Metabolite production Muscle development Pigmentation - Red
Energy production Insulin-regulated growth
Muscle development Metabolite production
Energy production
Protein translation
Muscle development
Table 5. Endocrine, myogenic, cell cycle and pluripotency factors relevant to stem cell proliferation, differentiation, of muscle tissue growth, potentially present during crustacean limb regeneration [15]. Those with transcript IDs were identified in the current dataset. Refer to figures noted for relative expression of each target factor.
Gene Category Gene/Factor Transcript_ID Expression
Endocrine Factors Bone Morphogenetic Protein 1 (BMP1) NonamEVm007201t1 Figure 6
Bone Morphogenetic Protein 2 (BMP2) NonamEVm003174t1
Bone Morphogenetic Protein Receptor (BMPR) NonamEVm006724t1
Transforming Growth Factor Beta (TGFβ) NonamEVm004397t1
Transforming Growth Factor Beta (TGFβR) NonamEVm003982t1
Ecdysone Receptor (ECR) NonamEVm002506t1
Epidermal Growth Factor (EGF) NonamEVm000011t1
Epidermal Growth Factor Receptor (EGFR) NonamEVm000307t1
Fibroblast Growth Factor 1 (FGF1) NonamEVm009793t1
Fibroblast Growth Factor Receptor (FGFR) NonamEVm002596t1
Insulin-like Growth Factor/Peptide (IGF/ILP) NonamEVm015416t1
Insulin-like Growth Factor Binding Protein (IGFBP) NonamEVm006292t1
Insulin-like Growth Factor Binding Protein 3 (IBP3)
Insulin-like Growth Factor Binding Protein 4 (IBP4)
Insulin-like growth factor 2 mRNA-binding protein (IGF2B)
NonamEVm007418t1
NonamEVm018337t1
NonamEVm002726t1
Single insulin-like growth factor-binding domain protein-2 (SBD2) NonamEVm018319t1
Insulin Receptor (IR) NonamEVm000244t1
Platelet Derived/Vascular Endothelial Factor (PVF) NonamEVm006397t1
Platelet Derived/Vascular Endothelial Factor Receptor (PVR) Not found
Hepatocyte Growth Factor & Receptor (HGF/HGFR) Not found
Myostatin (MSTN) Not found
Myogenic Factors Zinc Finger Homeodomain 1 (ZFH1) NonamEVm000901t1 Figure 8
Pax 3 and Pax 7 Binding Protein 1 (PAXB1) NonamEVm001208t1
Myogenic Determination Protein/Nautilus (MYOD/NAU) NonamEVm006620t1
Myocyte Enhancer Factor 2 (MEF2) NonamEVm004258t1
Myosin Heavy Chain, Muscle (MHC) NonamEVm000136t1
Myosin Regulatory Light Chain (MYL) NonamEVm011187t1
Myosin Light Chain (MLC) NonamEVm013270t1
Muscle Lim Protein (MLP) NonamEVm002170t1
Tropomyosin (TMP) NonamEVm005681t1
Actin, Muscle-Related (ACTA) NonamEVm004870t1
Myogenic Determination Protein/Twist (MYOD/TWIST) Not found
Paired Box Protein 3 (PAX3) Not found
Paired Box Protein 7 (PAX7) Not found
Cell Cycle Factors Cyclin-dependent Kinase 1 (CDK1) NonamEVm006446t1 Figure 9
Cyclin-dependent Kinase 14 (CDK14) NonamEVm007728t1
Cyclin-dependent Kinase 2 (CDK2) NonamEVm006000t1
Cyclin-dependent Kinase 4 (CDK4) NonamEVm010173t1
Cyclin-dependent Kinase 7 (CDK7) NonamEVm005270t1
Cyclin A (CYC-A) NonamEVm003889t1
Cyclin B (CYC-B) NonamEVm004508t1
Cyclin C (CYC-C) NonamEVm007180t1
Cyclin E (CYC-E) NonamEVm006398t1
Cellular Tumor Antigen p53 (P53) NonamEVm004102t1
Tumor Protein p53-inducible Protein 11 (P5I11) NonamEVm007863t1
Cellular Tumor Antigen p53 (P63) NonamEVm001352t1
Proliferating Cell Nuclear Antigen (PCNA) NonamEVm007483t1
Retinoblastoma-like Associated Protein (RBL1) NonamEVm000671t1
Cyclin-dependent Kinase 3 (CDK3) Not found
Cyclin-dependent Kinase 6 (CDK6) Not found
Cyclin D (CYC-D) Not found
Pluripotency Factors MYC Proto-oncogene Protein (C-MYC) NonamEVm003188t1 Figure 10
Krueppel-like Factor 4 (KLF4) NonamEVm004452t1
SRY-Box Transcription Factor 2 (SOX2) NonamEVm004482t1
POU Domain, Class 5, Transcription Factor 1 (OCT3/4) NonamEVm004528t1
Int/Wingless Family Protein 2 (WNT-2) NonamEVm005041t1
Int/Wingless Family Protein 4 (WNT-4) NonamEVm003744t1
Hedgehog (HH) NonamEVm003556t1
Frizzled (FZD) NonamEVm005809t1
Nanog (NANOG) Not found
Int/Wingless Family Protein 1 (WNT-1) Not found
Table 5. Primers designed for selected target genes and Roche Universal Probes (discontinued). The 18S housekeeping gene was used for the positive control and to normalize expression of the other genes.
Primer Name UPL Probe # Forward Primer Reverse Primer
qCq18S 133 GCGCTACACTGAAGGGATCA AGGGGTTTGAACGGGTTACC
qCqMLC 135 CGTGTGCTGGGAATCACTGA CGGGCTGGACCTTCGTTATT
qCqZfh1 10 AGAAGTCCCCCTCATCTCCC CAACGCAACTATTAGCCCGC
qCqPCNA 42 GGCTCGTCTTGTCCAAGGAA TGACGCTTCATTCAGCAGCT
qCqOct3/4 85 CGAAGTCGAAGAGGAGACCC CCAGCTTGATACGCCTCTGT
cCqNautilus 5 CGTGCAAGAGAAAGAGCGTC TCACCTTCCGTAGTCTCCGT
Disclaimer/Publisher’s Note: The statements, opinions and data contained in all publications are solely those of the individual author(s) and contributor(s) and not of MDPI and/or the editor(s). MDPI and/or the editor(s) disclaim responsibility for any injury to people or property resulting from any ideas, methods, instructions or products referred to in the content.
Copyright: This open access article is published under a Creative Commons CC BY 4.0 license, which permit the free download, distribution, and reuse, provided that the author and preprint are cited in any reuse.
Prerpints.org logo

Preprints.org is a free preprint server supported by MDPI in Basel, Switzerland.

Subscribe

© 2024 MDPI (Basel, Switzerland) unless otherwise stated