1. Introduction
Nowadays, the role of nitrogen (N) for the growth, development and productivity of crops is essential. This essential macroelement has a direct effect on the production of biomass and dry weight of plants, by influencing, in addition to many other physiological processes, the efficiency of the photosynthetic system of the leaves. In this way, a strong photosynthetic system allows optimal development; In contrast, a limited or stunted photosynthetic system results in low photosynthetic efficiency, causing rickets and plant death. [
1,
2].
For this reason, it is essential to improve nitrogen use efficiency (NUE) within crop agronomic management programs. The increase in NUE through agronomic management practices, and with the use of high-performance technologies, manages to reduce intensive applications of nitrogen, increase its use and reduce environmental pollution caused by nitrogen fertilizers. [
3]. In parallel, it must be considered that N is a key component of living cells, and that nitrogen fertilizer is the second largest requirement after water in crop production [
4]. For this reason, the relationship between the applied N and its absorption and fixation efficiency must be high, and not inefficient or on a scale higher than the plant’s requirements [
5].
It is then that the elements that are key for nitrogen fixation must also be taken into account. In this sense, molybdenum (Mo) stands out for being an essential micro-element that plays a fundamental role in N metabolism, and that regulates and optimizes the activities and expressions of the enzymes responsible for N assimilation. In addition, it participates in different biosyntheses responsible for the normal functioning of plant growth and development processes [
6].
To enhance the effect of Mo, its application must be foliar and can be effectively combined with the use of nanotechnology, in this way a nanofertilizer is created capable of penetrating plant tissues and intelligently releasing the active ingredient. (Mo), so that it is fully available to the plant [
7]. The harmony of these tools aligns agricultural systems with global needs to protect natural resources [
3]. Therefore, the objective of this study was to determine the efficiency of nitrogen use, and to create new NUE indices that can determine and calculate the final destination of the assimilated nitrogen, for the formation and development of the organs of fertilized green bean plants. with molybdenum nanofertilizer applied foliarly and combined with soil fertilization of ammonium nitrate.
4. Discussion
Nitrogen shortage or overfertilization severely affects the physiological, molecular and biochemical responses of the plan. In addition, the general metabolism and the distribution of metabolites and general resources necessary for their survival are affected [
14]. For this reason, nitrogen is considered among all essential nutrients, the most limiting nutrient for agricultural production [
5]. However, its intensive and unbalanced use is strongly related to the losses that cause low efficiency in the use of nitrogen fertilizers (NUE) [
15]. Given the urgency of solving the problem of low nitrogen use efficiency, techniques were used that allowed raising the level of use of this nutrient to the maximum. The use of microelements as important as molybdenum, essential in the nitrogen assimilation process; and the use of cutting-edge tools such as nanotechnology, have proven to be nitrogen use efficiency.
Nitrogen use efficiency represents the ability of plants to use the mineral nitrogen that is available. For this reason, its definition implies the increase in yield per unit of nitrogen applied, absorbed and used by the plant for the production of economically viable fruit [
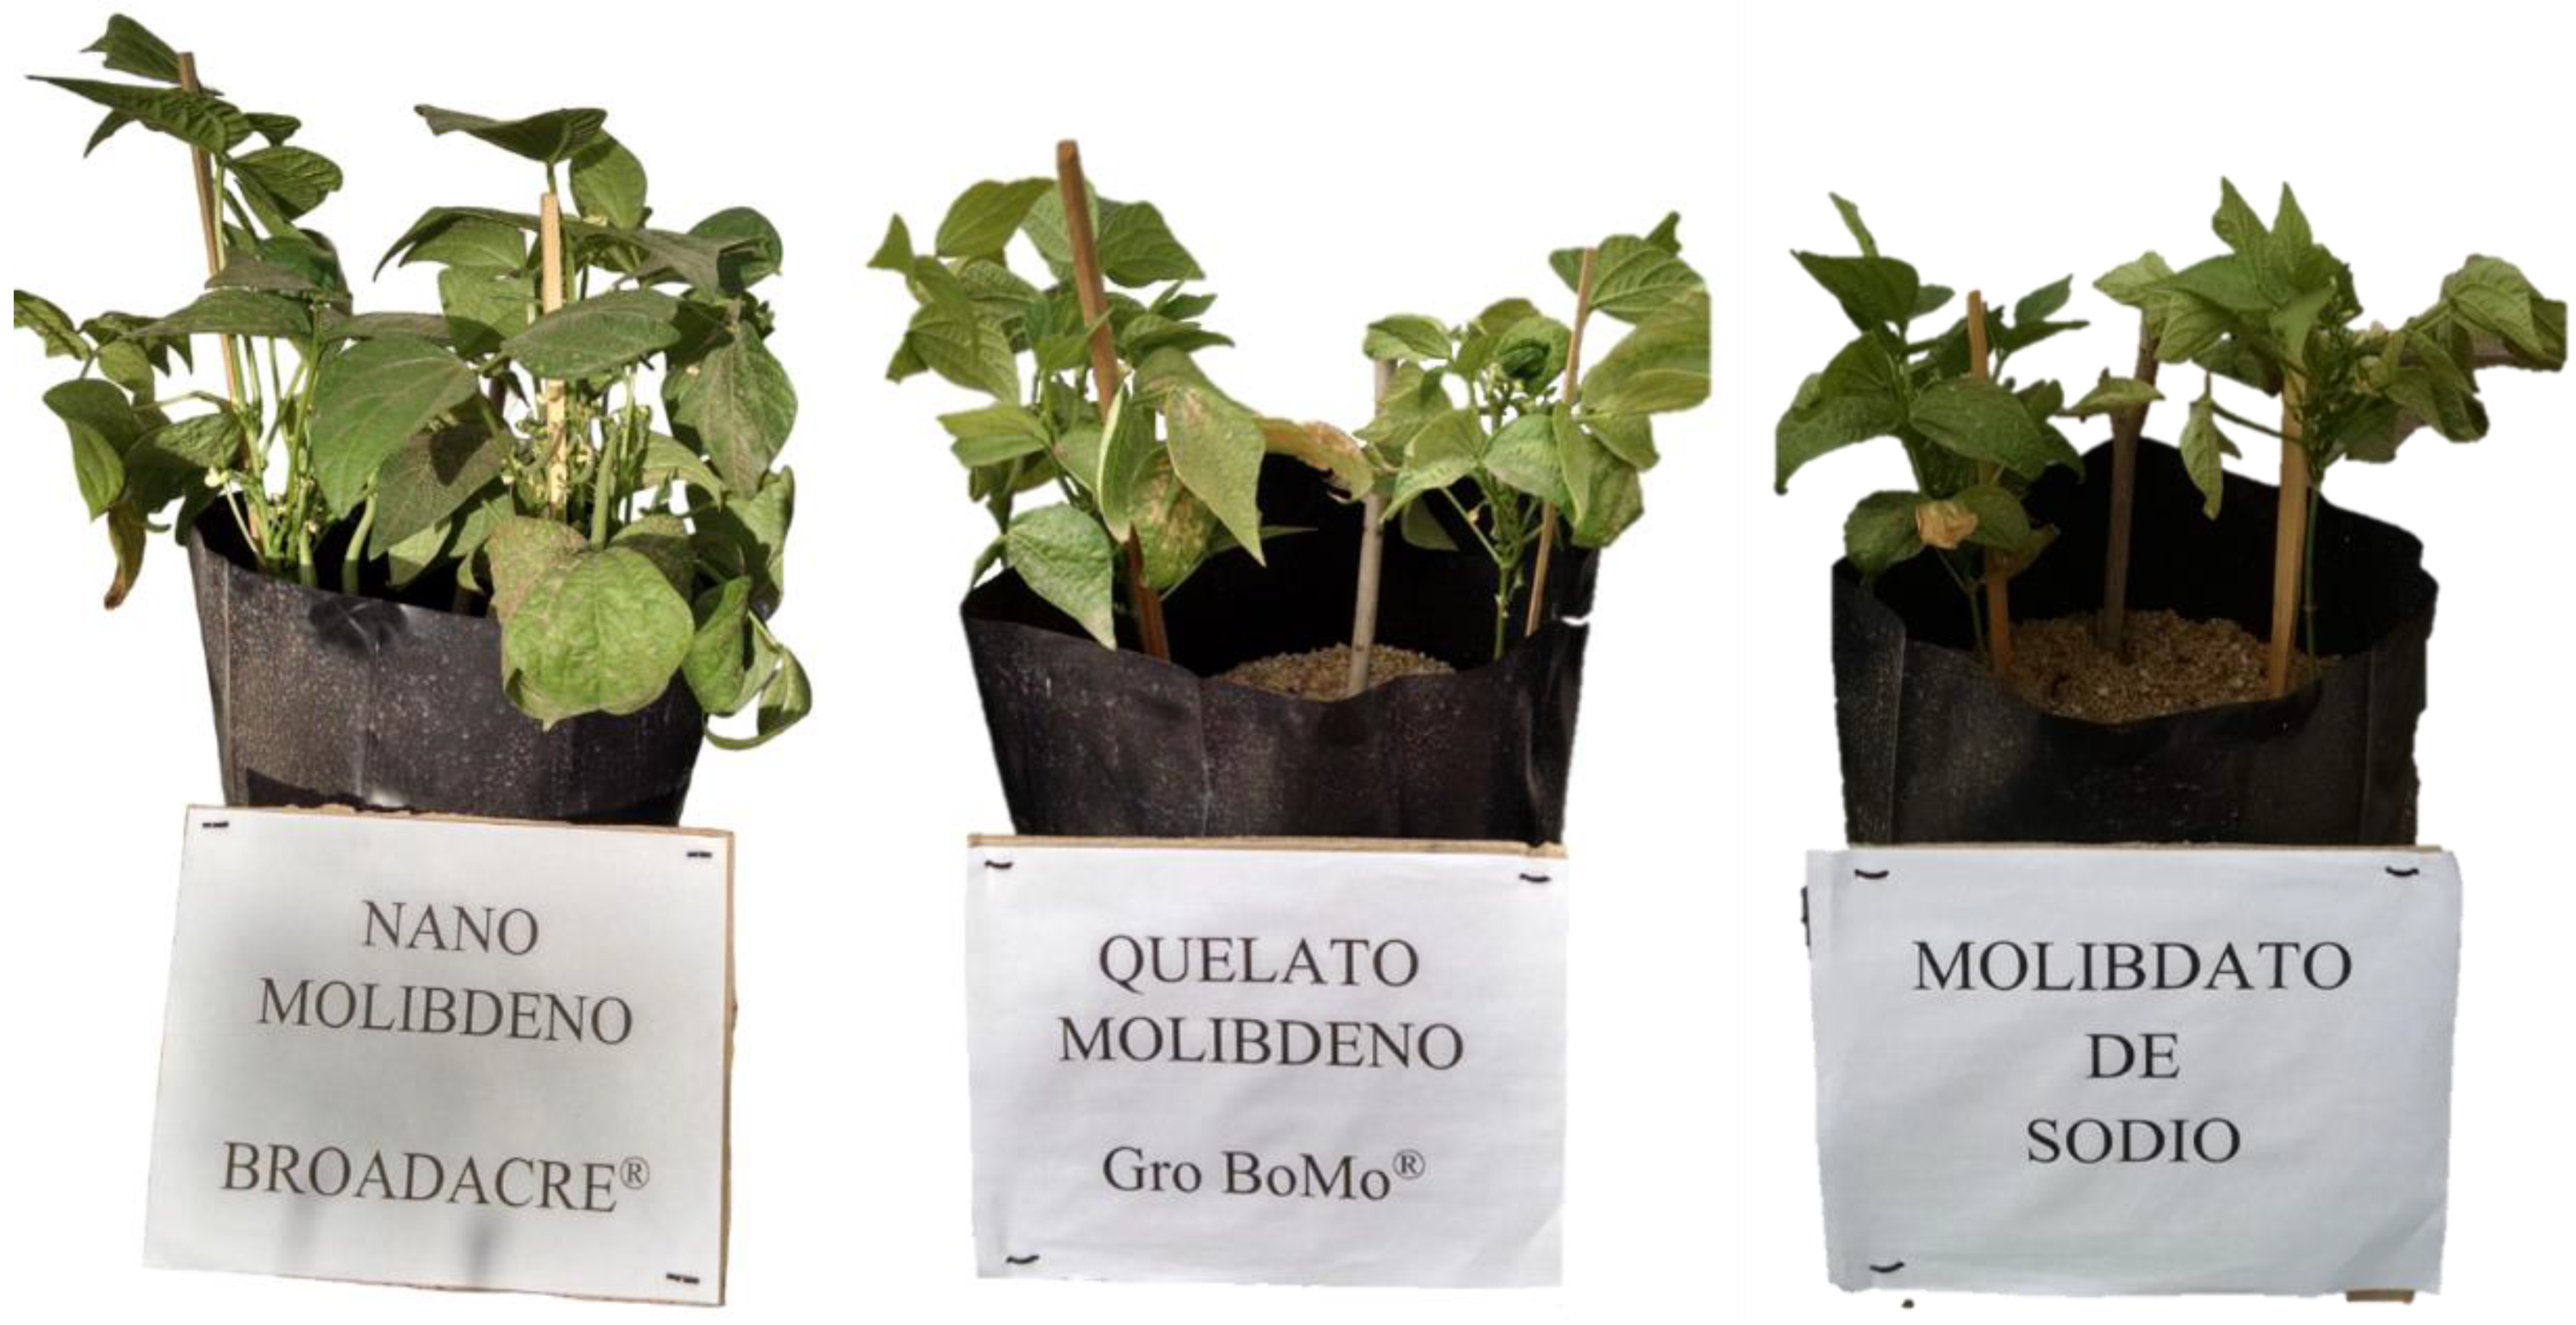
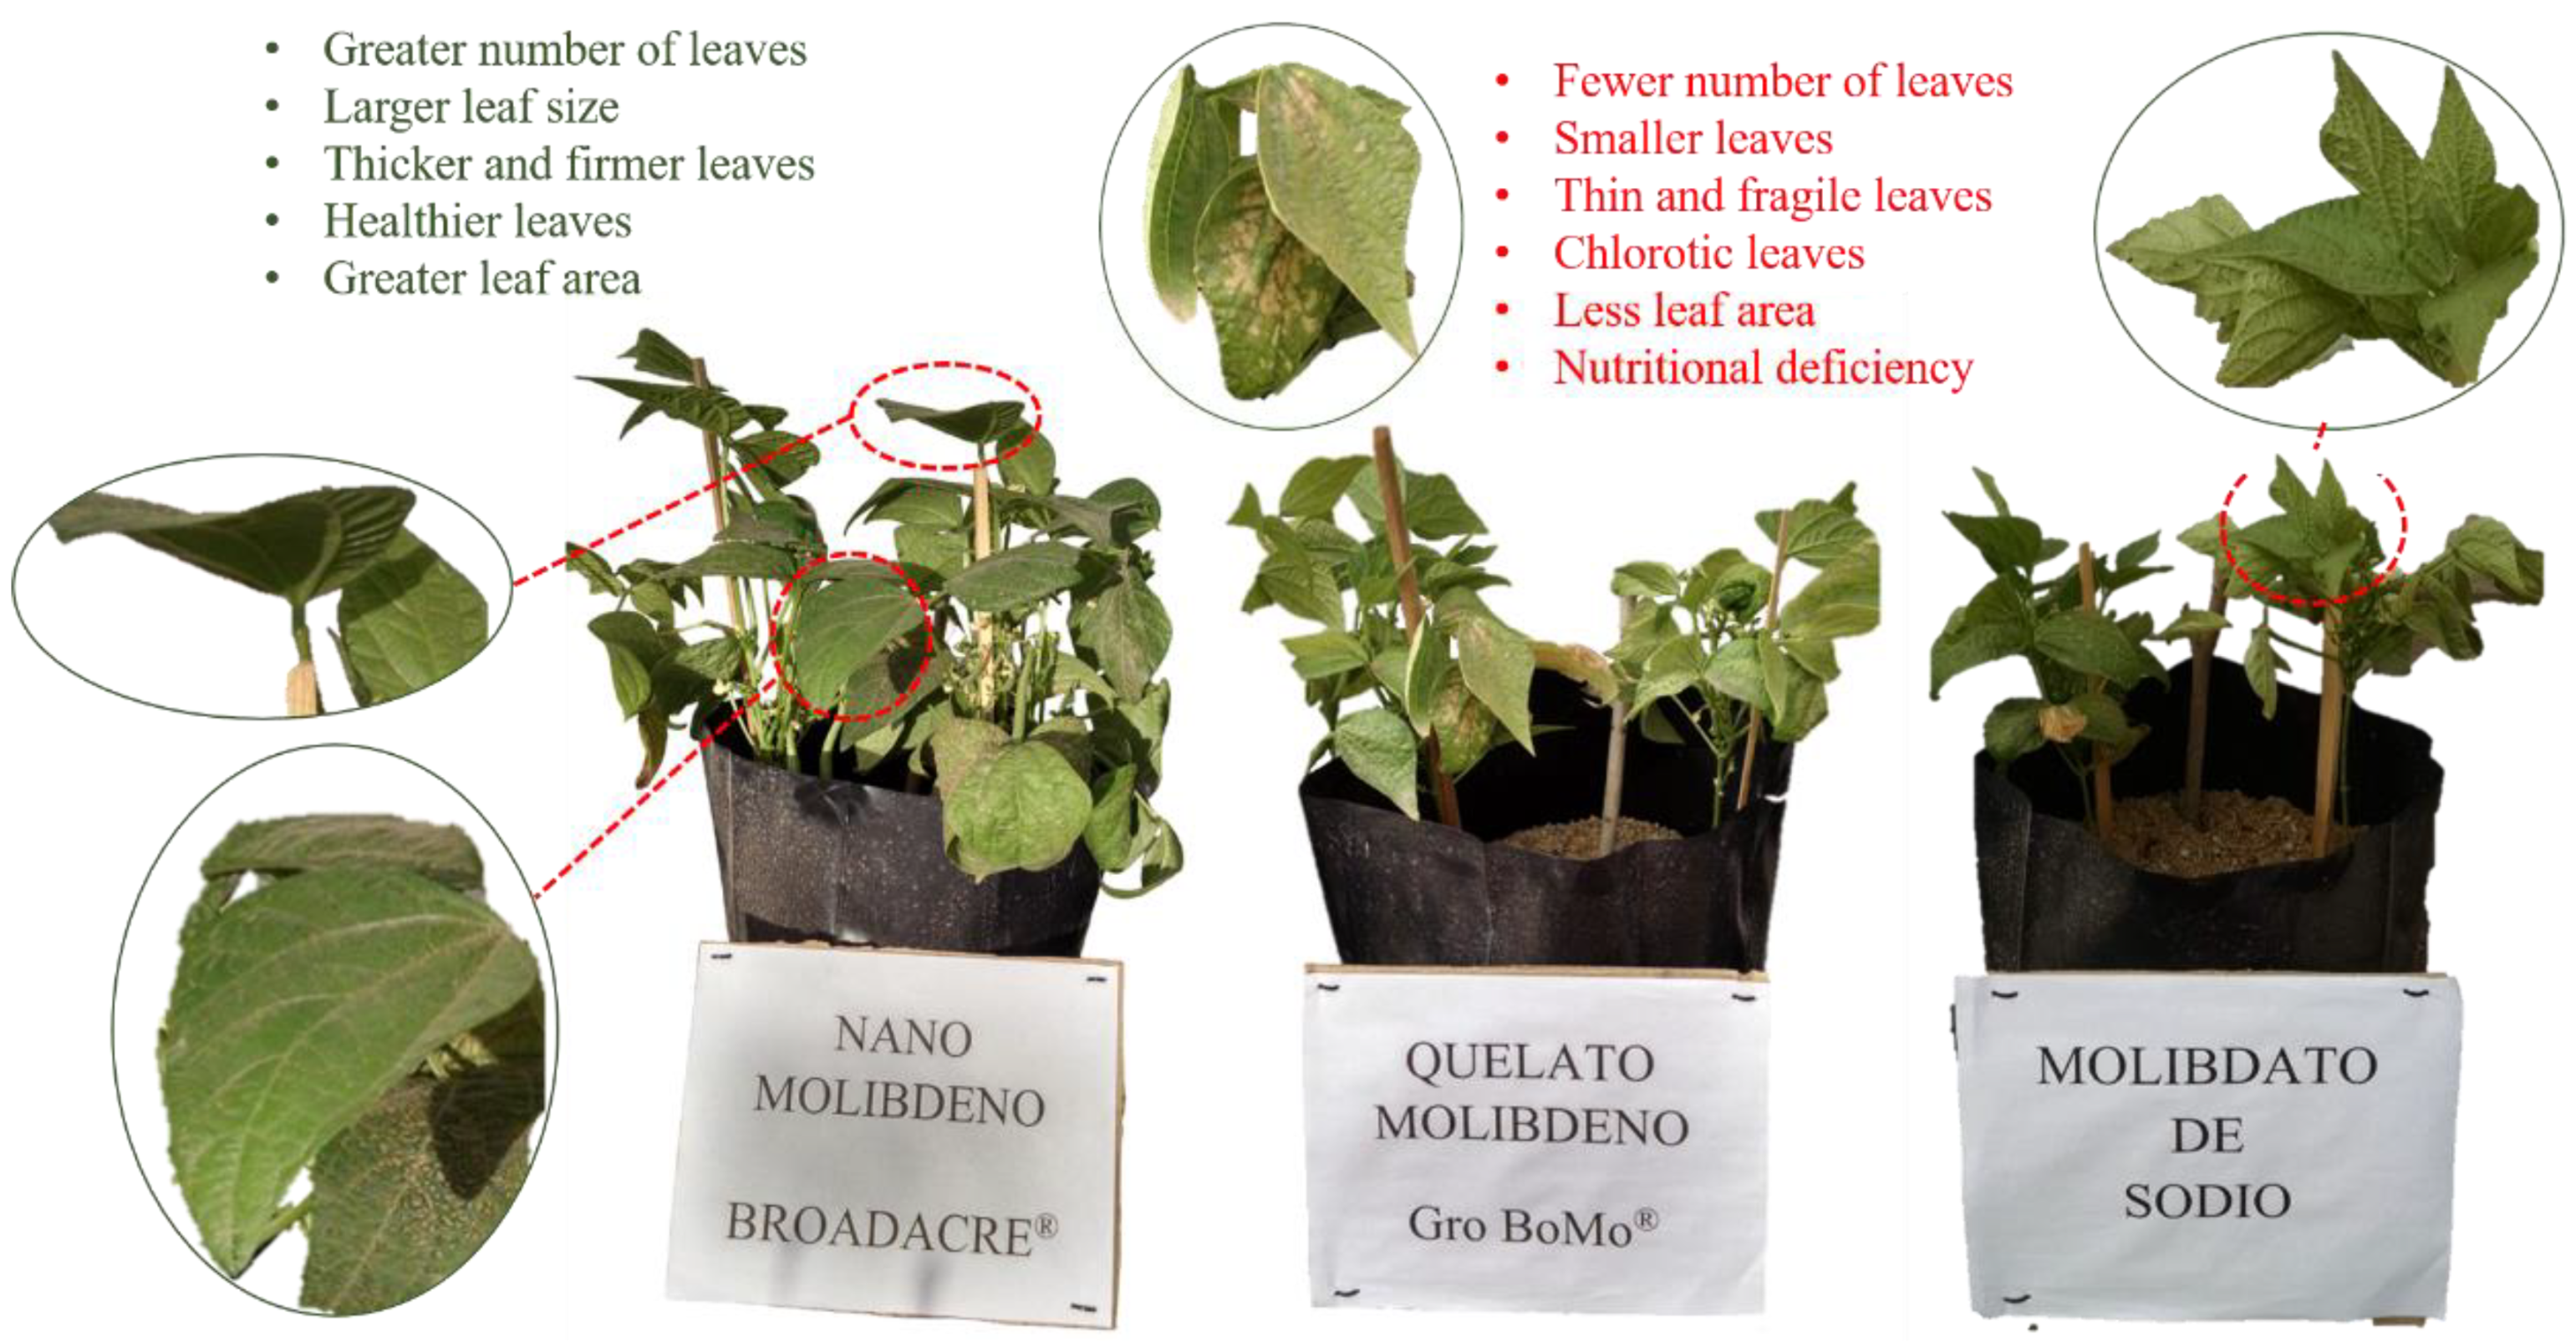
16]. However, it is also used to determine the production efficiency of the entire plant biomass. For this reason, the different parameters calculated in the present research were able to demonstrate the positive effect of NanoMo on the efficiency of nitrogen use in the production of leaves, stems, roots and fruit in bean plants. The particular characteristics of NanoMo facilitated its penetration through the surface of the leaves, and its nanometric size allowed it to be distributed throughout all tissues, which guaranteed an effective concentration required by the plant for its growth (
Figure 7) [
17].
The importance of Mo being available in the cells lies in the fact that it is a metallic component that plays a fundamental role in the biosynthesis of the cofactor Moco, which binds to the molybdoenzymes (enzymes that require molybdenum) responsible for the reduction, assimilation and nitrate fixation (Nitrate reductase (NR) and Nitrite reductase (NiR)), in addition to the regulation of the enzymes Glutamine synthetase (GS) and glutamate synthase (GOGAT) responsible for the assimilation of ammonium [
6]. In this way, a sufficient amount of Mo allowed the plant to use it in the metabolic process of nitrogen assimilation, and that the activity of the enzymes responsible for its assimilation and fixation was not stopped or decreased. Likewise, nitrogen used efficiently allowed the development of meristems, the formation and growth of leaf tissue in the increase in the growth rate and elongation of the leaves [
18] (
Figure 8).
The adequate supply of nutrients and especially nitrogen, allows the plant to develop a support system strong enough so that it can remain upright, and prevent the stems from breaking despite the overturning forces that the plant can generate. wind and the weight of the plant itself; The stems must have the ability to redirect and transmit those forces to the anchoring system in the ground [
19].
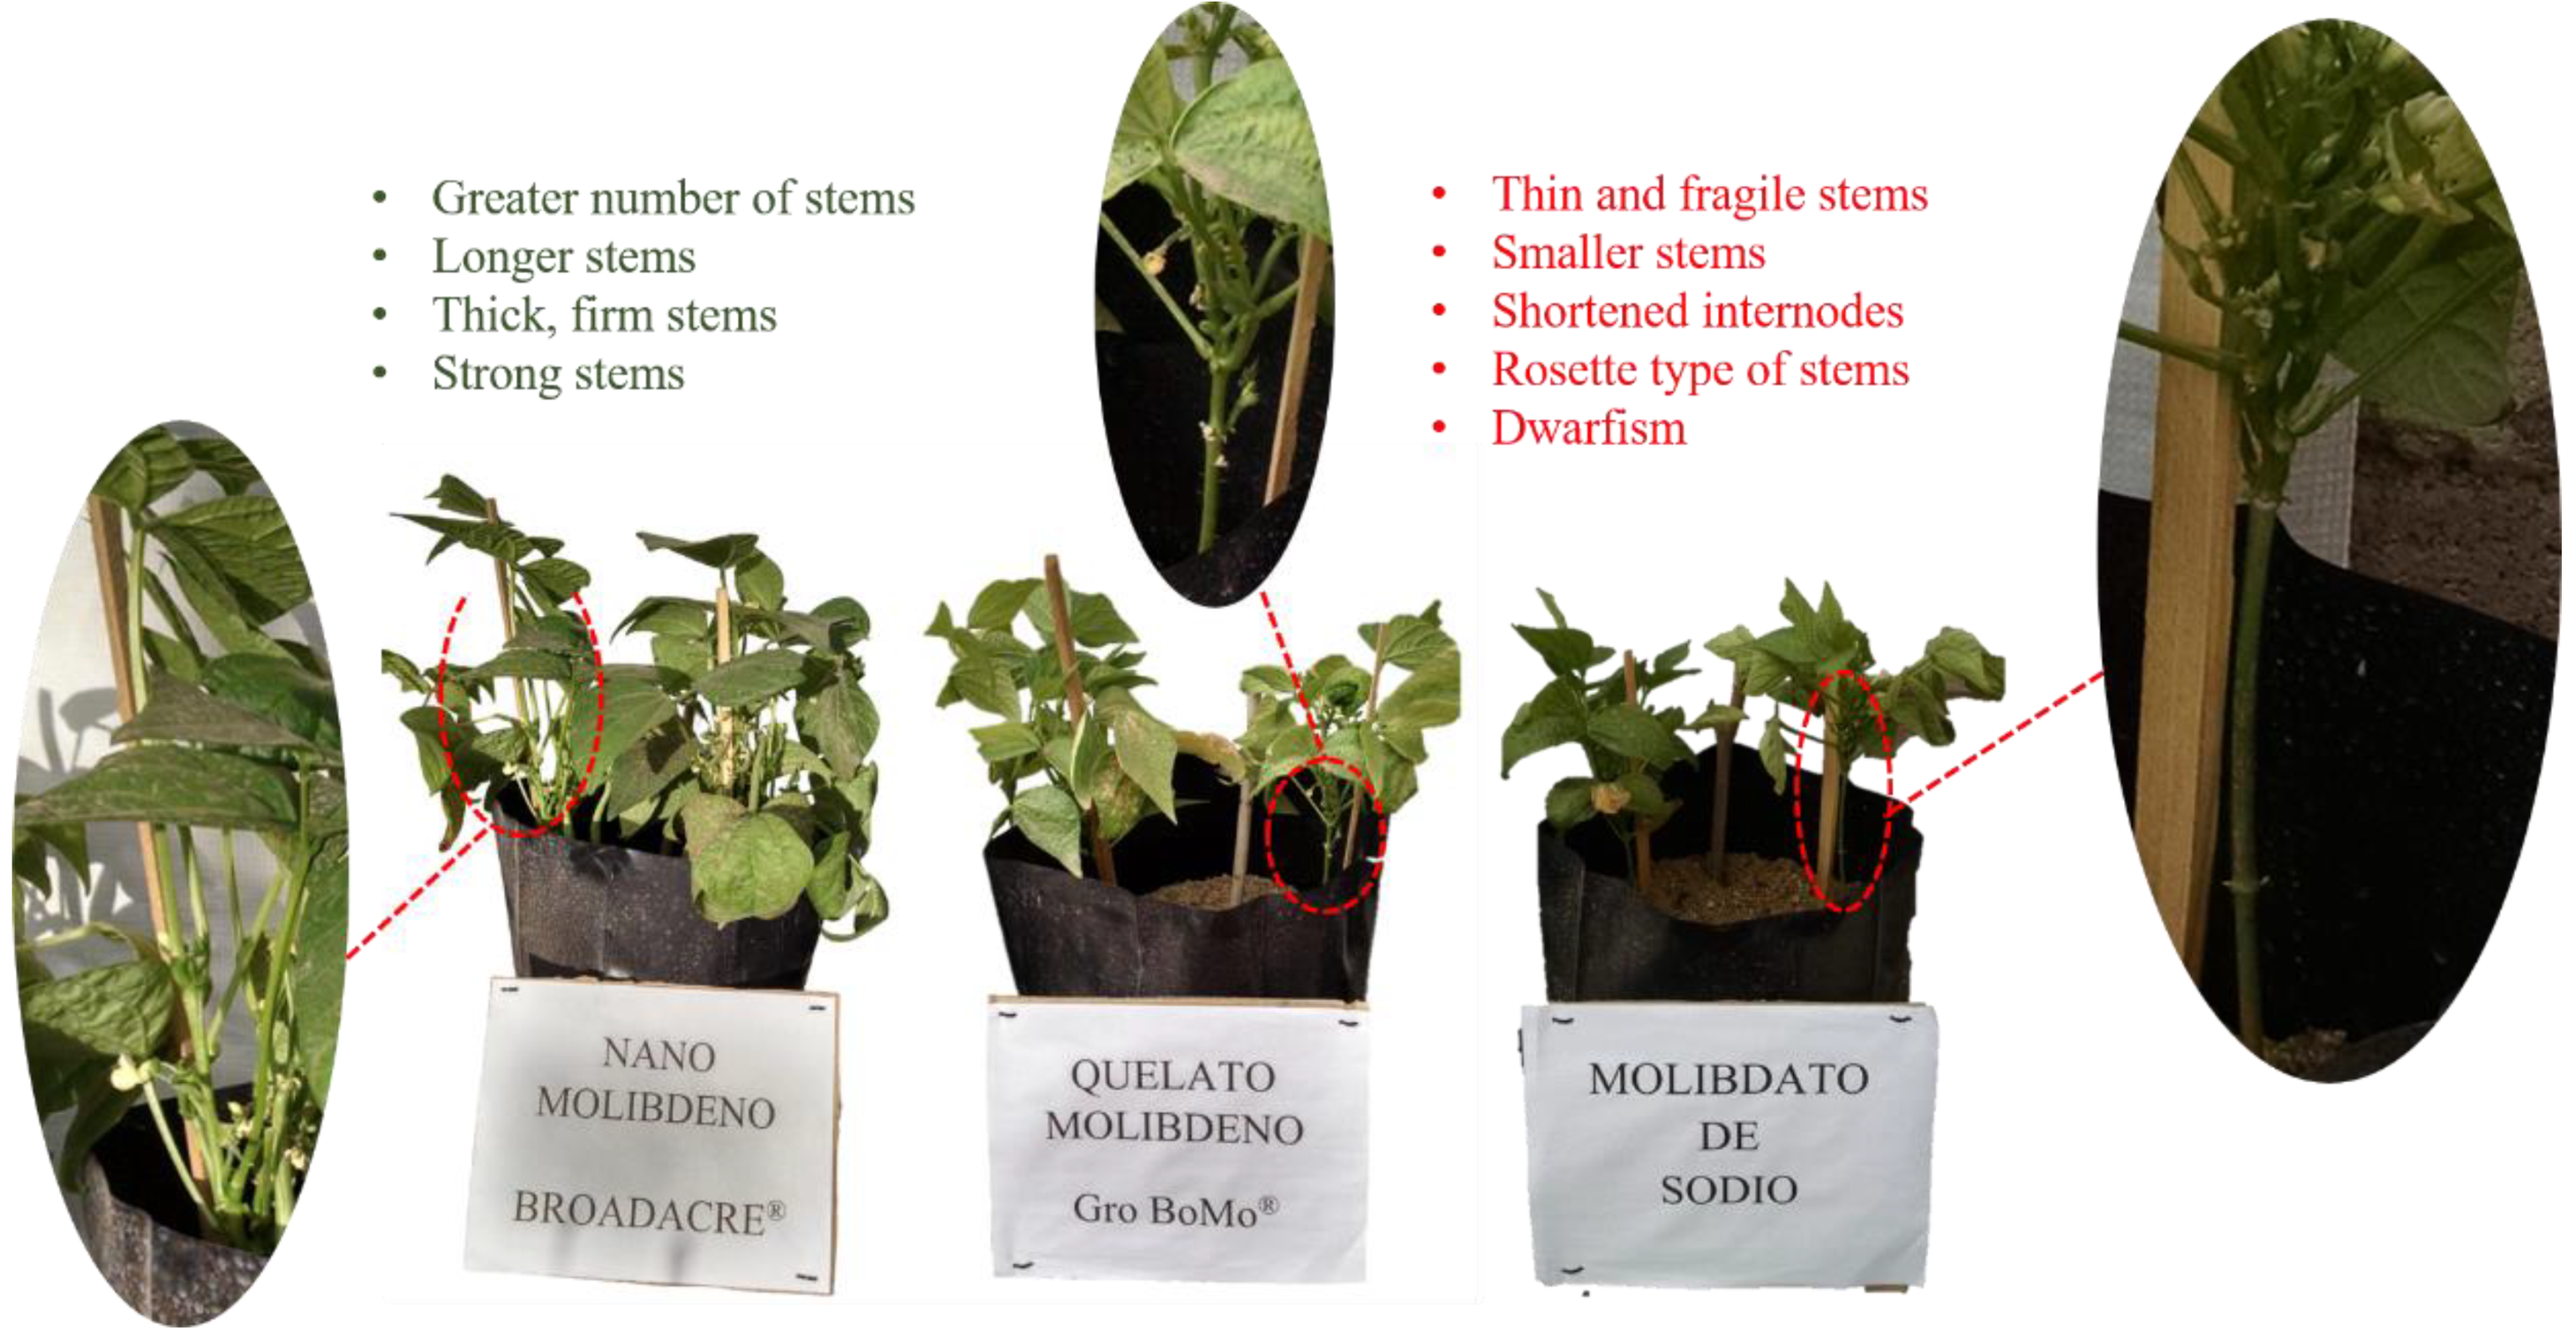
Likewise, the effect of NUE was reflected in the formation of strong and resistant stems in the plants treated with NanoMo, which were not prevented from developing properly. On the other hand, the deficiency in the growth of plants treated with Chelate and Molybdate, supposes a low assimilation of nitrogen, which consequently affects the production of proteins and various nitrogen products essential for the development of the plant. The low assimilation of nitrogen triggered various metabolic effects, which strongly impact metabolic pathways, and specific actions that involve some macronutrients that act on the specific development of the stems. In this case, it can be assumed that there was an affectation in the phosphorus (P) cycle, which results in a reduction in the synthesis of cellulose, starch and sucrose, which affects the formation of stems, in such a way that the plants may present dwarfism. Likewise, the activity of potassium (K) could be affected; the inaction or deficiency of this element caused by the N-K relationship produces a stagnation in the development of the plant, especially by shortening the internodes of the stems, making them weaker [
20] (
Figure 8).
Figure 9.
Effect of NanoMo on Nitrogen Use Efficiency in green beans cv. Strike on the growth and development of stems.
Figure 9.
Effect of NanoMo on Nitrogen Use Efficiency in green beans cv. Strike on the growth and development of stems.
The root is the fundamental organ of the plant that anchors it to the soil. Furthermore, it has the indispensable function of capturing water and nutrients from the soil, and is a site of great interaction with biotic and abiotic factors that are frequently determinants for crop productivity [
21]. For good root development to occur, there must be an adequate supply of nutrients, especially nitrogen. The absence or shortage of this element drastically reduces root growth, which directly impacts the development and quality of the plant [
22].
The development of a strong and abundant root system facilitates the absorption and translocation of nitrogen for the development of the entire vegetative system, and especially in fruit formation [
23]. The adequate nutritional status of the plants fertilized with NanoMo, allowed, among many other plant mechanisms, the timely activation of nutrient transporters, which are distributed in all their organs. In the particular case of this research, nitrate transporters, responsible for the absorption and transport of nitrate to assimilation sites within cells [
24]. In such a way, plants with a high nitrogen use efficiency develop a strong and extensive root system during their growth and vegetative development; which is an essential basis for the continuous absorption and translocation of nitrogen, until culminating in the stage of fruit formation and filling [
25,
26] (
Figure 10).
Nitrogen is vital in increasing crop yields. Adequate supply of this nutrient can increase performance by up to 40% [
27]. Furthermore, the quality of the fruits depends on the quantity and proportion of amino acids, proteins, vitamins, sugars and other metabolites that depend on the supply of nitrogen by the plant [
28]. In addition, it is necessary to increase the efficient use of nitrogen to improve the productivity and quality of the fruits.
It is very important to highlight that the high quality of the fruits is vital for consumers and food processors. In addition, high-quality fruits are mainly desired in the world market, where they are expected to have good flavor, excellent appearance, firmness, size and, above all, be rich in nutrients essential for health. All this can be achieved with proper crop management, and especially fertilization management [
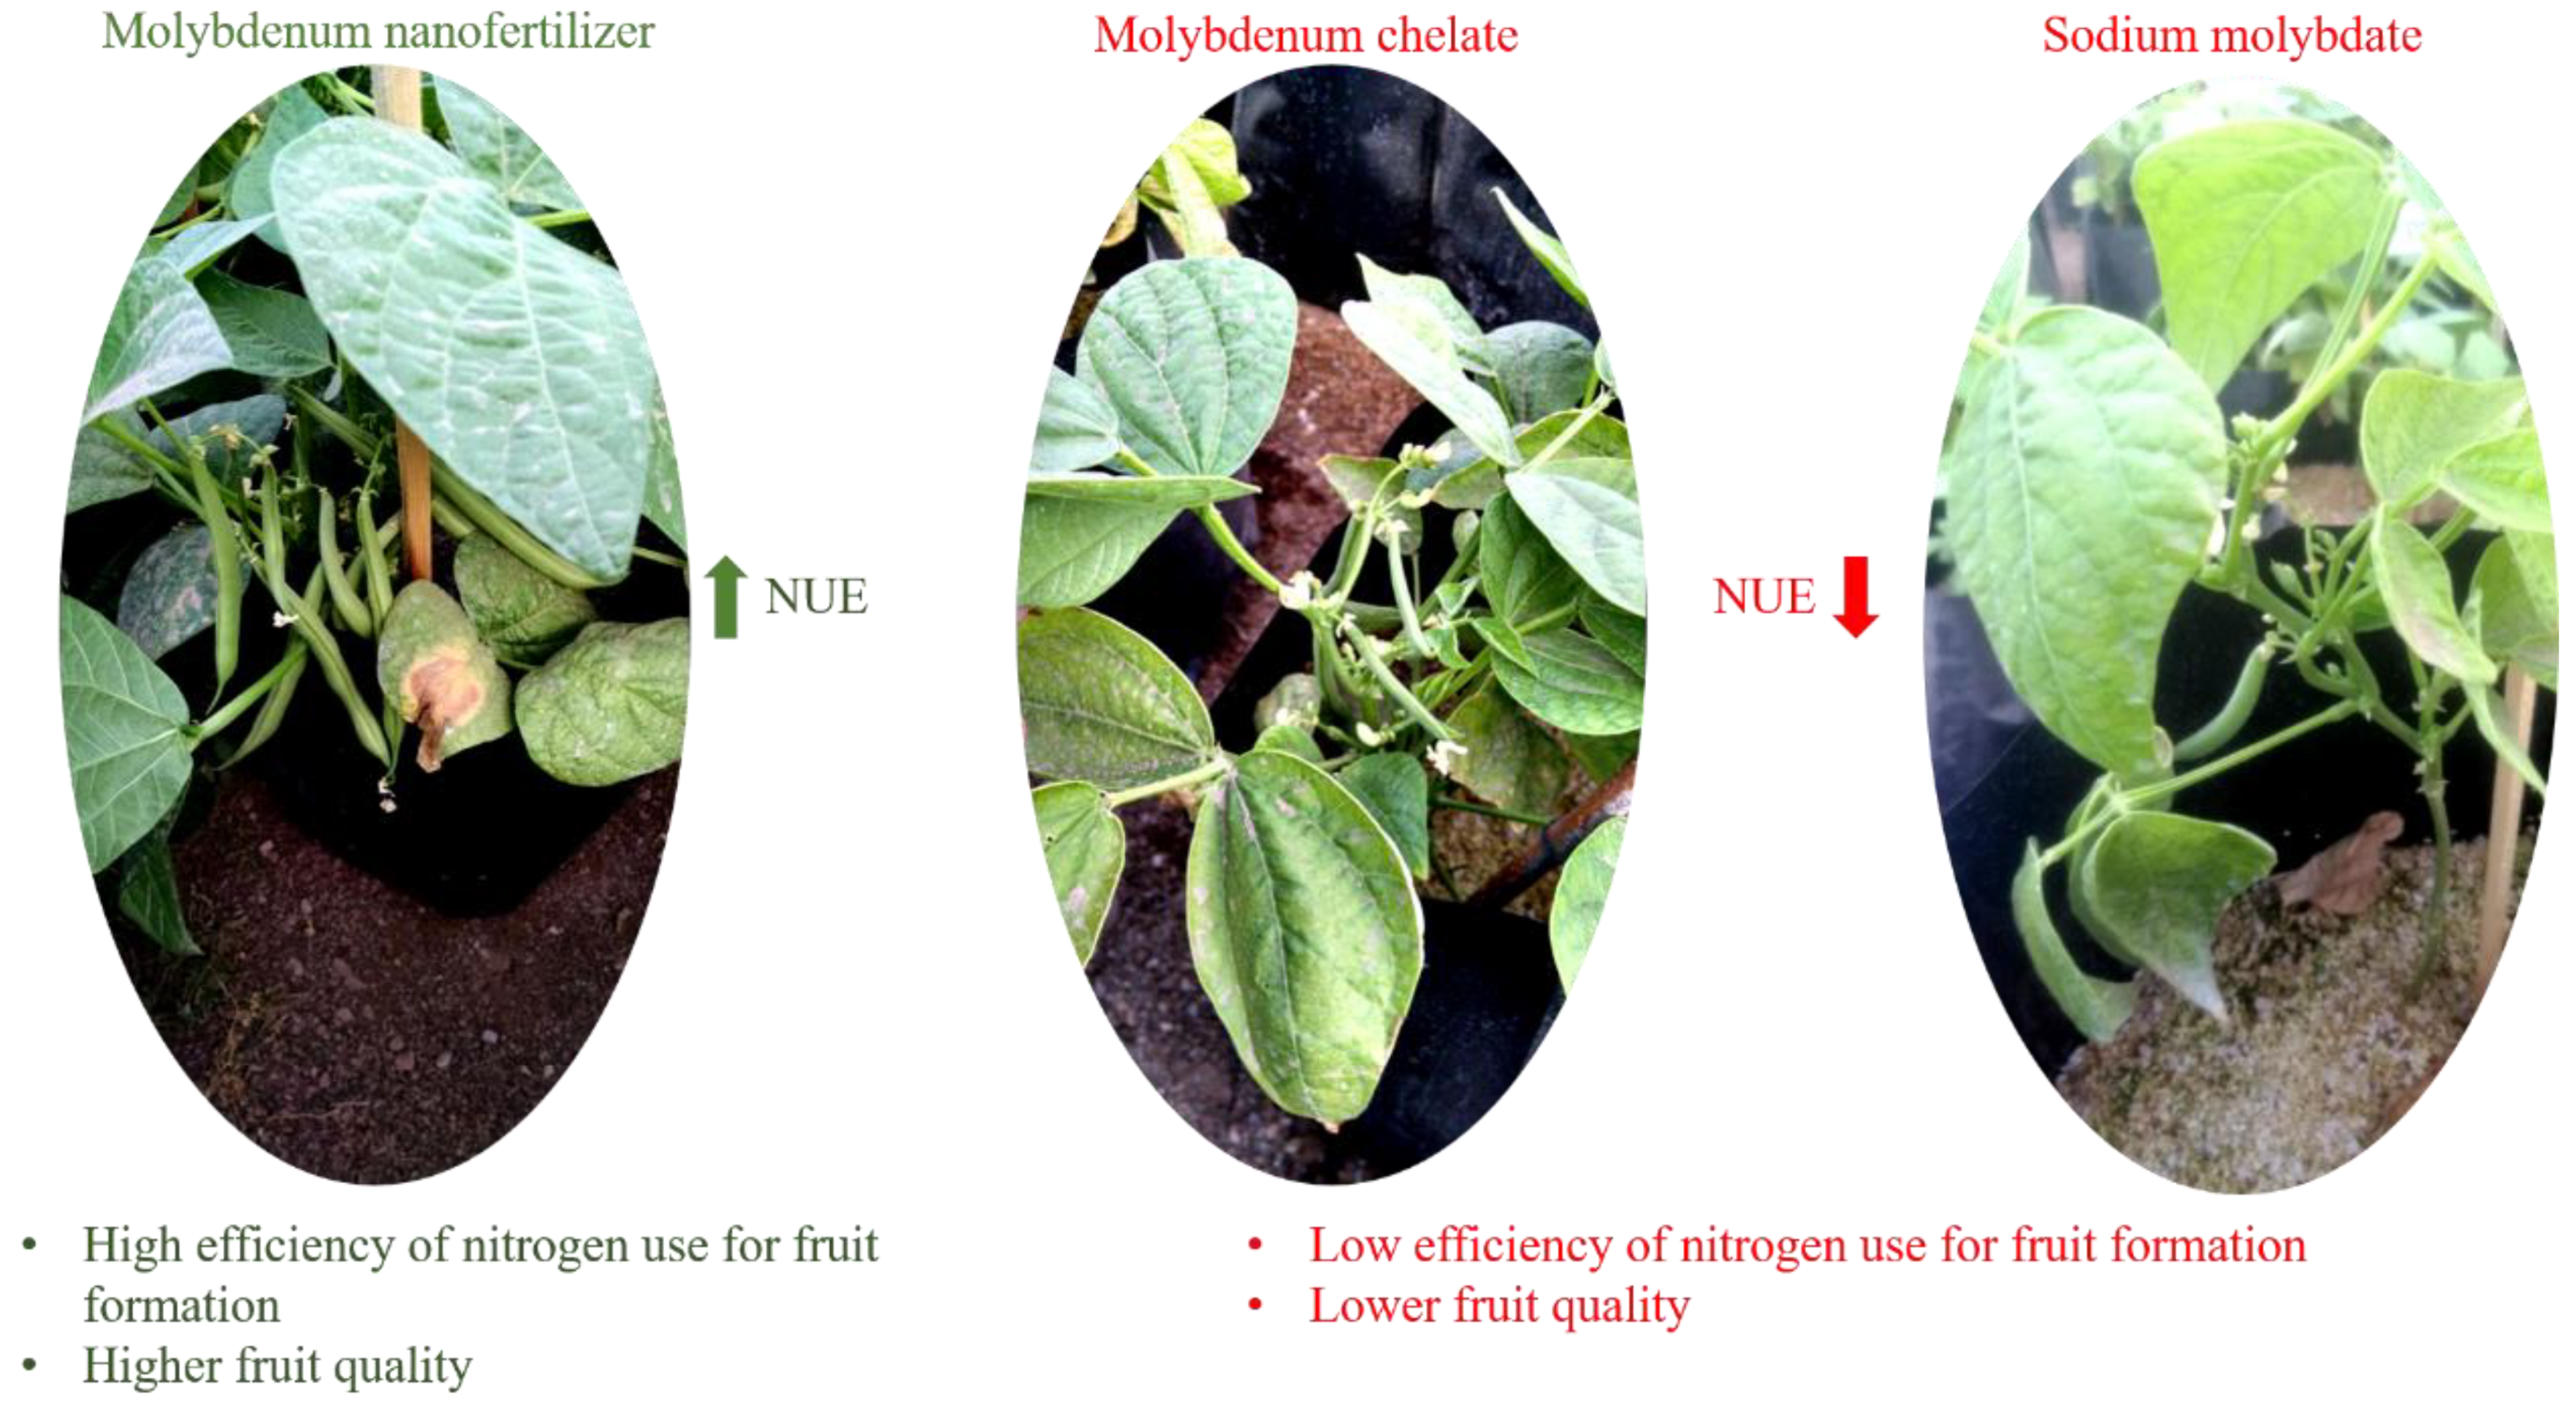
29]. For this reason, the efficient use of nitrogen and nanomolybdenum allowed the bean plants to produce a greater quantity of high-quality fruit; since nitrogen directly impacts fruit growth and regulates its quality [
27]. Furthermore, the high assimilation efficiency of nanomolybdenum allowed optimizing the metabolic functions of the enzymes and cofactors responsible for the reduction, assimilation and fixation of nitrogen, which are intended for plant growth and fruit development [
6]. . Efficiently assimilated nitrogen is an important component of the chemical structure of proteins, chlorophylls, some phytohormones, nucleic acids and secondary metabolites responsible for the quality of the fruits [
30]. In this way, a higher content of sugars, antioxidant compounds and firmness are guaranteed [
31,
32].
On the other hand, [
33] reported that high nitrogen applications combined with low efficiency caused a decrease in phenolic content, yield and nutritional content. In addition, the size, shape, color and general appearance of the olive fruit was affected. Likewise, most crops are undoubtedly affected by nitrogen, and it is for this reason that the calculation of nitrogen parameters is a reliable tool to effectively determine the use of nitrogen and other essential nutrients for plant development and performance.
Figure 11.
Effect of NanoMo on NUE in green beans cv. Strike on the growth and development of the fruit.
Figure 11.
Effect of NanoMo on NUE in green beans cv. Strike on the growth and development of the fruit.
5. Conclusions
Foliar applications of Nanomolybdenum considerably increased the efficiency of nitrogen use, which increased the productivity of bean plants per unit of applied nitrogen by 42% and 37% more in the leaf, 44% and 24% more in the stem, 26% and 2% more in roots, and 46% and 18% in fruit production than chelate and molybdate respectively.
Furthermore, the determination of the NUE through the use of the different efficiency indices allowed us to specify the final destination of the assimilated nitrogen and its use in the production of leaves, stems, fruit and roots of the green bean plants.
Finally, the results prove that the use of NUE indices is an important approach to evaluate the efficiency of nitrogen applied to crops; and that can be used to estimate the growth, development and yield of cultivated plants.
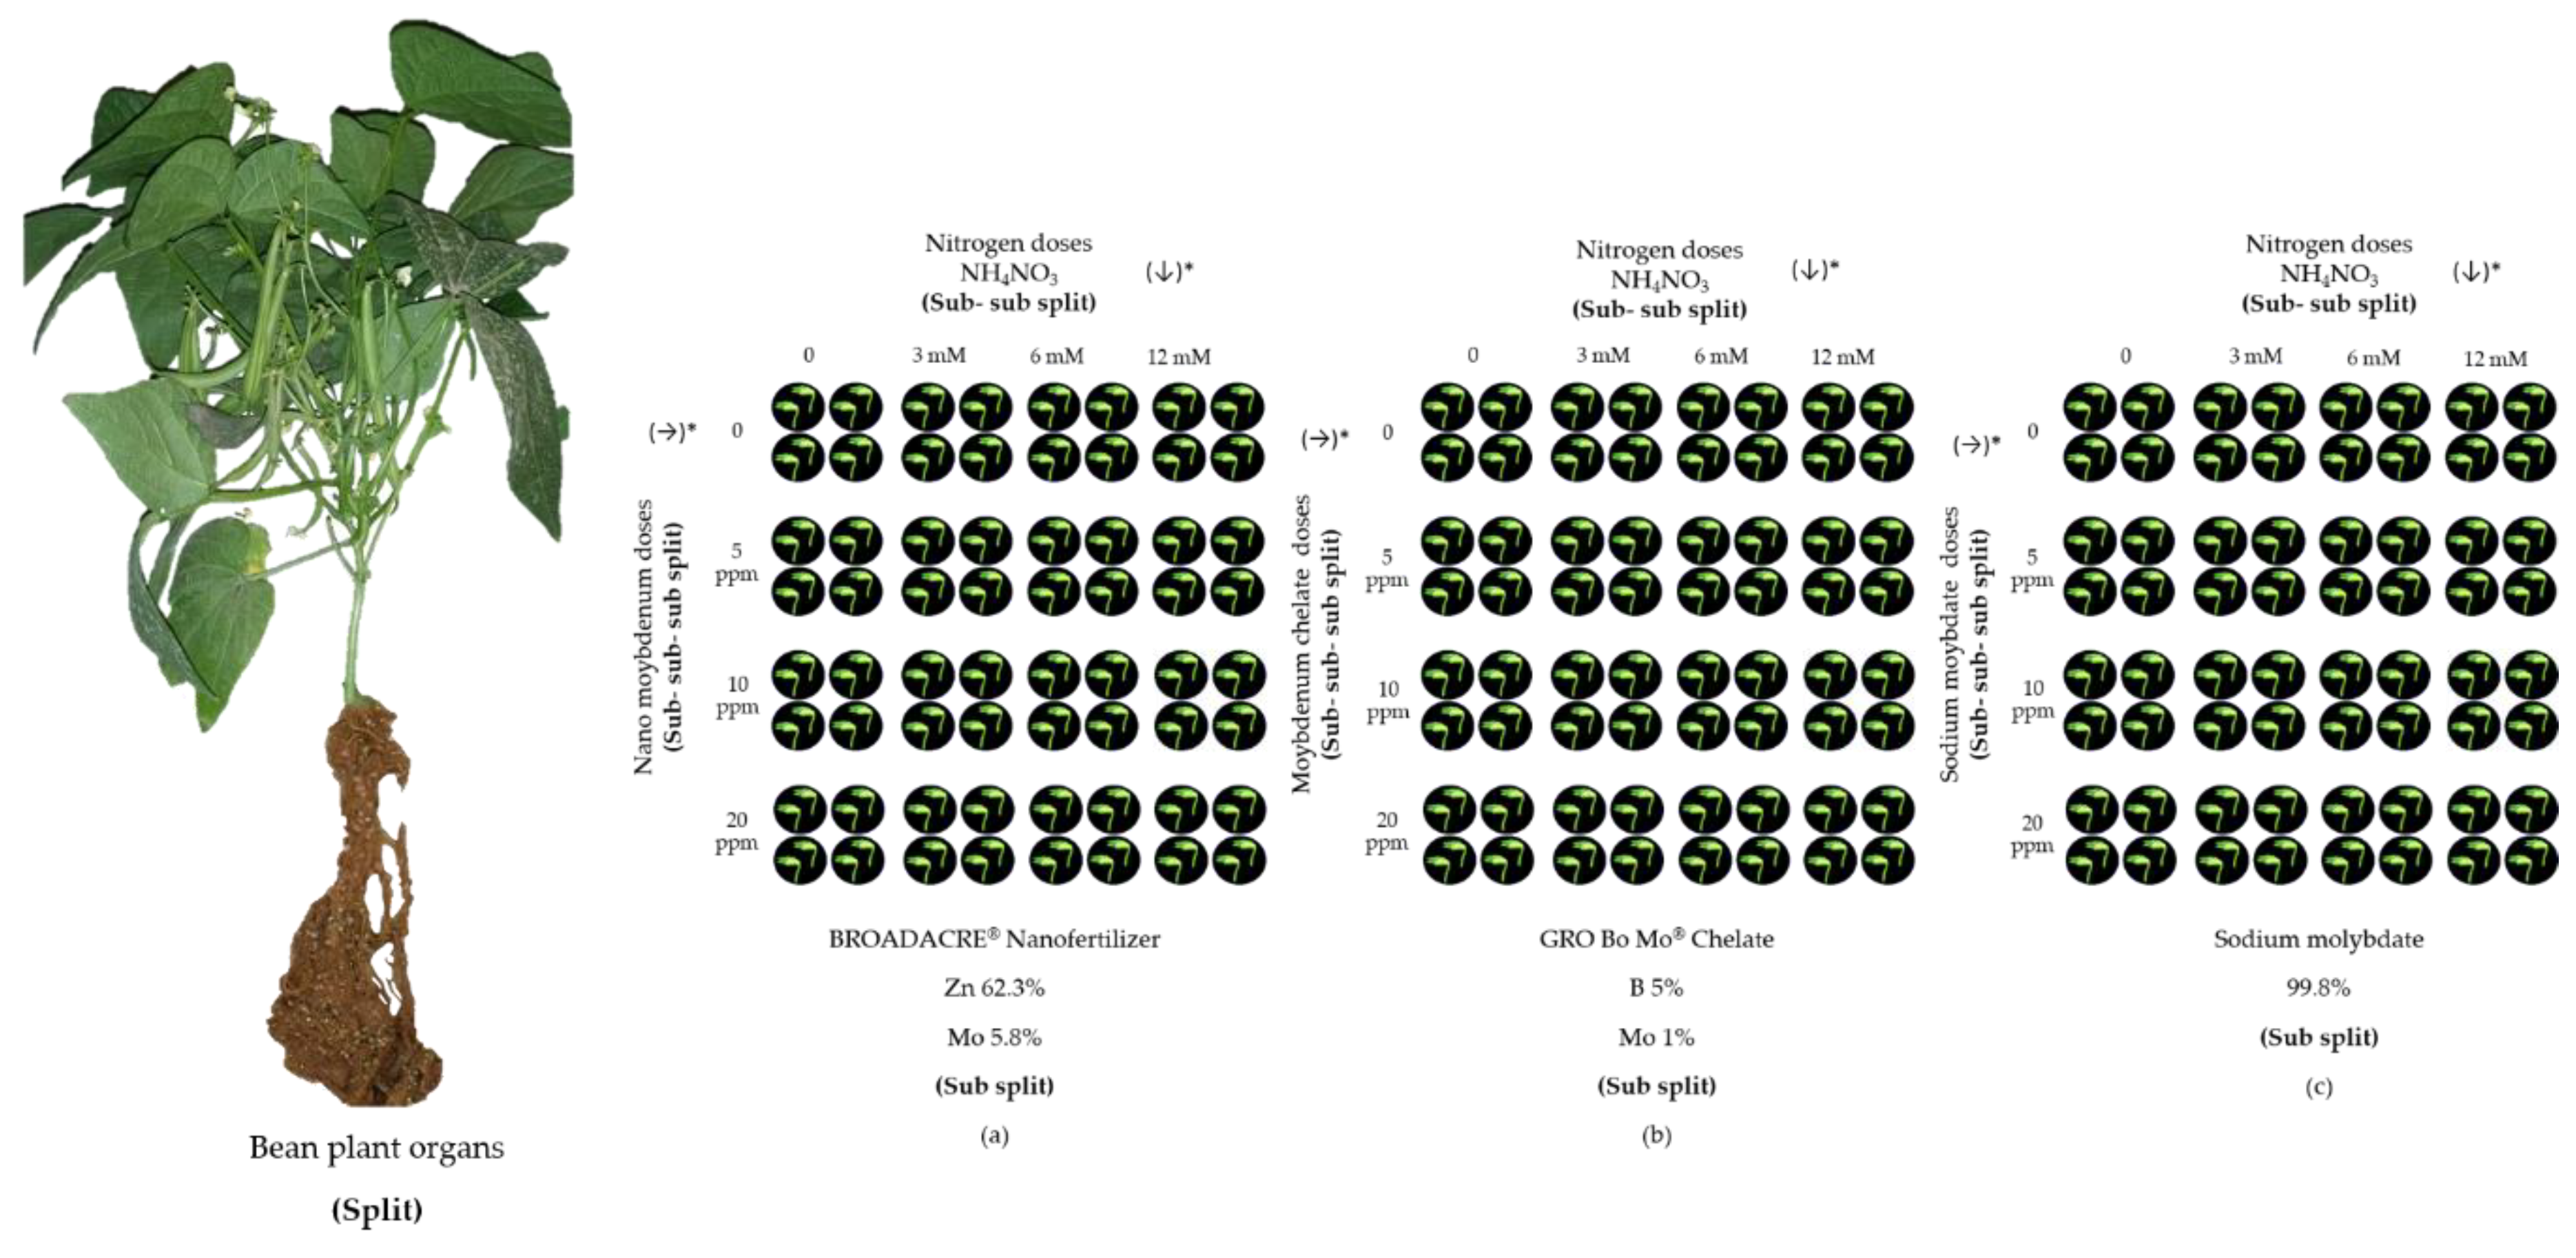
Figure 1.
Experimental design. Soil nitrogen fertilization supplemented with foliar molybdenum fertilization in green beans cv. Strike. The figure shows how the experiment was laid out inside the greenhouse. The organs of the plant were considered as Spit: leaves, stems, fruits and roots, (a) Sub split where nanofertilizer was applied, (b) Sub split where chelate was applied, (c) Sub split where sodium molybdate was applied. (↓)* Direction of application in columns of nitrogen doses, (→)* Direction of application in rows of molybdenum doses.
Figure 2.
Effect of edaphic nitrogen fertilization, complemented with foliar fertilization with molybdenum nanofertilizer on nitrogen use efficiency (NUE).
Figure 2.
Effect of edaphic nitrogen fertilization, complemented with foliar fertilization with molybdenum nanofertilizer on nitrogen use efficiency (NUE).
Figure 3.
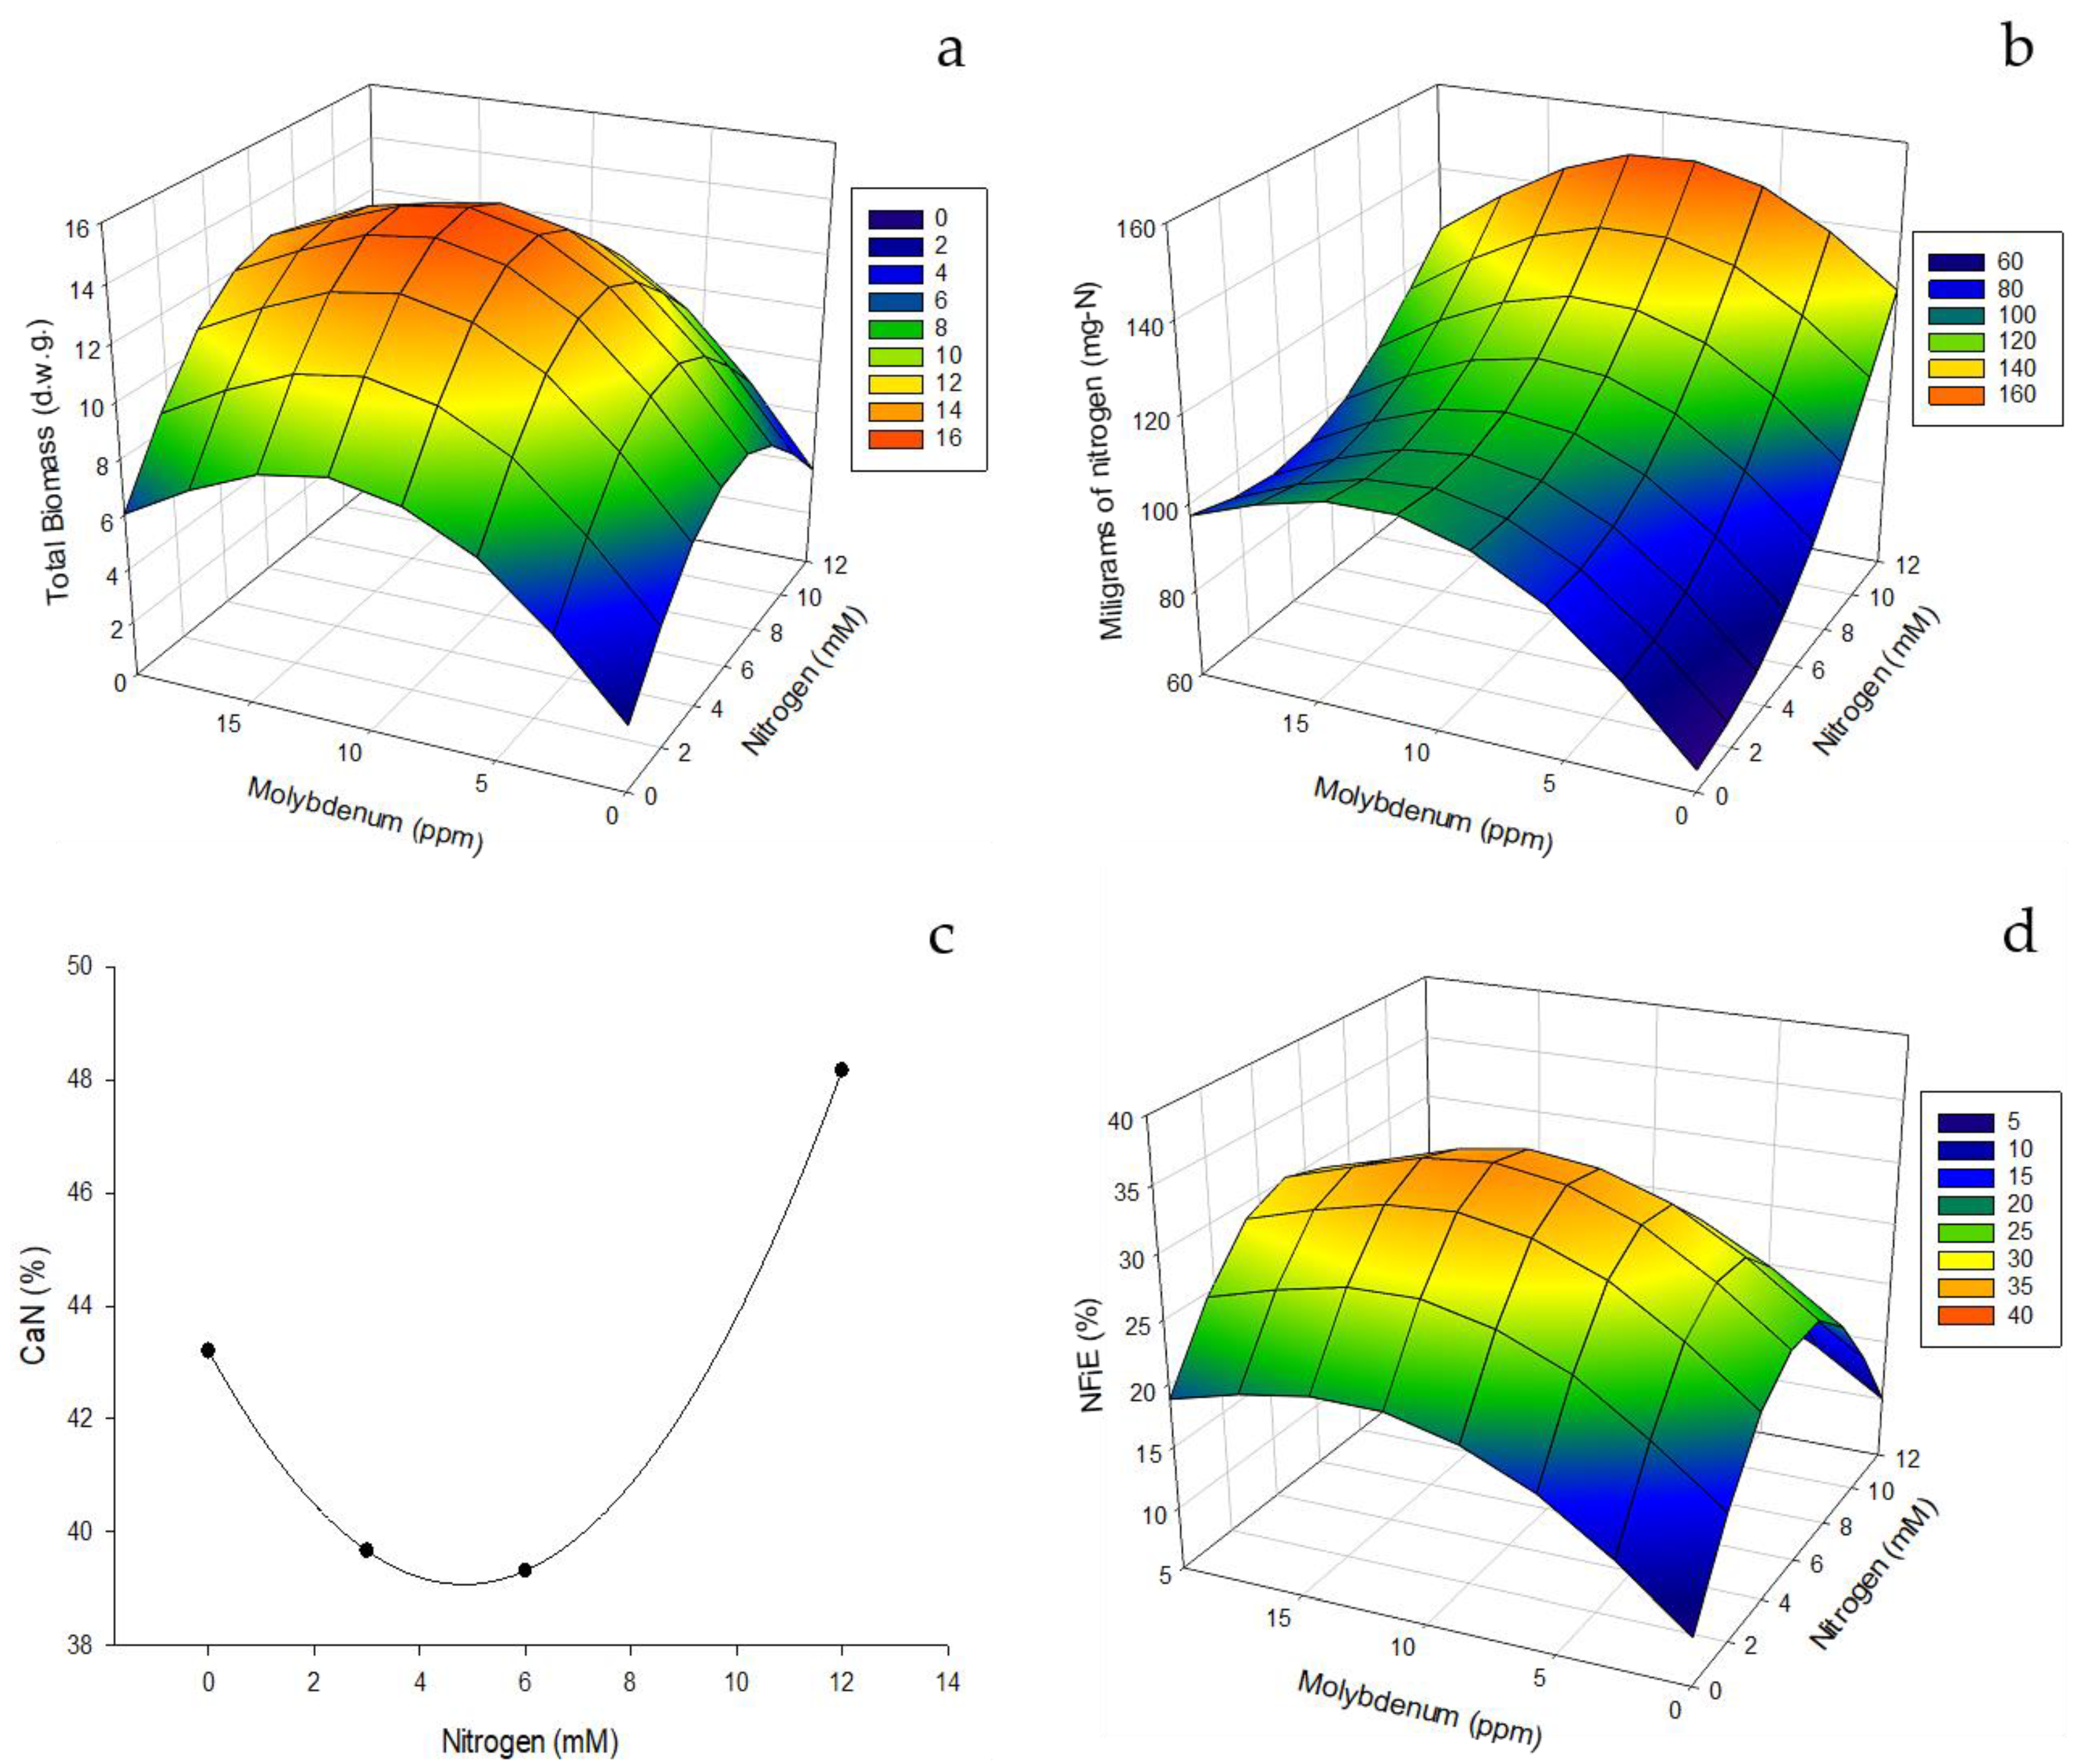
Effect of edaphic nitrogen fertilization, complemented with foliar fertilization with molybdenum nanofertilizer on NUE indices for biomass formation. (a) Total foliage biomass (grams dry weight). (b) Milligrams of nitrogen needed to form the leaves of the plant (mg-N). (c) Quantity of nitrogen to form the leaves (CaNl). (d)Nitrogen fixation efficiency (NFiE).
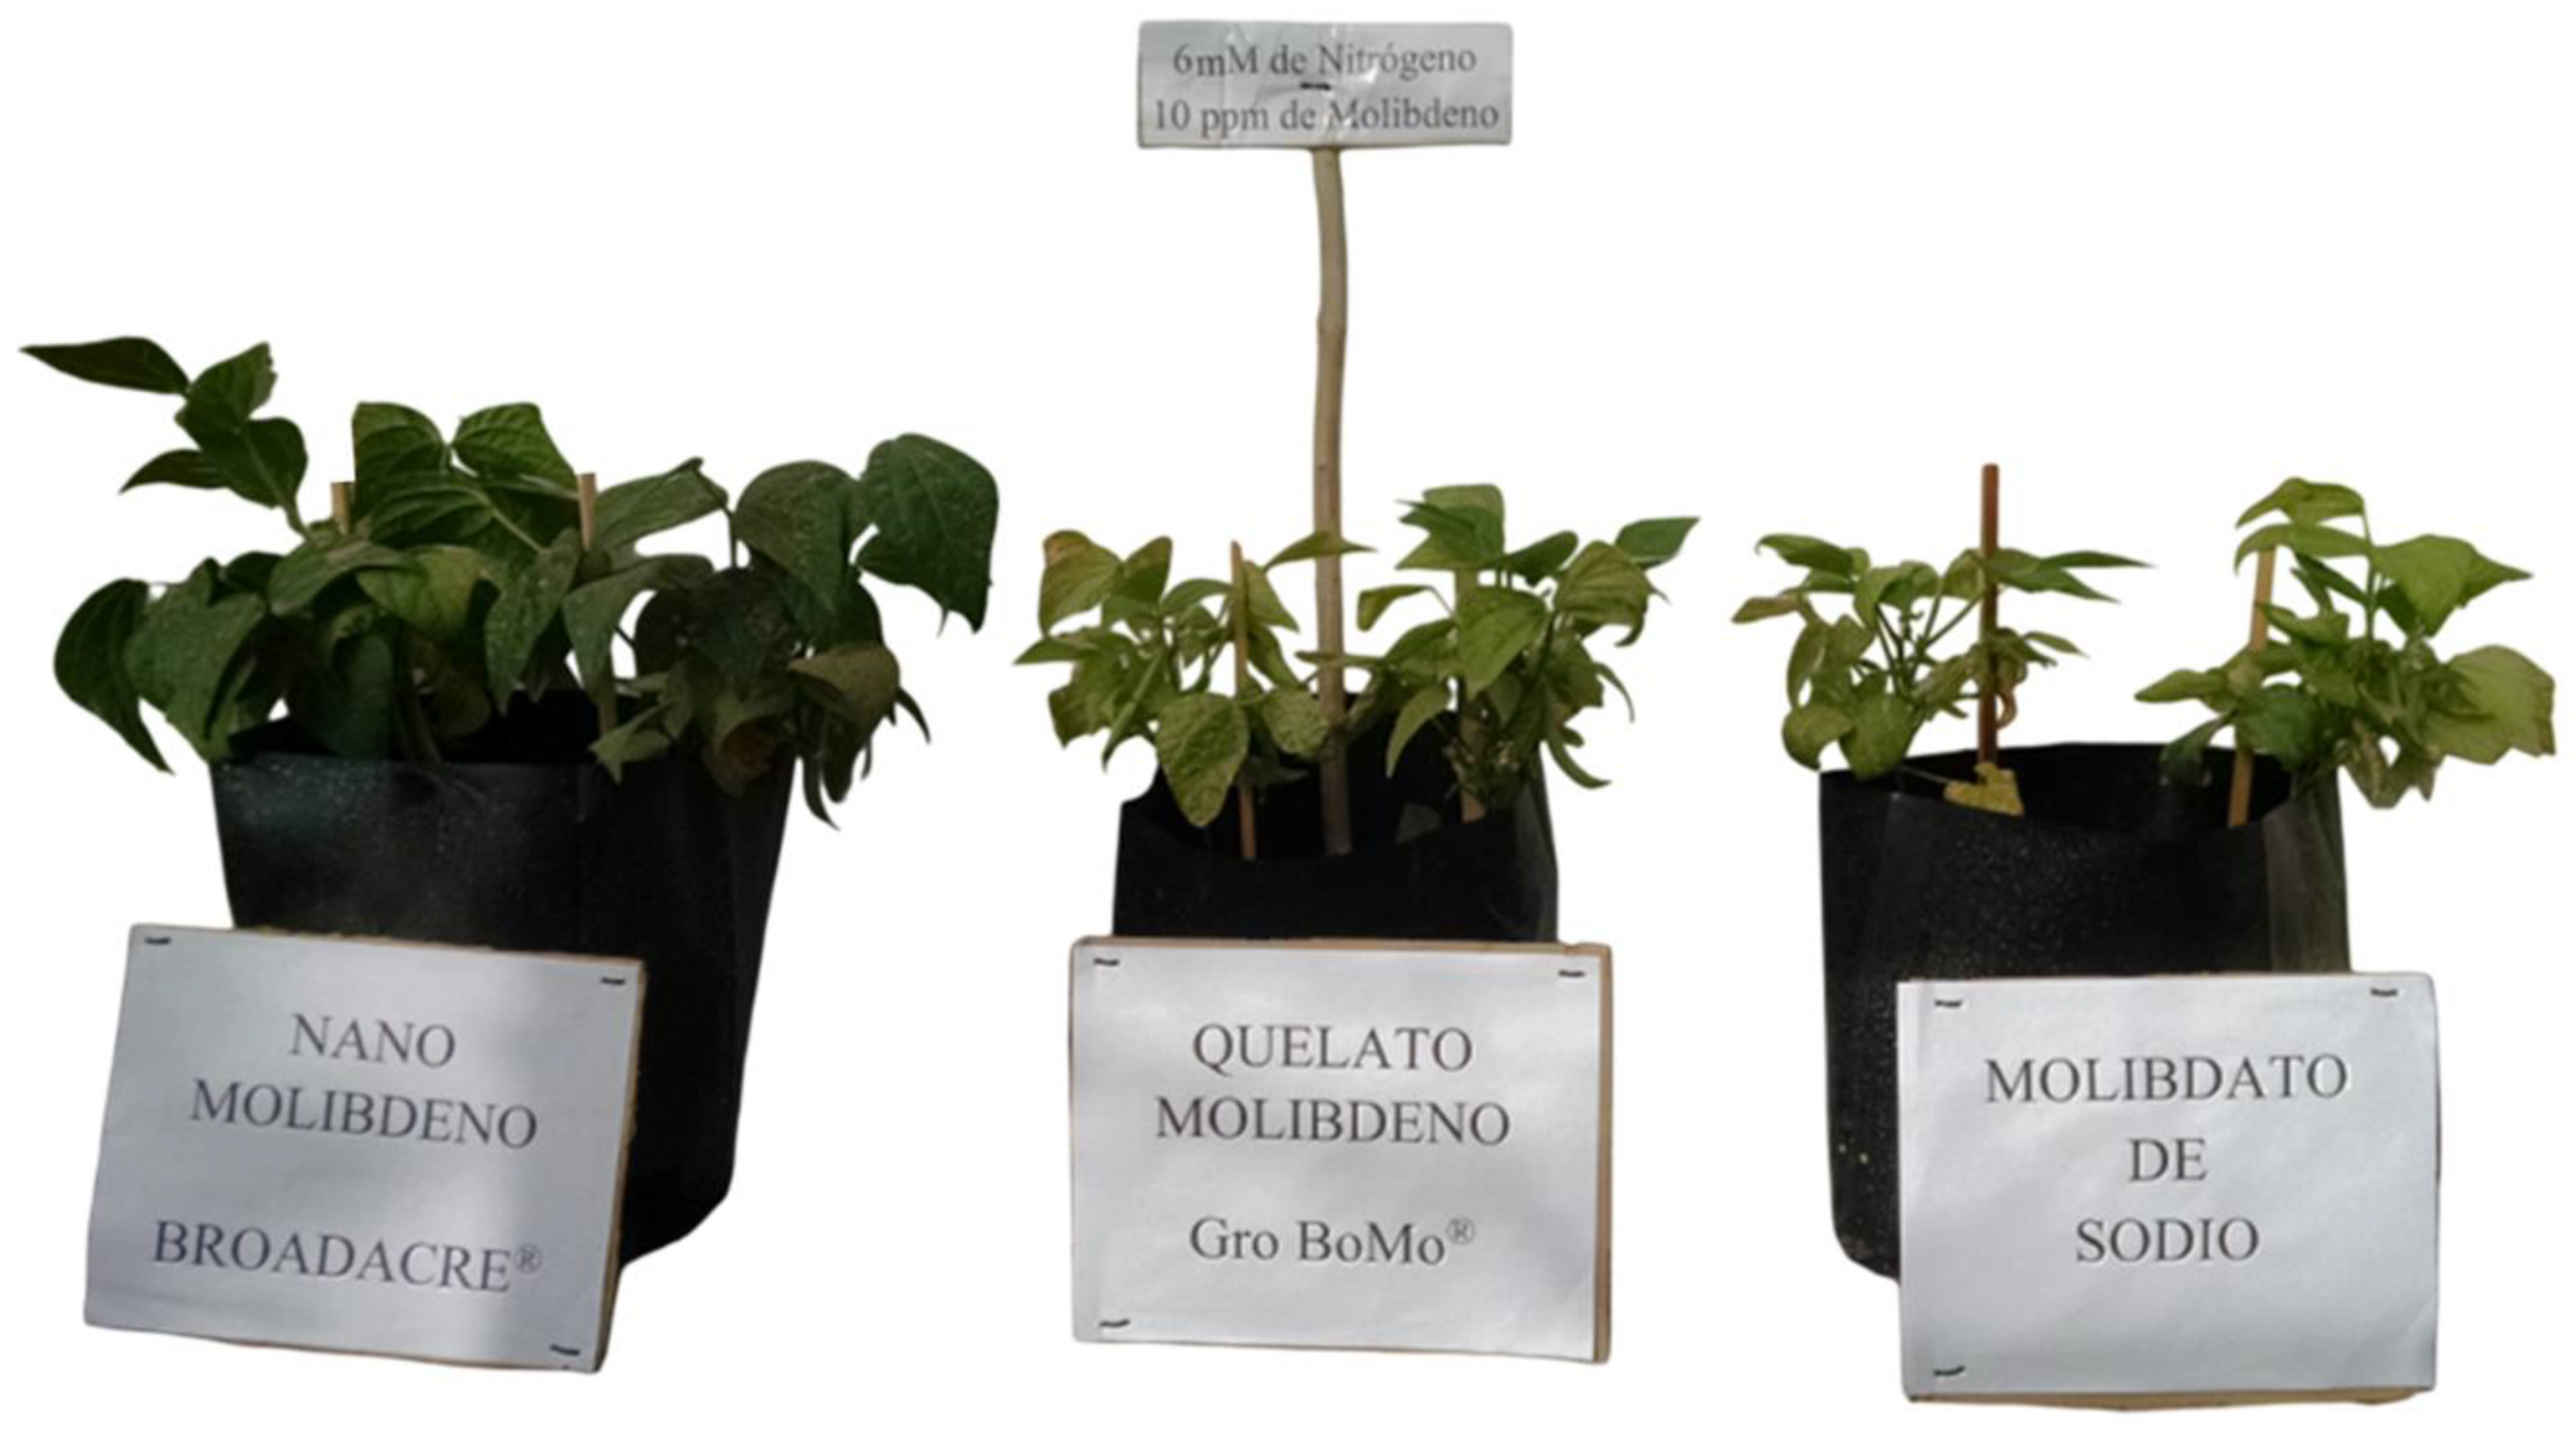
Figure 4.
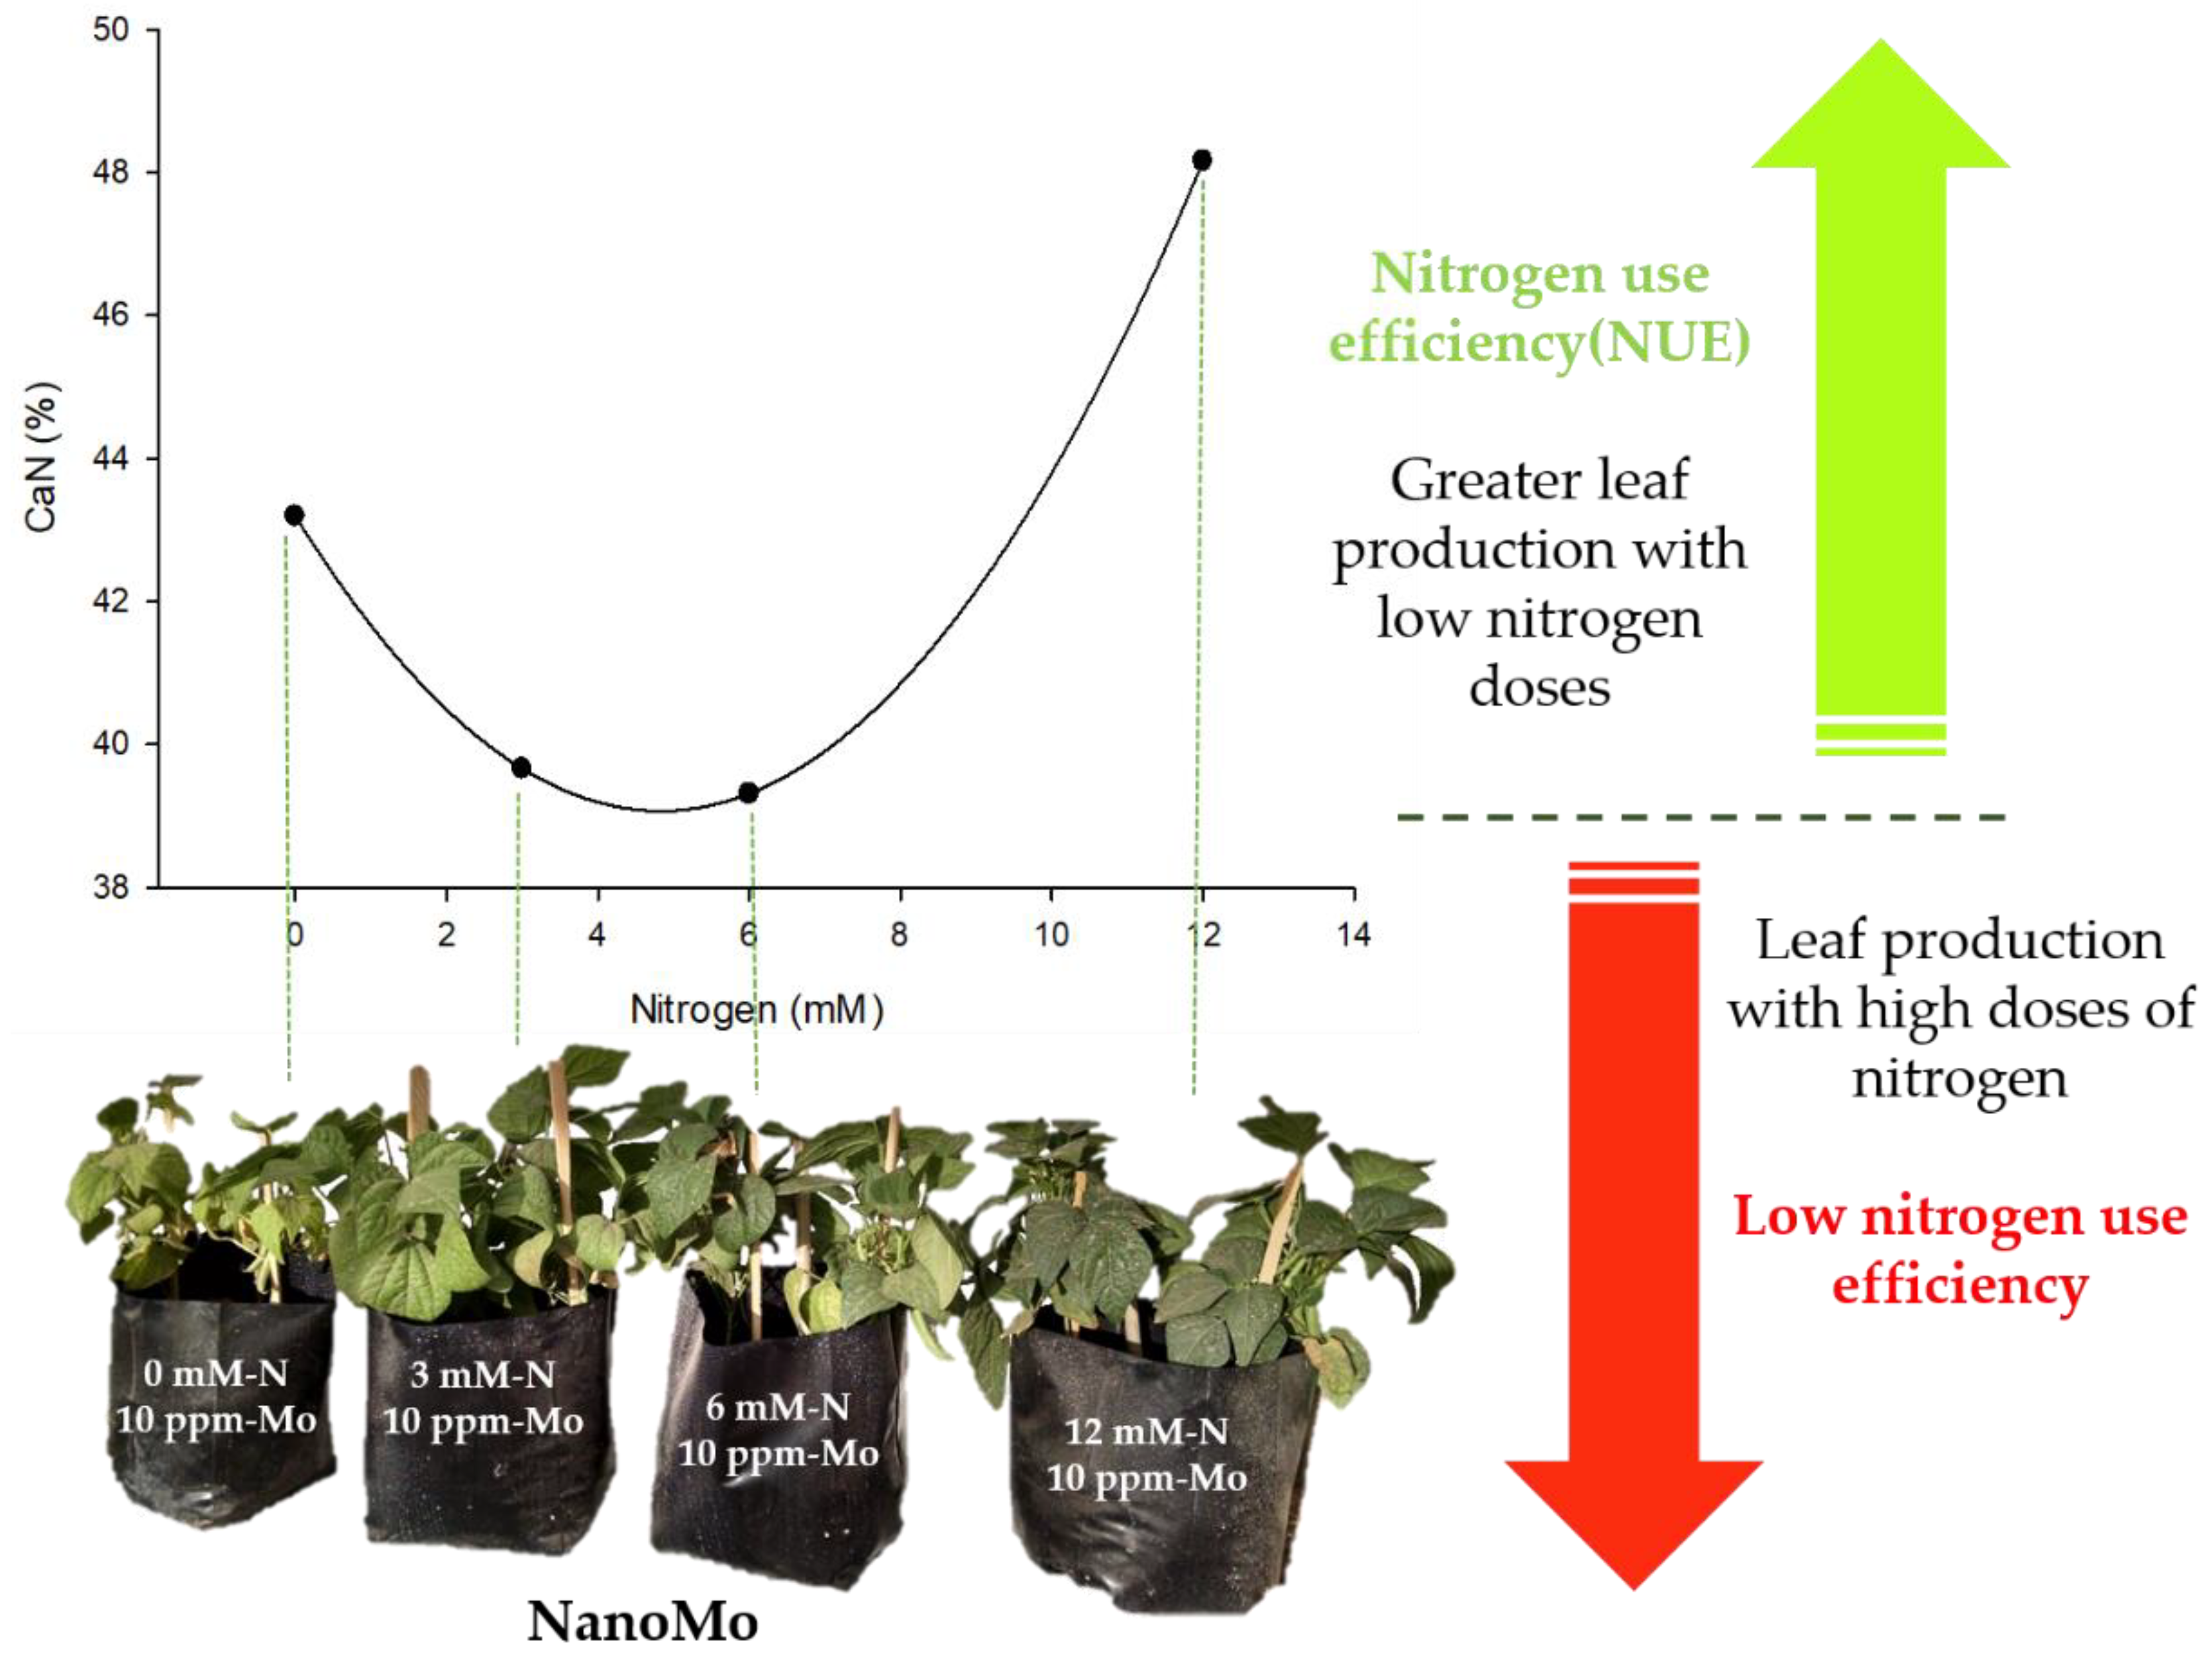
Nitrogen use efficiency in biomass production as an effect of foliar application of NanoMo. The image shows how the combination of low doses of nitrogen (3mM) and low doses of NanoMo (10 ppm) favors biomass production, increasing productivity efficiency per unit of fertilizer applied.
Figure 4.
Nitrogen use efficiency in biomass production as an effect of foliar application of NanoMo. The image shows how the combination of low doses of nitrogen (3mM) and low doses of NanoMo (10 ppm) favors biomass production, increasing productivity efficiency per unit of fertilizer applied.
Figure 4.
Effect of edaphic nitrogen fertilization, complemented with foliar fertilization with molybdenum nanofertilizer on NUE indices for stem formation. (a) Total stem biomass (grams dry weight). (b) Milligrams of nitrogen needed to form the plant stems (mg-Ns). (c) Amount of nitrogen to form the stems of the plant (CaNs). (d) Nitrogen conduction efficiency (NCoE).
Figure 5.
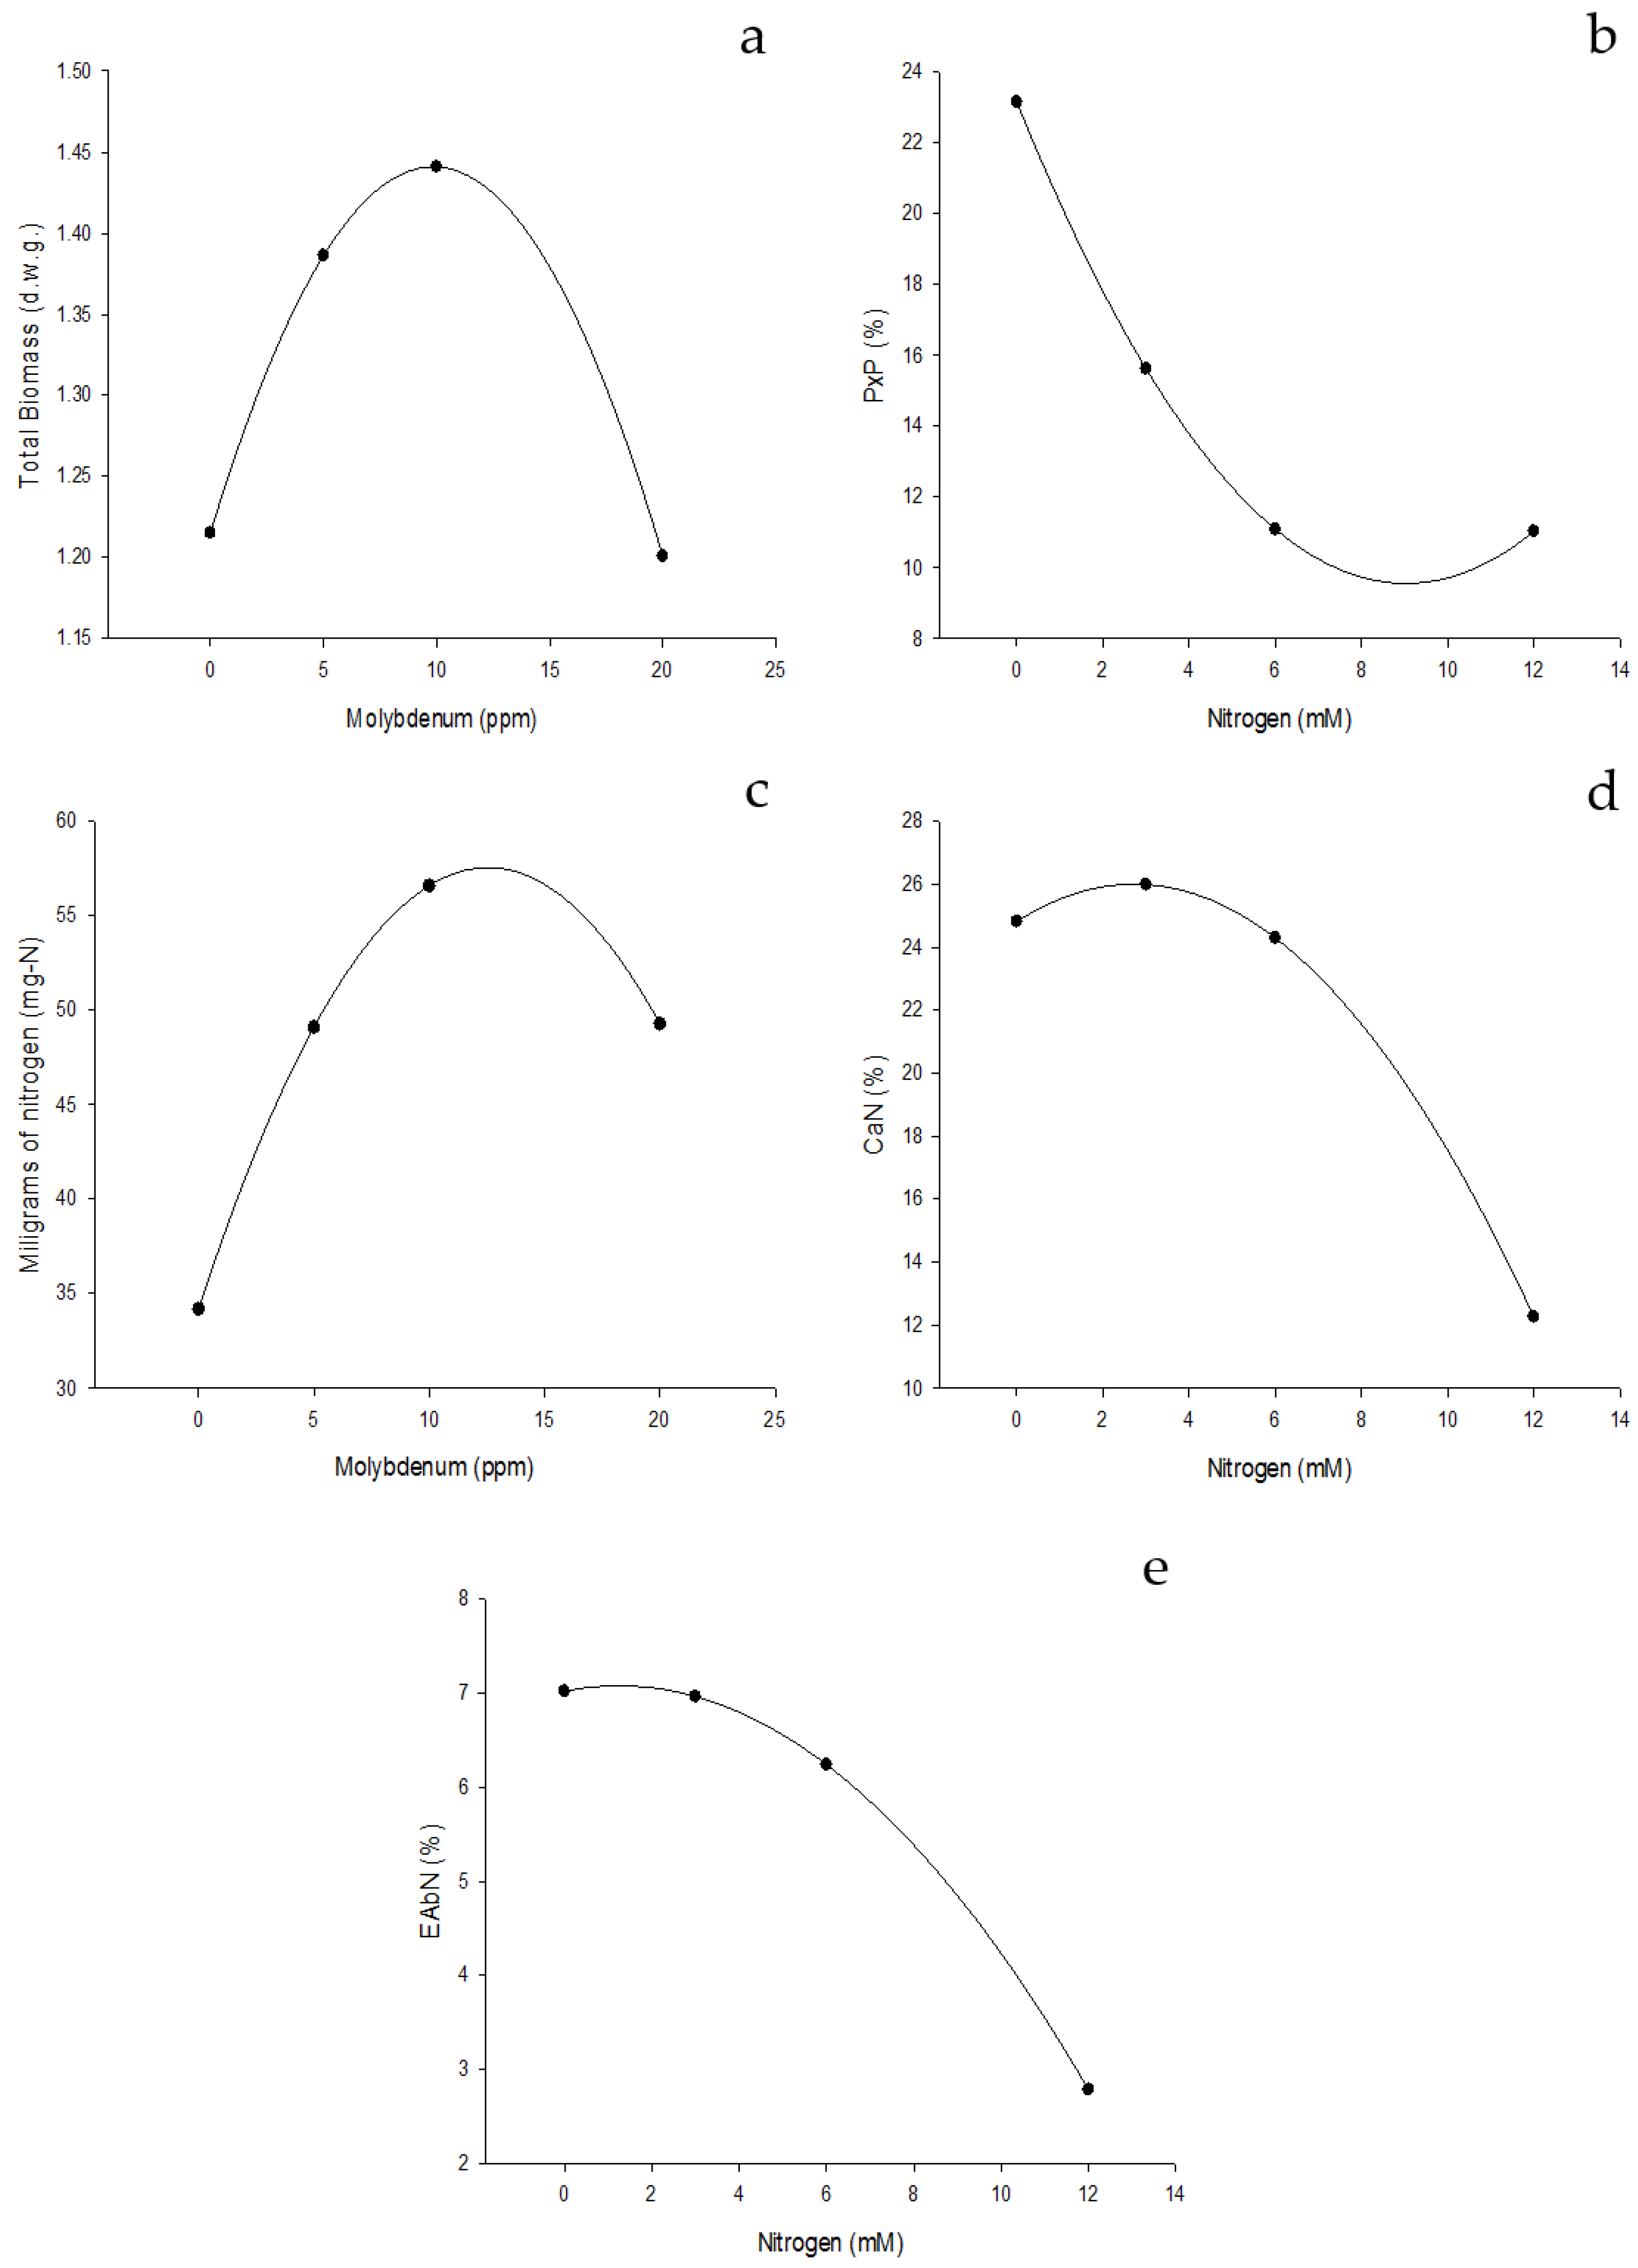
Effect of edaphic nitrogen fertilization, complemented with foliar fertilization with molybdenum nanofertilizer on NUE indices for root formation. (a) Total biomass (grams of dry weight). (b) Percentage by weight, which represents the root of the total weight of the plant (%). (c) Milligrams of nitrogen needed to form the plant root (mg-N). (d) Amount of nitrogen to form the root of the plant (CaNr). (e) Nitrogen absorption efficiency (NAbE).
Figure 6.
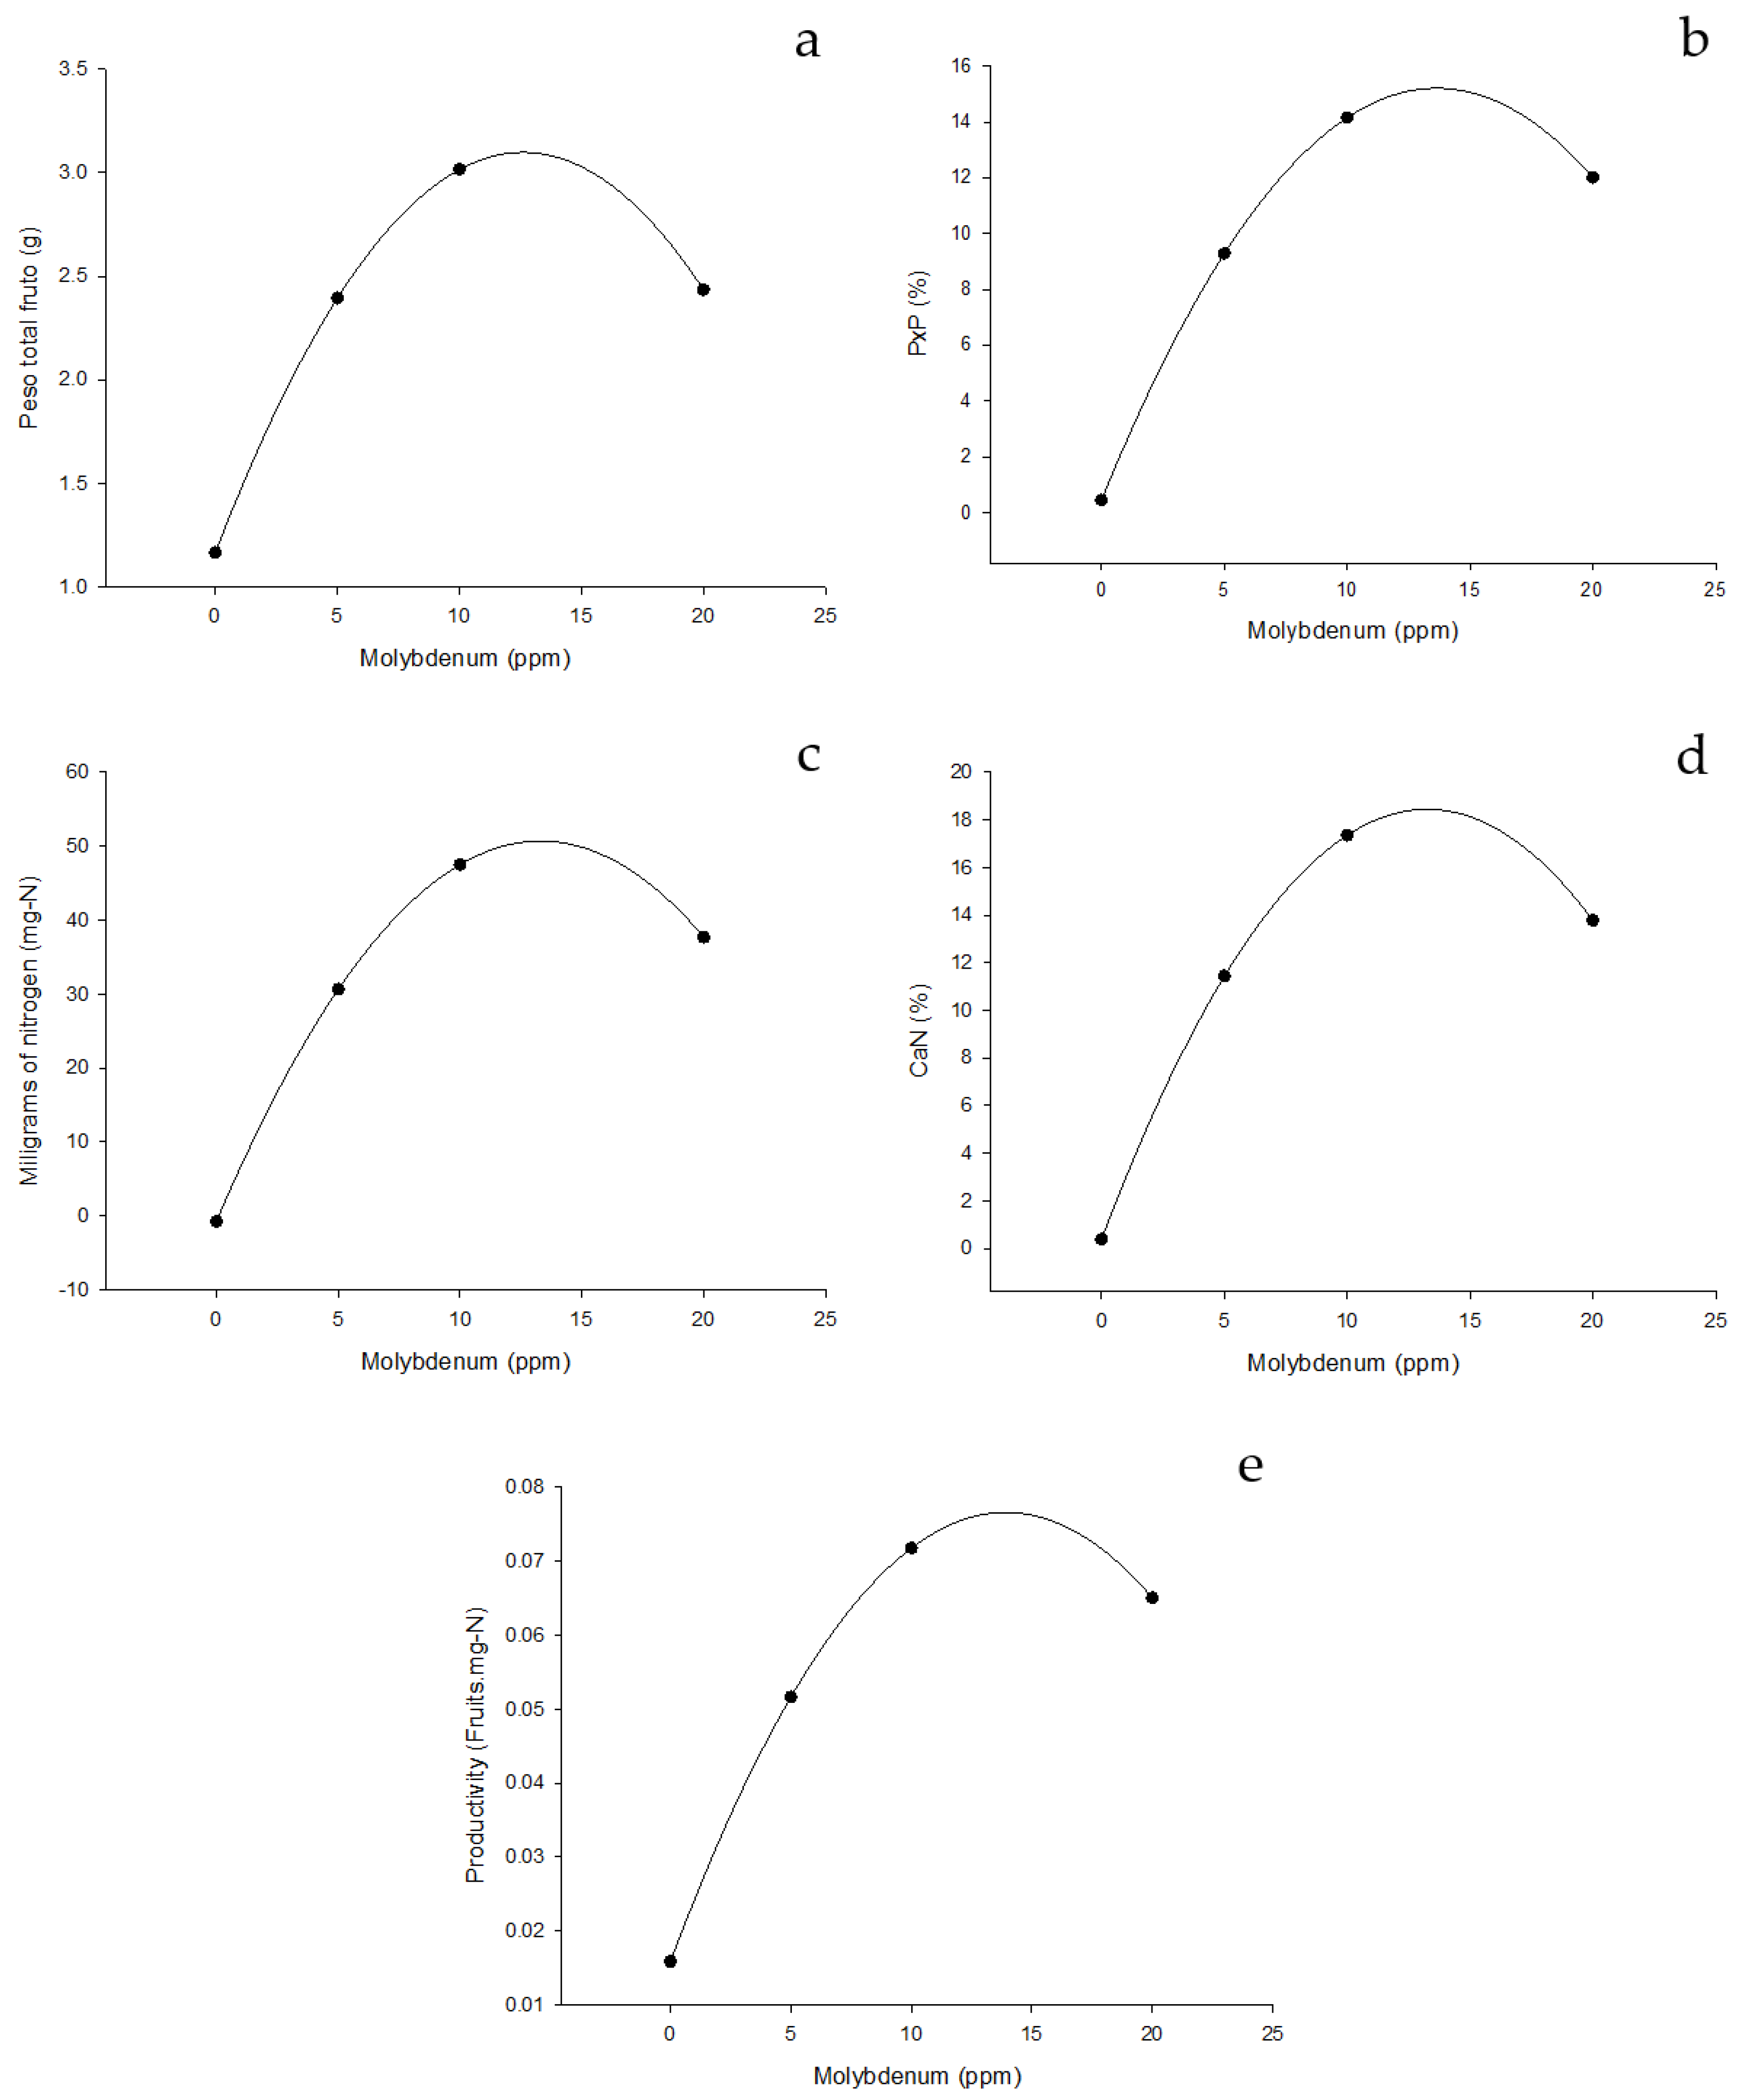
Effect of edaphic nitrogen fertilization, complemented with foliar fertilization with molybdenum nanofertilizer on NUE indices for fruit formation. (a) Total biomass (grams of dry weight). (b) Percentage by weight, which represents the fruit of the total weight of the plant (%) (c) Milligrams of nitrogen required for fruit formation (mg-N). (d) Amount of nitrogen to form the fruits of the plant (CaNf). (e) Productivity (Fruits.mg-N).
Figure 7.
Effect of NanoMo on Nitrogen Use Efficiency in green beans cv. Strike on the different NUE indices.
Figure 7.
Effect of NanoMo on Nitrogen Use Efficiency in green beans cv. Strike on the different NUE indices.
Figure 8.
Effect of NanoMo on NUE in green beans cv. Strike on the growth and development of leaves.
Figure 8.
Effect of NanoMo on NUE in green beans cv. Strike on the growth and development of leaves.
Figure 10.
Effect of NanoMo on NUE in green beans cv. Strike on root growth and development.
Figure 10.
Effect of NanoMo on NUE in green beans cv. Strike on root growth and development.
Table 1.
Effect of edaphic nitrogen fertilization supplemented with foliar fertilization of molybdenum nanofertilizer on leaf NUE indices.
Table 1.
Effect of edaphic nitrogen fertilization supplemented with foliar fertilization of molybdenum nanofertilizer on leaf NUE indices.
| Indices NUE (Leaf) |
|---|
| |
PTl |
PxPl |
mg-Nl |
CaNl |
NFiE |
| Mo Source |
<0.0001U
|
<0.0001 |
0.0008 |
0.0719 |
0.6624 |
| Nano Mo |
8.93 aV |
52.50 a |
103.92 a |
42.58 a |
21.54 a |
| Mo Chelate |
5.21 b |
54.05 a |
77.46 b |
48.06 a |
23.49 a |
| Na Molybdate |
5.64 b |
43.52 b |
51.81 c |
40.44 a |
22.24 a |
| MSD |
1.35W
|
3.91 |
24.51 |
8.19 |
5.95 |
| NitrogenX |
<0.0001 |
0.0649 |
<0.0001 |
0.0064 |
<0.0001 |
| 0 |
4.74 c |
46.25 b |
51.76 b |
40.36 b |
30.90 a |
| 3 |
7.22 ab |
51.17 ab |
53.65 b |
39.71 b |
27.11 a |
| 6 |
8.20 a |
49.32 ab |
101.23 a |
44.14 ab |
17.27 b |
| 12 |
6.19 bc |
53.35 a |
104.26 a |
50.57 a |
14.42 b |
| MSD |
1.62 |
7.07 |
15.64 |
8.54 |
7.49 |
| MolybdenumY
|
<0.0001 |
0.1327 |
0.9602 |
0.1924 |
0.0009 |
| 0 |
5.34 c |
50.34 a |
75.89 a |
44.68 a |
17.86 b |
| 5 |
6.07 bc |
52.35 a |
79.30 a |
46.80 a |
22.43 ab |
| 10 |
7.76 a |
47.88 a |
77.49 a |
40.99 a |
26.77 a |
| 20 |
7.20 ab |
49.56 a |
78.30 a |
43.30 a |
22.64 ab |
| MSD |
1.16 |
4.94 |
16.90 |
7.48 |
5.51 |
| SoMo*N |
0.0817 |
0.5016 |
0.0001 |
0.0926 |
<0.0001 |
| SoMo*Mo |
<0.0001 |
0.9408 |
0.0025 |
0.3620 |
0.0378 |
| N*Mo |
0.0675 |
0.2929 |
0.0256 |
0.0415 |
0.0327 |
| SoMo*N*Mo |
0.2956 |
0.0519 |
0.0085 |
0.0022 |
<0.0001 |
| µ |
6.59 |
50.02 |
77.73 |
43.69 |
22.42 |
| C.V. |
33.08 |
18.57 |
40.83 |
32.17 |
46.18 |
| R2
|
0.7872 |
0.6217 |
0.7704 |
0.5990 |
0.7705 |
Table 2.
Effect of edaphic nitrogen fertilization supplemented with foliar fertilization of molybdenum nanofertilizer on NUE indices in stems.
Table 2.
Effect of edaphic nitrogen fertilization supplemented with foliar fertilization of molybdenum nanofertilizer on NUE indices in stems.
| Indices NUE (Stems) |
| |
PTs |
PxPs |
mg-Ns |
CaNs |
NCoE |
| Mo Source |
0.0004U
|
0.2506 |
0.0003 |
0.4423 |
0.0074 |
| Nano Mo |
4.32 aV |
23.29 a |
58.91 a |
24.82 a |
9.52 b |
| Mo Chelate |
2.44 c |
23.88 a |
45.49 b |
27.26 a |
9.89 b |
| Na Molybdate |
3.29 b |
25.53 a |
34.25 c |
26.24 a |
12.90 a |
| MSD |
0.80W
|
3.59 |
10.31 |
5.10 |
2.45 |
| NitrogenX |
0.0149 |
0.0104 |
<0.0001 |
<0.0001 |
<0.0001 |
| 0 |
2.68 b |
22.52 b |
24.23 b |
17.65 b |
14.47 a |
| 3 |
3.53 ab |
25.41 ab |
33.98 b |
26.79 a |
13.31 a |
| 6 |
4.10 a |
25.86 a |
62.06 a |
29.45 a |
9.07 b |
| 12 |
3.09 ab |
23.14 ab |
64.59 a |
30.55 a |
6.24 c |
| MSD |
1.15 |
2.98 |
14.04 |
5.53 |
1.73 |
| MolybdenumY
|
<0.0001 |
0.4451 |
0.1723 |
0.0065 |
0.0078 |
| 0 |
2.77 b |
25.39 a |
50.77 a |
29.29 a |
9.14 b |
| 5 |
2.85 b |
24.00 a |
47.76 a |
27.59 ab |
10.40 ab |
| 10 |
4.08 a |
23.57 a |
43.34 a |
22.77 b |
12.29 a |
| 20 |
3.70 a |
23.97 a |
42.99 a |
24.78 ab |
11.26 ab |
| MSD |
0.74 |
3.10 |
10.59 |
5.15 |
2.41 |
| SoMo*N |
0.6515 |
0.8421 |
0.0004 |
<0.0001 |
<0.0001 |
| SoMo*Mo |
<0.0001 |
0.4362 |
0.2316 |
0.0287 |
0.9227 |
| N*Mo |
0.0857 |
0.3859 |
0.0111 |
0.1252 |
0.4571 |
| SoMo*N*Mo |
0.2070 |
0.8777 |
0.0022 |
0.0001 |
0.1112 |
| µ |
3.35 |
24.23 |
46.21 |
26.11 |
10.77 |
| C.V. |
41.40 |
24.03 |
43.01 |
37.06 |
42.09 |
| R2
|
0.7113 |
0.4407 |
0.7834 |
0.6900 |
0.7300 |
Table 3.
Effect of edaphic nitrogen fertilization supplemented with foliar fertilization of molybdenum nanofertilizer on NUE indices in roots.
Table 3.
Effect of edaphic nitrogen fertilization supplemented with foliar fertilization of molybdenum nanofertilizer on NUE indices in roots.
| Indices NUE (Roots) |
|---|
| |
PTr |
WxWr |
mg-Nr |
CaNr |
NAbE |
| Mo Source |
0.0141U
|
<0.0001 |
<0.0001 |
0.3945 |
<0.0001 |
| Nano Mo |
1.31 aV |
15.22 c |
47.30 a |
21.84 a |
5.75 c |
| Mo Chelate |
0.97 b |
18.74 b |
21.91 b |
19.42 a |
8.40 b |
| Na Molybdate |
1.28 a |
24.22 a |
21.83 b |
21.66 a |
13.24 a |
| MSD |
0.27W
|
3.00 |
7.52 |
5.24 |
2.39 |
| NitrogenX |
0.0006 |
<0.0001 |
0.0002 |
<0.0001 |
<0.0001 |
| 0 |
1.31 a |
25.80 a |
31.75 a |
35.50 a |
16.70 a |
| 3 |
1.34 a |
18.39 b |
32.14 a |
23.40 b |
9.30 b |
| 6 |
1.34 a |
18.26 b |
36.09 a |
16.02 c |
6.36 c |
| 12 |
0.85 b |
15.13 b |
21.40 b |
8.98 d |
4.15 c |
| MSD |
0.31 |
3.39 |
7.95 |
5.87 |
2.29 |
| MolybdenumY
|
0.0995 |
0.8598 |
0.1130 |
0.2469 |
0.0318 |
| 0 |
1.12 a |
20.11 a |
28.25 a |
19.98 a |
7.57 b |
| 5 |
1.05 a |
19.34 a |
27.97 a |
19.19 a |
8.54 ab |
| 10 |
1.31 a |
19.40 a |
33.34 a |
23.04 a |
10.54 a |
| 20 |
1.26 a |
18.73 a |
31.83 a |
21.70 a |
9.88 ab |
| MSD |
0.30 |
4.14 |
6.86 |
5.39 |
2.81 |
| SoMo*N |
0.1897 |
0.0274 |
0.5581 |
<0.0001 |
<0.0001 |
| SoMo*Mo |
0.0719 |
0.1580 |
0.0004 |
0.3757 |
0.4295 |
| N*Mo |
0.0264 |
0.6066 |
0.0079 |
0.0027 |
0.3090 |
| SoMo*N*Mo |
0.0006 |
0.0922 |
0.0001 |
0.0403 |
0.2646 |
| µ |
1.19 |
19.39 |
30.35 |
20.98 |
9.13 |
| C.V. |
48.65 |
40.10 |
42.49 |
48.24 |
57.94 |
| R2
|
0.6052 |
0.6114 |
0.7714 |
0.7642 |
0.7653 |
Table 4.
Effect of edaphic nitrogen fertilization supplemented with foliar fertilization of molybdenum nanofertilizer on NUE indices in fruit.
Table 4.
Effect of edaphic nitrogen fertilization supplemented with foliar fertilization of molybdenum nanofertilizer on NUE indices in fruit.
| Indices NUE (Fruit) |
|---|
| |
PTf |
WxWf |
mg-Nf |
CaNf |
Productivity |
| Mo Source |
0.0020U
|
0.0145 |
0.0923 |
0.0334 |
0.0059 |
| Nano Mo |
2.25 aV |
8.97 a |
28.78 a |
10.73 ab |
0.0510 a |
| Mo Chelate |
1.22 b |
3.31 b |
11.45 a |
5.25 b |
0.0280 b |
| Na Molybdate |
1.85 a |
6.72 ab |
25.49 a |
12.00 a |
0.0407 ab |
| MSD |
0.55W
|
4.24 |
20.5 |
6.28 |
0.0147 |
| NitrogenX |
0.5207 |
0.3797 |
0.0476 |
0.5260 |
0.0005 |
| 0 |
1.62 a |
5.41 a |
7.91 a |
6.47 a |
0.0543 a |
| 3 |
1.72 a |
5.01 a |
15.76 a |
10.09 a |
0.0490 a |
| 6 |
2.05 a |
6.54 a |
29.40 a |
10.38 a |
0.0356 ab |
| 12 |
1.70 a |
8.36 a |
34.56 a |
10.37 a |
0.0209 b |
| MSD |
0.84 |
5.62 |
27.33 |
8.47 |
0.0203 |
| MolybdenumY
|
0.0001 |
0.0030 |
0.0095 |
0.0030 |
0.0008 |
| 0 |
1.43 bc |
1.18 b |
13.73 b |
6.04 b |
0.0229 b |
| 5 |
1.39 c |
4.30 b |
12.80 b |
6.40 b |
0.0357 ab |
| 10 |
2.28 a |
9.13 a |
33.16 a |
13.19 a |
0.0524 a |
| 20 |
1.99 ab |
7.72 ab |
27.93 ab |
11.68 ab |
0.0488 a |
| MSD |
0.58 |
1.13 |
18.82 |
6.05 |
0.0201 |
| SoMo*N |
0.7188 |
0.5879 |
0.6899 |
0.8514 |
0.0011 |
| SoMo*Mo |
0.0097 |
0.0011 |
0.0224 |
0.0048 |
0.0094 |
| N*Mo |
0.3347 |
0.7546 |
0.5063 |
0.9849 |
0.2249 |
| SoMo*N*Mo |
0.1443 |
0.9891 |
0.9834 |
0.9164 |
0.0687 |
| µ |
1.77 |
6.33 |
21.91 |
9.33 |
0.03 |
| C.V. |
61.29 |
122.40 |
161.29 |
121.71 |
94.54 |
| R2
|
0.62 |
0.56 |
0.56 |
0.54 |
0.61 |
