Submitted:
02 July 2024
Posted:
03 July 2024
You are already at the latest version
Abstract
Keywords:
1. Introduction
2. Results
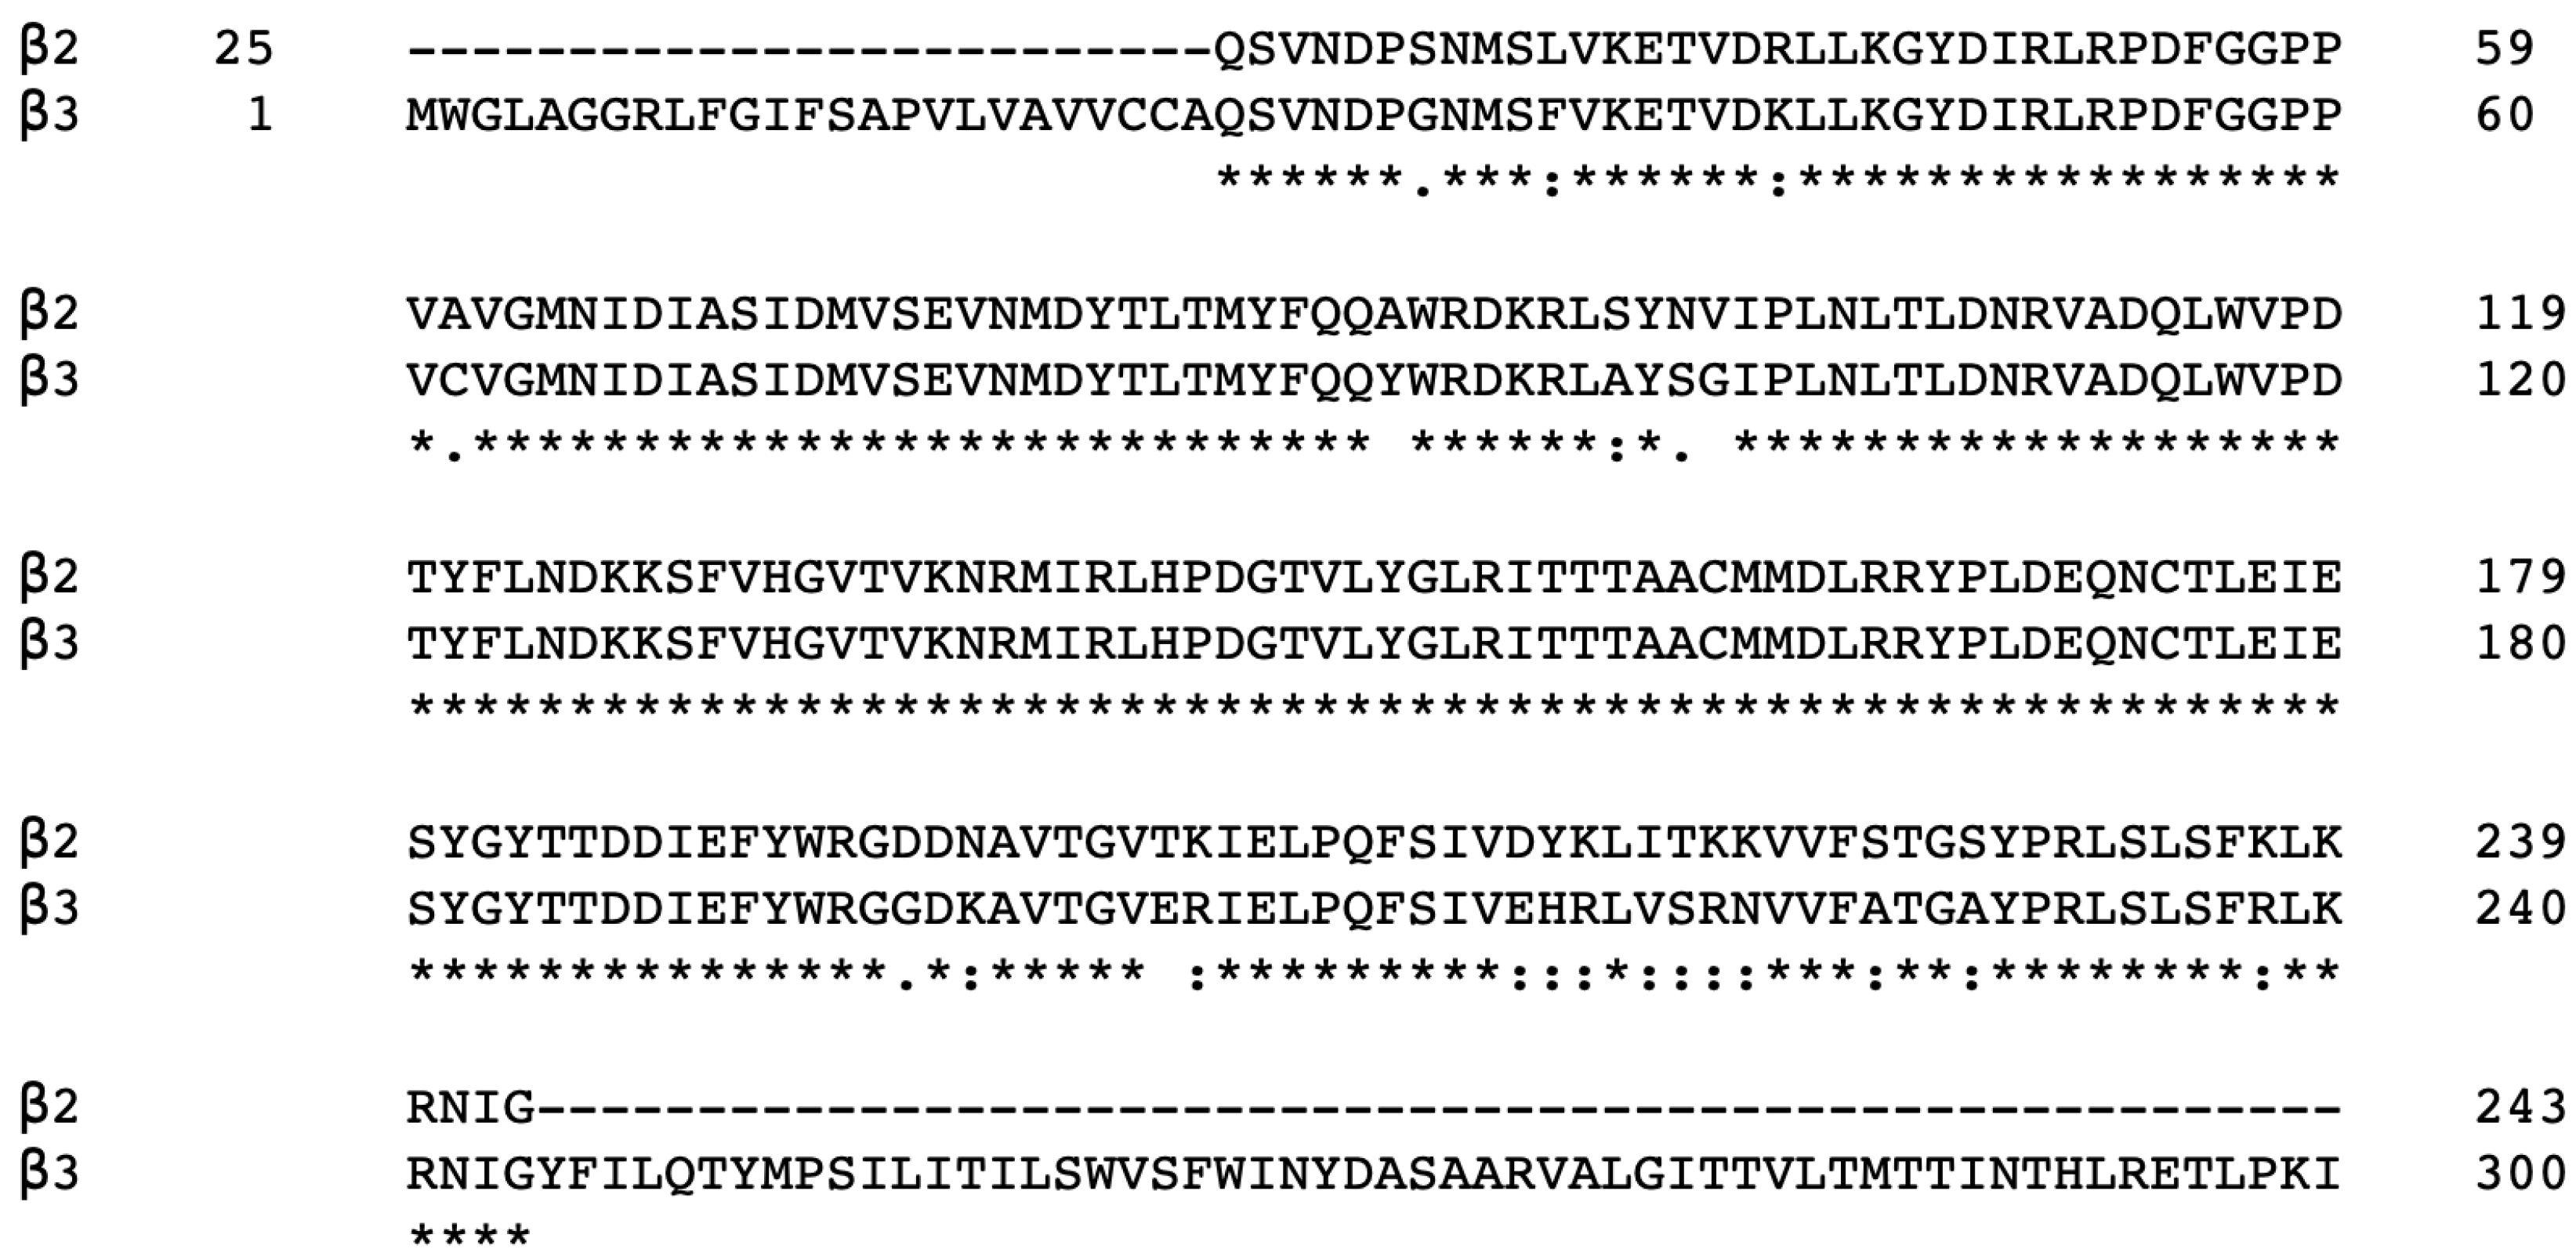
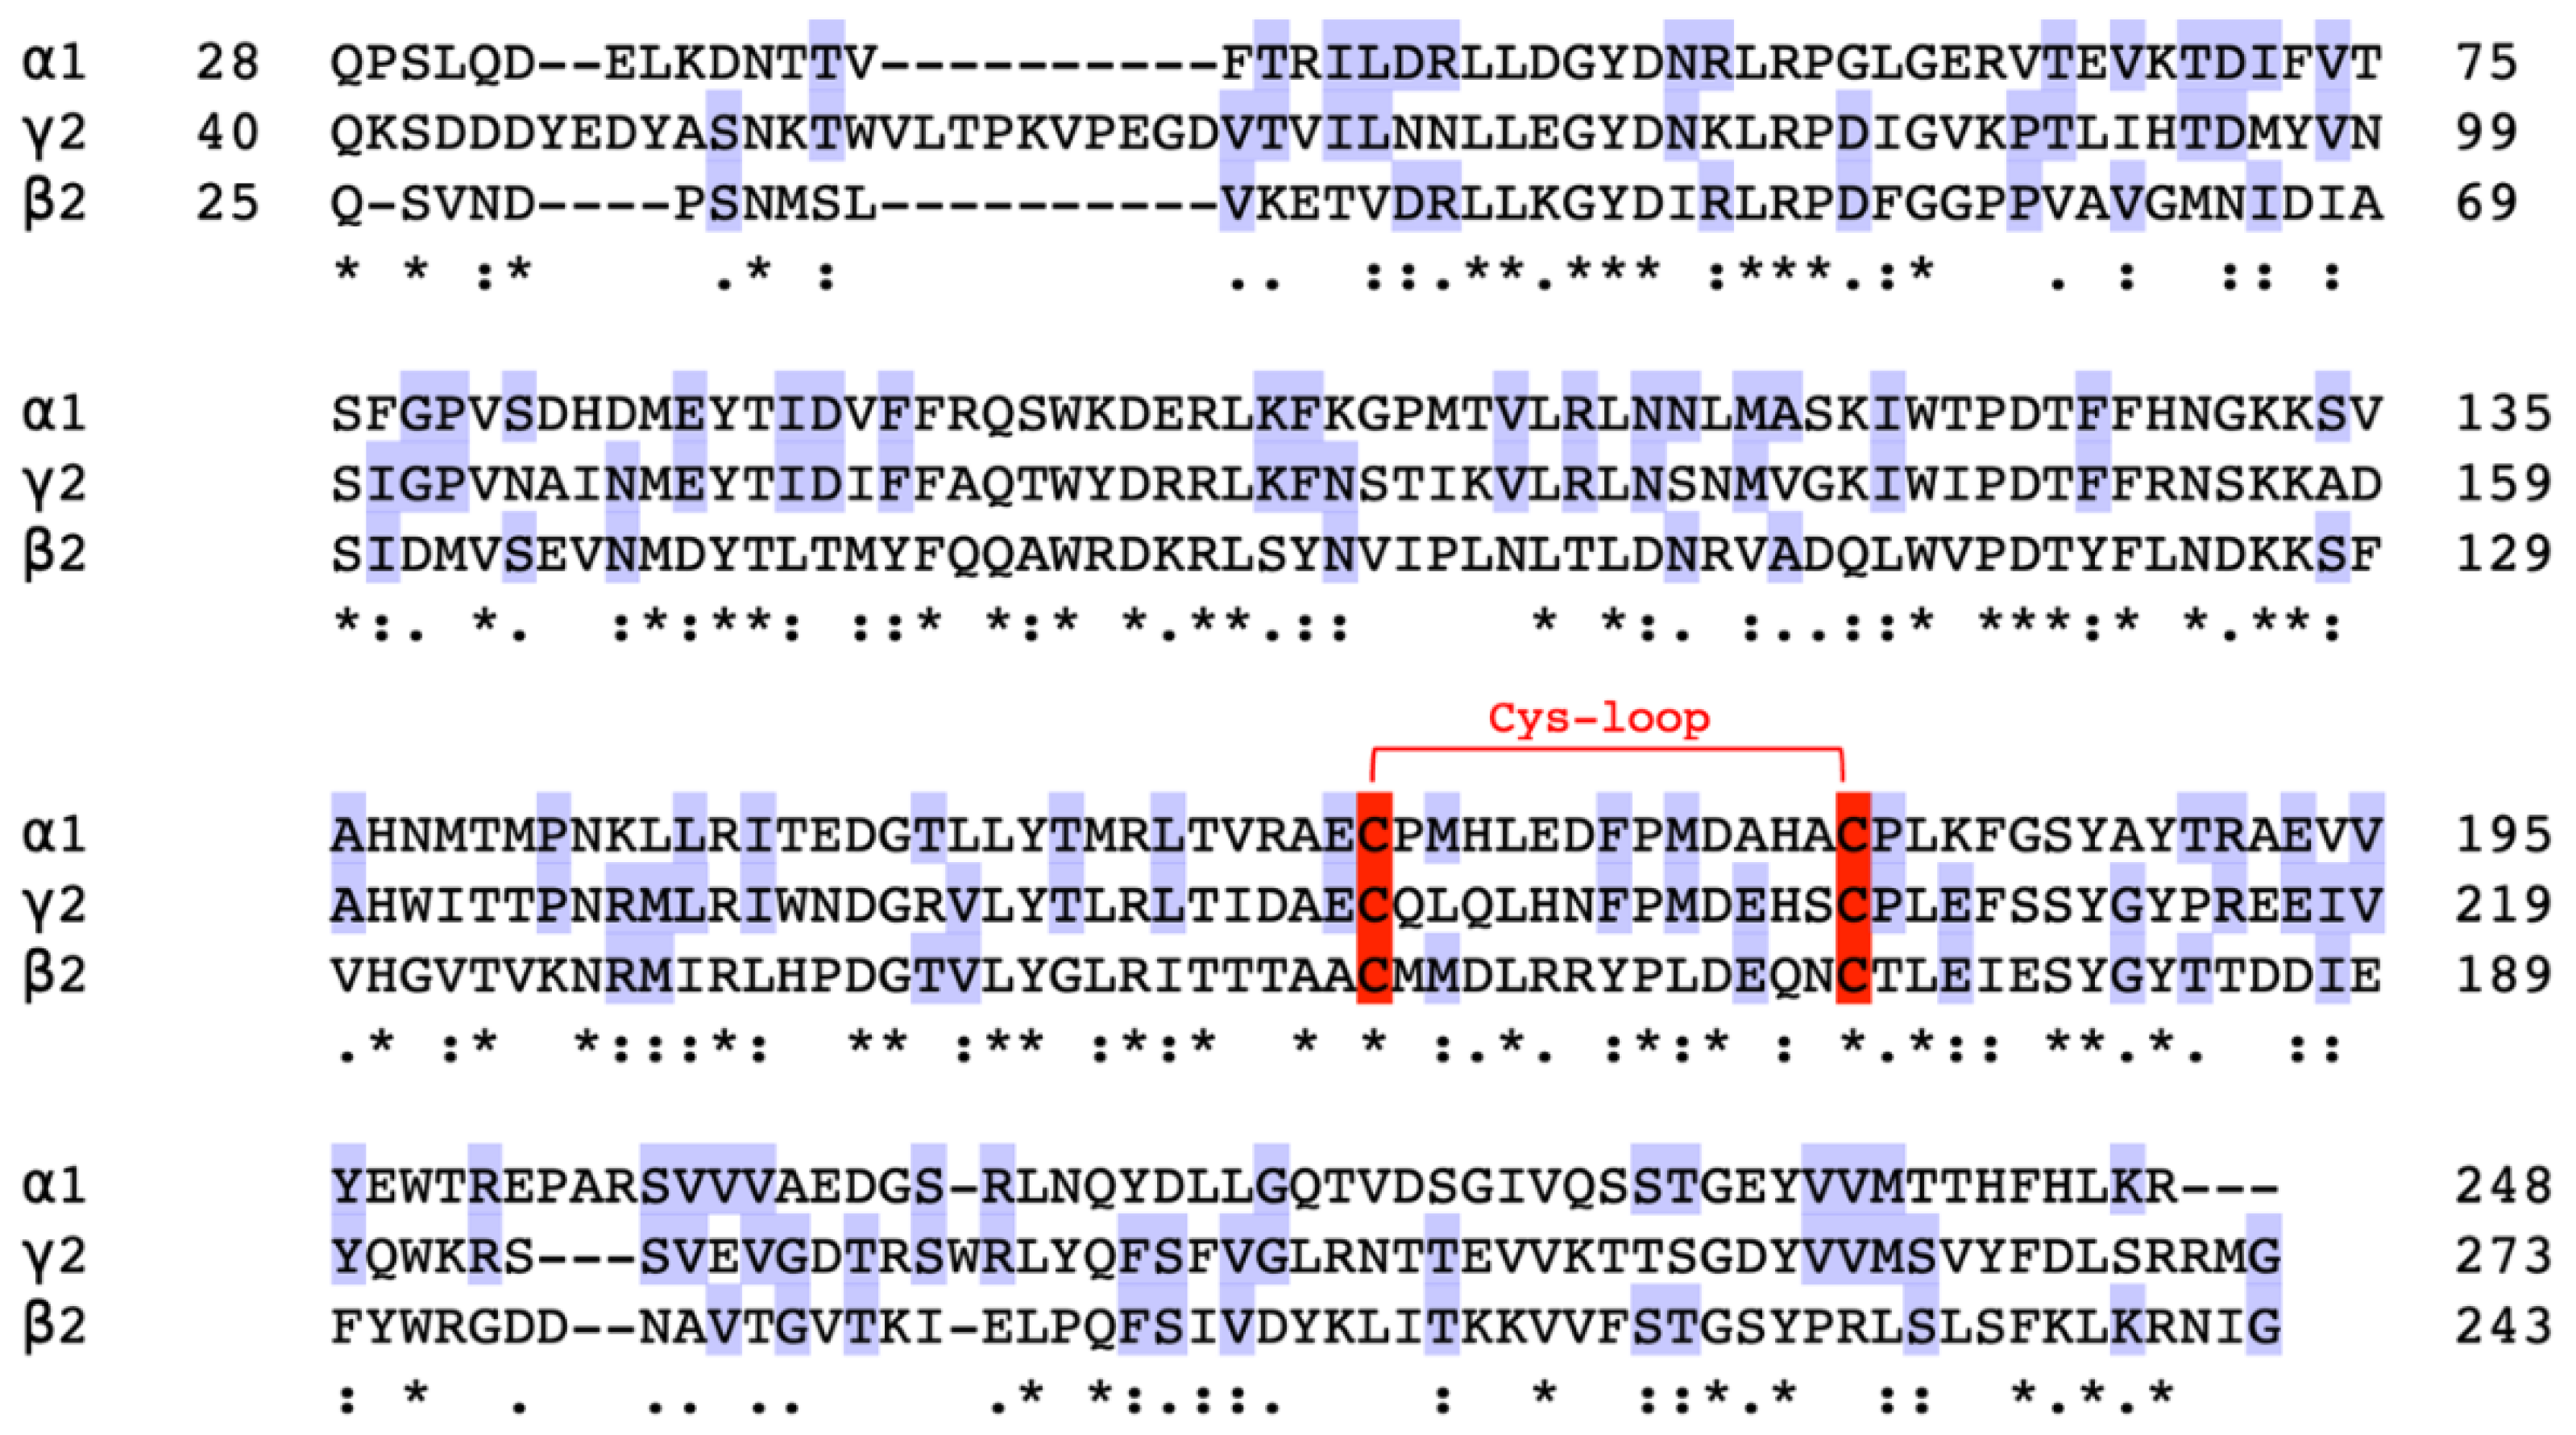
2.1. Amino Acid Sequence Alignment
2.2. Expression and Purification of α1, β2, and γ2 Subunit Fragments
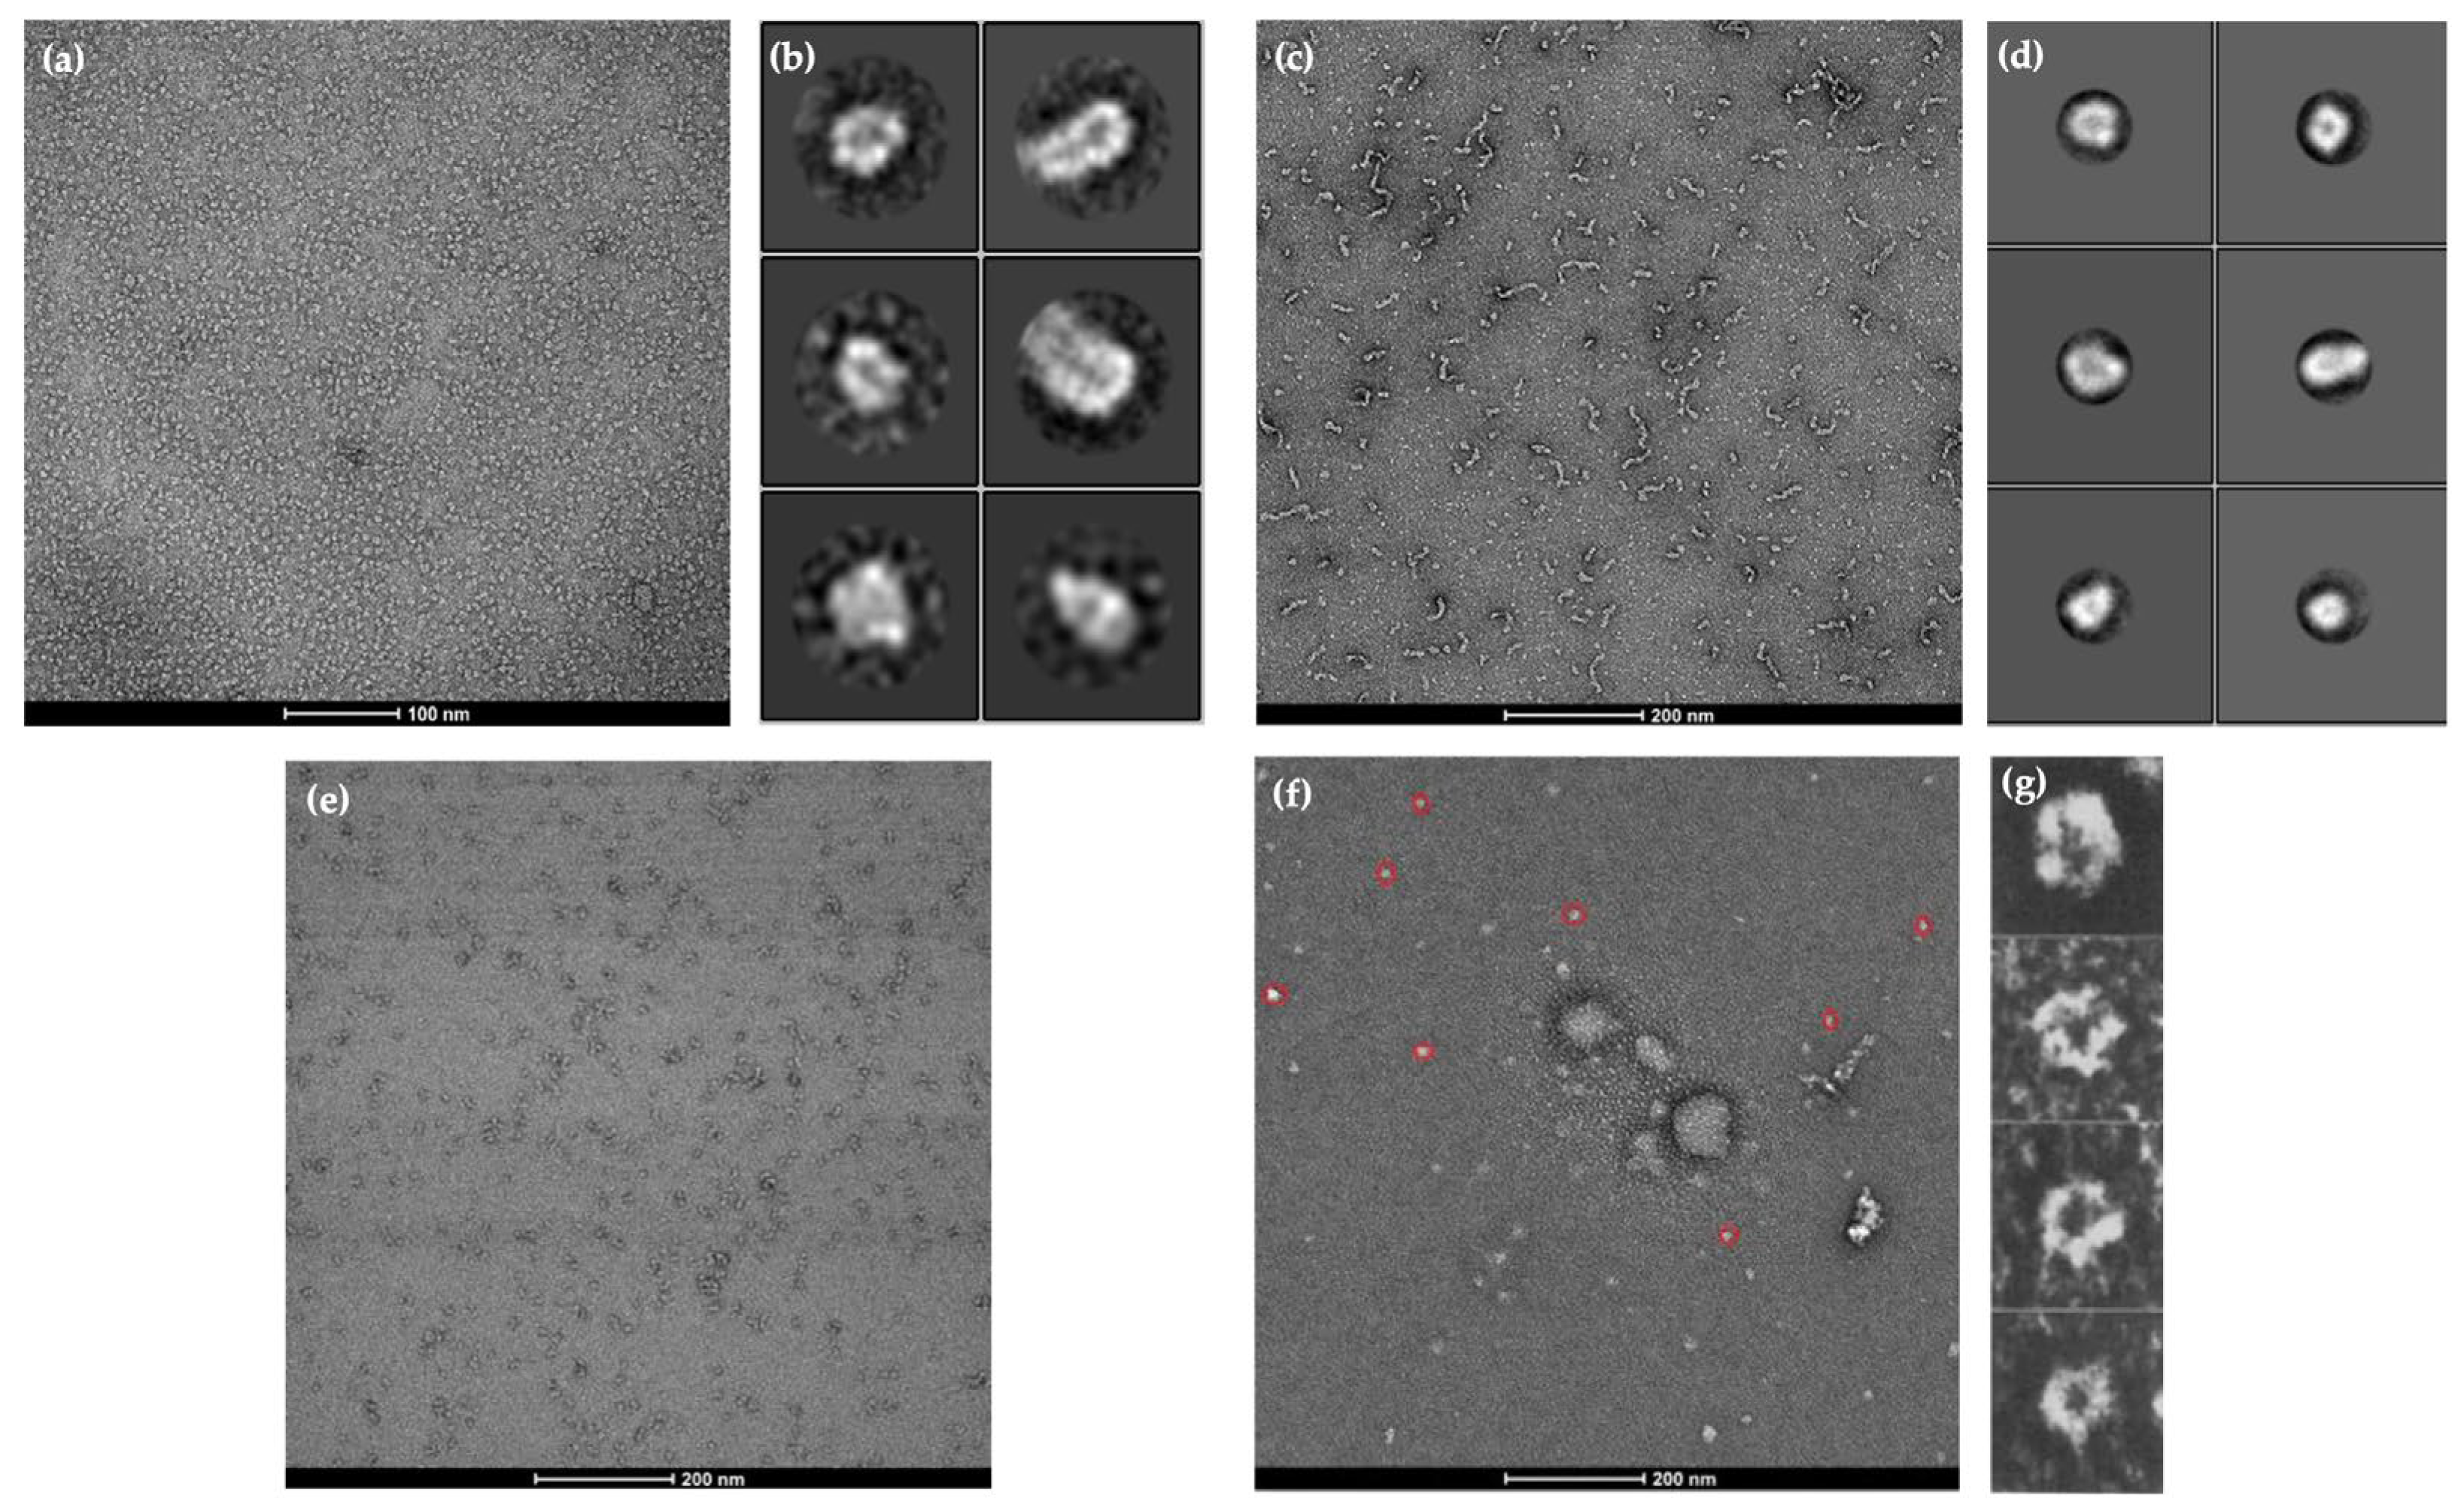
2.3. Visualisation of Protein Structures Using Cryo-EM
2.4. AlphaFold2 Prediction of α1, β2, and γ2 Homopentameric Structures
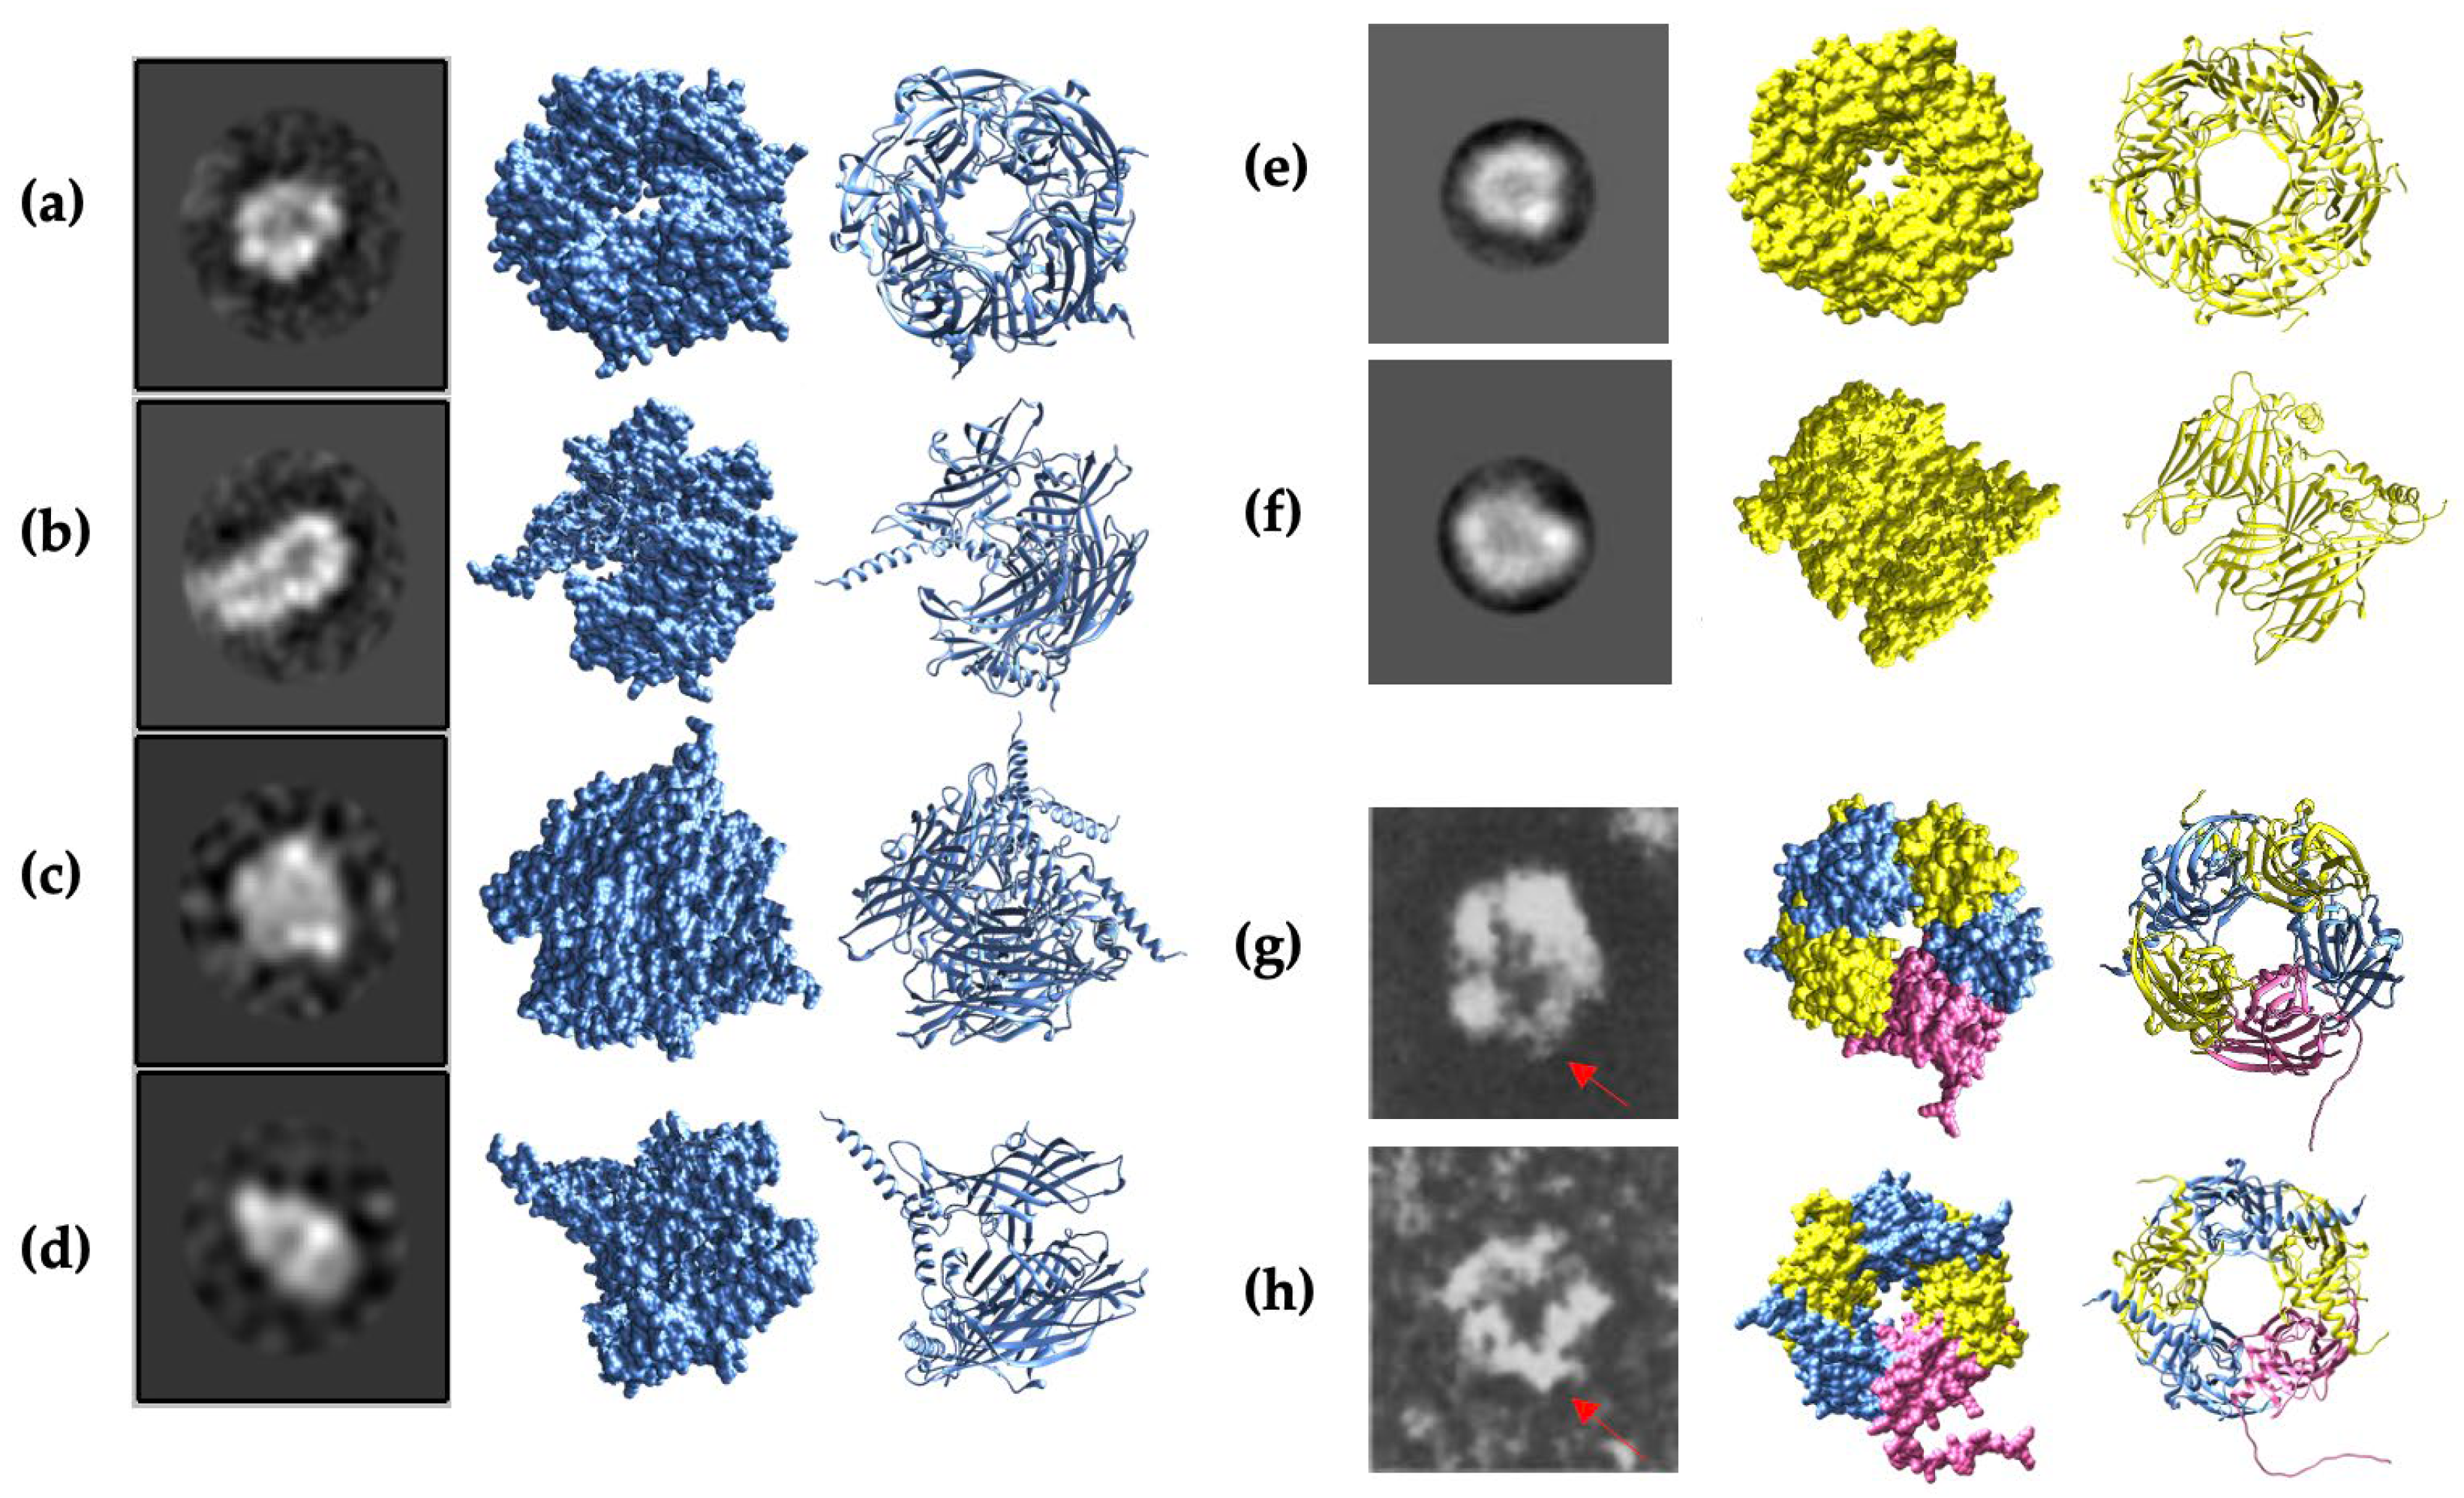
2.5. Cryo-EM Images and AlphaFold2 Prediction Comparison
2.6. Conserved Trp Residues in the GABAA Receptor α1, β2, and γ2 Subunits

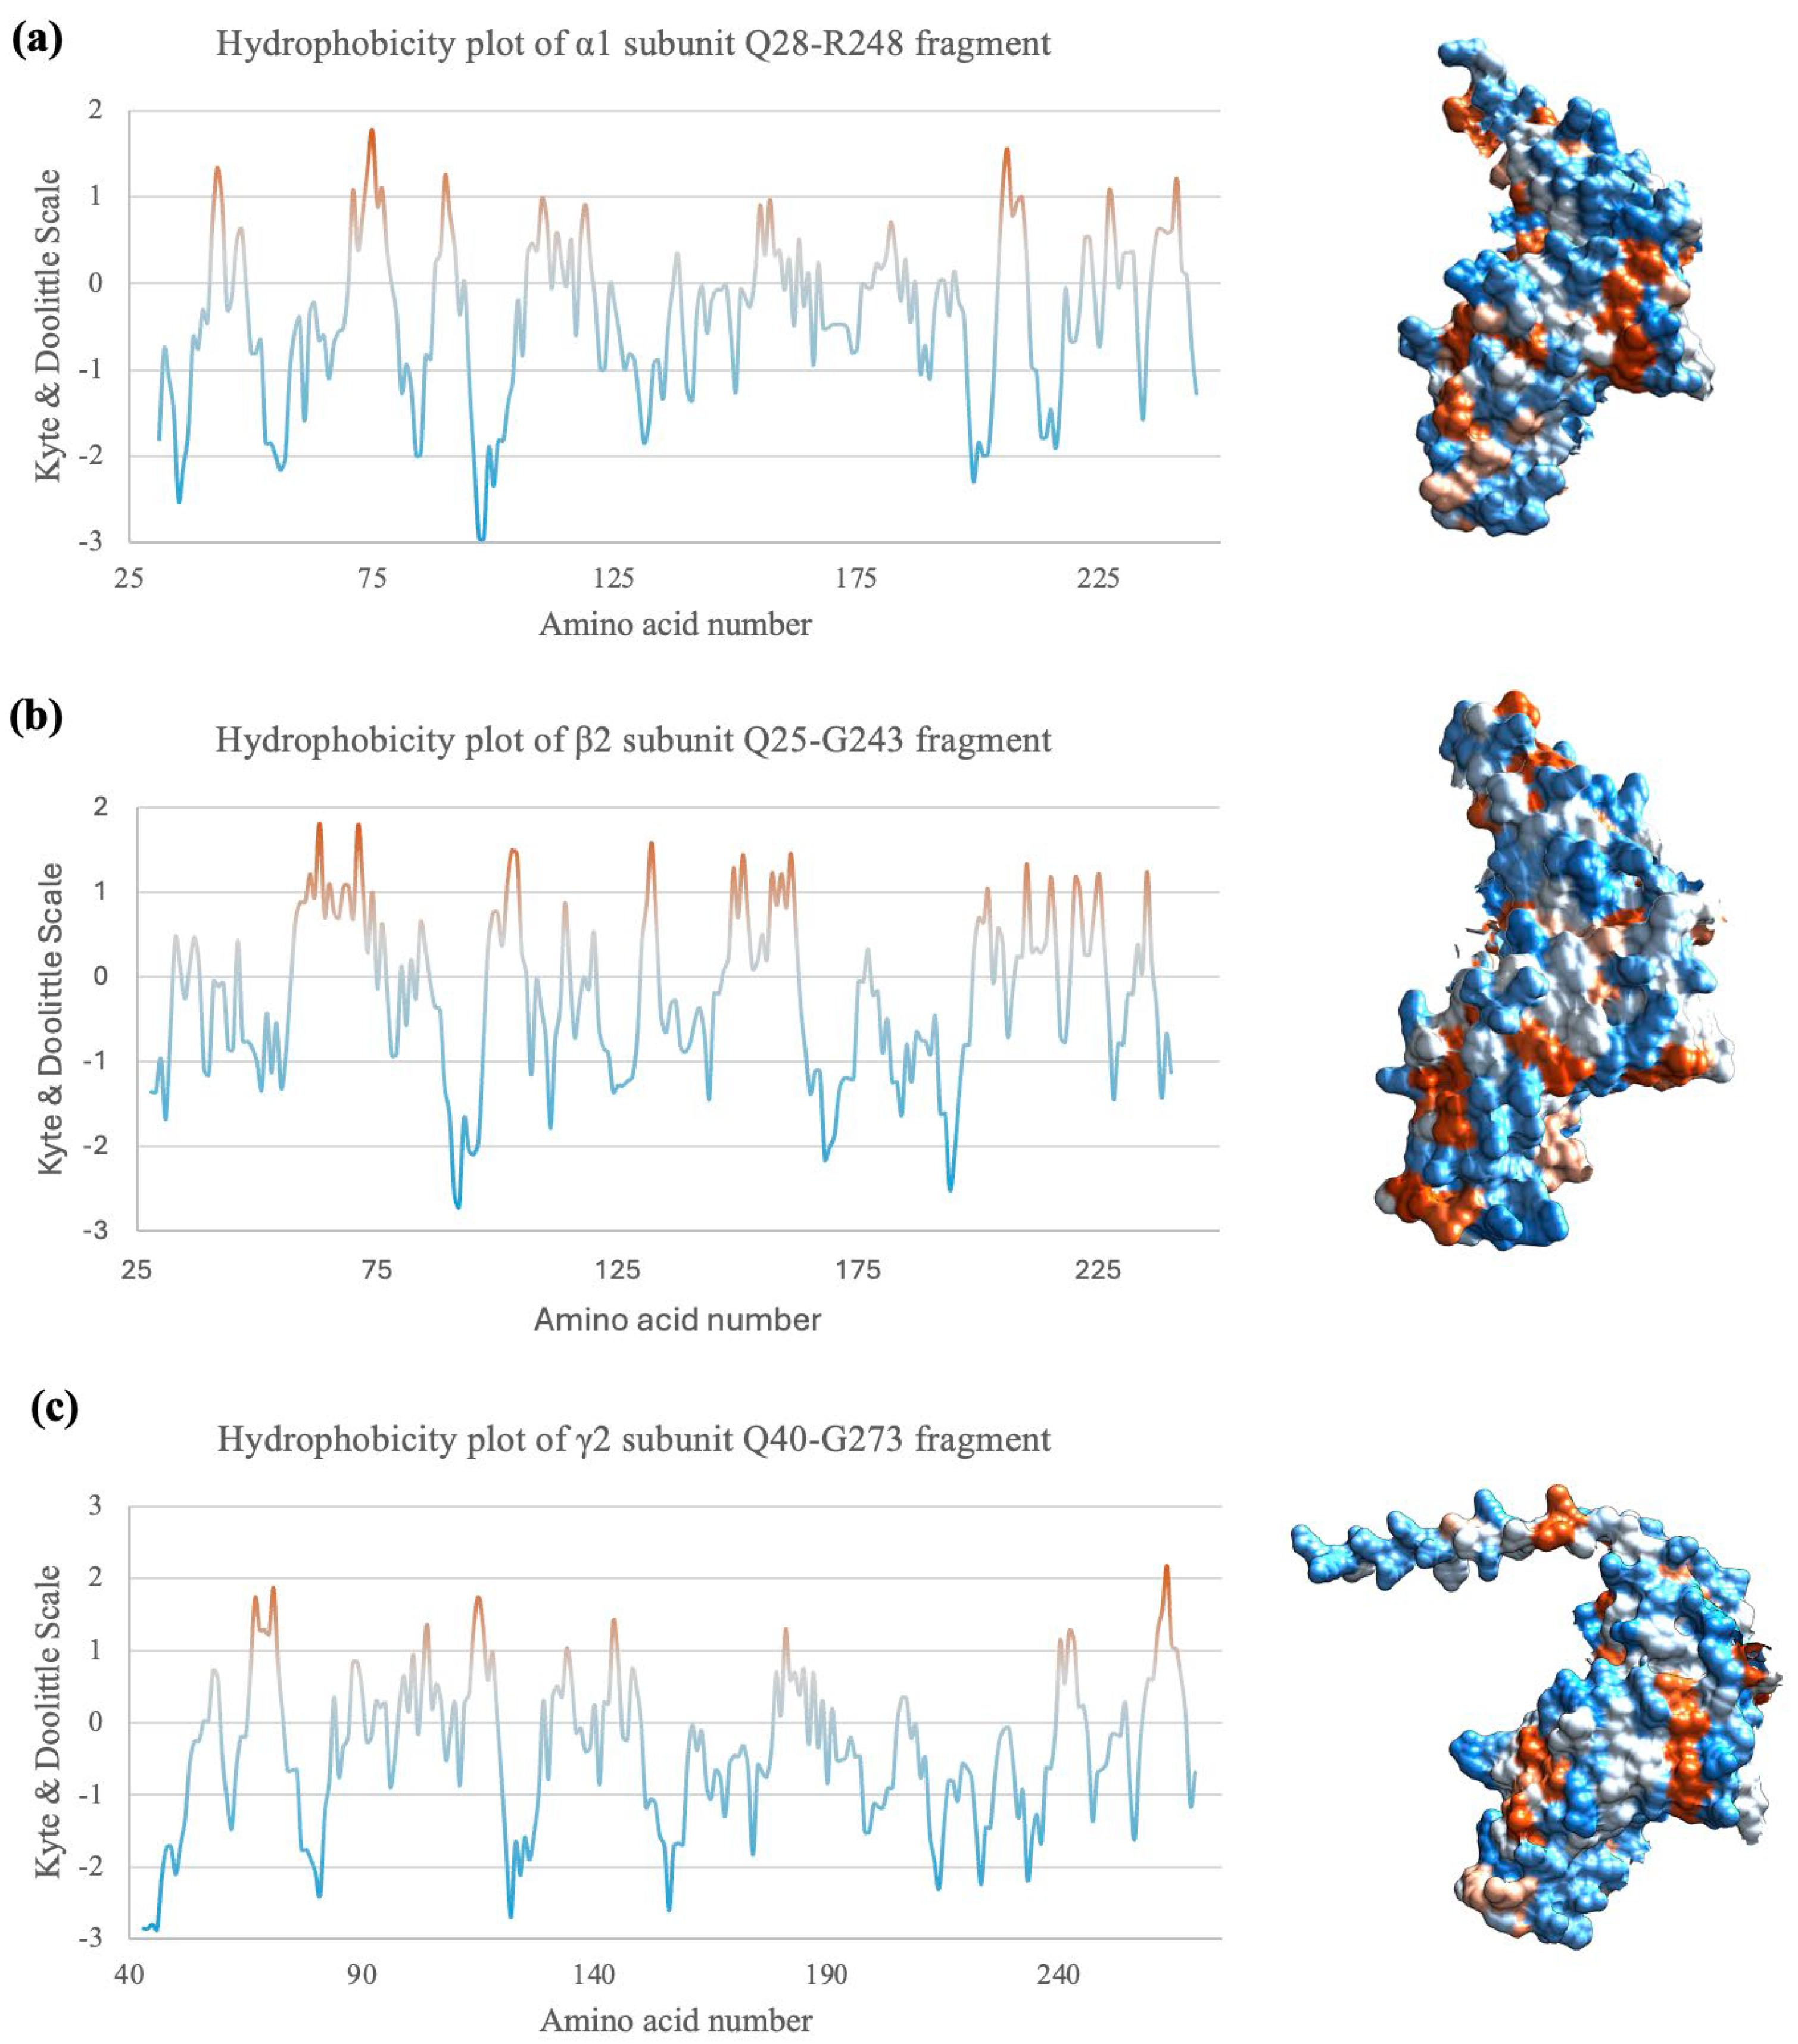
2.7. Hydrophobicity Plot Indicates Subunit Fragments Are Relatively Hydrophilic
3. Discussion
3.1. α1. and β2 Subunits of GABAA Receptors Form Homopentamers
3.2. Gln28-Arg248 α1 Subunit Fragments Form Stable Homopentamers

3.3. β2. Subunit Fragments Homopentamers Possible Assembly Mechanism

3.4. Complexity of γ2 Subunit of the GABAA Receptor
3.5. Constructed α1β2γ2 Heteropentameric GABAA Receptors
3.6. Potential of Using AlphaFold2 for Aided Experimental Design and Evaluation
4. Materials and Methods
4.1. Buffers
- Wash Buffer A: 50mM Tris-Cl, pH 8.0 and 10mM EDTA.
- Lysis buffer: 100mM Tris-Cl, pH 8.0, 10mM EDTA 5mM DTT, 100mM NaCl, 10% Glycerol and 200µg/ml lysozyme.
- Wash Buffer B: 100mM Tris-Cl, pH 8.0, 10mM EDTA 5mM DTT, 100mM NaCl, 10% Glycerol 2M urea and 2% deoxycholic acid.
- Elution Buffer: 10 mM glycine pH 10.3 and 2% sodium dodecyl sulfate (SDS).
4.2. Cloning and Protein Expression
4.3. Cell Purification
4.4. Protein Refolding
4.5. Constructing Heteropentamers
4.6. Proteins Dialysis
4.7. Negative Staining of the Protein
4.8. Computational Prediction of Protein Structure Using AlphaFold2
4.9. Hydrophobicity Plots
5. Conclusions
Supplementary Materials
Author Contributions
Funding
Institutional Review Board Statement
Informed Consent Statement
Data Availability Statement
Acknowledgments
Conflicts of Interest
References
- Sieghart, W. Structure, Pharmacology, and Function of GABAA Receptor Subtypes. In Advances in Pharmacology; GABA; Academic Press, 2006; Vol. 54, pp. 231–263.
- Goetz, T.; Arslan, A.; Wisden, W.; Wulff, P. GABA(A) Receptors: Structure and Function in the Basal Ganglia. Prog. Brain Res. 2007, 160, 21–41. [Google Scholar] [CrossRef]
- Olsen, R.W.; Li, G.-D. Chapter 18 - GABA. In Basic Neurochemistry (Eighth Edition); Brady, S.T., Siegel, G.J., Albers, R.W., Price, D.L., Eds.; Academic Press: New York, 2012; pp. 367–376; ISBN 978-0-12-374947-5. [Google Scholar]
- Elgarf, A.A.; Siebert, D.C.B.; Steudle, F.; Draxler, A.; Li, G.; Huang, S.; Cook, J.M.; Ernst, M.; Scholze, P. Different Benzodiazepines Bind with Distinct Binding Modes to GABAA Receptors. ACS Chem. Biol. 2018, 13, 2033–2039. [Google Scholar] [CrossRef] [PubMed]
- Salari, R.; Murlidaran, S.; Brannigan, G. Pentameric Ligand-Gated Ion Channels : Insights from Computation. Mol. Simul. 2014, 40, 821–829. [Google Scholar] [CrossRef] [PubMed]
- Dutertre, S.; Becker, C.-M.; Betz, H. Inhibitory Glycine Receptors: An Update. J. Biol. Chem. 2012, 287, 40216–40223. [Google Scholar] [CrossRef]
- Waxham, M.N. Chapter 10 - Neurotransmitter Receptors. In From Molecules to Networks (Third Edition); Byrne, J.H., Heidelberger, R., Waxham, M.N., Eds.; Academic Press: Boston, 2014; pp. 285–321; ISBN 978-0-12-397179-1. [Google Scholar]
- Nemecz, Á.; Prevost, M.S.; Menny, A.; Corringer, P.-J. Emerging Molecular Mechanisms of Signal Transduction in Pentameric Ligand-Gated Ion Channels. Neuron 2016, 90, 452–470. [Google Scholar] [CrossRef] [PubMed]
- Simon, J.; Wakimoto, H.; Fujita, N.; Lalande, M.; Barnard, E.A. Analysis of the Set of GABAA Receptor Genes in the Human Genome*. J. Biol. Chem. 2004, 279, 41422–41435. [Google Scholar] [CrossRef]
- Ghit, A.; Assal, D.; Al-Shami, A.S.; Hussein, D.E.E. GABAA Receptors: Structure, Function, Pharmacology, and Related Disorders. J. Genet. Eng. Biotechnol. 2021, 19, 123. [Google Scholar] [CrossRef]
- Sigel, E.; Steinmann, M.E. Structure, Function, and Modulation of GABAA Receptors. J. Biol. Chem. 2012, 287, 40224–40231. [Google Scholar] [CrossRef]
- Baumann, S.W.; Baur, R.; Sigel, E. Forced Subunit Assembly in Alpha1beta2gamma2 GABAA Receptors. Insight into the Absolute Arrangement. J. Biol. Chem. 2002, 277, 46020–46025. [Google Scholar] [CrossRef]
- Barki, M.; Xue, H. GABRB2, a Key Player in Neuropsychiatric Disorders and Beyond. Gene 2022, 809, 146021. [Google Scholar] [CrossRef]
- Puthenkalam, R.; Hieckel, M.; Simeone, X.; Suwattanasophon, C.; Feldbauer, R.V.; Ecker, G.F.; Ernst, M. Structural Studies of GABAA Receptor Binding Sites: Which Experimental Structure Tells Us What? Front. Mol. Neurosci. 2016, 9. [Google Scholar] [CrossRef] [PubMed]
- Renard, S.; Olivier, A.; Granger, P.; Avenet, P.; Graham, D.; Sevrin, M.; George, P.; Besnard, F. Structural Elements of the γ-Aminobutyric Acid Type A Receptor Conferring Subtype Selectivity for Benzodiazepine Site Ligands*. J. Biol. Chem. 1999, 274, 13370–13374. [Google Scholar] [CrossRef] [PubMed]
- Claxton, D.P.; Gouaux, E. Expression and Purification of a Functional Heteromeric GABAA Receptor for Structural Studies. PLOS ONE 2018, 13, e0201210. [Google Scholar] [CrossRef]
- Barker, J.S.; Hines, R.M. Regulation of GABAA Receptor Subunit Expression in Substance Use Disorders. Int. J. Mol. Sci. 2020, 21, 4445. [Google Scholar] [CrossRef] [PubMed]
- Sieghart, W.; Fuchs, K.; Tretter, V.; Ebert, V.; Jechlinger, M.; Höger, H.; Adamiker, D. Structure and Subunit Composition of GABAA Receptors. Neurochem. Int. 1999, 34, 379–385. [Google Scholar] [CrossRef]
- Laurie, D.J.; Wisden, W.; Seeburg, P.H. The Distribution of Thirteen GABAA Receptor Subunit mRNAs in the Rat Brain. III. Embryonic and Postnatal Development. J. Neurosci. 1992, 12, 4151–4172. [Google Scholar] [CrossRef]
- Smith, G.B.; Olsen, R.W. Identification of a [3H]Muscimol Photoaffinity Substrate in the Bovine Gamma-Aminobutyric acidA Receptor Alpha Subunit. J. Biol. Chem. 1994, 269, 20380–20387. [Google Scholar] [CrossRef] [PubMed]
- Westh-Hansen, S.E.; Rasmussen, P.B.; Hastrup, S.; Nabekura, J.; Noguchi, K.; Akaike, N.; Witt, M.R.; Nielsen, M. Decreased Agonist Sensitivity of Human GABA(A) Receptors by an Amino Acid Variant, Isoleucine to Valine, in the Alpha1 Subunit. Eur. J. Pharmacol. 1997, 329, 253–257. [Google Scholar] [CrossRef] [PubMed]
- Westh-Hansen, S.E.; Witt, M.R.; Dekermendjian, K.; Liljefors, T.; Rasmussen, P.B.; Nielsen, M. Arginine Residue 120 of the Human GABAA Receptor Alpha 1, Subunit Is Essential for GABA Binding and Chloride Ion Current Gating. Neuroreport 1999, 10, 2417–2421. [Google Scholar] [CrossRef]
- Nors, J.W.; Gupta, S.; Goldschen-Ohm, M.P. A Critical Residue in the α1M2–M3 Linker Regulating Mammalian GABAA Receptor Pore Gating by Diazepam. eLife 10, e64400. [CrossRef]
- Shao, J.; Kuiper, B.P.; Thunnissen, A.-M.W.H.; Cool, R.H.; Zhou, L.; Huang, C.; Dijkstra, B.W.; Broos, J. The Role of Tryptophan in π Interactions in Proteins: An Experimental Approach. J. Am. Chem. Soc. 2022, 144, 13815–13822. [Google Scholar] [CrossRef]
- Dougherty, D.A. Cation-Pi Interactions Involving Aromatic Amino Acids. J. Nutr. 2007, 137, 1504S–1508S; discussion 1516S-1517S. [Google Scholar] [CrossRef] [PubMed]
- Laverty, D.; Desai, R.; Uchański, T.; Masiulis, S.; Stec, W.J.; Malinauskas, T.; Zivanov, J.; Pardon, E.; Steyaert, J.; Miller, K.W.; et al. Cryo-EM Structure of the Human A1β3γ2 GABAA Receptor in a Lipid Bilayer. Nature 2019, 565, 516–520. [Google Scholar] [CrossRef]
- Sigel, E.; Baur, R.; Kellenberger, S.; Malherbe, P. Point Mutations Affecting Antagonist Affinity and Agonist Dependent Gating of GABAA Receptor Channels. EMBO J. 1992, 11, 2017–2023. [Google Scholar] [CrossRef]
- O’Shea, S.M.; Harrison, N.L. Arg-274 and Leu-277 of the γ-Aminobutyric Acid Type A Receptor A2 Subunit Define Agonist Efficacy and Potency *. J. Biol. Chem. 2000, 275, 22764–22768. [Google Scholar] [CrossRef] [PubMed]
- Barik, S. The Uniqueness of Tryptophan in Biology: Properties, Metabolism, Interactions and Localization in Proteins. Int. J. Mol. Sci. 2020, 21, 8776. [Google Scholar] [CrossRef]
- Khemaissa, S.; Sagan, S.; Walrant, A. Tryptophan, an Amino-Acid Endowed with Unique Properties and Its Many Roles in Membrane Proteins. Crystals 2021, 11, 1032. [Google Scholar] [CrossRef]
- Perraut, C.; Clottes, E.; Leydier, C.; Vial, C.; Marcillat, O. Role of Quaternary Structure in Muscle Creatine Kinase Stability: Tryptophan 210 Is Important for Dimer Cohesion. Proteins Struct. Funct. Bioinforma. 1998, 32, 43–51. [Google Scholar] [CrossRef]
- Skoging, U.; Liljeström, P. Role of the C-Terminal Tryptophan Residue for the Structure-Function of the Alphavirus Capsid Protein1. J. Mol. Biol. 1998, 279, 865–872. [Google Scholar] [CrossRef] [PubMed]
- Srinivasan, S.; Nichols, C.J.; Lawless, G.M.; Olsen, R.W.; Tobin, A.J. Two Invariant Tryptophans on the A1 Subunit Define Domains Necessary for GABAA Receptor Assembly*. J. Biol. Chem. 1999, 274, 26633–26638. [Google Scholar] [CrossRef]
- Smith, G.B.; Olsen, R.W. Functional Domains of GABAA Receptors. Trends Pharmacol. Sci. 1995, 16, 162–168. [Google Scholar] [CrossRef]
- Galzi, J.-L.; Changeux, J.-P. Neurotransmitter-Gated Ion Channels as Unconventional Allosteric Proteins. Curr. Opin. Struct. Biol. 1994, 4, 554–565. [Google Scholar] [CrossRef]
- Hartiadi, L.Y.; Ahring, P.K.; Chebib, M.; Absalom, N.L. High and Low GABA Sensitivity A4β2δ GABAA Receptors Are Expressed in Xenopus Laevis Oocytes with Divergent Stoichiometries. Biochem. Pharmacol. 2016, 103, 98–108. [Google Scholar] [CrossRef] [PubMed]
- Laha, K.T.; Tran, P.N. Multiple Tyrosine Residues at the GABA Binding Pocket Influence Surface Expression and Mediate Kinetics of the GABAA Receptor. J. Neurochem. 2013, 124, 200–209. [Google Scholar] [CrossRef] [PubMed]
- Kucken, A.M.; Wagner, D.A.; Ward, P.R.; Teissére, J.A.; Boileau, A.J.; Czajkowski, C. Identification of Benzodiazepine Binding Site Residues in the Gamma2 Subunit of the Gamma-Aminobutyric Acid(A) Receptor. Mol. Pharmacol. 2000, 57, 932–939. [Google Scholar] [PubMed]
- Shi, H.; Tsang, S.Y.; Tse, M.K.; Xu, Z.; Xue, H. Recombinant Extracellular Domain of the Three Major Subunits of GABAA Receptor Show Comparable Secondary Structure and Benzodiazepine Binding Properties. Protein Sci. Publ. Protein Soc. 2003, 12, 2642–2646. [Google Scholar] [CrossRef] [PubMed]
- Xue, H.; Zheng, H.; Li, H.M.; Kitmitto, A.; Zhu, H.; Lee, P.; Holzenburg, A. A Fragment of Recombinant GABA(A) Receptor Alpha1 Subunit Forming Rosette-like Homo-Oligomers. J. Mol. Biol. 2000, 296, 739–742. [Google Scholar] [CrossRef] [PubMed]
- Hang, J.; Shi, H.; Li, D.; Liao, Y.; Lian, D.; Xiao, Y.; Xue, H. Ligand Binding and Structural Properties of Segments of GABAA Receptor A1 Subunit Overexpressed in Escherichia Coli *. J. Biol. Chem. 2000, 275, 18818–18823. [Google Scholar] [CrossRef] [PubMed]
- Xu, Z.; Fang, S.; Shi, H.; Li, H.; Deng, Y.; Liao, Y.; Wu, J.-M.; Zheng, H.; Zhu, H.; Chen, H.-M.; et al. Topology Characterization of a Benzodiazepine-Binding β-Rich Domain of the GABAA Receptor A1 Subunit. Protein Sci. 2005, 14, 2622–2637. [Google Scholar] [CrossRef]
- Lesk, A.M.; Chothia, C. Evolution of Proteins Formed by β-Sheets: II. The Core of the Immunoglobulin Domains. J. Mol. Biol. 1982, 160, 325–342. [Google Scholar] [CrossRef]
- Braun, N.; Lynagh, T.; Yu, R.; Biggin, P.C.; Pless, S.A. Role of an Absolutely Conserved Tryptophan Pair in the Extracellular Domain of Cys-Loop Receptors. ACS Chem. Neurosci. 2016, 7, 339–348. [Google Scholar] [CrossRef]
- Zhu, S.; Noviello, C.M.; Teng, J.; Walsh, R.M.; Kim, J.J.; Hibbs, R.E. Structure of a Human Synaptic GABAA Receptor. Nature 2018, 559, 67–72. [Google Scholar] [CrossRef] [PubMed]
- Phulera, S.; Zhu, H.; Yu, J.; Claxton, D.P.; Yoder, N.; Yoshioka, C.; Gouaux, E. Cryo-EM Structure of the Benzodiazepine-Sensitive α1β1γ2S Tri-Heteromeric GABAA Receptor in Complex with GABA. eLife 2018, 7, e39383. [Google Scholar] [CrossRef] [PubMed]
- Kasaragod, V.B.; Schindelin, H. Structure of Heteropentameric GABAA Receptors and Receptor-Anchoring Properties of Gephyrin. Front. Mol. Neurosci. 2019, 12. [Google Scholar] [CrossRef] [PubMed]
- Kim, J.J.; Gharpure, A.; Teng, J.; Zhuang, Y.; Howard, R.J.; Zhu, S.; Noviello, C.M.; Walsh, R.M.; Lindahl, E.; Hibbs, R.E. Shared Structural Mechanisms of General Anaesthetics and Benzodiazepines. Nature 2020, 585, 303–308. [Google Scholar] [CrossRef] [PubMed]
- Masiulis, S.; Desai, R.; Uchański, T.; Serna Martin, I.; Laverty, D.; Karia, D.; Malinauskas, T.; Zivanov, J.; Pardon, E.; Kotecha, A.; et al. GABAA Receptor Signalling Mechanisms Revealed by Structural Pharmacology. Nature 2019, 565, 454–459. [Google Scholar] [CrossRef] [PubMed]
- Miller, P.S.; Aricescu, A.R. Crystal Structure of a Human GABAA Receptor. Nature 2014, 512, 270–275. [Google Scholar] [CrossRef] [PubMed]
- Jumper, J.; Evans, R.; Pritzel, A.; Green, T.; Figurnov, M.; Ronneberger, O.; Tunyasuvunakool, K.; Bates, R.; Žídek, A.; Potapenko, A.; et al. Highly Accurate Protein Structure Prediction with AlphaFold. Nature 2021, 596, 583–589. [Google Scholar] [CrossRef]
- Kaczor, P.T.; Wolska, A.D.; Mozrzymas, J.W. A1 Subunit Histidine 55 at the Interface between Extracellular and Transmembrane Domains Affects Preactivation and Desensitization of the GABAA Receptor. ACS Chem. Neurosci. 2021, 12, 562–572. [Google Scholar] [CrossRef] [PubMed]
- Miller, P.S.; Smart, T.G. Binding, Activation and Modulation of Cys-Loop Receptors. Trends Pharmacol. Sci. 2010, 31, 161–174. [Google Scholar] [CrossRef]
- McKechnie, W.S.; Tugcu, N.; Kandula, S. Accurate and Rapid Protein Concentration Measurement of In-Process, High Concentration Protein Pools. Biotechnol. Prog. 2018, 34, 1234–1241. [Google Scholar] [CrossRef]
- The UniProt Consortium UniProt: The Universal Protein Knowledgebase in 2023. Nucleic Acids Res. 2023, 51, D523–D531. [CrossRef] [PubMed]
- Gasteiger, E.; Gattiker, A.; Hoogland, C.; Ivanyi, I.; Appel, R.D.; Bairoch, A. ExPASy: The Proteomics Server for in-Depth Protein Knowledge and Analysis. Nucleic Acids Res. 2003, 31, 3784–3788. [Google Scholar] [CrossRef] [PubMed]
- Gasteiger, E.; Hoogland, C.; Gattiker, A.; Duvaud, S.; Wilkins, M.R.; Appel, R.D.; Bairoch, A. Protein Identification and Analysis Tools on the ExPASy Server. In The Proteomics Protocols Handbook; Walker, J.M., Ed.; Humana Press: Totowa, NJ, 2005; pp. 571–607; ISBN 978-1-58829-343-5. [Google Scholar]
- Kyte, J.; Doolittle, R.F. A Simple Method for Displaying the Hydropathic Character of a Protein. J. Mol. Biol. 1982, 157, 105–132. [Google Scholar] [CrossRef] [PubMed]
- Xue, H.; Chu, R.; Hang, J.; Lee, P.; Zheng, H. Fragment of GABA(A) Receptor Containing Key Ligand-Binding Residues Overexpressed in Escherichia Coli. Protein Sci. Publ. Protein Soc. 1998, 7, 216–219. [Google Scholar] [CrossRef] [PubMed]
- Wang, J.; Shen, D.; Xia, G.; Shen, W.; Macdonald, R.L.; Xu, D.; Kang, J.-Q. Differential Protein Structural Disturbances and Suppression of Assembly Partners Produced by Nonsense GABRG2 Epilepsy Mutations: Implications for Disease Phenotypic Heterogeneity. Sci. Rep. 2016, 6, 35294. [Google Scholar] [CrossRef] [PubMed]
- Xu, D.; Lin, S.L.; Nussinov, R. Protein Binding versus Protein Folding: The Role of Hydrophilic Bridges in Protein Associations. J. Mol. Biol. 1997, 265, 68–84. [Google Scholar] [CrossRef]
- Klausberger, T.; Fuchs, K.; Mayer, B.; Ehya, N.; Sieghart, W. GABAA Receptor Assembly. J. Biol. Chem. 2000, 275, 8921–8928. [Google Scholar] [CrossRef] [PubMed]
- Berezhnoy, D.; Gibbs, T.T.; Farb, D.H. Docking of 1,4-Benzodiazepines in the A1/Γ2 GABAA Receptor Modulator Site. Mol. Pharmacol. 2009, 76, 440–450. [Google Scholar] [CrossRef] [PubMed]
- Richter, L.; de Graaf, C.; Sieghart, W.; Varagic, Z.; Mörzinger, M.; de Esch, I.J.P.; Ecker, G.F.; Ernst, M. Diazepam-Bound GABAA Receptor Models Identify New Benzodiazepine Binding-Site Ligands. Nat. Chem. Biol. 2012, 8, 455–464. [Google Scholar] [CrossRef] [PubMed]
- Morlock, E.V.; Czajkowski, C. Different Residues in the GABAA Receptor Benzodiazepine Binding Pocket Mediate Benzodiazepine Efficacy and Binding. Mol. Pharmacol. 2011, 80, 14–22. [Google Scholar] [CrossRef]
- Sarto-Jackson, I.; Sieghart, W. Assembly of GABAA Receptors (Review). Mol. Membr. Biol. 2008, 25, 302–310. [Google Scholar] [CrossRef] [PubMed]
- Wongsamitkul, N.; Maldifassi, M.C.; Simeone, X.; Baur, R.; Ernst, M.; Sigel, E. α Subunits in GABAA Receptors Are Dispensable for GABA and Diazepam Action. Sci. Rep. 2017, 7, 15498. [Google Scholar] [CrossRef] [PubMed]
- Taylor, P.M.; Thomas, P.; Gorrie, G.H.; Connolly, C.N.; Smart, T.G.; Moss, S.J. Identification of Amino Acid Residues within GABAAReceptor β Subunits That Mediate Both Homomeric and Heteromeric Receptor Expression. J. Neurosci. 1999, 19, 6360–6371. [Google Scholar] [CrossRef] [PubMed]
- Pritchett, D.B.; Sontheimer, H.; Shivers, B.D.; Ymer, S.; Kettenmann, H.; Schofield, P.R.; Seeburg, P.H. Importance of a Novel GABAA Receptor Subunit for Benzodiazepine Pharmacology. Nature 1989, 338, 582–585. [Google Scholar] [CrossRef] [PubMed]
- Boileau, A.J.; Li, T.; Benkwitz, C.; Czajkowski, C.; Pearce, R.A. Effects of γ2S Subunit Incorporation on GABAA Receptor Macroscopic Kinetics. Neuropharmacology 2003, 44, 1003–1012. [Google Scholar] [CrossRef] [PubMed]
- Kittler, J.T.; Wang, J.; Connolly, C.N.; Vicini, S.; Smart, T.G.; Moss, S.J. Analysis of GABAA Receptor Assembly in Mammalian Cell Lines and Hippocampal Neurons Using Γ2 Subunit Green Fluorescent Protein Chimeras. Mol. Cell. Neurosci. 2000, 16, 440–452. [Google Scholar] [CrossRef] [PubMed]
- Connolly, C.N.; Uren, J.M.; Thomas, P.; Gorrie, G.H.; Gibson, A.; Smart, T.G.; Moss, S.J. Subcellular Localization and Endocytosis of Homomeric Gamma2 Subunit Splice Variants of Gamma-Aminobutyric Acid Type A Receptors. Mol. Cell. Neurosci. 1999, 13, 259–271. [Google Scholar] [CrossRef] [PubMed]
- Martínez-Torres, A.; Miledi, R. Expression of Functional Receptors by the Human γ-Aminobutyric Acid A Γ2 Subunit. Proc. Natl. Acad. Sci. 2004, 101, 3220–3223. [Google Scholar] [CrossRef]
- Stephens, D.N.; King, S.L.; Lambert, J.J.; Belelli, D.; Duka, T. GABAA Receptor Subtype Involvement in Addictive Behaviour. Genes Brain Behav. 2017, 16, 149–184. [Google Scholar] [CrossRef]
- Keller, C.A.; Yuan, X.; Panzanelli, P.; Martin, M.L.; Alldred, M.; Sassoè-Pognetto, M.; Lüscher, B. The Gamma2 Subunit of GABA(A) Receptors Is a Substrate for Palmitoylation by GODZ. J. Neurosci. Off. J. Soc. Neurosci. 2004, 24, 5881–5891. [Google Scholar] [CrossRef]
- Tyagarajan, S.K.; Fritschy, J.-M. Gephyrin: A Master Regulator of Neuronal Function? Nat. Rev. Neurosci. 2014, 15, 141–156. [Google Scholar] [CrossRef] [PubMed]
- Choii, G.; Ko, J. Gephyrin: A Central GABAergic Synapse Organizer. Exp. Mol. Med. 2015, 47, e158–e158. [Google Scholar] [CrossRef] [PubMed]
- Essrich, C.; Lorez, M.; Benson, J.A.; Fritschy, J.-M.; Lüscher, B. Postsynaptic Clustering of Major GABAA Receptor Subtypes Requires the Γ2 Subunit and Gephyrin. Nat. Neurosci. 1998, 1, 563–571. [Google Scholar] [CrossRef] [PubMed]
- Alldred, M.J.; Mulder-Rosi, J.; Lingenfelter, S.E.; Chen, G.; Lüscher, B. Distinct Γ2 Subunit Domains Mediate Clustering and Synaptic Function of Postsynaptic GABAA Receptors and Gephyrin. J. Neurosci. 2005, 25, 594–603. [Google Scholar] [CrossRef] [PubMed]
- Kasaragod, V.B.; Schindelin, H. Structure–Function Relationships of Glycine and GABAA Receptors and Their Interplay With the Scaffolding Protein Gephyrin. Front. Mol. Neurosci. 2018, 11. [Google Scholar] [CrossRef] [PubMed]
- Saiepour, L.; Fuchs, C.; Patrizi, A.; Sassoè-Pognetto, M.; Harvey, R.J.; Harvey, K. Complex Role of Collybistin and Gephyrin in GABAA Receptor Clustering. J. Biol. Chem. 2010, 285, 29623–29631. [Google Scholar] [CrossRef]
- Tretter, V.; Jacob, T.C.; Mukherjee, J.; Fritschy, J.-M.; Pangalos, M.N.; Moss, S.J. The Clustering of GABA(A) Receptor Subtypes at Inhibitory Synapses Is Facilitated via the Direct Binding of Receptor Alpha 2 Subunits to Gephyrin. J. Neurosci. Off. J. Soc. Neurosci. 2008, 28, 1356–1365. [Google Scholar] [CrossRef] [PubMed]
- Hockenberry, A.J.; Wilke, C.O. Evolutionary Couplings Detect Side-Chain Interactions. PeerJ 2019, 7, e7280. [Google Scholar] [CrossRef] [PubMed]
- Marks, D.S.; Colwell, L.J.; Sheridan, R.; Hopf, T.A.; Pagnani, A.; Zecchina, R.; Sander, C. Protein 3D Structure Computed from Evolutionary Sequence Variation. PLOS ONE 2011, 6, e28766. [Google Scholar] [CrossRef] [PubMed]
- Patrizio, A.; Renner, M.; Pizzarelli, R.; Triller, A.; Specht, C.G. Alpha Subunit-Dependent Glycine Receptor Clustering and Regulation of Synaptic Receptor Numbers. Sci. Rep. 2017, 7, 10899. [Google Scholar] [CrossRef]
- Nussinov, R.; Zhang, M.; Liu, Y.; Jang, H. AlphaFold, Allosteric, and Orthosteric Drug Discovery: Ways Forward. Drug Discov. Today 2023, 28, 103551. [Google Scholar] [CrossRef]
- Bryant, P.; Pozzati, G.; Elofsson, A. Improved Prediction of Protein-Protein Interactions Using AlphaFold2. Nat. Commun. 2022, 13, 1265. [Google Scholar] [CrossRef]
- Bartolec, T.K.; Vázquez-Campos, X.; Norman, A.; Luong, C.; Johnson, M.; Payne, R.J.; Wilkins, M.R.; Mackay, J.P.; Low, J.K.K. Cross-Linking Mass Spectrometry Discovers, Evaluates, and Corroborates Structures and Protein–Protein Interactions in the Human Cell. Proc. Natl. Acad. Sci. 2023, 120, e2219418120. [Google Scholar] [CrossRef]
- Yang, Z.; Zeng, X.; Zhao, Y.; Chen, R. AlphaFold2 and Its Applications in the Fields of Biology and Medicine. Signal Transduct. Target. Ther. 2023, 8, 1–14. [Google Scholar] [CrossRef]
- Nagaratnam, N.; Martin-Garcia, J.M.; Yang, J.-H.; Goode, M.R.; Ketawala, G.; Craciunescu, F.M.; Zook, J.D.; Sonowal, M.; Williams, D.; Grant, T.D.; et al. Structural and Biophysical Properties of FopA, a Major Outer Membrane Protein of Francisella Tularensis. PLoS ONE 2022, 17, e0267370. [Google Scholar] [CrossRef]
- Paul, B.; Weeratunga, S.; Tillu, V.A.; Hariri, H.; Henne, W.M.; Collins, B.M. Structural Predictions of the SNX-RGS Proteins Suggest They Belong to a New Class of Lipid Transfer Proteins. Front. Cell Dev. Biol. 2022, 10, 826688. [Google Scholar] [CrossRef]
- Jin, Y.; Fyfe, P.K.; Gardner, S.; Wilmes, S.; Bubeck, D.; Moraga, I. Structural Insights into the Assembly and Activation of the IL-27 Signaling Complex. EMBO Rep. 2022, 23, e55450. [Google Scholar] [CrossRef]
- Skalidis, I.; Kyrilis, F.L.; Tüting, C.; Hamdi, F.; Chojnowski, G.; Kastritis, P.L. Cryo-EM and Artificial Intelligence Visualize Endogenous Protein Community Members. Struct. Lond. Engl. 1993 2022, 30, 575–589e6. [Google Scholar] [CrossRef]
- Liu, H.; Hong, X.; Xi, J.; Menne, S.; Hu, J.; Wang, J.C.-Y. Cryo-EM Structures of Human Hepatitis B and Woodchuck Hepatitis Virus Small Spherical Subviral Particles. Sci. Adv. 2022, 8, eabo4184. [Google Scholar] [CrossRef]
- Tai, L.; Zhu, Y.; Ren, H.; Huang, X.; Zhang, C.; Sun, F. 8 Å Structure of the Outer Rings of the Xenopus Laevis Nuclear Pore Complex Obtained by Cryo-EM and AI. Protein Cell 2022, 13, 760–777. [Google Scholar] [CrossRef]
- Yeung, R.K.; Xiang, Z.-H.; Tsang, S.-Y.; Li, R.; Ho, T.Y.C.; Li, Q.; Hui, C.-K.; Sham, P.-C.; Qiao, M.-Q.; Xue, H. Gabrb2-Knockout Mice Displayed Schizophrenia-like and Comorbid Phenotypes with Interneuron-Astrocyte-Microglia Dysregulation. Transl. Psychiatry 2018, 8, 128. [Google Scholar] [CrossRef]
- Lo, W.-S.; Harano, M.; Gawlik, M.; Yu, Z.; Chen, J.; Pun, F.W.; Tong, K.-L.; Zhao, C.; Ng, S.-K.; Tsang, S.-Y.; et al. GABRB2 Association with Schizophrenia: Commonalities and Differences Between Ethnic Groups and Clinical Subtypes. Biol. Psychiatry 2007, 61, 653–660. [Google Scholar] [CrossRef]
- Sperk, G.; Furtinger, S.; Schwarzer, C.; Pirker, S. GABA and Its Receptors in Epilepsy. Adv. Exp. Med. Biol. 2004, 548, 92–103. [Google Scholar] [CrossRef]
- Limon, A.; Reyes-Ruiz, J.M.; Miledi, R. Loss of Functional GABAA Receptors in the Alzheimer Diseased Brain. Proc. Natl. Acad. Sci. 2012, 109, 10071–10076. [Google Scholar] [CrossRef] [PubMed]
- Tretter, V.; Ehya, N.; Fuchs, K.; Sieghart, W. Stoichiometry and Assembly of a Recombinant GABAA Receptor Subtype. J. Neurosci. Off. J. Soc. Neurosci. 1997, 17, 2728–2737. [Google Scholar] [CrossRef] [PubMed]
- Connolly, C.N.; Krishek, B.J.; McDonald, B.J.; Smart, T.G.; Moss, S.J. Assembly and Cell Surface Expression of Heteromeric and Homomeric γ-Aminobutyric Acid Type A Receptors (∗). J. Biol. Chem. 1996, 271, 89–96. [Google Scholar] [CrossRef]
- Taylor, P.M.; Connolly, C.N.; Kittler, J.T.; Gorrie, G.H.; Hosie, A.; Smart, T.G.; Moss, S.J. Identification of Residues within GABAA Receptor α Subunits That Mediate Specific Assembly with Receptor β Subunits. J. Neurosci. 2000, 20, 1297–1306. [Google Scholar] [CrossRef]
- Mirdita, M.; Schütze, K.; Moriwaki, Y.; Heo, L.; Ovchinnikov, S.; Steinegger, M. ColabFold: Making Protein Folding Accessible to All. Nat. Methods 2022, 19, 679–682. [Google Scholar] [CrossRef]
- Yin, R.; Feng, B.Y.; Varshney, A.; Pierce, B.G. Benchmarking AlphaFold for Protein Complex Modeling Reveals Accuracy Determinants. Protein Sci. 2022, 31, e4379. [Google Scholar] [CrossRef]


| α1 | β2 | γ2 | |
| α1 | 100% | 36.57% | 51.83% |
| β2 | 36.57% | 100% | 39.45% |
| γ2 | 51.83% | 39.45% | 100% |
Disclaimer/Publisher’s Note: The statements, opinions and data contained in all publications are solely those of the individual author(s) and contributor(s) and not of MDPI and/or the editor(s). MDPI and/or the editor(s) disclaim responsibility for any injury to people or property resulting from any ideas, methods, instructions or products referred to in the content. |
© 2024 by the authors. Licensee MDPI, Basel, Switzerland. This article is an open access article distributed under the terms and conditions of the Creative Commons Attribution (CC BY) license (http://creativecommons.org/licenses/by/4.0/).


