Preprint
Article

A diffusion model to describe water absorption by red rice during soaking: Variable mass diffusivity, variable volume, use of Boundary-Fitted Coordinates

Altmetrics

Downloads

143

Views

52

Comments

0

A peer-reviewed article of this preprint also exists.

Submitted:

03 July 2024

Posted:

03 July 2024

You are already at the latest version

Alerts
Abstract
This article aims to carry out experiments on water absorption by husked red rice, at constant temperatures of 28, 40 and 50 °C. The description of the absorption kinetics, as well as the analyses of water distribution and volumetric expansion of each grain, at a given instant, was done using a diffusion model. In order for the model to be as close as possible to the real physical situation, the mesh necessary to numerically solve the diffusion equation was generated from the photograph of a grain. Thus, the diffusion equation was written in Boundary-Fitted Coordinates (BFC). The solution of the diffusion equation written in generalized coordinates was then discretized in space and time, using the Finite Volume method, with a fully implicit formulation, considering variable volume and also variable mass diffusivity as a function of local moisture content. Optimizations based on Levenberg-Marquardt algorithm make it possible to determine the parameters of an exponential function relating mass diffusivity and the local moisture content for each temperature. Statistical indicators (chi-square, determination coefficient and Student’s t-test) allowed concluding that the model proposed was very satisfactory for all temperatures, making it possible to simulate water absorption, water distribution and volumetric expansion of the grain over time.
Keywords: 
Subject: Biology and Life Sciences  -   Food Science and Technology

1. Introduction

Rice (Oryza sativa L.) is an important basic food in many countries, including Brazil. White rice, in particular, is the main type of rice consumed in this country. However, other types of rice are produced in Brazil, including, for example, black and brown rice. There are also other varieties of pigmented rice, known for their rich nutritional content and bioactive pigments, the most common colors being red and purple [1]. Red rice, also known as “Arroz da Terra”, has its cultivation restricted to small areas of the semiarid region of the Northeast of Brazil. This region has a watershed suitable for growing the product, and has naturally fertile soils, which make the production of this type of rice viable [2]. Aspects about the nutritional and bioactive quality of red rice were presented and discussed by [3] and also by [4], among other researchers.
In general, rice grains are consumed on a large scale practically throughout the world due to their high nutritional value. The chemical composition of this product is influenced by genotypic variation, climate conditions, fertilizers, soil quality, processing, storage and cooking [3]. Considering only the dry matter, rice contains, on average, 10.5% proteins, 2.5% lipids, 1.2% ash, 11.8% fiber and 74.0% carbohydrates [3].
After harvesting, paddy rice is normally subjected to a drying process, necessary for its safe storage. To be consumed, the product is generally husked and subjected to a hydration process, by immersing it in water for a certain time. This step guarantees softness and reduces subsequent cooking time, enhancing the nutritional profile of the food product, as well as its digestibility. Throughout the hydration process, water slowly penetrates the grains and, eventually, reaches a constant level of moisture content. Water absorption rate depends on the permeability and dimensions of the grains, composition, structure, initial moisture content and, mainly, temperature and immersion time [5,6]. In the case of wet milling, the dry product is initially hydrated to facilitate grinding and the acquisition of its compounds such as proteins, fibers, starch, among others [5]. Several studies have already been carried out on water absorption by grains such as rice [7], beans [8], chickpeas [9], peas [10] and lentils [11], among others.
The description of water migration from inside of an agricultural product to the external environment (air), or from the external environment (water) to inside of the product, is done through various types of mathematical models. The type of mathematical model to be chosen depends on the purpose of the study to be carried out. If the objective is only to describe the kinetics of water migration, a simple empirical model is generally satisfactory, and there are numerous works in the literature involving these models, both describing drying of products [8,12,13,14] and describing water absorption by products [5,15,16,17,18,19]. In these cases, the average moisture content at each instant of the transient regime is generally measured by the gravimetric method.
An alternative to the empirical model is the diffusion model, also used to describe water migration in agricultural products. The advantage of diffusion models is that, in addition to describing the water migration kinetics, such models also describe the distribution of this liquid within the product at any time, during the transient regime referring to the process. A search in the literature shows diffusion models used to describe heat transfer [20,21,22,23], drying [4,13,24,25,26] and water absorption [15,27,28,29], among other processes.
To use simplified solutions of the diffusion equation, in many articles the mass diffusivity is considered to be a constant value throughout the water migration process and the volumetric variation is disregarded [21,28,30,31,32]. However, when water migrates to the external environment of the product or into the product, the composition of this product changes over time [3,33], as well as the solid/water ratio. In addition, the distribution of water within the product is not uniform during the transient process. Thus, it is very intuitive to understand that the mass diffusivity and the volume of the product must vary over time [29,34,35].
Still with regard to the use of diffusion models, in many articles available in the literature the geometry of the product is approximated to a simple geometric shape such as an infinite wall [31,35], cylinder [4,13,15,36] and sphere [9,37,38]. However, in these cases of geometric approximation, the main information from the diffusion models cannot be considered: water distribution inside the product over time. It is through information about water (and/or temperature) distribution in the product over time that water (and/or thermal) stresses can be determined. It is through knowledge of these stresses that it is possible to predict the formation of cracks in the product [39].
During moisture migration, although water distribution over time can be determined, for example, by magnetic resonance imaging, or other methods involving imaging [8,40,41], this distribution can be predicted by an appropriate diffusion model. In this case, product geometry must be as close as possible to the real geometry [21,25,30,42,43]. In addition, the model must consider not only the mass diffusivity with a variable value, as a function of the local value of the moisture content, but also the volumetric variation over time. In this context, the objectives of this article are defined below.
This article proposes a two-dimensional diffusion model to describe water absorption by red rice during soaking, considering variable mass diffusivity as a function of the local moisture content and, also, variable volume over time. To use a mesh as close as possible to the real geometry of the grain, the diffusion equation was written in generalized coordinates and solved numerically using the Finite Volume method, with a fully implicit formulation. As this solution requires the creation of a mesh, this mesh was obtained from a photograph of a grain of the product. The water absorption experiments were carried out at constant temperatures, lower than the gelatinization temperature of the product.

2. Materials and Methods

2.1. Assumptions

Initially, the assumptions for the experiments of water absorption by husked red rice and the mathematical model proposed to describe the process are presented:
1) In the experiments, simple and inexpensive devices must be used in all measurements performed;
2) Husked red rice grains were considered as a homogeneous and isotropic medium;
3) Moisture migration can be described by the phenomenon of mass diffusion;
4) In the analyses, the geometry to represent the rice grain must be as close as possible to the real geometry, and axisymmetric conditions are assumed for a flat area of revolution rotating around its axial axis;
5) In solving the diffusion equation, the increase in grain volume during water absorption must be considered over time, and is assumed to be equal to the volume of water absorbed;
6) In solving the diffusion equation, variable mass diffusivity must be considered as a function of the local moisture content.

2.2. Water Absorption Experiments

2.2.1. Description of the Experiments and Measurements

Husked red rice (Oryza sativa L.), with moisture content of 0.1356 (d.b.), was purchased at the local market in the city of Piancó, Paraíba, Brazil. Broken and defective grains were removed from the sample to be studied. In the product immersion experiments, carried out in Campina Grande, Paraíba, Brazil (Federal University of Campina Grande), a water bath device with adjustable temperature (Kacil brand, model BM02) was used. The experiments were carried out in triplicate at constant temperatures of 28.0, 40.0 and 50.0 °C. Drinking water was placed in the water bath device and, after the system had reached the previously stipulated temperature, three baskets with 10.000 g of husked red rice each were immersed in the water. As the device holds 9.00 L of water, immersing the three small baskets does not significantly alter the previously set temperature. The mass of each of the three baskets with husked red rice was measured every 30.0 minutes, using a digital scale with an accuracy of 0.001 g. The same digital scale was used to measure the mass of each of the three empty baskets, identified by numbers 1, 2 and 3. For the water absorption kinetics, the mass measurements at 28.0 °C were performed up to 450.0 min. For 40.0 and 50.0 °C, these measurements were performed up to 390.0 and 300.0 min, respectively. After the measurements for a given temperature, the immersion process continued for more 15.0 hours to ensure that the equilibrium moisture content was reached and determined [7]. In these experiments, time was measured with a stopwatch available on a common cell phone.
The average diameter of the husked red rice grains was determined using a digital caliper with a resolution of 0.01 mm, measuring the largest and smallest diameters in the central position of 50 randomly chosen grains. After measurements, the average diameter of the grains was calculated [7]. A similar procedure was used to determine the longitudinal length of the grains.

2.2.2. Moisture Content

The average moisture content absorbed by the husked red rice grains, M ¯ ( t ) , at an instant t (min), was calculated by the expression [44]
M ¯ ( t ) = m ( t ) H 2 O m 0 ,
where m ( t ) H 2 O is the mass of water (g) absorbed by the rice grains at the instant t, and m 0 is the initial mass of the product (g) in each basket. Once M ¯ ( t ) , given in g/g, was determined for each of the baskets 1, 2 and 3, the average of the three values obtained was calculated at each instant t.

2.2.3. Growth in the Volume of Husked Red Rice Grains Over Time

Lima et al. [25], studying banana drying, considered that, at instant t, the shrinkage of the product is equivalent to the volume of water lost at the same instant. A similar idea was proposed by Lentzou et al. [35], studying isothermal water migration in fruits, and Xanthopoulos et al. [45], studying water migration in tomato. In the present article, the equation below was proposed to calculate the volume of each rice grain over time, during the water absorption process, as also done by [35,45,46,47] and many other researchers:
V ( t ) V 0 = 1 . 000 + 1 . 441   × M ¯ ( t ) ,
where V(t), given in m3, is the volume of each rice grain at time t and V0 (m3) is its initial volume. This initial volume is determined by the sum of the volumes V0i of all control volumes i of a mesh representing the product. Each volume V0i is calculated by the inverse of the Jacobian of this control volume i, as will be seen in Section 2.3.2 and 2.3.3.

2.3. Mathematical Model for Description of Water Absorption

Due to the established assumptions, a numerical solution of the two-dimensional diffusion equation, including variable volume and mass diffusivity, will be necessary.

2.3.1. Diffusion Equation and System of Coordinates

As the kinetics of water absorption by rice grains must be described using the diffusion equation, such equation is given in its generic form, below [27,29,48,49]:
M t = · ( D M ) ,
In Cartesian coordinates, Equation (3), used to describe dehydration of a product or water absorption by a product, is given by the equation below [50]:
M t = x D M x + y D M y + z D M z ,
in which, in Equations (3) and (4), M (g/g) is water content on dry basis, t (min) is time and D (m2 min-1) is the mass diffusivity. In Equation (4), x, y and z are the coordinates that define a position in the Cartesian coordinate system.
The geometry of a husked red rice grain is close to the geometry of a solid obtained by the revolution of an ellipse-shaped flat area rotating around its axial axis. However, in this article, a mesh was created from the photograph of a grain of the product, as shown in Figure 1a,b.
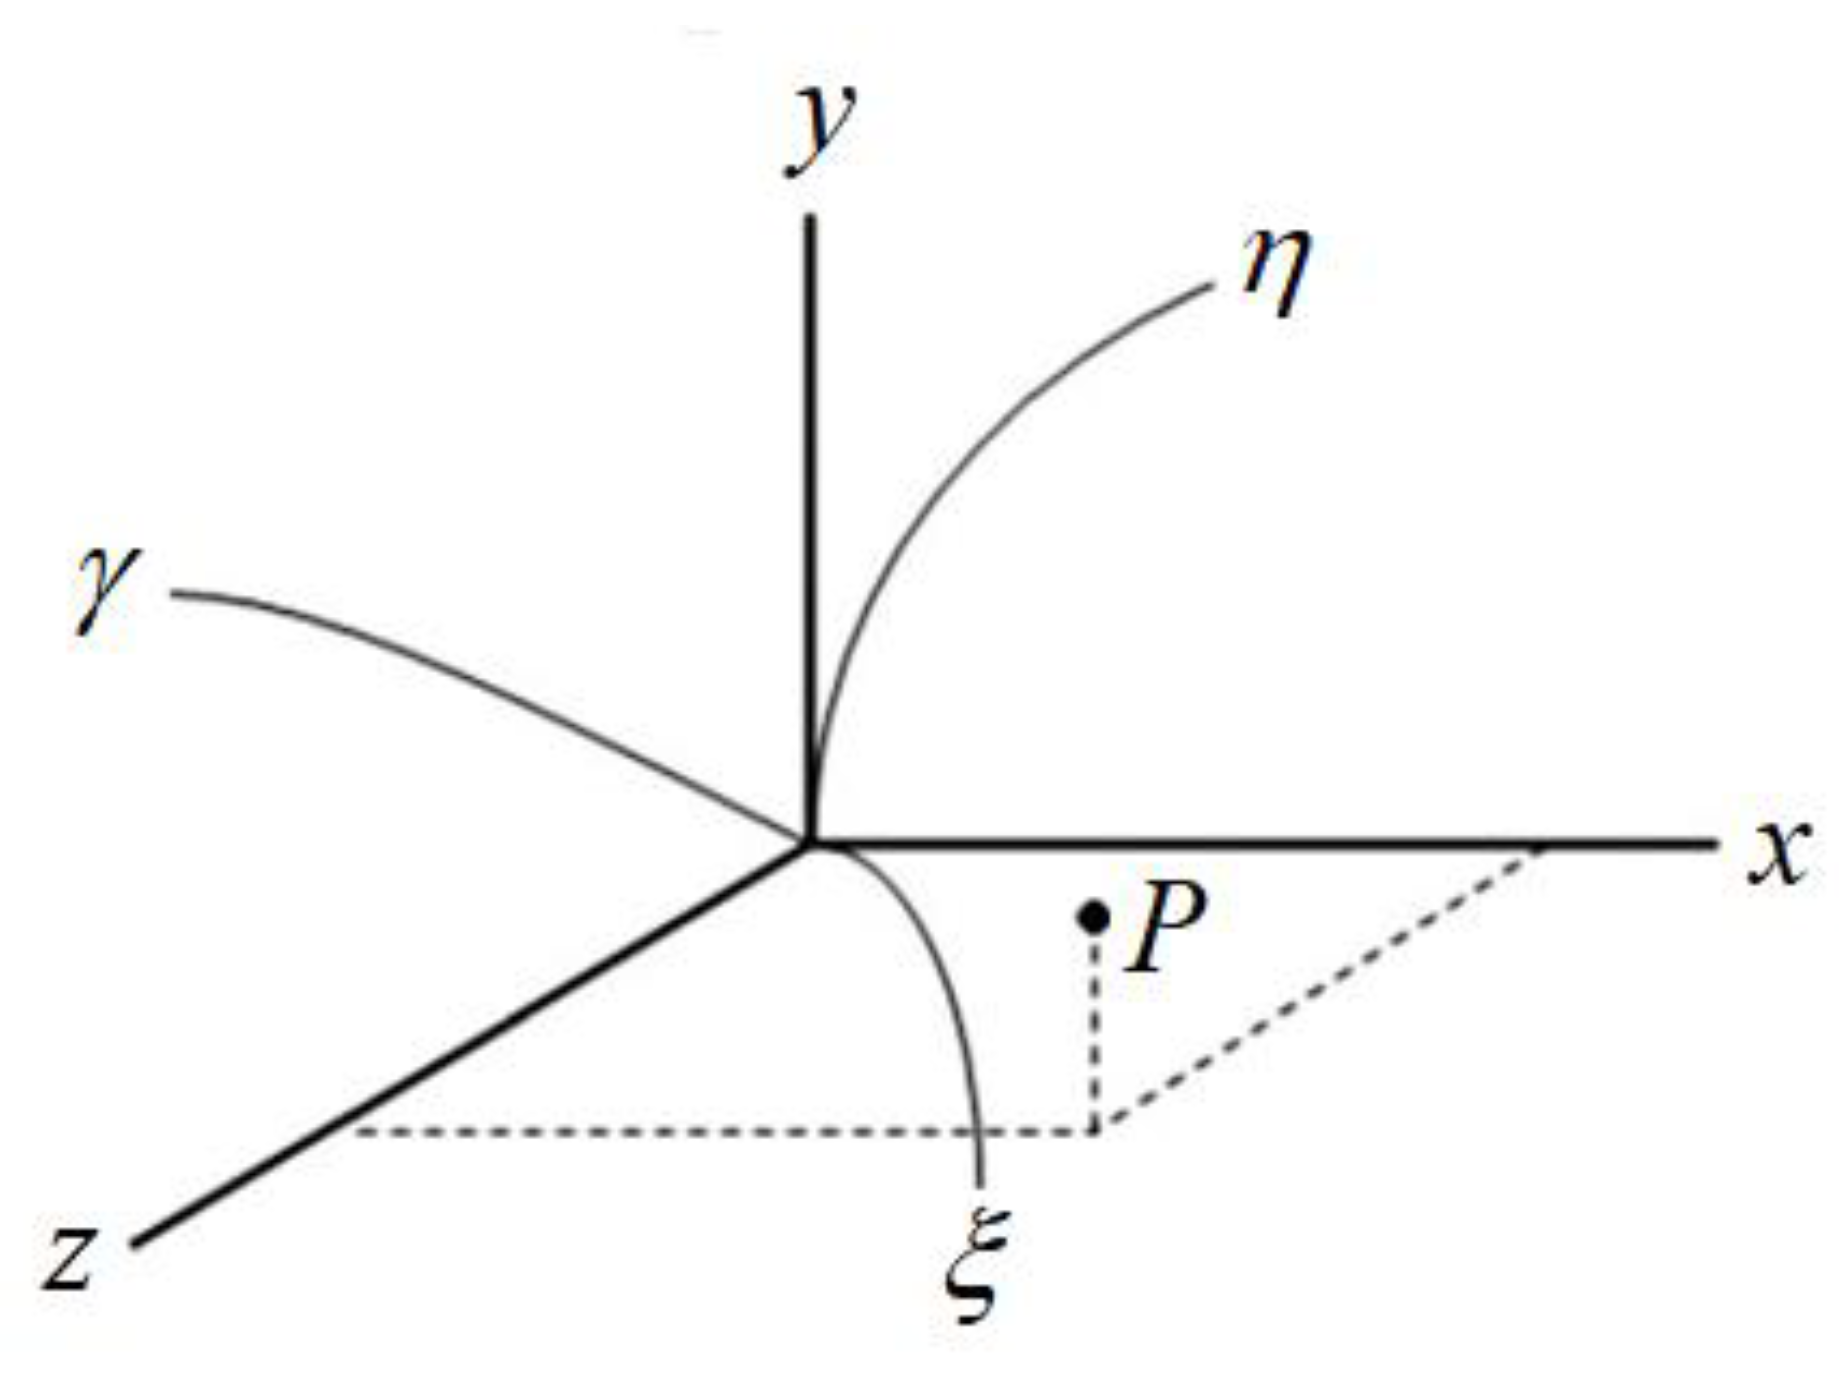
The geometry shown in Figure 1 will be used to create a mesh to describe water migration in the rice grains. Thus, Equation (4), written in Cartesian coordinates, is not appropriate. Due to that, the diffusion equation must be written in a body-fitted coordinate system, also called generalized coordinates ( ξ , η , γ ), which is a curvilinear system. For this purpose, Figure 2 presents the two coordinate systems and a point P that can be located through either of them.
Thus, a point P with coordinates ( x , y , z ) can also be located in generalized coordinates ( ξ , η , γ ) through appropriate correspondences, generically given by [51]:
ξ = ξ ( x , y , z ) ;   η = η ( x , y , z ) ,   γ = γ ( x , y , z ) .
Using the transformations presented in Equations (5), Equation (4) can be written in generalized coordinates as follows [51,52]:
t M J = ξ α 11 J D M ξ + α 12 J D M η + α 13 J D M γ + η α 21 J D M ξ + α 22 J D M η + α 23 J D M γ + γ α 31 J D M ξ + α 32 J D M η + α 33 J D M γ ,
where terms of the type α n m contain partial derivatives relating Cartesian coordinates (x, y, z), and ( ξ , η , γ ), that is, generalized coordinates.

2.3.2. Solution of the Two-Dimensional Diffusion Equation in Generalized Coordinates

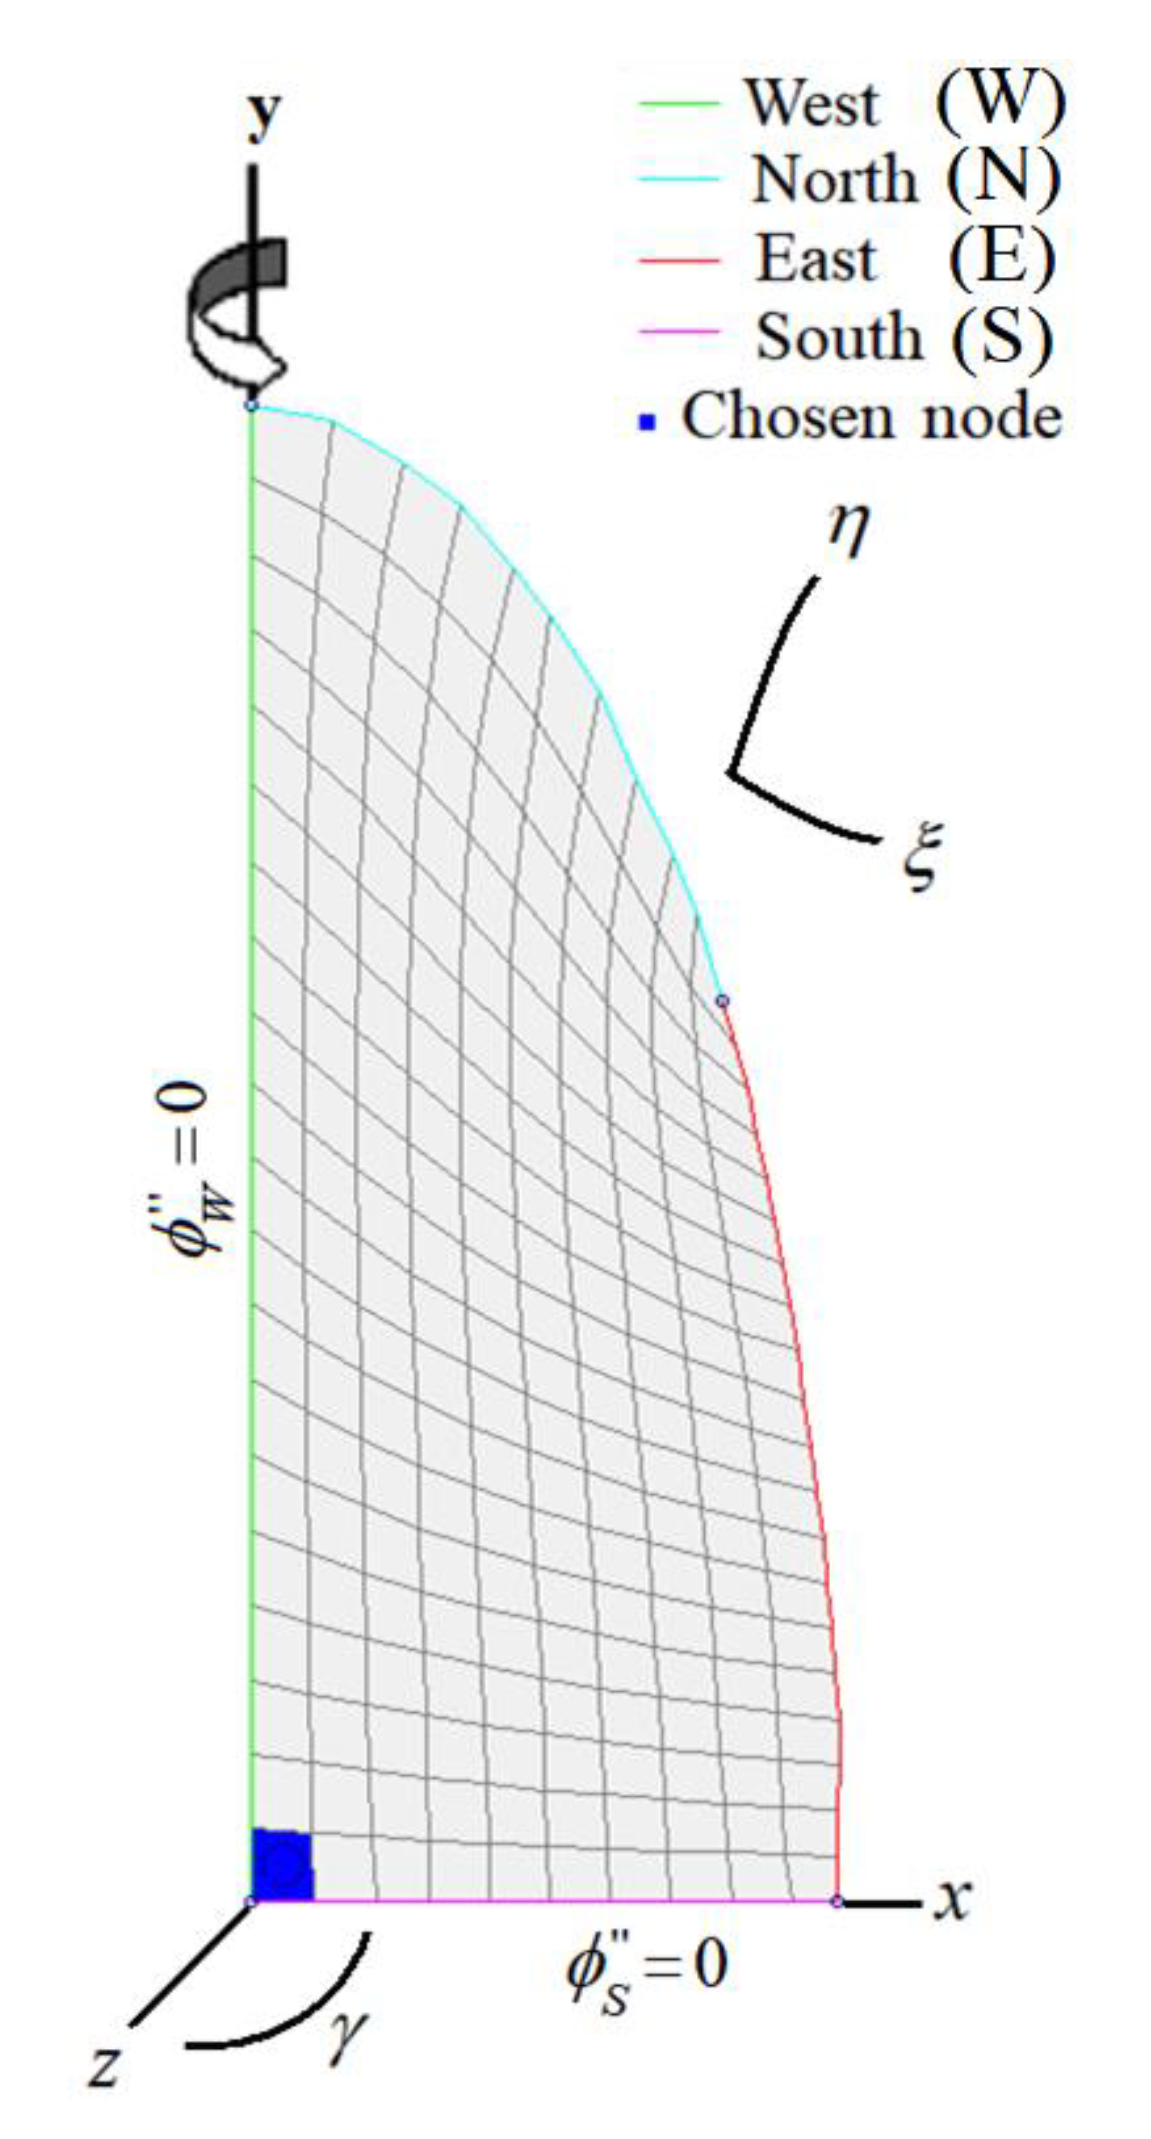
For a solid obtained by the revolution of a flat area (contained in a particular ξ η or xy, that is, contained in a vertical plane) rotating around its axial axis (y), as shown in Figure 3, the third term on the right side of Equation (6) is zero. This statement is due to symmetry, that is, axisymmetric conditions were assumed for the physical situation under study. For a solid of this type, the derivatives of x and y with respect to γ as well as the derivatives of z with respect to ξ and η are equal to zero, as the generating area is contained in a vertical plane ξ η (or xy), while z and γ are contained in a horizontal plane, as shown in Figure 3.
In Equation (6), J is the Jacobian of the transformation of Cartesian coordinates (physical domain) into generalized coordinates (transformed or computational domain). It is interesting to observe that, in the solution of Equation (6), J must be calculated in the nodal point (centroid) of each control volume of the discretized domain. For a revolution solid as that presented in Figure 3, Jacobian of a control volume is given by [53]:
1 J = x ξ x η 0 y ξ y η 0 0 0 z γ ,
where terms of the type kw should be interpreted as k / w . It is interesting to note that, in a mesh (Figure 3, for example), the inverse of the Jacobian, J, calculated at a given nodal point (central point of each area element) corresponds to the volume of the solid generated by the rotation of that area element, according to Pappus-Guldin Theorem [34,54]. On the other hand, due to the symmetry, the only terms of the type α n m that are non-zero in Equation (6) are presented below:
α 11 = z γ 2 ( x η 2 + y η 2 ) ;   α 12 = α 21 = - z γ 2 ( x ξ x η + y ξ y η ) ;   α 22 = z γ 2 ( x ξ 2 + y ξ 2 ) .
The expressions for x ξ , x η , y ξ , y η and z γ are presented by Silva et al. [53]. It is interesting to observe that the terms containing α i j that appear in the Equations (6) and (8), in which i j (such as α 12 and α 21 ), are terms that appear in the equations due to the non-orthogonality of the mesh.
The solution to Equation (6) was numerically presented by Silva et al. [53] , using the Finite Volume method with a fully implicit formulation, with time and domain discretization (see also [21] and [51]. Silva et al. [53] developed a software called Diffusion RE (Revolution and Extrusion), using their numerical solution. The software is available at www.labfit.net/Diffusion.htm (only for Windows XP), and the bases for the software development are also available in Da Silva et al. [52] and Maliska [51]. Such software was used in the present article to describe water absorption by husked red rice. The numerical solution requires the creation of a flat mesh like the one in Figure 3, which when rotated around its axial axis generates a solid in the shape close to half a grain of rice (used due to symmetry), as shown in [52].
The appropriate boundary conditions for the flat area shown in Figure 3, whose rotation represents half a grain of red rice, are: zero water flux, ϕ   = 0 , to the west and south boundaries (boundary condition of the second kind) due to the symmetry; and zero resistance to water flux for the north and east boundaries (boundary condition of the first kind). It is interesting to note that, although the third kind boundary condition has already been used to describe water transfer in rice [36], the boundary condition of the first kind for grains immersed in an aqueous medium (or in dry air) is the most frequently found in the literature [7,30,32,42,48]. It is important to highlight that, based on the results obtained by Balbinoti et al. [36], the Biot number for water transfer is greater than 100, meaning, in practical terms, first-kind boundary condition (not third-kind boundary condition).
In this numerical solution contained in Diffusion RE software, the system of equations in each time step was solved using Gauss-Seidel method [55], with a tolerance of 10-8 to reach the convergence.

2.3.3. Grid Generation, Grid and Time Refinement, Average Moisture Content, and Optimizations

For husked red rice, due to symmetry, the flat mesh is a non-orthogonal two-dimensional structured mesh, and was obtained using 2D Grid Generation Software, developed using Finite Difference method, available at www.labfit.net/gg.htm (only for Windows XP). To use the Grid Generation Software, the program requires a photograph (or drawing) of the product, and this photo was taken with a common cell phone camera. Figure 1(a) makes it possible to define the half-grain contours in two dimensions, shown in Figure 1(b). The identification of the contours of a domain to create a mesh is done, in 2D Grid Generation Software, through a sequence of mouse clicks on the photo (or drawing) in a system of axes, with information on the respective coordinates x and y, to define the scales for the axes; and a sequence of clicks on points established by the user at south, west, east and north boundaries. These steps are shown in the animated gif available at www.labfit.net/Steps.gif for a flat area. It is worth noting that, once the scales for x and y have been defined, each click on a point on the contours is converted into coordinates (x,y) of that point. Through the coordinates of the points established for the contours (south, west, east and north), the coordinates of the internal intersections of the north-south lines with the east-west lines are determined. As mentioned, the mesh was generated only for half a grain, as can be seen in Figure 1(b), which also presents a control volume in blue (chosen node) that corresponds to the center of the whole grain. Thus, it is possible to describe not only the unsteady state of the average moisture content, M ¯ ( t ) , but also the transient regime of the central region of the grain M1(t), in which the subscript “1” represents the control volume at the central point of the grain (chosen node). Rigorously, with the solution available in Diffusion RE Software, the transient state of all control volumes is known over time. However, only the information on control volume in blue (central point of the grain) was selected in this research to study its transient state, M1(t). Consequently, the developed software generates information on the transient state of this control volume, in addition to the information on the average value of the absorbed moisture content over time, M ¯ ( t ) .
A mesh refinement study has indicated that the 10×20 mesh is enough for a relative tolerance of 10-5 on the results. The time step was stipulated as 0.25 min (15.0 s) for all optimizations and simulations.
In the optimizations and simulations of water absorption by husked red rice, the average moisture content M ¯ ( t ) at each time t was calculated by the following expression [34,50,53]:
M ¯ ( t ) = 1 i = 1 N V i i = 1 N M i V i   or   M ¯ ( t ) = 1 i = 1 N 1 J i i = 1 N M i 1 J i ,
in which Mi and Vi are the moisture content and volume of the control volume i (given by Vi = 1/Ji, referring to control volume i), with N being the number of control volumes of the mesh
As it is known, during water migration in an agricultural product, the variable mass diffusivity, D, increases with increasing local moisture content, M [34,50]. In this study, for water absorption by husked red rice, a relationship was proposed between the mass diffusivity and the local moisture content given by the expression [29,34,56,57]
D ( M ) = b e a M ,
and this expression was used in Equation (6) to determine the local mass diffusivity, that is, to determine the parameters a and b that minimize the differences between each experimental value M ¯ ( t ) exp and the correspondent simulated value M ¯ ( t ) s i m , for each temperature T, through the inverse method. This determination, for each temperature, was performed using LS Optimizer Software, which uses Levenberg-Marquardt algorithm [58,59]. This software, developed by the first author of this article, is freely available at www.labfit.net/LS.htm. After determining the parameters a and b by optimization, Equation (10) (with the values of a and b) is also replaced in Equation (6), to perform simulation of the kinetics of water absorption by husked red rice, at each previously stipulated temperature.
The statistical indicators used to evaluate each optimization process were the chi-square ( χ 2 ) and the determination coefficient ( R 2 ), both calculated and made available by LS Optimizer Software. Additionally, Student’s t-test was used to determine the statistical significance of each parameter obtained in the optimizations.

3. Results and Discussion

Using the diffusion model proposed in this article, all results to be obtained depend only on the average moisture content over time, the equilibrium moisture content (both obtained by the gravimetric method), and also the shape and dimensions of the husked red rice grain (Figure 1).

3.1. Results and Comments

The equilibrium moisture contents for husked red rice were 0.2453, 0.3110 and 0.3361 at temperatures of 28, 40 and 50 °C, respectively. The average diameter and length of husked red rice grains were 2.40 (radius R of 1.20) and 6.10 (half a length L of 3.05) mm, respectively. These results obtained for the dimensions are close to those obtained by Wahengbam et al. [60], when studying brown rice, and those obtained by Balbinoti et al. [36], when studying paddy rice cultivar BR-IRGA 409. The values of the average moisture content of the grains over time, for each temperature, will be presented in the water absorption kinetics graphs. The shape of the grain was obtained through its photograph, which was presented in Figure 1. This photograph was used to define the non-orthogonal two-dimensional structured mesh (Figure 3).

3.1.1. Optimizations

The application of the inverse method to the experimental data sets, also known as optimization, makes it possible to obtain the parameters a and b from Equation (10) and, consequently, the mass diffusivity for husked red rice at temperatures of 28, 40 and 50 °C. In the present research, the optimizer called LS Optimizer Software was used, as mentioned in the Methodology Section. The results for each temperature, as well as the statistical indicators (determination coefficient, R2, and chi-square, χ2), are presented in Table 1.
As can be seen in Table 1, the statistical indicators obtained in the optimizations can be considered excellent. Furthermore, the t-test indicates zero probability of each parameter being zero, despite the value obtained, that is, the values obtained for the parameters in Table 1 are statistically significant. These statistical indicators suggest that the proposed model for the water diffusivity as a function of the local moisture content, given by Equation (10), should be considered satisfactory in describing the process.
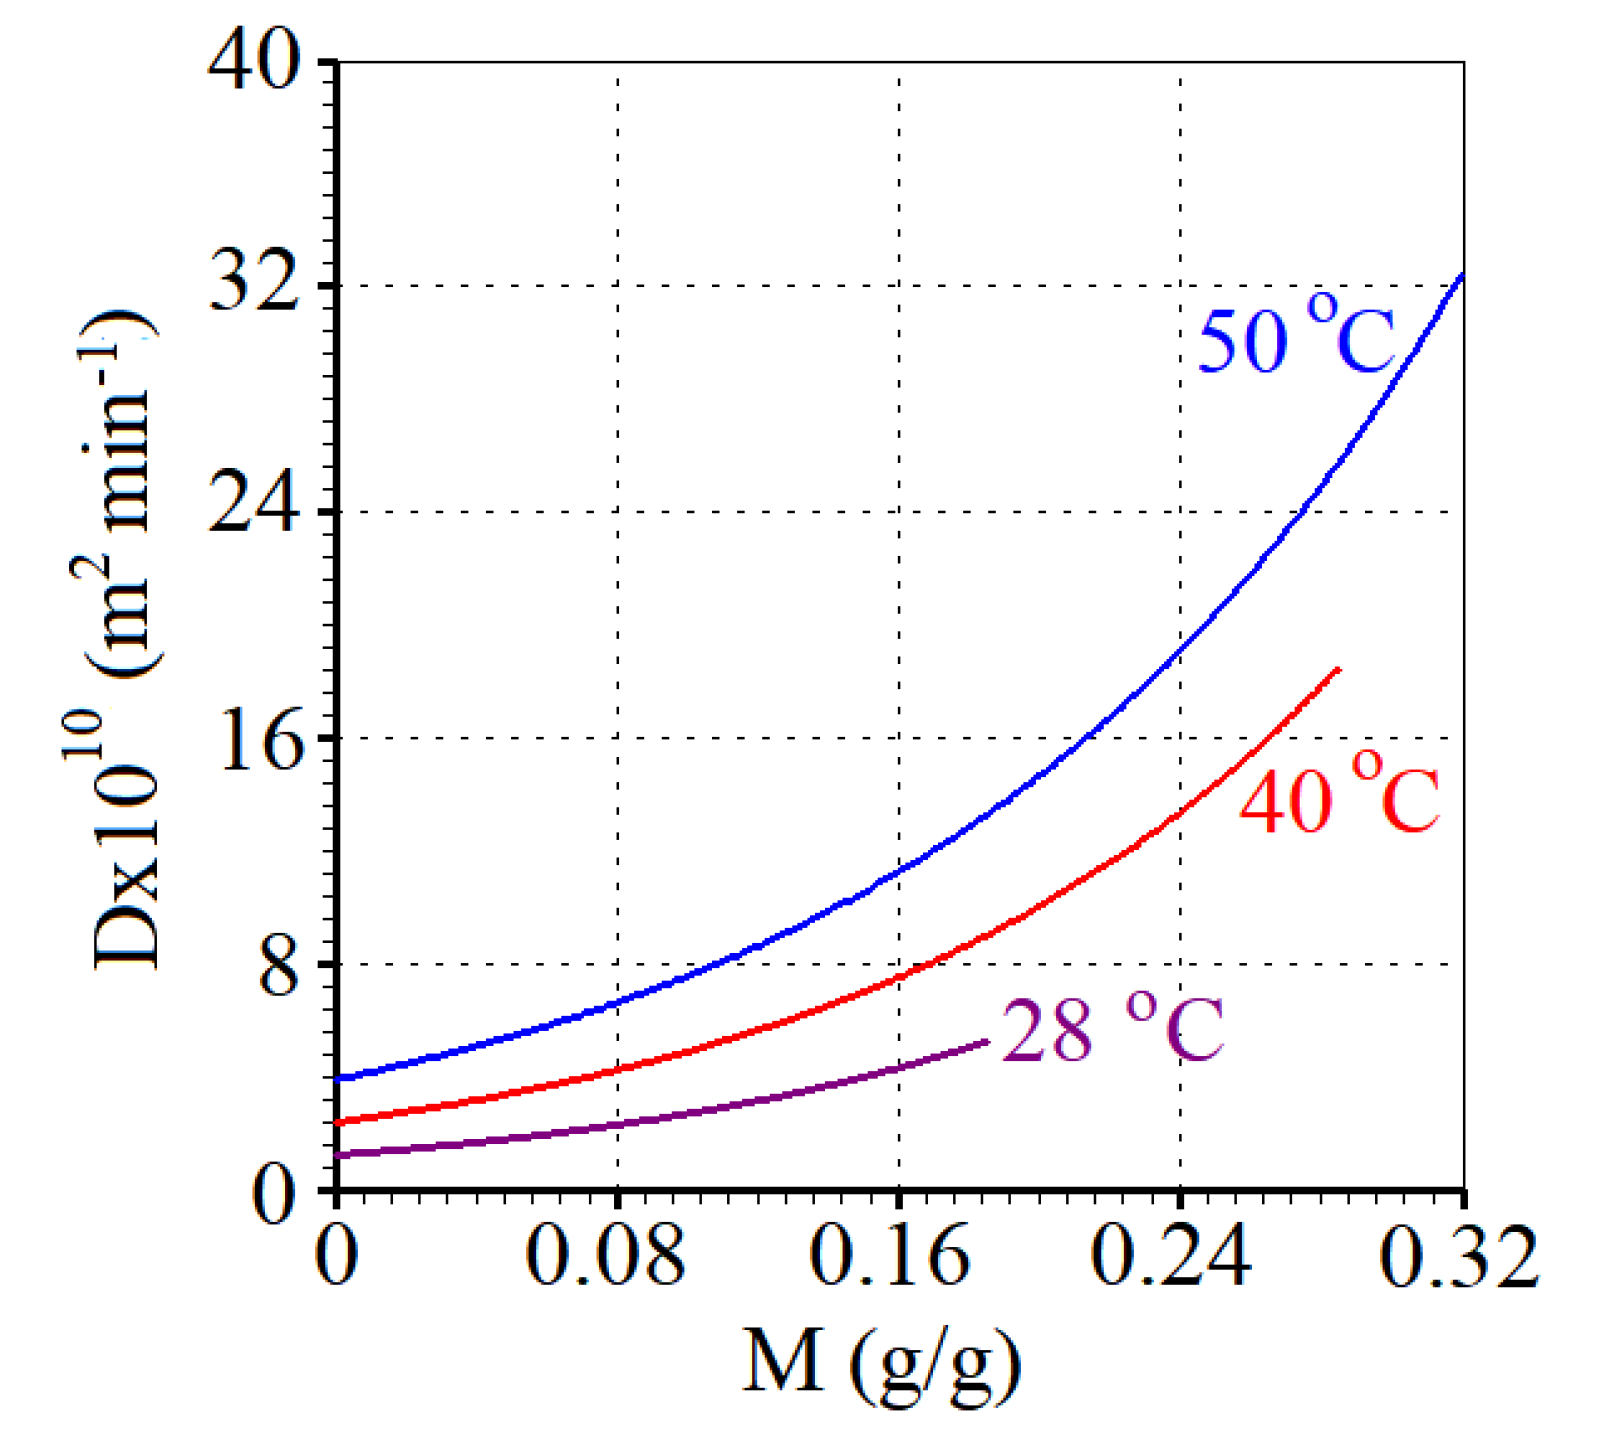
The three mass diffusivities as a function of the local moisture content are given, now, by Equation (10), with the values of a and b provided in Table 1. Thus, for each temperature, the water diffusivity as a function of the local moisture content can be visualized in Figure 4.
With the results obtained in Table 1 for the parameters a and b, Table 2 can be obtained to relate a temperature T and a value previously established for the local moisture content M to the respective value of the mass diffusivity D, calculated through Equation (10).
The data set available in Table 2 was analyzed by LAB Fit Curve Fitting Software (www.labfit.net). LAB Fit offers a feature, called Finder, which consists in fitting all functions with two independent variables available in its library to the data set provided to the software. The best function is chosen based on the criterion of the lowest chi-square. For the data set in Table 2, LAB Fit suggests the following function, in which the three parameters have already been calculated:
D ( M , T ) = 13.6 3 e ( 65.04 T + 6.785 M ) ,
with the following statistical indicators: χ2 = 8.9094×10⁻² and R2 = 0.9993.
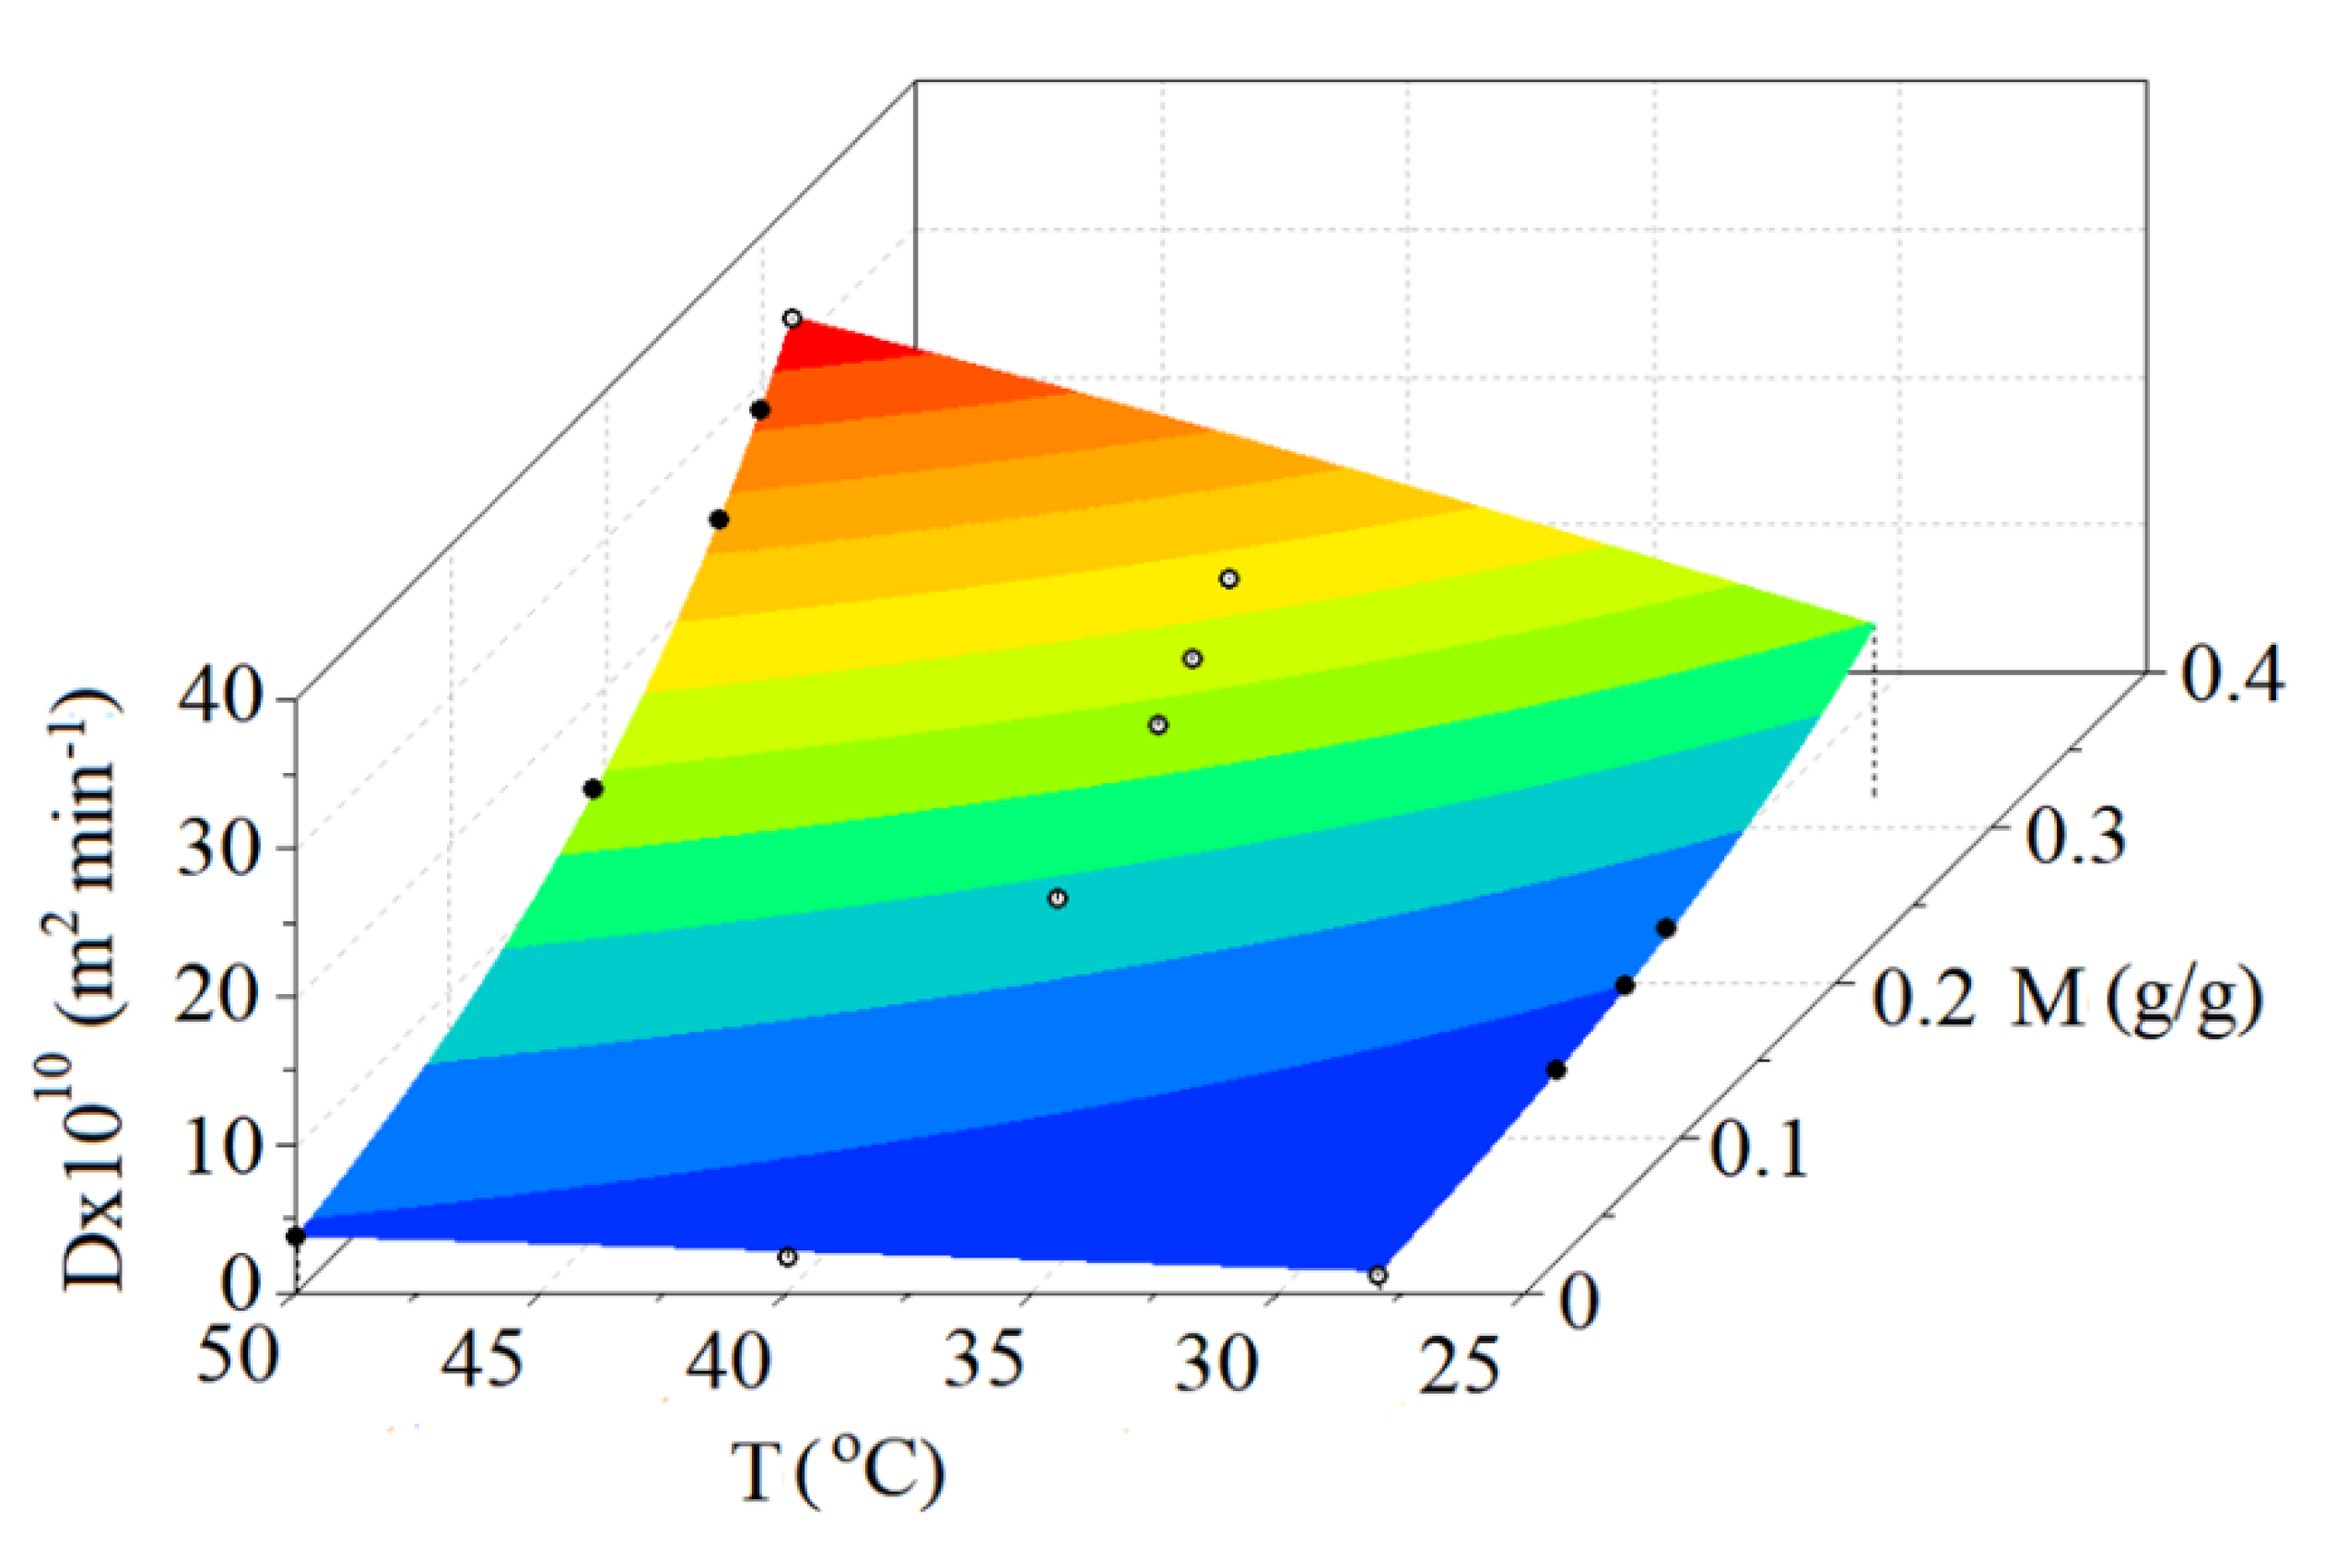
Visually, the fitting result can be seen in Figure 5, in which the experimental points are represented by small circles. Filled circles are on or slightly above the surface, while empty circles are slightly below the surface.
It is interesting to note that Equation (11) makes it possible to estimate an expression for mass diffusivity as a function of the local moisture content at temperatures different from those stipulated in the experiments, and reasonably to predict new simulations.
Once the expression for the mass diffusivity has been determined by optimization (Equation (10) and Table 1) or estimated by Equation (11), simulations can be carried out, with useful information about various characteristics of the studied process, as will be presented below.

3.1.2. Simulations

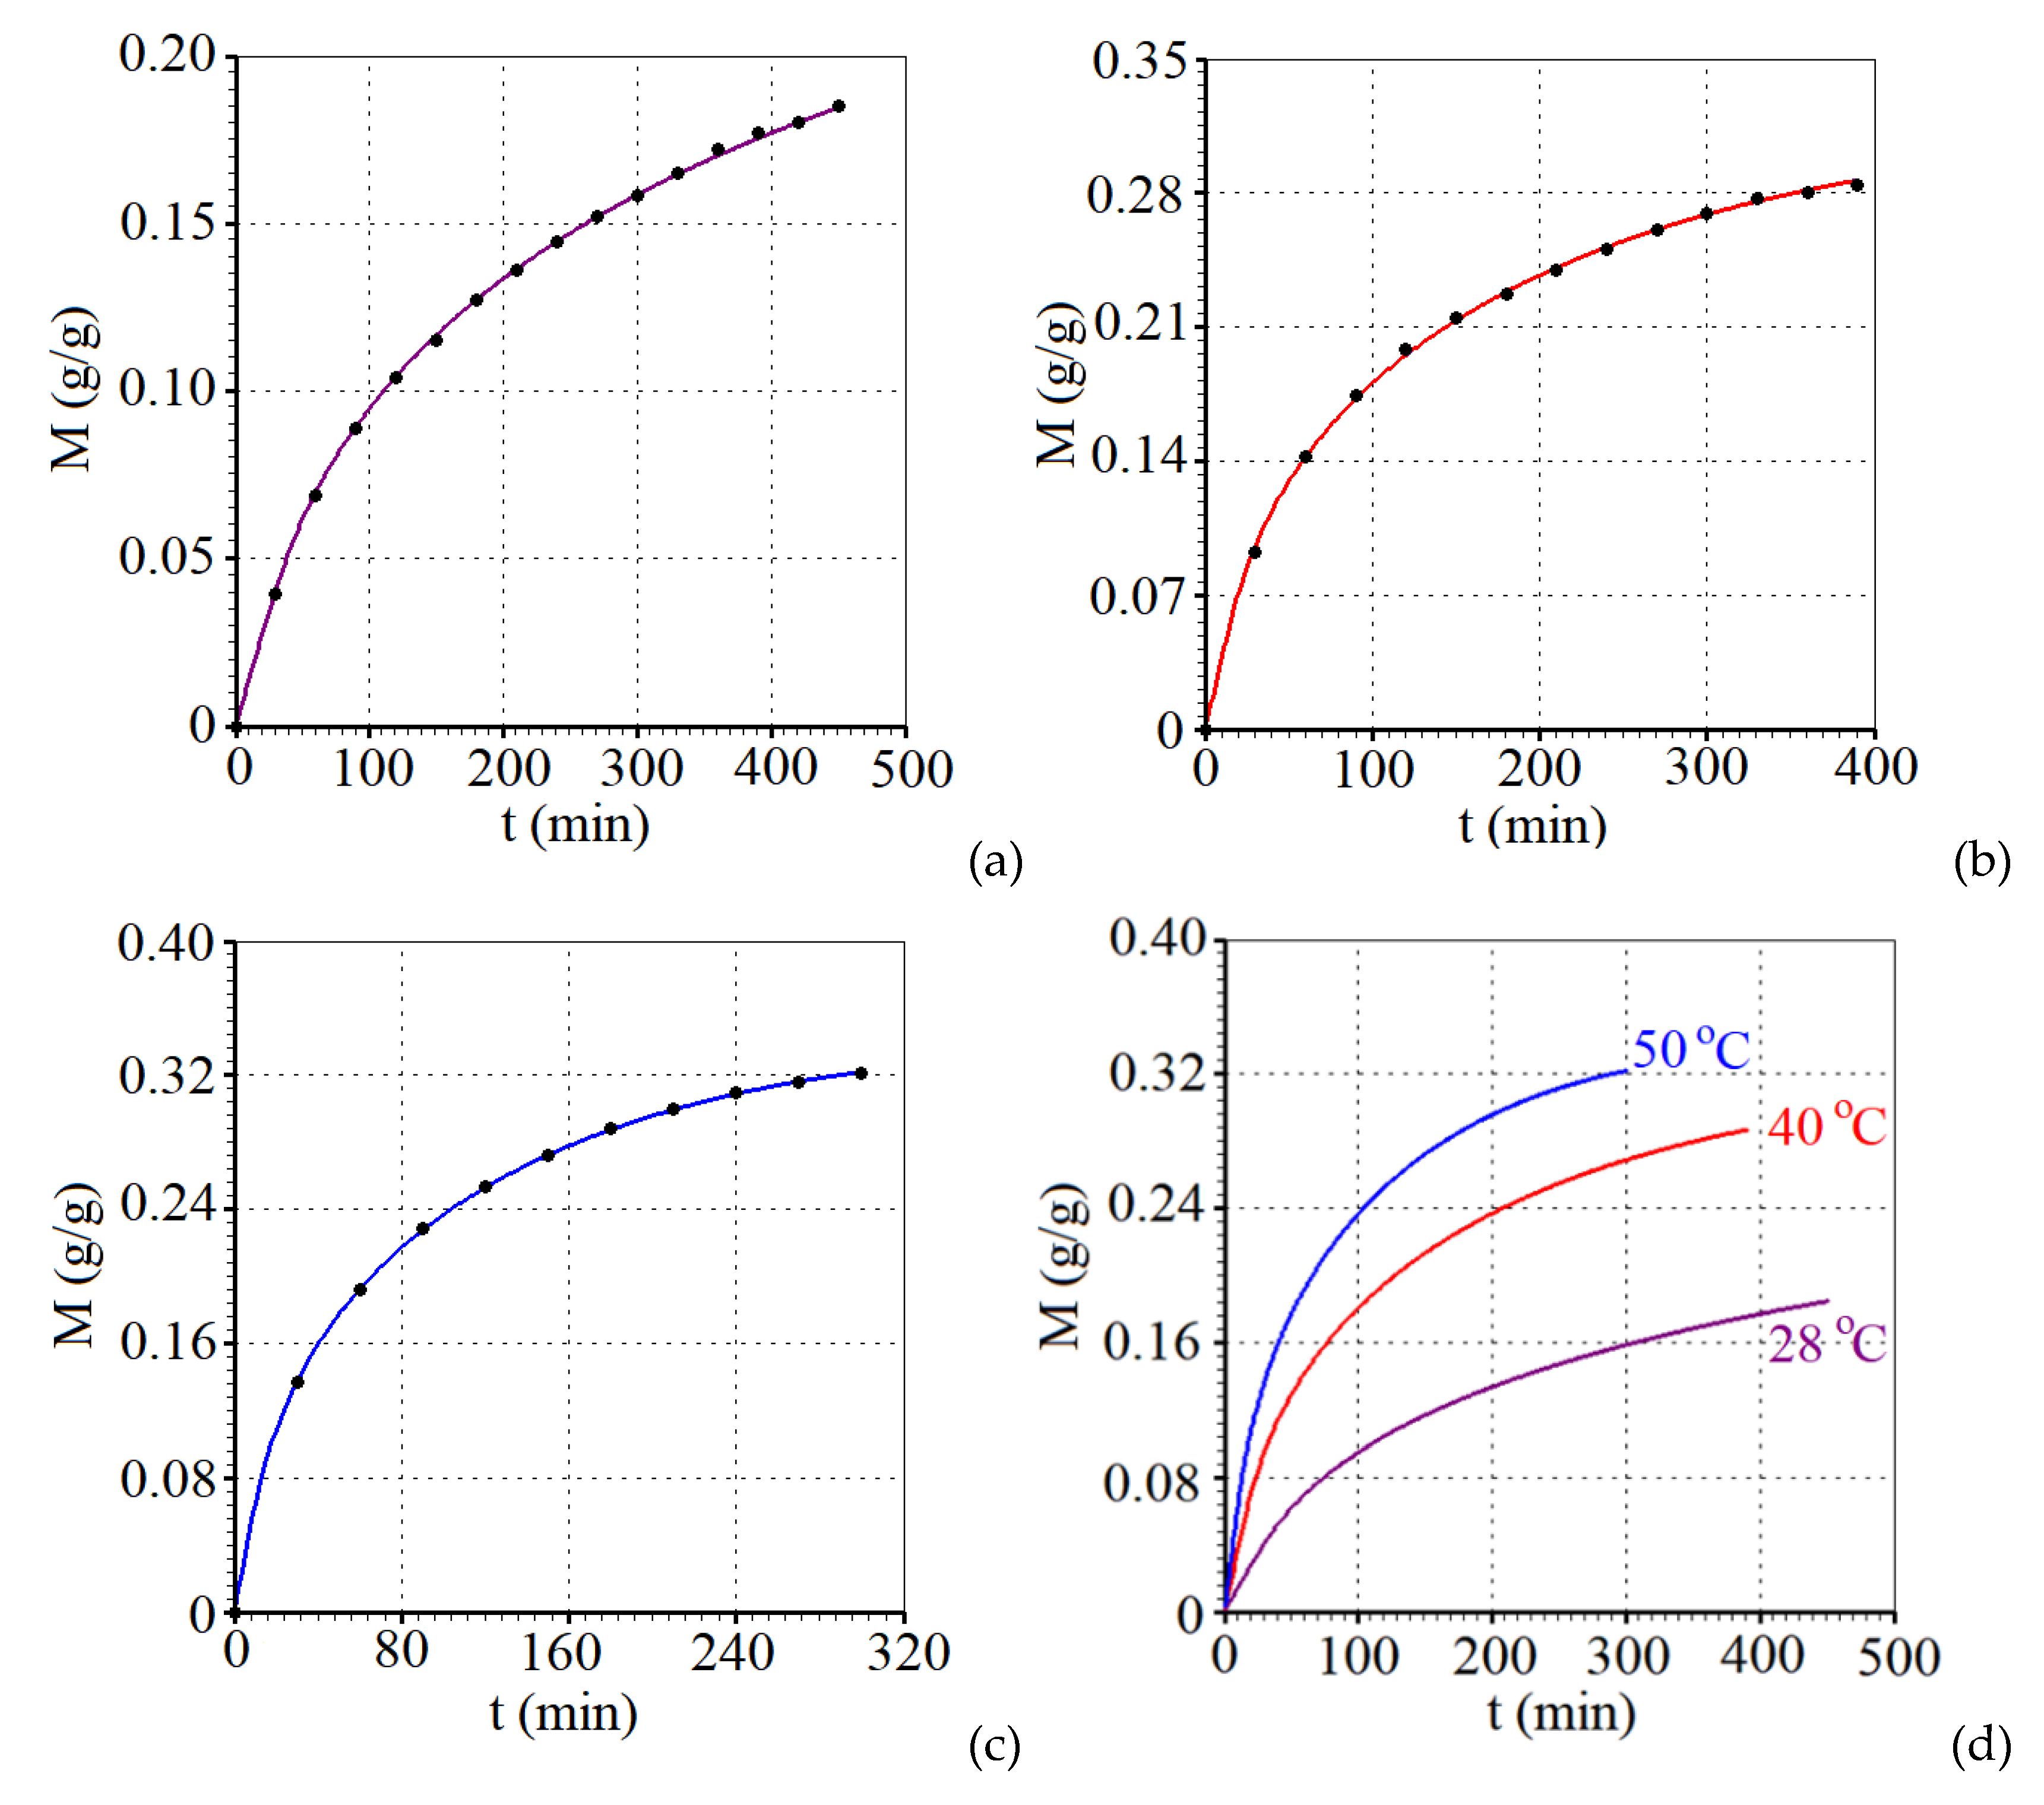
According to the proposed model, the kinetics of water absorption by husked red rice can now be presented for each of the temperatures studied, as well as their superposition, and all this information is shown in Figure 6.
It is worth mentioning that, in both optimizations and simulations, the expression used for mass diffusivity as a function of local moisture content was that given by Equation (10). In the case of simulations of water absorption kinetics at temperatures of 28, 40 and 50 °C, the values of the parameters a and b available in Table 1 were used.
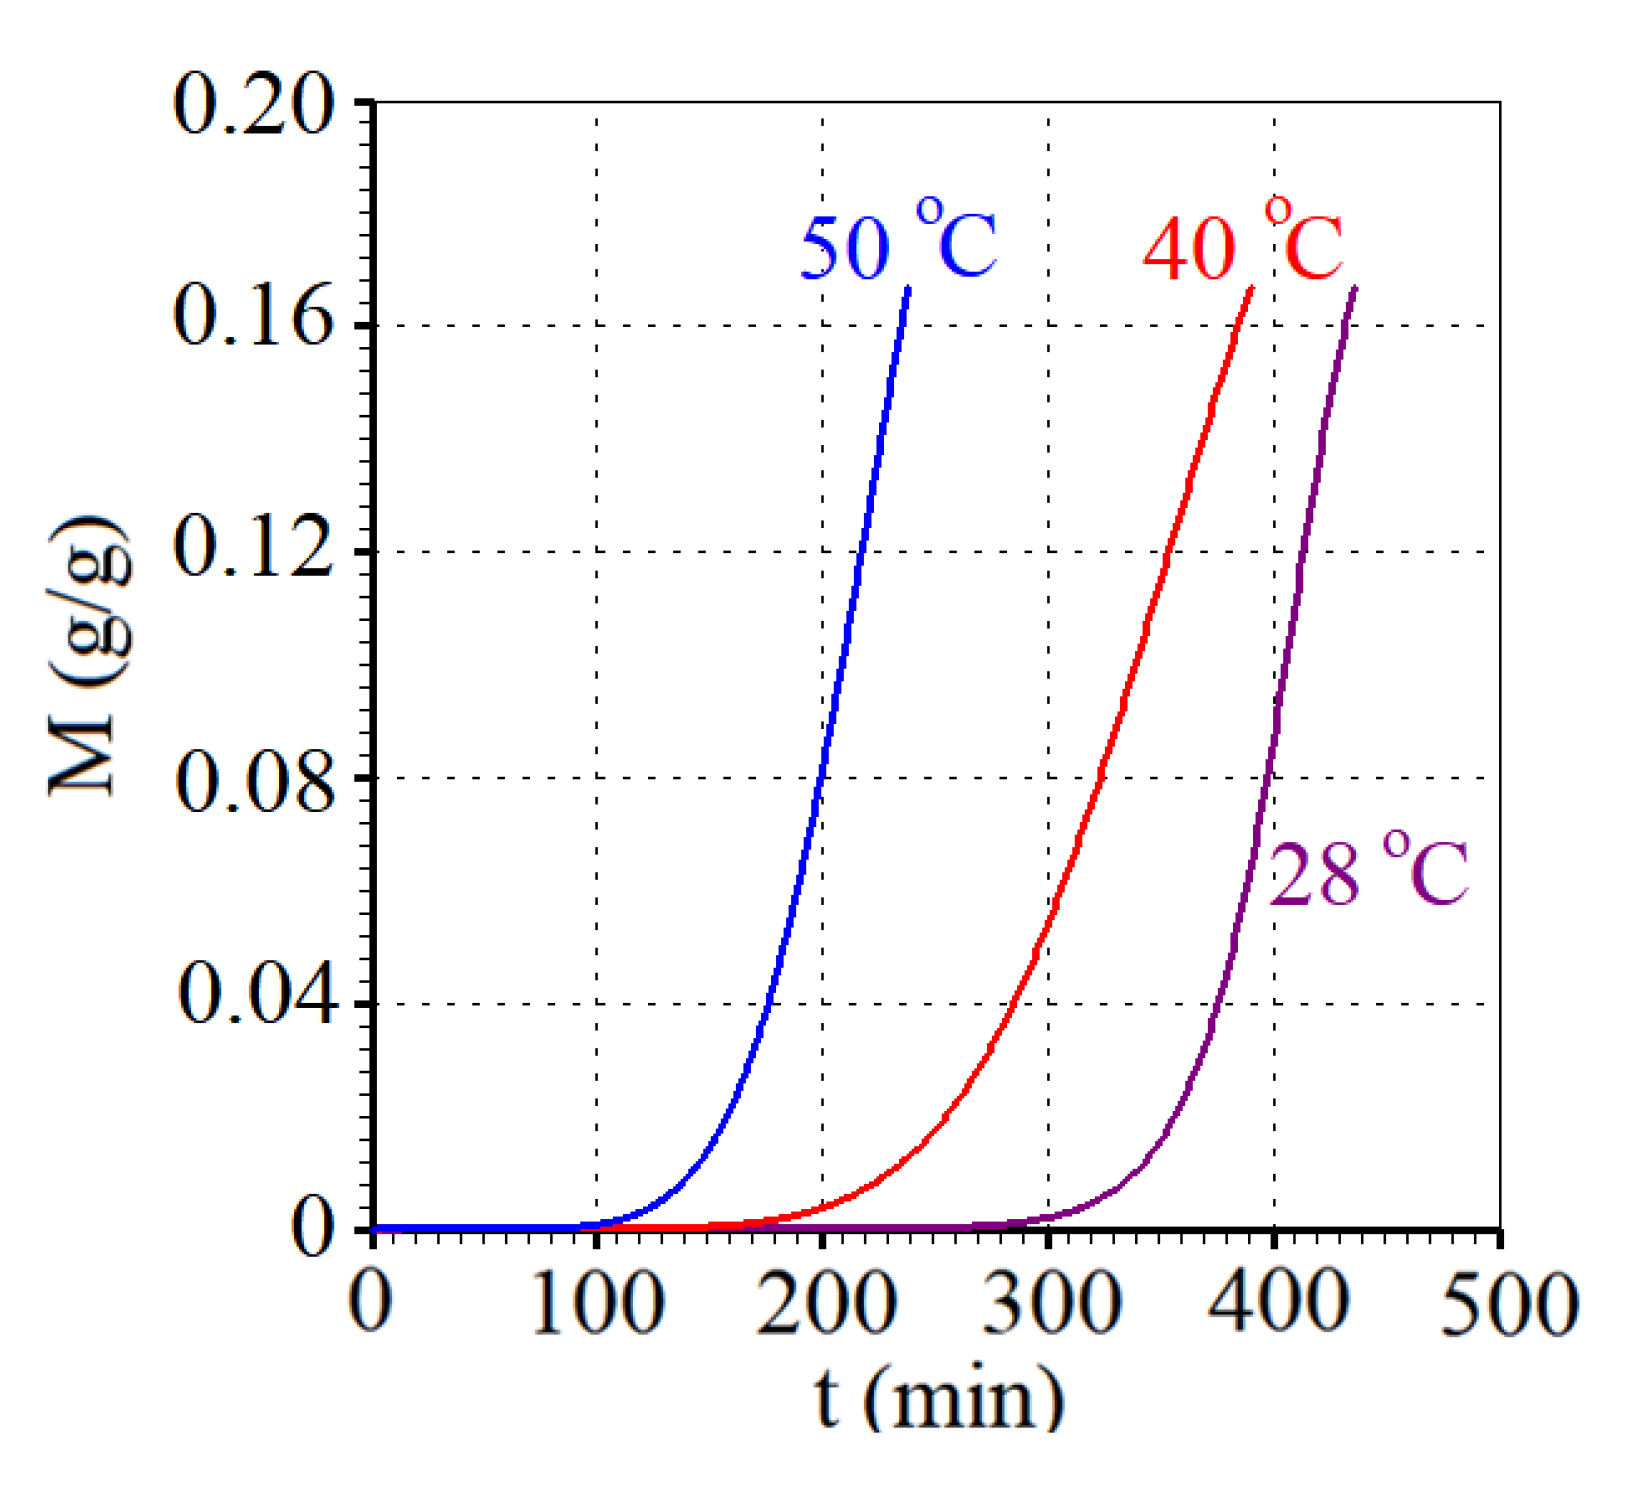
The moisture absorption kinetics at the central point of the husked red rice grain (chosen node, that is, control volume in blue shown in Figure 3) can be obtained with the proposed model, and it is shown up to a moisture content of 0.167 g/g for all temperatures, in Figure 7.
Regarding moisture content, an observation in Figure 7 shows a seemingly obvious phenomenon, but which can be predicted by the proposed model: the lag factor at the central point of the grain increases as the temperature decreases.
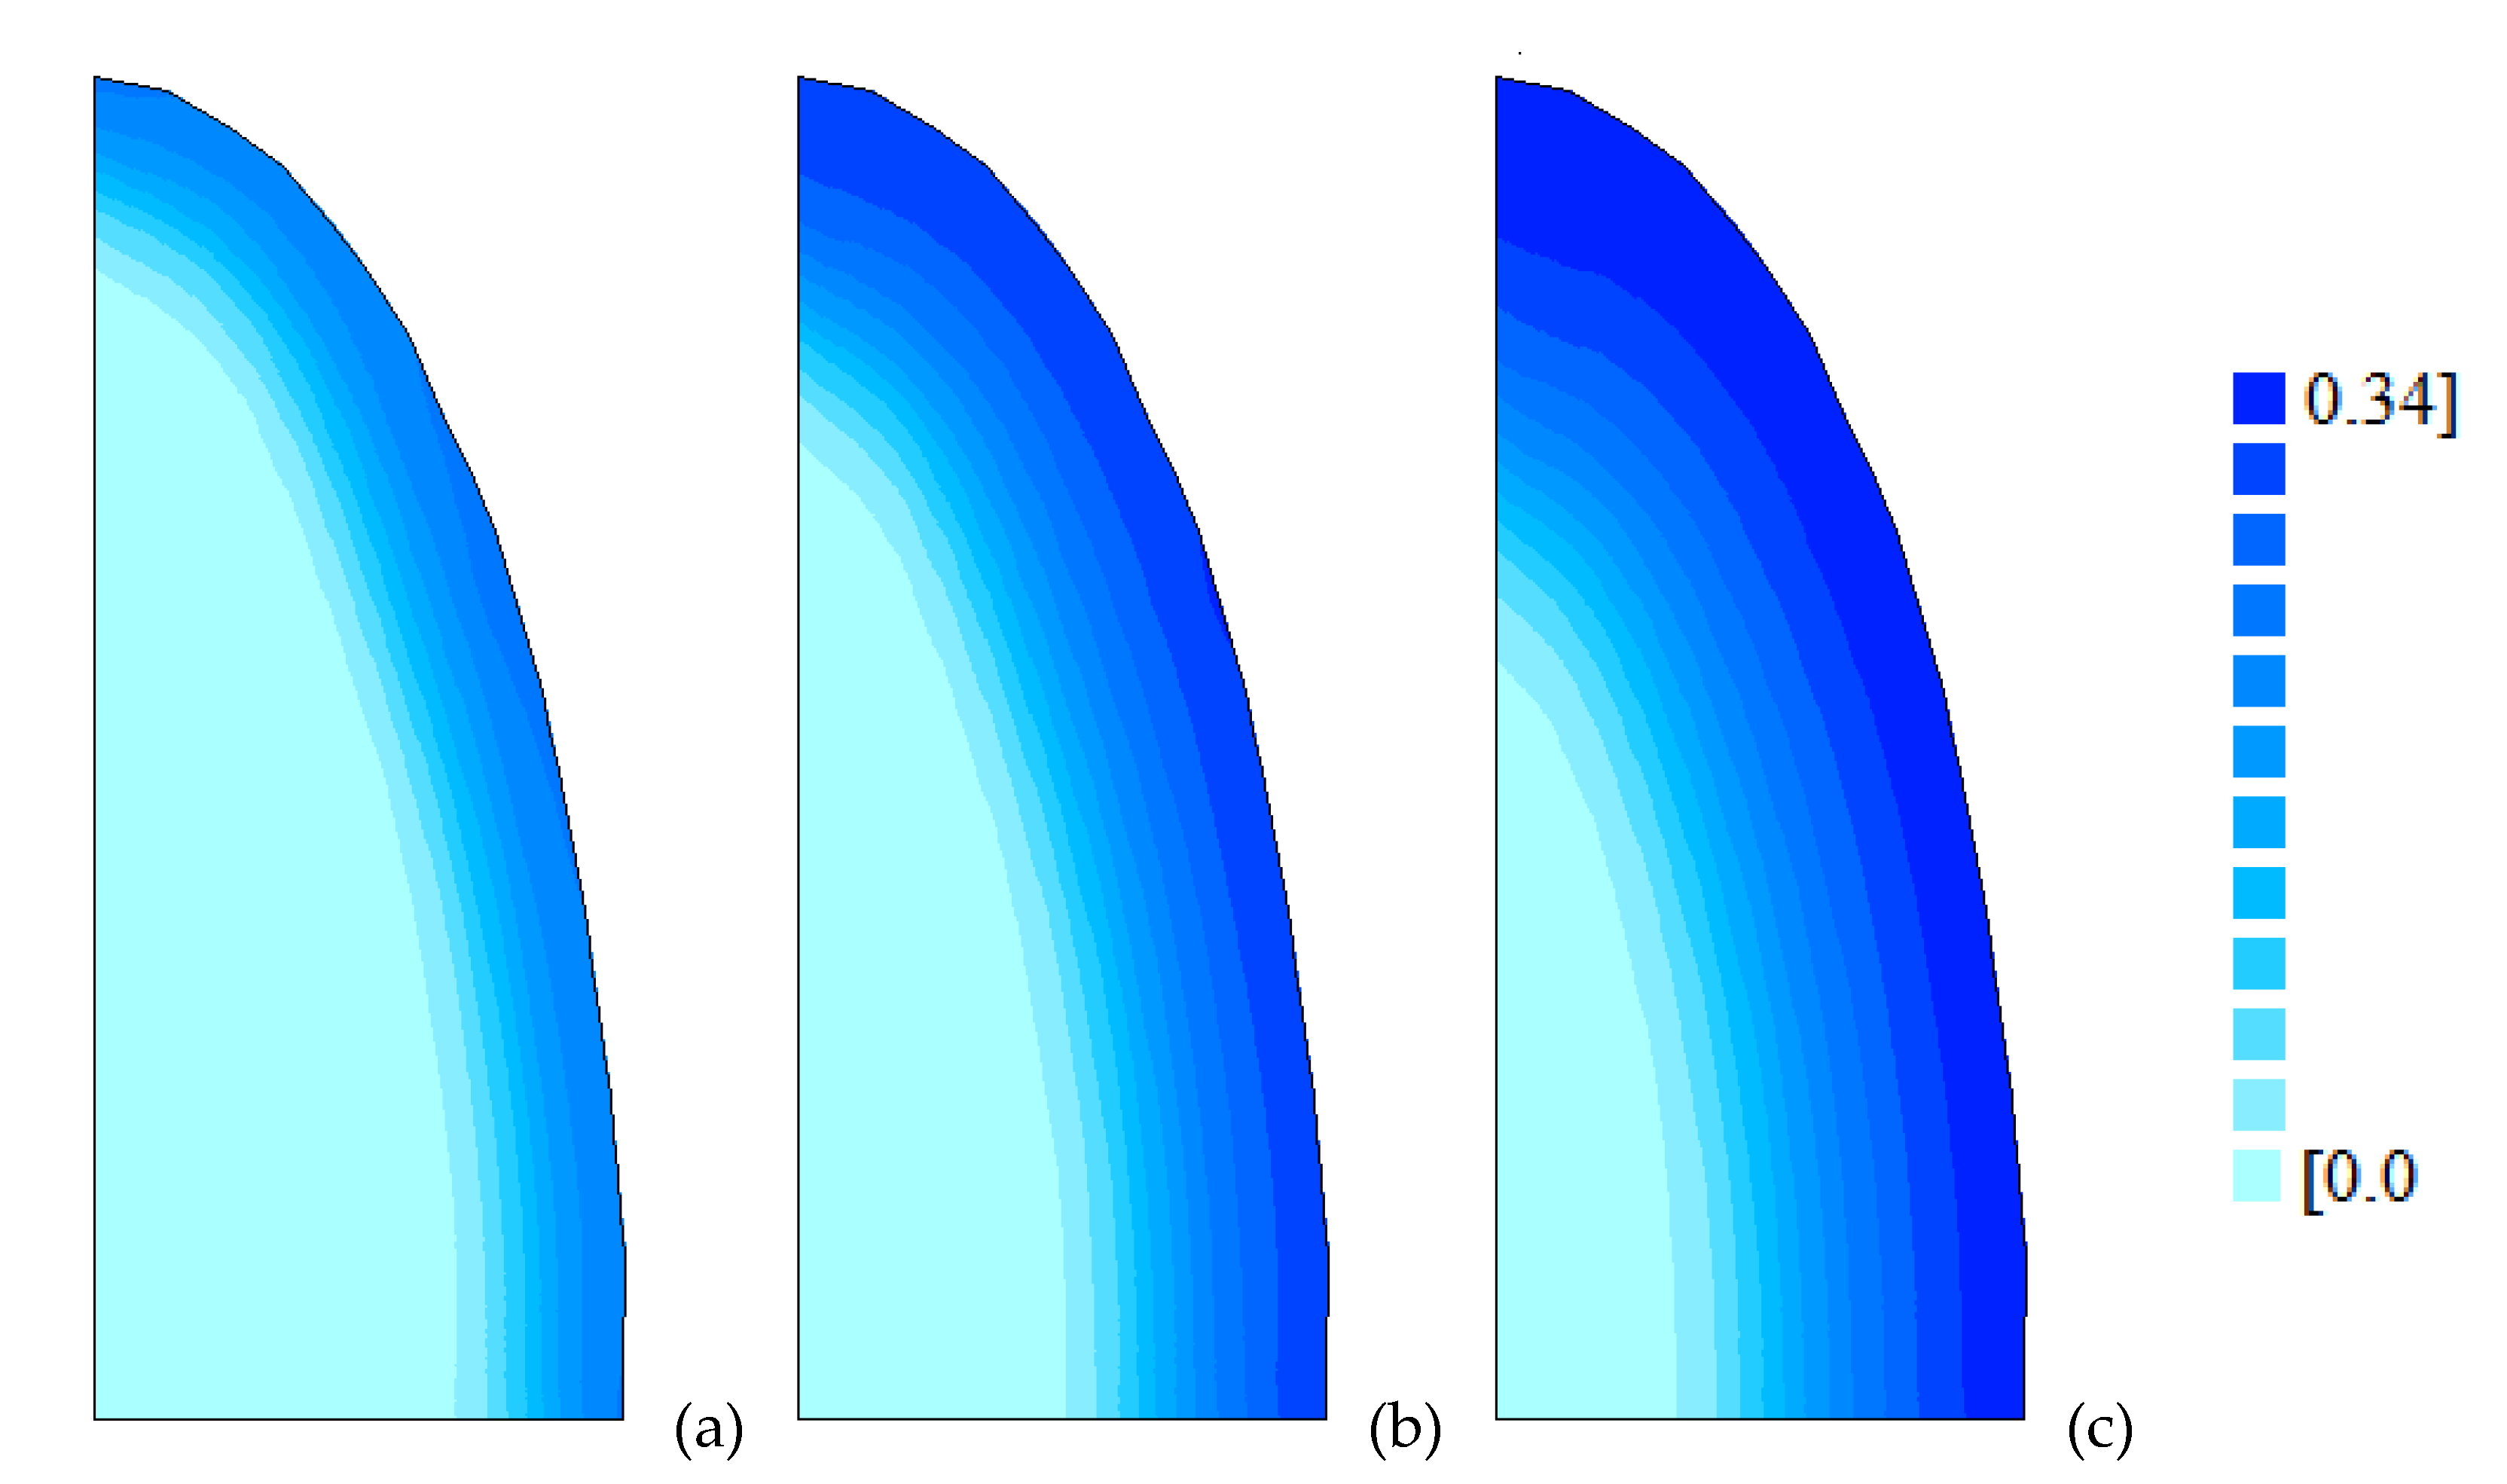
According to the proposed model, water distributions within the rice grain can be determined at any instant, for instance, at t = 100 min, for all temperatures studied in this research. Figure 8 presents these distributions. These moisture distributions are important because they make it possible to determine water stresses during the process.
When observing Figure 8, the effect of the temperature of the liquid medium on the distribution of water inside the grain can be clearly seen: the higher the temperature, the greater the amount of water absorbed at a given time and the faster the uptake.
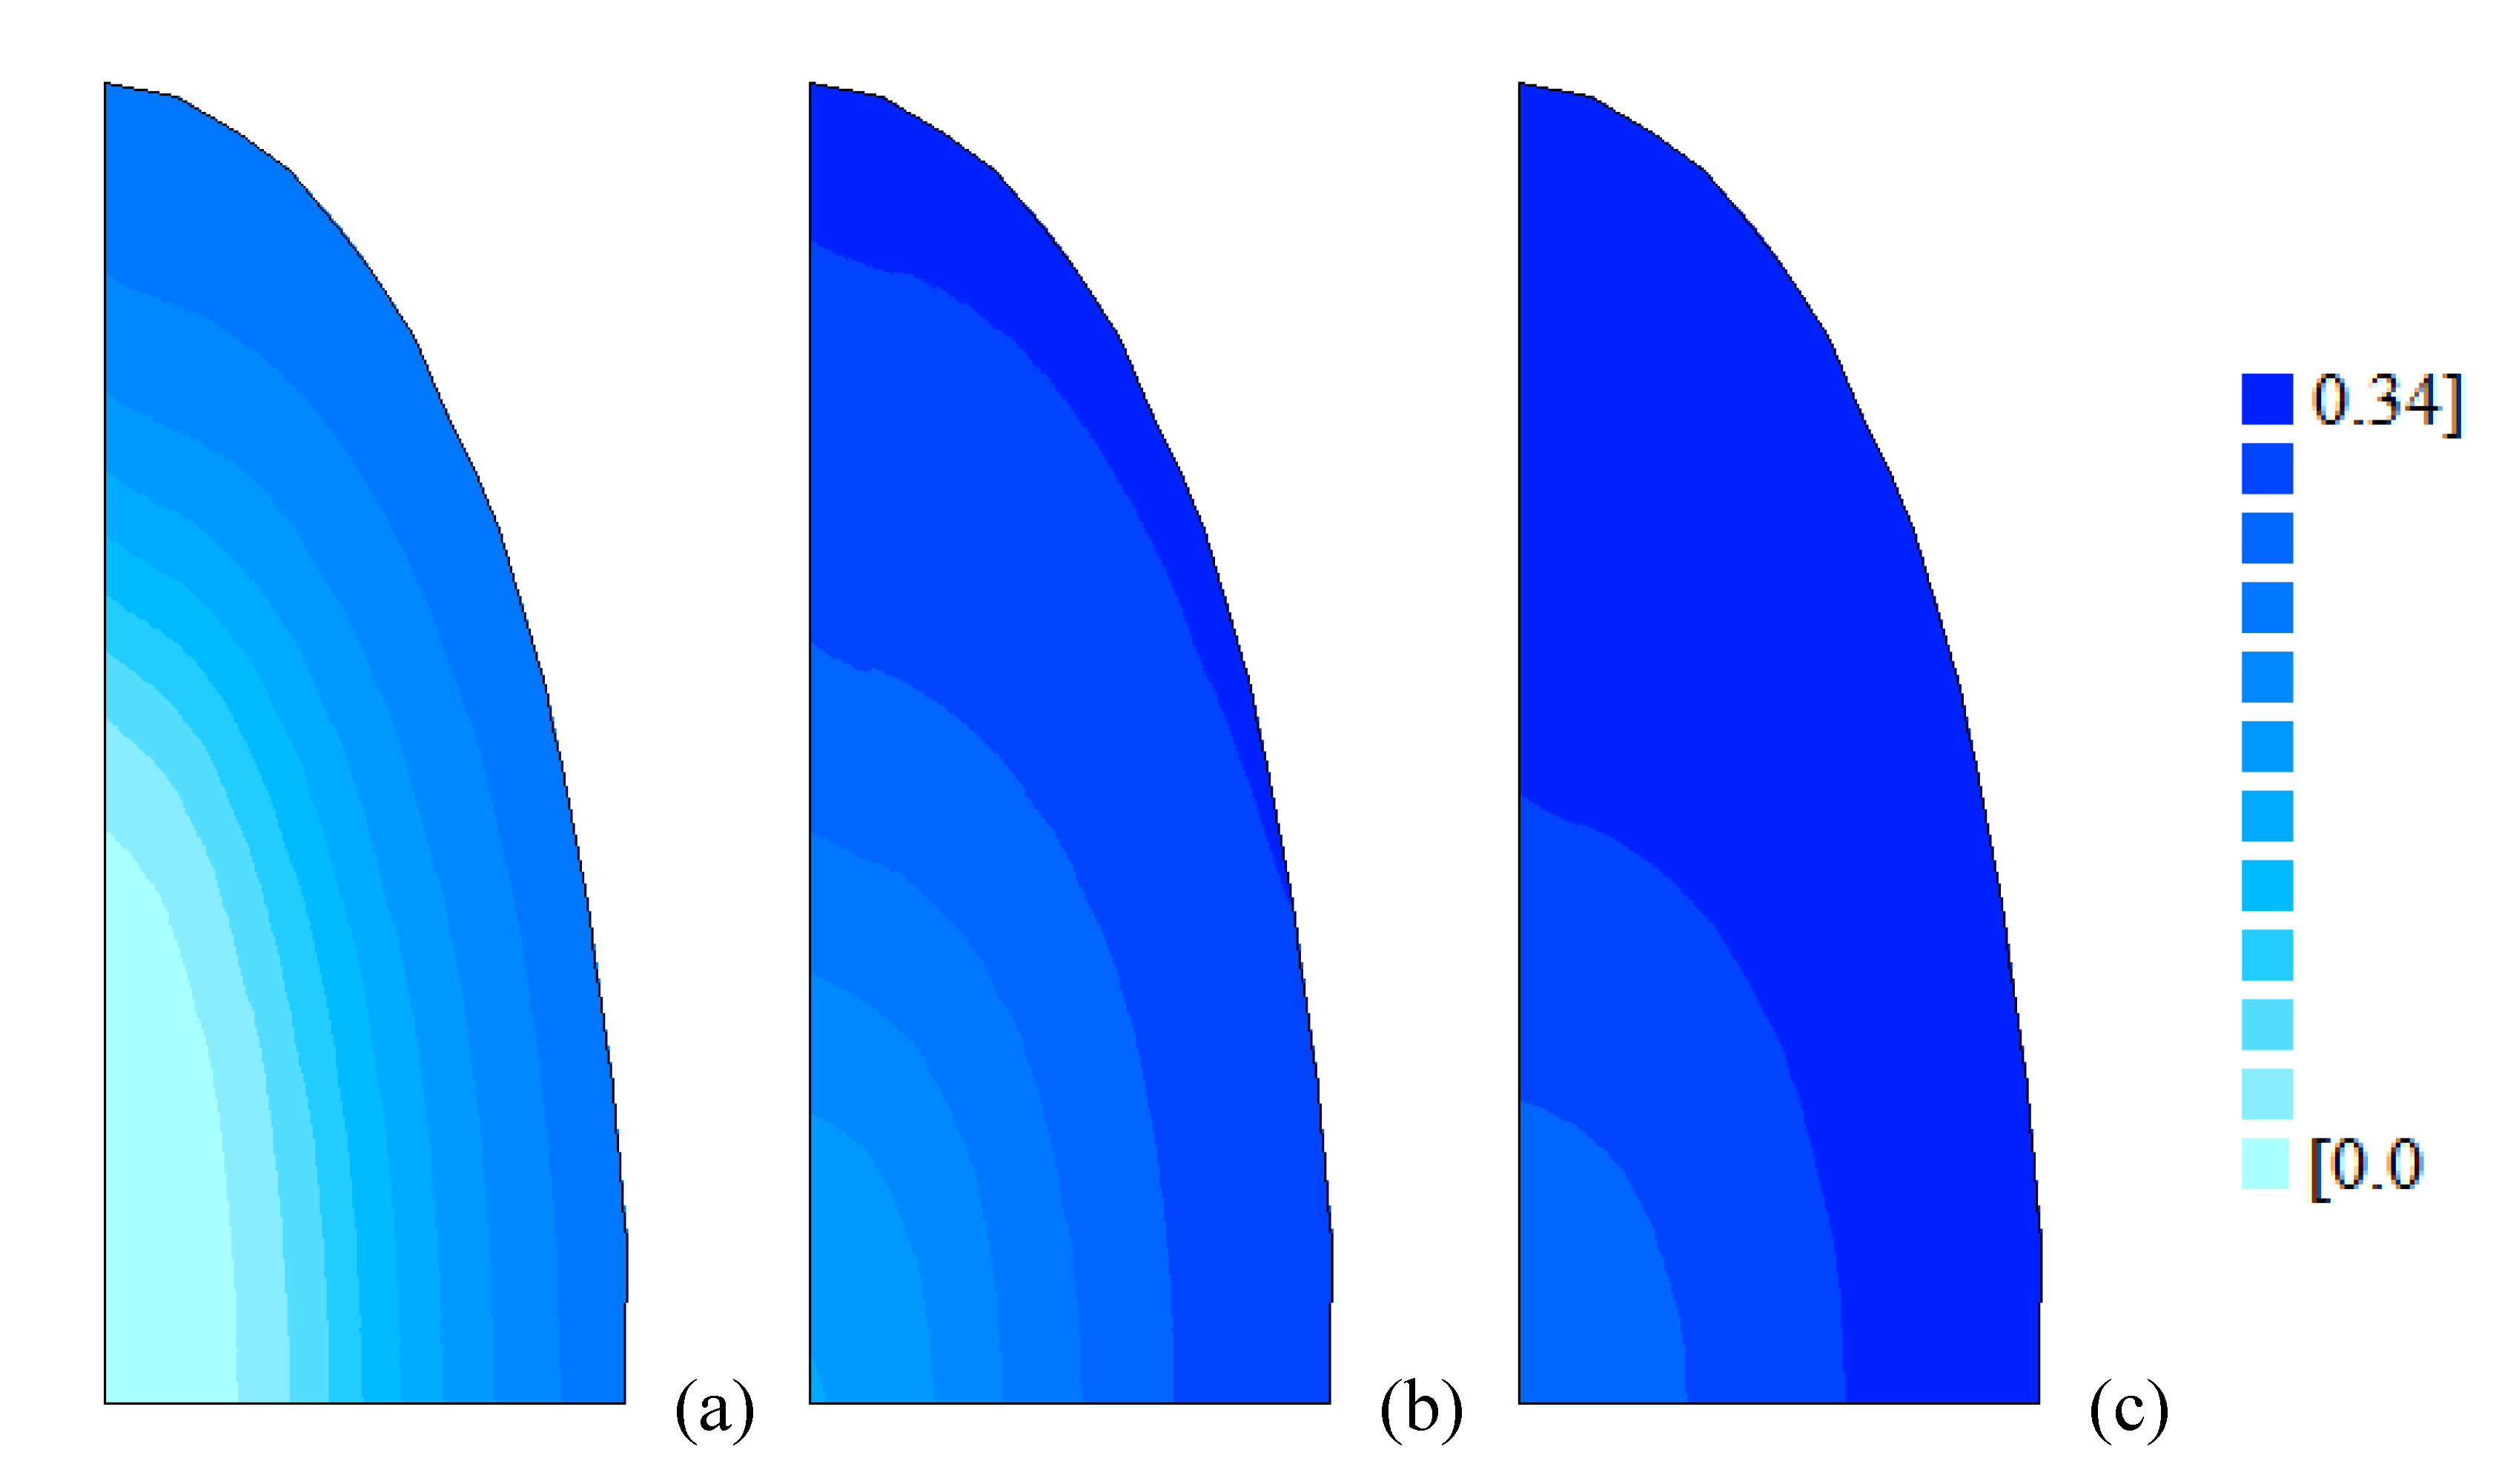
At the end of each water absorption process studied, the moisture distribution predicted by the proposed model is shown in Figure 9.
Figure 9 makes it possible to see that, for a temperature of 50 °C, the distribution of water inside the grain is already reasonably close to uniformity, while for temperatures of 28 °C and 40 °C there are significant moisture gradients.
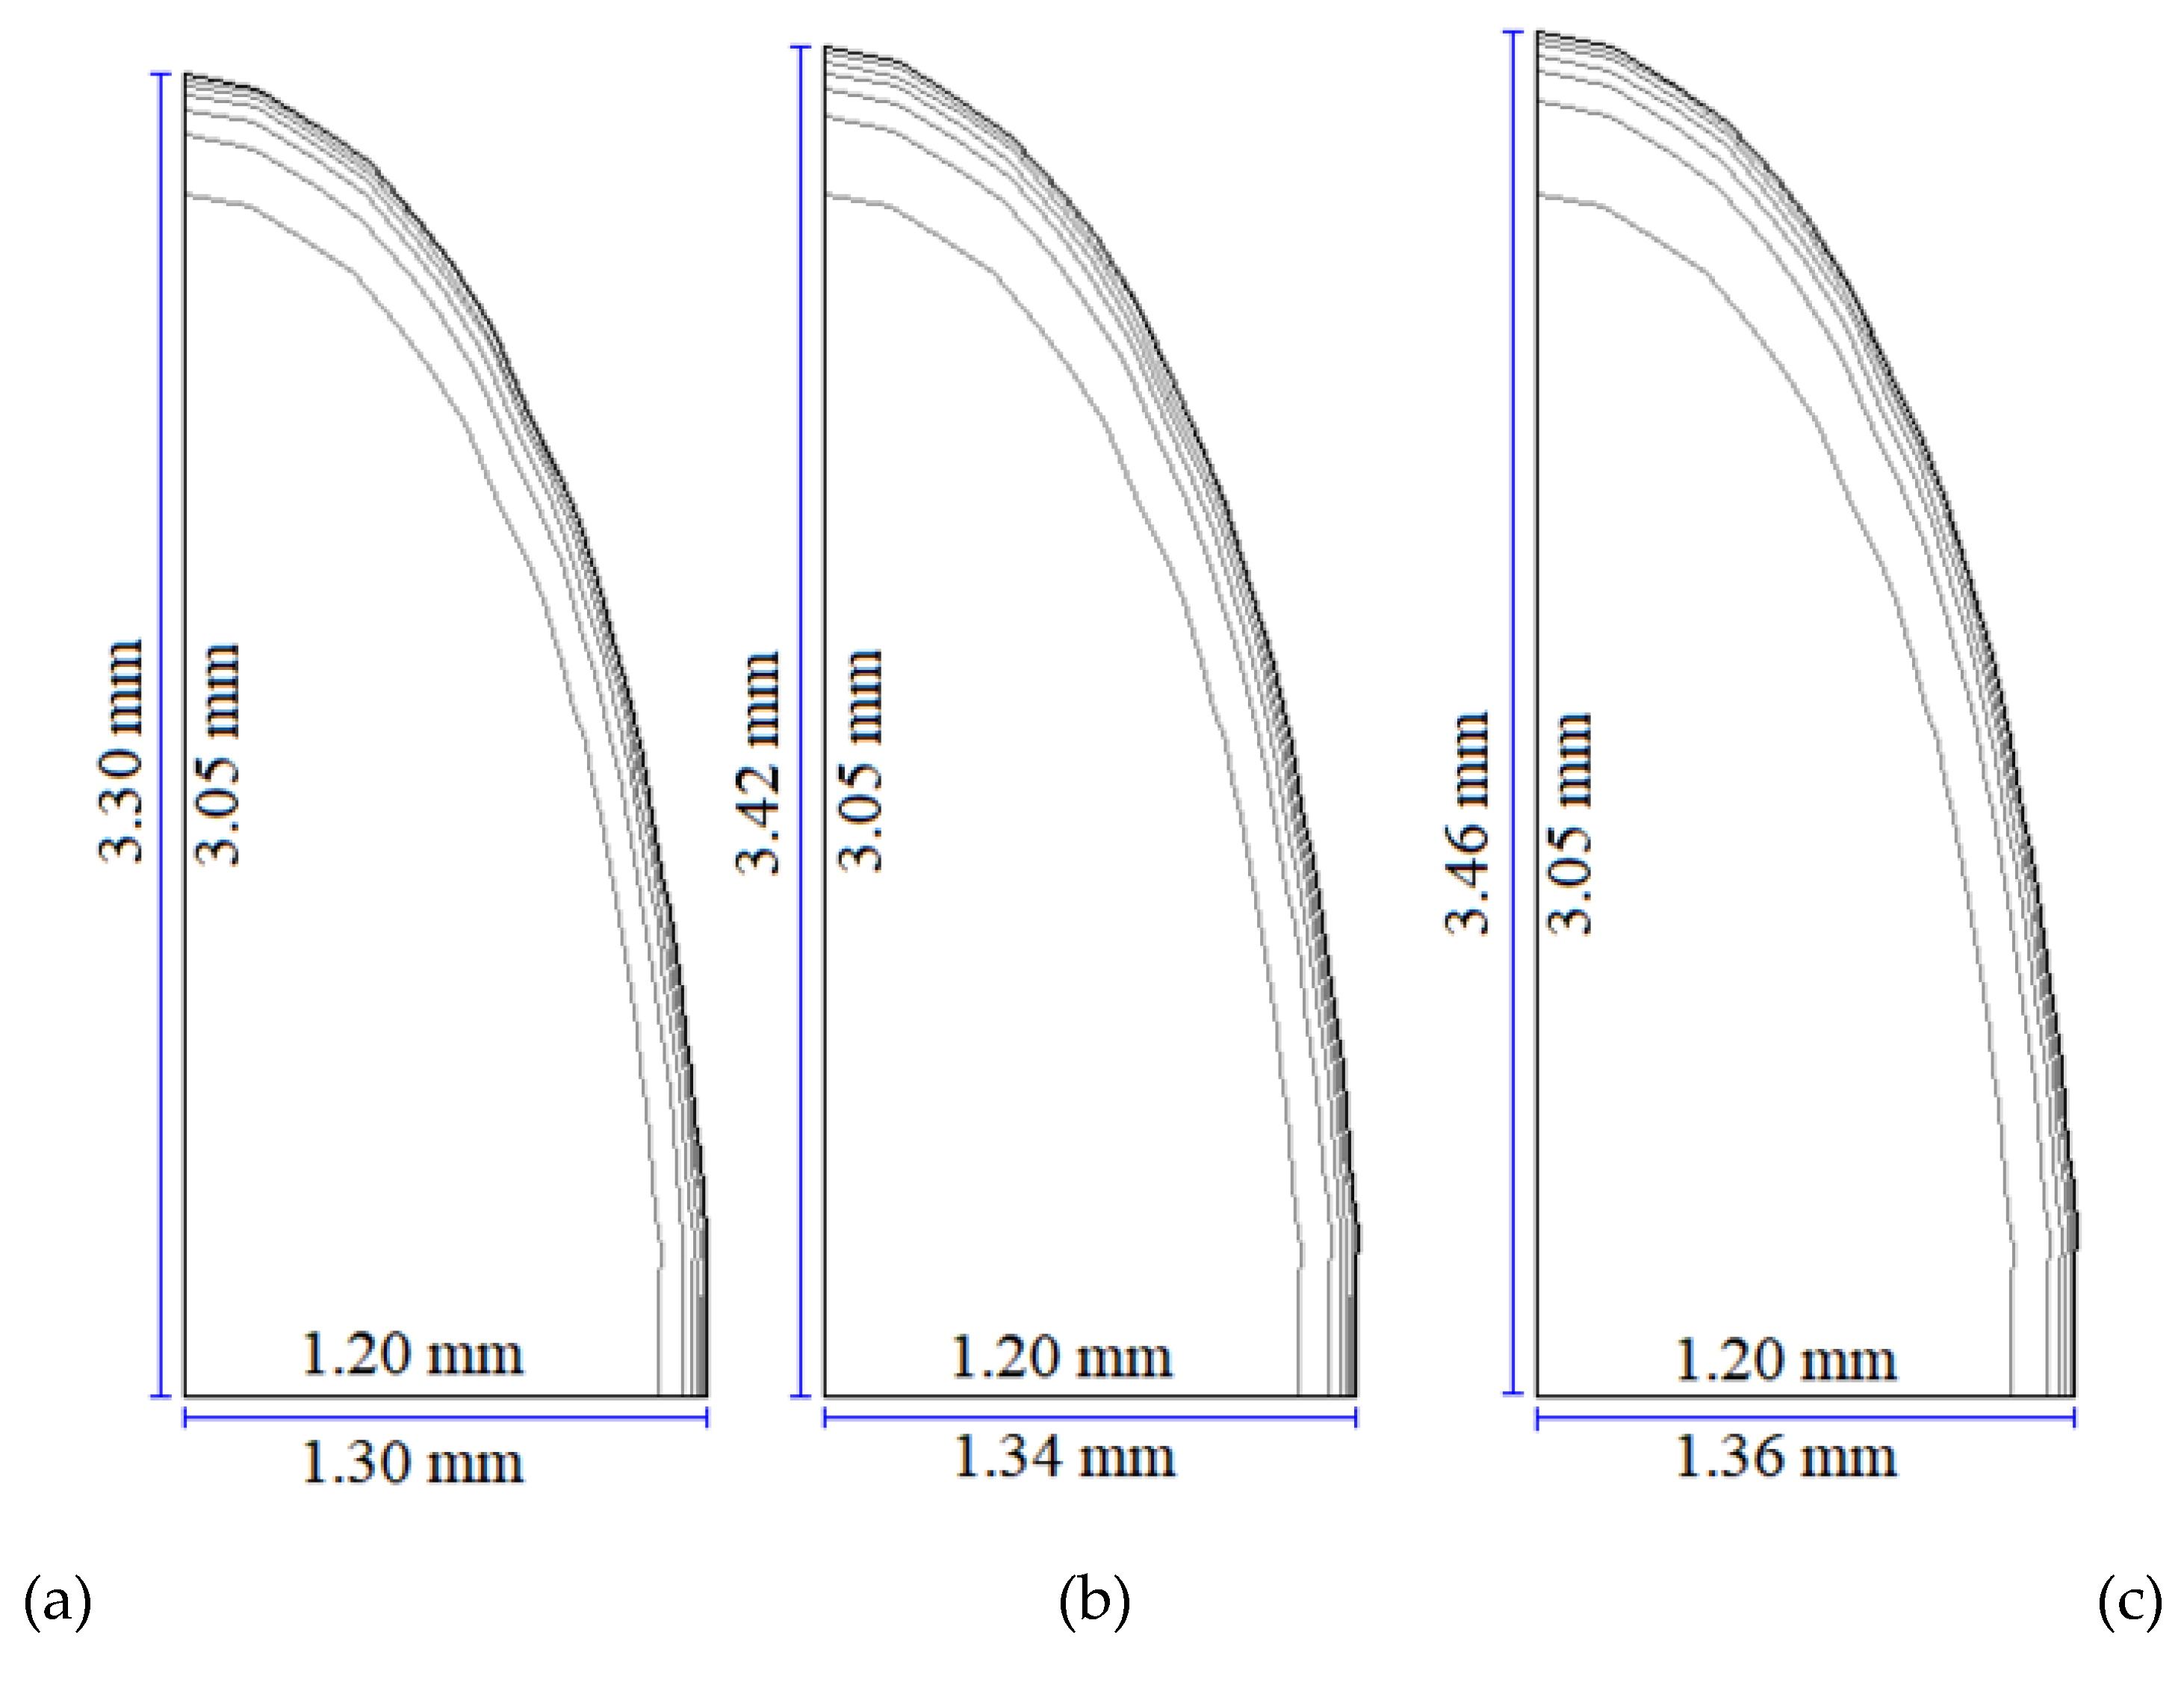
According to the proposed model, the growth of the flat area that generates the solid that represents half a grain of husked red rice can be observed in Figure 10.
Figure 10, also generated by the Diffusion RE software, shows the boundaries of the mesh at seven instants, from the beginning to the end of each water absorption process. From Figure 10 it is evident, in the three cases, that the highest d E R / d t rates of the expansion ratio ( E R ) occur at the initial instants. Although this is an intuitive information, it can also be predicted by the proposed model.
Numerical information on the volume of half a grain of husked red rice is available in Table 3, at various times t for each water absorption temperature.
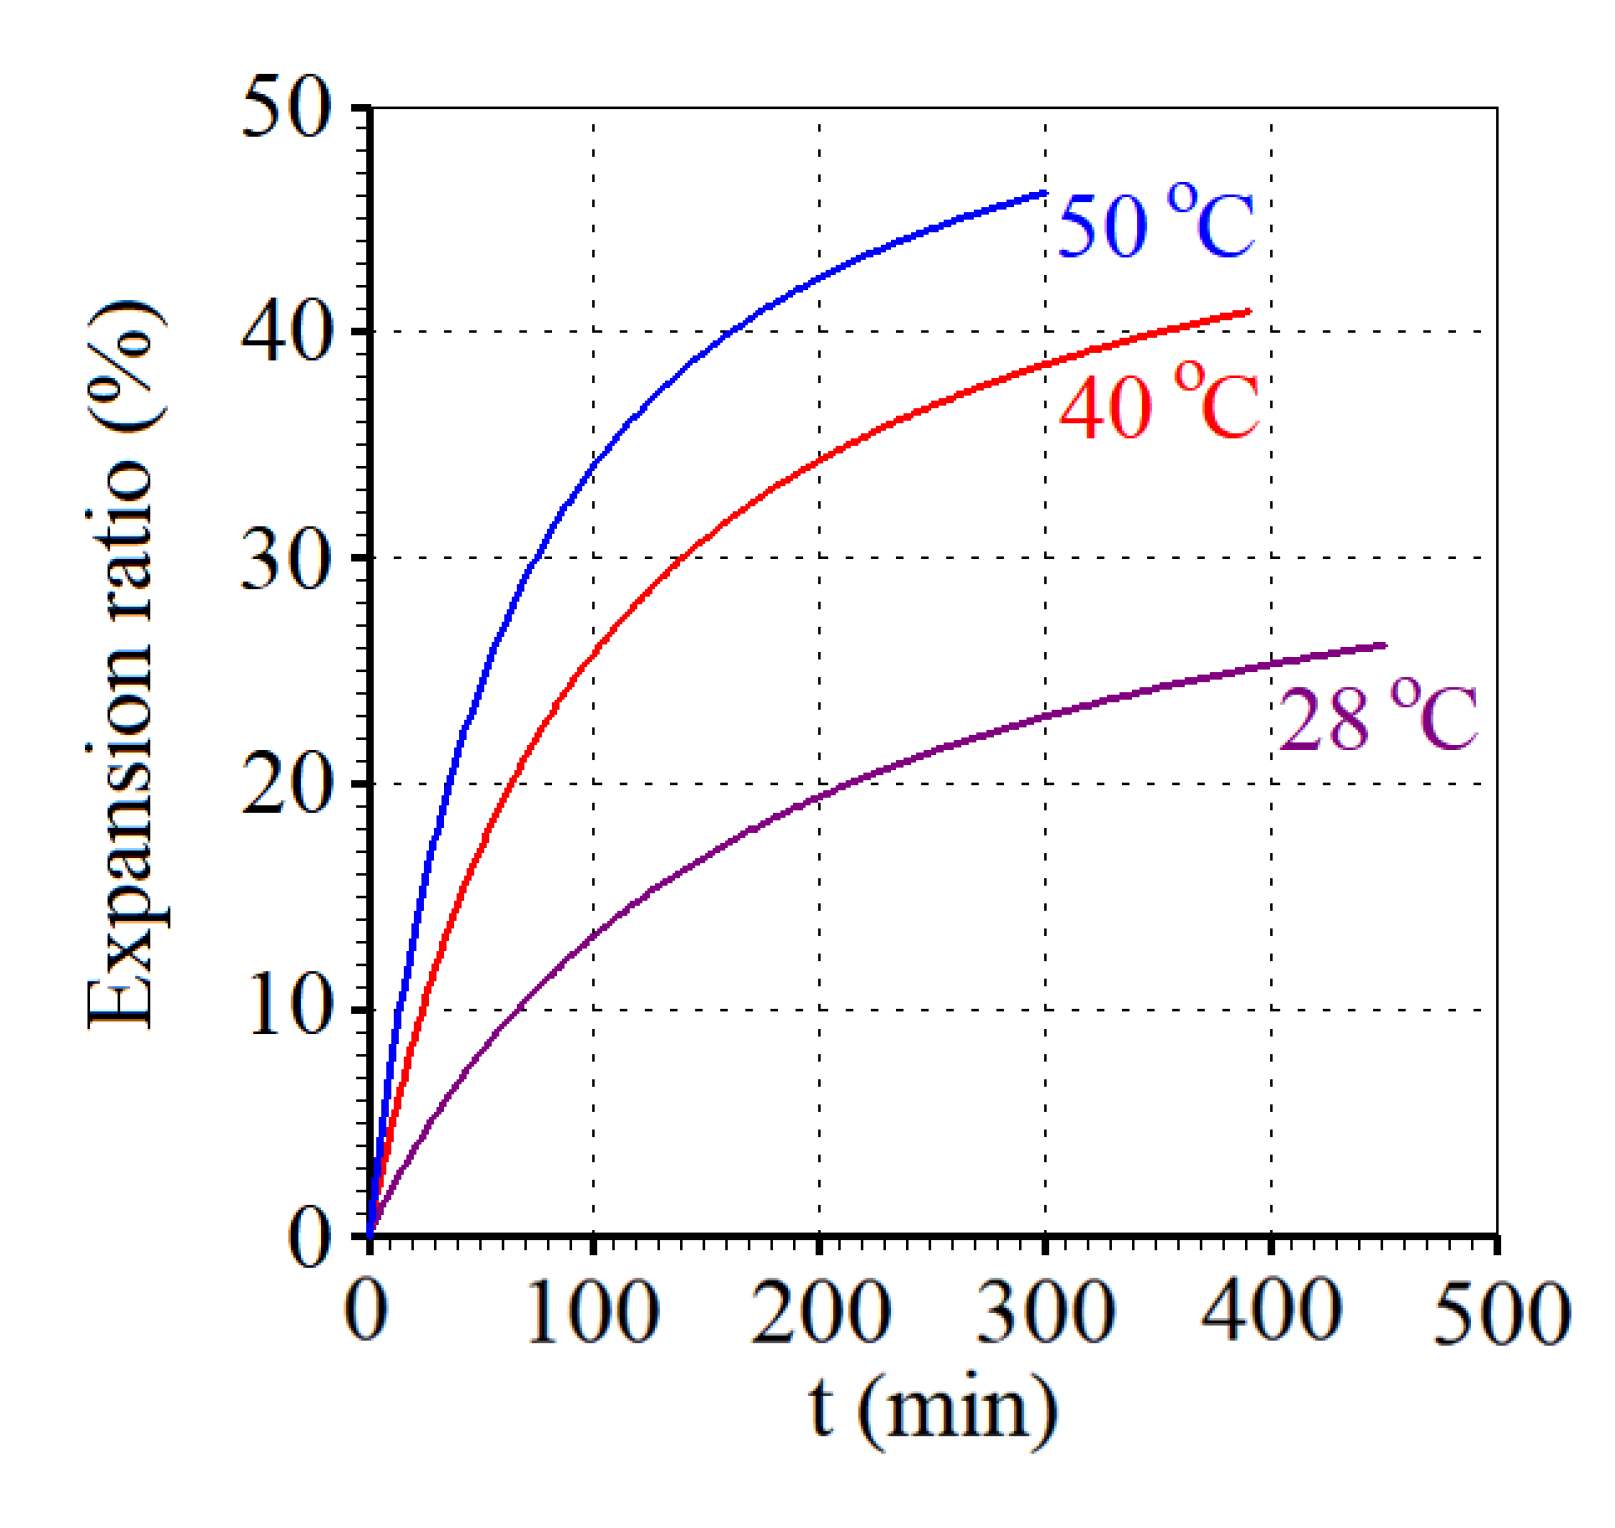
With the obtained results given in Table 3, the expansion ratio ( E R = Δ V ( t ) / V 0 ) over time predicted by the proposed model for the three absorption temperatures can be visualized in Figure 11.
From Figure 11 it can be observed, again, that the highest d E R / d t rates of the expansion ratio ( E R ) occur at the initial instants, decreasing over time.

3.2. Additional Discussion

Table 1 shows that parameter a in Equation (10) decreases with increasing temperature T, while parameter b increases with increasing temperature. The global effect of such variations is more noticeable by observing Figure 4: for a given local value of moisture content, M, mass diffusivity increases with increasing temperature. Similar results are found in the literature for D(T), both in the case of water removal from a product and in the case of water absorption by a product [6,7,9,25,27,32,50,61,62].
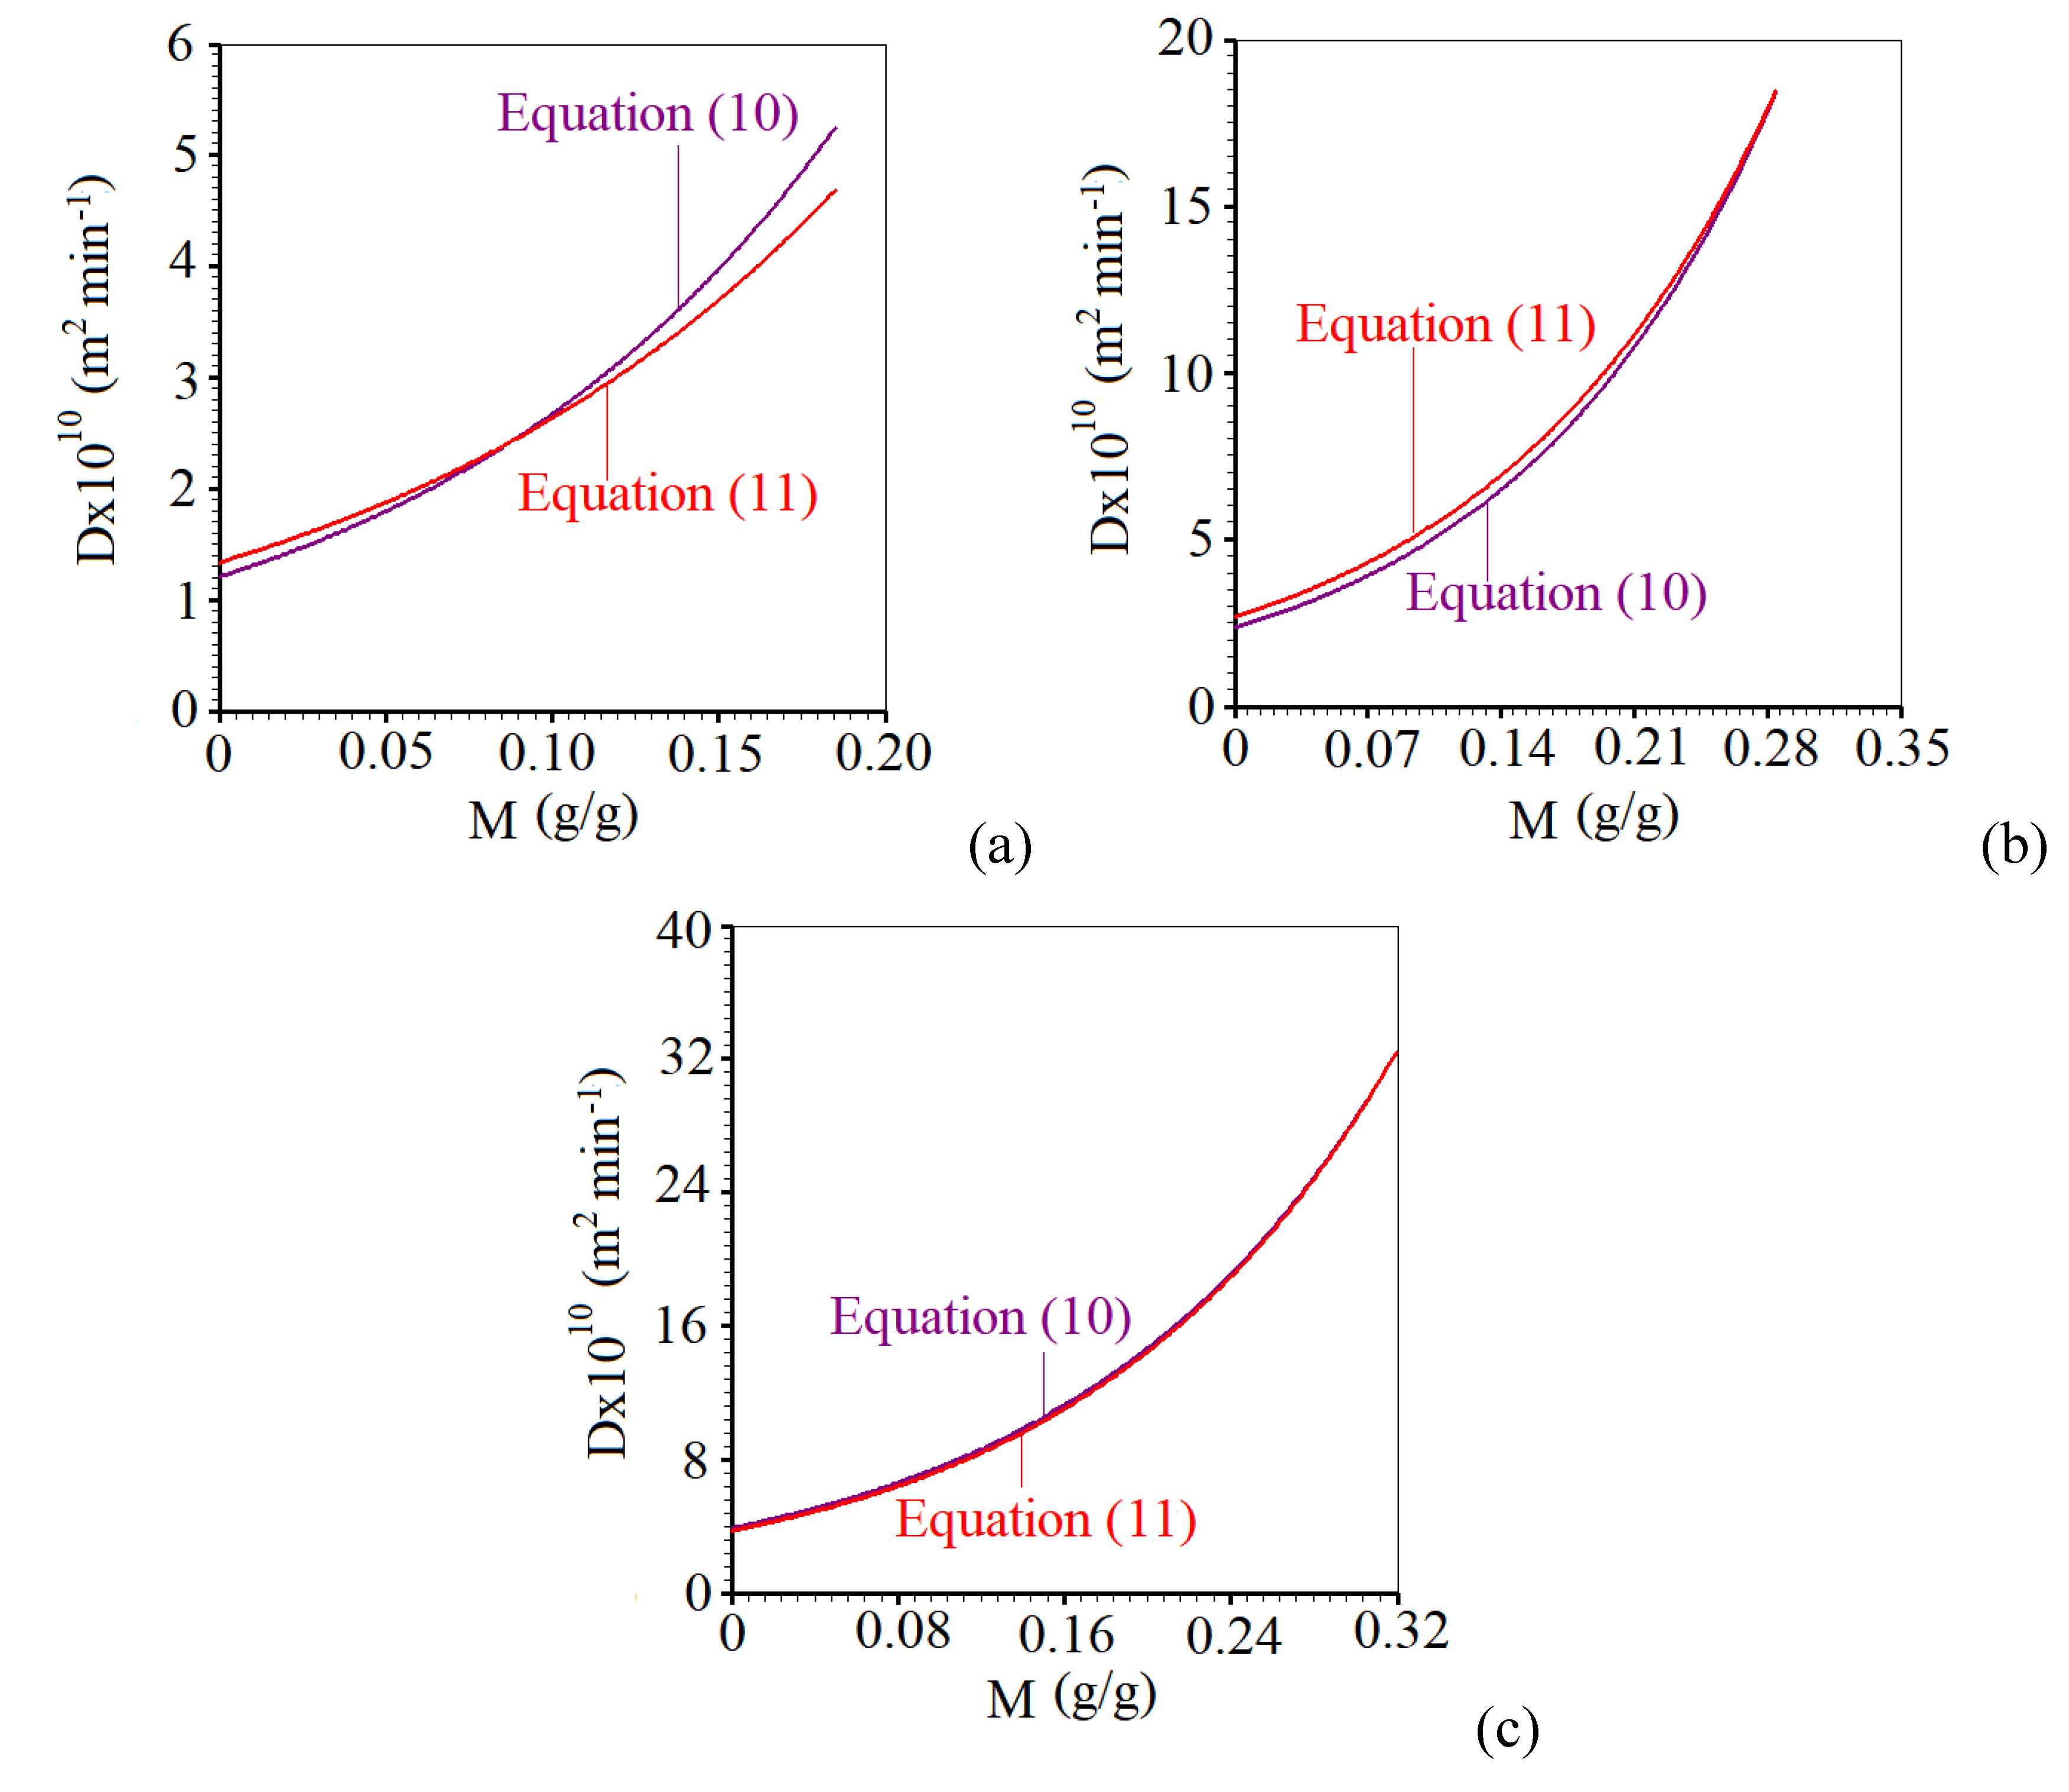
A comparison between mass diffusivity as a function of local moisture content given by Equation (10), obtained by optimization and Equation (11), obtained by the LAB Fit Finder, can be observed in Figure 12.
As can be seen in Figure 12, there is a good agreement between Equations (10) and (11), particularly for temperatures in the vicinity of the region between 40 and 50 °C. In this context, Equation (11) seems to be valid in obtaining D(M) in the region close to 40-50 °C.
The experimental data on water absorption by rice, analyzed in this article, were also studied by [7], through a diffusion model, considering each grain as an infinite cylinder with constant diffusivity. Although the results obtained in that study can be considered reasonable to describe water absorption kinetics, the possibility of obtaining data of the moisture distribution that could be used for a subsequent calculation of water stress does not exist, due to the geometry used, which is very different from the real geometry of the grains. As expected, the closer the geometry proposed by the model is to the real geometry of the studied product, the better and more accurate the results obtained will be [27,30]. The geometric simplification strategy in the description of a diffusion phenomenon, although undesirable, occurs in different processes such as heat transfer [22,38], water absorption [6,9,28,29,36,37,46,47,57,63] and water removal [26,32,64], among other processes. The model proposed in this article to describe the kinetics of water absorption by husked red rice grains at low temperatures is as close as possible to the real physical situation, especially taking into account the choice of simple devices to obtain the experimental data. The geometry of each grain of rice was taken into account, which required a model in which the diffusion equation must be written in generalized coordinates [21,25,30,42,43,48,62]. Furthermore, the model considers a variable value for the mass diffusivity as a function of local moisture content [34,50,65], and also the volumetric variation of the product throughout the water migration process [35,65,66].
As already noted in the Introduction Section, it is very common to find studies using diffusion models to describe water migration in an agricultural product, in which the mass diffusivity is considered constant [9,25,30,43,46,48]. On the other hand, Bakalis et al. [48] proposed a model with variable mass diffusivity as a function of the average moisture content at each time instant. However, when these authors presented the moisture distribution inside a grain, during the transient process, it became clear that, for a given instant, the water distribution within the grain is completely heterogeneous before the equilibrium. Therefore, considering the “average” moisture content does not seem to be the best choice for the model, but rather the local moisture content. In the present article, Figure 8 and Figure 9 show clearly, during the transient state, for a given time, a low concentration of water in the central region of the grain, which increases up to the surface of the product. This behavior indicates that mass diffusivity really must be a function of the local moisture content, as proposed in this article for rice, and already proposed by some researchers for other products [35,45,66].
Regarding the kinetics of volumetric expansion, during immersion, several studies are available in the literature on the subject, such as the works of Hu et al. [18] and [44]. In these articles written by Hu et al. it is possible to observe that the expansion ratio of each rice grain varies, for different rice genotypes, from initial volume up to equilibrium volume, reaching maximum values close to 50%. In the present research, the expansion ratio varied from 26.5% (28.0 °C) up to 46.3% (50.0 °C), and such results agree with those from the literature [18,44].
Zhu et al. [41], and also other researchers, used magnetic resonance imaging to determine the moisture distribution in rice, during water absorption, analyzing such images generated in their study. However, the method proposed in this article determines the moisture content values for all nodal points of the mesh, at each time step. For that, a solution of the diffusion equation in generalized coordinates was used, requiring simple devices to carry out the experiments. Thus, in the present article, the images are generated from these values previously calculated (Figure 8 and Figure 9). In this context, the method proposed here can produce better results, for instance, to calculate water stresses within the grains. Obviously, the determination of these water (and also thermal) stresses is important to predict crack formation within the product [39]. On the other hand, to illustrate the power of the proposed model, an animated gif (in infinite loop) of water distribution during absorption (from t = 0 min to t = 300 min), at a temperature of 50 °C, is available in the following link: www.labfit.net/Uptake50C.gif. As can be seen, the numerical solution available in the Diffusion RE program offers detailed information about the water absorption process by husked red rice.
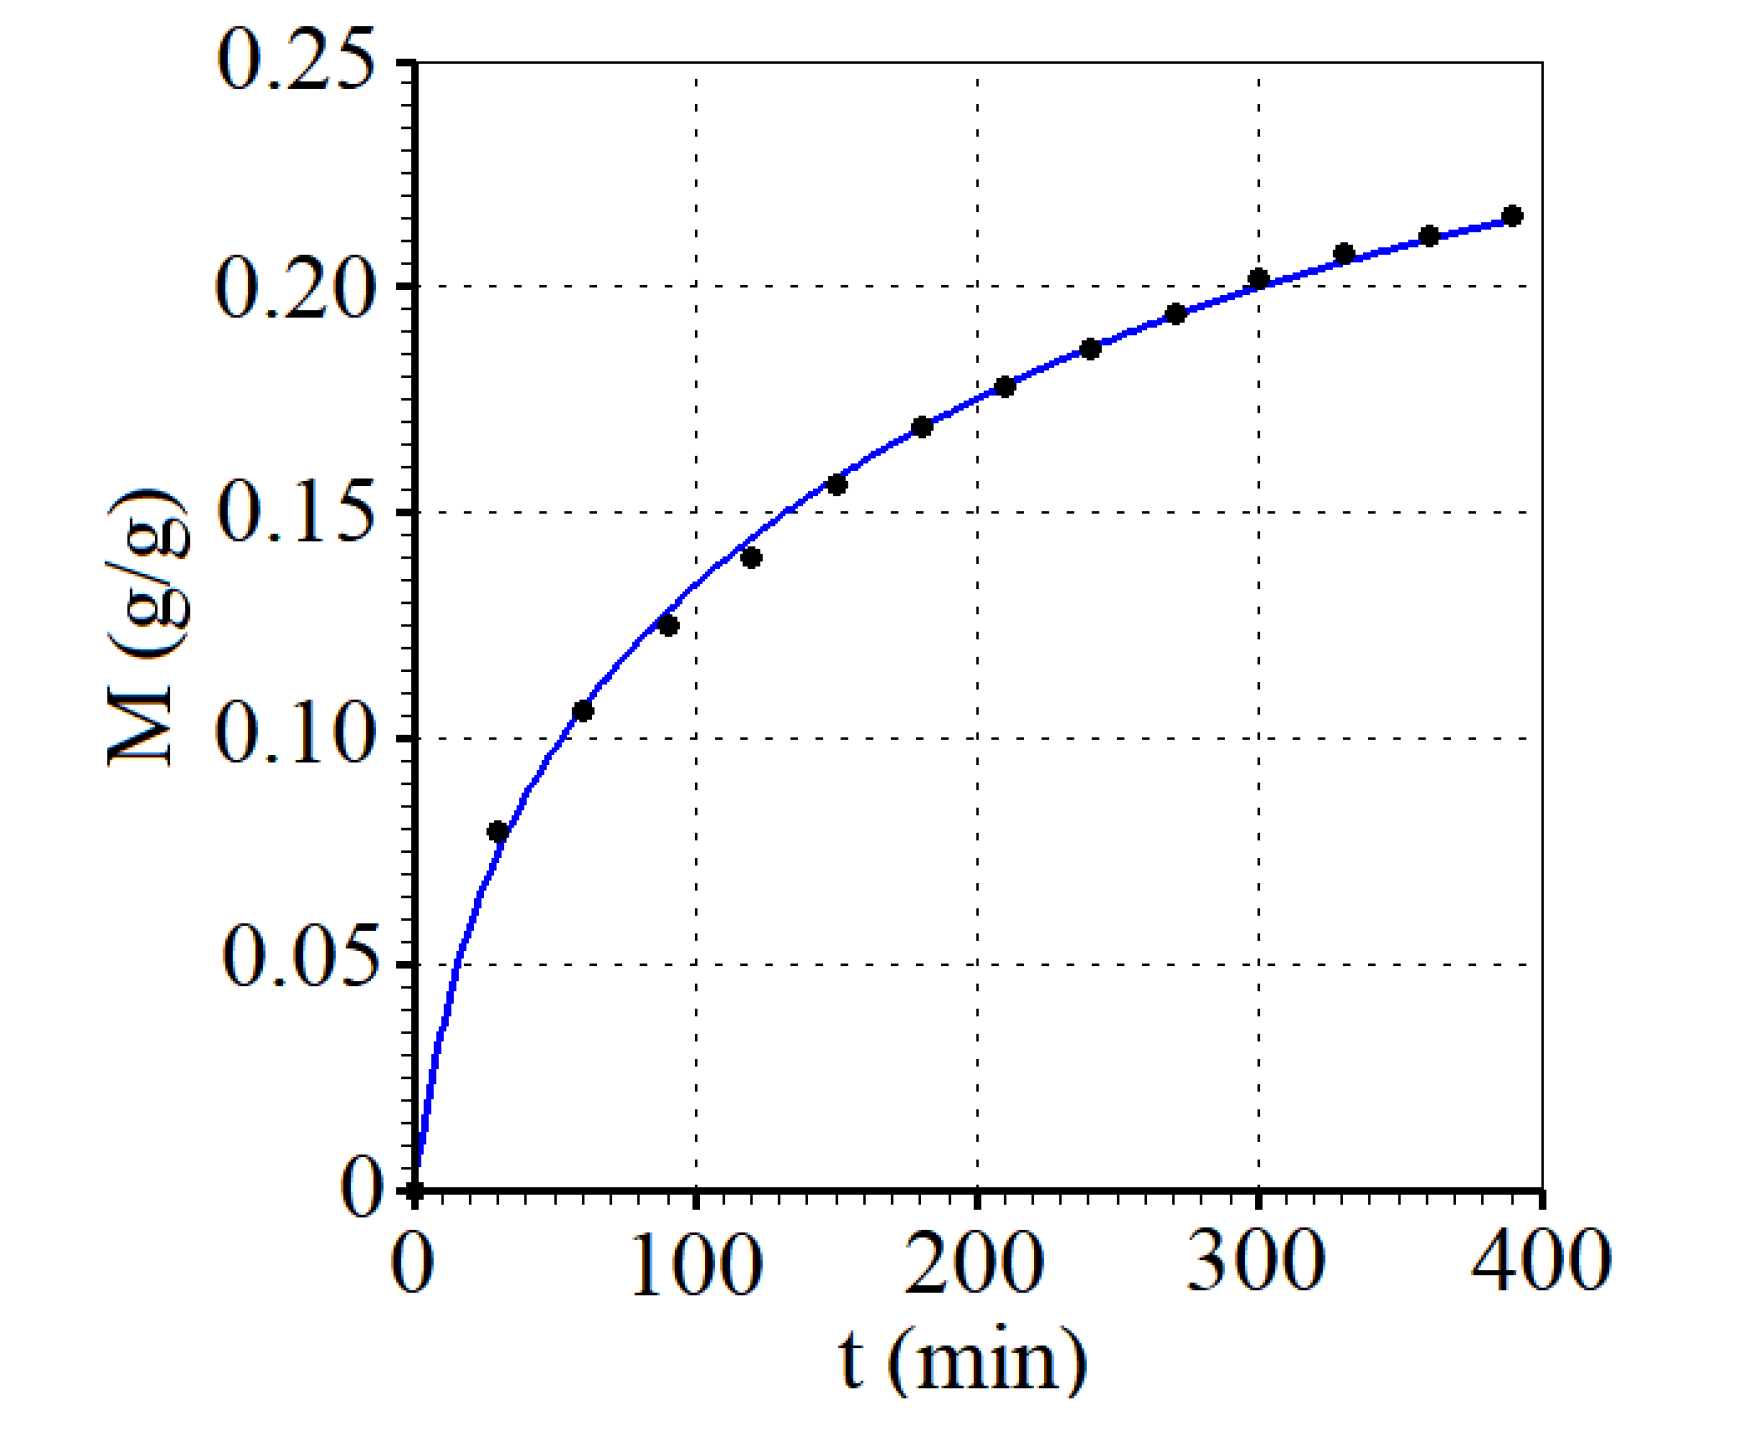
If the interest in studying water absorption is in the parboiling process, it is interesting to know whether the model proposed in this article describes the process well for red rice with husk. Thus, the absorption kinetics of this product (central radius of 1.38 mm and axial length of 6.46 mm) immersed in water at 50 °C, with equilibrium moisture content of 0.2466 g/g, was analyzed. For such, a new mesh was created and the optimization process resulted in the following expression for mass diffusivity, as a function of the local moisture content:
D ( M ) = 5 . 147 × 10 10 e 4 . 810 M
(given in m2 min-1), with chi-square and determination coefficient given by χ2 = 5.5841×10⁻⁵ and R2 = 0.99885, respectively.
The water absorption kinetics for red rice with husk can be observed in Figure 13.
For this case, the volume of half a grain of red rice with husk at instants t = 0 and t = 390 min are 12.97×10⁻⁹ and 16.98×10⁻⁹ m3, respectively. Thus, the expansion ratio for the present case is 30.9%.
The results obtained for husked red rice and also for red rice with husk suggest that the model proposed in this article can be useful not only for the temperatures studied here, but also for temperatures above 50 °C, up to close to those related to the gelatinization of the product with husk.

5. Conclusions

The diffusion model proposed in this article to describe water absorption by husked red rice showed very satisfactory results, both to describe the kinetics of the process (χ2 between 8.942×10⁻⁶ and 3.8311×10⁻⁵; R2 between 0.99957 and 0.99991) and to describe the expansion ratio of the grains (between 26.5% and 46.3%). Three characteristics of the model give robustness to the results: 1) Variable mass diffusivity as a function of the local moisture content; 2) Consideration of variable volume over time; 3) Geometry generated by a mesh defined from the red rice grain photograph, making it possible to use Boundary-Fitted Coordinates.
A test carried out with absorption of red rice with husk showed good statistical indicators (χ2 = 5.5841×10⁻⁵ and R2 = 0.99885) for the optimization process. This fact suggests that the model can also be useful for describing water absorption with the purpose of reaching temperatures close to the gelatinization temperature of the product.
The model also makes it possible to predict the distribution of water inside the grain during the transient process, which can be useful for a subsequent determination of the water stresses. Obviously, these water (and also thermal) stresses are important because they make it possible to simulate and to predict crack formation within the product.

Author Contributions

Conceptualization, W.P.d.S. and A.G.B.L.; methodology, W.P.d.S.; software, W.P.d.S., J.C.A.P. and A.F.S.J.; validation, F.S.d.S., H.V.M, E.T.V.S. and L.M.S.; formal analysis, Y.F.P. B.A.M; investigation, J.P.G., A.J.d.M.Q. and R.M.F.d.F.; resources, W.P.d.S.; data curation, J.C.A.P.; writ-ing—original draft W.P.d.S.; writing—review and editing, W.P.d.S., A.G.B.L. and Y.F.P.; project administration, A.G.B.L., J.P.G., A.J.d.M.Q. and R.M.F.d.F.

Funding

The article did not receive funding.

Data Availability Statement

Data can be digitized from the graphs or requested from the corresponding author.

Acknowledgments

The first author would like to thank CNPq (Conselho Nacional de Desenvolvimento Científico e Tecnológico) for supporting this study and for his research grant (Process Number 301708/2019-3; PQ-1A). Special thanks to Antonio Gilson (Advisor) and Josivanda (Colleague).

Conflicts of Interest

On behalf of all authors, the corresponding author states that there is no conflict of interest.

References

  1. Ribeiro-Filho, N.; Borges, S. R. S.; Menezes, P. H.; Oliveira, M. R. T.; Silva, A. P. G. Red rice (Oryza sativa L.) composition and its water interaction. Food and Humanity, v. 2, 2024. [CrossRef]
  2. Pereira, J. A.; Morais, O. P. As variedades de arroz vermelho brasileiras. Embrapa Meio-Norte, Teresina, 2014. 39 p.
  3. Walter, M., Marchezan, E., Avila, L.A. 2008. Rice: composition and nutritional characteristics. Ciência Rural, 38(4), 1184-1192. [CrossRef]
  4. Santos, N.C., Silva, W.P., Barros, S.L., Almeida, R.L.J., Araújo, A.J.B., Nascimento, A.P.S. 2020. Red rice (Oryza sativa L.) use in flour production: Convective drying and bioactive quality. Journal of Food Process Engineering, 4(10), 1-10. [CrossRef]
  5. Marques, B.C., Jorge, L.M.M., Jorge, R.M.M. 2016. Chemical properties and water absorption kinetics of transgenic corn grain (2B587 Hx) and its conventional isoline (2B587). Journal of Cereal Science, 71(1), 93-98. [CrossRef]
  6. Sharanagat, V.S., Kansal, V., Kumar, K. 2018. Modeling the effect of temperature on the hydration kinetic whole moong grain. Journal of the Saudi Society of Agricultural Sciences, 17(3), 268–274. [CrossRef]
  7. Alves Pereira, J.C., Silva, W.P., Silva, R.C., Silva, C.M.D.P.S., Gomes. J.P. 2021. Use of empirical and diffusion models in the description of the process of water absorption by rice. Engineering Computations, 39(4), 1556-1574. [CrossRef]
  8. Li, P., Li, Y., Wang, L., Zhang, H., Qi, X., Qian, H. 2020. Study on water absorption kinetics of black beans during soaking. Journal of Food Engineering, 283(1), 110030. [CrossRef]
  9. Costa, R., Fusco, F., Gândara, J.F.M. 2018. Mass transfer dynamics in soaking of chickpea. Journal of Food Engineering, 227(1), 42-50. [CrossRef]
  10. Costa, R.; Pedroso, V.; Madeira, T.; Gândara, J. 2022. Water uptake kinetics in soaking of grass pea. Food Science and Technology, 42(2022), 1-10. [CrossRef]
  11. Kuna-Broniowska, I., Blicharz-Kania, A., Andrejko, D.; Kubik-Komar, A., Kobus, Z., Pecyna, A., Stoma, M., Slaska-Grzywna, B., Rydzak, L. 2020. Modelling water absorption in micronized lentil seeds with the use of Peleg’s Equation. Sustainability, 12(1), 1-9. [CrossRef]
  12. Zhao, H., Yang, Z., Tao, Z. 2017. Drying kinetics of continuous and intermittent heat pump drying of green soybean seeds. International Journal of Food Engineering, 13(11), 1–15. [CrossRef]
  13. Almeida, R. L. J., Santos, N. C., Santos, P. T., Alcântara, S. V. M., Alcântara, R. V. H., Silva, L. R. I., & Silva, E. R. 2020. Melon seed drying kinetics described by a diffusion model. Research, Society and Development, 9, 32953146. [CrossRef]
  14. Costa da Silva, R., Silva, W.P., Gomes, J.P., Queiroz, A.J.M., Figueirêdo, R.M.F., Lima, A.G.B., Trindade Rocha, A.P., Silva, L.D., Ferreira Lima, J.P., Santos, D.C., Andrade, R.O. 2022. A new empirical model for predicting intermittent and continuous drying of “Neve” melon (Cucumis melo sp.) seeds. Agriculture, 12(1), 328. [CrossRef]
  15. Botelho, F.M., Corrêa, P.C., Goneli, A.L.D., Martins, M.A., Baptestini, F.M. 2010. Water absorption kinetics in parboiled husk rice. Ciência e Tecnologia de Alimentos, 30(3), 713-718. [CrossRef]
  16. Salimi, A., Ameri H., Hajighorbani, A. 2019. Investigating on effect of hot air and water temperature on kinetic of rehydration of celery by using Peleg’s model. Latin American Applied Research, 49(4), 249-254. [CrossRef]
  17. Martins, G.M.V., Pereira, V.S., B.L.R., Martins, Sousa, S., Duarte, M.E.M., Cavalcanti Mata, M.E.R.M. 2020. Study of the red rice parboilization process. Journal of Agricultural Studies, 8(2), 531-560. [CrossRef]
  18. Hu, Z., Yang, Y., Lu, L., Chen, Y., Zhu, Z., Huang, J., 2021. Kinetics of water absorption expansion of rice during soaking at different temperatures and correlation analysis upon the influential factors. Food Chemistry 346(2021), 128912. [CrossRef]
  19. Hanucharoenkul, P., Theerathanan, C., Pongsawatmanit, R. 2021. Influence of soaking temperature and time on the kinetics of water absorption and pasting properties of glutinous rice. Agriculture and Natural Resources, 55(1), 193–200. [CrossRef]
  20. Dincer, I. 1995. Transient heat transfer analysis in air cooling of individual spherical products. Journal of Food Engineering, 26(4), 453–467. [CrossRef]
  21. Wu, B., Yang, W., Jia, C. 2004. A three-dimensional numerical simulation of transient heat and mass transfer inside a single rice kernel during the drying process Biosystems Engineering, 87(2), 191–200. [CrossRef]
  22. Silva, W.P., E Silva, C.M.D.P.S., Farias, V.S., E Silva, D.D.P.S. 2010. Calculation of the convective heat transfer coefficient and cooling kinetics of an individual fig fruit. Heat and Mass Transfer, 46(3), 371-380. [CrossRef]
  23. Silva, W.P., Silva, C.M.D.P.S., Lins, M.A.A. 2011. Determination of expressions for the thermal diffusivity of canned foodstuffs by the inverse method and numerical simulations of heat penetration. International Journal of Food Science and Technology, 46(4), 811-818. [CrossRef]
  24. Cihan, A., Ece, M.C., 2001. Liquid diffusion model for intermittent drying of rough rice. Journal of Food Engineering, 49(4), 327–331. [CrossRef]
  25. Lima AGB, Queiroz MR, Nebra AS. 2002. Simultaneous moisture transport and shrinkage during drying of solids with ellipsoidal configuration. Chemical Engineering Journal, 86(1-2), 85–93. [CrossRef]
  26. Silva, W.P., Mata, M.E.R.M.C., Silva, C.D.P.S., Guedes, M.A., Lima, A.G.B. 2008. Determination of diffusivity and activation energy for cowpea grains (Vigna unguiculata (L.) Walp.), always-green variety, based on its drying behavior. Engenharia Agricola, 28(2), 325-333. [CrossRef]
  27. Silva, W.P., Silva e Silva, C.M.D.P., Farias, V.S.O., Lima A.G.B. 2011. Effect of the geometry on the description of the water absorption by composite materials using diffusion models. Material Science & Engineering Technology (Materialwissenschaft und Werkstofftechnik), 42(8). [CrossRef]
  28. Tomita, H., Fukuoka, M., Takemori, T., Sakai, N. 2019. Development of the visualization and quantification method of the rice soaking process by using the digital microscope. Journal of Food Engineering, 243(1), 33–38. [CrossRef]
  29. Dutta, A., Subramanian, A.S., Chakraborty, R., Erdogdu, F. 2020. Numerical modeling of water uptake in white rice (Oryza sativa L.) using variable diffusivity approach. Biosystems Engineering, 191(1), 116-128. [CrossRef]
  30. Hacihafizoglu, O., Cihan, A., Kahveci, K., de Lima, A.G.B. 2008. A liquid diffusion model for thin-layer drying of rough rice. European Food Research and Technology, 226(1), 787–793. [CrossRef]
  31. Genkawa, T., Tanaka, F., Hamanaka, D., Uchino, T. 2011. Incidence of open crack formation in short-grain polished rice during soaking in water at different temperatures. Journal of Food Engineering, 103(1), 457–463. [CrossRef]
  32. Pereira, J.C.A., Silva, W.P., Gomes, J.P., Queiroz, A.J.M., Figueirêdo, R.M.F., Melo, B.A., Santiago, Â.M., de Lima, A.G.B., Macedo, A.D.B. 2020. Continuous and intermittent drying of rough rice: Effects on process effective time and effective mass diffusivity. Agriculture 10(1), 282. [CrossRef]
  33. Kale, S.J., Jha, S.K., Jha, G.K., Sinha, J.P., Lal, S.B. 2015. Soaking induced changes in chemical composition, glycemic index and starch characteristics of basmati rice. Rice Science, 22(5), 227−236. [CrossRef]
  34. Silva, W.P., e Silva, C.M.D.P.S., da Silva Junior, A.F., Queiroz, A.J.M. 2015. A numerical approach to determine some properties of cylindrical pieces of bananas during drying. International Journal of Food Engineering, 11(3). [CrossRef]
  35. Lentzou, D., Boudouvis, A.G., Karathanos, V.T., Xanthopoulos, G. 2019. A moving boundary model for fruit isothermal drying and shrinkage: An optimization method for water diffusivity and peel resistance estimation. Journal of Food Engineering, 263(1), 299–310. [CrossRef]
  36. Balbinoti, T.C.V., Jorge, Matos., L.M., Jorge, R.M.M. 2018. Modeling the hydration step of the rice (Oryza sativa) parboiling process. Journal of Food Engineering, 216(1), 81-89. [CrossRef]
  37. Bello, M.O., Tolaba, M.P., Suarez, C. 2007. Water absorption and starch gelatinization in whole rice grain during soaking. LWT - Food Science and Technology, 40(2), 313–318. [CrossRef]
  38. Loisel, J., Cornuéjols, A., Laguerre, O., Tardet, M., Cagnon, D., Lamotte, O.D., Duret, S. 2022. Machine learning for temperature prediction in food pallet along a cold chain: Comparison between synthetic and experimental training dataset. Journal of Food Engineering, 335(1), 111156. [CrossRef]
  39. Wei, S., Xiao, B. Xie, W. Wang, F., Chen, P., Yang, D. 2020. Stress simulation and cracking prediction of corn kernels during hot-air drying. Food and Bioproducts Processing, 121(1), 202–212. [CrossRef]
  40. Mikac, U., Sepe, A., Serša, I. 2015. MR microscopy for noninvasive detection of water distribution during soaking and cooking in the common bean. Magnetic Resonance Imaging 33(3) 336–345. [CrossRef]
  41. Zhu, L., Cheng, L., Zhang, H., Wang, L., Qian, H., Qi, X., Wu, G. 2019. Research on migration path and structuring role of water in rice grain during soaking. Food Hydrocolloids, 92(2019), 41–50. [CrossRef]
  42. Cihan, A., Kahveci, K., Hacihafizoglu, O., de Lima, A.G.B. 2008. A diffusion based model for intermittent drying of rough rice. Heat Mass Transfer. 44(2008), 905–911. [CrossRef]
  43. Gomes da Silva, E., Gomez, R.S., Gomes, J.P., Figueirêdo, R.M.F., Queiroz, A.J.M., Silva, W.P., Santiago, Â.M., Macedo, A.D.B., Ferreira, J.P.L., Gomes, Í.A., Lima, A.G.B. 2020. Convective and microwave assisted drying of wet porous materials with prolate spheroidal shape: A Finite-Volume approach. Agriculture, 10(11), 507. [CrossRef]
  44. Hu, Z., Yang, H., Chaima, M., Fang, C., Lu, L., Hu, X., Du, B., Zhu, Z., Huang, J. 2020. A visualization and quantification method to evaluate the water-absorbing characteristics of rice. Food Chemistry, 331(1), 127050. [CrossRef]
  45. Xanthopoulos, G., Yanniotis, S., Boudouvis, A.G. 2012. Numerical Simulation of Variable Water Diffusivity during Drying of Peeled and Unpeeled Tomato. Journal of Food Science, 77(10), 287-296. [CrossRef]
  46. Bello, M., Tolaba, M.P., Suarez, C. 2004. Factors affecting water uptake of rice grain during soaking. LWT - Food Science and Technology, 37(8), 811-816. [CrossRef]
  47. Briffaz, A., Bohuon, P., Méot, J.-M., Dornier, M., Mestres, C. 2014. Modelling of water transport and swelling associated with starch gelatinization during rice cooking. Journal of Food Engineering, 121(), 143–151. [CrossRef]
  48. Bakalis, S., Kyritsi, A., Karathanos, V.T., Yanniotis, S. 2009. Modeling of rice hydration using finite elements. Journal of Food Engineering, 94(3-4), 321–325. [CrossRef]
  49. Irigoyen, R.M.T., Goñi, S.M., Giner, S.A. 2014. Drying–toasting kinetics of presoaked soybean. A mathematical model considering variable diffusivity, shrinkage and coupled heat transfer. Journal of Food Engineering, 142(1), 70–79. [CrossRef]
  50. Farias Aires, K.L.C.A., Silva, W.P., Farias Aires, J.E., Silva Júnior, A.F., da Silva e Silva, C.M.D.P. 2018. Apple osmotic dehydration described by three-dimensional numerical solution of the diffusion equation. Drying Technology, 36(16), 1970-1981. [CrossRef]
  51. Maliska, C.R. 2023. Fluid Mechanics and Its Applications (Volume 135): Fundamentals of Computational Fluid Dynamics. The Finite Volume Method. Springer, ISBN 978-3-031-18235-8 (eBook). [CrossRef]
  52. Silva, W.P., Ataíde, J.S.P., de Oliveira, M.E.G., Silva, C.M.D.P.S., Nunes, J.S. 2018. Heat transfer during pasteurization of fruit pulps stored in containers with arbitrary geometries obtained through revolution of flat areas. Journal of Food Engineering 217(1), 58-67. [CrossRef]
  53. Silva, W.P., Precker, J.W., Silva, D.D.P.S., Silva, C.D.P.S., de Lima, A.G.B. 2009. Numerical simulation of diffusive processes in solids of revolution via the finite volume method and generalized coordinates. International Journal of Heat and Mass Transfer, 52(21–22) 4976–4985. [CrossRef]
  54. Cloete, T.J. 2023. Extensions to the theorems of Pappus to determine the centroids of solids and surfaces of revolution. International Journal of Mechanical Engineering Education, 51(4), 319–332. [CrossRef]
  55. Press, W.H., Teukolsky, S.A., Vetterling, W.T. & Flannery, B.P. 2007. Numerical Recipes in Fortran 77. The Art of Scientific Computing, 3rd Edition. New York: Cambridge University Press. [CrossRef]
  56. Tolikas, P.K., Tzimopoulos, C.D., Tolikas, D.K. 1982. Horizontal absorption of water by soils with variable diffusivity. Journal of Hydrology, 58(1-2), 123-129. [CrossRef]
  57. Nicolin, D.J., Jorge, R.M.M., Jorge, L.M.M. 2016. Effects of variable diffusivity on soybean hydration modeling as a Stefan problem. The Canadian Journal of Chemical Engineering, 95(5), 1–10. [CrossRef]
  58. Levenberg, K. 1944. A method for the solution of certain problems in least squares. Quartely of Applied Mathemathics, 2(2), 164–168. [CrossRef]
  59. Marquardt, D. W. 1963. An algorithm for least-squares estimation of nonlinear parameters. Journal of the Society for Industrial and Applied Mathematics, 11(2), 431–441. [CrossRef]
  60. Wahengbam, E.D., Abdul, S., Hazarika, M.K. 2019. Water uptake in brown rice during soaking for production of no-cooking rice. Agricultural Engineering International: CIGR Journal, 21(3), 138-149. https://www.cigrjournal.
  61. Silva, W.P., Silva, C.M.D.P.S., Silva, L.D., Lins M.A.A. 2012. Comparison between models with constant and variable diffusivity to describe water absorption by composite materials. Material Science & Engineering Technology (Materialwissenschaft und Werkstofftechnik), 43(10), 825-831. [CrossRef]
  62. Silva, W.P., Hamawand, I., Silva, C.M.D.P.S. 2014. A liquid diffusion model to describe drying of whole bananas using boundary-fitted coordinates. Journal of Food Engineering, 137(1), 32–38. [CrossRef]
  63. Elbert, G., Tolaba, M.P., Suárez C. 2001. Model application: hydration and gelatinization during rice parboiling. Drying Technology, 19(3-4), 571-581. [CrossRef]
  64. Silva, W.P., Cavalcanti Mata, M.E.R.M., Silva, C.D.P.S., Guedes, M.A., Lima, A.G.B. 2008. Determination of diffusivity and activation energy for cowpea grains (Vigna unguiculata (L.) Walp.), always-green variety, based on its drying behavior. Engenharia Agricola, 28(2), 325-333. [CrossRef]
  65. Ruiz-López, I.I., Ruiz-Espinosa, H., Arellanes-Lozada, P., Bárcenas-Pozos, M.E., García-Alvarado, M.A. 2012. Analytical model for variable moisture diffusivity estimation and drying simulation of shrinkable food products. Journal of Food Engineering, 108(3), 427–435. [CrossRef]
  66. Batista, L.M., Rosa, C.A., Pinto. L.A.A. 2007. Diffusive model with variable effective diffusivity considering shrinkage in thin layer drying of chitosan. Journal of Food Engineering, 81(1), 127–132. [CrossRef]
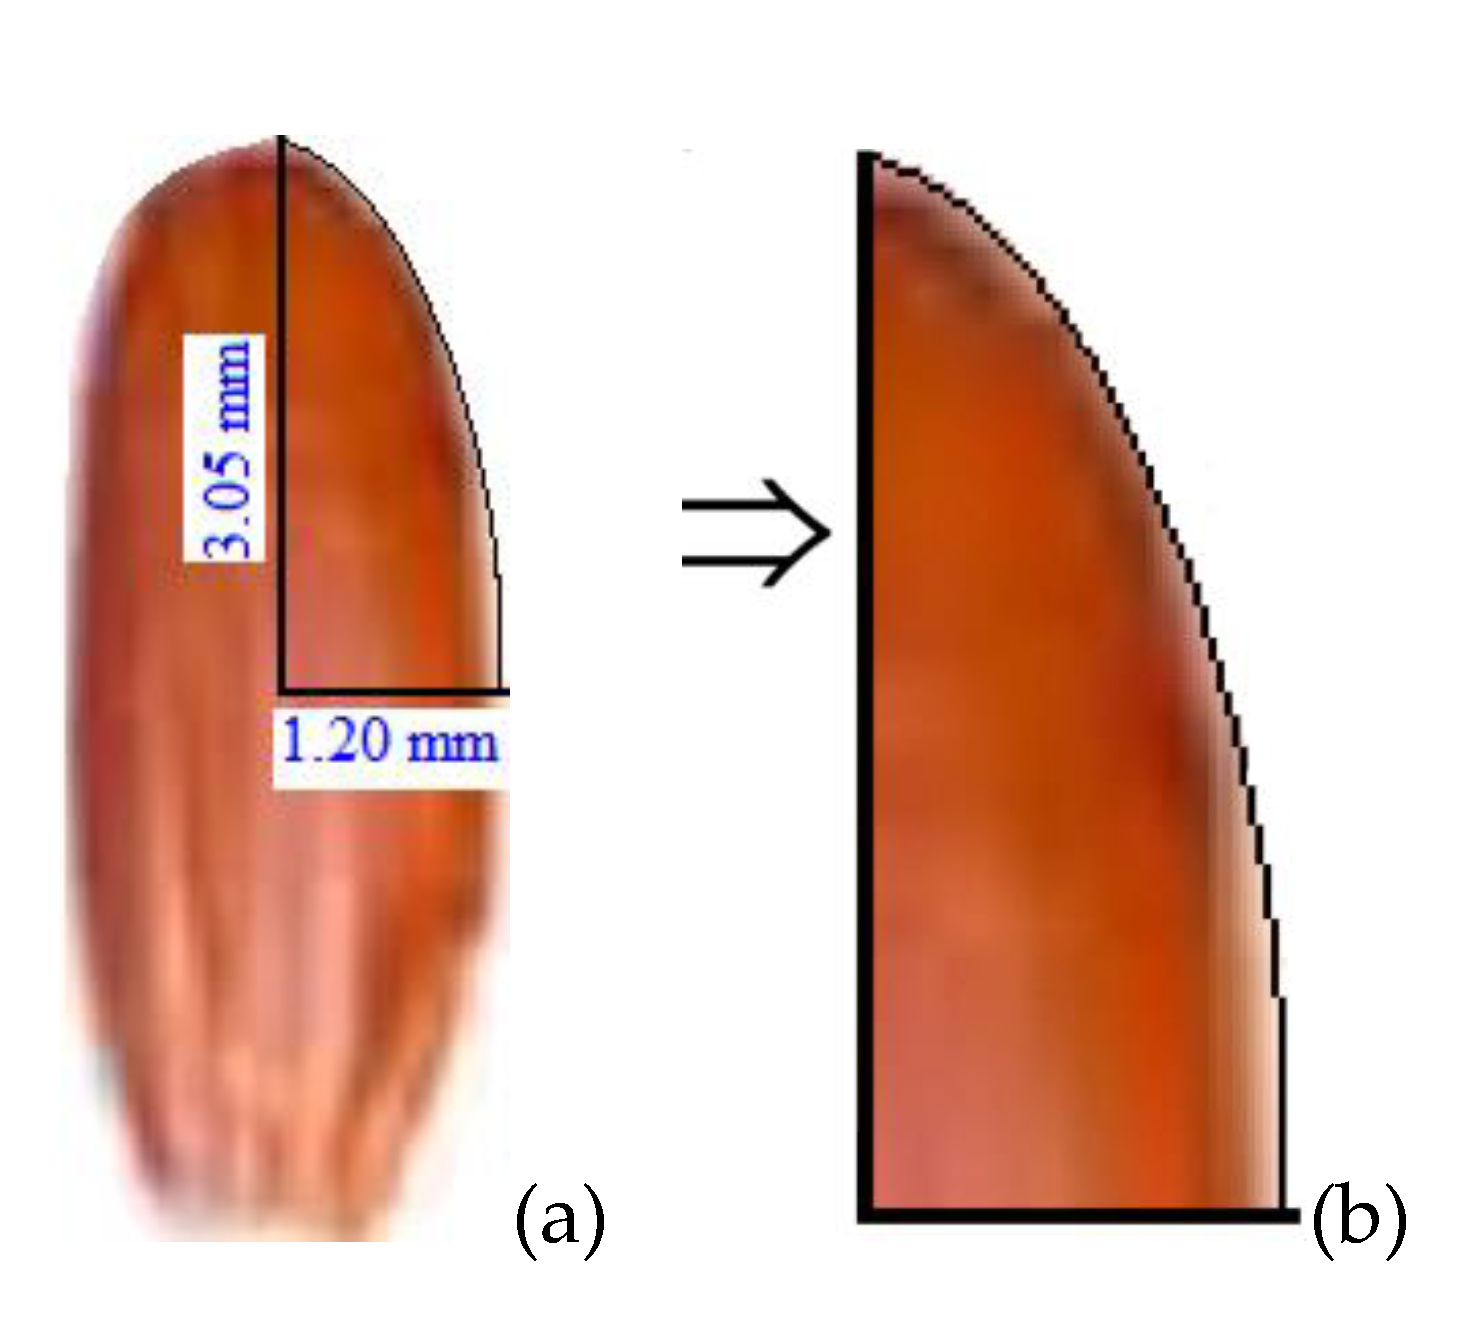
Figure 1. (a) Photograph of a grain of husked red rice highlighting a quarter of the flat area; (b) Contours of the flat area to generate a mesh for half a grain.
Preprints 111121 g001
Figure 2. Orthogonal axis system, x , y , z and the generalized coordinates, ξ , η , γ highlighting a point P that can be located through both axis systems.
Preprints 111121 g002
Figure 3. Non-orthogonal two-dimensional structured mesh (10×20) generating the solid of revolution through its rotation around the y-axis. Control volume in blue (chosen node), which is the center of the grain, was selected to study its transient regime.
Preprints 111121 g003
Figure 4. Water diffusivity D as a function of the local moisture content M, for each temperature.
Preprints 111121 g004
Figure 5. Mass diffusivity D for water absorption by husked red rice as a function of the temperature T and the local moisture content M.
Preprints 111121 g005
Figure 6. Kinetics of water absorption by husked red rice at temperatures T: (a) 28.0 °C (magenta); (b) 40.0 °C (red); (c) 50.0 °C (blue); (d) Superposition of the three kinetics.
Preprints 111121 g006
Figure 7. Transient regime of the central point of the grain (chosen node) until reaching M = 0.167 g/g, at temperatures T of 28.0 °C, 40.0 °C and 50.0 °C.
Preprints 111121 g007
Figure 8. Distribution of water absorbed at time t = 100.0 min for temperatures T of:. (a) 28.0 °C; (b) 40.0 °C; (c) 5.00 °C.
Preprints 111121 g008
Figure 9. Distribution of water absorbed at final time t for temperatures T of: (a) t = 450.0 min, T = 28.0 °C; (b) t = 390.0 min, T = 40.0 °C; (c) t = 300.0 min, T = 50.0 °C.
Preprints 111121 g009
Figure 10. Evolution of the growth in the generating area for each temperature T at the specified times t: (a) T = 28.0 °C at t = 0.0, 75.0, 150.0, 225.0, 300.0, 375.0, 450.0 min; (b) T = 40.0 °C at t = 0.0, 65.0, 130.0, 195.0, 260.0, 325.0, 390.0 min; (c) T = 50.0 °C at t = 0.0, 50.0, 100.0, 150.0, 200.0, 250.0, 300.0 min.
Preprints 111121 g010
Figure 11. Expansion ratio over time for the three absorption temperatures.
Preprints 111121 g011
Figure 12. Comparison between the mass diffusivity graphs given by Equation (10), obtained by optimization, and by Equation (11), obtained by the LAB Fit Finder:. (a) 28 °C; (b) 40 °C; (c) 50 °C.
Preprints 111121 g012
Figure 13. Kinetics of water absorption by red rice with husk at temperature of 50 °C.
Preprints 111121 g013
Table 1. Parameters of Equation (10) and statistical indicators.
T (°C) a (-) b×1010 (m2 min-1) R2 χ2×10⁵
28.0 7.95 ± 0.22 1.206 ± 0.029 0.99979 1.2388
40.0 7.22 ± 0.17 2.363 ± 0.039 0.99957 3.8311
50.0 6.65 ± 0.12 3.874± 0.038 0.99991 0.8942
Table 2. Diffusivities, D ( M , T ) , for husked red rice immersed in water during the absorption process.
T (°C) M (g/g) Dx1010 (m2min-1)
28.0 0.0 1.206
28.0 0.1150 3.009
28.0 0.1585 4.252
28.0 0.1850 5.249
40.0 0.0 2.363
40.0 0.1745 8.330
40.0 0.2395 13.318
40.0 0.2609 15.543
40.0 0.2845 18.431
50.0 0.0 3.874
50.0 0.1921 13.898
50.0 0.2723 23.691
50.0 0.2994 28.369
50.0 0.3194 32.405
Table 3. Volume of half a grain of rice at the times previously established for each absorption temperature.
28.0 °C 40.0 °C 50.0 °C
t (min) V×109 (m3) t (min) V×109 (m3) t (min) V×109 (m3)
0.0 9.247 0.0 9.247 0.0 9.247
75.0 10.30 65.0 11.17 50.0 11.54
150.0 10.79 130.0 11.91 100.0 12.36
225.0 11.11 195.0 12.36 150.0 12.85
300.0 11.35 260.0 12.67 200.0 13.17
375.0 11.54 325.0 12.89 250.0 13.38
450.0 11.70 390.0 13.06 300.0 13.53
Disclaimer/Publisher’s Note: The statements, opinions and data contained in all publications are solely those of the individual author(s) and contributor(s) and not of MDPI and/or the editor(s). MDPI and/or the editor(s) disclaim responsibility for any injury to people or property resulting from any ideas, methods, instructions or products referred to in the content.
Copyright: This open access article is published under a Creative Commons CC BY 4.0 license, which permit the free download, distribution, and reuse, provided that the author and preprint are cited in any reuse.
Prerpints.org logo

Preprints.org is a free preprint server supported by MDPI in Basel, Switzerland.

Subscribe

© 2024 MDPI (Basel, Switzerland) unless otherwise stated