1. Introduction
Peripheral nerve injury (PNI) is a challenging clinical issue with diverse range of symptoms, including muscle weakness, pain, and paresthesia often resulting in functional disability and affecting quality of life[
1,
2,
3]. The most severe degree of PNI is neurotmesis, a nerve transection injury with complete disruption of endoneurium, perineurium, and epineurium [
3]. Nerve transection injuries with a substance loss exceeding 3mm often require surgical intervention by using nerve conduits for neurological recovery. However, neurological recovery does not guarantee functional recovery resulting from nerve regeneration at the injury site, and reinnervation and muscle function recovery of the end-organ (muscle innervated by the injured nerve) [
2]. After muscle denervation caused by neurotmesis, muscle fibers degenerated and were replaced by fibrous connective tissue resulting in function loss [
4]. Muscle function is determined not only by the muscle fibers that generate force but also by the intramuscular connective tissue (IMCT), which transmits force, regulating muscle flexibility and stiffness through its extracellular matrix (ECM) components [
5,
6].
Previous studies reported collagen accumulation in the denervated muscle ranging from 2 days to 5 weeks after denervation [
7,
8,
9,
10,
11]. Indeed, ECM of IMCT is composed of not only protein fibers such as collagen fibers, which provides a three-dimensional scaffold for muscle fibers, playing a crucial role for the force transition [
5,
6], but also ground substances regulating the gliding movement [
12], composing of proteoglycans, multi-adhesive glycoproteins, glycosaminoglycans, and water. Among these components, hyaluronan (HA) plays a vital role for the integrity of ECM [
13]. HA is a high molecular weight glycosaminoglycan found in various tissues and fluids providing mechanical stability and serving as a water reservoir and lubricant [
14]. The primary mechanical function of HA is to maintain the viscosity to facilitate gliding between the two adjacent surfaces of fascia or IMCT and muscle, as well as between fascia sublayers [
15,
16,
17]. The alterations in the concentration, molecular weight, or covalent modification of HA, and the changes in its binding interactions with other macromolecules, can significantly impact the gliding movement of IMCT or fascia [
18], leading to various pathological conditions including pain and muscle dysfunction [
19].
HA alteration has been widely observed in IMCT in skeletal muscle in different pathological conditions: an accumulation of HA was found in joint immobilization rats [
20]and stroke patients [
21]; whereas a reduction of HA level and increasing collagen level was found in aged human and mouse muscles [
22] as well as in patients with hip osteoarthritis [
23]. However, HA in IMCT of muscles following nerve injury remains unexplored. Therefore, the primary goal of this study is to analyze the HA amount modifications in IMCT of the gastrocnemius muscle following sciatic nerve injury in rats.
The secondary goal of this study is to investigate ECM alterations in the gastrocnemius muscle on the contralateral side of the left sciatic nerve injury rats. Previous animal studies demonstrated that unilateral lower limb PNI has a significant impact on lower limb muscle atrophy, affecting not only the injured side but also the contralateral side in rat PNI model [
24,
25]. Specifically, two weeks post left L5 nerve injury, there was a significant decrease in muscle mass in the right gastrocnemius muscle, accompanied by reductions in myofibrillar protein content and cross-sectional area of Type II fibers in the right plantaris muscle of the rats [
25]. However, the changes of ECM on the muscle of the contralateral side after unilateral lower limb PNI remain unclear.
Thirdly, we also extend our investigation of ECM alterations in the thoracolumbar fascia (TLF), as evidence has shown a connection between the TLF and the fascia of the lower limb [
26]. The aim is to explore whether the impact of a unilateral lower limb PNI is localized exclusively to the end-organ --affecting the muscle innervated by the injured nerve or extends systemically--affecting distally lower limb on the contralateral side and reaching proximally to the TLF.
Therefore, this study aims to investigate the concentration of HA and collagen in IMCT of the muscle innervated by the injured never, the muscle on the contralateral side and in the TLF of the unilateral lower limb PNI rats, to provide new insights into the localized and systemic effects of PNI on ECM, potentially guiding future therapeutic strategies aimed at holistic functional recovery.
3. Discussion
In this study, six weeks after the left sciatic nerve transection injury repaired by nerve conduits, the SFI values of the rats in the experimental group are near -100, indicating a sever deficit of motor function following the unilateral lower limb PNI, as the scores range from 0 (normal function) to -100 (complete dysfunction) [
27]. Gait analysis supports this functional deficit, revealing abnormal movement patterns. Our previous research has revealed that, six weeks post-surgery, OxPVA-based nerve conduits significantly increased the number and density of myelinated axons in the sciatic nerve transection injury rats [
28], but is not sufficient enough to achieve functional recovery, which is probably hindered by the alterations in ECM.
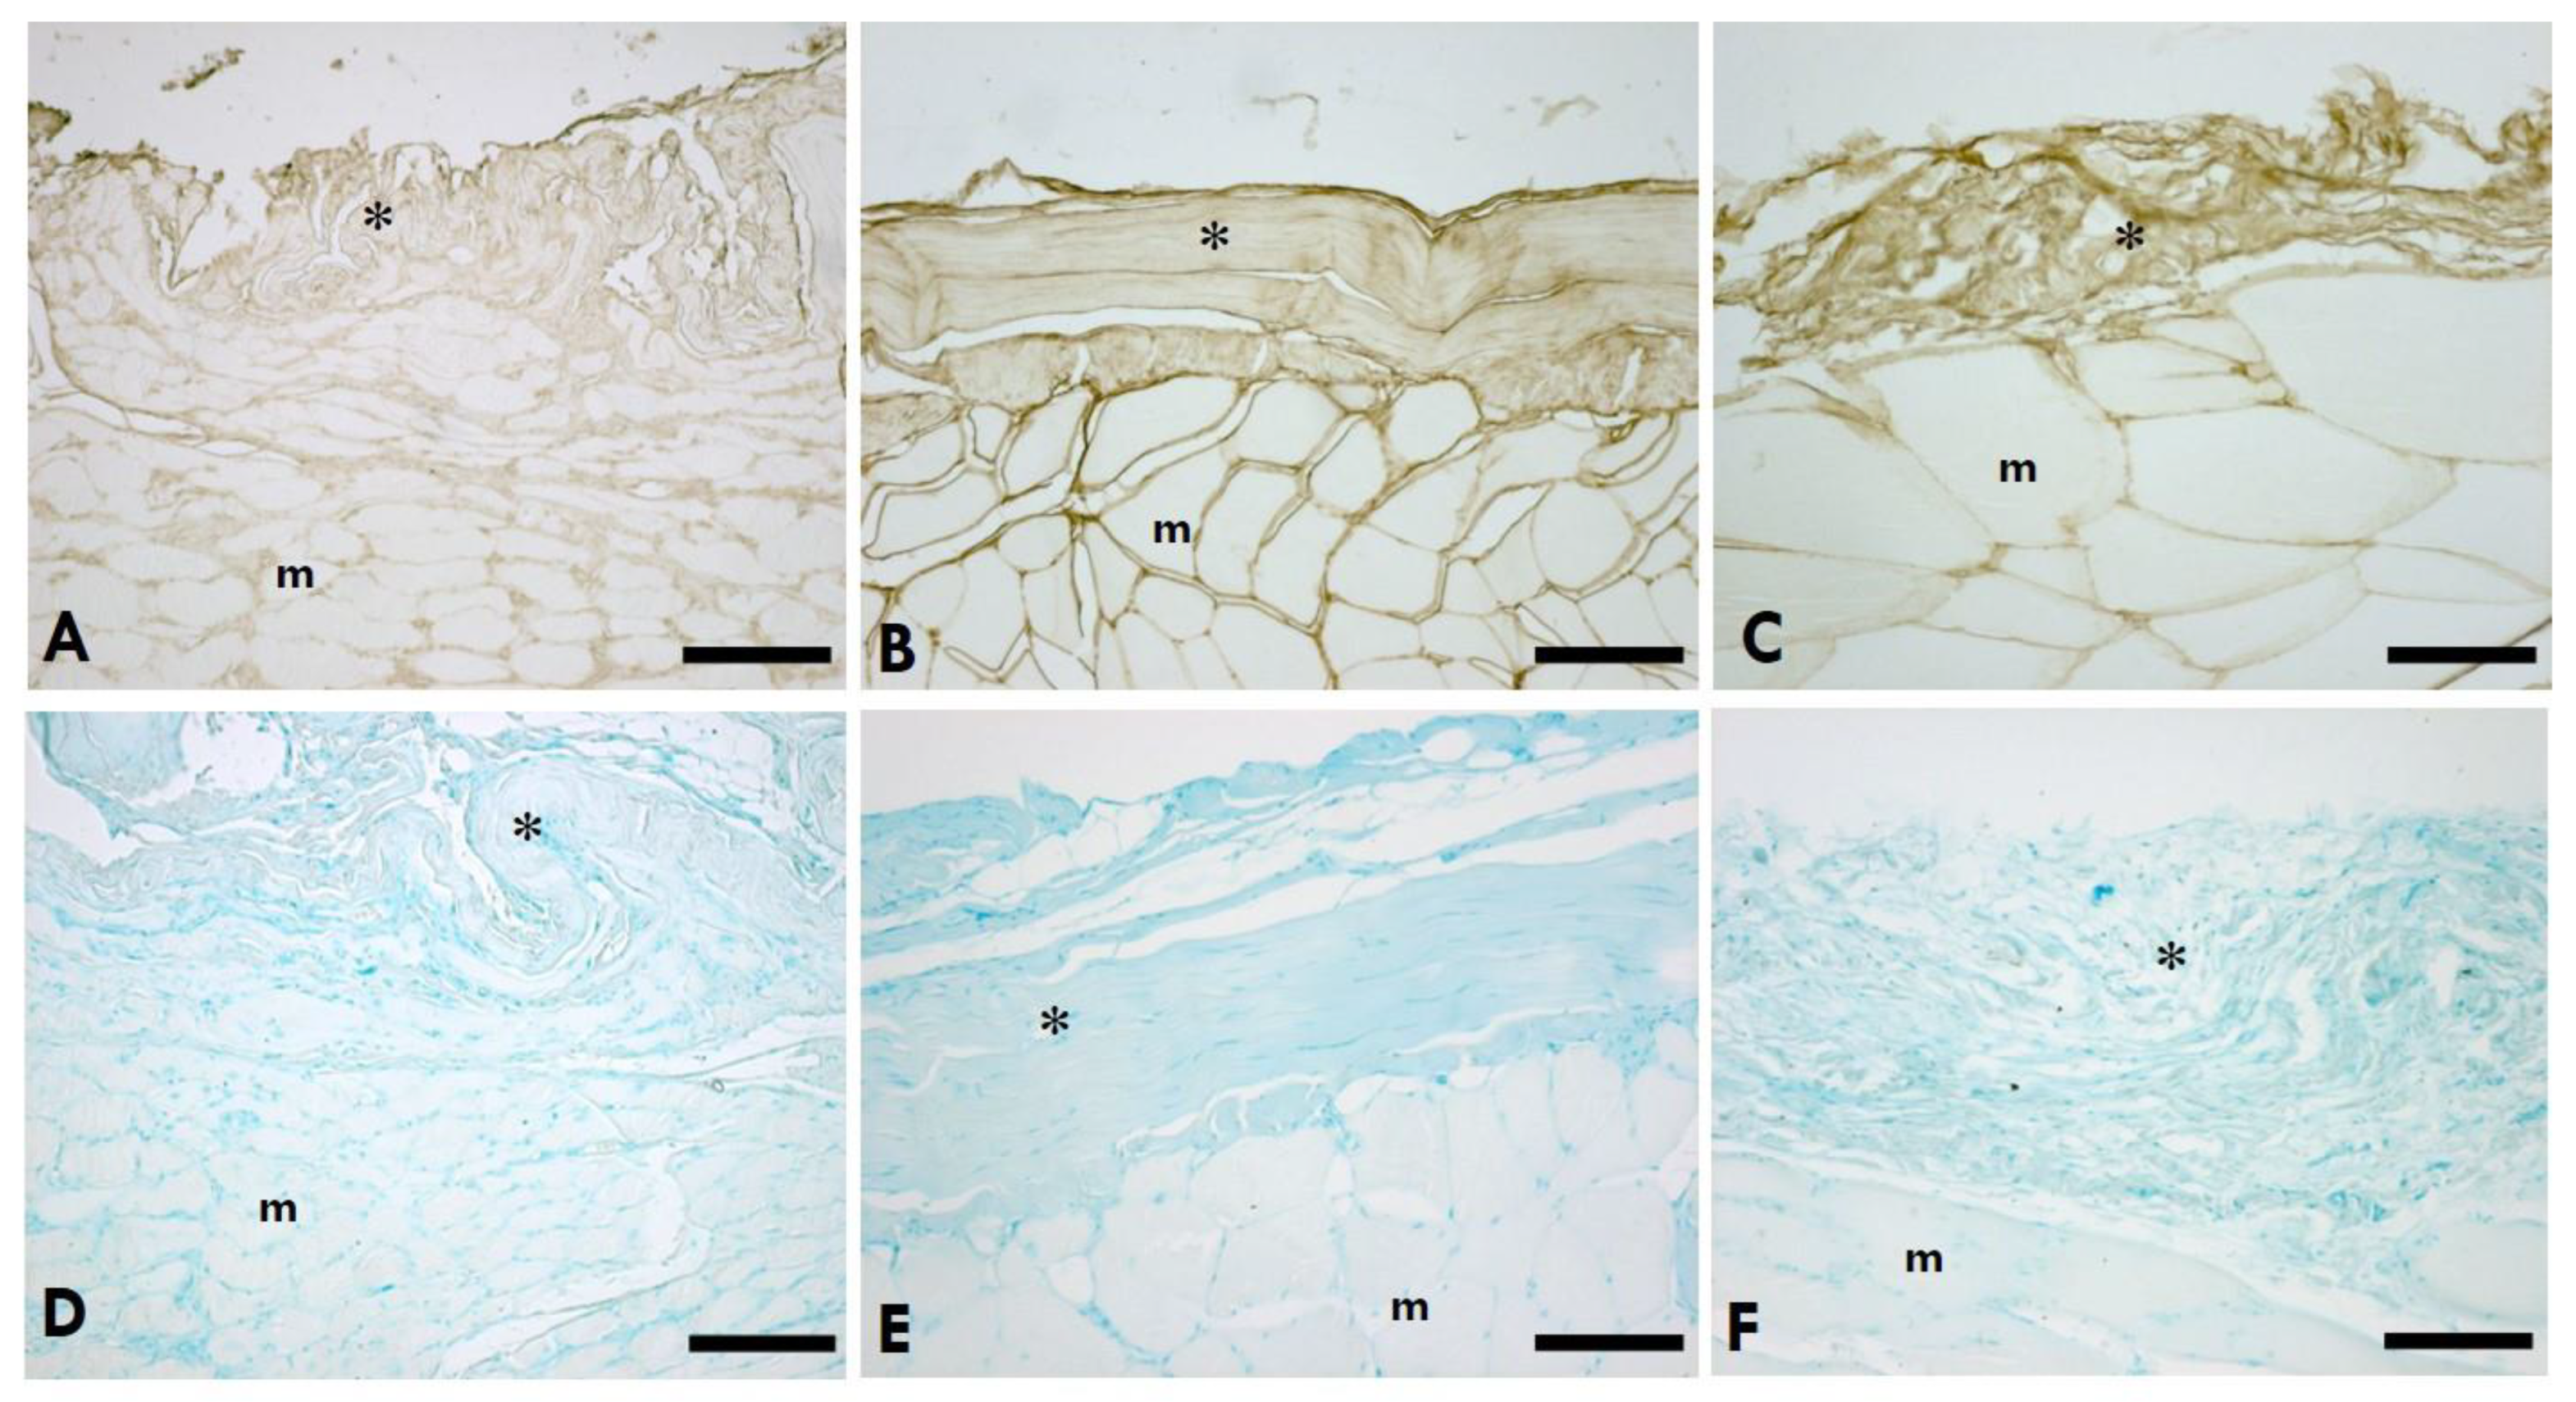
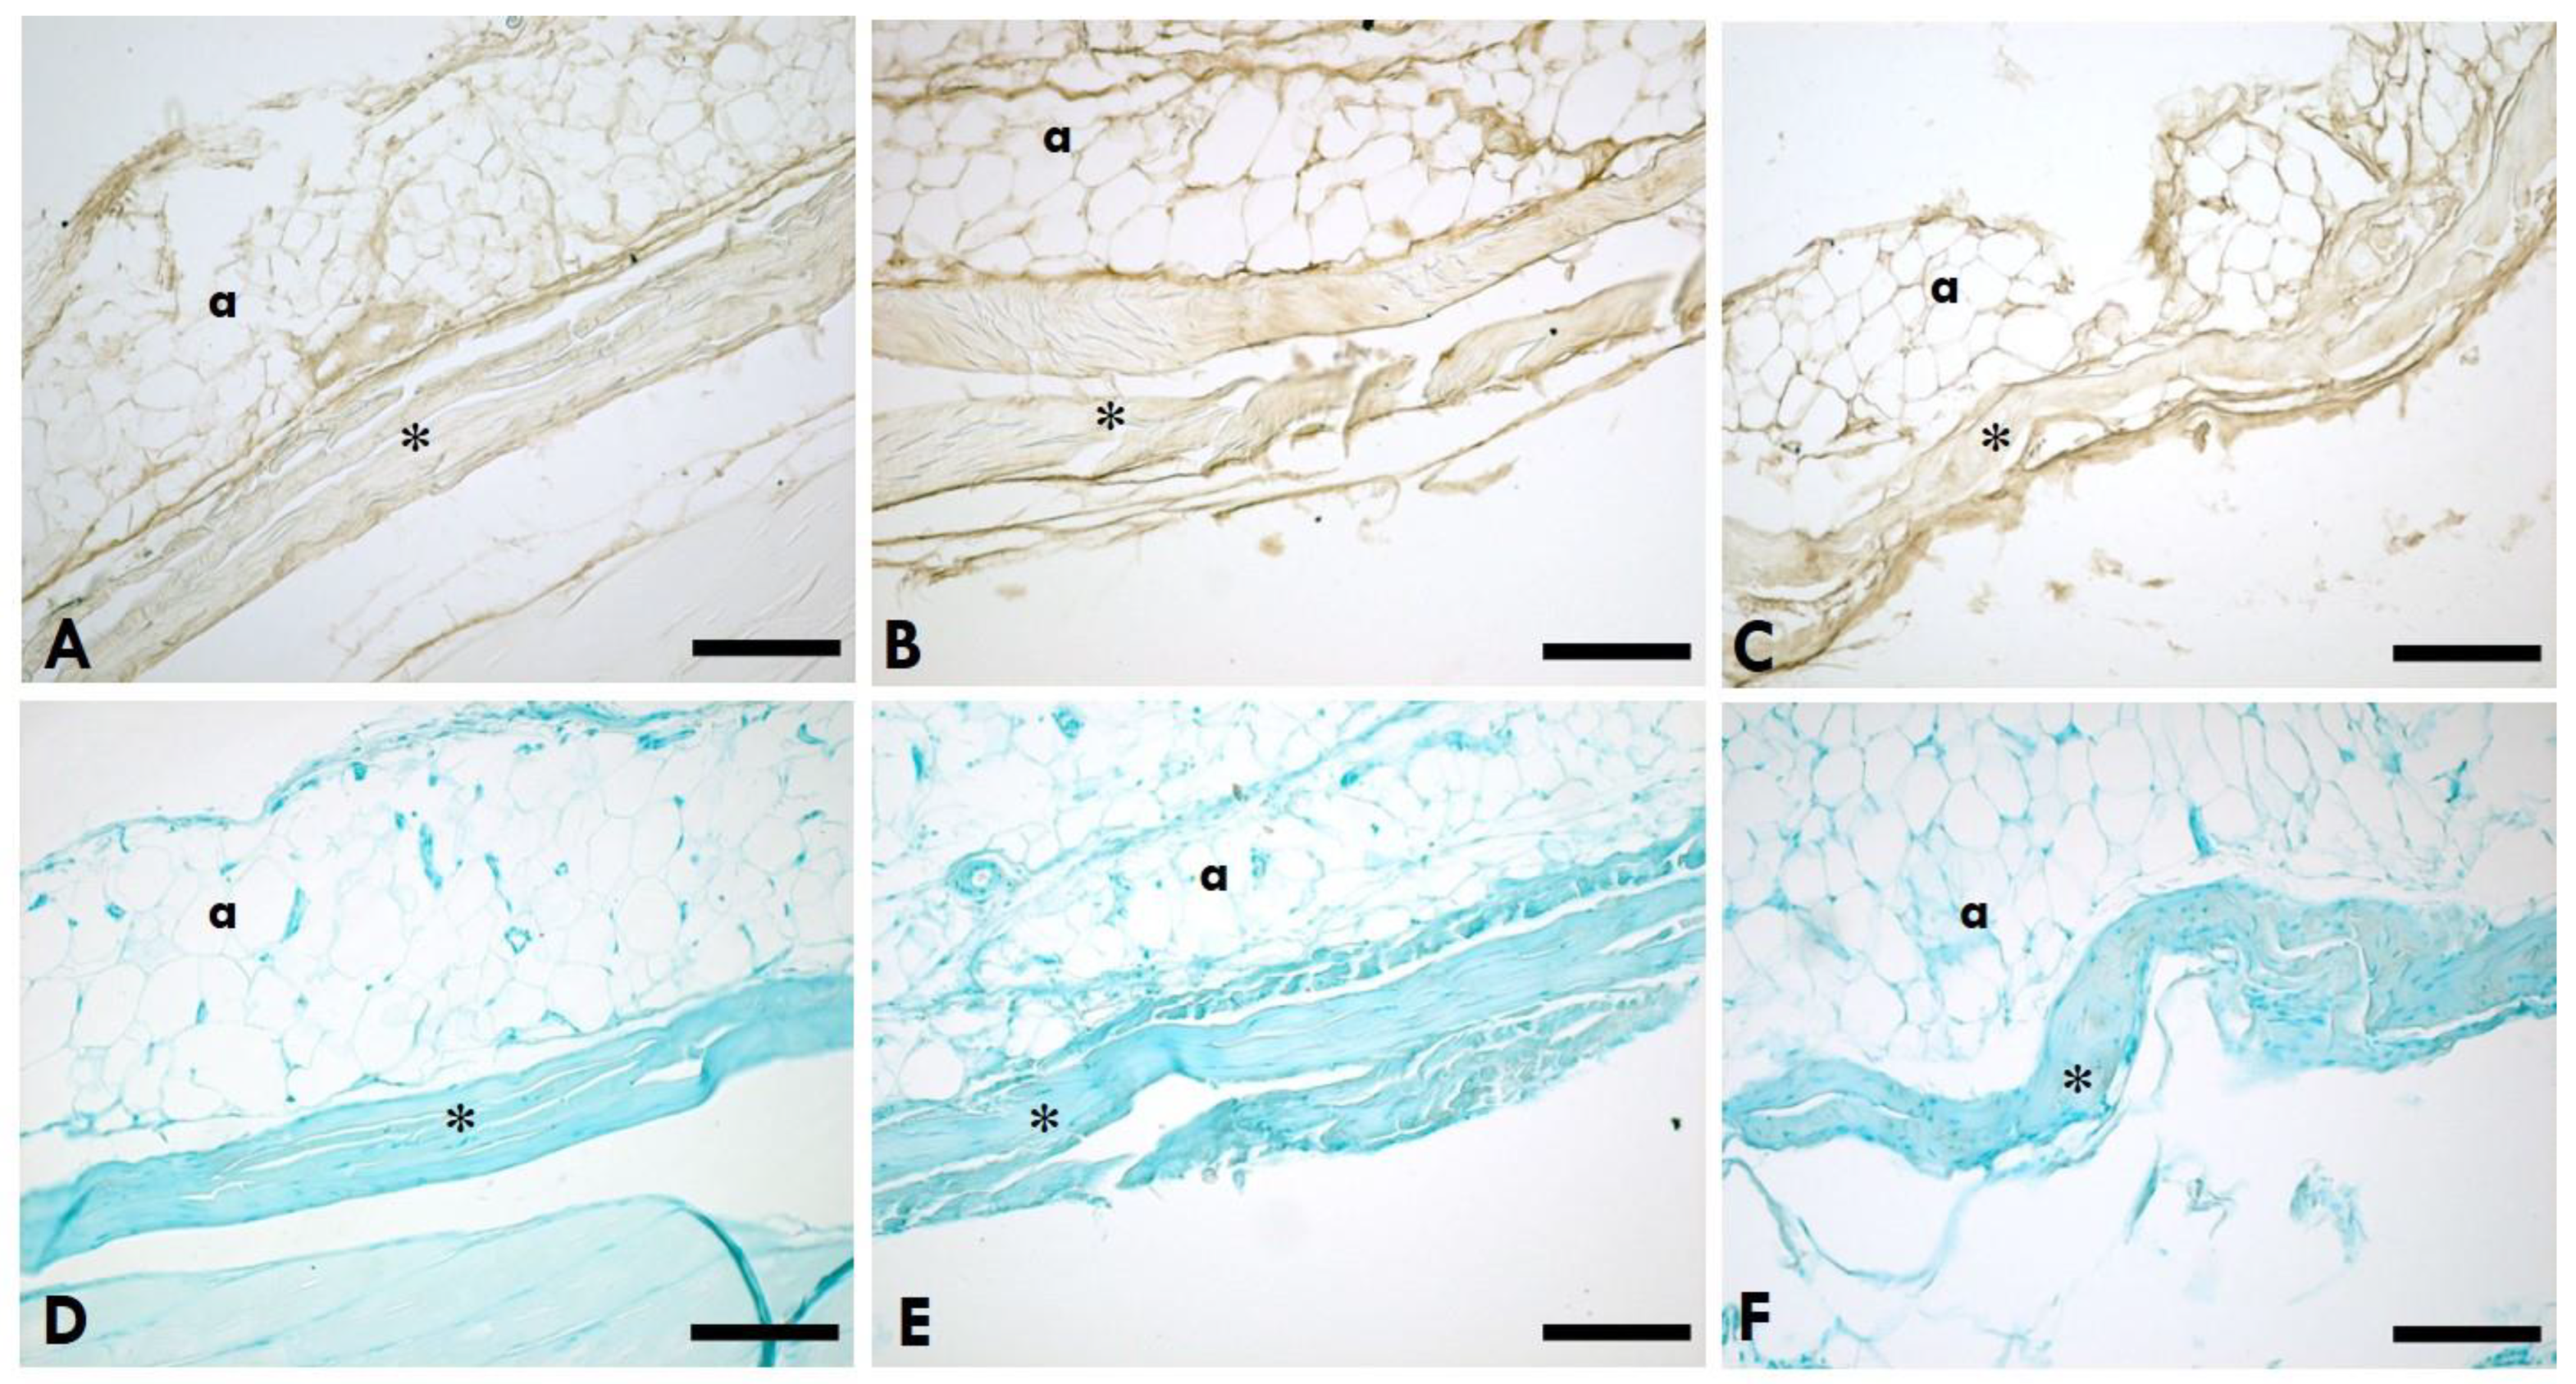
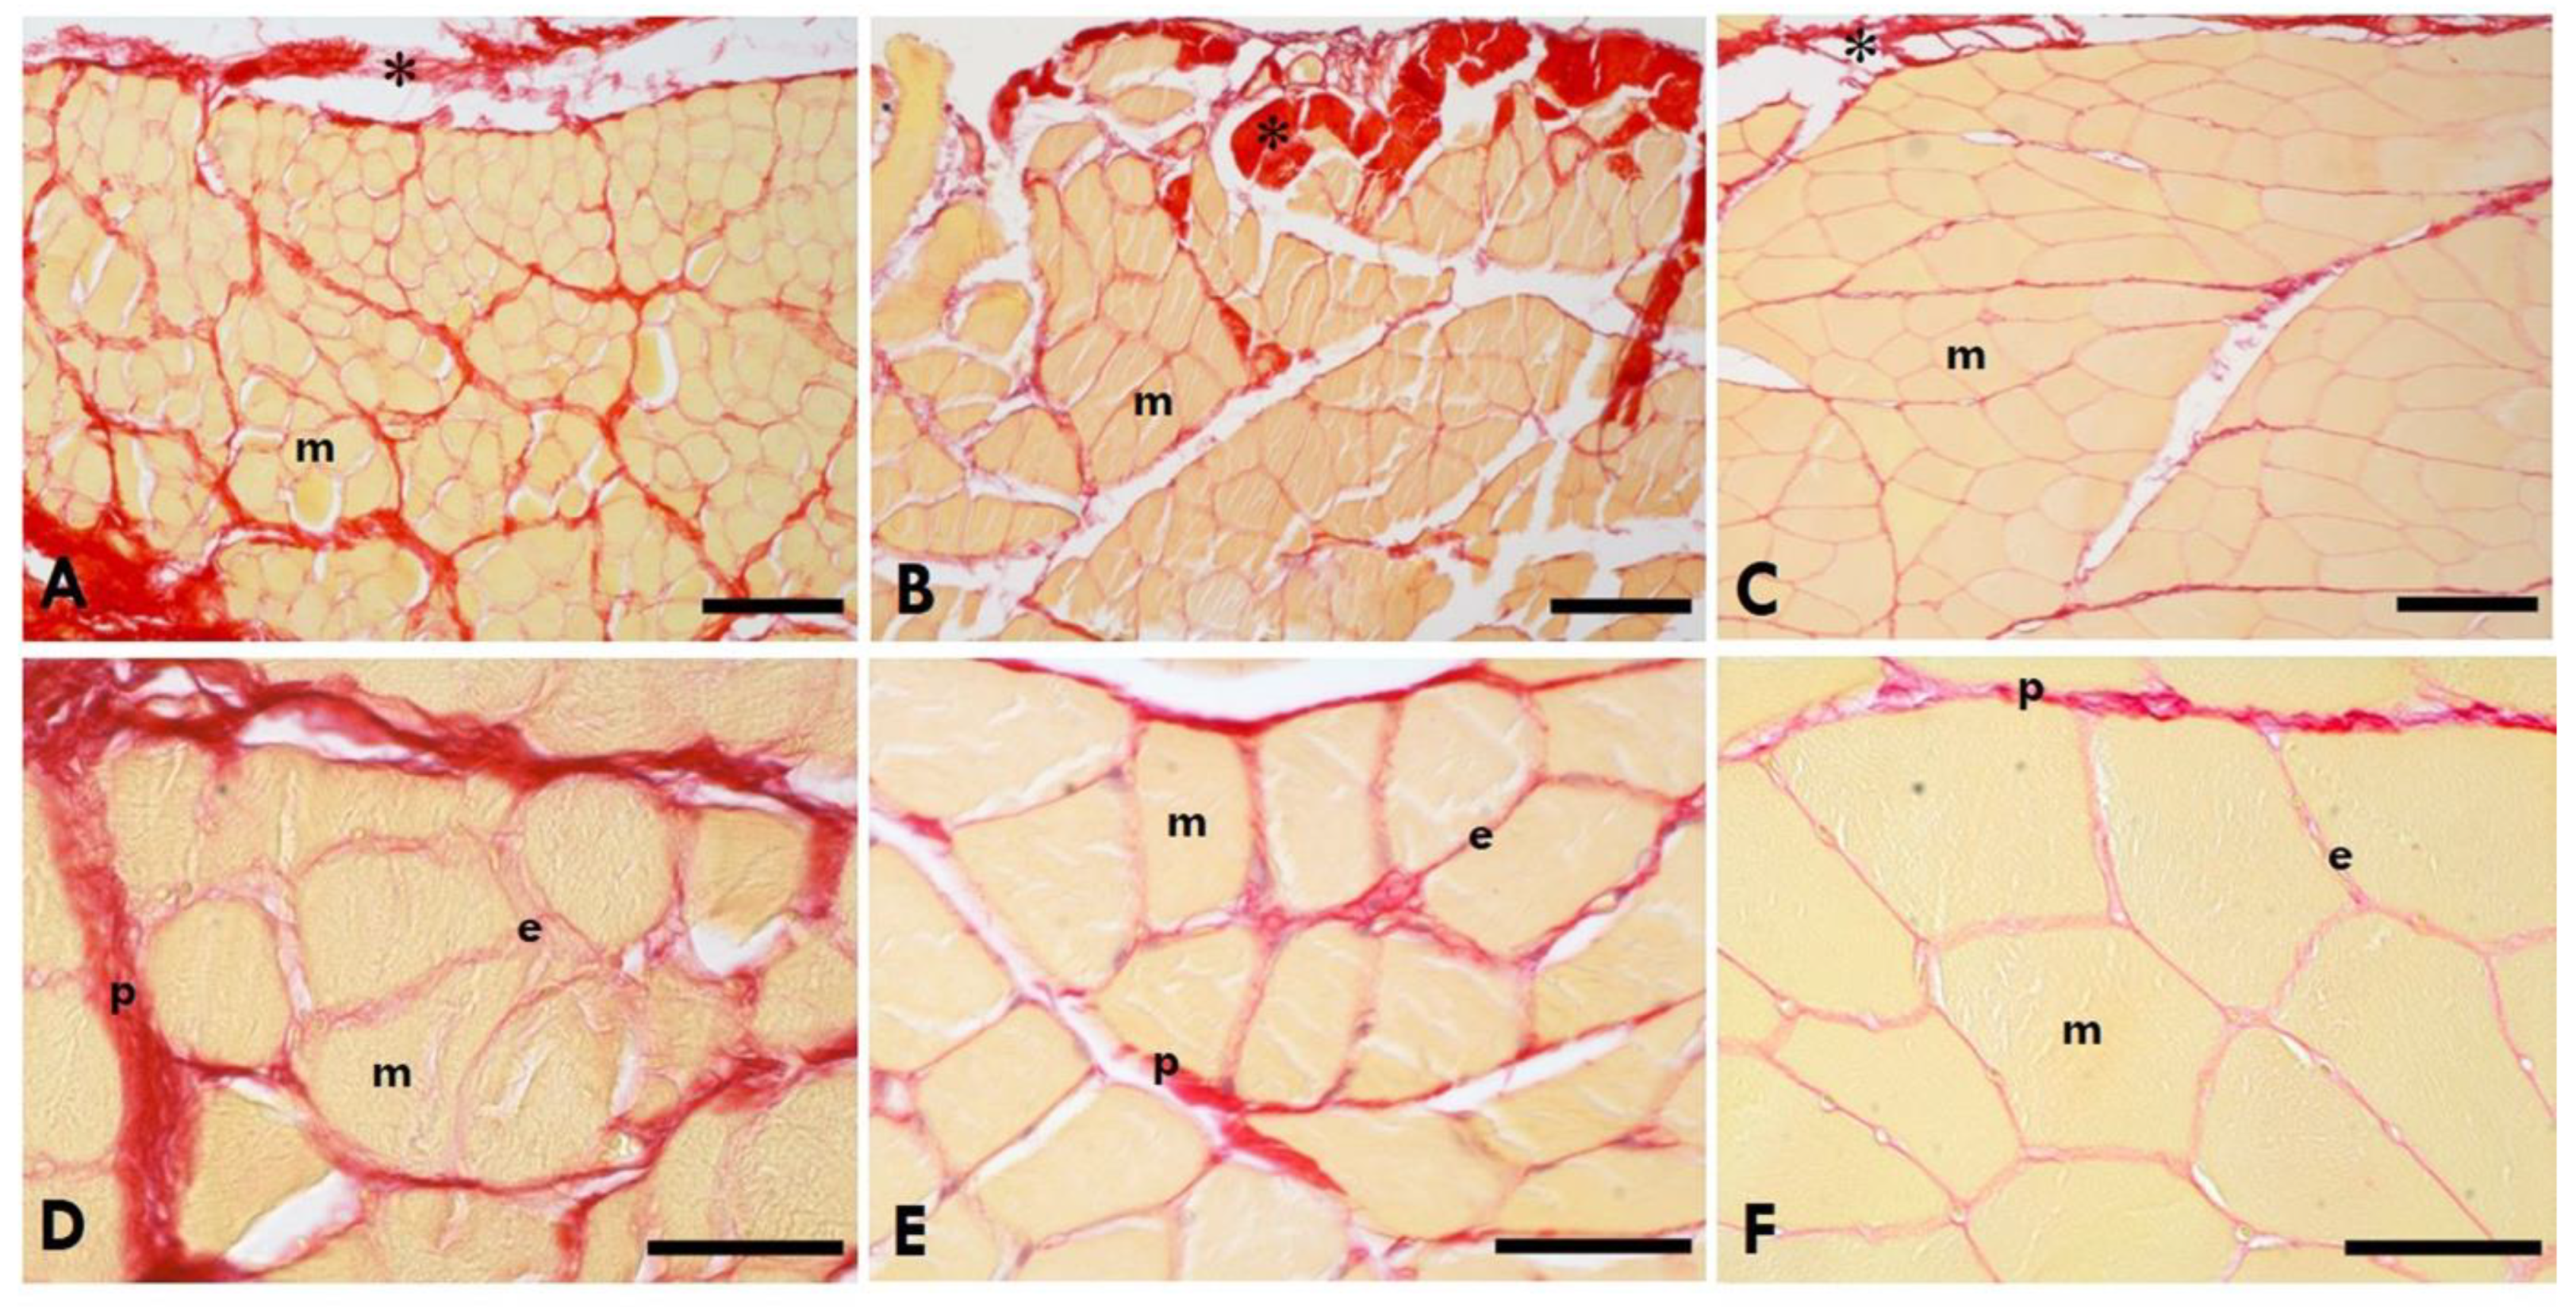
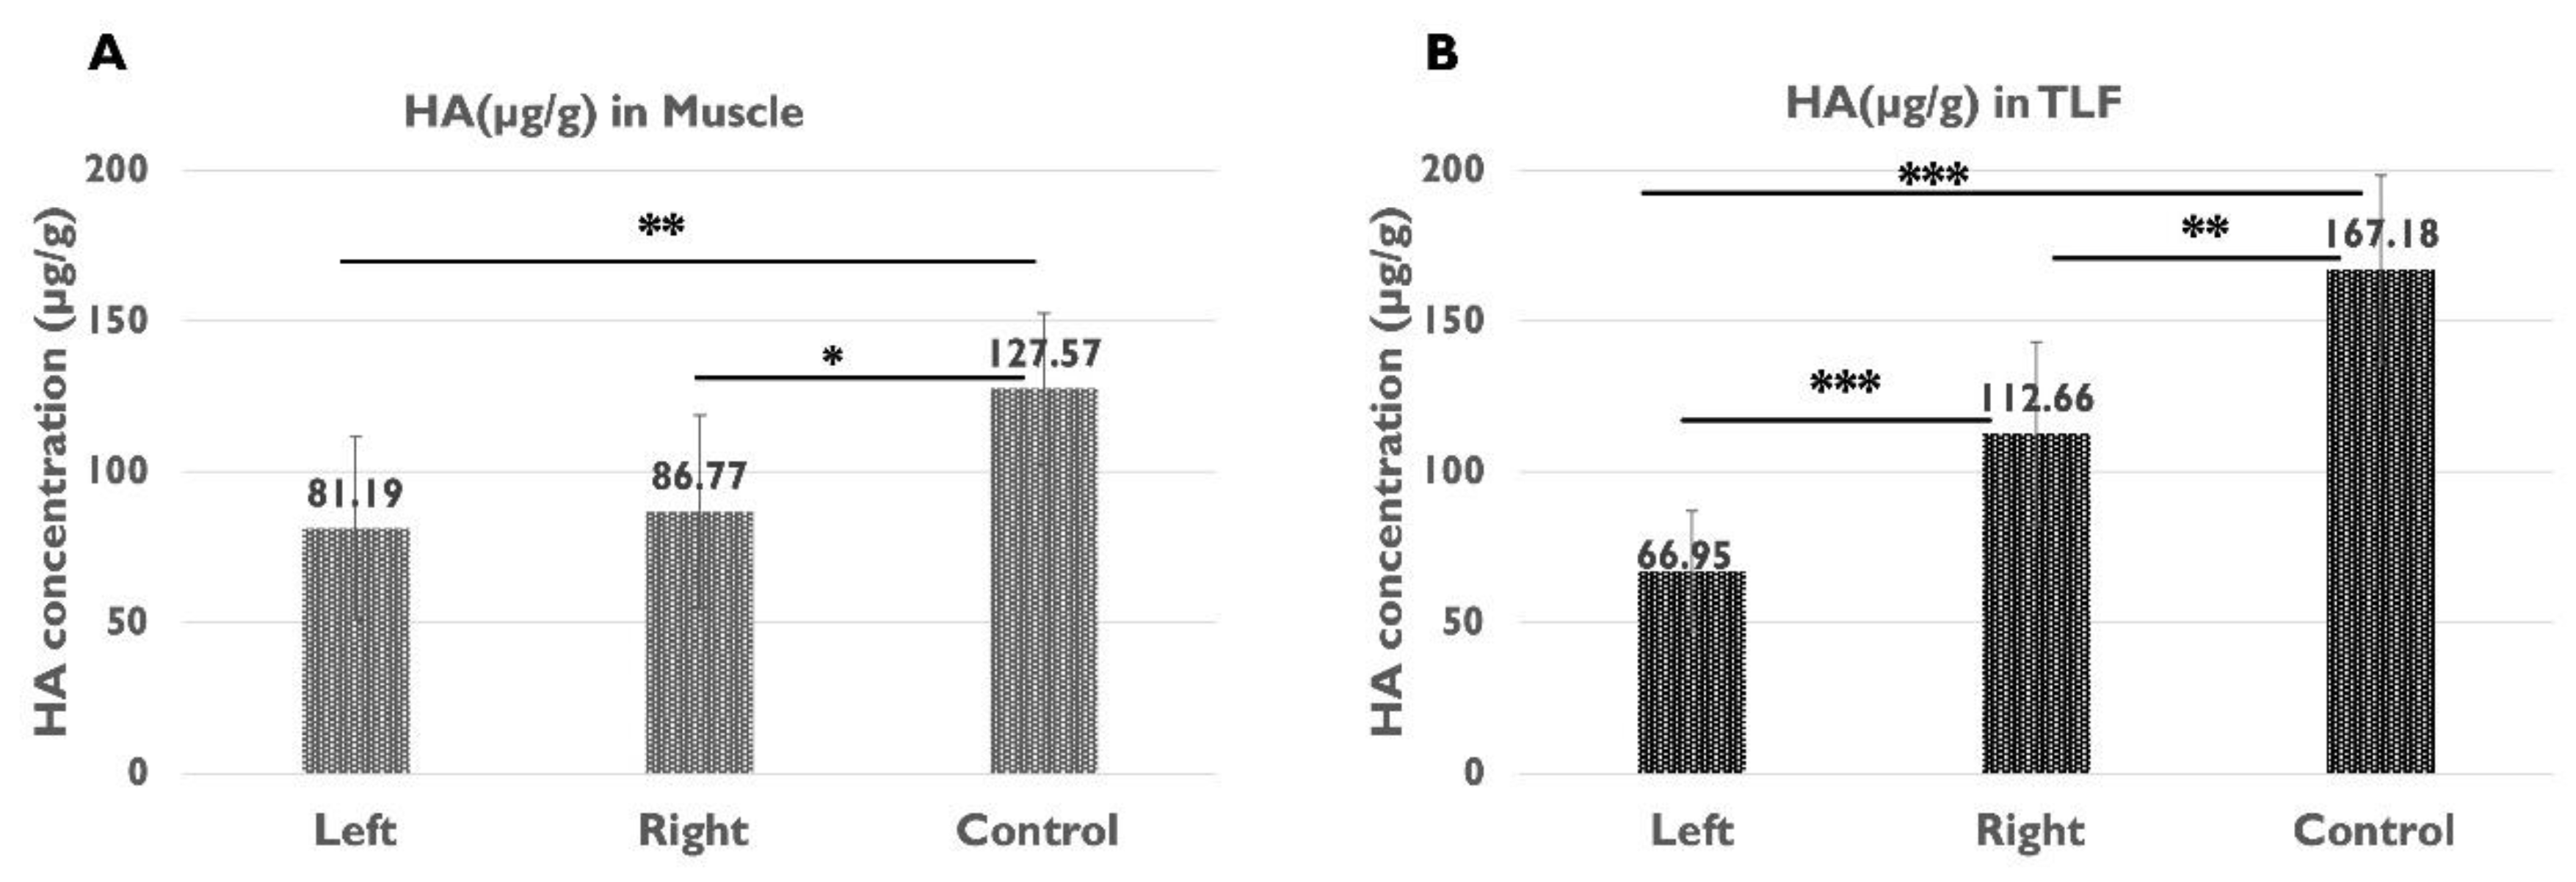
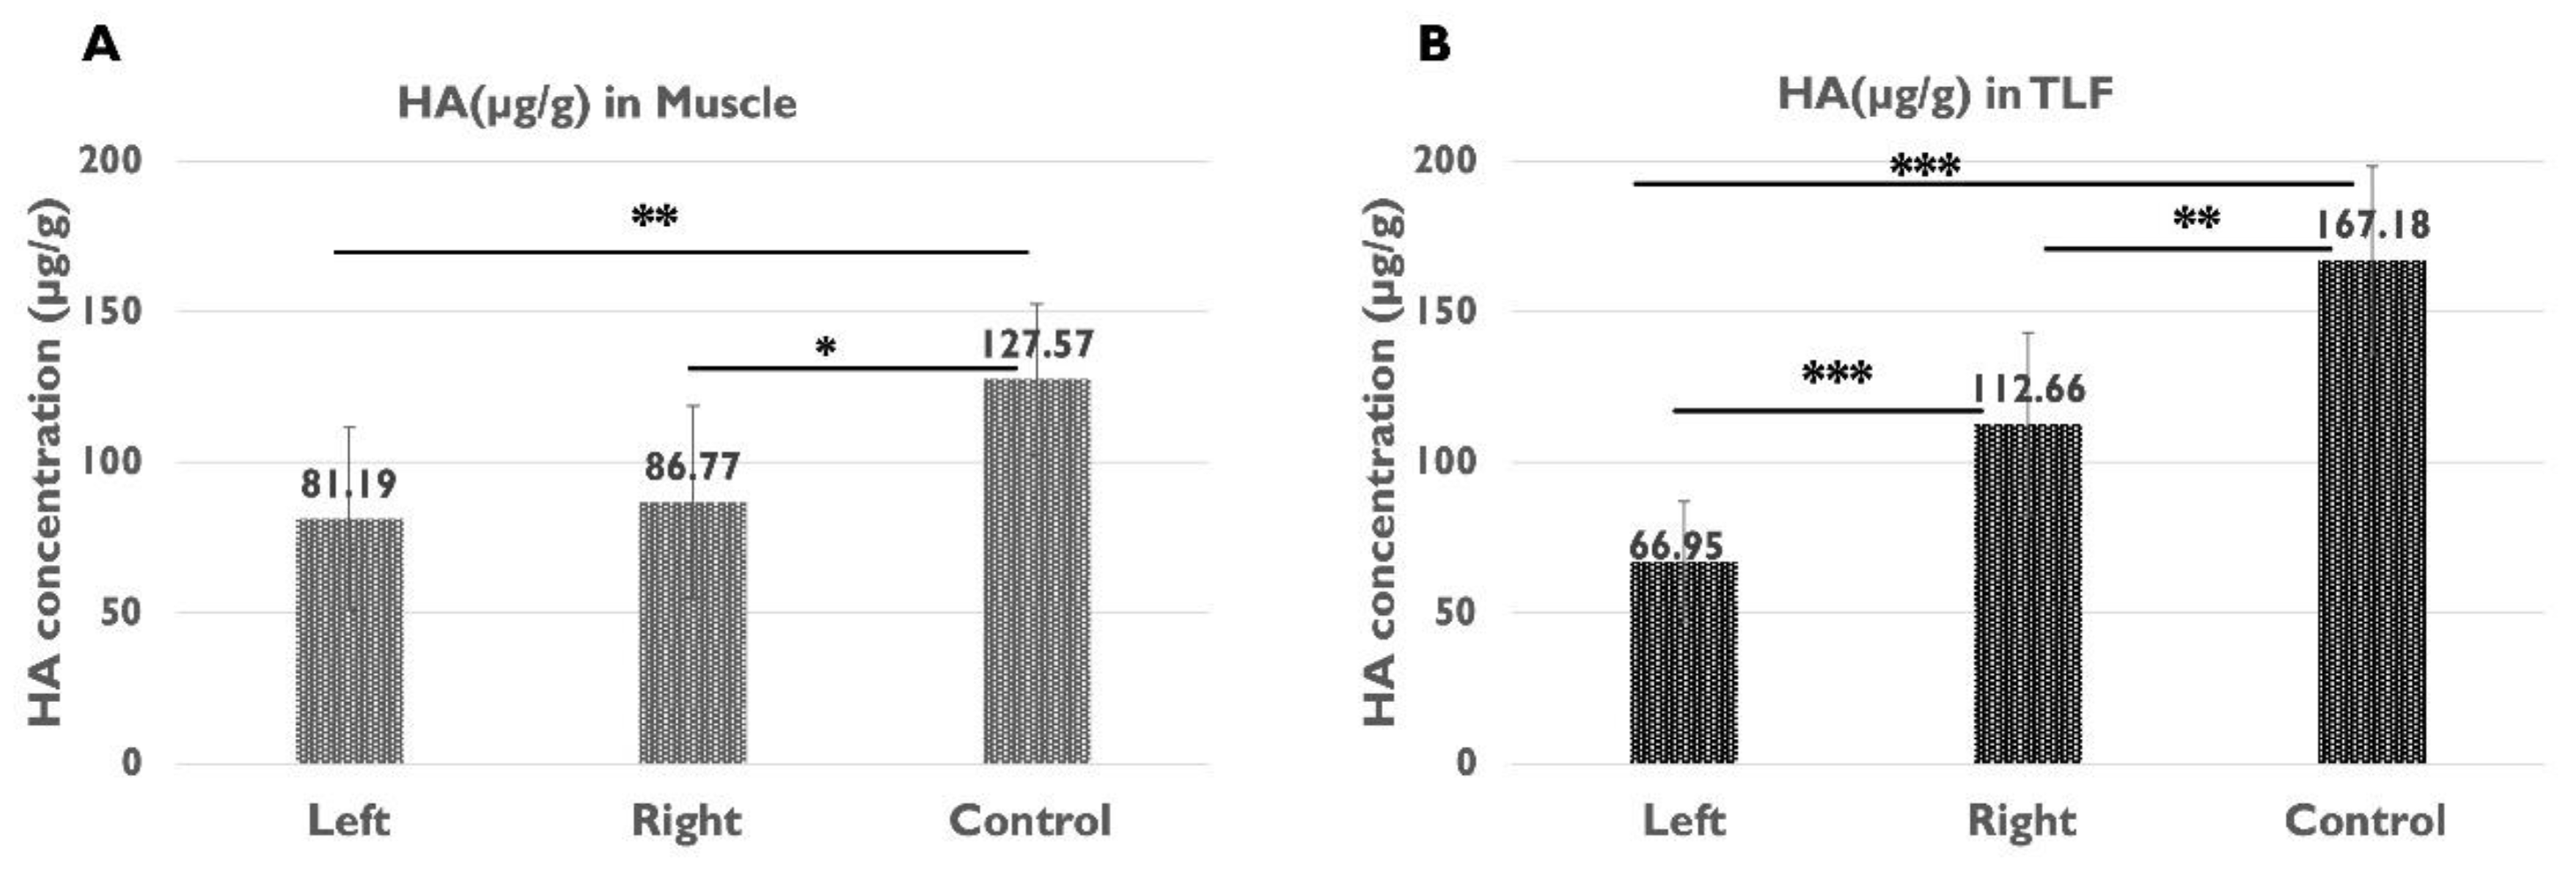
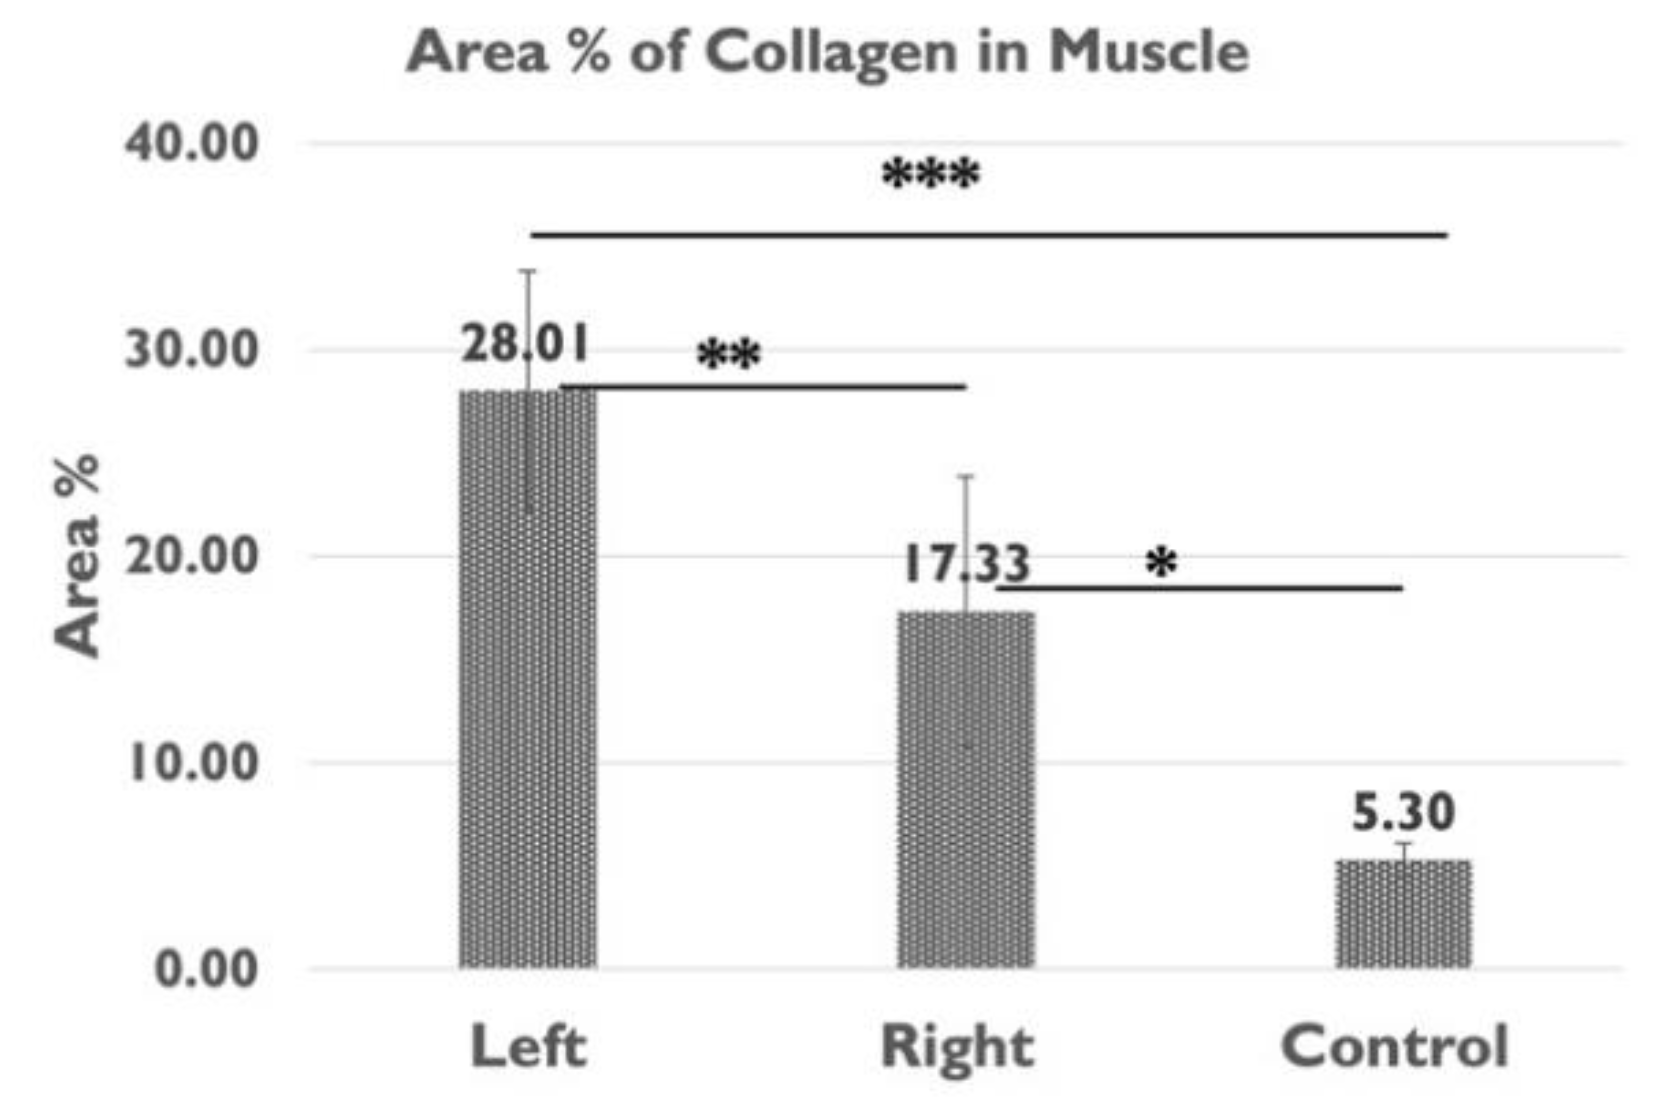
Our findings are the first to demonstrate that 6 weeks after an injury to the unilateral sciatic nerve, compared to the healthy rats, HA concentration in the IMCT of gastrocnemius muscle of both the left and right sides (sciatic nerve injury side and contralateral side) decreased by approximately one-third, from 127.57 µg/g to 81.19 µg/g and 86.77 µg/g; additionally a greater reduction in HA was observed in the TLF on the injured side than on the contralateral side. In terms of collagen, both biochemical assays and analysis of collagen area % showed a significant increase in collagen levels (roughly one-third) within the IMCT of the gastrocnemius muscle on the sciatic nerve injury side compared to the contralateral side. This accumulation of collagen concentration aligns with the previous findings in the denervated muscles on rat models [
7,
8,
9,
10,
11], but our study extends the observations to collagen accumulation on the contralateral side and at a distance in the TLF. Compared to the healthy rats, collagen level increased nearly three times on the sciatic nerve injury side and two times on the contralateral side in both the gastrocnemius muscle and TLF. Combined with the HA alterations in both the muscle and TLF, these results indicate a systemic ECM alteration after unilateral lower limb peripheral nerve injury.
HA, the main component of the ground substance in ECM, not only impacts the viscoelasticity of the ECM facilitates the gliding among muscles [
17,
26], but also is critical for effective tissue repair and regeneration [
29,
30]. In muscle denervation following sciatic nerve transection injury, the reduced HA levels can limit the muscle repair and regeneration process [
31,
32] leading to compromised muscle functional recovery. On the contralateral side, the lower HA level could lead to hydration reduction of IMCT, affecting lubrication and then altering the normal gliding of muscle during movement[
22], which can influence the muscle function.
On the other hand, collagen is the most abundant component of ECM playing a crucial role in providing structure support for cells and scaffolding for muscle fibres, and resistance to force, tension, and stretch to protect muscle fibres [
33]. In general, the increased collagen concentration can increase the stiffness of the IMCT and muscle [
34], which limits force transmission, leading to decreased functional capabilities diminishing functional efficiency [
35]. While the increased collagen level in the left gastrocnemius muscles of left sciatic nerve injury rats can be a protective factor for muscle atrophy during the stage of denervation [
10], it limits the functional recovery after reinnervation, and contributes to decrease elasticity and muscle mechanical performance.
Therefore, for functional recovery, reduced HA level and increased collagen of the gastrocnemius muscle of both sides may aggravate these functional impairments by affecting the viscoelastic properties [
18] and stiffness [
34] of the gastrocnemius muscles which is crucial for plantarflexion during walking [
36,
37].
The reduction of HA level and the concurrent increase in collagen concentration in unilateral lower limb PNI rats was also observed at distance in the TLF. Compared to the healthy rats, the significant HA reduction observed on both the left and right side in the left sciatic injury rats is exceeding a half on the left and one-fourth on the right side, while the collagen level increased nearly three times on the injured side and two times on the contralateral side. Anatomically, the TLF serves as an attachment point for both the upper and lower limb muscles; functionally, it is essential for the efficient transfer of loads between the trunk and the limbs [
38]. Structurally, the TLF is a thick, band-like, multi-layered structure consisting of three layers of collagen fibres separated by a thin layer of loose connective tissue [
39,
40], rich in HA that facilitates the gliding of adjacent sublayers to maintain the normal function of the TLF [
17]. The reduction of HA demonstrated in this study can reduce the gliding movement of the TLF while an increase in collagen level can increase its stiffness. This combination can make the TLF become more rigid and stiffer.
For overall function, these ECM alterations in the TLF can also contribute to abnormal gait. A human study suggested that the increased stiffness in the TLF together with increased plantar-flexion resistance could influence biomechanics of plantar-flexion during walking [
41], and therefore potentially impact gait patterns. In addition, clinical evidence has demonstrated that individuals with chronic low back pain (LBP) can experience reduced shear strain of the TLF [
42]. The reduction of HA level demonstrated by this study, can lead to a decrease in the gliding capabilities of the layers of connective tissue of TLF [
18], which can decrease the shear strain of TLF with potential increase of the risk of lower back pain[
43]. At the same time, the increased collagen level in the TLF, can increase the stiffness of the TLF. This stiffness combined with reduced gliding due to HA reduction may further exacerbate shear strain [
43] and thereby, potentially contributing to lower back pain and dysfunction.
The ECM alterations demonstrated in this study underline the systemic implications of unilateral lower limb PNI, extending beyond the site of the end-organ to the broader connective tissue network, potentially impacting overall musculoskeletal health and mobility. As fascia exhibits a remarkable capacity for remodelling in response to biomechanical stimuli [
44], the observed ECM alterations in the IMCT in the gastrocnemius muscle of the contralateral side and TLF of the left sciatic nerve injury rat may not directly from the nerve injury itself but rather from compensatory remodelling following of the function loss of the injured limb after PNI.
Limitations and Further Research
This study only evaluated the concentration of the HA, but did not address its molecular weight, which is also important for HA’s function. Additionally, the change of other important ECM elements such as elastic fibers can be taken into consideration in further study. While total collagen content was assessed, future studies should separately investigate types of collagens, such as collagen I and III. Furthermore, the sample size of the control group can be increased at the same level of the experimental group to increase the statistical power of the study.
4. Materials and Methods
4.1. Animal Model of PNI
Eighteen male Sprague-Dawley rats (8-week-old) were randomly allocated into two groups. Specifically, n=12 animals underwent left sciatic nerve transection injury repaired by OxPVA-based conduit (experimental group); n=6 animals represented the healthy control group.
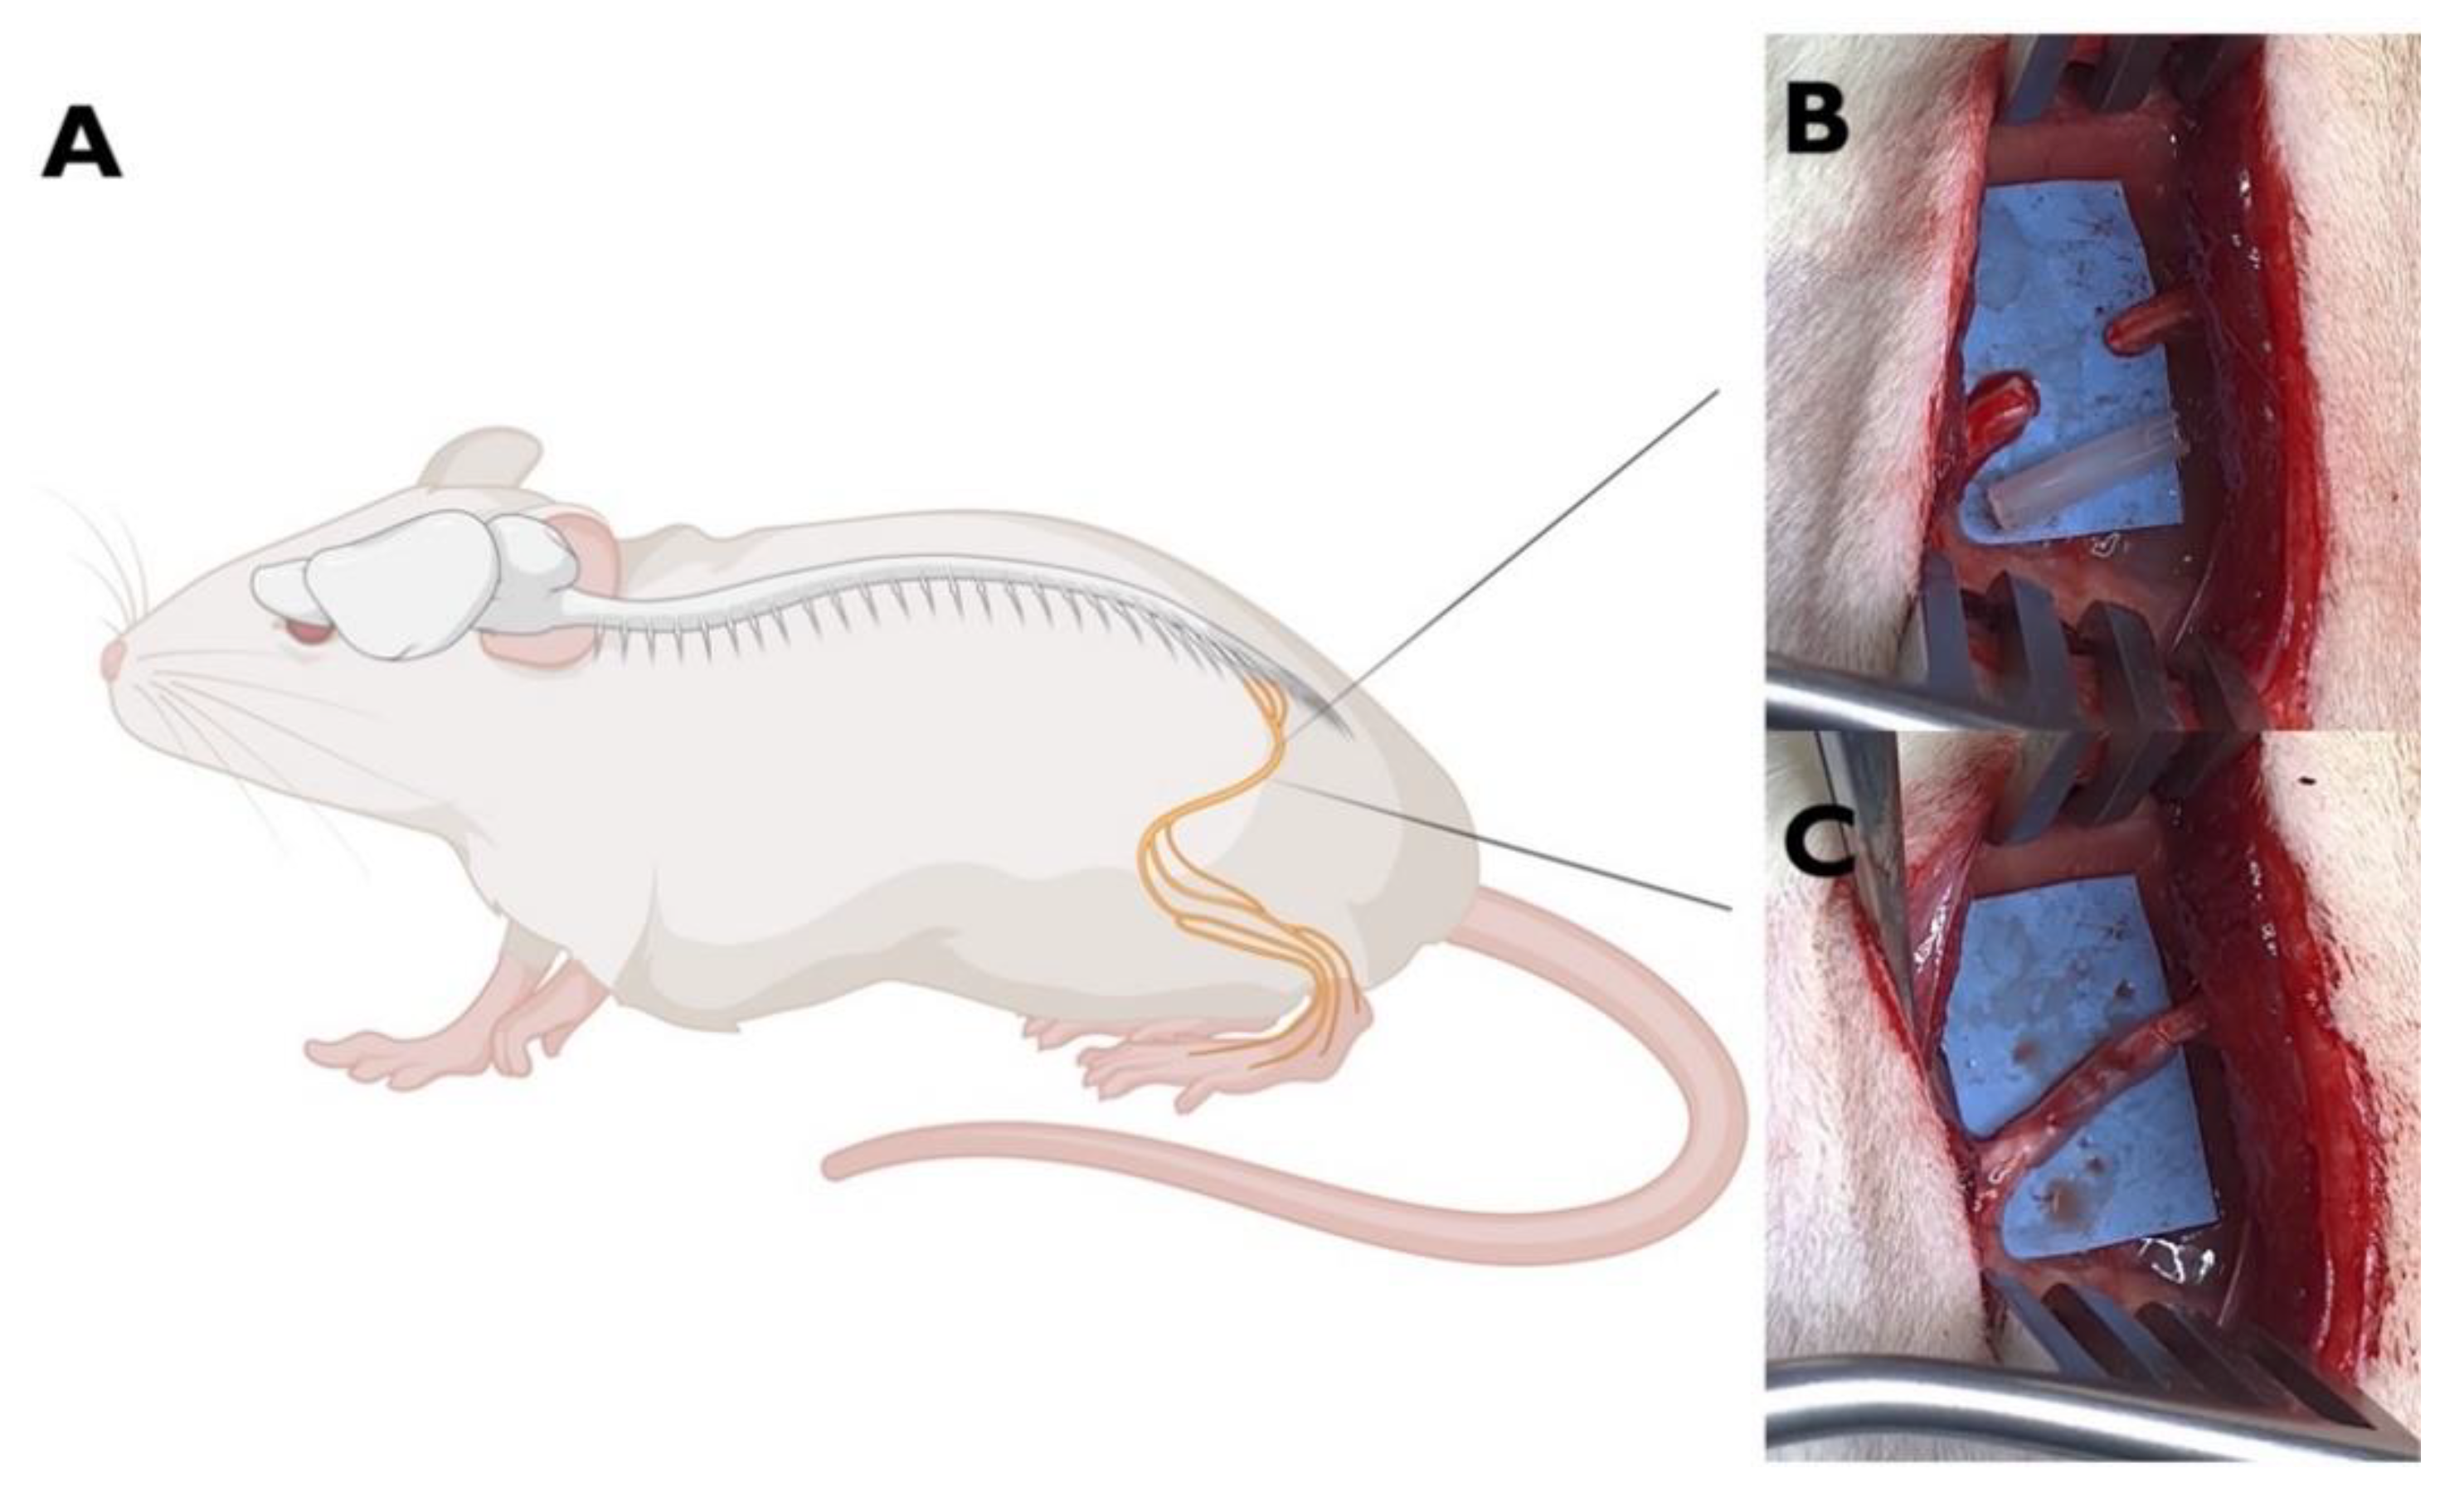
For the experimental group, following the induction of anesthesia with a gas mixture of isoflurane and oxygen, the left thigh of each rat was shaved and disinfected. After that, a gluteal-splitting incision was performed to expose the sciatic nerve, which was then transacted to create a 5 mm gap between the proximal and distal nerve ends. Thus, a OxPVA-based conduit (10 mm in length) was coaxially interposed between the nerve stumps and sutured to the epineurium with 8-0 nylon stitches to bridge the severed nerve (
Figure 8). The surgical site was subsequently closed in a layered fashion using 4-0 silk sutures to ensure proper healing. Following surgery, the rats were allowed to recover in their cages, and housed within a temperature-regulated facility; comprehensive post-operative care was administered, including anti-inflammatory and antibiotic treatments (Rimadil, 5 mg/kg and Bytril, 5 mg/kg, respectively for a duration of 5 days. The animals were provided with a standard laboratory rodent diet and had unrestricted access to water. The animals’ well-being was consistently monitored, encompassing assessments of their typical activities, uninterrupted feeding routines with no weight loss (the weight of each rat at week1, 3 and 6 are reported in Supplementary Material S2), and the absence of any signs of wound infection or illness.
Animal surgery and husbandry were performed following the Italian guidelines on the use of experimental animals and approved by the Ethical Committee of the University of Padua and by the Italian Department of Health (Authorization n. 837/2019-PR, December 09, 2019).
4.2. Behavioural Tests of Motor Function
4.2.1. Sciatic Functional Index
Six weeks post-surgery and prior to euthanasia, the motor function of the injured sciatic nerve was evaluated by using sciatic functional index (SFI). In accordance with the procedure described previously [
28,
45,
46], in the experimental group all the rats’ hindfeet were stained with black ink, after which the footprints were captured as they walked on a corridor lined with white paper. The SFI score was calculated based on the formula established by Bain et al. [
27]. The following measurements were gained from the footprints. PL: Print Length measures the distance from the heel to the tip of the third toe. TS: Toe Spread measures the distance from the first to the fifth toe. IT: Intermediary Toe Spread measures the distance between the second and fourth toes. EPL, ETS, and EIT represent the PL, TS, and IT measurement from the sciatic nerve injury (experimental) side. NPL, NTS, and NIT represent the PL, TS, and IT of the non-operated side respectively. A score near 0 indicates normal sciatic nerve function, while a score approaching -100 indicates complete motor dysfunction of the sciatic nerve.
4.2.2. Gait Analysis
After footprint recording, each rat of experimental group was guided along a 50 cm long and 10 cm wide transparent plexiglass lane, with one end darkened, under which a mirror was positioned at a 45-degree angle. This allowed for the concurrent observation of the lateral profile of the rat throughout the gait cycle. The gait of each rat was recorded for analysis. The evaluated parameters included toe spread; plantar walking; normal swing phase; smooth walking, absence of paw dragging, inversion and eversion; step alternation; hindfoot remaining in the body perimeter and joint contraction [
47]. Each parameter was scored on a scale: 0 for non-assessable, 1 for assessable but abnormal, and 2 for normal. A mean score for each rat was calculated (maximum 2.0) and then the mean score of the experimental group was calculated.
4.3. Sample Collection
Six weeks post-surgery, after the behavioural tests described as above, all the animals were compassionately euthanised under carbon dioxide asphyxiation. Subsequently, the Samples (approximately 1x1.5 cm) of muscle (gastrocnemius muscle) and TLF were excised from the left (sciatic nerve injury) and right (contralateral) sides of the rats in experimental group. The gastrocnemius muscle and TLF samples were also collected from the right side of the healthy rats in control group. Each sample was divided into two pieces: one was preserved at -80°C until the HA and collagen assay, the other was fixed in 10% formalin for subsequent histological/immunohistochemical analysis.
4.4. Quantification of Hyaluronan
The Purple-Jelley HA assay (Biocolor Ltd.) was employed to determine the concentration of HA in skeletal muscle or fascia of rats. As previously described [
22,
48,
49], 150 mg ± 50 mg of wet tissue (defrosted from -80°C) were weighted and cut into small fragments using a surgical scalpel and transferred into 2.0 mL microcentrifuge tubes. Subsequently, samples were subjected to digestion in 400 μl of TRIS-HCl (50 mM, pH 7.6) with the addition of Proteinase K (Sigma) overnight at 55°C to ensure complete enzymatic digestion. After centrifugation at 13,000 g for 10 minutes, the supernatants were carefully transferred into new microcentrifuge tubes and mixed with 1.0 mL of a GAG precipitation reagent. After 15 minutes, another round of centrifugation at 13,000 g for 10 minutes was performed to obtain the resulting residues. These residues were then dispersed in water and mixed with NaCl and cetylpyridinium chloride (CPC). After repeating the aforementioned steps and successfully recovering the total GAG content, HA isolation was performed by adding 500 μl of 98% ethanol to the samples, followed by centrifugation and full hydration in 100 μl of water. For the subsequent colorimetric analysis, 200 μl of a purple dye reagent was added to 20 μl aliquots of the test samples, standards, or reagent blanks. The absorbance value at 650 nm was measured using the Wallac Victor3 1420 Multilabel Counter (Perkin Elmer, Finland) in 96-microwell plates. To determine the concentration of HA in the samples, the absorbance values of the standard curve created with the HA standard (200 μg/ml) were converted into micrograms of HA contained in the total volume of 100 μl. After calculating the micrograms of HA extracted from the starting tissue samples, the average micrograms of HA per gram of wet tissue were determined for each sample (at least two measurements ± standard deviation for each sample).
4.5. Quantification of Collagen
The Total Collagen Assay Kit (Perchlorate-Free, Abcam Ltd.) was employed to determine the concentration of collagen in the gastrocnemius muscle and TLF of the rats. Briefly, 60-100 mg of wet tissue (defrosted from -80°C) were weighted, cut in small fragments using a surgical scalpel, and homogenized in distilled water (100 µl for every 10 mg of starting tissue). For each sample, 100 µl of homogenate were added to 100 μl of 10N NaOH, at 120°C for 1 hour to facilitate collagen extraction. Following cooling the vial on ice, and neutralisation by adding 100 µl of 10N HCl, the samples were centrifuged at 10000g for 5 minutes. 10 µl of the centrifuged solution was transferred into a 96-well plate, placed in an oven at 65°C and evaporated for 10-20 minutes until white crystals formed. To each well, 100 µl of oxidising reagent (6 µl Chloramine T mixed + 94 µl oxidation buffer) was added and incubated at room temperature for 20 minutes. For the development of the colorimetric reaction, 50 µl of developer solution was added to each well at 37°C for 5 minutes, and subsequently, 50 µl of concentrated Dimethylaminobenzaldehyde (DMAB) was added, mixed thoroughly, and incubated on a plate heater at 65°C for 45 minutes. Following incubation, absorbance was measured at 570 nm utilising the Wallac Victor3 1420 Multilabel Counter (Perkin Elmer, Finland), with data compared against a standard curve generated from Collagen I standard solution (from 0 to 18μg/ml), to obtain the micrograms of collagen per milligram of tissue. For each sample at least two measurements were performed to obtain mean values ± standard deviation.
4.6. Histological Analysis
Fixed samples (gastrocnemius muscle and TLF) were dehydrated in graded ethanol, in xylene, and then embedded in paraffin. 5 µm slices were cut by microtome, then dewaxed and hydrated before to proceed with Picrosirius Red staining, Alcian Blue staining, and immunohistochemistry.
Picrosirius Red staining: After deparaffination and rehydration, tissue sections were stained with Picrosirius Red solution for 13 minutes to selectively highlight collagen fibres. Subsequently, the sections were briefly rinsed in 0.01M hydrochloric acid (HCl) for 20 seconds, then washed in deionised water quickly. After dehydrated through an ascending alcohol series, cleared in xylene, the samples were finally mounted by Eukitt (Agar Scientific).
Alcian Blue staining: Alcian Blue solution was used to stain acidic polysaccharides such as glycosaminoglycans (GAGs), according the principle described by Scott and Dorling [
50]. Dewaxed sections were incubated for 1 hr in sodium acetate buffer pH 5.8 and MgCl
2 0.05 M and then stained for 2h with 0.05% Alcian Blue in MgCl
2 0.05M. Samples were then washed in 0.01 N HCl for 10 min and in distilled water [
49]. The dehydrated samples were finally mounted by Eukitt (Agar Scientific).
Immunohistochemistry: Sections were treated with 0.5% H2O2 for 15 minutes to block endogenous peroxidases. After washings, the specimens were incubated for 1 h in 0.2% blocking solution (PBS + 0.2% Bovine Serum Albumin -BSA) and then incubated overnight at 4° C with anti-HABP (Hyaluronic Acid Binding Protein, dilution 1:1000, Millipore Sigma-Aldrich, MI, Italy). After washings in PBS, the samples were incubated in HRP-conjugated Streptavidin (Jackson ImmunoResearch, Cambridgeshire, UK, dilution 1:250) for 30 min, and then washed 3 times in PBS. The reaction was developed with 3,3′-diaminobenzidine (Liquid DAB + Substrate Chromogen System kit Dako, CA, USA) and stopped with distilled water. Slides were then dehydrated and mounted using Eukitt (Agar Scientific).
4.7. Image Analysis
All the images were acquired by Leica DMR microscope (Leica Microsystems, Wetzlar, Germany).
For measuring the area percentage of collagen content (area %) of the gastrocnemius muscle, for each sample at least twenty images from two different tissue sections were taken at a 10x magnification after Picrosirius Red staining. Then the images were analysed by ImageJ software [
51], freely available at http:// rsb.info.nih.gov/ij/ (accessed on 19 Feb 2024). The field area containing epimysium, perimysium, and endomysium were used to estimate the collagen level, normalized for the total area (the detailed procedure are described in Supplementary Material S3).
4.8. Statistical Analysis
Statistical analyses were performed by using IBM SPSS statistical software (version 25, SPSS, Chicago, Illinois, USA) and the significance level was set at 0.05. HA and collagen content in muscle and TLF sections were reported as mean ± standard deviations (M ± SD). Paired t-test is applied to compare the difference between left (sciatic nerve injury) and right (contralateral) side. Independent t-test is applied to compare the results of the left (sciatic nerve injury) side and control (healthy rats), as well as right (contralateral) side and control.
Author Contributions
X.Z.: Writing – original draft, Writing – review & editing, Conceptualization, Formal Analysis, Investigation, Methodology; C.F.(Caterina Fede): Writing – review & editing, Conceptualization, Formal Analysis, Investigation, Methodology; L.P.: Writing – review & editing, Formal Analysis, Investigation, Methodology; C.P.: Writing – review & editing, Formal Analysis, Methodology; E.S.: Writing – review & editing, Methodology, Project administration; C.F. (Chenglei Fan): Writing – review & editing, Methodology; A.P.: Writing – review & editing, Methodology, Project administration; R.D.C.: Writing – review & editing, Supervision, Conceptualization; S.M.: Writing – review & editing, Supervision, Conceptualization; C.S.*: Writing –review & editing, Project administration, Conceptualization.
Figure 1.
HA distribution in IMCT of the gastrocnemius muscle. A-C: Anti-HABP (Hyaluronic Acid Binding Protein); D-F: 0.05% Alcian Blue in MgCl2 0.05M; A,D=Left (sciatic nerve injury) side; B,E=Right (contralateral) side; C,F=Control (healthy rats); *=IMCT; m=muscle. Scale Bars: 150 µm.
Figure 1.
HA distribution in IMCT of the gastrocnemius muscle. A-C: Anti-HABP (Hyaluronic Acid Binding Protein); D-F: 0.05% Alcian Blue in MgCl2 0.05M; A,D=Left (sciatic nerve injury) side; B,E=Right (contralateral) side; C,F=Control (healthy rats); *=IMCT; m=muscle. Scale Bars: 150 µm.
Figure 2.
HA distribution in the TLF. A-C: Anti-HABP (Hyaluronic Acid Binding Protein); D-F: 0.05% Alcian Blue in MgCl2 0.05M; A,D=Left (sciatic nerve injury) side; B,E=Right (contralateral) side; C,F=Control (healthy rats); *=TLF; a=adipocytes. Scale Bars: 150 µm.
Figure 2.
HA distribution in the TLF. A-C: Anti-HABP (Hyaluronic Acid Binding Protein); D-F: 0.05% Alcian Blue in MgCl2 0.05M; A,D=Left (sciatic nerve injury) side; B,E=Right (contralateral) side; C,F=Control (healthy rats); *=TLF; a=adipocytes. Scale Bars: 150 µm.
Figure 3.
Picrossirius Red Staining of the gastrocnemius muscle. A,D=Left (sciatic nerve injury) side; B,E= Right (contralateral) side; C,F= Control-healthy rats.*=IMCT; m=muscle; e=endomysium; p=perimysium. Scale Bars: A-C:150µm; D-F: 50µm. Collagen is in red, the muscle fibres of the gastrocnemius muscle in yellow.
Figure 4.
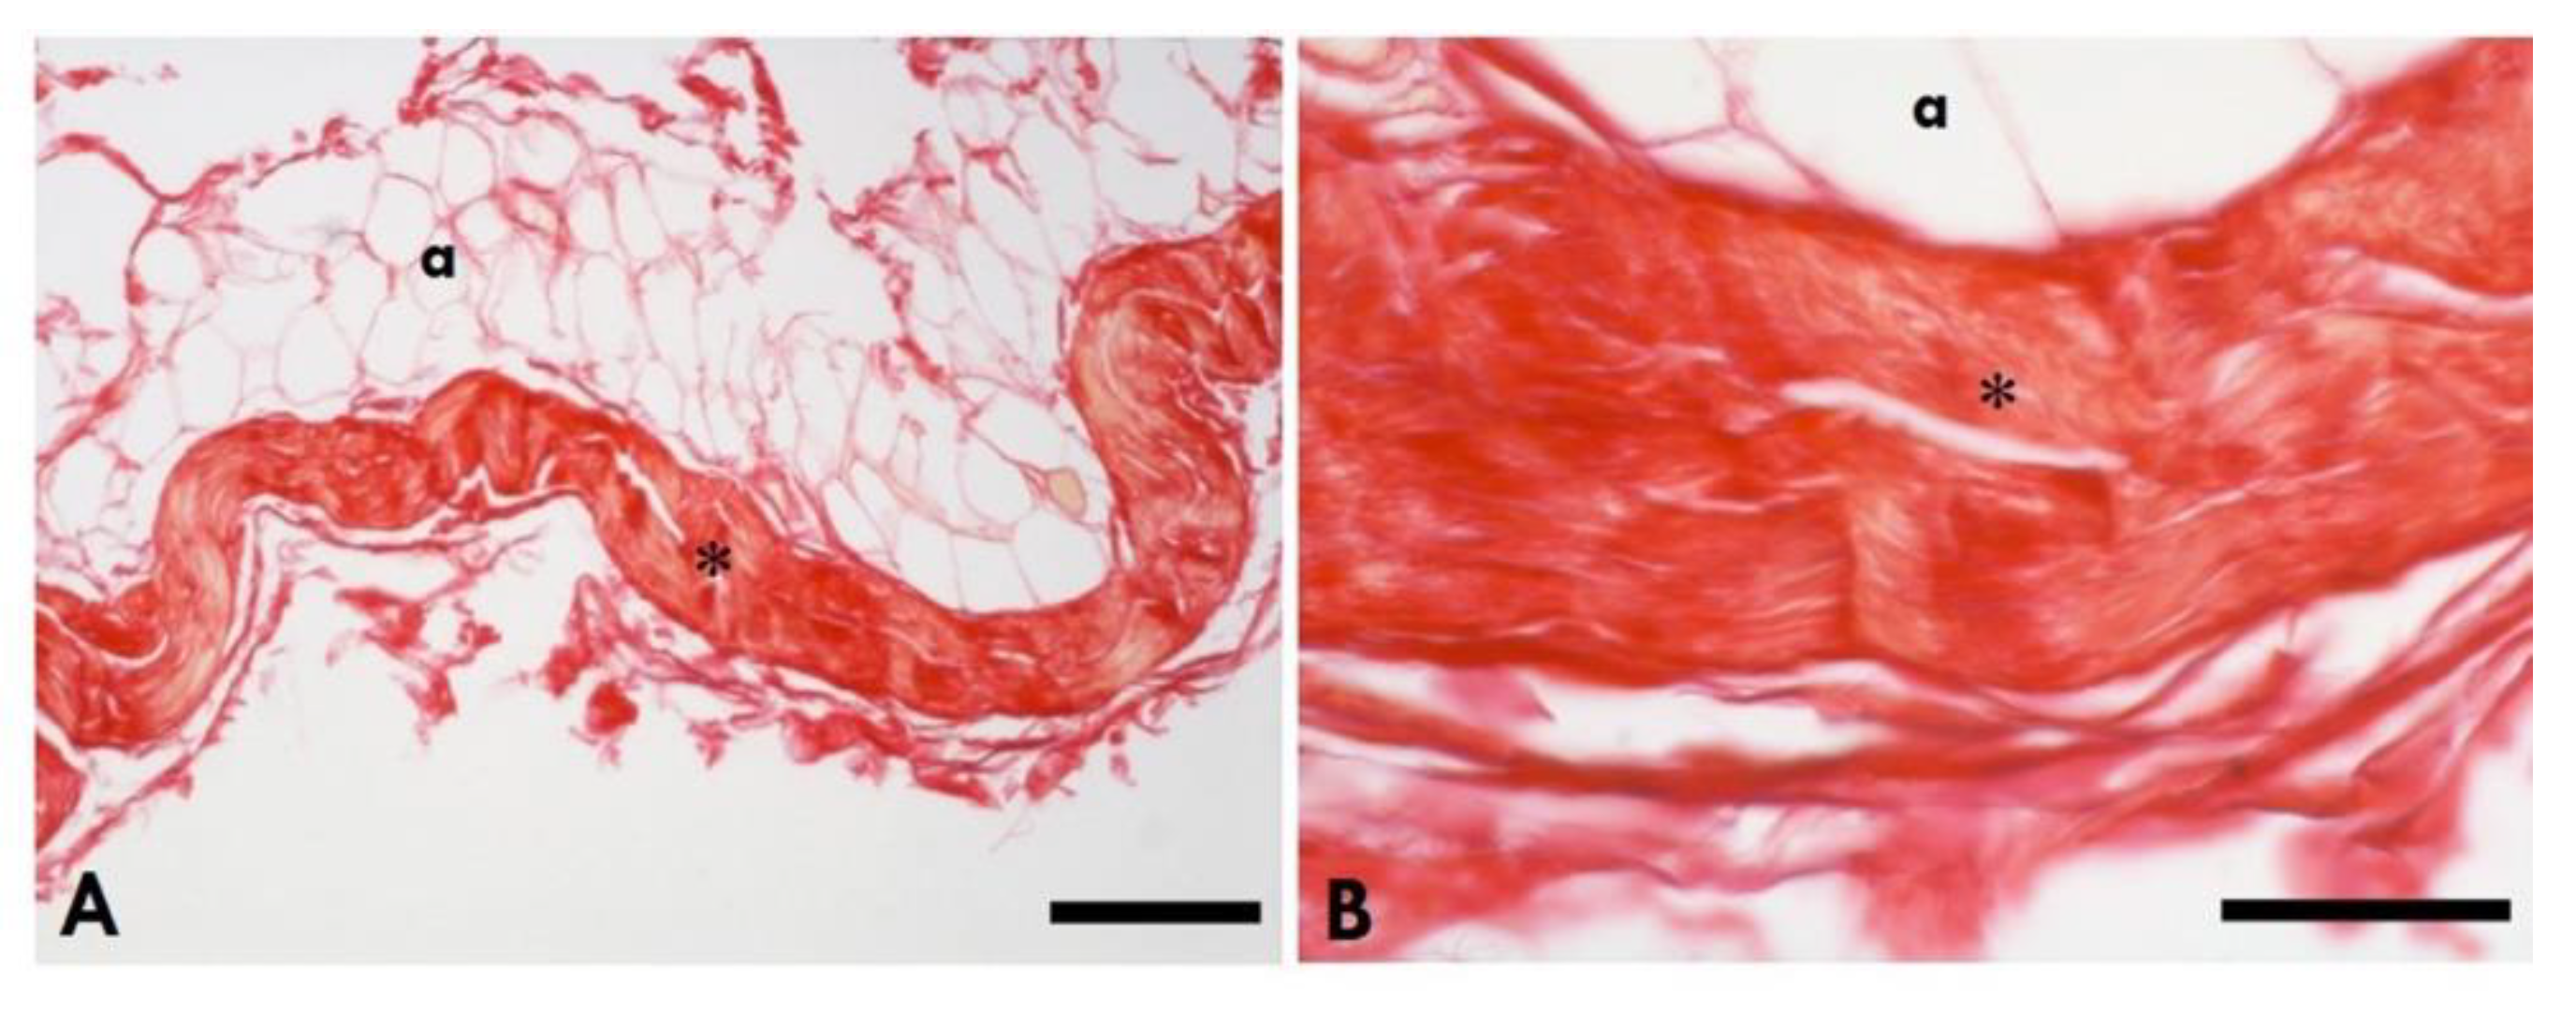
Picrosirius Red staining of the healthy TLF. A: Scale Bars 150µm; B: Scale Bars 50µm; *=Thoracolumbar fascia; a= adipocytes.
Figure 4.
Picrosirius Red staining of the healthy TLF. A: Scale Bars 150µm; B: Scale Bars 50µm; *=Thoracolumbar fascia; a= adipocytes.
Figure 5.
A: The HA concentration in the gastrocnemius muscle on the left (sciatica nerve injury) side and right (contralateral) side of the left sciatic nerve injury rats, and of the healthy rats (*p<0.05, **p<0.01); B: The HA concentration in the TLF of the left (sciatica nerve injury) side and right (contralateral) side of the left sciatica nerve injury rats, and of the healthy rats (**p<0.01, ***p<0.001).
Figure 6.
A: The collagen concentration in the gastrocnemius muscle of the left (sciatic nerve injury) side and the right (contralateral) side of the left sciatic nerve injury rats, and of the healthy rats (*p<0.05, **p<0.01); B: The HA concentration in the TLF of the left (sciatic nerve injury) side and the right (contralateral) side of the left sciatica nerve injury rats, and of the healthy rats (*p<0.05, ***p<0.001).
Figure 7.
The area percentage of collagen content in the gastrocnemius muscle of the left (sciatica nerve injury) side and the right (contralateral) side of the left sciatic nerve injury rats, and of the healthy rats in the control group (*p<0.05, **p<0.01, ***p<0.001).
Figure 7.
The area percentage of collagen content in the gastrocnemius muscle of the left (sciatica nerve injury) side and the right (contralateral) side of the left sciatic nerve injury rats, and of the healthy rats in the control group (*p<0.05, **p<0.01, ***p<0.001).
Figure 8.
Animal model of PNI. A. Left sciatic nerve of the rat (Created with BioRender.co) B. nerve exposure and gap (5mm) creation; C. nerve repaired by interposition of a OxPVA-based nerve conduit (10 mm) between the proximal and the distal stump.
Figure 8.
Animal model of PNI. A. Left sciatic nerve of the rat (Created with BioRender.co) B. nerve exposure and gap (5mm) creation; C. nerve repaired by interposition of a OxPVA-based nerve conduit (10 mm) between the proximal and the distal stump.
Table 1.
HA and Collagen concentration and Collagen area% in IMCT of the muscle and TLF.
Table 1.
HA and Collagen concentration and Collagen area% in IMCT of the muscle and TLF.
| Variable |
L (n=12) |
R (n=12) |
Ctrl (n=6) |
p-value
L vs. R |
p-value
L vs. Ctrl |
p-value
R vs. Ctrl |
| µg HA/g muscle |
81.19 ± 30.33 |
86.77 ± 31.96 |
127.57 ± 24.90 |
0.473 |
0.005** |
0.015* |
| µg HA/g TLF |
66.95 ± 20.08 |
112.66 ± 30.53 |
167.18 ± 31.13 |
0.000*** |
0.000*** |
0.003** |
| µg Col/g muscle |
32.92±11.34 |
20.54 ± 7.03 |
12.74 ± 4.83 |
0.001** |
0.001** |
0.035* |
| µg Col/g TLF |
115.89 ± 28.18 |
90.43 ± 20.83 |
47.51 ± 7.82 |
0.016* |
0.000*** |
0.000*** |
| Col area% muscle |
28.01 ± 5.78 |
17.33 ± 6.52% |
5.30 ± 0.82 % |
0.004** |
0.000*** |
0.011* |
