Preprint
Article

Technoeconomic Assessment of Phosphoric Acid and Rare-Earths Recovery from Phosphoric Acid Sludge

Altmetrics

Downloads

97

Views

47

Comments

0

A peer-reviewed article of this preprint also exists.

Submitted:

03 July 2024

Posted:

04 July 2024

You are already at the latest version

Alerts
Abstract
A decanter centrifuge has been employed to successfully separated phosphoric acid and rare-earth-element (REE)-containing particles from phosphoric acid sludge with concentrations ranging from 1,000 to 2,200 ppm REEs. Operating efficiently with up to 35 wt.% solids, the centrifuge was demonstrated to achieve approximately 95% phosphoric acid recovery and 90% REEs recovery in a single pass, eliminating the need for additional processing steps. This breakthrough supports a proposed REEs oxide recovery process integrating phosphoric acid (PA), elemental phosphorus (P4), and REEs into two potential pathways: PA-REO and PA-P4-REO. These processes aim to reintroduce recovered phosphoric acid into the main product to significantly increase output and revenue. Post-separation, phosphorus-rich particles can be converted to P4, while REEs-containing solids undergo further treatment including acid leaching, extraction/stripping, precipitation, and calcination to produce a marketable rare-earth oxide (REO) material. Techno-economic analysis indicates promising profitability, with the PA-REO process showing a delta net present value (∆NPV) of $441.8 million and an expected return within a year of construction, while the PA-P4-REO process yields a ∆NPV of $178.7 million over a 12-year return period. Both pathways offer robust financial prospects and demonstrate the feasibility of commercial-scale REEs recovery from phosphoric acid sludge.
Keywords: 
Subject: Chemistry and Materials Science  -   Chemical Engineering

1. Introduction

Rare earth elements (REEs) are essential materials for the power, manufacturing, chemical, metallurgical, alloys, electronic appliances, glass, catalysts manufacturing, and other industries [1]. However, the availability of natural resources for REEs is limited to a few countries including China, the United States, Myanmar, and Australia. With 85% of the global supply, China is emerging as the major producer of REEs [2]. Recognizing the critical importance of REEs for the energy and manufacturing industries, the U.S. Department of Energy (DOE) established the Critical Materials Institute (CMI) to address challenges related to reserves, supply, and recycling of REEs and other critical materials including lithium, aluminum, platinum, graphite, cobalt, copper, fluorine, iridium, magnesium, nickel, and silicon [3]. Securing REEs has become crucial to meet current and future industrial demands as well as to maintain national security. One possible resource for the recovery of REEs is the phosphate industry, which includes several streams of high REEs concentration and offers the potential for simplified recovery processing and the opportunity to recycle phosphoric acid (PA) for enhanced fertilizer production [4,5]. It is well known that the phosphate rock, specifically fluorapatite [Ca10(PO4)6F2], contains rare earth elements (REEs) at a concentration ranging from 100 to 1000 ppm [6]. In 2018, PA production and elemental phosphorus production reached 27 million tons, valued at $1.8 billion [7]. During the mining/beneficiation process in Florida, for example, approximately 30% of the REEs in phosphate ore reports to waste clay, 10% to flotation tailings, and 60% to the phosphate rock product. In the PA manufacturing process [Figure 1], approximately 70% of the REEs in the phosphate rock reports to phosphogypsum (PG) and 30% to PA.
PA production generates a byproduct called phosphoric acid sludge or evaporation sludge, which contains PA and significant amounts of total REEs at a concentration ranging between 1,500 and 3,000 ppm. According to Mosaic, a major phosphate production company in the USA, their Florida operations generate about 450,000 tons of sludge solids per year. If an efficient method could separate the solids from the sludge, recover PA (~54% P2O5 [8]), and subsequently extract REEs from the separated solids, the phosphate industry could become a major supplier of REEs. Traditional solid/liquid separation technologies, however, such as centrifugation, decantation, settling, and filtration are ineffective due to the sludge high viscosity, high density, and high solids content (e.g., 20–40%). Recently, we employed a continuous-flow decanter centrifuge (CFDC) for solid/liquid separation of PA and REEs-containing solids from real phosphoric acid sludge [5]. The CFDC offers the potential for a single-step separation without the need for pre- or post-processing steps. Using the CFDC, we demonstrated continuous-flow separation of PA and REEs-containing particles from phosphoric acid sludge in our effort to develop a profitable process for REEs recovery from the PA industry. The decanter centrifuge has shown effectiveness in separating solid particles from phosphoric acid sludge containing up to 33.5 wt.% solids without additional processing steps and helped us achieve simultaneous recovery of liquid PA at approximately 93% efficiency and REEs-containing solids at approximately 90% efficiency after a single pass in a continuous mode operation.
Numerous research efforts have been conducted to recover REEs from various industrial byproducts and waste streams, including used catalyst, e-waste, PG, acid mine drainage, geothermal brine water, coal ash and phosphoric acid sludge. However, exploration of the economic feasibility of the proposed technologies for producing rare earth oxide as the final product is limited, as shown in Table 1. The proposed technoeconomic analysis (TEA) shows that the operating cost of REE recovery ($/kg) remains high compared to the value of REE particles. To achieve economic viability, process improvement and co-production of other valuable materials are required.
In this study, we conducted a long-term CFDC process to separate solid particles from phosphoric acid sludge. Based on experimental results, we present a TEA evaluating the potential benefits of the CFDC process for PA and REEs recovery from phosphoric acid sludge. The recovered PA can be returned to the mainstream, increasing PA production, which will significantly increase the revenue, while solid particles containing REEs can be further processed to produce a commercial-grade rare-earth oxide (REO) material. The remaining solids still require extensive treatment such as acid leaching, extraction-stripping, precipitation, and calcination, to produce the REO product. Based on a rigorous literature review, we validated the feasible technologies for each process and proposed two post-treatment scenarios for final products: 1) phosphoric acid and mixed REO and 2) phosphoric acid, elemental phosphorus (P4), and REO. For the TEA, mass and energy balances are used to estimate both the operating and capital costs of the processing plant, as well as the levelized value of the REEs product. By exploring this innovative approach, we aim to contribute to the development of efficient and economically viable processes for the recovery of REEs from phosphoric acid sludge, thereby addressing the critical need of securing a supply of REEs for current and future industrial demands in the U.S. and worldwide.

2. Materials and Method

2.1. Solid/Liquid Separation

A real phosphoric acid sludge was provided by the Mosaic Company (Florida, USA). Based on the range of solids fraction of the sludge observed in real operations [4,5], the solids concentration in the feed sludge was adjusted between 25 and 35 wt.%, for the experiments of this study, by mixing corresponding portions of the light and heavy sludge fractions. Solid/liquid separation tests were carried out using a Lemitec MD 60 (Berlin, Germany) CFDC having a 60-mm internal bowl diameter. A continuous-flow system was set up using the CFDC to carry out a set of solid/liquid separation experiments using phosphoric acid sludge. The input feed solution was constantly mixed using a mixer at 100 rotations per minute (rpm). The CFDC operation was adjusted at various rotational speeds yielding an acceleration of 1000–1500 G to map its operational stability and performance and seek a high recovery efficiency for the concentrated sludge. An acceleration of 1000-G achieved at a rotational speed of 5460 rpm was selected to evaluate other operating parameters, such as feed flowrate and differential speed of the rotor. The solid/liquid recovery was quantified through the following relationships:
S o l i d s   R e c o v e r y ( % ) = S o l i d s   i n   d i s c h a r g e   o u t l e t S o l i d s   a m o u n t   i n   f e e d   ( 1 k g   b a s e ) × 100
L i q u i d   R e c o v e r y ( % ) = L i q u i d   i n   l i q u i d   o u t l e t L i q u i d   a m o u n t   i n   f e e d   ( 1 k g   b a s e ) × 100

2.2. Technoeconomic Analysis

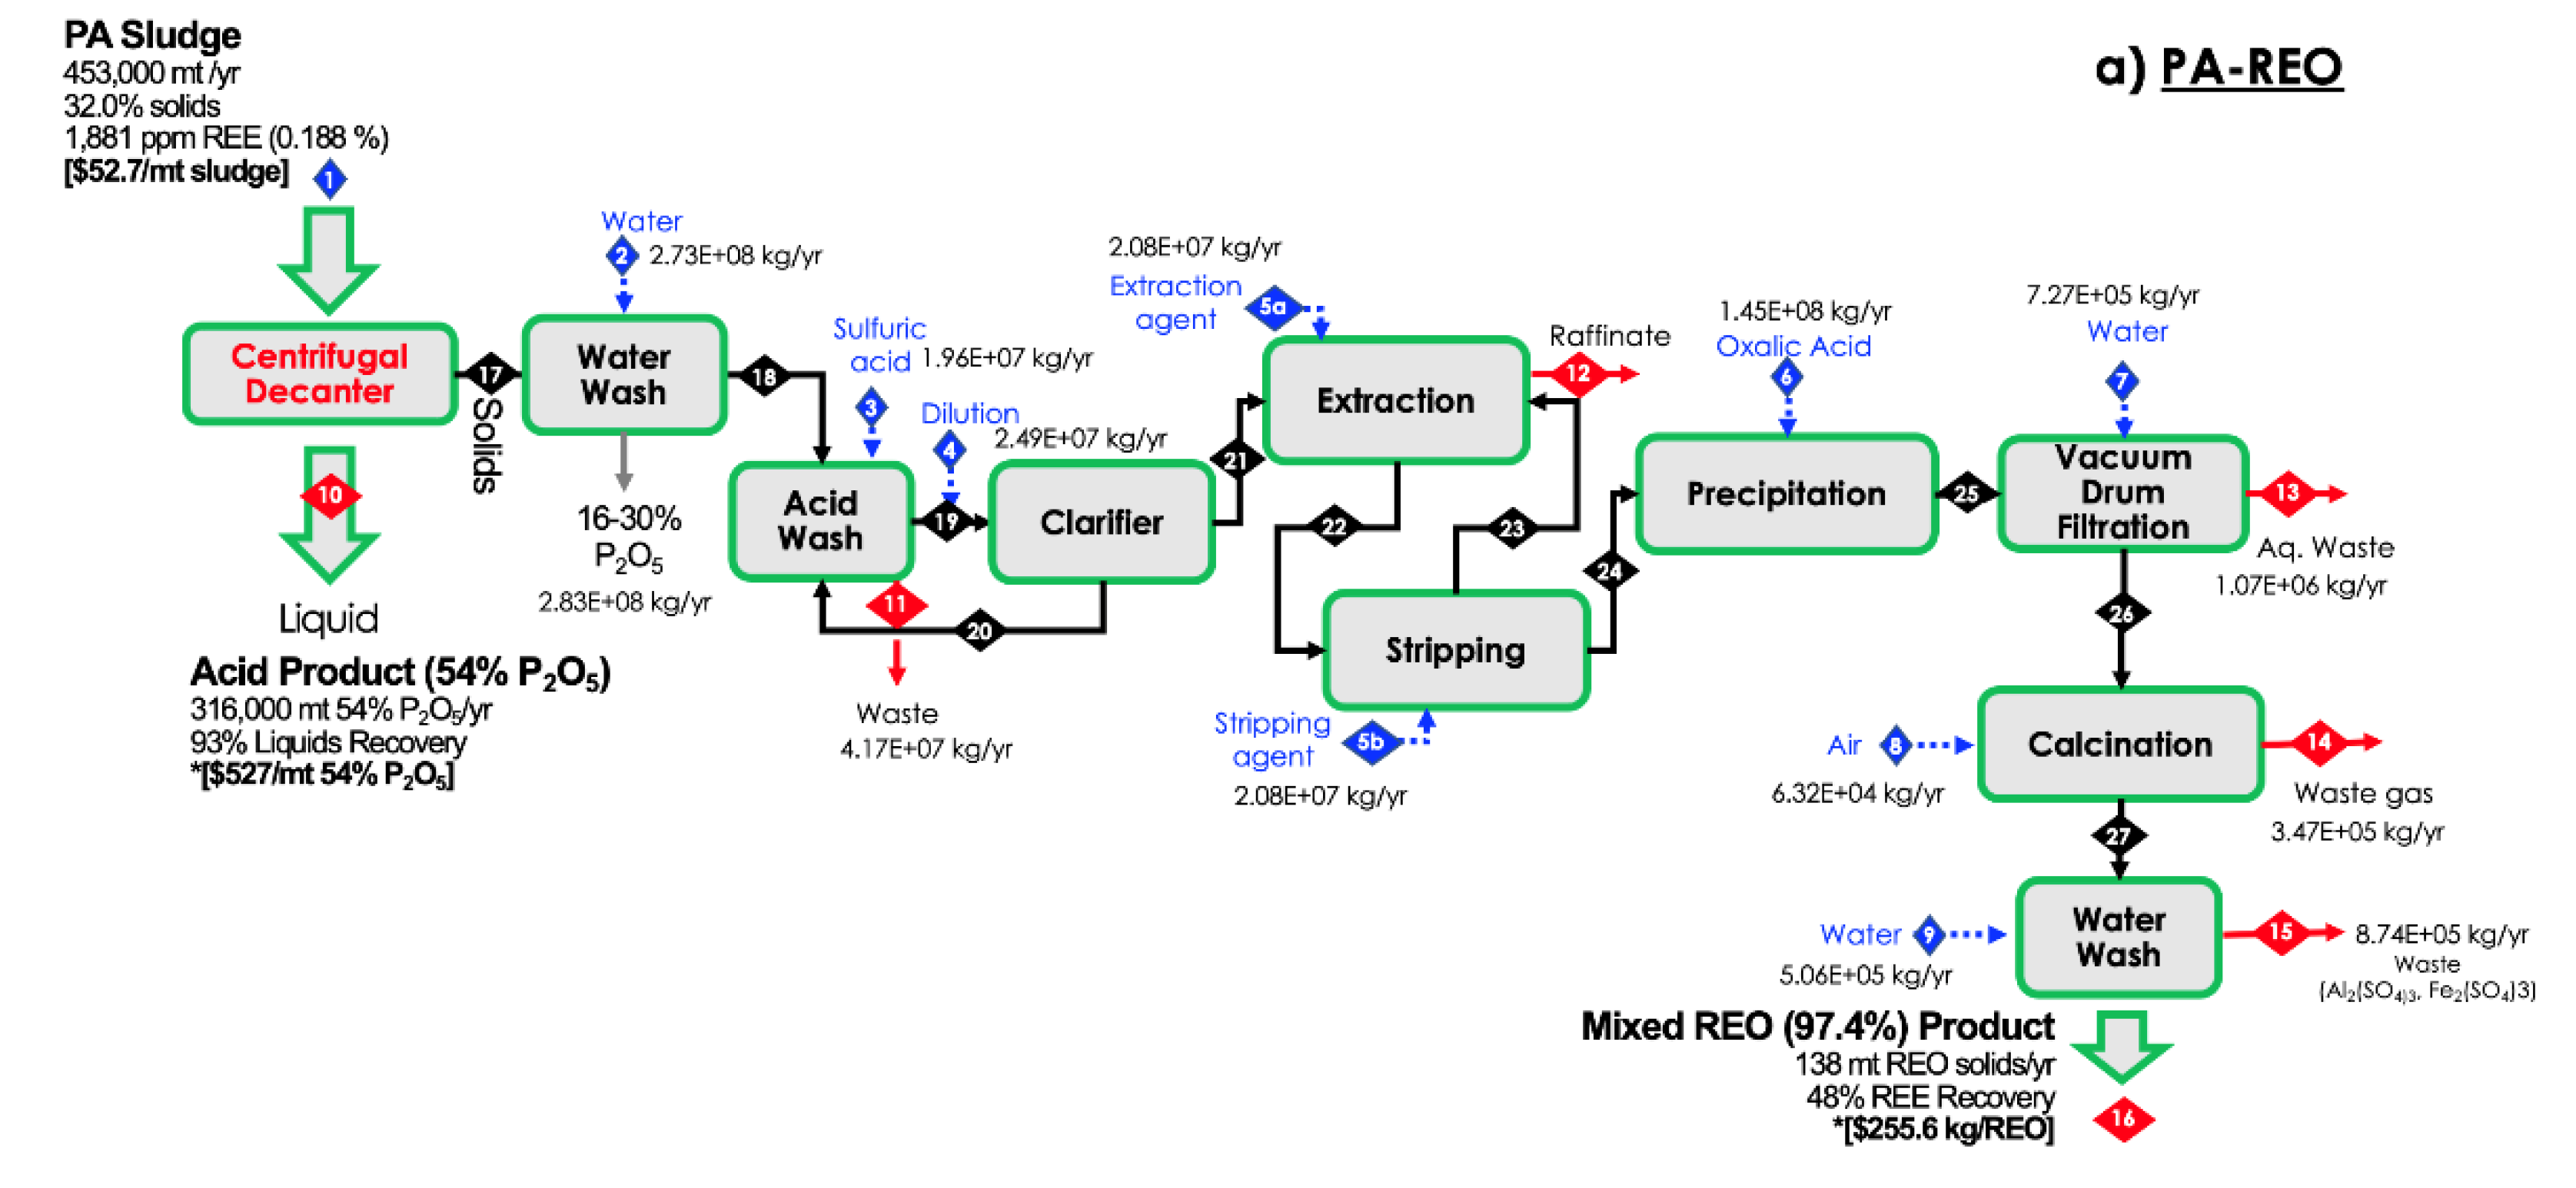
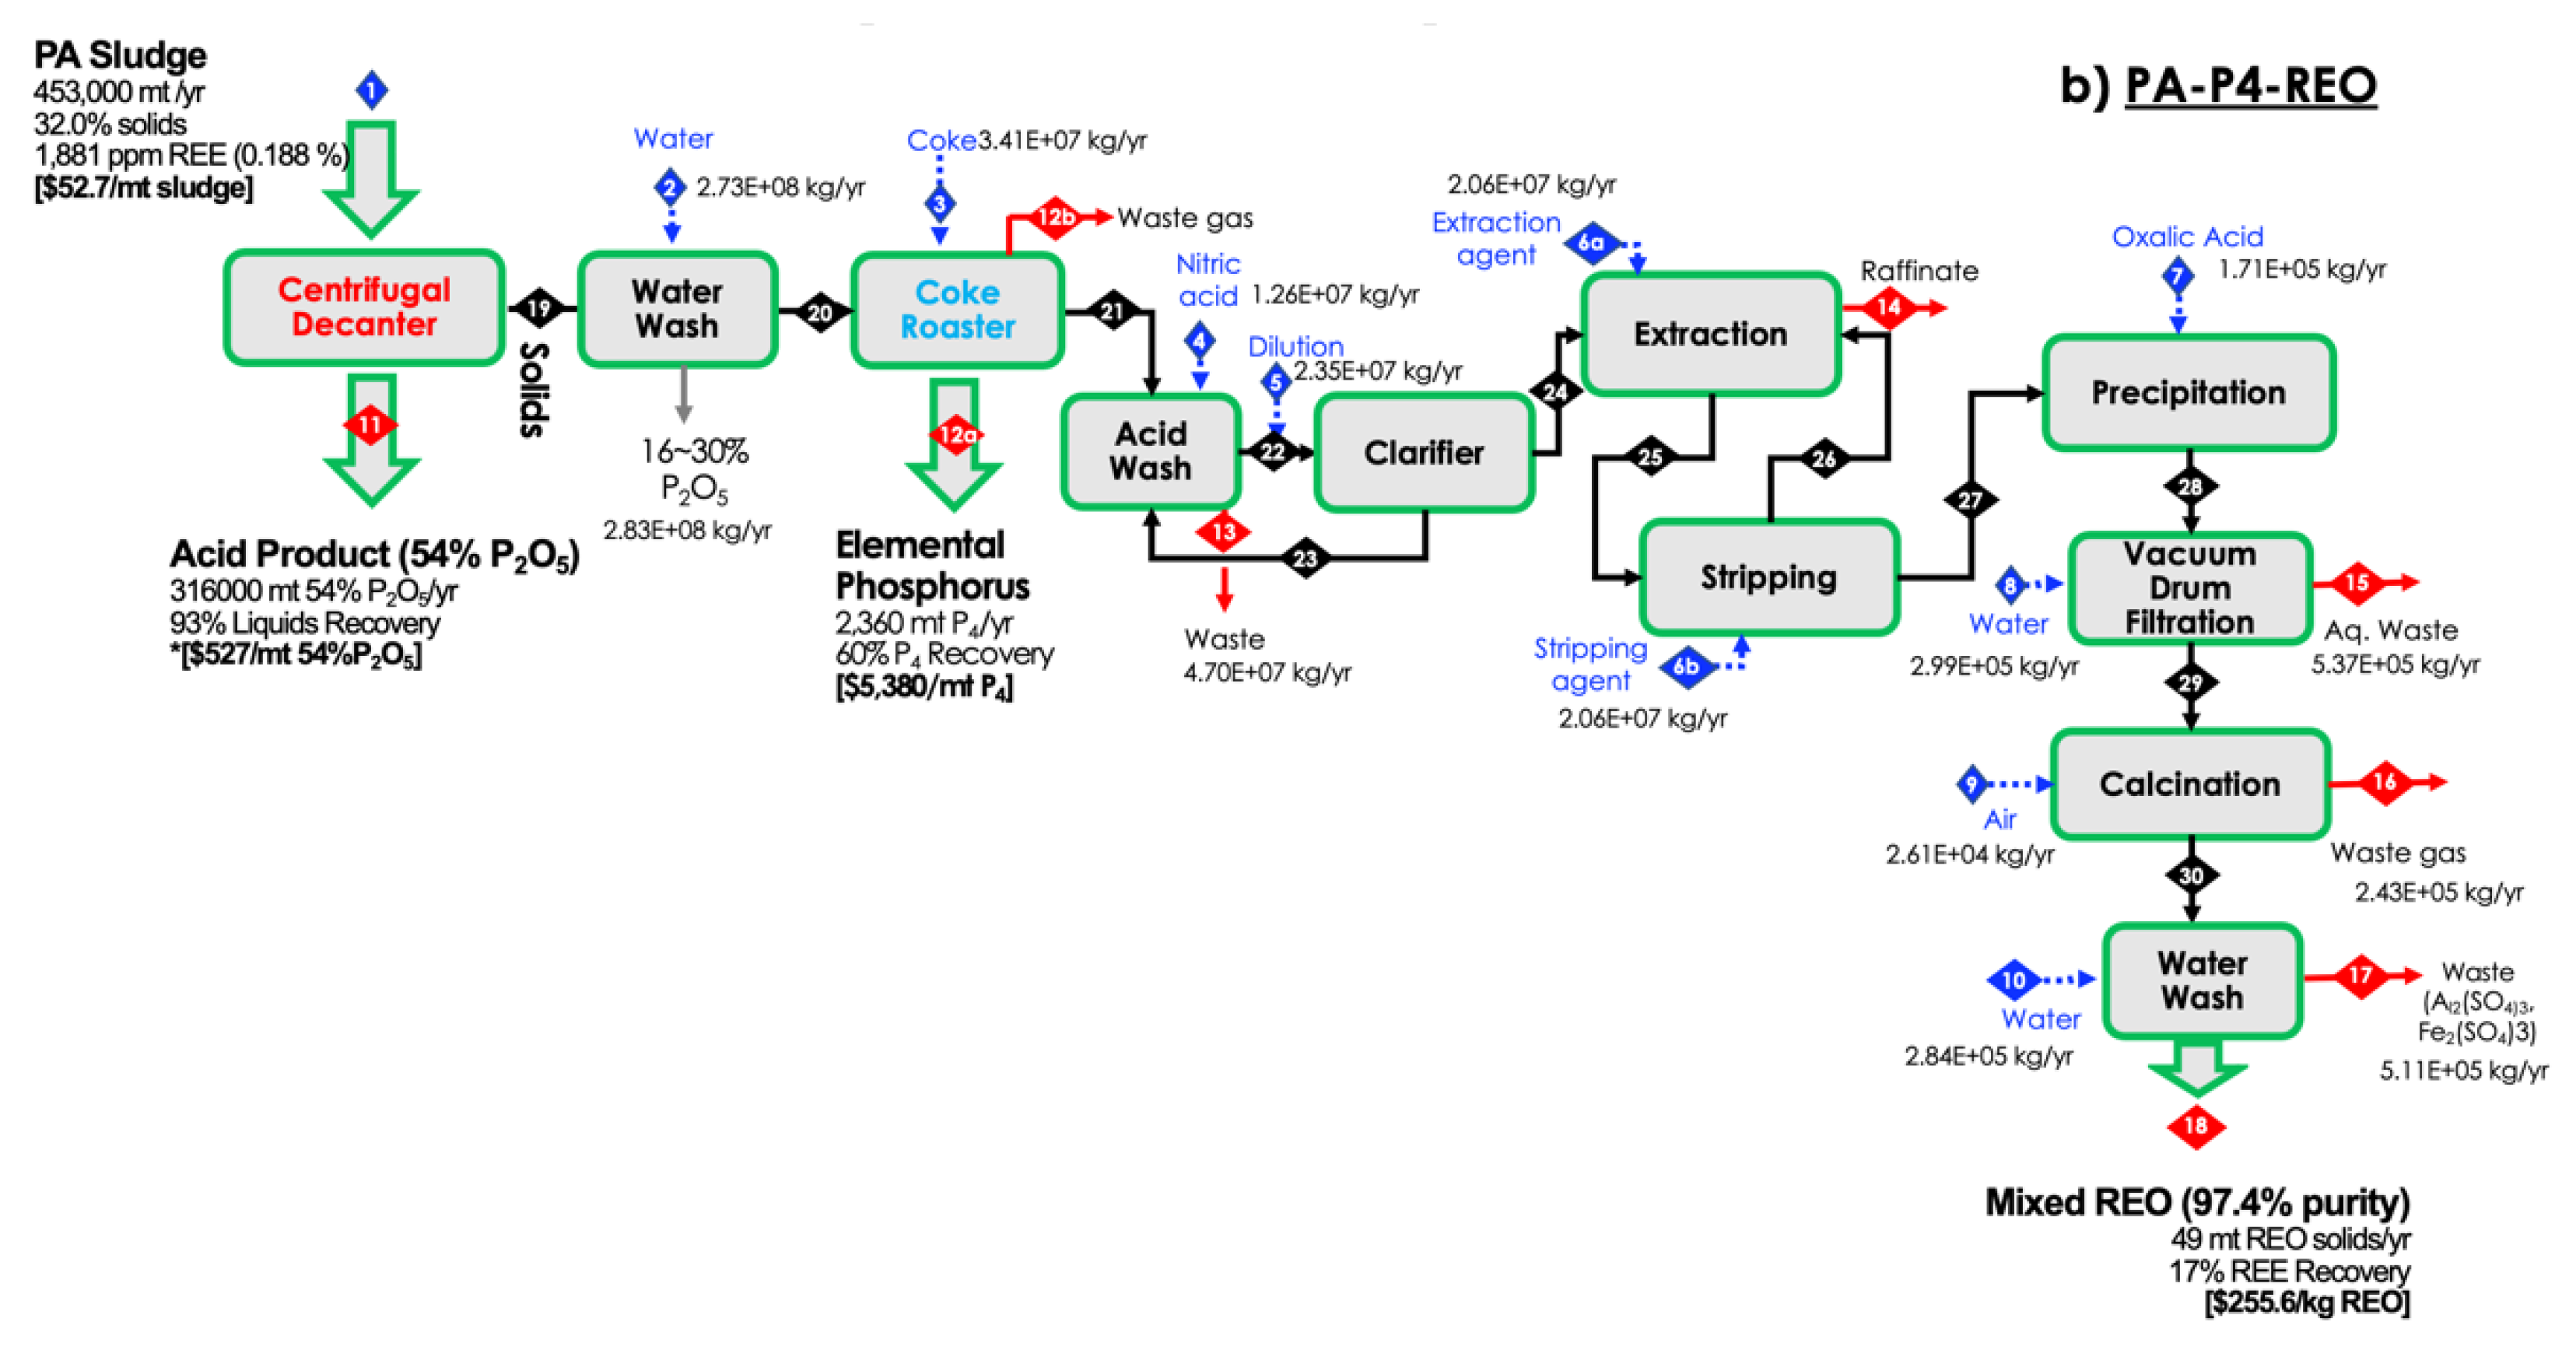
For the TEA analysis, we considered both the capital and operating costs to build a new facility against an “as-is” operation where the phosphoric sludge is used to produce a low-grade fertilizer. Currently, the phosphoric acid sludge is removed from the clarifiers; part of it is recycled to the previous clarifiers to increase the production of 54% PA and part of the sludge goes into fertilizer production processes that have ‘room’ to accommodate the sludge and still meet product specifications. An amount of 453,000 tons of PA sludges is considered as the baseline of the mass and energy balances for the proposed processes. The mass and energy balances were used to estimate the size of equipment and the operating costs associated with each unit operation [Supporting Information]. The separated phosphoric acid (54% P2O5) returns to the output stream (i.e., merchant grade phosphoric acid) to increase product recovery, while the separated solids require extensive treatment such as acid leaching, extraction/stripping, precipitation, and calcination, to produce the REO product. Based on a literature review and current prices of materials, reliable process and parameters (e.g., 32 wt.% solids in the feed stream) were adopted. Feasible technologies were then validated for each process, and two final products were considered for analysis: (1) PA and REO [Figure 2a] and (2) PA, P4 and REO [Figure 2b].
The recovered PA and processed mix REO solids (97.4% purity) are 316,000 metric tons/yr and 138 metric ton/yr, respectively, in the PA-REO process. In the PA-P4-REO process, due to the additional post-treatment of coke roasting, the production of mixed REO is further reduced to 49 ton/yr, and a new product (P4) is produced at 2,360 ton/yr. All cost numbers were determined using prices from 2023. The equipment cost for the REEs recovery plant from phosphoric acid sludge was calculated based on the following assumptions: 1) Total equipment costs were calculated by equipment sizing and cost data from Peters & Timmerhaus [12], with an inflation rate of 5% to convert to 2023 U.S. dollars. 2) Installation, piping, materials, buildings, and engineering were assumed to account for 15%, 15%, 15%, and 10% of total equipment costs, respectively. These assumptions are considered typical for similar activities in the phosphoric acid industry. 3) The total capital cost was then calculated and assumed to be spent within one year from the start of the project in 2023. Operating costs were calculated based on the materials cost, which was determined by multiplying the materials requirement from the mass balance by the 2023 price [Supporting Information]. For the key extraction agent (i.e., TODGA), a price of $6,500/kg was chosen for the current price. TODGA is still a new chemical agent, which has not been produced in bulk. The price of TODGA is included in the sensitivity study. The cost of waste disposal has not been considered in this process because most of the waste consists of PG and aqueous acid dilution, which are byproducts of the phosphate process stream. The process is supposed to be built at the phosphate mining site, allowing the waste to be dumped into the gypsum stacks (landfill site). In addition to this cost estimation, the following yearly operating costs were also considered: 1) maintenance and repair costs, which accounted for 15% of the total equipment cost; 2) operating supplies costs, estimated at 15% of the maintenance and repair costs; 3) additional charges including labor, overhead, taxes, and insurance, accounted for 2.45% of the operating costs.
Price of Phosphoric Acid: The recent price history of phosphoric acid ‘market prices’ is shown in Table 1 in terms of average price of P2O5 per year. These prices are based on 100% P2O5, while the final product of the phosphoric acid industry is typically 54% P2O5. Based on the lowest 2023 average price of 100% P2O5 for India (i.e., $975/MT), the value of 54% P2O5 would be $975/100 units = $9.75/unit of P2O5 × 54 units = $526.50/ton of 54% P2O5 equivalent. Thus, for the purpose of TEA evaluation of the process, the conservative price of $526.50/ton or $0.53/kg of 54% P2O5 was used.
Table 3. Recent Average Annual Prices of P2O5 (Provided by Mosaic Company, 2023).
Price Point: (100% P2O5) Average Price ($/MT) 2016-2023 AVG Spot Price
2016 2017 2018 2019 2020 2021 2022 2023
Brazil Quarterly Spot/Contract CFR $756 $665 $781 $746 $683 $1,128 $1,773 $1,197 $980 $1,034
India Quarterly
Contract CFR
$626 $566 $732 $691 $628 $1,073 $1,541 $975 $849 $850
North Africa Quarterly Contract FOB $699 $602 $764 $745 $687 $1,114 $1,617 $1,073 $906 $887
NW Europe (non-food grade) Quarterly Spot/Contract CFR N/A N/A N/A N/A N/A $1,254 $1,712 $1,218 $1,427 $1,034
NW Europe Quarterly Spot/Contract CFR $826 $705 $855 $852 $791 $1,193 $1,729 $1,223 $1,024 $1,034
Calculation of the delta net present value required the net present value (NPV) of the sludge sold as-is for low-grade fertilizer. A cost of $0.05/kg, approximately 10% of the 54% phosphoric acid price, was assumed, with a revenue inflation rate of 5% over a period of 10+2 years (i.e., 10-year operation and 2-year construction). The depreciation rate for the plant was assumed to be 10%, and the tax rate was set at 35%. Additional revenue was calculated based on the assumption that the recovered phosphoric acid could be sold at $0.53 per kilogram, and the produced mixed REO (97% purity) could be sold at $255.6 per kilogram by using contemporary oxide prices. The price of yellow phosphorus (P4) is determined at $5,380 per metric tonne [Supporting Information].
The annual delta net present value is then estimated by the following formula:
N P V = R e v e n u e T a x e s O P E X D e p r e c i a t i o n C A P E X R e v e n u e s l u d g e 1 + i y c y
All costs are calculated for the considered year, y, and then calculated with inflation for the present value in the current year, cy. The delta net present value is then the summation of NPV over the entire project life, i.e., 10+2 years. Finally, the levelized cost is calculated by dividing the delta net present value by the total amount of sludge processed over the 10-year plant operation.
L C = N P V m s l u d g e * 10 y r s

3. Results and Discussion

3.1. Process Validation

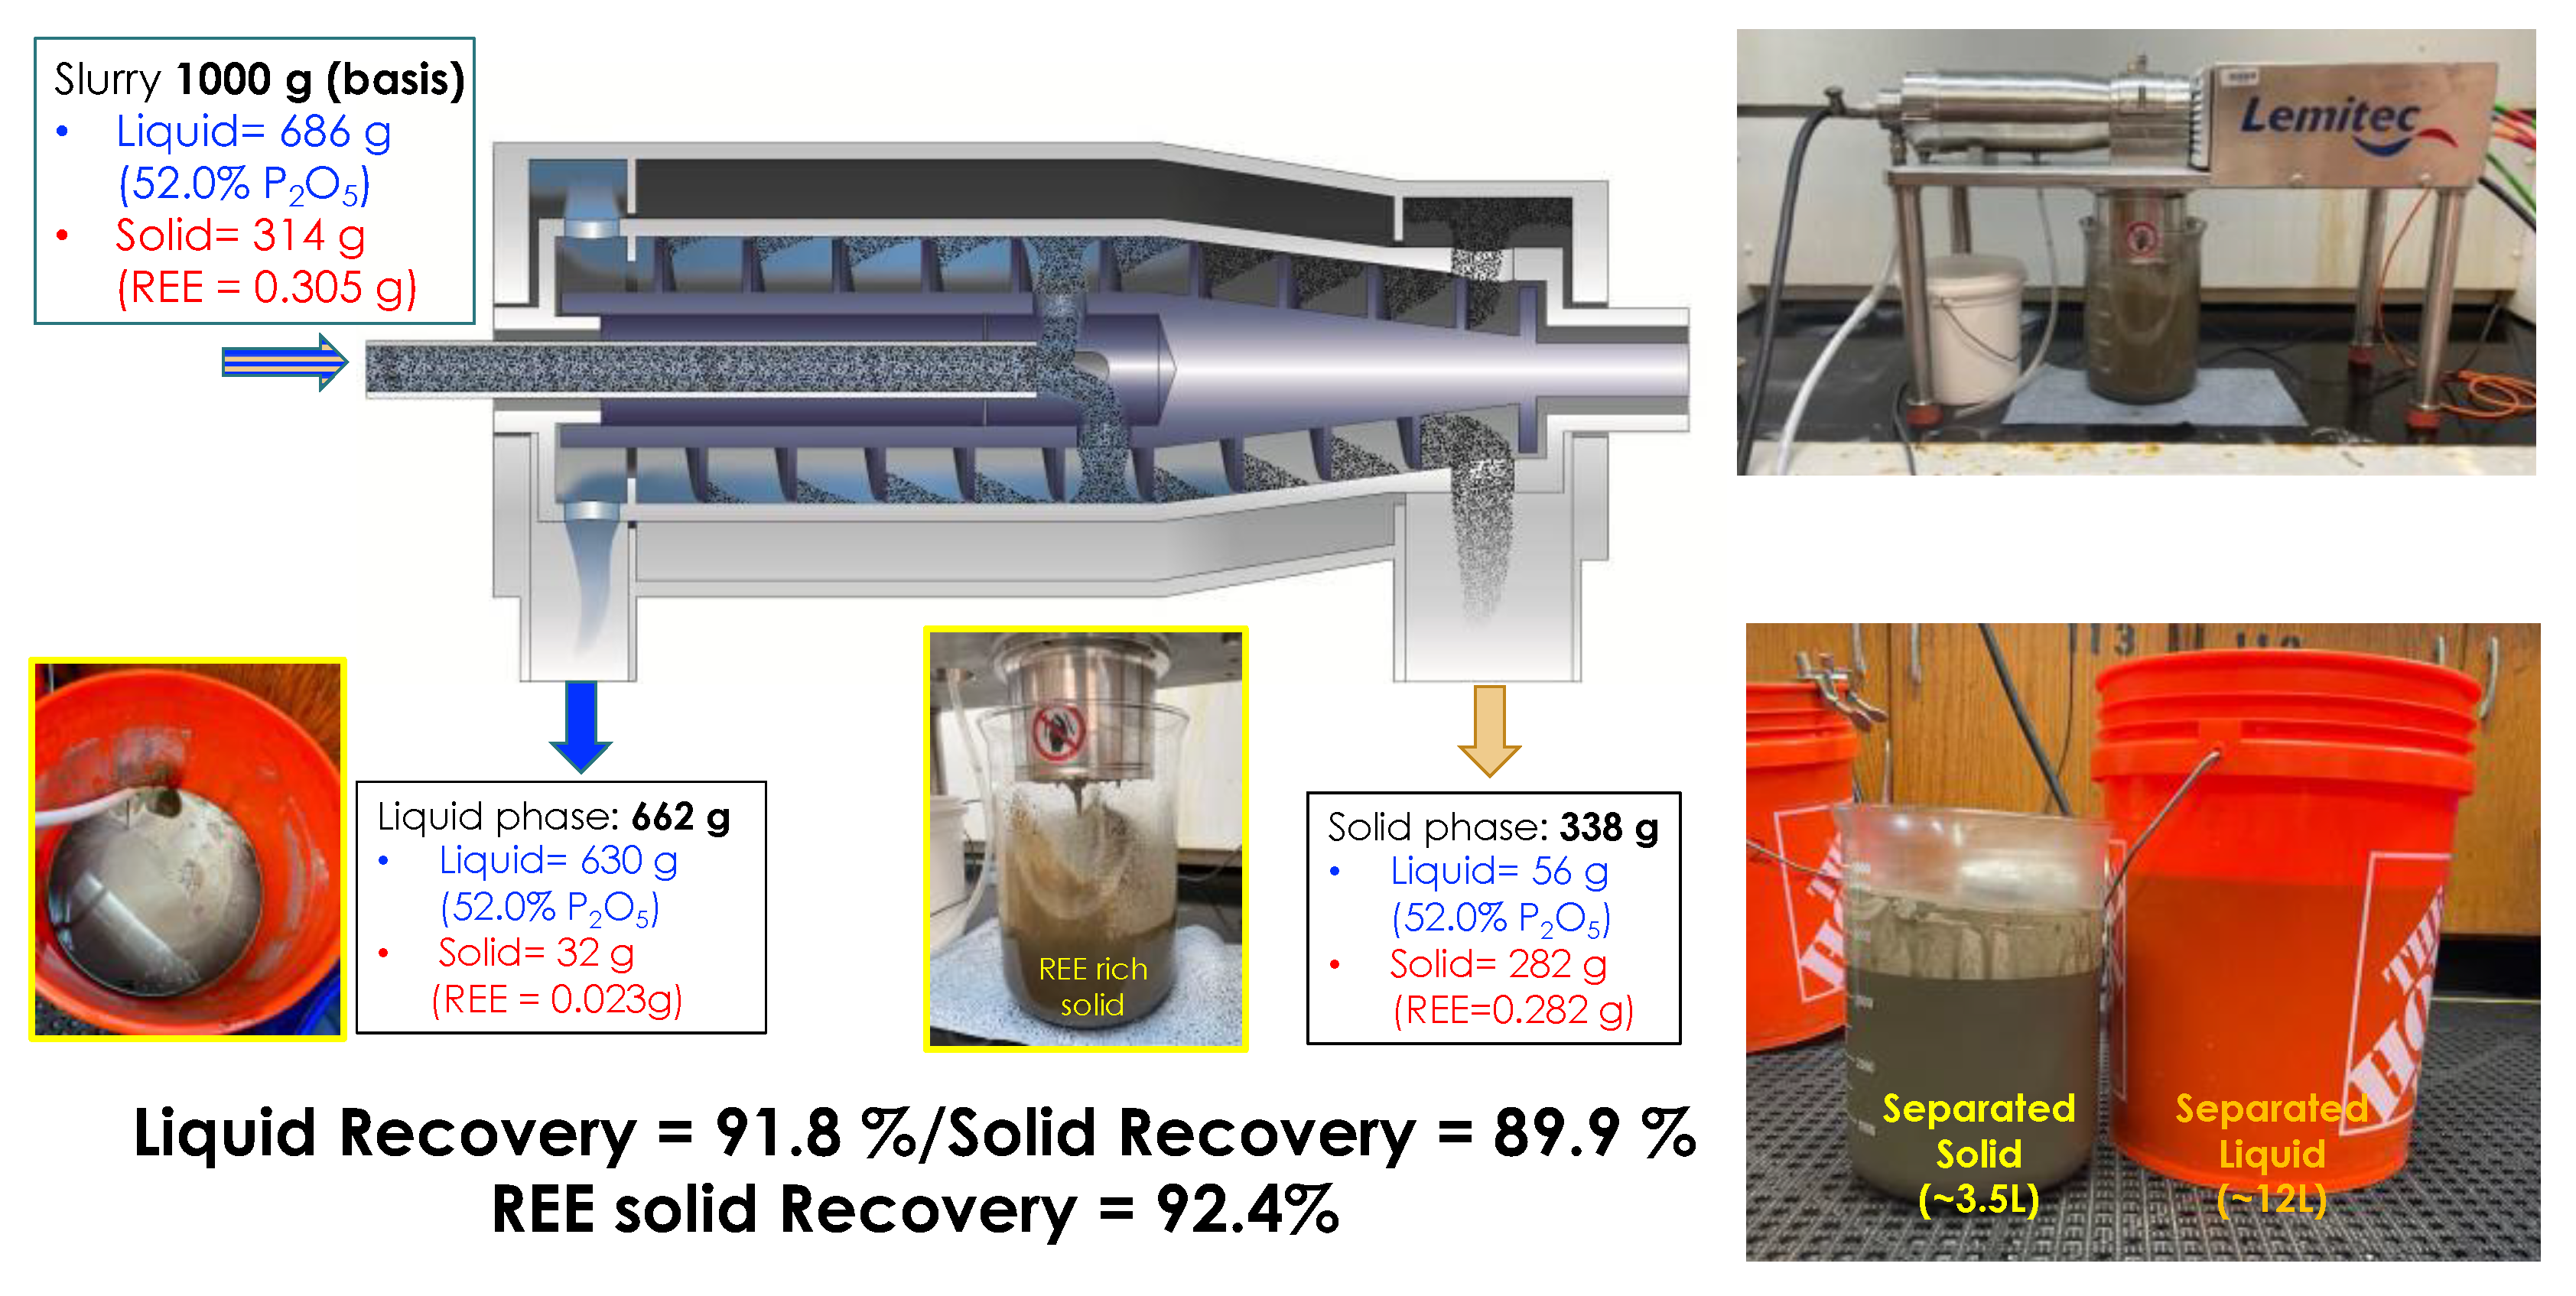
Decanter Centrifuge: In previous work, we have demonstrated the effectiveness of the decanter centrifuge in separating a solids-rich stream and a liquid-rich stream from phosphoric acid sludge containing up to 33.5 wt% solids. Simultaneous recovery of phosphoric acid liquid at >95% efficiency and REEs-containing solids at ~90% efficiency in a continuous-flow mode has been achieved after a single pass [5]. We also performed a field test at the site of the Florida Industrial and Phosphate Research Institute, in Lakeland Florida, to evaluate operational feasibility [Figure 3]. A series of experiments showed effective continuous separation after a single pass through the CFDC.
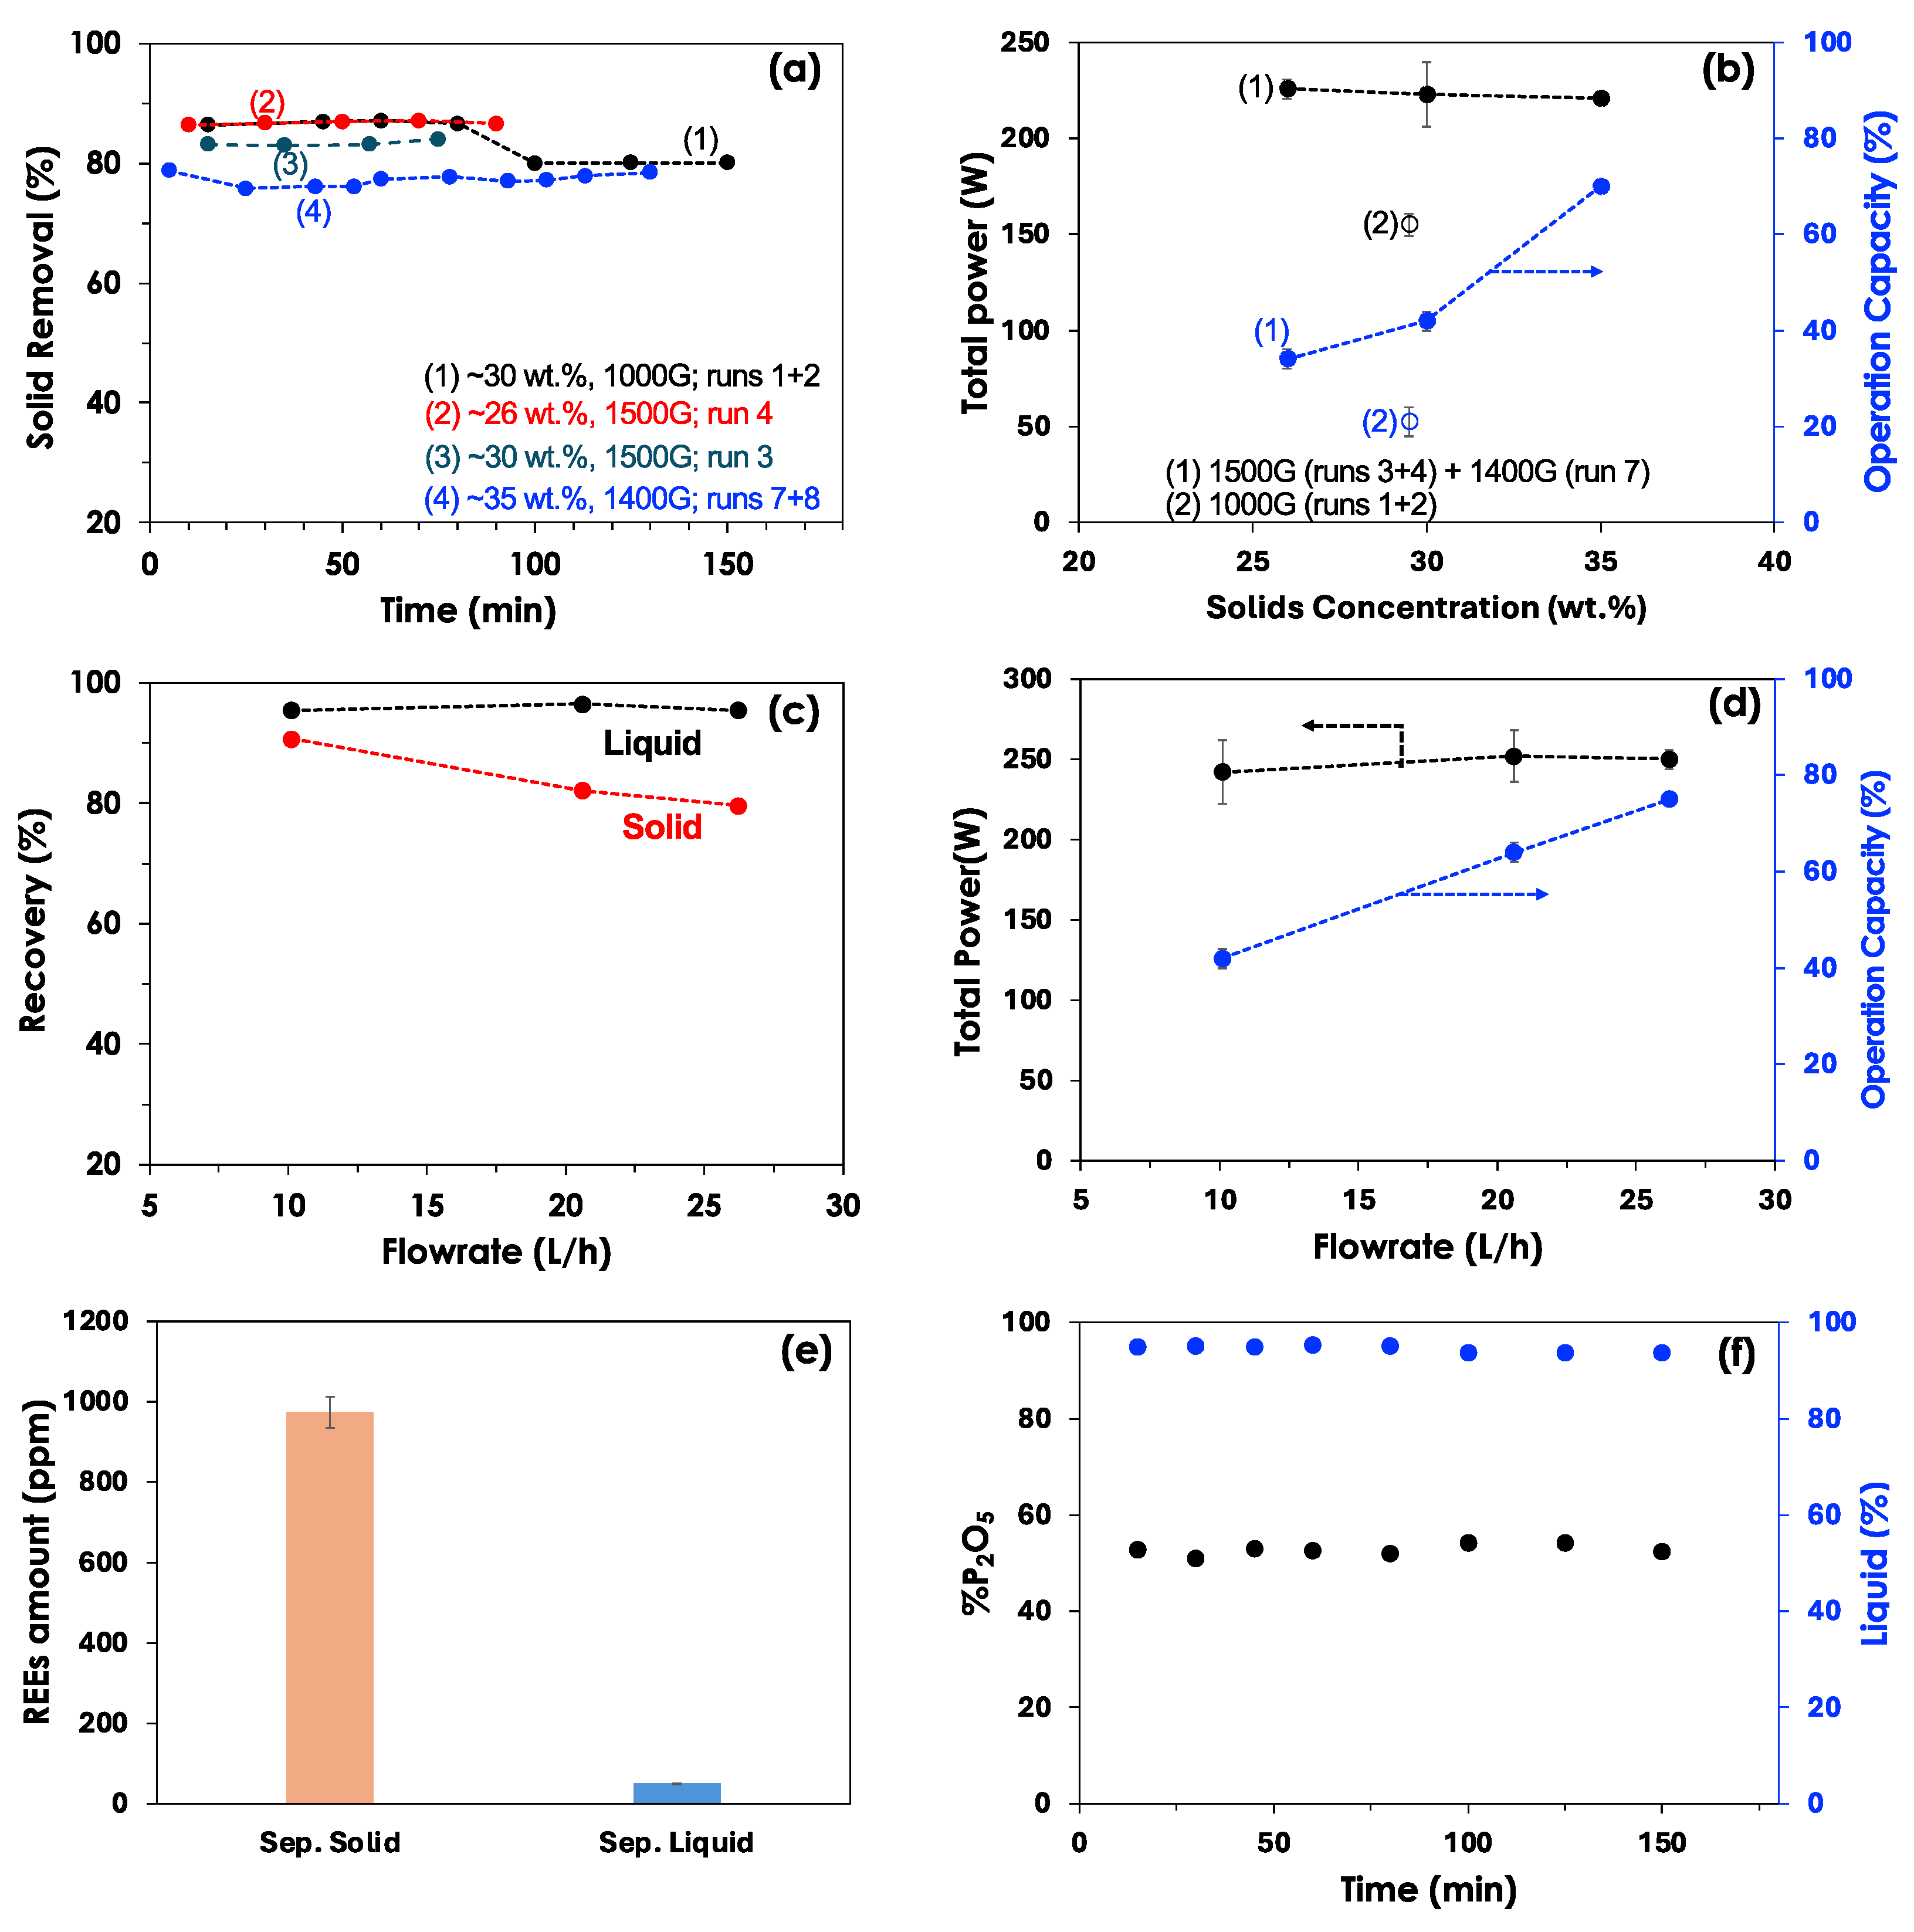
Various operating conditions were tested to evaluate the solid/liquid separation efficiency and total power consumption and to determine the optimal steady-state operation window [Figure 4]. The solid removal versus operation time in Figure 4a suggests that as the solid concentration increased from 26 wt% to 35 wt%, the solids removal slightly decreased; however, the removal efficiency by the decanter remained stable over time. As shown in Figure 4b, the operational capacity of the screw engine and controller indicates a significant increase from 38% to 75% with increasing solid concentration, but the total power consumption did not change due to operation within limits. Figure 4c,d show that the sludge feed flow rate increased while the acceleration was fixed at 1500 G. The solids removal efficiency decreased over the increasing range of feed flow rates, while the liquid recovery efficiency did not change. The effect of flowrate contributed to an increase in operation capacity, but not in total energy consumption. The separated solid, as shown in Figure 4e, contains 1,000 ppm REE, while the separated liquid contains <60 ppm of REE. The separated liquid consists of ~52% P2O5 with <5% solids [Figure 4f]. Detailed experimental results are available in the Supporting Information, showing consistency with previously reported values [5].
The case considered here for the TEA, using the decanter centrifuge, is based on 93% liquid recovery and 90% solids recovery, resulting in a potential 92% recovery of rare earth elements from the phosphoric acid sludge. Based on these experimental data, when we consider a full-scale industrial plant, we can assume an increase in the phosphoric acid product of 316,000 metric tons 54% P2O5/yr that can be recovered through the CFDC process, and that the separated solid is further processed to recover REEs and/or elemental P.
Acid Washing (Leaching REEs from solid particles with sulfuric acid): The solids stream separated from phosphoric acid sludge mostly contains insoluble hydrated calcium sulphate salt (i.e., phosphogypsum, PG). The recovery of REEs from PG has been well studied using mineral acid leaching. Conventional mineral acids such as H2SO4, HCl, and HNO3 have been investigated to leach REEs out of PG under different conditions such as concentration of acid, liquid/solid ratio, and combinations of acid type and leaching time [6]. The reported leaching efficiencies from PG with solely H2SO4 leaching were relatively medium, ranging from 40% to 70%, and consumed large amounts of acid for high liquid (L) to solid (S) ratios, in the range of 1.3-8 [13,14,15,16]. Some studies reported that nitric acid (HNO3) yields higher leaching efficiencies than sulfuric acid [17,18]. H2SO4 is still preferred, however, due to materials cost (e.g., $64/MT for sulfuric acid vs $393/MT for nitric acid on Free on Board (FOB) Linden NJ basis at the end of the year 2023 [19]) and because H2SO4 is already available in phosphoric acid plants, while HNO3 would need an additional acid circulation procedure. A recent study shows that the REEs leaching efficiency can be increased up to 90% through process optimization using an acid concentration of ~3 mol/L, a liquid/solid ratio of 12 L/kg and a temperature of 55 °C [20]. By adopting a clarifier for continuous removal of undissolved solids being deposited by sedimentation, the supernatant can be transported to the solvent extraction process. Based on this process, REEs recovery can be assumed at 85% with a 6-stage circulation. Thus, a sulfuric acid and clarifier system were assumed in this study to convert phosphate to sulfate salts of REEs with a recovery rate of 85% of the REEs and 3% of the other solids.
Extraction and Stripping (REEs extraction from the leaching solution): The hydrometallurgical separation of REEs from conventional sources, such as monazite and bastnaesite, has been accomplished using ion exchange chromatography and solvent extraction (SX). SX offers several advantages for REEs separation from ore concentrates including good selectivity, flexibility in process design, and high REE concentration in the solvent, which allows for more compact equipment. Solvent extraction is a mass transfer process between two immiscible phases, involving the selective transfer of the desired solute from an aqueous solution to an organic solvent phase. Multiple stages of extraction are typically required to achieve complete solute recovery, and a counter-current cascade is commonly used for efficient separation. SX of REEs flowsheets typically include saponification, extraction, scrubbing, and stripping processes. The affinity of the solvent extraction ligands increases with the increasing atomic weight of the REEs, facilitating fractionation and subsequent separation to yield individual REEs. In this study, the diglycolamide (DGA) ligand N, N, N, N’ Tetra-octyl-3-oxopentanediamide (TODGA) was selected as the key reagent for REEs extraction. The extraction efficiency of 14 REEs from a sulfuric acid solution is reported to be between 91.0% and 99.8% [21]. TODGA exhibits higher selectivity for REEs and very low affinity for competing metals (e.g., Fe, Mg, and Al). This behavior is advantageous for extracting REEs from complex lean sources. TODGA has been found to have high solubility in paraffinic solvents, poor solubility in aqueous media, and a high distribution (D) value for trivalent actinides [22]. Trioctylamine (TOA) has also been used as an extractant in the form of pseudoprotic ionic liquid for the separation of REEs [23]. Based on the performance of TODGA and TOA, a formula comprising TODGA, TOA, ExxalTM13, ISOPAR L was proposed for effectively recovering dissolved REEs from a sulfuric acid medium. The formula allows for the complexation of REEs in the solution and their transfer from the aqueous phase to an aqueous-insoluble hydrophobic (non-polar) solution, where the extractant compound is dissolved [24]. The previously reported formula of a mixture of 0.2M TODGA + 0.02 M TOA30% v/v ExxalTM 13 in Isopar-L is assumed as the extraction solution in this study, while 0.01 M H2SO4 is assumed as the stripping solution. Extraction and stripping affinities reported in the literature are employed here to determine mass balances and REEs recovery for the process flow diagram [24]. The extraction process consists of three stages with a leachant-to-acid volumetric ratio of 2, followed by stripping steps that have an acid-to-leachant volumetric ratio of 4.
Precipitation and REEs Oxide Recovery: Oxalic acid is employed to selectively precipitate the REEs as oxalates, which are relatively insoluble. The precipitation reaction occurs by mixing a solution containing the REEs with oxalic acid. By controlling the process parameters, such as increasing the oxalic acid concentration to 80 g/L and raising the solution pH from 0.5 to 2.5, significant improvements in the precipitation efficiency of REEs were achieved, reaching up to 95.0% and 98.9%, respectively [25].
The precipitation reaction of REEs with oxalic acid can be expressed by the following overall reaction [26]:
2REE3+ + 3C2H2O4 + 10H2O ⇄ REE2(C2O4)3∙10H2O(S) + 6H+
Based on Equation (5), 1.5 mol oxalic acid is required to precipitate 1 mol REEs from solution. The resulting precipitate, known as rare earth oxalate, can be further processed to yield purified REEs compounds or metals.
Filtration and Calcination: To filter the REE oxide products, a rotary vacuum drum filtration unit is assumed in this study. This equipment involves the use of a rotating drum, a vacuum system, and a filter medium to achieve efficient solid-liquid separation. Widely used in various industrial fields, this filtration technique enables continuous filtering, clarification, cake washing, extraction, and dewatering of slurries and waste materials [27]. An oxalic acid precipitator with an acid-to-feed ratio of 1.2 and a vacuum drum filter with a wash-water ratio of 4.0 were assumed to recover REEs as oxalic acid complex with 96% purity and 95% recovery. Calcination was the final unit operation to convert REEs to the oxide form for calculation of the mixed REO production rate. The required air ratio for calcination was assumed to be 1.0. After washing the calcinated product, mixed REO of 97.4% purity is obtained.
Elemental Phosphorus Production from Sludge Solids: Elemental phosphorus is commercially produced through an electrothermal process commonly known as coke roasting. The primary source for this process is fluoroapatite, 3Ca3(PO4)2·CaF2, commonly known as ‘phosphate rock’. Impurities present in phosphate rock include calcium and magnesium carbonates, iron(lll) oxide, aluminum oxide, and silica. In the furnace, a mixture of phosphate rock, coke, and silica (sand) in a mass ratio typically of 16:30:100 is smelted, resulting in the formation of carbon monoxide and phosphorus. The phosphorus is released as an element at temperatures ranging from 1,200 to 1,500 °C. The reaction can be represented as follows:
2Ca3(PO4)2(s) + 6SiO2 (s) + 10 C (s) → 6 CaSiO3 (s) + P4(g) + 10 CO(g)
Gaseous phosphorus and carbon monoxide, obtained from the top of the furnace, are then passed into a spray of water at 343 K. Most of the phosphorus (melting point 317 K) condenses during this process. Condensation is completed by using cold water. The carbon monoxide can be either burnt off or recycled as a fuel source that can be utilized in the production process for the preparation of nodules from the phosphate rock or, in some cases, sold to local power producers. Molten calcium silicate slag and an alloy of iron and phosphorus, known as ferrophosphorus, are removed from the bottom of the furnace. Following the traditional approach, the P2O5 from the separated solids (CaSO4·2H2O) is recovered to yield elemental phosphorus. We demonstrated that approximately 60% of the total P2O5 in the solid is converted into elemental phosphorus through thermal coke roasting [ Supporting Information]. The REEs are further concentrated into the byproduct solid, which can be further processed to produce REE oxides.
REEs Leaching from the Roasted Byproduct: Leaching of REEs from the roasted byproduct is conducted at room temperature with a 30% solids concentration using either a 5M nitric acid solution or a 5M hydrochloric acid solution. Nitric acid is preferred as it does not react with the residual carbon in the roasted product. Through leaching, a REEs recovery of 98% is achieved [Supporting Information]. Approximately, one fifth of the acid is consumed during leaching, while the remainder is recycled. Leching is accomplished in a single stage.

3.2. Technoeconomic Analysis

The technoeconomic performance of the two REEs extraction processes presented in Figure 2 is assessed for a representative feedstock of phosphoric acid sludge obtained from passive treatment beds by the Mosaic Company in Florida. The materials used, energy expended, and costs for a hypothetical processing plant designed to produce a solid REO are first presented. The revenue is then quantified using both scenarios for lifecycle economic metrics, such as net present value and internal rate of return. Finally, the sensitivity of the net profit to cost components is evaluated, and recommendations for process modifications to make REEs extraction economically viable are discussed.
Based on the annual production of PA sludge (453,000 metric tons/year) with a content of 32 wt.% solids, the recovered PA and processed REO solids are 316,000 metric tons/yr and 138 metric tons/yr, respectively in scenario I, while due to the additional post-treatment of coke roasting in scenario II, the production of REO is further reduced to 49 ton/yr and a new profit from elemental P is produced at 2,360 tons/year [Figure 2a]. The capital costs of process equipment for scenarios I and II, as shown in Table 4, are estimated at $7.08 million and $7.55 million, respectively. The capital cost of a REEs recovery facility processing 297,000 tons of amine sand tailing per year, with ~229 ppm of REEs, is reported to be $13.5 million [28]. Another study reported the capital cost of a facility producing 1 ton REEs/year from acid mine drainage precipitate to be $2.6-3.4 million [10]. A commercial SX process accounts for ~20% of the total equipment cost for both scenarios. The total capital cost for scenario II is slightly higher than that for scenario I because, after producing elemental phosphorus in the coke roasting, the mass flowrate of the process stream (i.e., concentrated solids) is significantly reduced by acid washing. The extractor and stripper are the most expensive processing steps in terms of capital expenses. The decanter centrifuge appears to have a medium CAPEX. Table 4 shows that the operating costs of sludge processing to PA-REO and PA-P4-REO are determined at $9.82 million (equivalent to $21.7/ton of sludge) and $27.15 million (equivalent to $59.9/ton of sludge), respectively. The levelized cost of REO solids produced from the PA-REO and PA-P4-REO processes as shown in Table 6 is determined to be $71.0/kg and $550.6/kg, respectively. As a reference, the levelized cost of REE from coal mining drainage (~0.9 ppm) is reported to range between $86,000 and $278,000/kg [29]. Due to the production of P4, the production rate of REO from the PA-P4-REO process is reduced by ~64.5%, and nitric acid is used for the extraction instead of sulfuric acid.
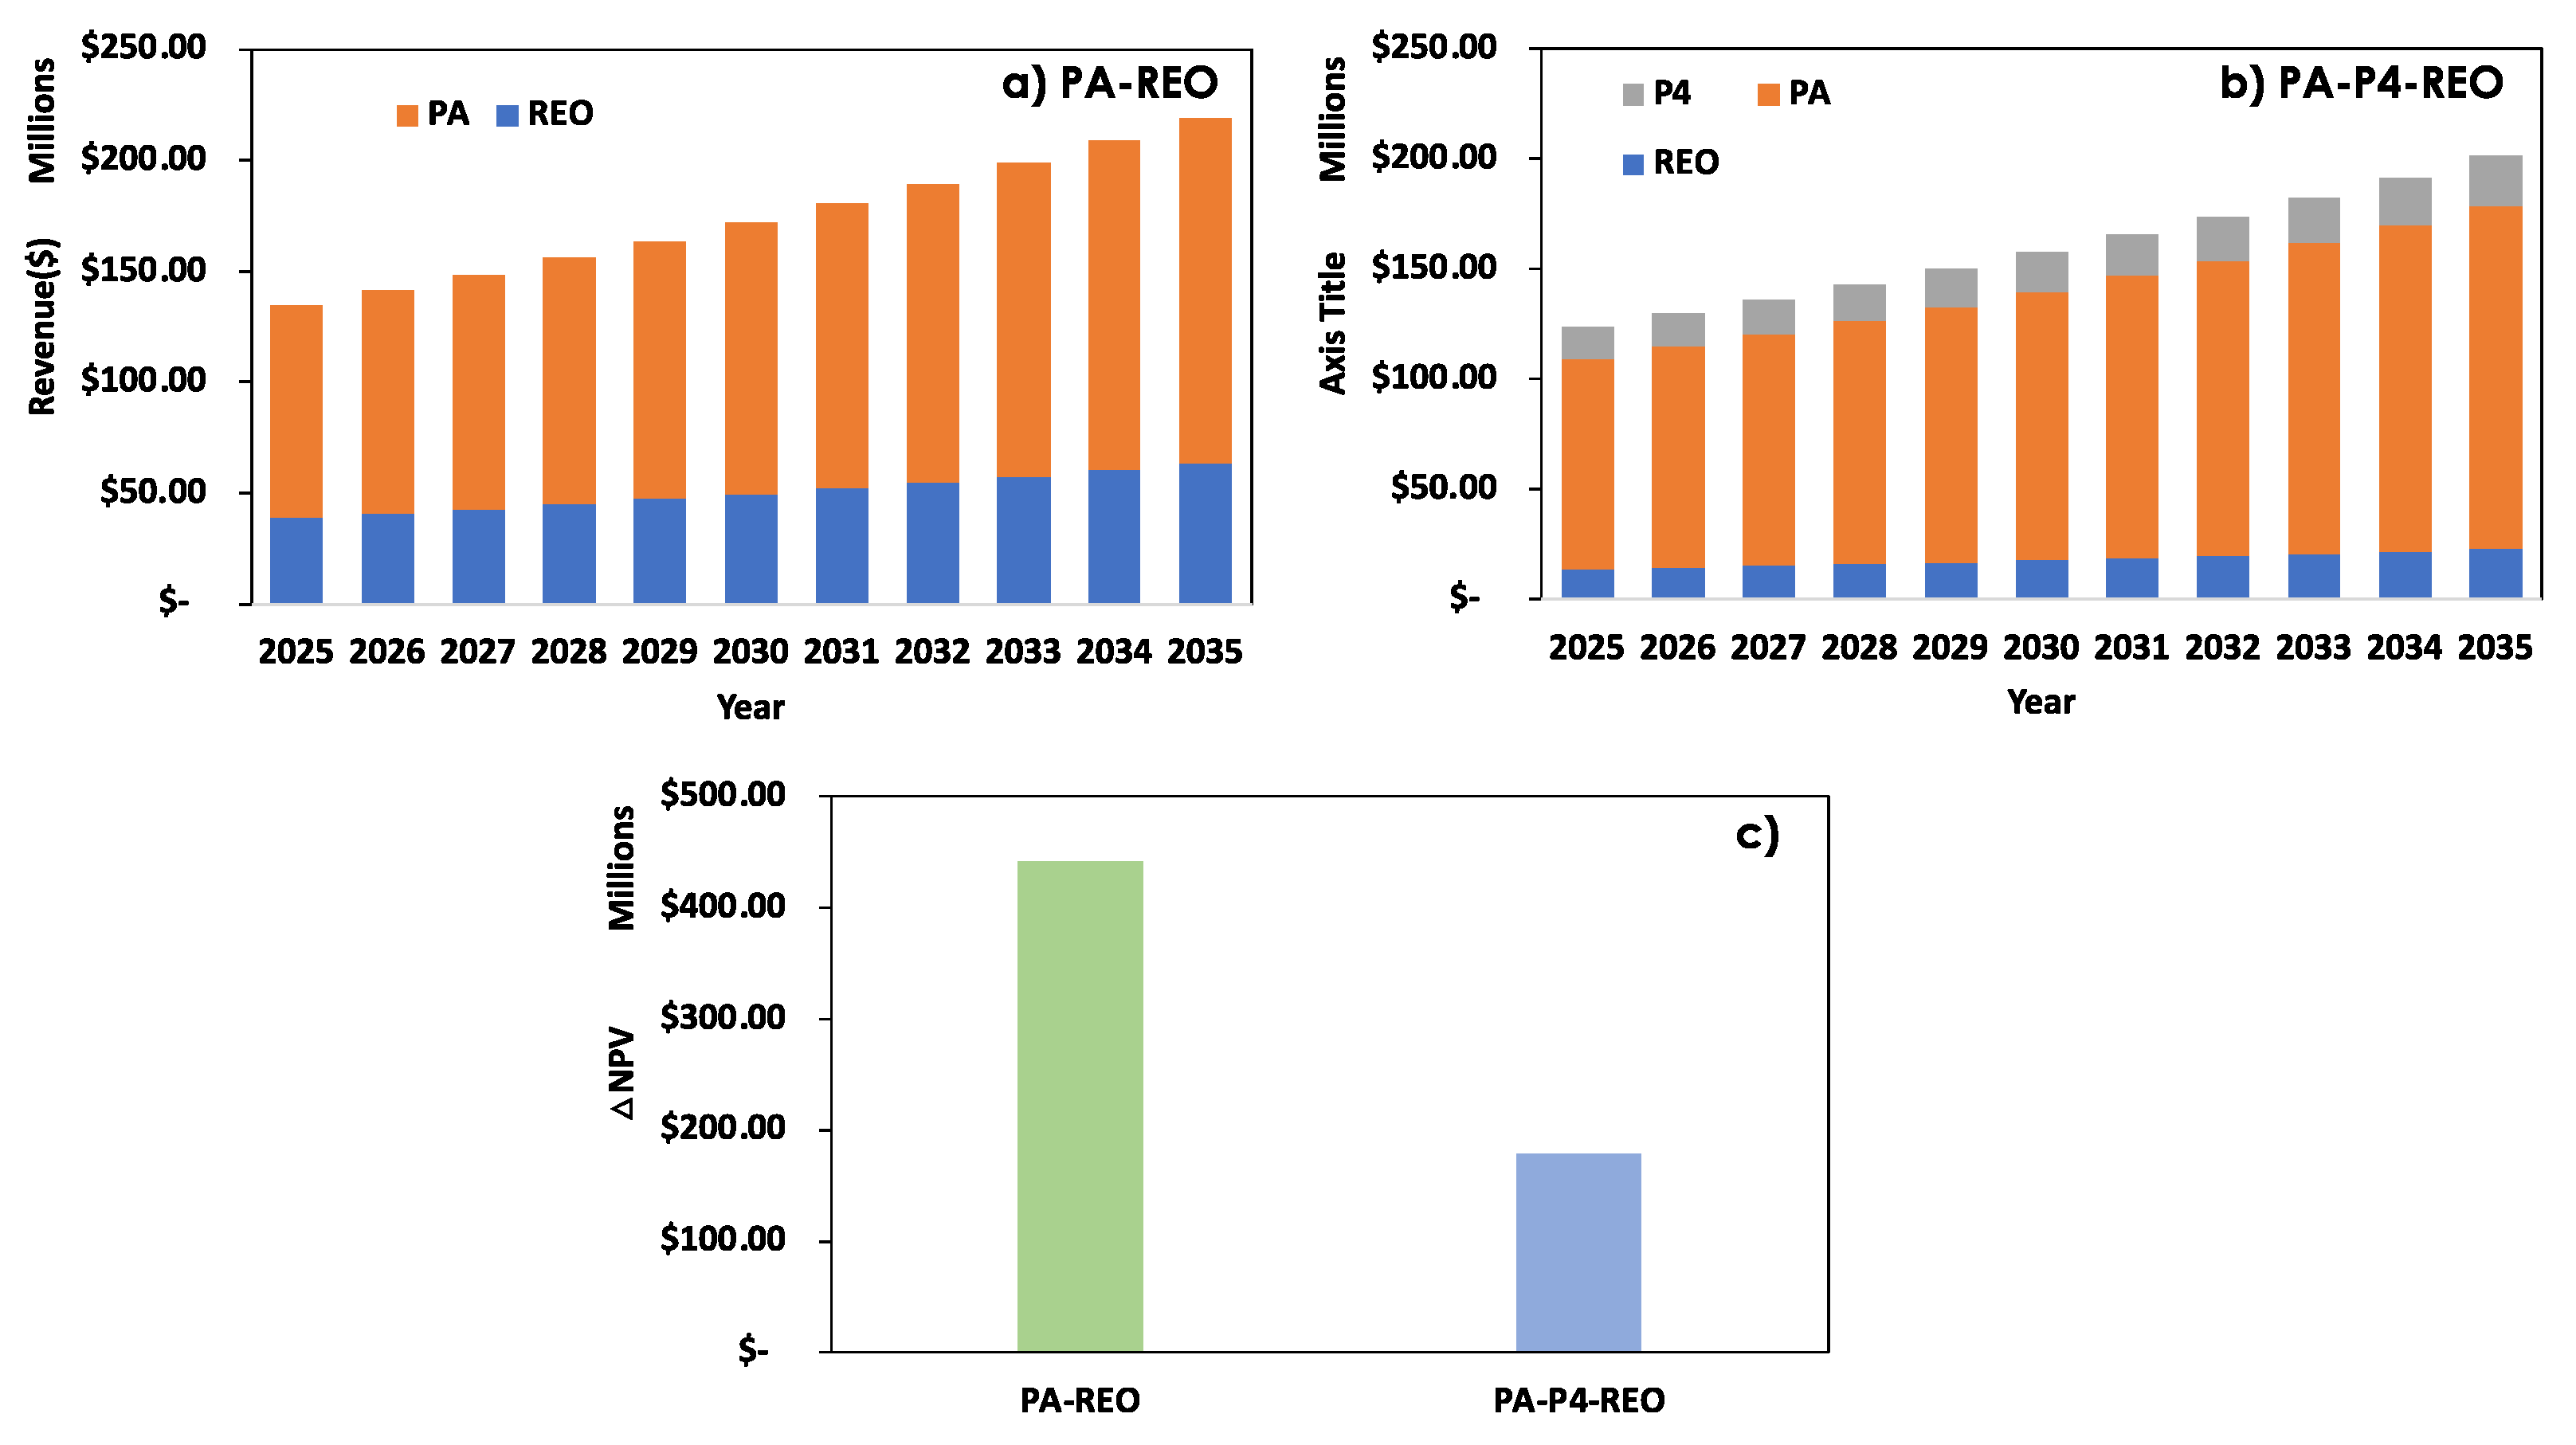
Figure 5a shows that 71.0% of the revenue in the PA-REO process comes from phosphoric acid, while REO accounts for 29% of the revenue. In the PA-P4-REO process, the production of P4 could not increase the total revenue compared to that from PA-REO, because of the reduction of REO production and relative low revenue contribution associated with high operating cost in scenario II [Figure 5b].
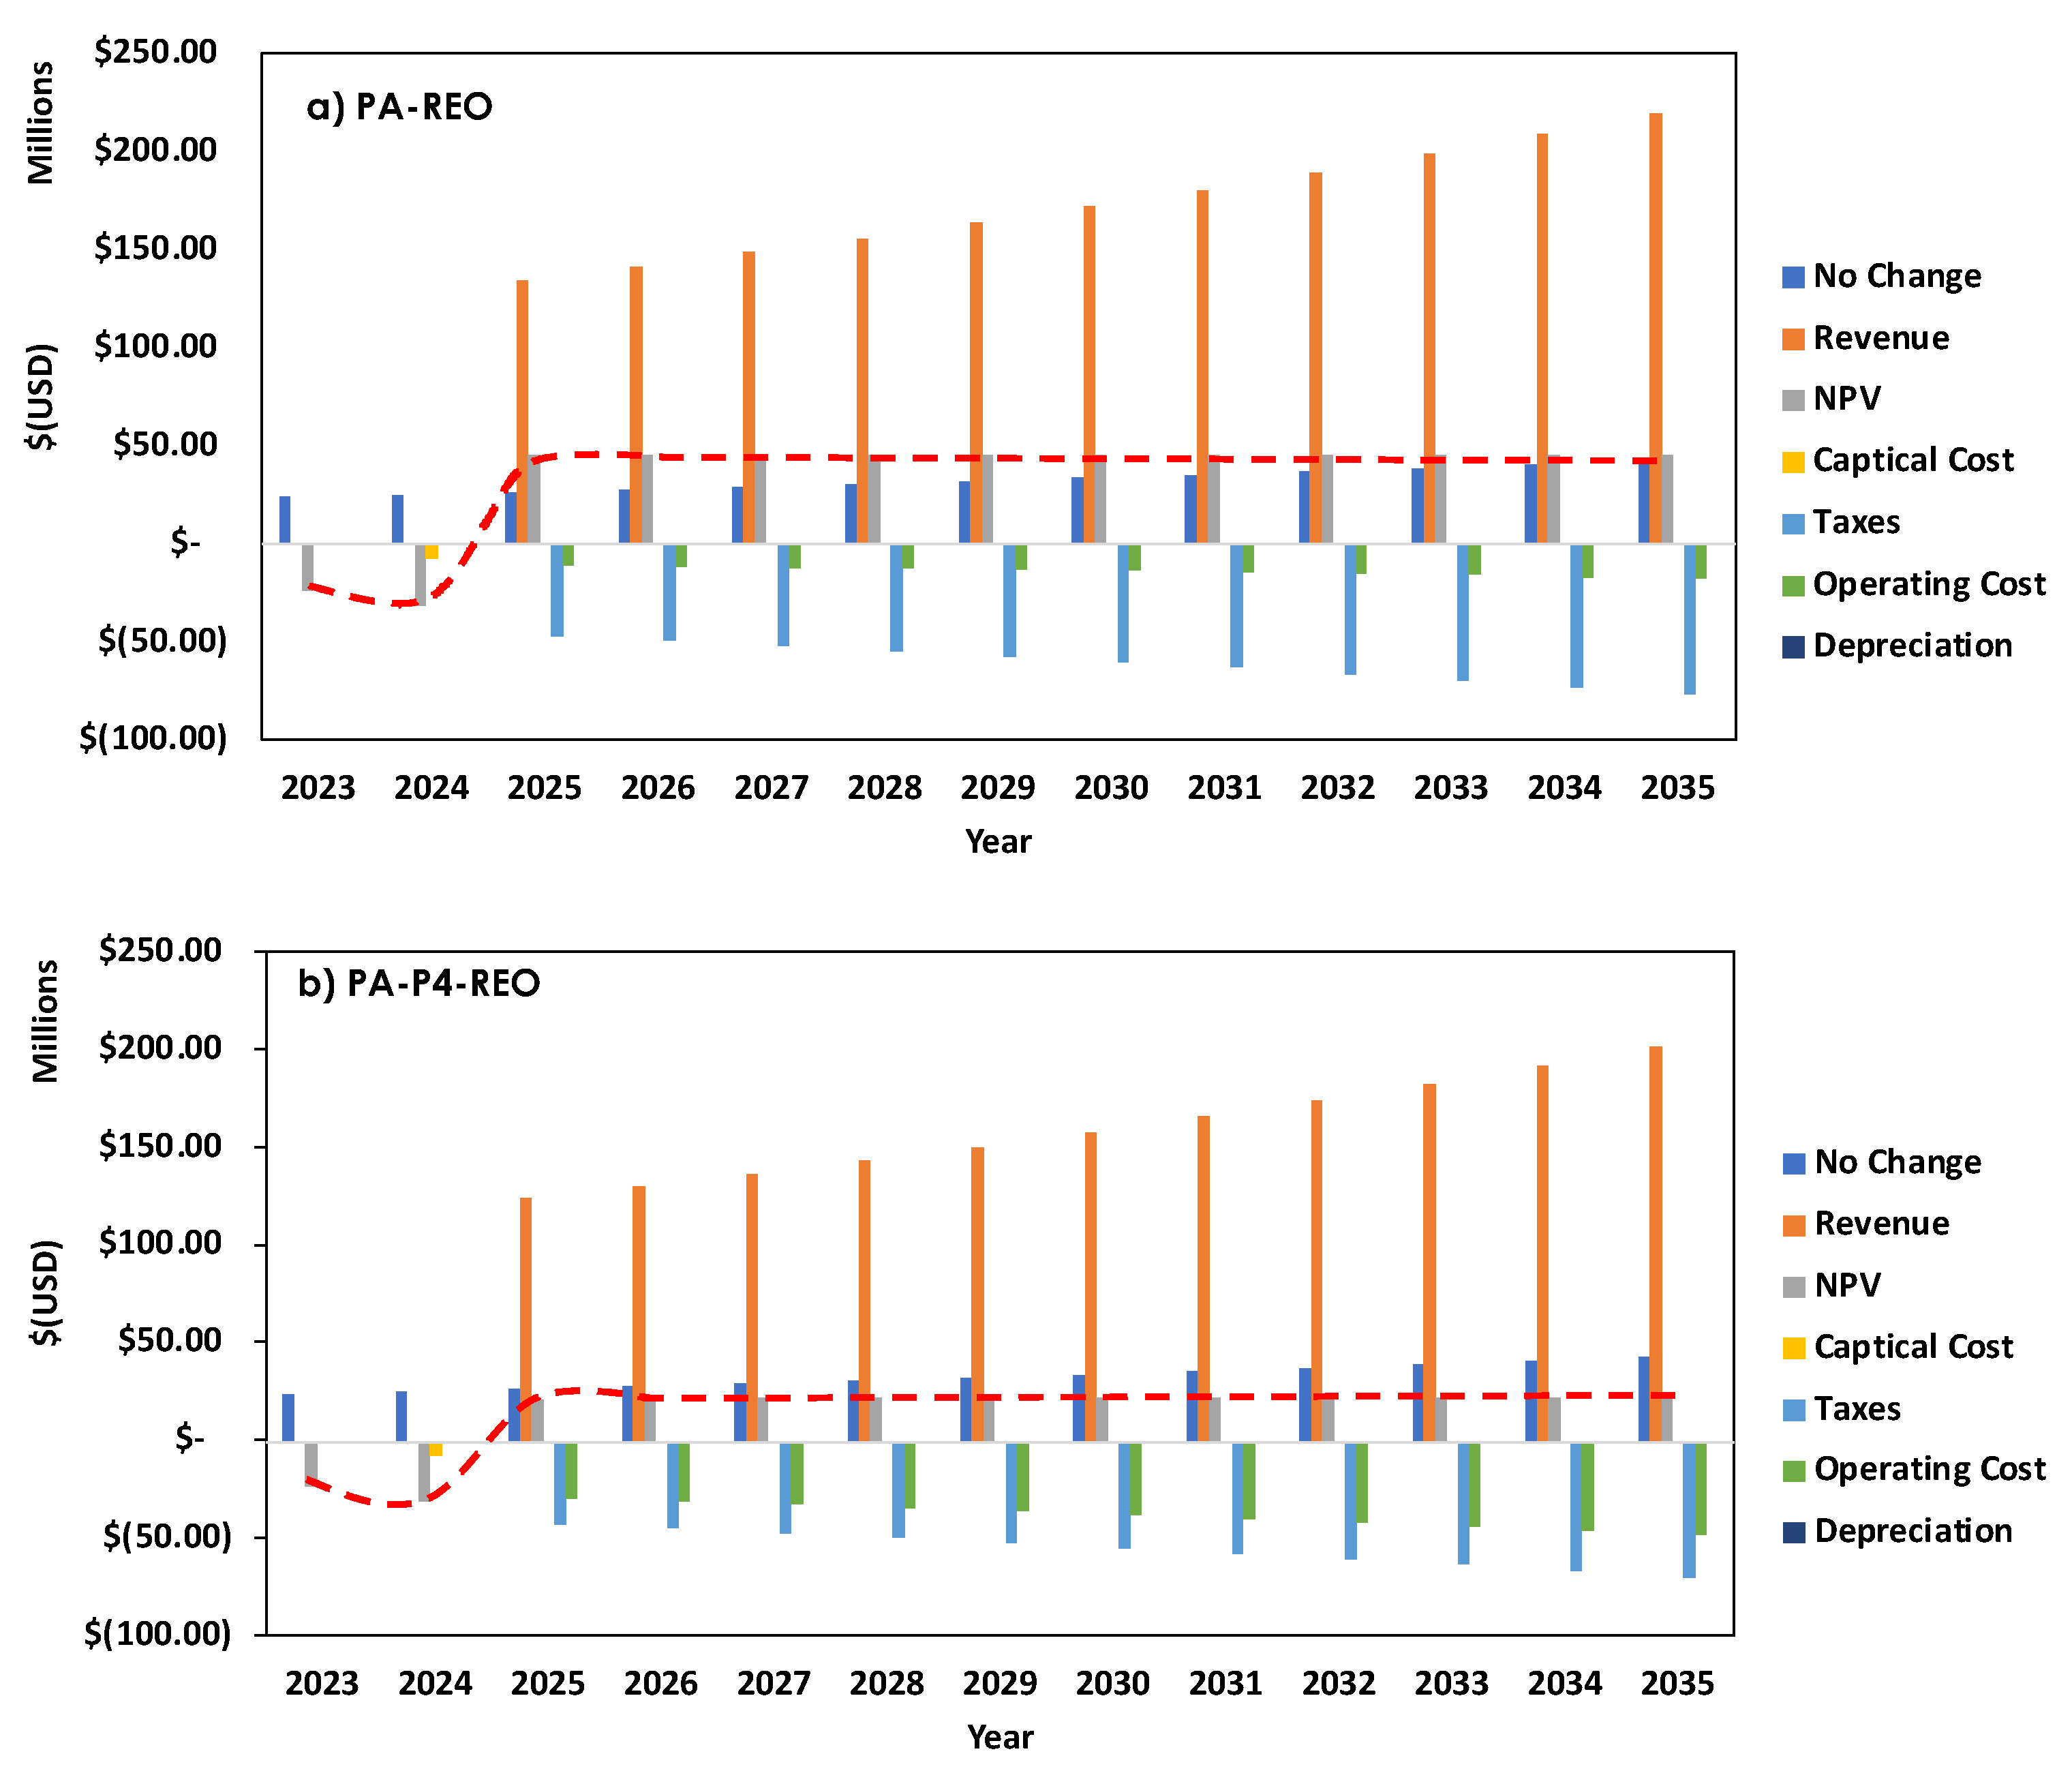
Based on the CAPEX, OPEX, and revenues, we determined the net present value, which is the sum of all future cash flows over the investment’s operation time (i.e., 10 years), discounted to the present value. The calculation of the delta net present value requires the net present value (NPV) of the sludge sold as-is for low-grade fertilizer. Figure 5c shows the delta net present value ( NPV; light blue bars), assuming a revenue inflation rate of 5% over an operational period of 10+2 years, comparing the total value of the project (acid and REE oxide recovery) against the current scenario (i.e., sale of sludge for low-grade fertilizer). The NPV of the PA-REO process is estimated at $ 441.8 million, while the NPV of the PA-P4-REO process is estimated at $178.7 million. Figure 6 shows both profiles of NPV over 12 years. Capital costs and loss of current profit (i.e., sale of sludge; no change) can be returned after construction of the sludge treatment facilities. Overall, the TEA concluded that both processes are profitable.
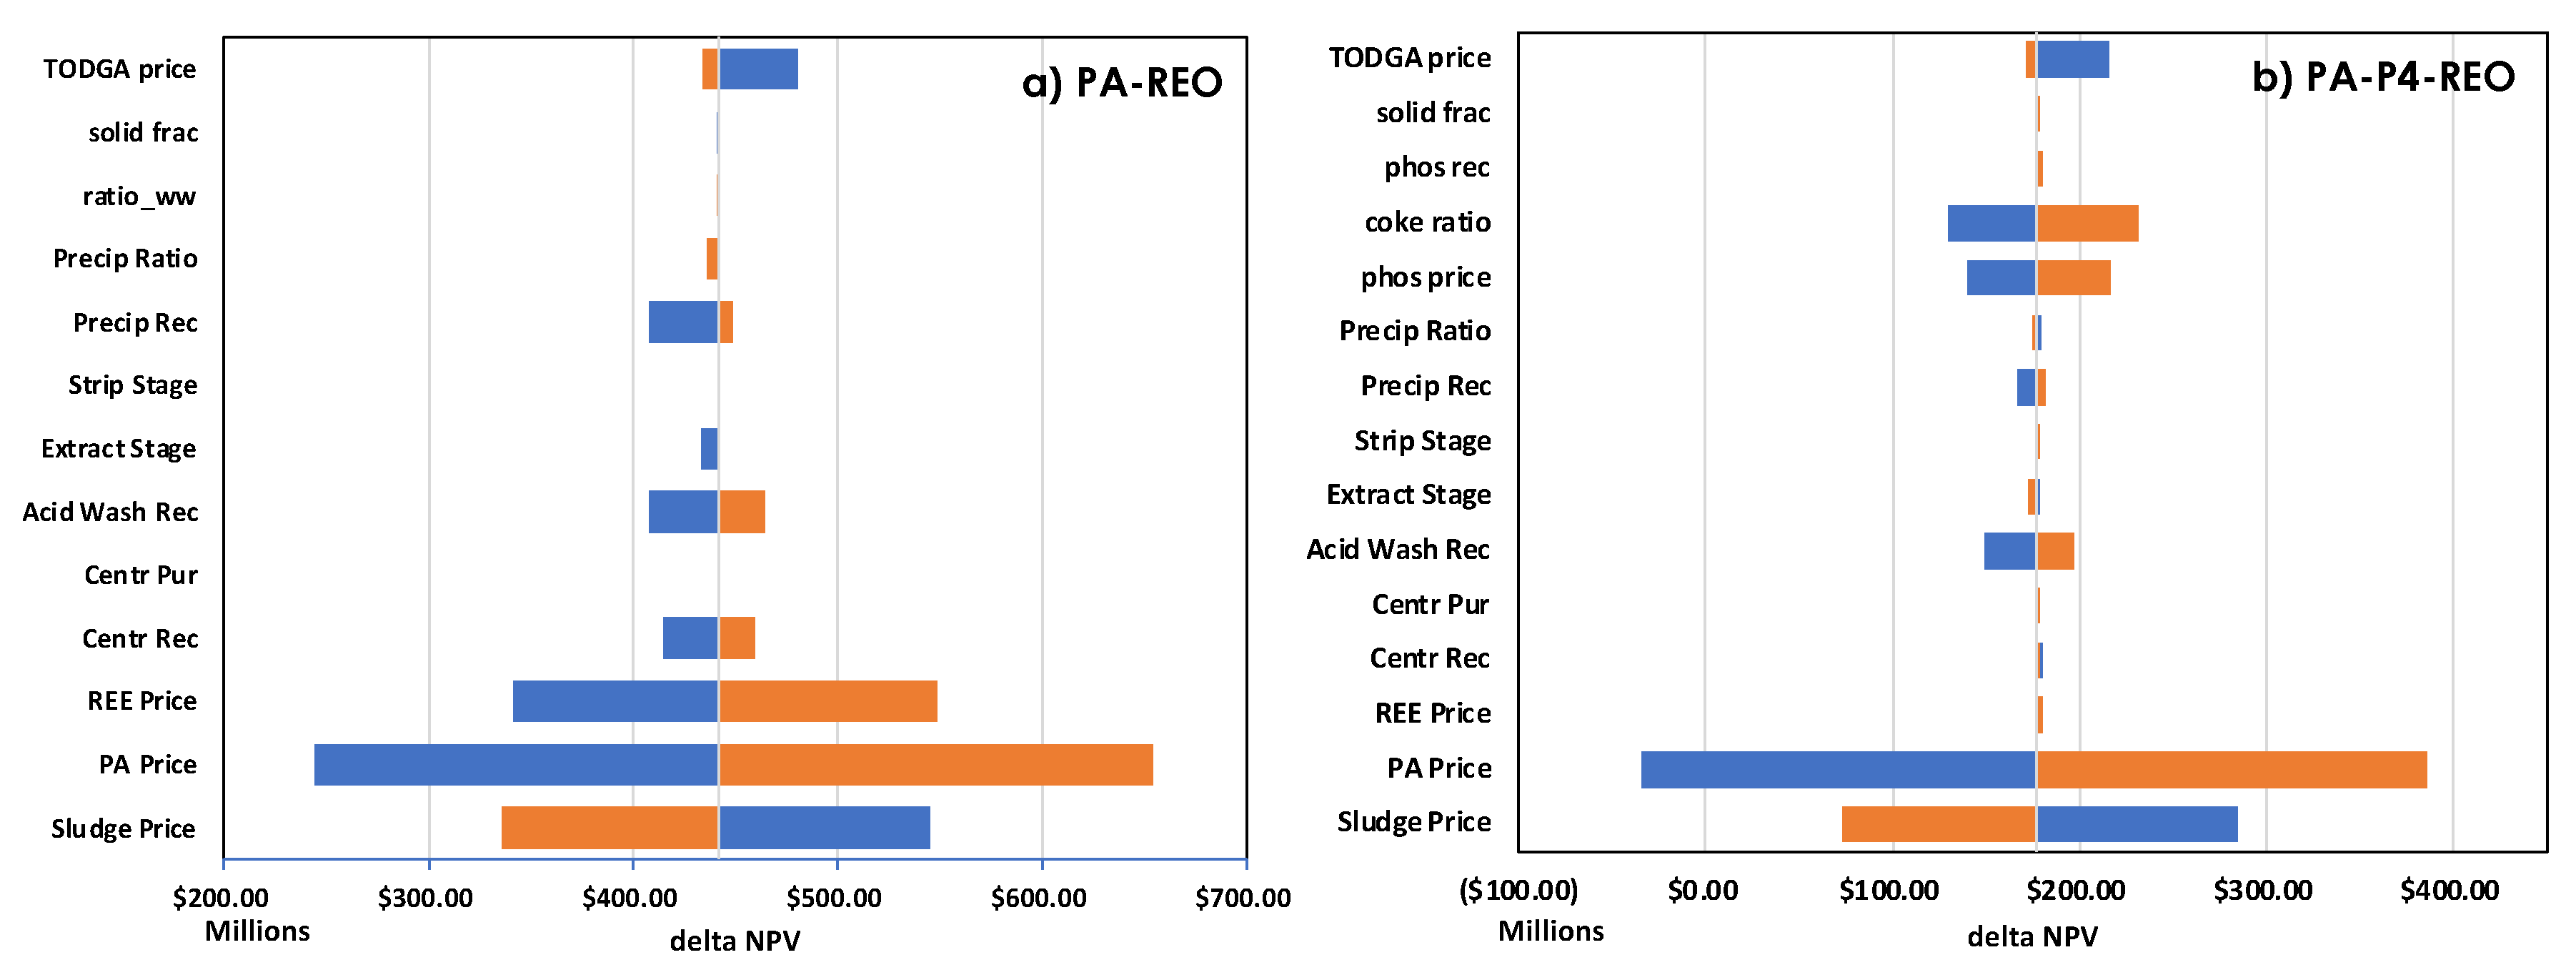
A sensitivity analysis was performed on both scenarios using current pricing of PA, elemental P4 and REO prices for delta NPV. The results of the sensitivity analysis are presented as a tornado plot in Figure 7. The tornado plot clearly shows that three project parameters, i.e., phosphoric acid, sludge, and REE prices, have a significant impact on the profitability of PA-REO project. In contrast, in the PA-P4-REO project, the REE price has a marginal impact due to significantly reduced production amount. The prices of coke and elemental phosphorous also have an impact on the profitability.

4. Conclusions

A decanter centrifuge has been proven successful in continuously separating phosphoric acid and rare-earth element (REE)-containing particles from phosphoric acid sludge, achieving efficiencies of around 95% for phosphoric acid and 90% for REEs recovery in a single pass. This breakthrough has led to the proposal of two profitable processes: PA-REO and PA-P4-REO, which aim to reintroduce recovered phosphoric acid into the mainstream product, while producing saleable elemental phosphorous and rare-earth oxide materials. The ∆NPV of the PA-REO process is estimated at $ 441.8 million with a projected investment return a year after process construction. Similarly, the PA-P4-REO process shows a ∆NPV at $178.7 million with the same return period over the next 12 years. TEA indicates that both processes offer promising financial returns despite the need for further processing to extract the REO product.

Supplementary Materials

The following supporting information can be downloaded at the website of this paper posted on Preprints.org.

Author Contributions

Conceptualization, P.Z. and C.T.; methodology, G.J. and J.T.; software, Z.S.; validation, G.J., P.A.P. and Z.Z.; formal analysis, G.J.; investigation, G.J.; resources, P.Z. and C.T.; data curation, G.J.; writing—original draft preparation, G.J.; writing—review and editing, C.T.; visualization, G.J.; supervision, C.T.; project administration, P.Z.; funding acquisition, P.Z. All authors have read and agreed to the published version of the manuscript.

Funding

This work was supported by the Critical Materials Institute, an Energy Innovation Hub funded by the U.S. Department of Energy (DOE), Office of Energy Efficiency and Re-newable Energy, Advanced Manufacturing Office under grant AL-12-350-001. The re-search was conducted at Oak Ridge National Laboratory (ORNL), which is managed by UT Battelle, LLC, for the U.S. DOE under contract DE-AC05- 00OR22725.

Institutional Review Board Statement

Not applicable.

Informed Consent Statement

Not applicable.

Data Availability Statement

Data are contained within the article.

Acknowledgments

This work was supported by the Critical Materials Institute, an Energy Innovation Hub funded by the U.S. Department of Energy (DOE), Office of Energy Efficiency and Renewable Energy, Advanced Manufacturing Office under grant AL-12-350-001. The research was conducted at Oak Ridge National Laboratory (ORNL), which is managed by UT Battelle, LLC, for the U.S. DOE under contract DE-AC05- 00OR22725.

Conflicts of Interest

The authors declare no conflict of interest.

References

  1. Binnemans, K.; Jones, P.T.; Blanpain, B.; Van Gerven, T.; Yang, Y.X.; Walton, A.; Buchert, M. Recycling of rare earths: a critical review. J Clean Prod 2013, 51, 1–22. [Google Scholar] [CrossRef]
  2. Klaus, J.H.D.; Schulz, J., Jr.; Seal, R.R., II; Bradley, D.C. Critical mineral resources of the United States—Economic and environmental geology and prospects for future supply; U.S. Geological Survey: 2017.
  3. Critical Materials Supply Chain: A Situational White Paper U.S. Departement of Energy, Office of Energy Efficiency & Renewable Energy: 2020.
  4. Jang, G.G.; Ladshaw, A.; Keum, J.K.; Zhang, P.; Tsouris, C. Continuous-Flow Centrifugal Solid/Liquid Separation for the Recovery of Rare-Earth Elements Containing Particles from Phosphoric Acid Sludge. Ind Eng Chem Res 2020, 59, 21901–21913. [Google Scholar] [CrossRef]
  5. Jang, G.G.; Ladshaw, A.; Keum, J.K.; Thompson, J.A.; Zhang, P.T.; Tsouris, C. Continuous recovery of phosphoric acid and Rare-Earths containing particles from phosphoric acid sludge using a decanter centrifuge. Chem Eng J 2023, 458. [Google Scholar] [CrossRef]
  6. Wu, S.X.; Wang, L.S.; Zhao, L.S.; Zhang, P.; El-Shall, H.; Moudgil, B.; Huang, X.W.; Zhang, L.F. Recovery of rare earth elements from phosphate rock by hydrometallurgical processes - A critical review. Chem Eng J 2018, 335, 774–800. [Google Scholar] [CrossRef]
  7. <i>Mineral Commodity Summaries, 2019</i>; U.S. Department of the Interior, U.S. Mineral Commodity Summaries 2019; U.S. Department of the Interior, U.S. Geological Survey: 2019.
  8. Argus North American Fertilizer, (23-1) (2023). https://doi.org/www.argusmedia.com/argus-north-america-fertilizer.pdf.
  9. Das, S.; Gaustad, G.; Sekar, A.; Williams, E. Techno-economic analysis of supercritical extraction of rare earth elements from coal ash. J Clean Prod 2018, 189, 539–551. [Google Scholar] [CrossRef]
  10. Fritz, A.G.; Tarka, T.J.; Mauter, M.S. Technoeconomic Assessment of a Sequential Step-Leaching Process for Rare Earth Element Extraction from Acid Mine Drainage Precipitates. Acs Sustain Chem Eng 2021, 9, 9308–9316. [Google Scholar] [CrossRef]
  11. Broutin, P.; Briot, P.; Ehlers, S.; Kather, A. Benchmarking of the DMX (TM) CO2 Capture Process. 13th International Conference on Greenhouse Gas Control Technologies, Ghgt-13 2017, 114, 2561–2572. [Google Scholar] [CrossRef]
  12. Max, S. Peters, K.D.T., Ronald E. West. Plant Design and Economics for Chemical Engineers, 5th ed.; McGraw-Hill Professional: New York, NY, 2002. [Google Scholar]
  13. Liang, H.; Zhang, P.; Jin, Z.; DePaoli, D. Rare earths recovery and gypsum upgrade from Florida phosphogypsum. Miner Metall Proc 2017, 34, 201–206. [Google Scholar] [CrossRef]
  14. Liang, H.; Zhang, P.; Jin, Z.; DePaoli, D. Rare-earth leaching from Florida phosphate rock in wet-process phosphoric acid production. Miner Metall Proc 2017, 34, 146–153. [Google Scholar] [CrossRef]
  15. Lokshin, E.P.; Tareeva, O.A.; Elizarova, I.P. A study of the sulfuric acid leaching of rare-earth elements, phosphorus, and alkali metals from phosphodihydrate. Russ J Appl Chem+ 2010, 83, 958–964. [Google Scholar] [CrossRef]
  16. Rychkov, V.N.; Kirillov, E.V.; Kirillov, S.V.; Semenishchev, V.S.; Bunkov, G.M.; Botalov, M.S.; Smyshlyaev, D.V.; Malyshev, A.S. Recovery of rare earth elements from phosphogypsum. J Clean Prod 2018, 196, 674–681. [Google Scholar] [CrossRef]
  17. Walawalkar, M.; Nichol, C.K.; Azimi, G. Process investigation of the acid leaching of rare earth elements from phosphogypsum using HCl, HNO3, and H2SO4. Hydrometallurgy 2016, 166, 195–204. [Google Scholar] [CrossRef]
  18. Preston, J.S.; Cole, P.M.; Craig, W.M.; Feather, A.M. The recovery of rare earth oxides from a phosphoric acid by-product.1. Leaching of rare earth values and recovery of a mixed rare earth oxide by solvent extraction. Hydrometallurgy 1996, 41, 1–19. [Google Scholar] [CrossRef]
  19. Sulphuric acid Price Trend and Forecast. Available online: https://www.chemanalyst.com/Pricing-data/sulphuric-acid-70#:~:text=The%20cost%20of%20Sulphuric%20Acid,the%20end%20of%20the%20quarter.&text=In%20the%20second%20quarter%20of%202022%2C%20Sulphuric%20Acid%20prices%20were,in%20the%20Asia%20Pacific%20market (accessed on 23 May 2023).
  20. Lutke, S.F.; Oliveira, M.L.S.; Waechter, S.R.; Silva, L.F.O.; Cadaval, T.R.S.; Duarte, F.A.; Dotto, G.L. Leaching of rare earth elements from phosphogypsum. Chemosphere 2022, 301. [Google Scholar] [CrossRef] [PubMed]
  21. Yuan, H.T.; Hong, W.X.; Zhou, Y.S.; Pu, B.S.; Gong, A.J.; Xu, T.; Yang, Q.S.; Li, F.K.; Qiu, L.N.; Zhang, W.W.; et al. Extraction and back-extraction behaviors of 14 rare earth elements from sulfuric acid medium by TODGA. J Rare Earth 2018, 36, 642–647. [Google Scholar] [CrossRef]
  22. Ansari, S.A.; Pathak, P.; Mohapatra, P.K.; Manchanda, V.K. Chemistry of Diglycolamides: Promising Extractants for Actinide Partitioning. Chem Rev 2012, 112, 1751–1772. [Google Scholar] [CrossRef] [PubMed]
  23. Ejaz, M. Separation of Trace Concentrations of Tantalum from Niobium and Some Other Heavy-Metal Ions by Extraction with N-Oxide of Trioctylamine. J Radioanal Chem 1975, 27, 67–75. [Google Scholar] [CrossRef]
  24. Derek Brigham, L.D., David DePaoli Lipophilic diglycolamide compounds for extraction of rare earth metals from aqueous solutions. June 22, 2019.
  25. Nawab, A.; Yang, X.B.; Honaker, R. Parametric study and speciation analysis of rare earth precipitation using oxalic acid in a chloride solution system. Miner Eng 2022, 176. [Google Scholar] [CrossRef]
  26. Chi, R.; Xu, Z. A solution chemistry approach to the study of rare earth element precipitation by oxalic acid. Metall Mater Trans B 1999, 30, 189–195. [Google Scholar] [CrossRef]
  27. Zhang, H.G.; Wang, L.G.; Xu, Y.C. Design research of efficient vacuum-type rotary drum filter. Key Eng Mater 2011, 480-481, 1246–1250. [Google Scholar] [CrossRef]
  28. Weber, L.L., Tyler; and Alzubairi, Abdullah. An Economic Analysis of the Extraction of Rare Earth Elements from WPPA Sand Tailings Waste Stream; University of Tennessee, Knoxville: 2015.
  29. Miranda, M.M.; Bielicki, J.M.; Chun, S.; Cheng, C.M. Recovering Rare Earth Elements from Coal Mine Drainage Using Industrial Byproducts: Environmental and Economic Consequences. Environ Eng Sci 2022, 39, 770–783. [Google Scholar] [CrossRef] [PubMed]
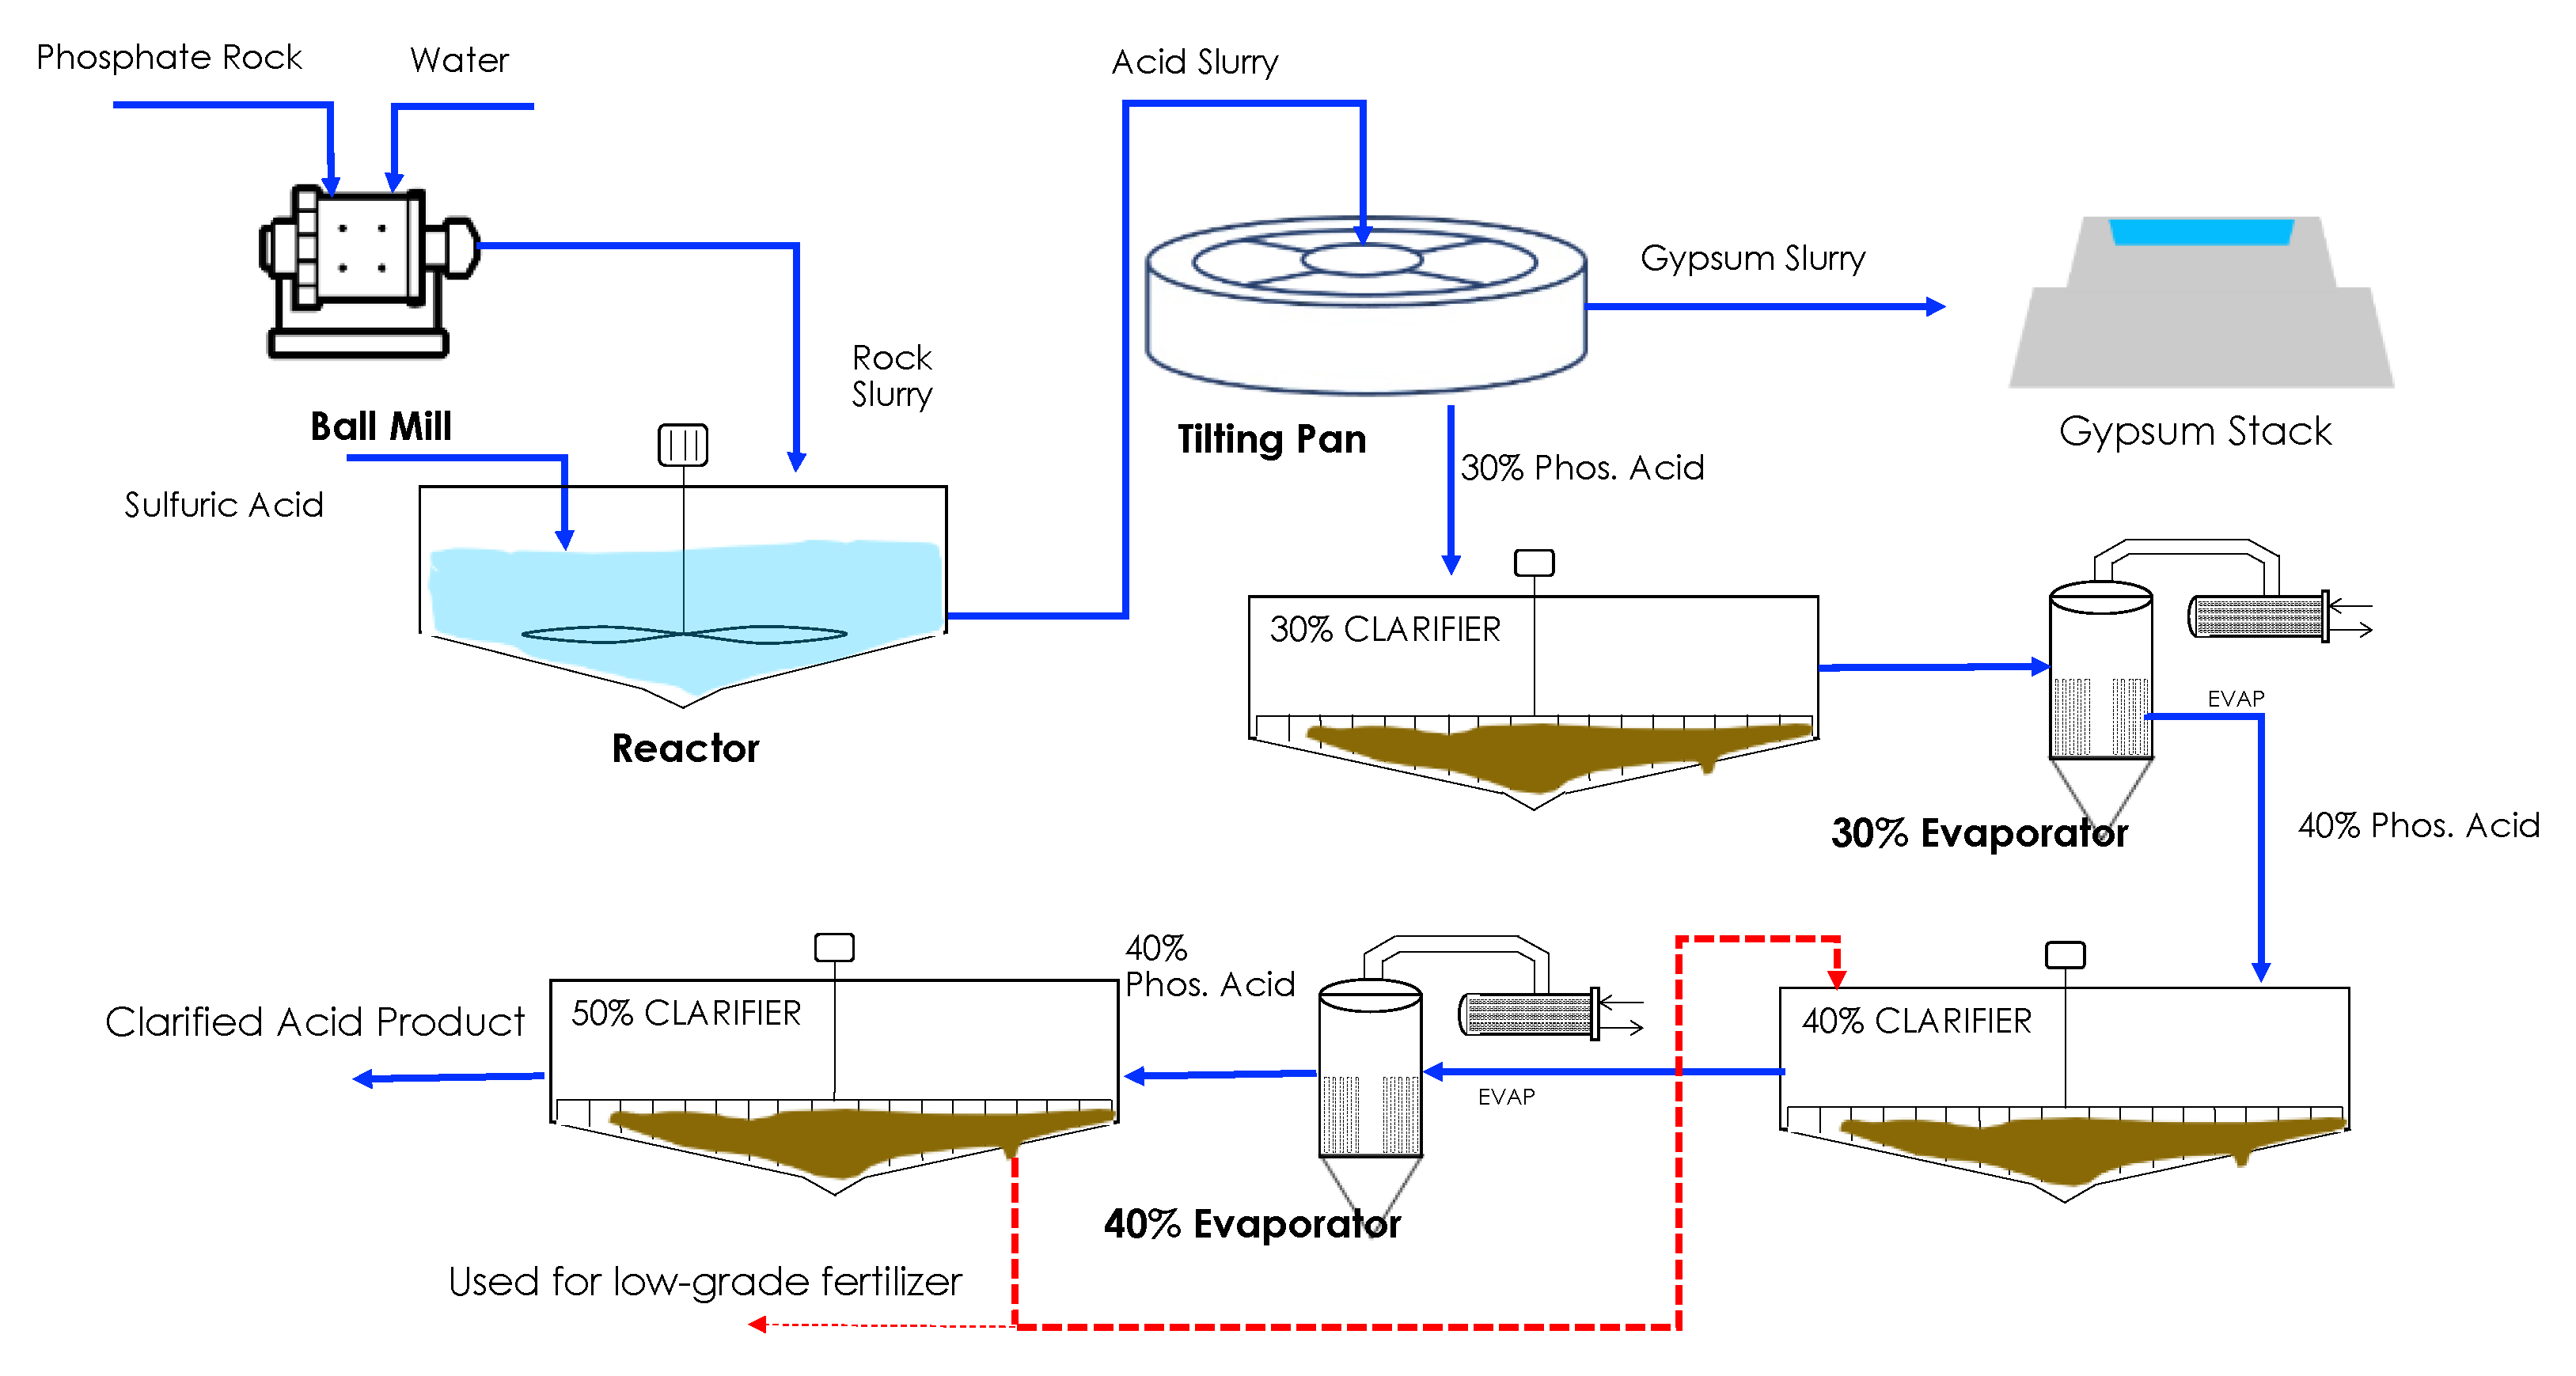
Figure 1. A general process of phosphate treatment for phosphoric acid production (Mosaic Company, USA).
Preprints 111174 g001
Figure 2. Process flow diagram for REEs recovery using a continuous-flow decanter centrifuge. A) Scenario 1: Production of phosphoric acid and REEs oxide (REO) product with REEs mass balance; b) Scenario 2: Production of phosphoric acid, elemental phosphorus and REEs oxide product with mass balance description. The REEs basket price of both PA-REO and PA-P4-REO processes was assumed at $256 /kg of REEs when using contemporary oxide prices.
Preprints 111174 g002aPreprints 111174 g002b
Figure 3. Mass balance for a single pass through the continuous-flow decanter centrifuge for solid/liquid separation of the phosphoric acid sludge.
Preprints 111174 g003
Figure 4. (a) Solid removal efficiency over time with solids concentration of 26–35 wt.%. Results are from runs 1–7 on Table S1 [Supporting Information]. (b) Solid concentration effect on total power consumption and operating capacities. (c) Feed flowrate effects on solid/liquid recovery efficiency. The feed solids concentration is 26 wt.%. Results are from runs 4, 5, and 6 on Table S1. (d) Corresponding total power consumptions and operating capacities. (e) Amount of REEs from the separated solid particles and liquid. The feed solids concentration is 30 wt.%. Results are from runs 1 and 2 on Table S1. (f) Fraction of phosphoric acid (P2O5) in the separated liquid and its recovery efficiency as a function of time. The feed solids concentration is 30 wt.%. Results are from runs 1 and 2 on Table S1.
Preprints 111174 g004
Figure 5. a) Revenues from the PA-REO process over a period of 10+2 years. b) Revenues for the PA-P4-REO process over a period of 10+2 years, c) Delta Net Present Value ( NPV).
Preprints 111174 g005
Figure 6. NPV profile over a period of 10+2 years: a) PA-REO process, b) PA-P4-REO process.
Preprints 111174 g006
Figure 7. Tornado plot showing the sensitivity of several key input factors on the delta NPV. a) PA-REO scenario, b) PA-P4-REO scenario.
Preprints 111174 g007
Table 1. Comparisons of REE Recovery Processes.
Method Source (REE amount, ppm) Capacity CAPEX
($)
OPEX REO($/kg) Value of REO ($/kg) Economic
Viability
Critical Factor Ref
Supercritical Extraction Coal ash (270-1480) - - 690-2181 6-557 low Price of REE (i.e., Sc) [9]
Leaching/solvent extraction Acid mine drainage precipitation (1103-1669) 1 mt REE/yr 2.6-3.4 million 3400-5900 - Very low Process improvement
Market change
[10]
Nano-fluid extraction Geothermal Brine
(0.25)
6800
gal brine/ min
6.8
million
468 - low REE conc. /price, electromagnet price
Need co-production other valuable material
[11]
Our study
(PA-REO)
Solid in PA sludge
(1000-3000)
431,000
mt/yr
7.1
million
71 256 Promising Co-production of PA
Our study
(PA-P4-REO)
Solid in PA sludge
(1000-3000)
431,000
mt/yr
7.5
million
551 256 Promising Co-production of PA and elemental P
Table 4. CAPEXs of equipment for the two operational scenarios presented in Figure 2.
PA-REO ($) PA-P4-REO ($)
Centrifugal Decanter 756,594 756,594
Roster - 882,480
Acid Washer 1,088,849 562,587
Clarifier 161,910 158,047
Extractor 1,670,663 1,638,071
Stripper 464,497 472,427
Precipitator 29,587 27,826
Drum Filter 373,052 352,104
Calciner 22,415 21,648
Total Module Cost 4,567,565 4,871,798
Installation 685,135 730,770
Piping/Materials 685,135 730,770
Buildings 685,135 730,770
Engineering 456,756 487,180
Total Capital Cost 7,079,725 7,551,286
Table 5. OPEX of operating units for both processes (details available in Supporting Information).
PA-REO PA-P4-REO
Category Stream Operating Cost ($/yr) Category Stream Operating Cost ($/yr)
Centrifuge Decanter Electricity 1 43,843 Electricity 1 43,518
Water washing Process Water 2 92,715 Process water 2 93,893
Roster - - - Coke/Air 3 8,405,691
Acid Wash Sulfuric acid/ Electricity 3/4 2,846,754
/69,410
Nitric acid/
Electricity
4/5 11,903,503
/36,435
Extraction TODGA
/Trioctylamine
5a 4,348,734
/113
TODGA/
Trioctylamine
6a 4,298,506
/112
Exxal 13
/Isopropanol
5b 6,049
/6,600
Exxal 13
/Isopropanol
6b 5,979
/6,535
Precipitation Oxalic acid 6 441,637 Oxalic acid 7 314,582
Drum filter Process water & Electricity 7 2,681 Process water & Electricity 8 2,310
Calcination Air & Power 8 21,175 Air & Power 9 14,669
Total 7,879,711 25,125,734
Maintenance &
Repairs
15% Capital 685,135 730,770
Operating Supplies 15% Maint. Rep. 102,770 109,615
Charges 15% Op. Suppl. 15,415 16,442
Labor Operator Salary = $60k 309,240 302,884
Overhead 695,582 717,115
Taxes 91,351 97,436
Insurance 45,676 48,718
Total Operating Costs 9,824,880 27,148,714
Table 6. Levelized operating costs (per kg) of products PA, P4, and REO.
PA-REO PA-P4-REO
54% PA $0.9/mt $0.9/mt
P4 - $4,104.8/mt
Mixed REO (97.4%) $71.0/kg $550.6/kg
Disclaimer/Publisher’s Note: The statements, opinions and data contained in all publications are solely those of the individual author(s) and contributor(s) and not of MDPI and/or the editor(s). MDPI and/or the editor(s) disclaim responsibility for any injury to people or property resulting from any ideas, methods, instructions or products referred to in the content.
Copyright: This open access article is published under a Creative Commons CC BY 4.0 license, which permit the free download, distribution, and reuse, provided that the author and preprint are cited in any reuse.
Prerpints.org logo

Preprints.org is a free preprint server supported by MDPI in Basel, Switzerland.

Subscribe

© 2024 MDPI (Basel, Switzerland) unless otherwise stated