1. Introduction
Mining is the leading industrial activity in the Republic of Kosovo. This research is focused on the analysis of heavy metals in agricultural soils in the vicinity of large mining landfills around the Kizhnica mine (municipality of Gracanica). One of the landfills (10 ha) is active, while two others (70 ha) are inactive yet only partly covered by soil. During rainy periods, the presence of water promotes the leaching of heavy metals from mining waste and can lead to contamination of nearby agricultural soils. Therefore, the range of contamination and its relationship with nearby waste landfills is determined.
The development of industry in Kosovo, primary mining, has had several positive and negative effects for a long time. The negative effects relate to the hazardous impact of industrial waste on the environment, which, in the end, probably has consequences for habitants and their quality of life. The Kizhnica mine is located about 10 km southeast of the city of Prishtina and is rich in lead and zinc ores [
1]. The ore production was increased by implementing flotation whose waste material is disposed on open landfills. Numerous studies [
2,
3,
4,
5,
6] have shown that activities associated with lead and zinc production lead to considerable pollution in the surrounding area. The presence of heavy metals in the soil prevents the agricultural use of the soil because plants absorb heavy metals from the soil. The consummation of such plants brings heavy metals into human organisms. In addition, heavy metals are not degradable, making it extremely difficult to restore polluted soil to its previous state. [
7,
8,
9,
10,
11,
12,
13,
14,
15,
16].
Borgna et al. [
17] investigated the concentration of 12 metals (As, Cd, Co, Cr, Cu, Ni, Pb, Sb, Tl, Th, U, and Zn) in surface soil (0-5 cm) and somewhat deeper soil-layers (5-50 cm) in river-valleys of Iber and Sitnica (north part of Kosovo, area 350 km
2) in 2009. They found an increasing trend in the concentrations of the investigated metals when approaching the ore smelters in Zveçan. The pollution ranged from 15-22 km around Zveçan. The concentrations of Pb, Zn, Cu, As, Cd and Sb were particularly high. The main pollution was in the surface layer; pollution decreased with increasing depth, and at a depth of 2 m, pollution was no longer detected in most areas, while the pollution was still detected in low concentrations near the tailings [
13,
14,
15,
16,
17,
18]. Several studies reported that current levels of lead exposure from mining are extremely high in soil and air [
19,
20,
21]. The authors confirmed that land use is affected by the concentration and distribution of heavy metals in the soil. The polluted land cannot be used for agricultural production, thus reducing the income in the area. The deposition of mining waste in open tailing and the soil is not a viable method because of future environmental costs. Tailings are exposed to weathering, acid mine drainage and mobilization of metals. Weathering and acid mine drainage release the metals in the soil, transporting them further to the surface/groundwater and food web [
14]. In this regard, the mobilization of metals in acid mine drainage become a significant environmental problem for many countries [
21,
22,
23,
24,
25]. The various factors affect the mobilization, deposition and concentration of metals from mining waste [
13,
14]. The pH value, for example, plays an important role in the bioavailability and mobilization of heavy metals. These metals became mobilized into the environment under strong acidic conditions. This means that mining waste provides suitable conditions for metal mobility and bioavailability. The high concentration of heavy metals becomes a potential human health concern due to their hazardous potential, which is linked with direct exposure to the contaminated site. Metals of particular concern for human health are lead, arsenic, cadmium, chromium, copper, nickel, selenium and zinc. Maximum contamination levels for toxic metals present in soil, water and food chains have been set by different organizations such as the United States Environmental Protection Agency (US EPA), World Health Organization (WHO), etc. The limits of heavy metals in soil have been determined through various standard methods of digestion based on the total concentrations of metals [
10,
14,
26]. Different pollution indicators are used to assess metal contamination in the soil, such as the pollution load index (PLI), the geo-accumulation index (Igeo), and the enrichment factor (
EF) [
27,
28].
The previous studies conducted in Kosovo paid more attention to heavy metal pollution in the mining area without considering the spatial distribution of heavy metals in agricultural soil surrounding the tailing waste landfill. This study aims to investigate the distribution of heavy metals in soil in the wider mining-affected area, including mainly agricultural areas close to the mining region in Kizhnica. The main specific objectives are (1) to determine concentrations of heavy metals in the soil around the Kizhnica flotation and evaluate their related ecological risk, (2) to analyze the distribution of heavy metals, and (3) to identify the sources of heavy metals with the use of statistics combined with air dispersion model and environmental assessment.
2. Materials and Methods
2.1. Sampling
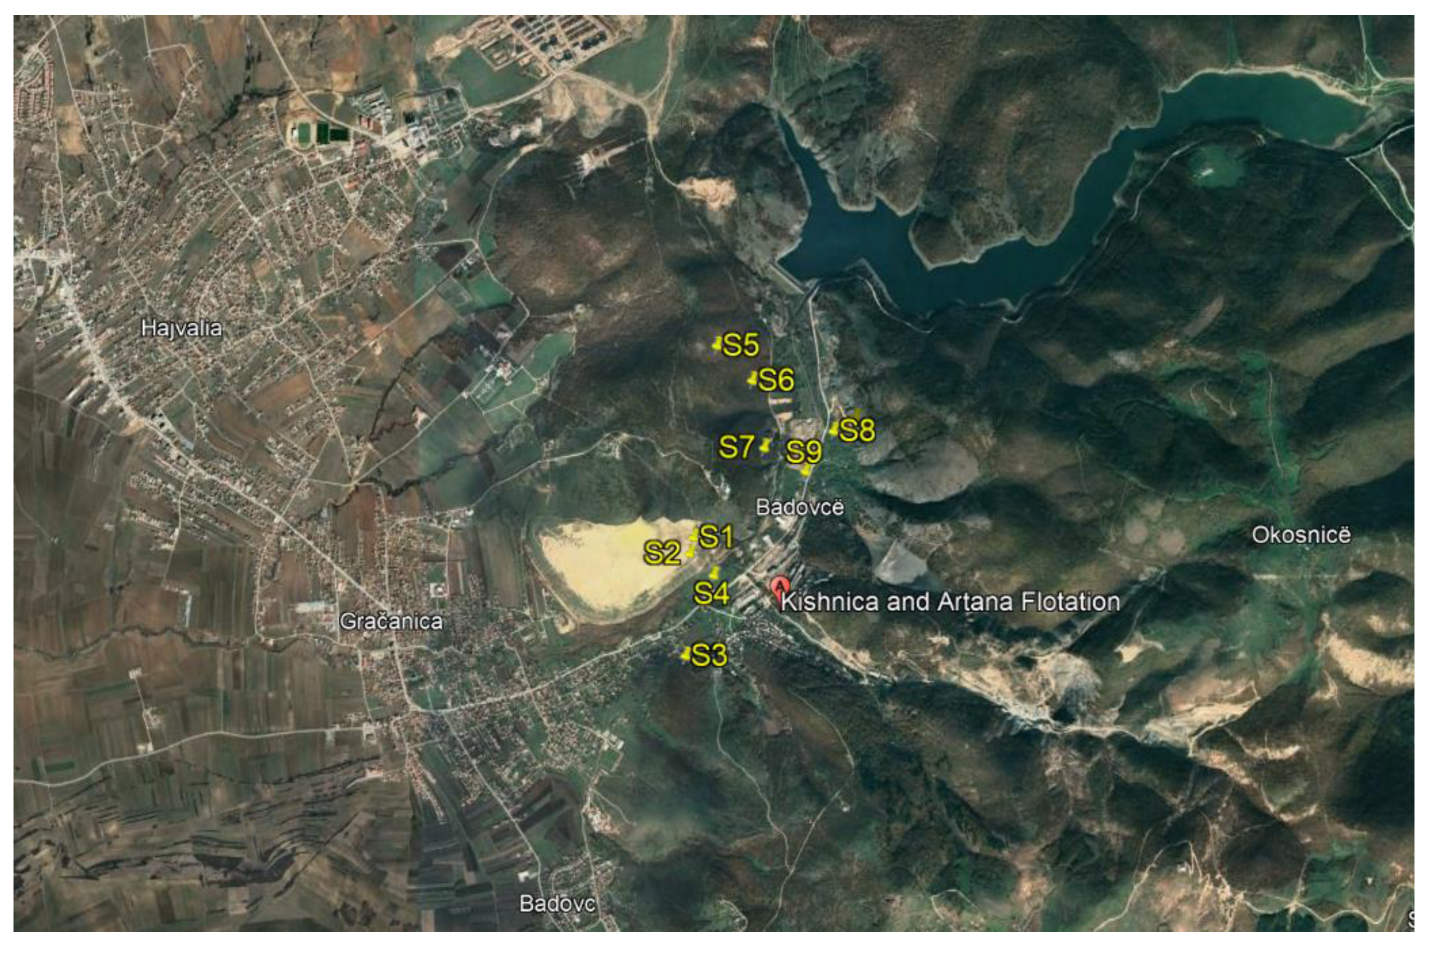
Ten sampling sites close to Kizhnica mining complex were selected in Kizhnica, municipality of Gracanica, Kosovo (
Figure 1). The samples were collected using the soil monster. Before sampling, the area was cleared of grass and plants, and the samples were taken directly from the soil.
2.2. Sample Preparations
After sampling, the samples were taken to the laboratory, air-dried at room temperature, sieved through a 2 mm sieve, mixed and homogenized using the coning and quartering method, and stored in polyethylene containers until analysis. All reagents used in this work were analytical or HPLC grade. The reagents for microwave digestion were as follows: nitric acid (HNO3, 67%) NORMATOM for trace element analysis, supplied by BDH PROLABO, England; hydrochloric acid (HCl, 30%) and boric acid (H3BO3, 99.9999 %) provided by Merck, Darmstadt, Germany; and hydrofluoric acid (HF, 48%) analytical reagent supplied by Fisher Scientific, Germany. All the plastic containers used for the analysis were cleaned by soaking them in 10% nitric acid for 24 h and then rinsed with distilled water before every use. Single-element standard metal ion solutions were used to control and prepare calibration standard solutions. All calibration standards were prepared by appropriate dilution of standard stock solutions (1 g L–1) in the concentration range from 1 to 100 mg L–1.
2.3. Chemical Analysis
Major and minor elements in soil samples were determined after treatment samples by microwave-assisted digestion method (HCl/HF/HNO
3/H
3BO
3) and dissolution in aqua regia. The contents of Pb, Zn, Cu, As, Cd, Ni, Mn, and Sb in soil samples were determined using inductively coupled plasma-optical emission spectrometry (ICP–OES). A Teledyne Leeman Labs (Hudson, NH, USA) Prodigy High Dispersion ICP system is used. Assisted microwave digestion method 3015A (HCl/ HNO
3/ HF/ H
3BO
3) was applied to determine total content of major and minor elements using MARSX XP1500 Microwave Digestion System, CEM, USA. Microwave digestion of 0.30 g soil samples was carried out in two stages using reagents HCl, HNO
3, HF and H
3BO
3. One drop of octanol was added to all prepared samples in order to avoid foaming. Also, three blanks were prepared. After completion of digestion, the samples are cooled at room temperature, diluted with deionized water in 50 ml volumetric flasks, filtered through filter paper and analyzed using ICP–OES. Carbon, hydrogen and nitrogen content were examined by Croatian waste characterization standard [
13,
14]. The carbon, hydrogen and nitrogen content were measured using CHN analyzer 1000 LECO by the ASTM D 5373 standard. The electrical conductivity and pH were measured using a conductivity meter (MA 5964 Iskra, Croatia) and a pH meter (FE20, Mettler Toledo, Switzerland).
2.4. Certified Reference Materials
Certified reference materials (S JR-3 and S Jsy-1) were analyzed to test the accuracy of the applied method for determining total metal concentrations using the microwave digestion method in investigated soil samples. Measured concentrations of elements showed very good agreement with the certified values of reference samples. Statistical comparison of obtained data was performed by two-paired t-test at a significance level of p = 0.05. Calculated t-values of 0.811 (for S JR-3) and 1.117 (for S Jsy-1) were lower than critical value of 2.204, implying the two sets of values for both certified reference standards were not significantly different.
2.5. Mineralogical Analysis
The mineralogical composition of the soil samples was determined by powder X-ray diffraction (XRD-6000, Shizmadu). The diffractometer operated at 40 kV with 30 mA current at room temperature to generate Cu-Kα radiation. The samples were scanned from 5 to 80° 2θ angles. The step size value used was 0.02° with a collection time of 0.6 seconds per step. The furnace temperature was set to different values ranging from 100 °C to 1000 °C.
2.6. Statistical Analysis
The results were analyzed using Statistica (data analysis software), version 14.1.0, Microsoft Office package, Excel 365 and AERMOD. The experimental data analyses were carried out using Pearson correlation coefficient (
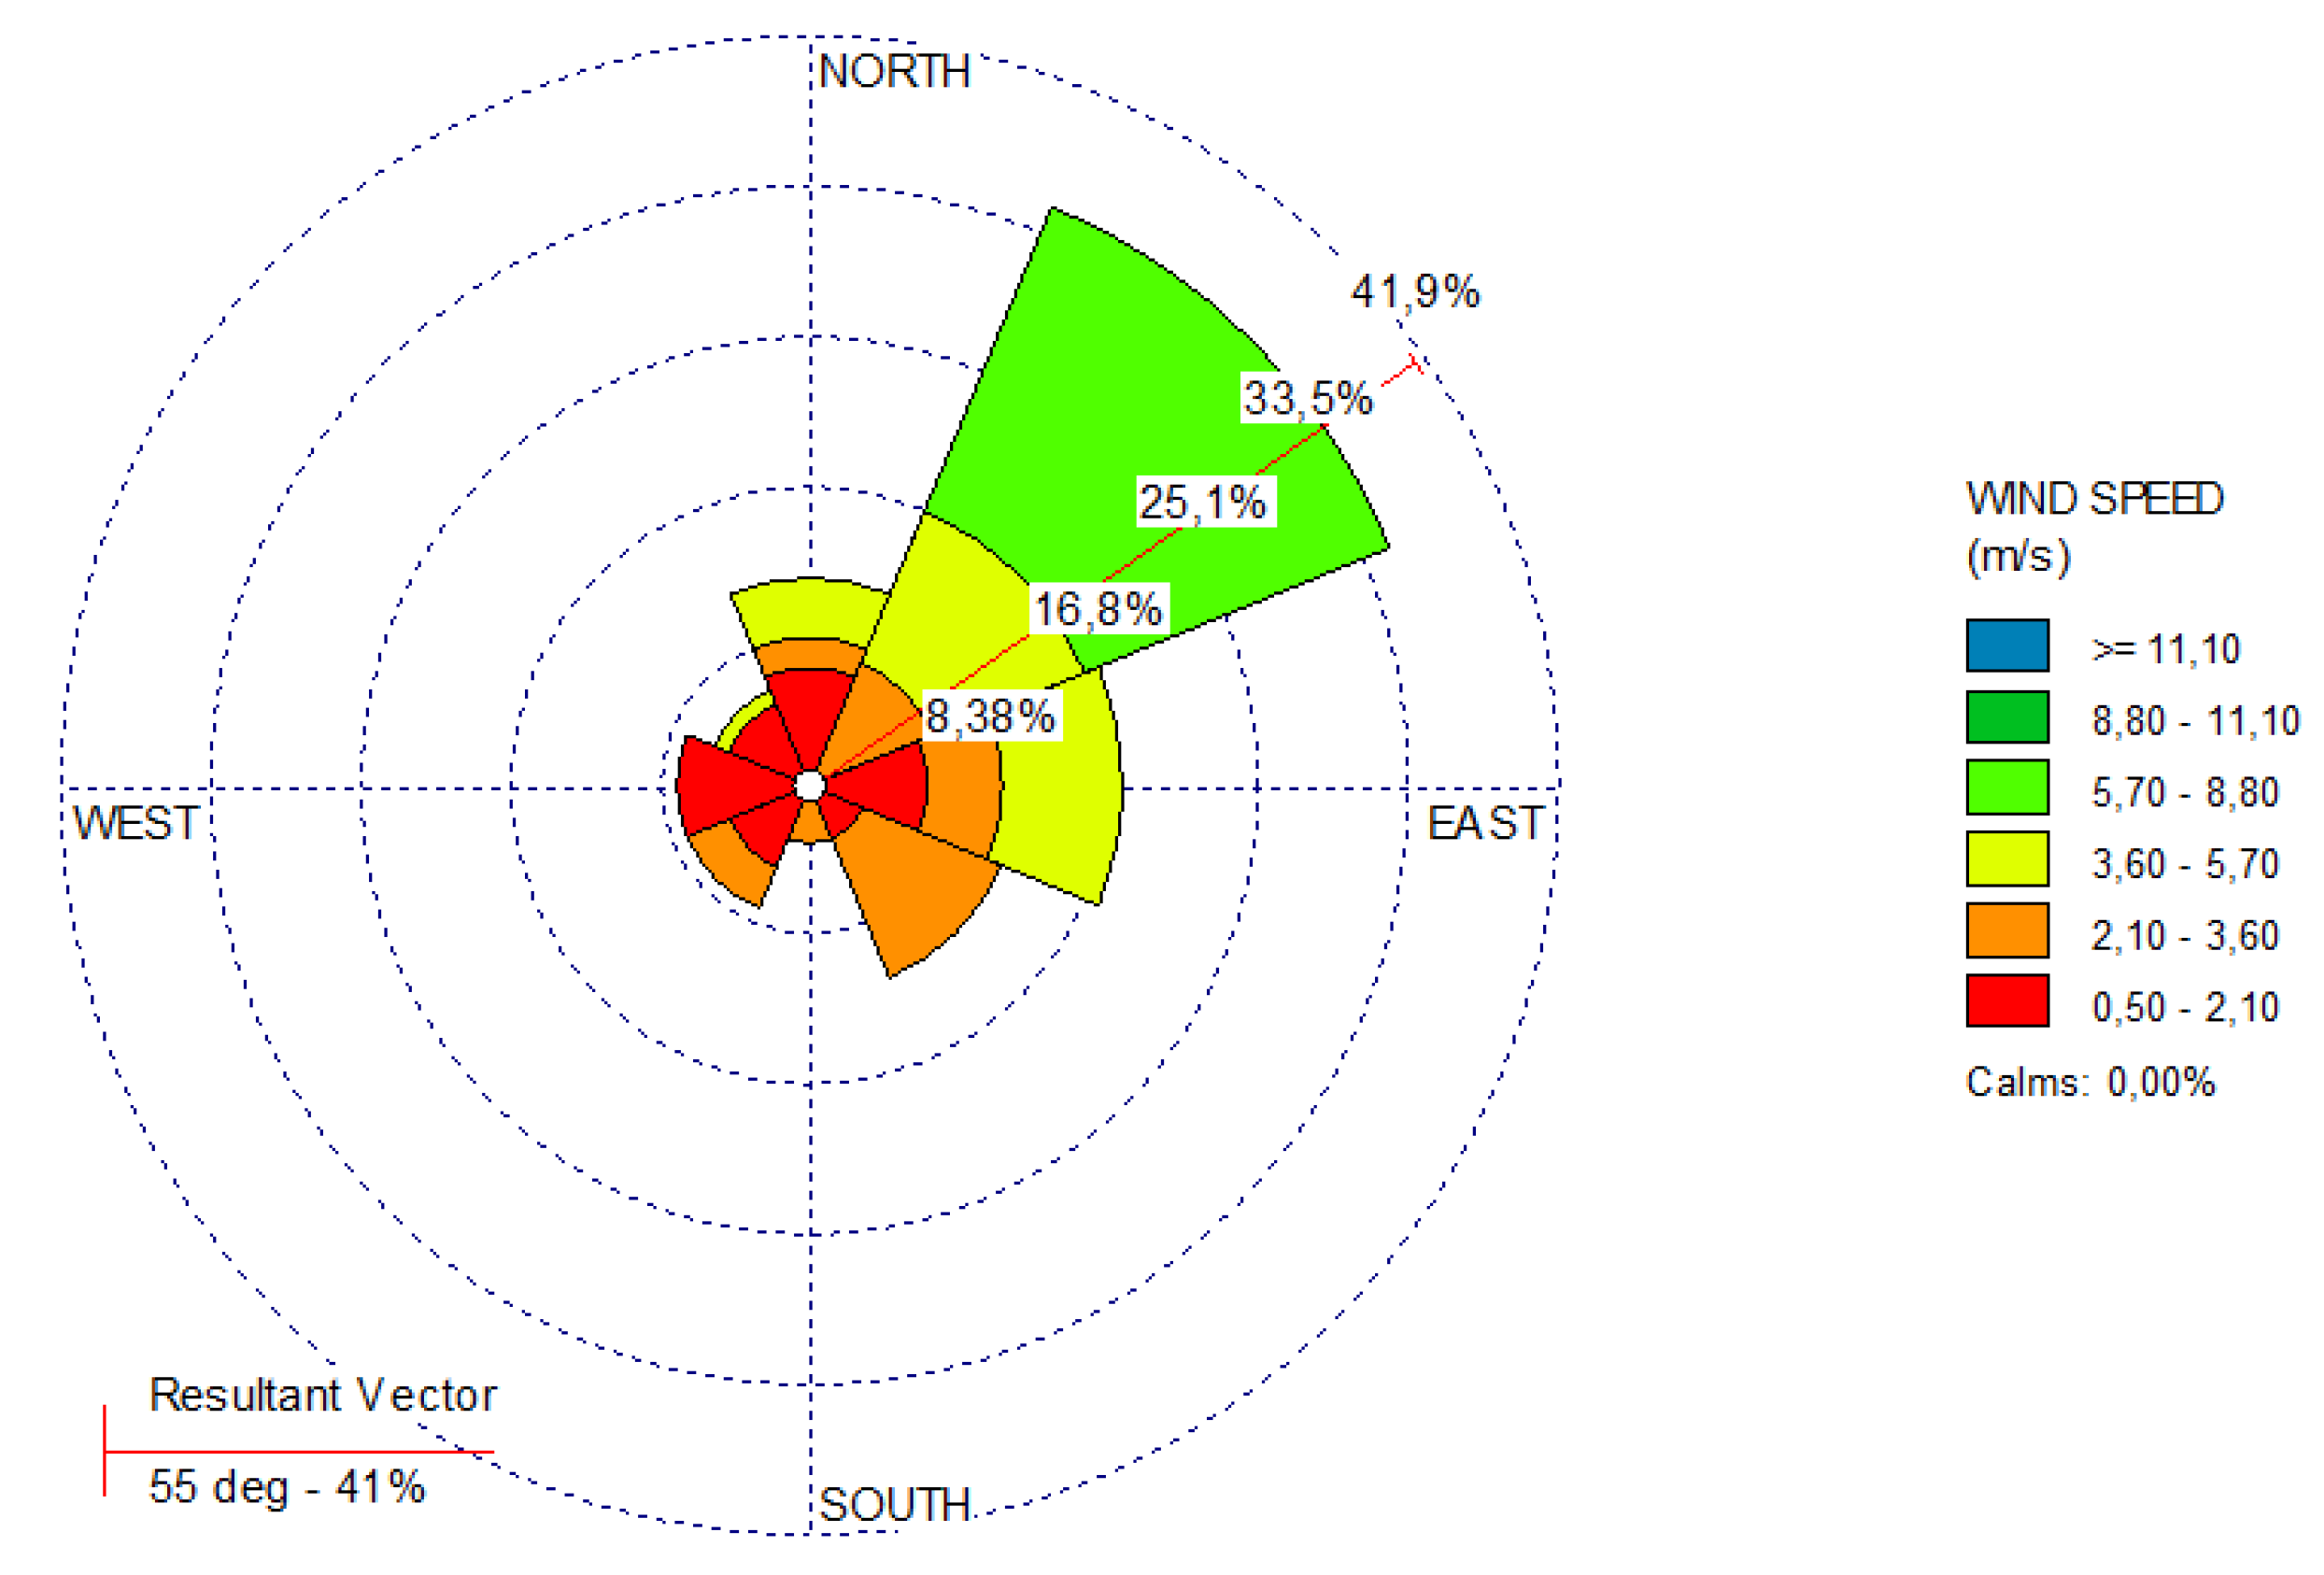
r) and cluster analysis (CA). Relationships among variables were tested using Pearson’s as a non-parametric measure with statistical significance at p < 0.05, while cluster analysis was used to group the heavy metals into the clusters based on their similarities within a group and dissimilarities between the groups. Modeling with the AERMOD View-Gaussian air dispersion model used the meteorological data for the wind velocity, directions, and frequency from Hydrometeorological Institute Kosovo records (
Figure 2). The July, August and September 2023 data were used for the modelling with the program Wind Rose Plot for Meteorological Data, Version 7.0.
In order to calculate the range of pollution and the pollutant concentration at discrete distances from the source, a specialized software package was used. SCREENVIEW, version 3.0 was developed to obtain pollutant concentration estimates for the single source short-term calculations, calculating maximum ground-level concentrations and the distance to the maximum. In this case, the terrain was set to be elevated, and modelling the impacts of simple area sources using a virtual point source procedure was performed [
29]. In this case, the calculation includes the following initial data: Emission Rate, Source Release Height, Surface of the Area of the deposit and Wind Direction. The maximum concentration of the pollutants was estimated to be in the east-west direction from the tailing waste deposit.
2.7. Determination of Contamination Factor
Contamination factor (
CF) for each studied heavy metal was calculated using the eq. (1) to evaluate the pollution of soil samples.
The calculation is based on methodology suggested by Min et al. [
28] and Kerolli-Mustafa et al. [
13].
is the concentration of heavy metal
i in the sample and
Bn is the background or limited value for same heavy metal in soil as per Administrative Instruction No.11/2018.
2.8. Determination of Pollution Load Index
The
Pollution Load Index (PLI) is used to determine the pollution quantity of the analyzed element in the environment, as suggested by Tomlinson et al. [
30]. The PLI was calculated according to eq. (2).
CF presents the contamination factor, while
n is the number of metals.
PLI value greater than 1 indicates contamination [
30].
2.9. Determination of Geo-Accumulation Index
The contamination impact of heavy metals in soil samples was determined using the geo-accumulation index (Igeo) as proposed by Müller [
27]. The assessment focused on the level of metal contamination in seven classes as the index's numerical values increased. This index is calculated according to eq. (3).
Cn is the concentration of the element in the enriched sample, and Bn is the background or limited value of the element.
3. Results and Discussion
3.1. Chemical Analyses
The pH values of soil samples are shown in
Table 1. The initial pH of samples close to the tailing damp was 2.35 and 2.68, while the pH values for other soil samples in the Kizhnica region range from 3.22 to 7.68. The pH value of the samples was from 2.35 to 3.22, which indicates that the samples close to the mining waste had high acidic buffering capacity. This complies with the conclusion of other studies [
1,
13,
14] that under these conditions, the mobility of heavy metals along the depth column from waste was a process that affected the environment on a larger scale. According to the results, the conductivity ranges from 13.5 for Sample 5 to 3160 μS cm−1 for sample 3. Higher values are recorded between sample 2 (2280 μS cm
−1), sample 4 (2620 μS cm
−1) and sample 8 (2060 μS cm
−1) and other samples of soil, where the value of conductivity decreases in sample 5 (13.5 μS cm
−1), sample 10 (25.1 μS cm
−1), sample 7 (72.4 μS cm
-1), sample 9 (125 μS cm
−1), sample 1 (361 μS cm
−1) and sample 6 (530 μS cm
−1). Determining the elemental composition of soil samples showed that the carbon content is generally between 0.94 and 2.71 wt.%, while the hydrogen content differs. The content of hydrogen is higher in sample 1 at 7.39 wt.%. The results showed that the content of nitrogen in soil samples ranges between 0.11 to 0.23 wt.%.
As was previously mentioned in section 2.3., the assisted microwave digestion method was applied for the determination of total metal content in soil samples. In the following
Table 2 the results of metal concentration are presented.
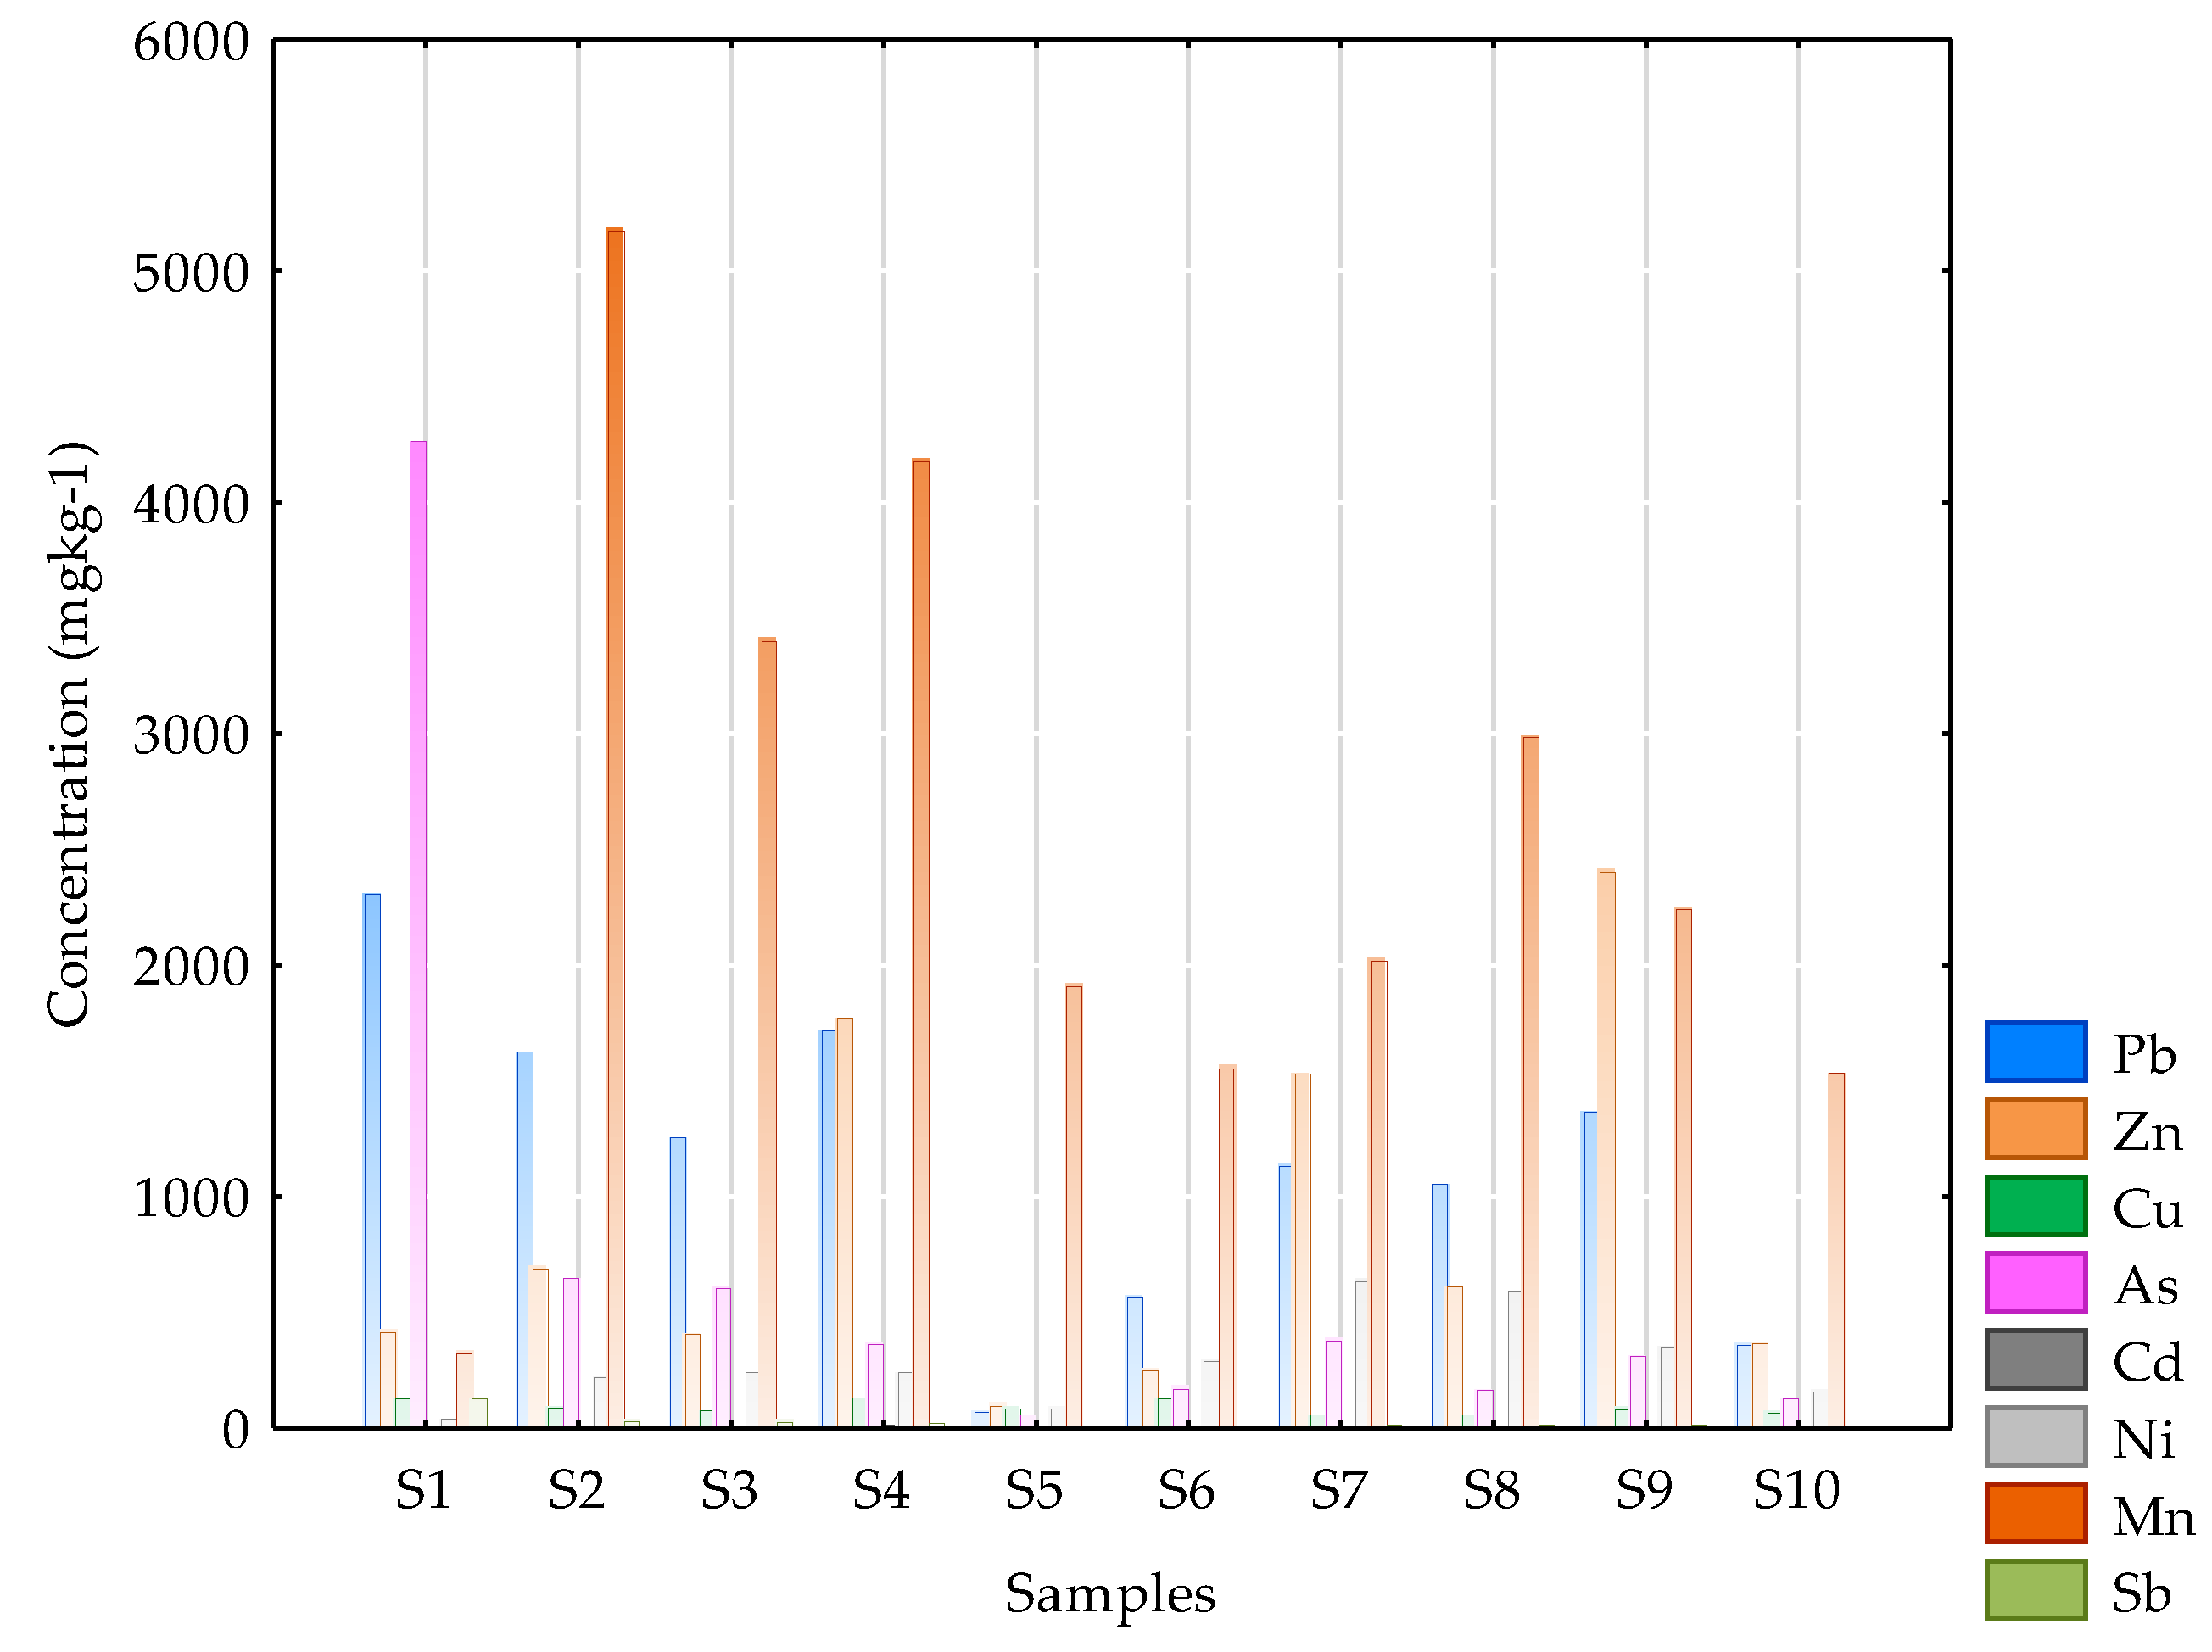
The concentration of eight metals in all 10 soil samples was found in the range of: 67.2- 2304.2 mg kg
–1 (Pb), 95.3 - 2401.1 mg kg
–1 (Zn), 54.0- 128.1 mg kg
–1 (Cu), 127.6 -4260.1 mgkg
–1 (As), 0.1-10.5 mg kg
–1 (Cd), 37.9 - 631.4 mg kg
–1 (Ni), 317.0 - 5171.1 mg kg
–1 (Mn), 2.9 - 125.9 mg kg
–1 (Sb). As can be seen from
Table 2, the concentrations of metals in sample 1 were higher for Pb and As than the concentrations of metals in other samples. As it can be seen by the results, the concentrations of heavy metals in soil samples are higher in the area of tailing deposited waste. Heavy metal concentration in mining and mineral processing tailing waste, as well as other sources, such as weathering, other industrial activities, and traffic, is having a great impact on the environment due to the historical changes in industrial activities in the region [
1,
6]. Therefore, the open tailing dump of mining waste influenced by winds has an important effect on the increase of heavy metal concentration on the surface of an area of Gracanica municipality. The contributions of these different sources are various, and their pollution characteristics might change. In fact, heavy metals are always heterogeneously distributed, and this might be the case for the higher concentration of the metals (including lead, arsenic and zinc) in the surface soil of the analyzed region. Overall, according to the results, samples contained a certain pollutant, which is a heavy burden on the environment. The obtained values for Pb, Zn, As, Cd, and Ni exceed the regulatory limit for heavy metals in soil [
13,
14]. The contamination risk for these metals is still very high due to the low pH and wind effect. The concentration of metal in soil samples was visualized in
Figure 3. This graph shows the level curves of a function of major and minor element variables from two of the
two-dimensional graphs as a function of concentration and location.
3.2. Mineralogical Characterization
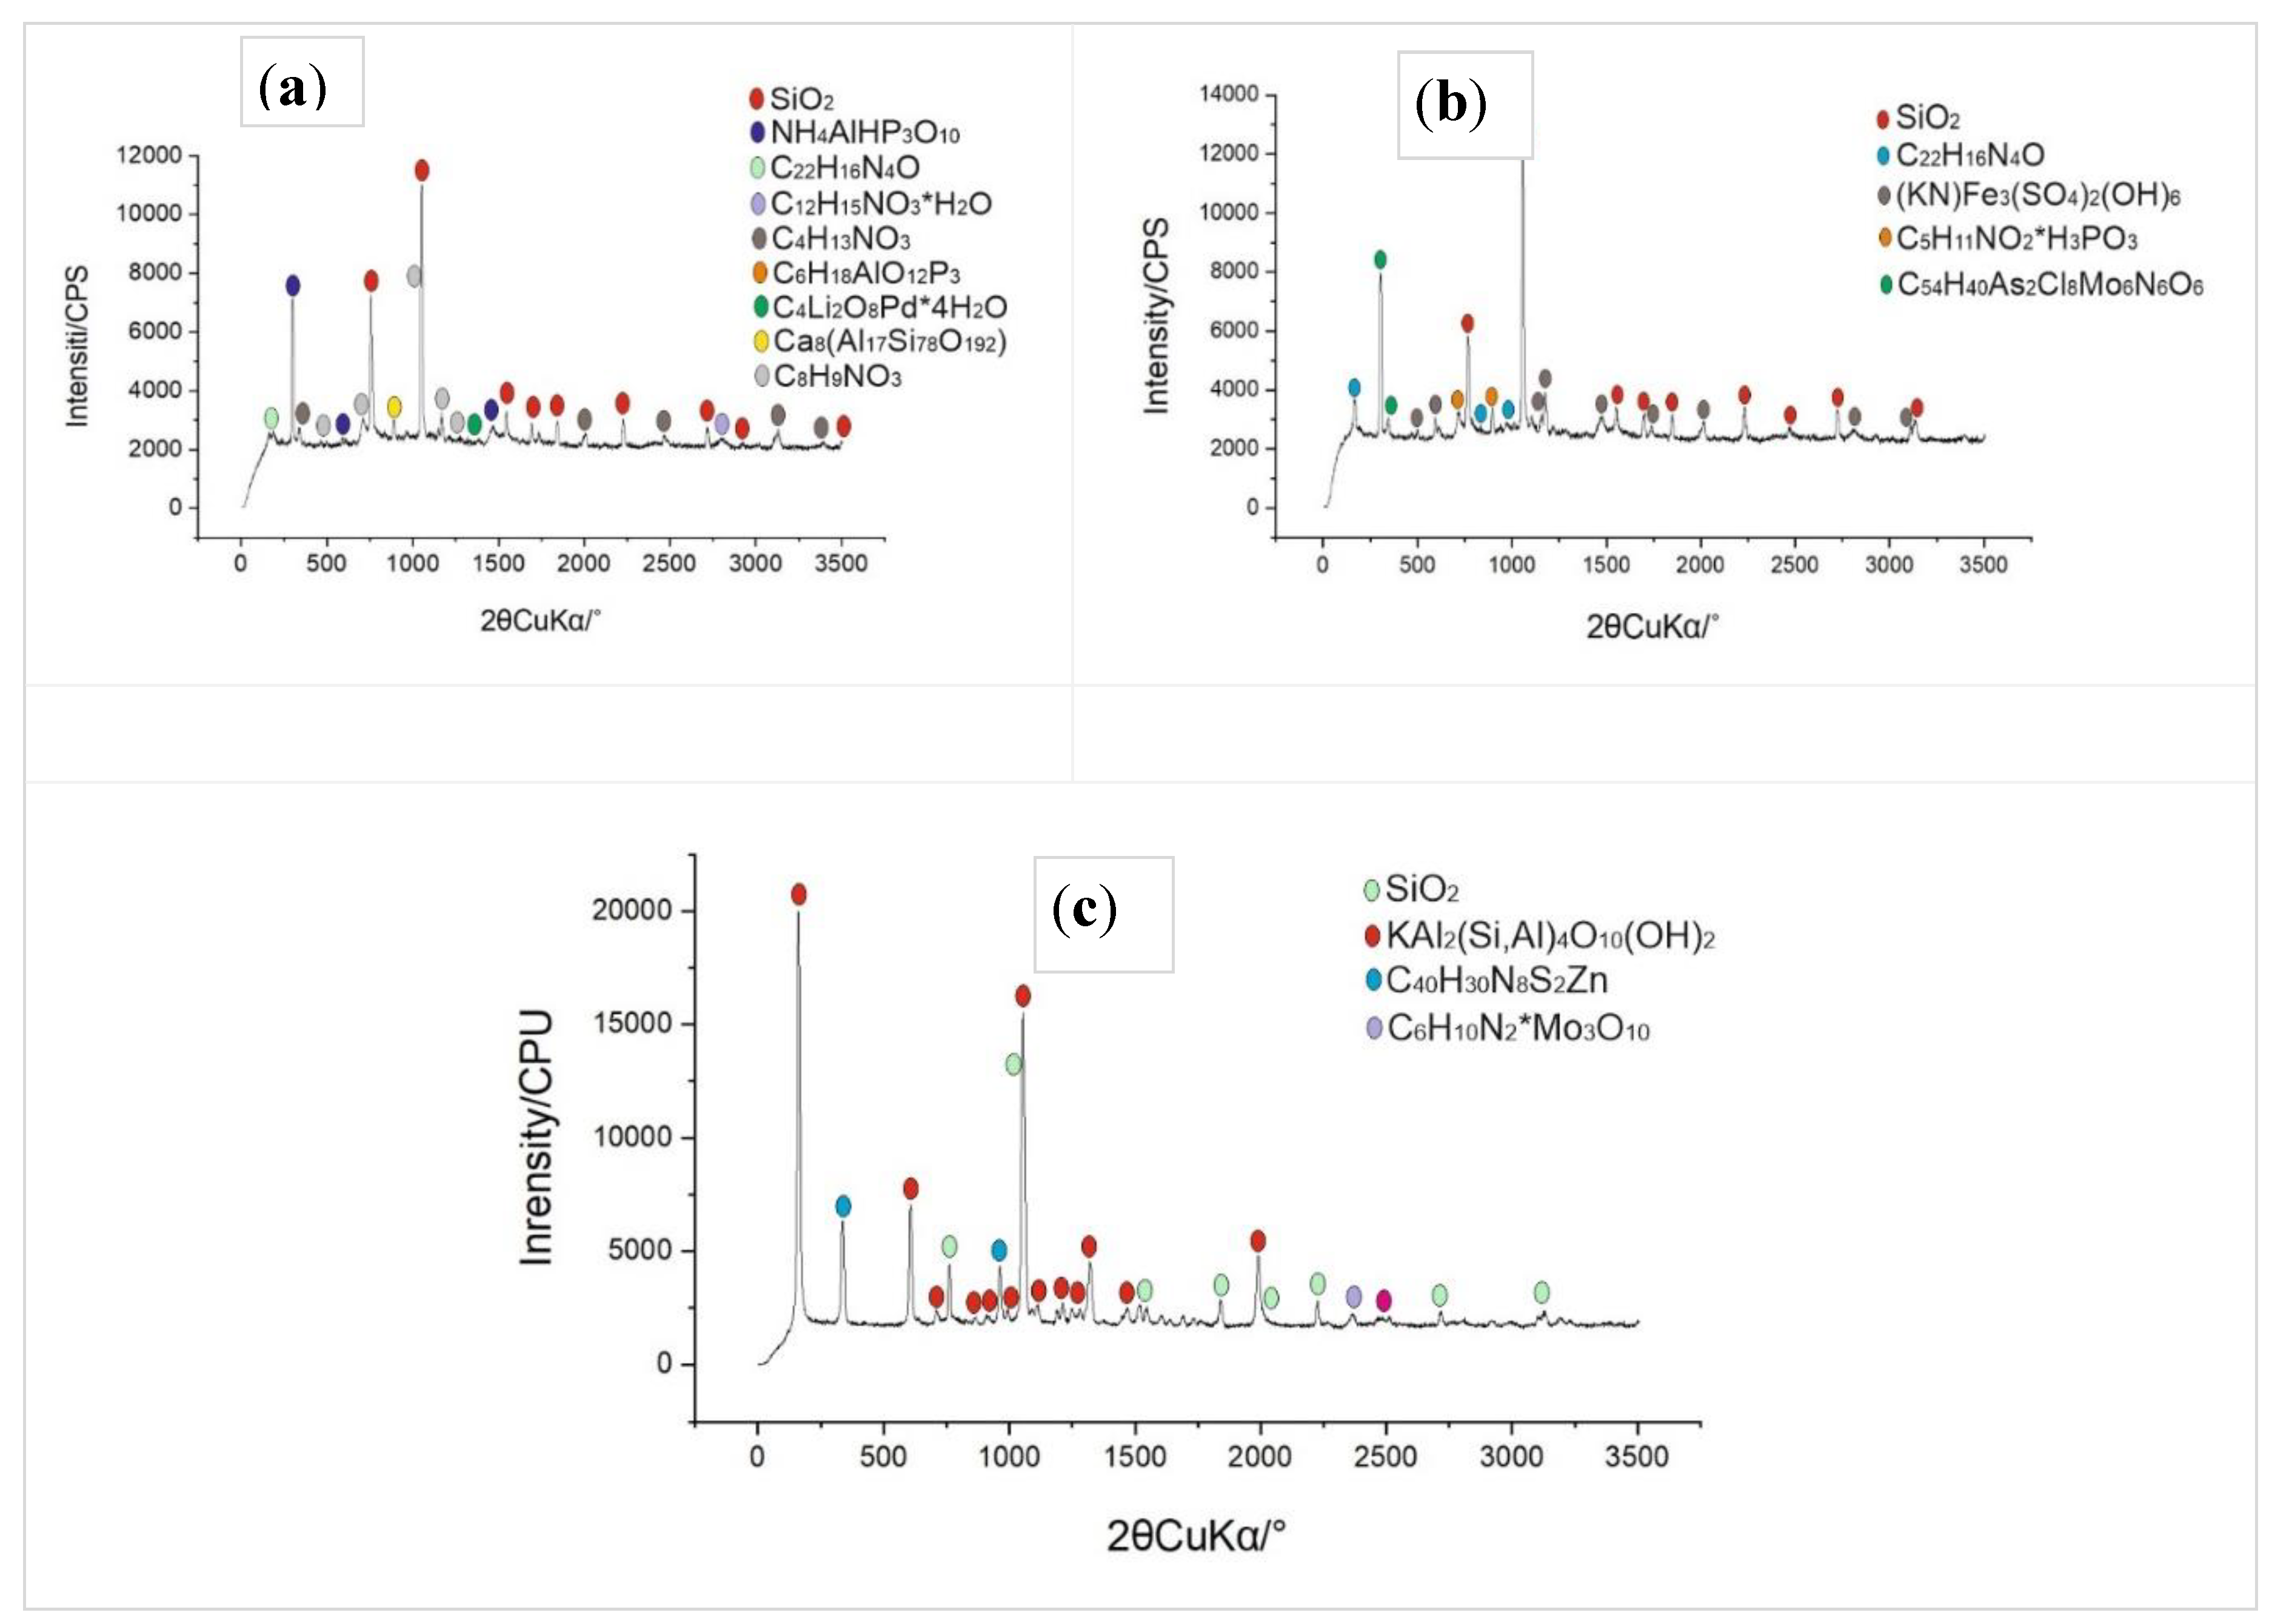
The X-ray diffraction (XRD) patterns for soil samples ((a) composite 1: S1, S2, S4, (b) composite 2: S7, S8, S9, (c) composite 3: S5, S6, S10) were taken in order to confirm the phase composition of samples. A combined study using different characterisation techniques is applied in order to better understand the structure and the composition of investigated samples. XRD patterns of original samples indicated that the major components of soil waste are quartz and other dominant faze, which include minerals of Al, Si, and K, as shown in
Figure 4. There are strong peaks assigned to the C, H and N groups in all samples. In other samples, the presence of Fe, As and Mo, P, Li, Pd, Na, Al, NO groups, Cu, and Zn can be confirmed, but the presence of organic compounds is also shown in different places.
Silica, betaine phosphate, azobenzenes, ammonium triphosphate, and ash are mostly detected in the XRD graphs of the samples located at the tailing waste deposit (
Figure 4 (a)), with Chalcedonite and Jarosite included in the XRD graph of the samples located on the Northeast and Southeast of the deposit. On the opposite side, diffractometry for the samples taken from the elevated locations (
Figure 4 (c)) showed quartz, mica (muscovite), Chalk (Chalcosine), and organic compounds. The analyses show that the XRD method has constraints in detecting lower concentrations of elements, however it confirms the source of the heavy metals in soil.
3.3. Statistical Analyses
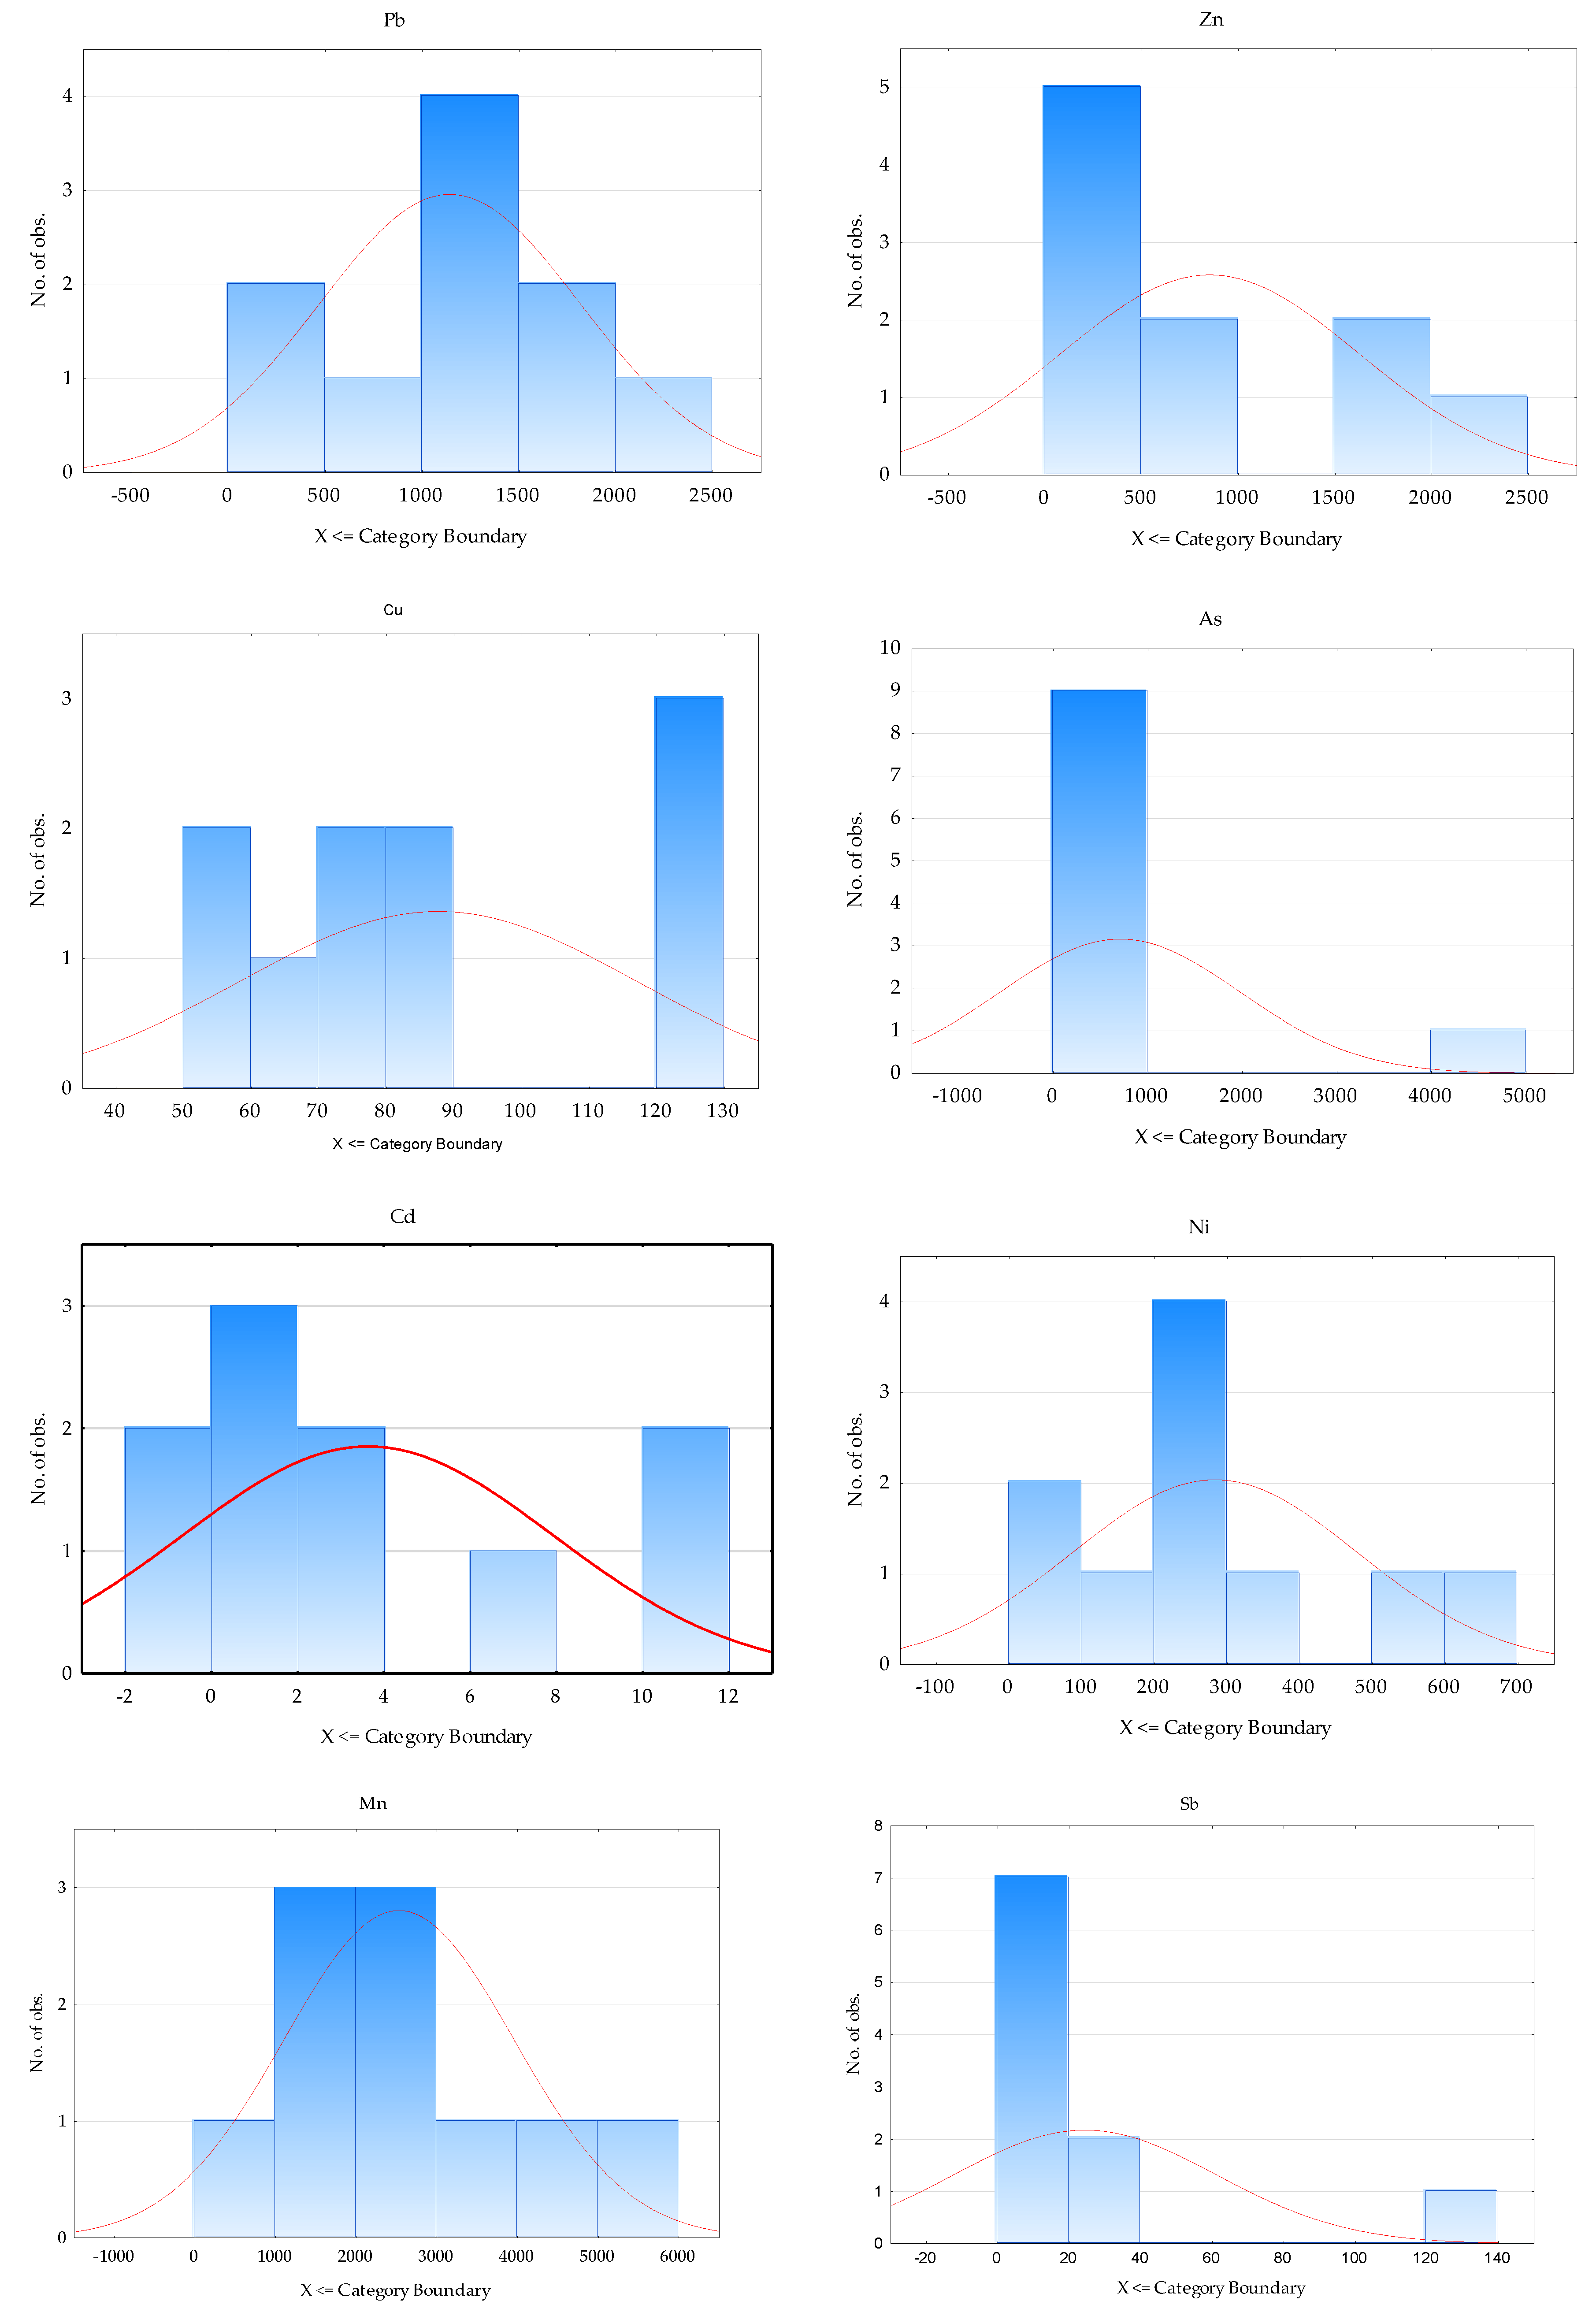
The Pareto charts are used to verify the effects of each operational variable presented in
Figure 5. In the figure, the bars extending to the vertical line corresponded to the effects of a 95% confidence level. As can be seen from the figure in all the evaluated responses with element concentration in soil samples, it displayed the concentration effects and value of the effects and drew a reference line on the chart. Any effect that extends over this reference line is potentially important. Analysis of the individual factors on the Pareto chart showed that concentration was statistically significant since they overshot the critical value line (reference line). The interactions for the majority of elements do not differ much from the normal distribution.
In this study, explanatory data such as correlation matrix and cluster analysis were employed in order to obtain relevant data information about the main variables (concentration of metals) of ten soil samples collected in Kizhnica. Eight variables (metal concentrations) were compared to find similarities and metal distribution. This fact is supported by the use of Pearson’s correlation coefficient analysis, which can be used to measure the degree of correlation between the concentration of the major and minor elements in the investigated samples. Statistical analysis of the soil samples revealed several links between elements of interest. The similarity shown between elements refers to the same source of origin and the same mobility entrance in the environment. The correlation matrix (
Table 3) between the elements of interest indicates a strong positive correlation of Zn with Pb, As and Pb. Cd showed a strong positive correlation with Zn, while Ni showed a strong correlation with Cd. Sb showed a strong correlation with Pb and As.
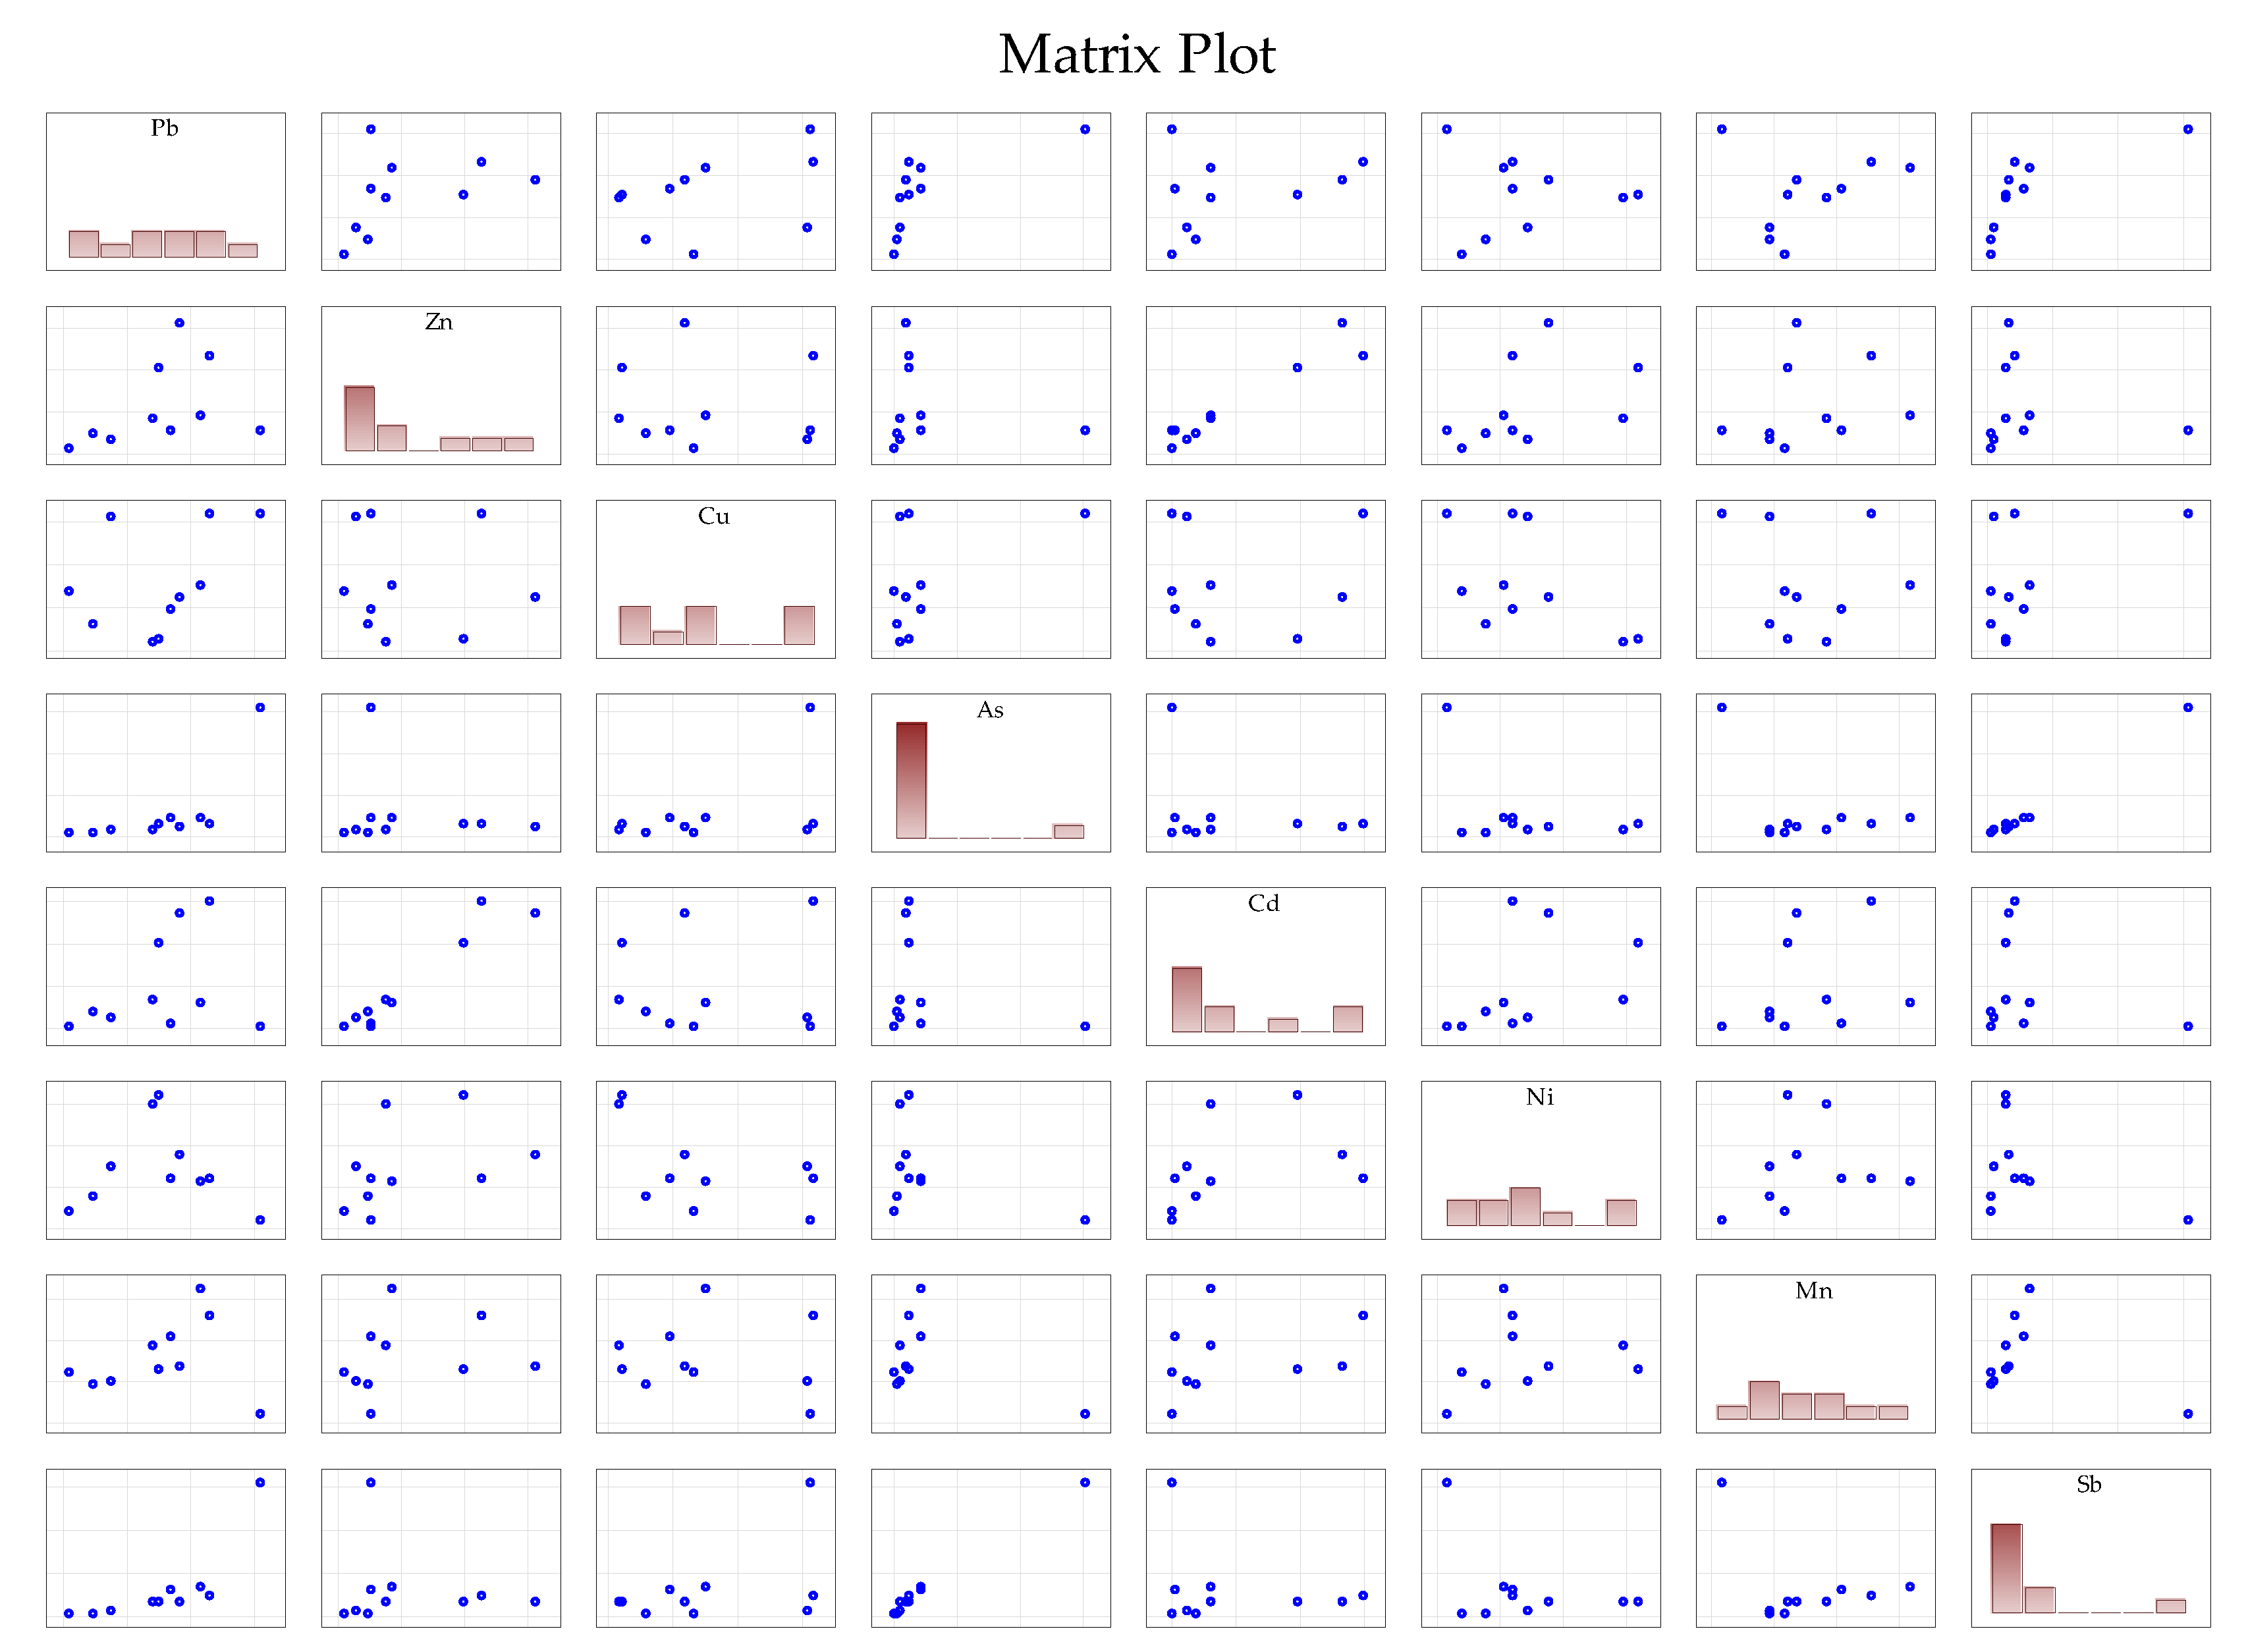
In general, the Pearson correlation coefficient used to analyze the correlation between elements in the investigated samples showed a very positive correlation between major and minor elements in soil samples coming from a common source of pollution and very much influenced by pH and conductivity. The matrix plot for investigated elements is presented in
Figure 6.
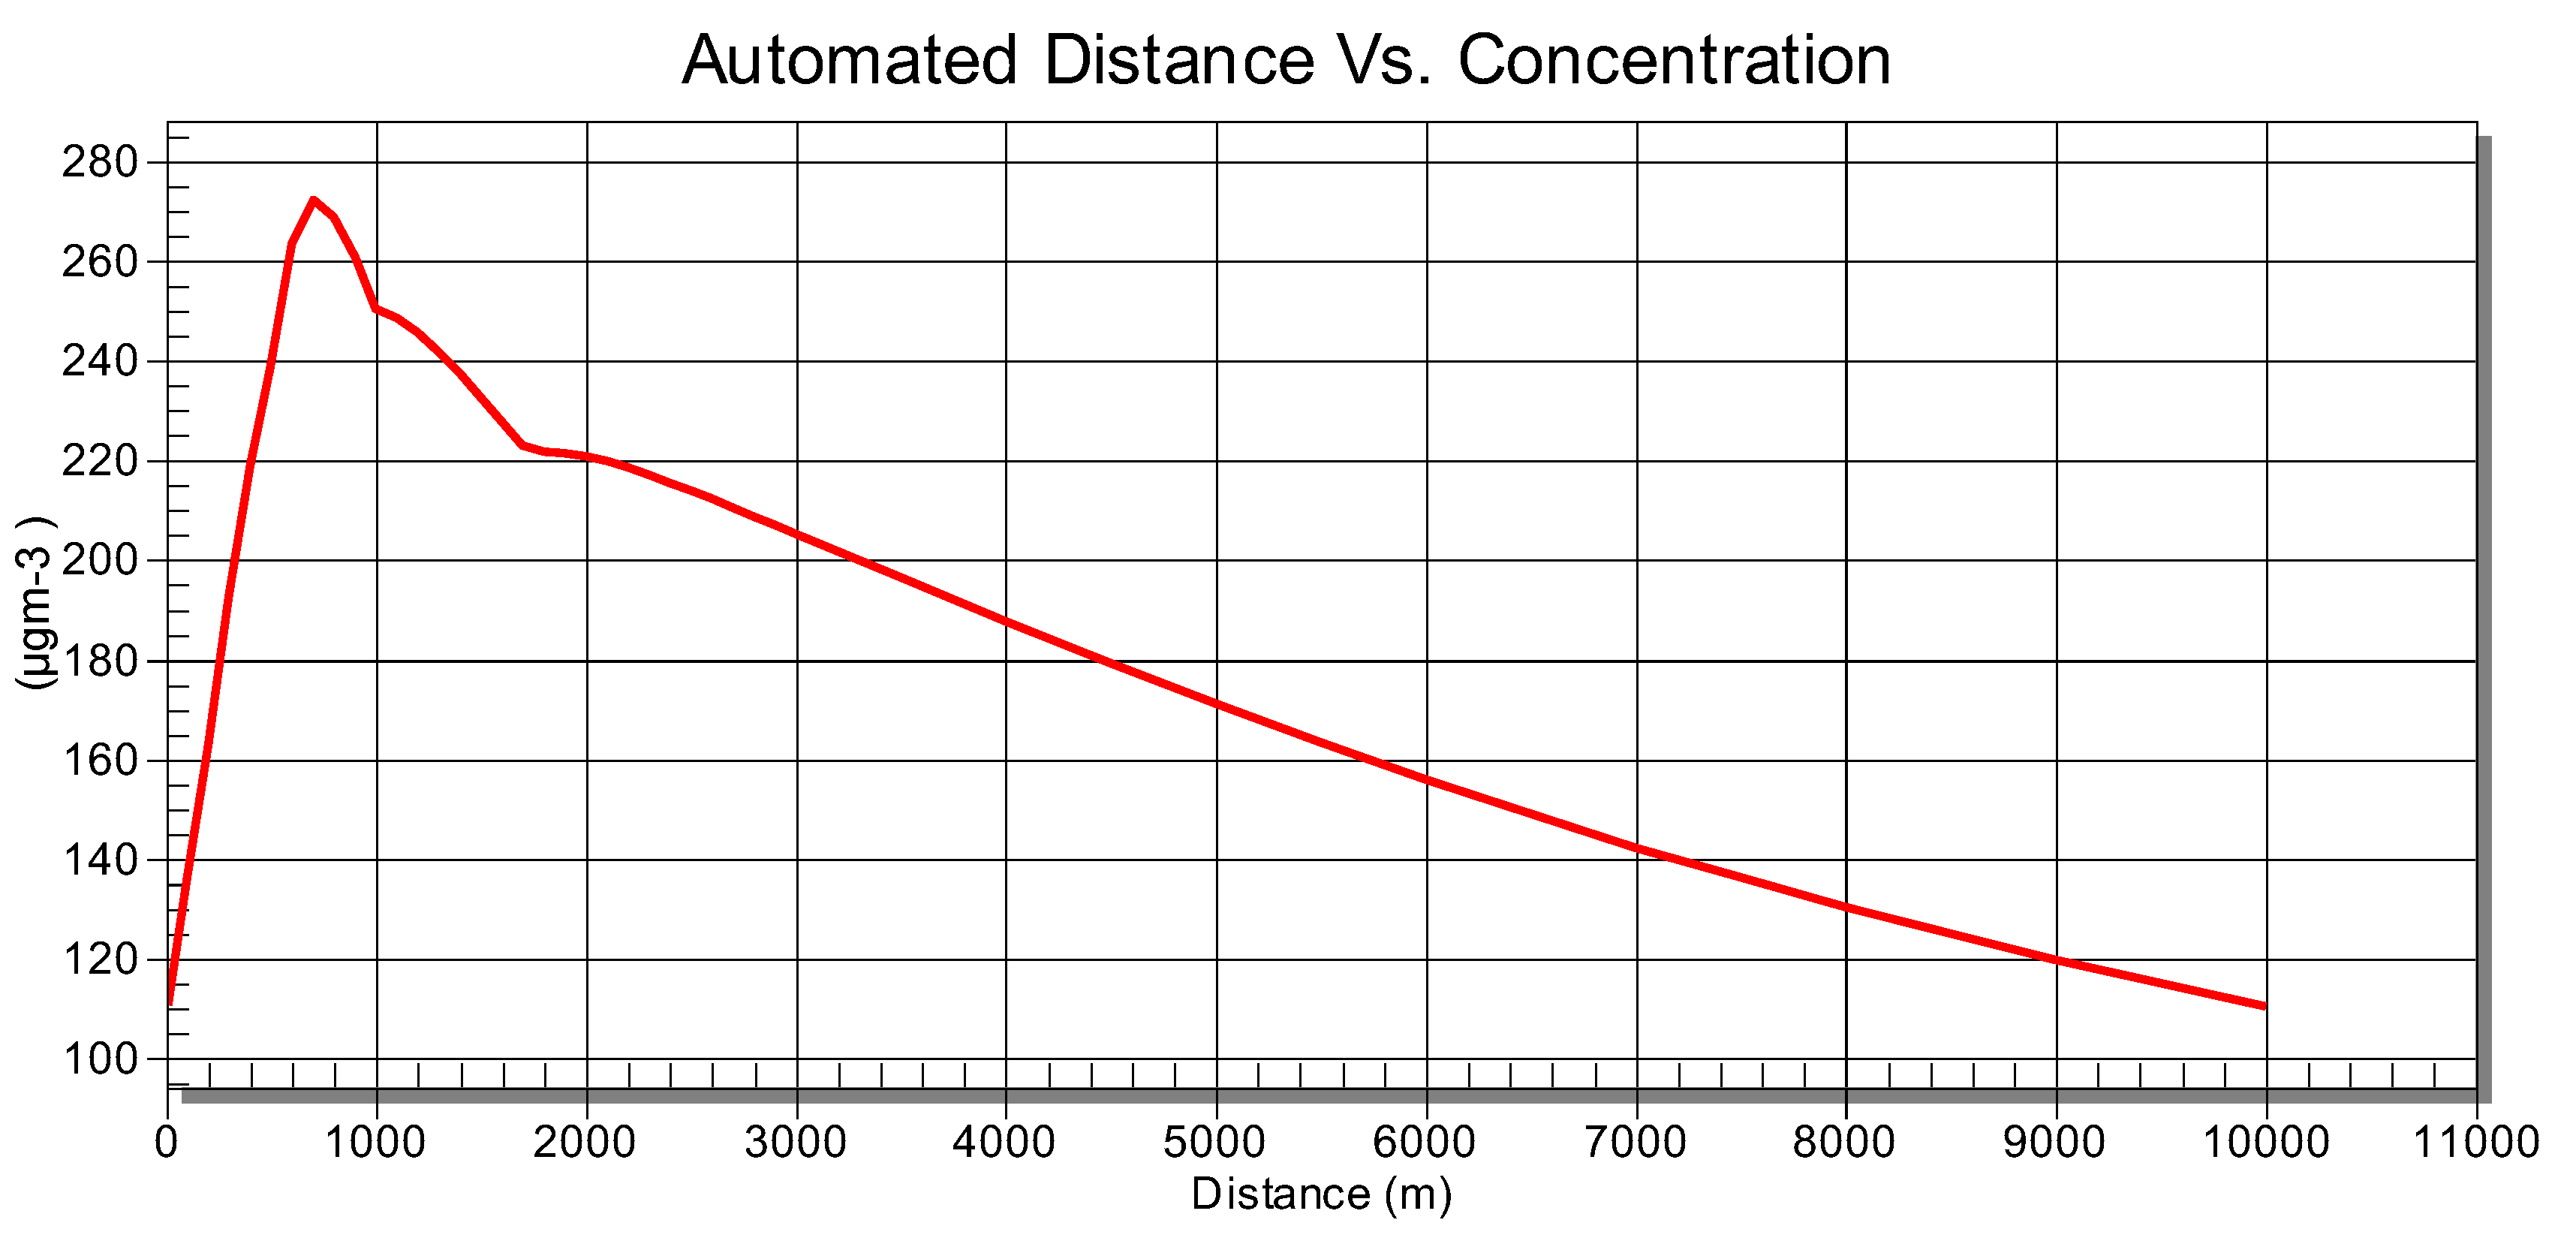
Severe air pollution occurs in the Kizhnica region, covering the whole area of the Gracanica. Two industrial waste deposits from mining and metallurgy production are being blown with the wind and scattered in an area covering more than 10 km. Wind class IV, wind speed 8.8-11 m s
−e in the East-West direction, as calculated to be a resultant vector for the given location for the summer season ( July, August and September), according to the data collected from the Hydrometeorological Institute Kosovo and downwind direction relative to long dimension of 45 degrees, the results are presented in
Figure 7.
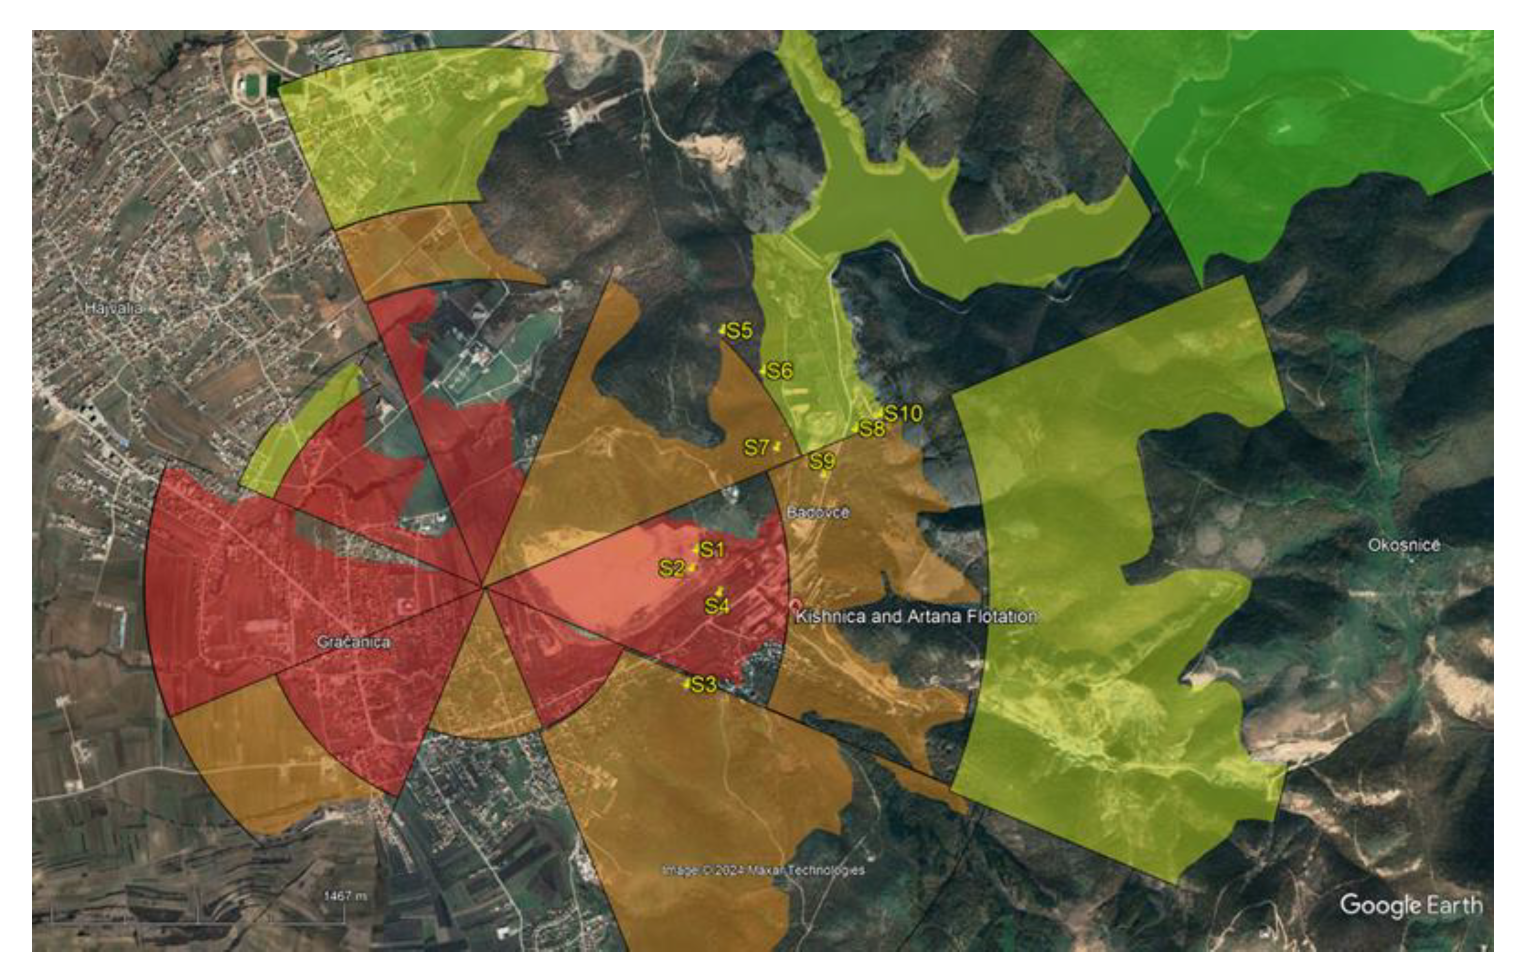
The pollutants settle in a large area, polluting the soil and being distributed throughout the region. There is a significant heavy metal-containing mining waste deposit in Kizhnica (
Figure 8.)
As observed in
Figure 8., heavy metals bearing particles of tailing waste deposit are scattered in the area. Samples S1 and S2 are at the tailing waste deposit, and S4 is in line with the predominant wind direction during the dry summer weather conditions, showing the highest concentrations. Samples S3, S7, S8, and S9 are located in the Northeast or Southeast directions, showing lower heavy metal concentrations than the samples directly exposed to the strongest winds. Samples S5, S6, and S10 are located on the elevated terrain and protected from air dispersion by the hills.
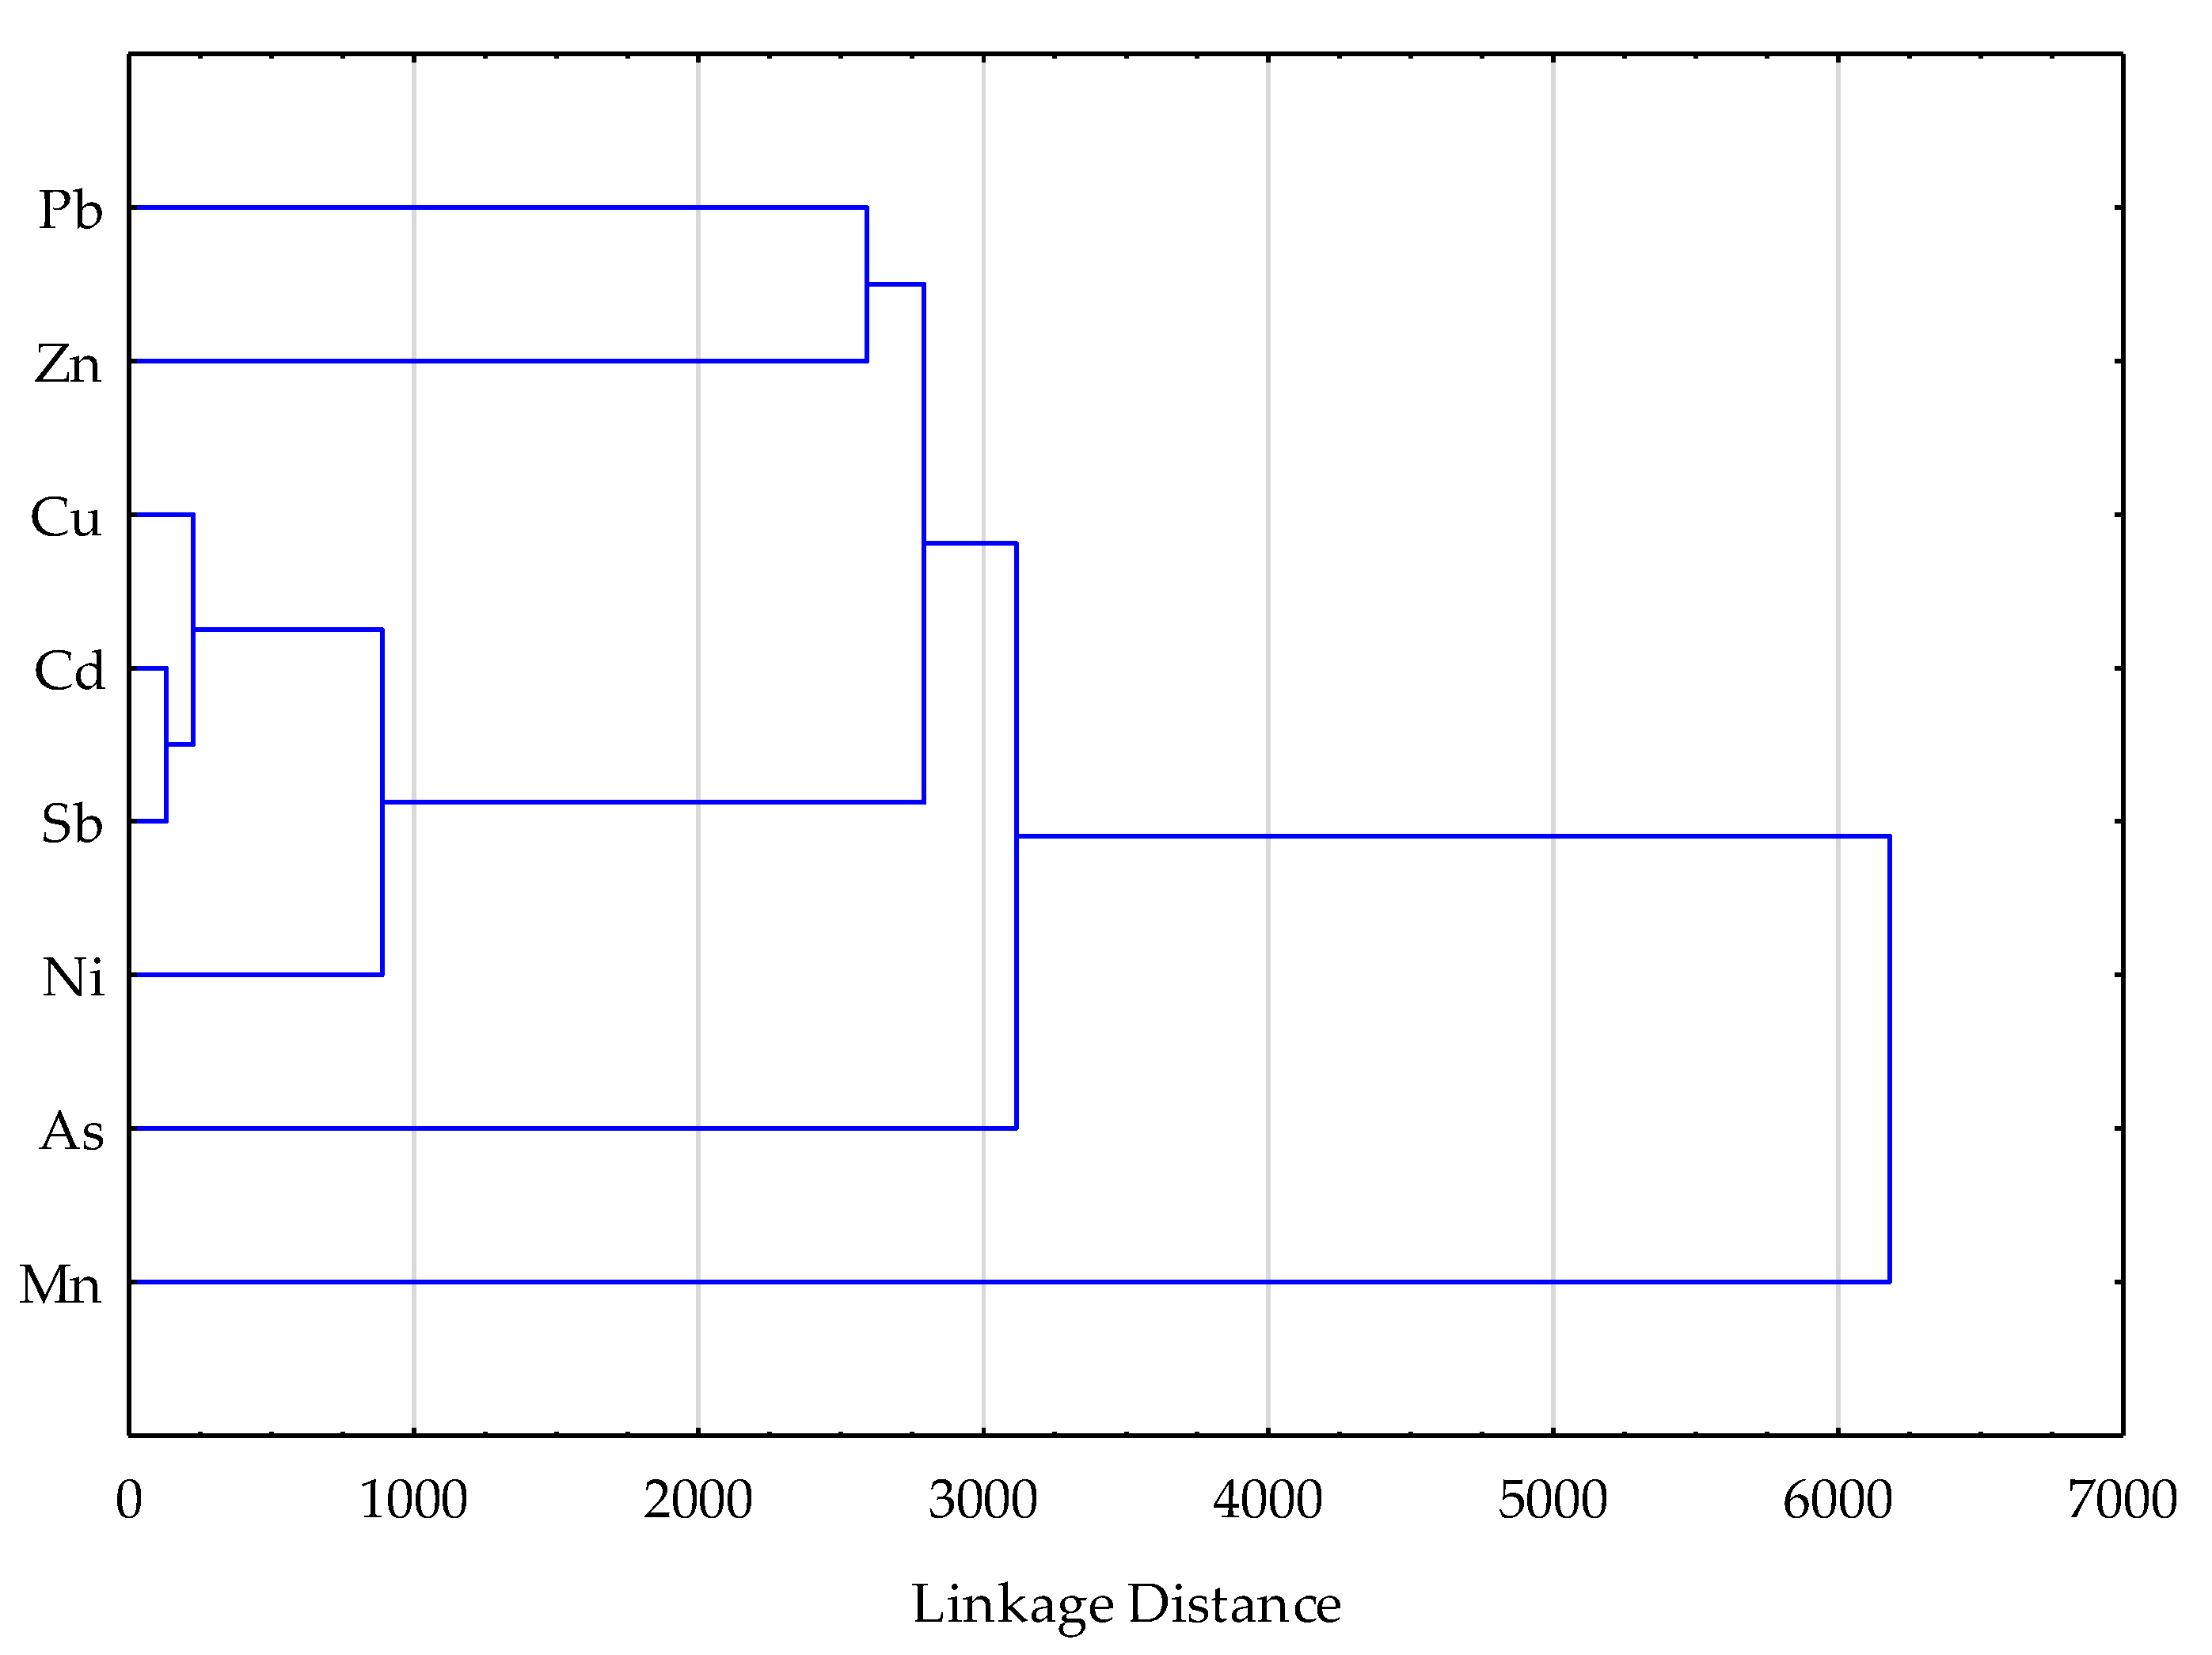
The cluster analyses are used to identify the relatively homogeneous groups of elements in the study samples. The metal concentration is used to analyze the grouping of elements on soil waste. The following dendrograms of the investigated samples were obtained with the help of Ward’s method in order to define the similarities and dissimilarities of elements.
Figure 9 shows the dendrogram analysis mean of elements in soil waste samples. When dendrograms of soil samples were examined, it was seen as great variations in pollution levels. The dendrogram presents three major distinct clusters with four groups formed. Pb and Zn have good similarity and are clustered in one group, whereas the Cu, Cd and Sb are clustered into another group. These two groups showed a close relationship with Ni and As in one of the major clusters. The third group showed close similarities with the last group of Mn. A similar relationship can be seen in elements of the other three groups as well. The major clusters indicated strong anthropogenic influence. The results obtained by cluster analysis are consistent with those obtained by correlation analysis of elements in soil samples in Kizhnica.
3.4. Environmental Implication
The environmental implications of heavy metals are presented in
Table 4. The Contamination Factor (
CF) was calculated as the total metal concentration with reference to the national limited standards for safe limits of heavy metals in soil [
26]. The analyzed elements are selected based on the toxicity index.
The results in
Table 4 show that Pb ranges from a very low degree of contamination to a very severe degree of pollution in sample 1. The content of Zn ranges from a low degree of contamination to a severe level of pollution in sample 9. Cd showed a moderate degree of contamination in samples 4, 7, and 9, while in other samples, it can be considered an element of no high risk (
Table 5).
The
CF data indicate significant anthropogenic impact in all sites. Using the classification system proposed for the modified equation [
28,
30,
31,
32], the overall range of
CF values indicates a high degree of contamination of soil samples to excessive pollution with As in sample 1. The scope of pollution load index in analyzed samples confirmed the degree of contaminants present, while in the majority of the samples,
results show that the soil quality is deteriorating (Table 5).
Results of the geo-accumulation index are presented in
Table 4 based on Muller's [
27] classification (
Table 6). Cd and As belongs to class 6 (extremely contaminated), Pb belongs to class III (moderately to strongly contaminated in sites S1, S2, S4 and S9), class II to moderately contaminated in sites S3, S7, S8 and uncontaminated to moderately contaminated S5, S6 and S10. Zn belongs to class III in S4, S7 and S9 (moderately to strongly contaminate) and to class uncontaminated to moderately contaminated in all other sites. Cd belongs to class II (moderately contaminated) in sites S4 and S9, while in other sites, the result was uncontaminated. Cu and Ni belong to class 0 (uncontaminated). While As results extremely contaminated in sample 1, all other analyzed samples show moderately to strongly contamination.
Heavy metals are critical contaminants due to their accumulation in the soil, easy uptake by the plants, and thus entering the food chain.
Table 4 shows the range and average values of
PLI values for each metal in the investigated sites. Based on the average values of PLI (
Table 7), the ranking of the intensity of heavy metal pollution of the soil samples in Kizhnica is from uncontaminated to a high degree of pollution.
3.4. Impact on Sustainability
During the second half of the twentieth century, the whole region was focused on mining and metallurgy as the primary source of income and development strategy. The environmental impacts of this industry were neglected, and just recently, environmental protection has become important to society. With the mandatory recycling of lead acid batteries, replacing lead pipelines in water supply systems, new lead-free materials and other green transition technologies, mining of lead and zinc ores became less attractive and profitable. The technology used in Kizhnica mines is out of date and cannot fulfil the requirements of the environmental regulations imposed by the laws.
In order to achieve sustainability, mining and minerals processing for heavy metals production should fulfil requirements in economics, environment and social equity. If the production meets environmental requirements, the investment rate in passive tailing landfill remediation, green technology instalments, dust emission prevention, and acid mine drainage prevention will be very high, and the profit will be heavily impacted. On the other hand, the communities living around the mining and mineral processing facilities are employed by the mine, but at the same time, they are facing health issues [
33]. According to the Kosovo Agency for Statistics, the significant cause of death in Kosovo is diseases of the respiratory system, and according to the Eurostat Yearbook- Enlargement Countries - health statistics, the incidence of respiratory diseases in Kosovo was much higher than in other Western Balkans and Turkey [
34].
In this situation, the population has turned to the original source of income-agriculture production, having favorable climatic conditions, and natural resources. They faced obstacles in land use, as presented in this study, as the area surrounding the mineral processing plant and tailing waste deposits are heavily loaded with heavy metals. In order to develop sustainable agriculture, massive land remediation should be done, as well as detailed mapping of the soil pollution, based on the presented statistical model.
4. Conclusions
The environmental pollution in Kizhnica - Municipality of Gracanica, the Republic of Kosovo, is highly due to mining activities. The measurements of heavy metal concentrations in these regions show high levels of metal concentration and bioaccumulation. The application of statistical analysis as a correlation matrix and cluster supports the fact that heavy metals are more concentrated close to the mining smelting area, but it has an impact on the surrounding area as well. The air dispersion modelling is in line with other chemical analysis and environmental implication indexes. The establishment of regular monitoring programs is an urgent need for Kosovo. The most important and cheap procedure is the application of phytoremediation as a method of great interest. The results also indicate that there is an increasing need for further research, mainly focused on the mechanisms of the remediation process and the potential use of the deposed waste material in different combinations in construction. This process will support the process of waste management and reduce the continued risk to the environment in the study area.
Author Contributions
Conceptualization, L.Z., M.K.M. and S.U.; methodology, M.K.H., L.Ć. and J.Dj.; validation, L.Z., M.K.M. and Š.U.; formal analysis, L.Z., M.K.M. and Š.U.; investigation, M.K.M., L.Z. and Š.U.; resources, J.Dj.; data curation, M.K.M., L.Ć. and Š.U.; writing—original draft preparation, L.Z., M.K.M., S.U., J.Dj. and L.Ć.; writing—review and editing, L.Z., M.K.M. and Š.U.; visualization, L.Z. and Š.U.; supervision, M.K.M. and Š.U.; project administration, M.K.M. and Š.U.; funding acquisition, L.Z. All authors have read and agreed to the published version of the manuscript.
Funding
This work has been fully supported by the University of Zagreb as part of PhD thesis of Lavdim Zeqiri under the supervision of Prof Dr. Šime Ukić and Prof dr. Mihone Kerolli Mustafa.
Data Availability Statement
The data presented in this study are available upon request from the corresponding author.
Conflicts of Interest
The authors declare no conflict of interest.
References
- Aliu, M.; Sajn, R.; Stafilov, T. Distribution of Ag, Au, Bi, Cu, and Mo in surface soils. Case study: Mitrovica region, Republic of Kosovo. Chem Ecol. 2023, 39, 970–990. [Google Scholar] [CrossRef]
- Zhang, X.; Yang, L.; Li, Y.; Li, H.; Wang, W.; Ge, Q. Estimation of lead and zinc emissions from mineral exploitation based on characteristics of lead/zinc deposits in China. Trans. Nonferrous Met. Soc. China 2011, 21, 2513–2519. [Google Scholar] [CrossRef]
- Kristensen, L. J.; Taylor, P. A.; Flegal, R. An odyssey of environmental pollution: The rise, fall and remobilisation of industrial lead in Australia. Appl. Geochem. 2017, 83, 3–13. [Google Scholar] [CrossRef]
- Cappuyns, V.; Swennen, R.; Vandamme, A.; Niclaes, M. Environmental impact of the former Pb–Zn mining and smelting in East Belgium. J. Geochem. Explor. 2006, 88, 6–9. [Google Scholar] [CrossRef]
- Li, C.; Zhou, K.; Qin, W.; Tian, C.; Qi, M.; Yan, X.; Han, W. A Review on Heavy Metals Contamination in Soil: Effects, Sources, and Remediation Techniques. Soil Sediment Contam. 2019, 28(4), 380–394. [Google Scholar] [CrossRef]
- Borgna, L.; Di Lella, L. A.; Nannoni, F.; Pisani, A.; Pizzetti, E.; Protano, G.; Riccobono, F.; Rossi, S. The high contents of lead in soils of northern Kosovo. J. Geochem. Explor. 2009, 101, 137–146. [Google Scholar] [CrossRef]
- Li, X.; Tang, Y.; Wang, X.; Song, X.; Yang, J. Heavy Metals in Soil around a Typical Antimony Mine Area of China: Pollution Characteristics, Land Cover Influence and Source Identification. Int. J. Environ. Res. Public Health 2023, 20, 2177. [Google Scholar] [CrossRef] [PubMed]
- Mahdi, P.; Mohammad, A.; Pegah, F.; Paridokht, A.; Matin, M. Recent progress on sustainable phytoremediation of heavy metals from soil. J. Environ. Chem. Eng. 2022, 10, 108482. [Google Scholar] [CrossRef]
- Verplanck, P.L.; Frederic, R. Siegel. Environmental Geochemistry of Potentially Toxic Metals. Miner Deposita. 2003, 38, 258. [Google Scholar] [CrossRef]
- European Union (2002) Heavy Metals in Wastes, European Commission on Environment. (http://ec.europa.eu/environment/waste/studies/pdf/heavymetalsreport.pdf) (20.04.2023).
- Pappu, A. ; Saxena, M,; Asolekar, Sh. R. Hazardous jarosite use in developing non-hazardous product for engineering application, Sci. Total. Env. 2006, 359, 232–243. [Google Scholar] [CrossRef]
- Papandreou, A. D.; Stournaras, C. J.; Paspaliaris, I. Adsorption of Pb(II), Zn(II) and Cr(III) on coal fly ash porous pellets. Miner. Eng. 2011, 24, 1495–1501. [Google Scholar] [CrossRef]
- Kerolli Mustafa, M.; Fajković, H.; Rončević, S.; Ćurković, L. Assessment of metals risks from different depths of jarosite tailing waste of Trepça Zinc Industry, Kosovo based on BCR procedure, J. Geochem. Explor. 2015, 148, 161–168. [Google Scholar] [CrossRef]
- Kerolli Mustafa, M. Characterization and environmental impact assessment of jarosite process tailing waste. PhD Thesis, University of Zagreb, Zagreb, 29.01.2014. https://www.croris.hr/crosbi/publikacija/ocjenski-rad/384970.
- Pouresmaieli, M.; Ataei, M.; Forouzandeh, P.; Azizollahi, P.; Mahmoudifard, M. Recent progress on sustainable phytoremediation of heavy metals from soil. Journal of Env. Chem. Eng. 2022, 10(5), 108482. [Google Scholar] [CrossRef]
- Chen, R.; Han, L.; Liu, Z.; Zhao, Y.; Li, R.; Xia, L.; Fan, Y. Assessment of Soil-Heavy Metal Pollution and the Health Risks in a Mining Area from Southern Shaanxi Province, China. Toxics 2022, 10, 385. [Google Scholar] [CrossRef] [PubMed]
- Borgna, L.A. Di Lella, F. Nannoni, A. Pisani, E. Pizzetti, G. Protano, F. Riccobono, S. Rossi, The high contents of lead in soils of northern Kosovo. J. Geochem. Explor. 2009, 101, 137–146. [Google Scholar] [CrossRef]
- Yang, D.; Zhu, H.; Liu, J.; Zhang, Y.; Wu, S.; Xiong, J.; Wang, F. Risk Assessment of Heavy Metals in Soils from Four Different Industrial Plants in a Medium-Sized City in North China. Toxics. 2023, 11, 217. [Google Scholar] [CrossRef] [PubMed]
- Brewer, P. A.; G. Bird, G.; Macklin, M. G. Isotopic provenancing of Pb in Mitrovica, northern Kosovo: Source identification of chronic Pb enrichment in soils, house dust and scalp hair. Appl. Geochem. 2016, 64, 164–175. [Google Scholar] [CrossRef]
- Kumar, V.; Sharma, A.; Cerda, A. Heavy metals in the environment impact, assessment, and remediation. Elsevier. 2020. [CrossRef]
- Kim, T. G.; Lee, A. Simultaneous stabilization and solidification of the top five most toxic heavy metals (Hg, Pb, As, Cr, and Cd). Chemosphere. 2017, 178, 479–485. [Google Scholar] [CrossRef] [PubMed]
- Bolanča, T.; Šipušić, J.; Ukić, Š.; Šiljeg, M.; Ujević Bošnjak, M. Optimization of arsenic sludge immobilization process in cement – natural zeolite – lime blends using artificial neural networks and multi objective criteria functions, Fresenius Environ. Bull. 2012, 21, 76–83. [Google Scholar]
- Toth, G.; Hermann, T.; M. R. De Silva, M.R.; Montanarella, L. Heavy metals in agricultural soils of the European Union with implications for food safety. Environ Int. 2016, 88, 299–309. [Google Scholar] [CrossRef] [PubMed]
- Mamat, A.; Zhang, Zh.; Mamat, Z.; Zhang, F.; Yinguang, C. Pollution assessment and health risk evaluation of eight (metalloid) heavy metals in farmland soil of 146 cities in China. Environ Geochem Health, 2020, 42, 3949–3963. [Google Scholar] [CrossRef] [PubMed]
- Khan, S.; Naushad, M.; Lima, E.C.; Zhang, S.; Shaheen, S.M.; Rinklebe, J. Global soil pollution by toxic elements: Current status and future perspectives on the risk assessment and remediation strategies–A review. J. Hazard. Mater. 2021, 417, 126039. [Google Scholar] [CrossRef] [PubMed]
- Administrative Instruction (GRK), No. 11/2018 on Limited Values of Emissions of Polluted Materials into Soil.
- Müller, G. Index of geoaccumulation in the sediments of the Rhine River. Geojournal. 1969, 2, 108–118. [Google Scholar]
- Liakopoulos, A.; Lemiere, B.; Michael, K.; Crouzet, C.; Laperche, V.; Romaidis, I.; Drougas, I.; Lassin, A. Environmental impacts of unmanaged solid waste at a former base metal mining and ore processing site (Kirki, Greece). Waste Manage Res 2020, 28, 996–1009, https://brgm.hal.science/hal-00553648. [Google Scholar] [CrossRef] [PubMed]
- Tomović, M; Dervišević, I. Manojlović,D.; Đokić, J.; Janačković, M.; Pollution Distribution from Korlace Mine Pit into the Environment. Pol. J. Environ. Stud. 2023, 32, 807–820. [Google Scholar] [CrossRef]
- Min, X.; Xie, X.; Chai, L.; Liang, Y.; Li, M.; Ke, Y. Environmental availability and ecological risk assessment of heavy metals in zinc leaching residue. Trans. Nonferrous Met. Soc. China. 2013, 23, 208–218. [Google Scholar] [CrossRef]
- Sotiria, G.; Papadimou, O.D.K.; Chartodiplomenou, M.A.; Golia, E.E. Urban Soil Pollution by Heavy Metals: Effect of the Lockdown during the Period of COVID-19 on Pollutant Levels over a Five-Year Study. 7,Soil Syst. 2023, 7, 28. [Google Scholar] [CrossRef]
- Tomlinson, D. C.; Wilson, J. G.; Harris, C. R. & Jeffrey, D. W. Problems in the assessment of heavy-metal levels in estuaries and the formation of a pollution index. Helgol. Mar. Res., 1980, 33, 566–575. [Google Scholar]
- Statistical Yearbook of the Republic of Kosovo, 2021.
- Eurostat Regional Yearbook Edition 2023ISBN 978-92-68-05058-3 ISSN 2363-1716. [CrossRef]
|
Disclaimer/Publisher’s Note: The statements, opinions and data contained in all publications are solely those of the individual author(s) and contributor(s) and not of MDPI and/or the editor(s). MDPI and/or the editor(s) disclaim responsibility for any injury to people or property resulting from any ideas, methods, instructions or products referred to in the content. |
© 2024 by the authors. Licensee MDPI, Basel, Switzerland. This article is an open access article distributed under the terms and conditions of the Creative Commons Attribution (CC BY) license (http://creativecommons.org/licenses/by/4.0/).
