1. Introduction
Energy scarcity and environmental deterioration pose significant challenges to humanity, necessitating a focus on energy conservation and emission reduction in architecture. This study explores thermal reflective insulation coatings for buildings, which involve placing low thermal conductivity air between layers of highly reflective aluminum films to form a composite material with superior insulation properties. These materials, particularly focused on barrier, reflective, and radiation insulation, are widely used in building walls and other applications [
1,
2,
3,
4,
5,
6,
7,
8,
9,
10,
11,
12,
13,
14,
15].
Organic thermal insulation materials, such as polyurethane foam, expanded polystyrene, and phenolic foam, are recognized for their light weight and ease of processing [
16,
17,
18,
19,
20,
21,
22,
23]. Conversely, inorganic thermal insulation materials are increasingly valued for their excellent thermal stability and eco-friendly characteristics [
24,
25,
26]. Previous research has shown that different substrates and novel nano-composite inorganic materials vary in their effects on sunlight reflection. ElȦbieta Malewska et al. performed extensive tests on new heat-reflecting coatings, assessing their suitability as substrates with anti-corrosion, alkaline resistance, and self-quenching properties at temperatures below 200°C [
27]. Marwan M developed a novel composite material, CLC brick, for use in building wall design, examining its potential to reduce energy costs [
28]. Lin et al. created Terbium-doped cerium oxide nanocomposites with a near-infrared solar reflectivity of 85.54% using a green synthesis method, ball milling, and high-temperature calcination [
29]. Luo et al. devised a method to prepare radiation-cooled coatings that enhance sunlight scattering efficiency by randomly distributing Y2O3 nanoparticles in PDMS [
30]. Yuan et al. explored the effects of applying DHR and RR materials to building facades on the outdoor thermal environment [
31].
This study investigates the reflection characteristics of thermal reflective coatings on different walls, systematically assessing the impact of wall composition, light source irradiation angle, light source irradiation duration, and other factors on the efficacy of thermal reflection. The aim is to thoroughly explore the mechanisms of thermal reflection.
2. Experimental Section
2.1. Control of Powder
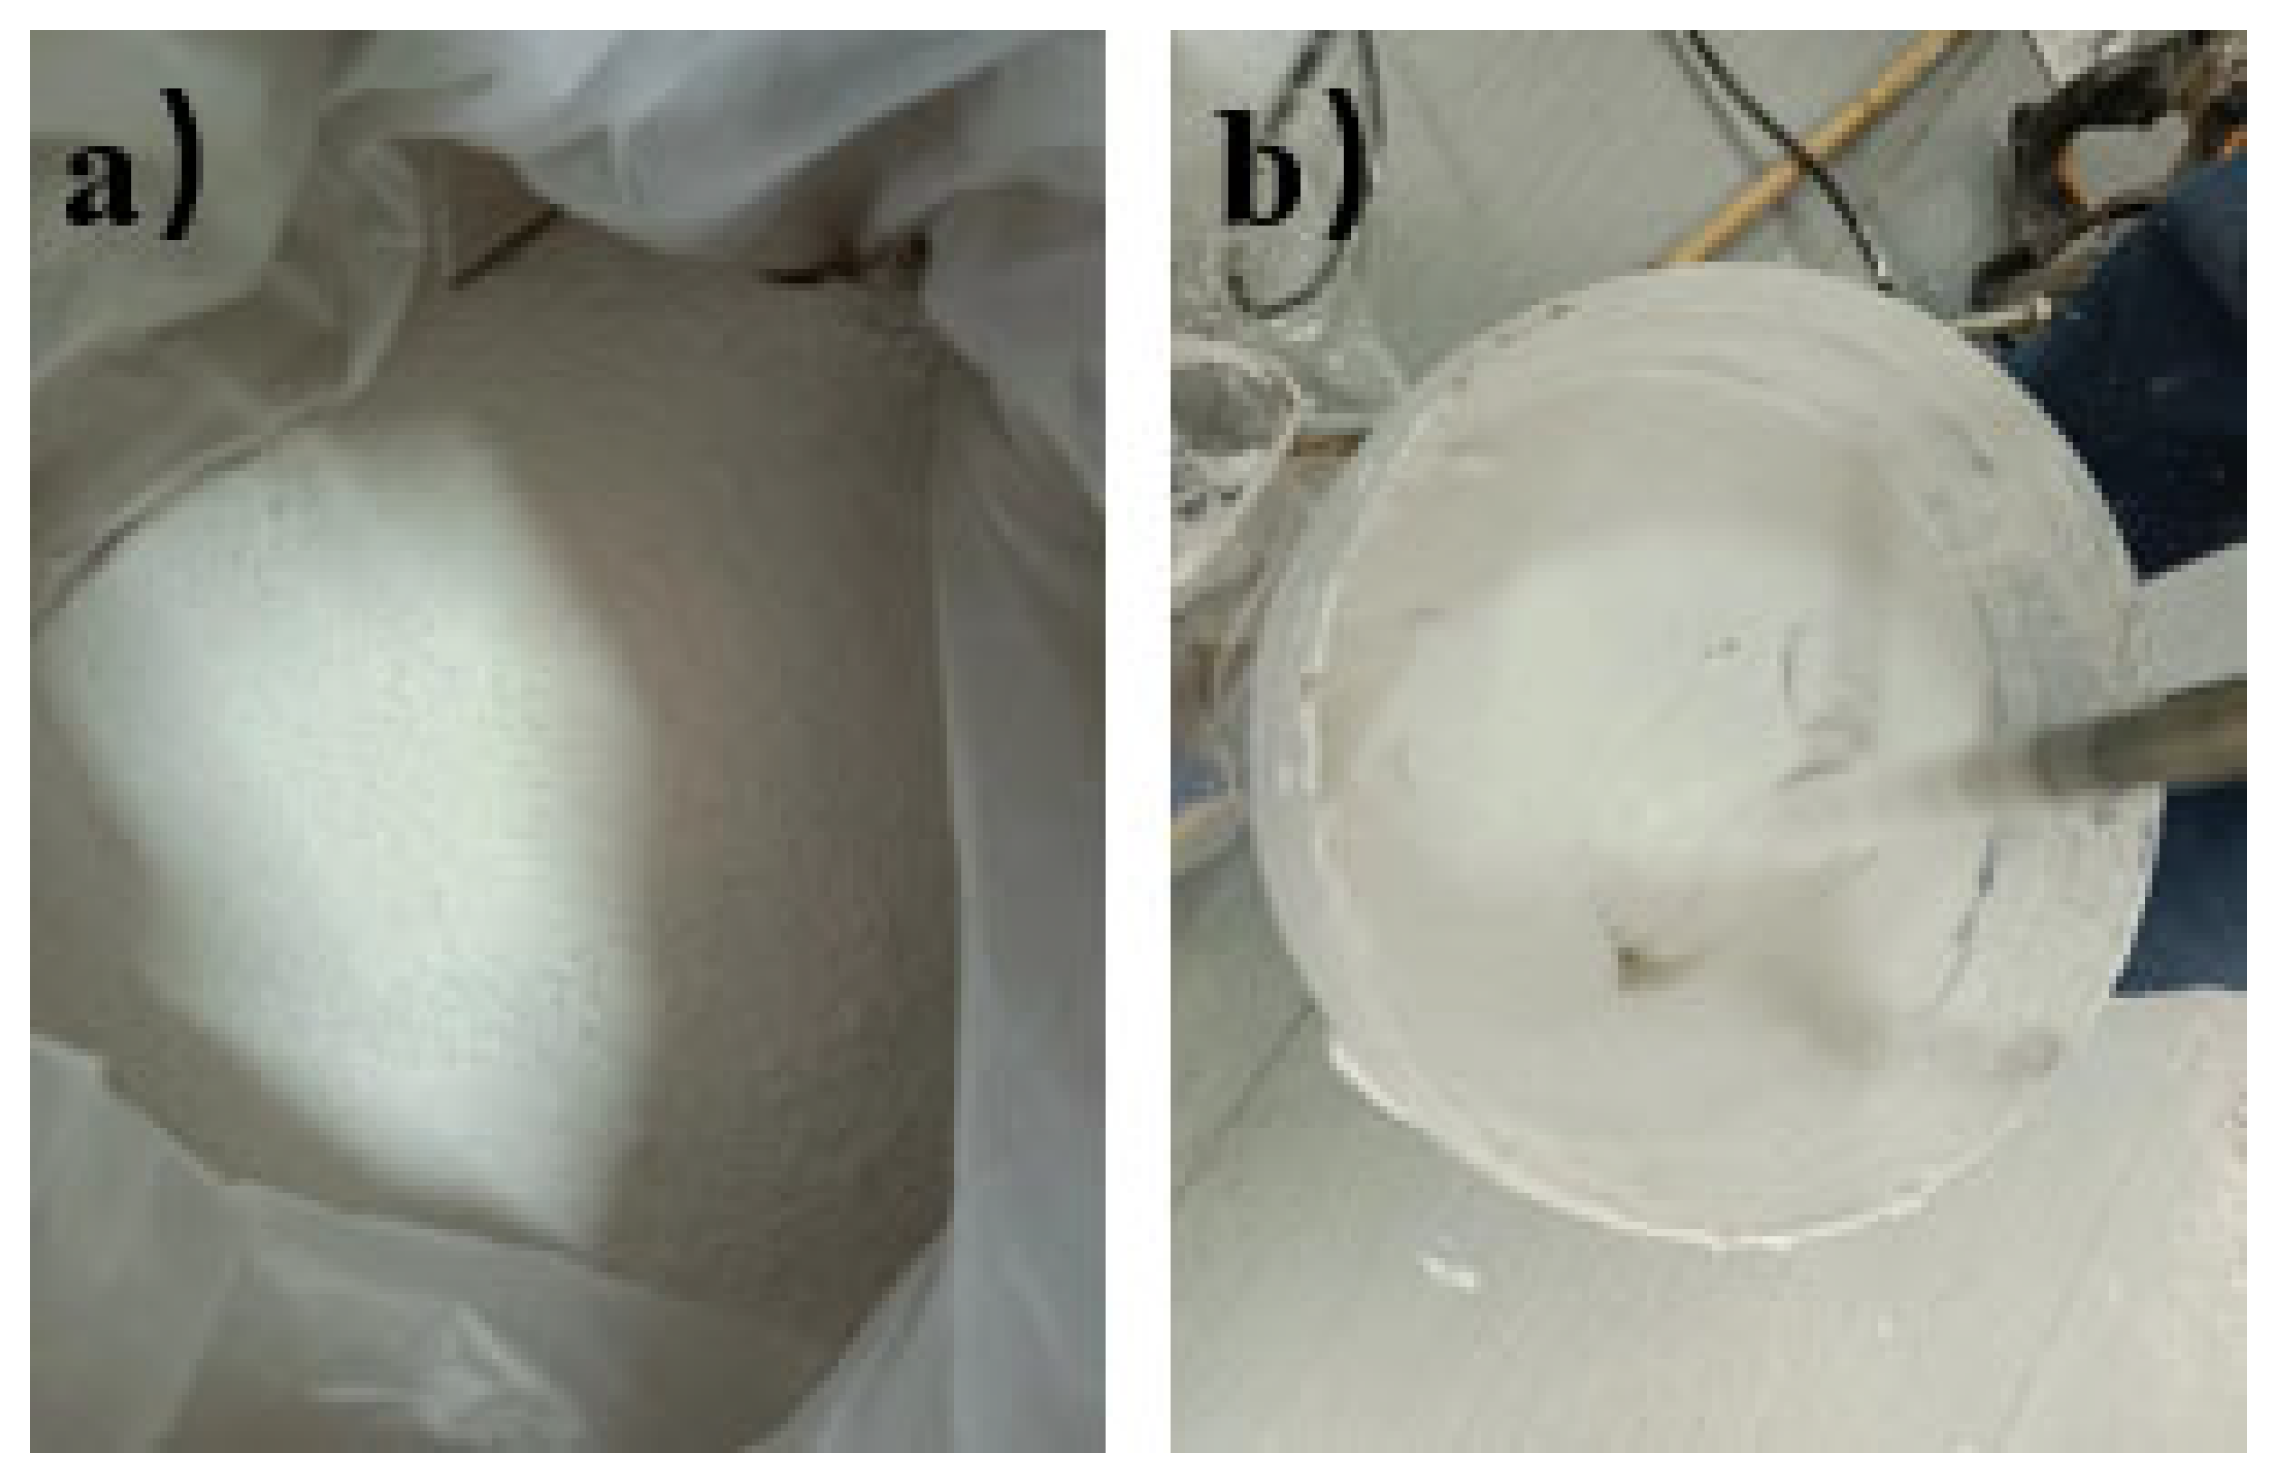
The powder is mainly composed of calcium silicate, calcium carbonate, calcium hydroxide, and binders. These components are combined in specific proportions to form a coating mixture. As shown in
Figure 1a, the mixing process begins with adding water at a speed of 1000rpm, and the mass ratio of dry powder to water (M (dry powder): M (water)) is about 1:0.7 until a uniform paste is obtained, as shown in
Figure 1c. After the mixture is left to stand for 15 minutes, the slurry is stirred again for 5 minutes. The amount of water added can be slightly adjusted according to the actual viscosity of the mixture.
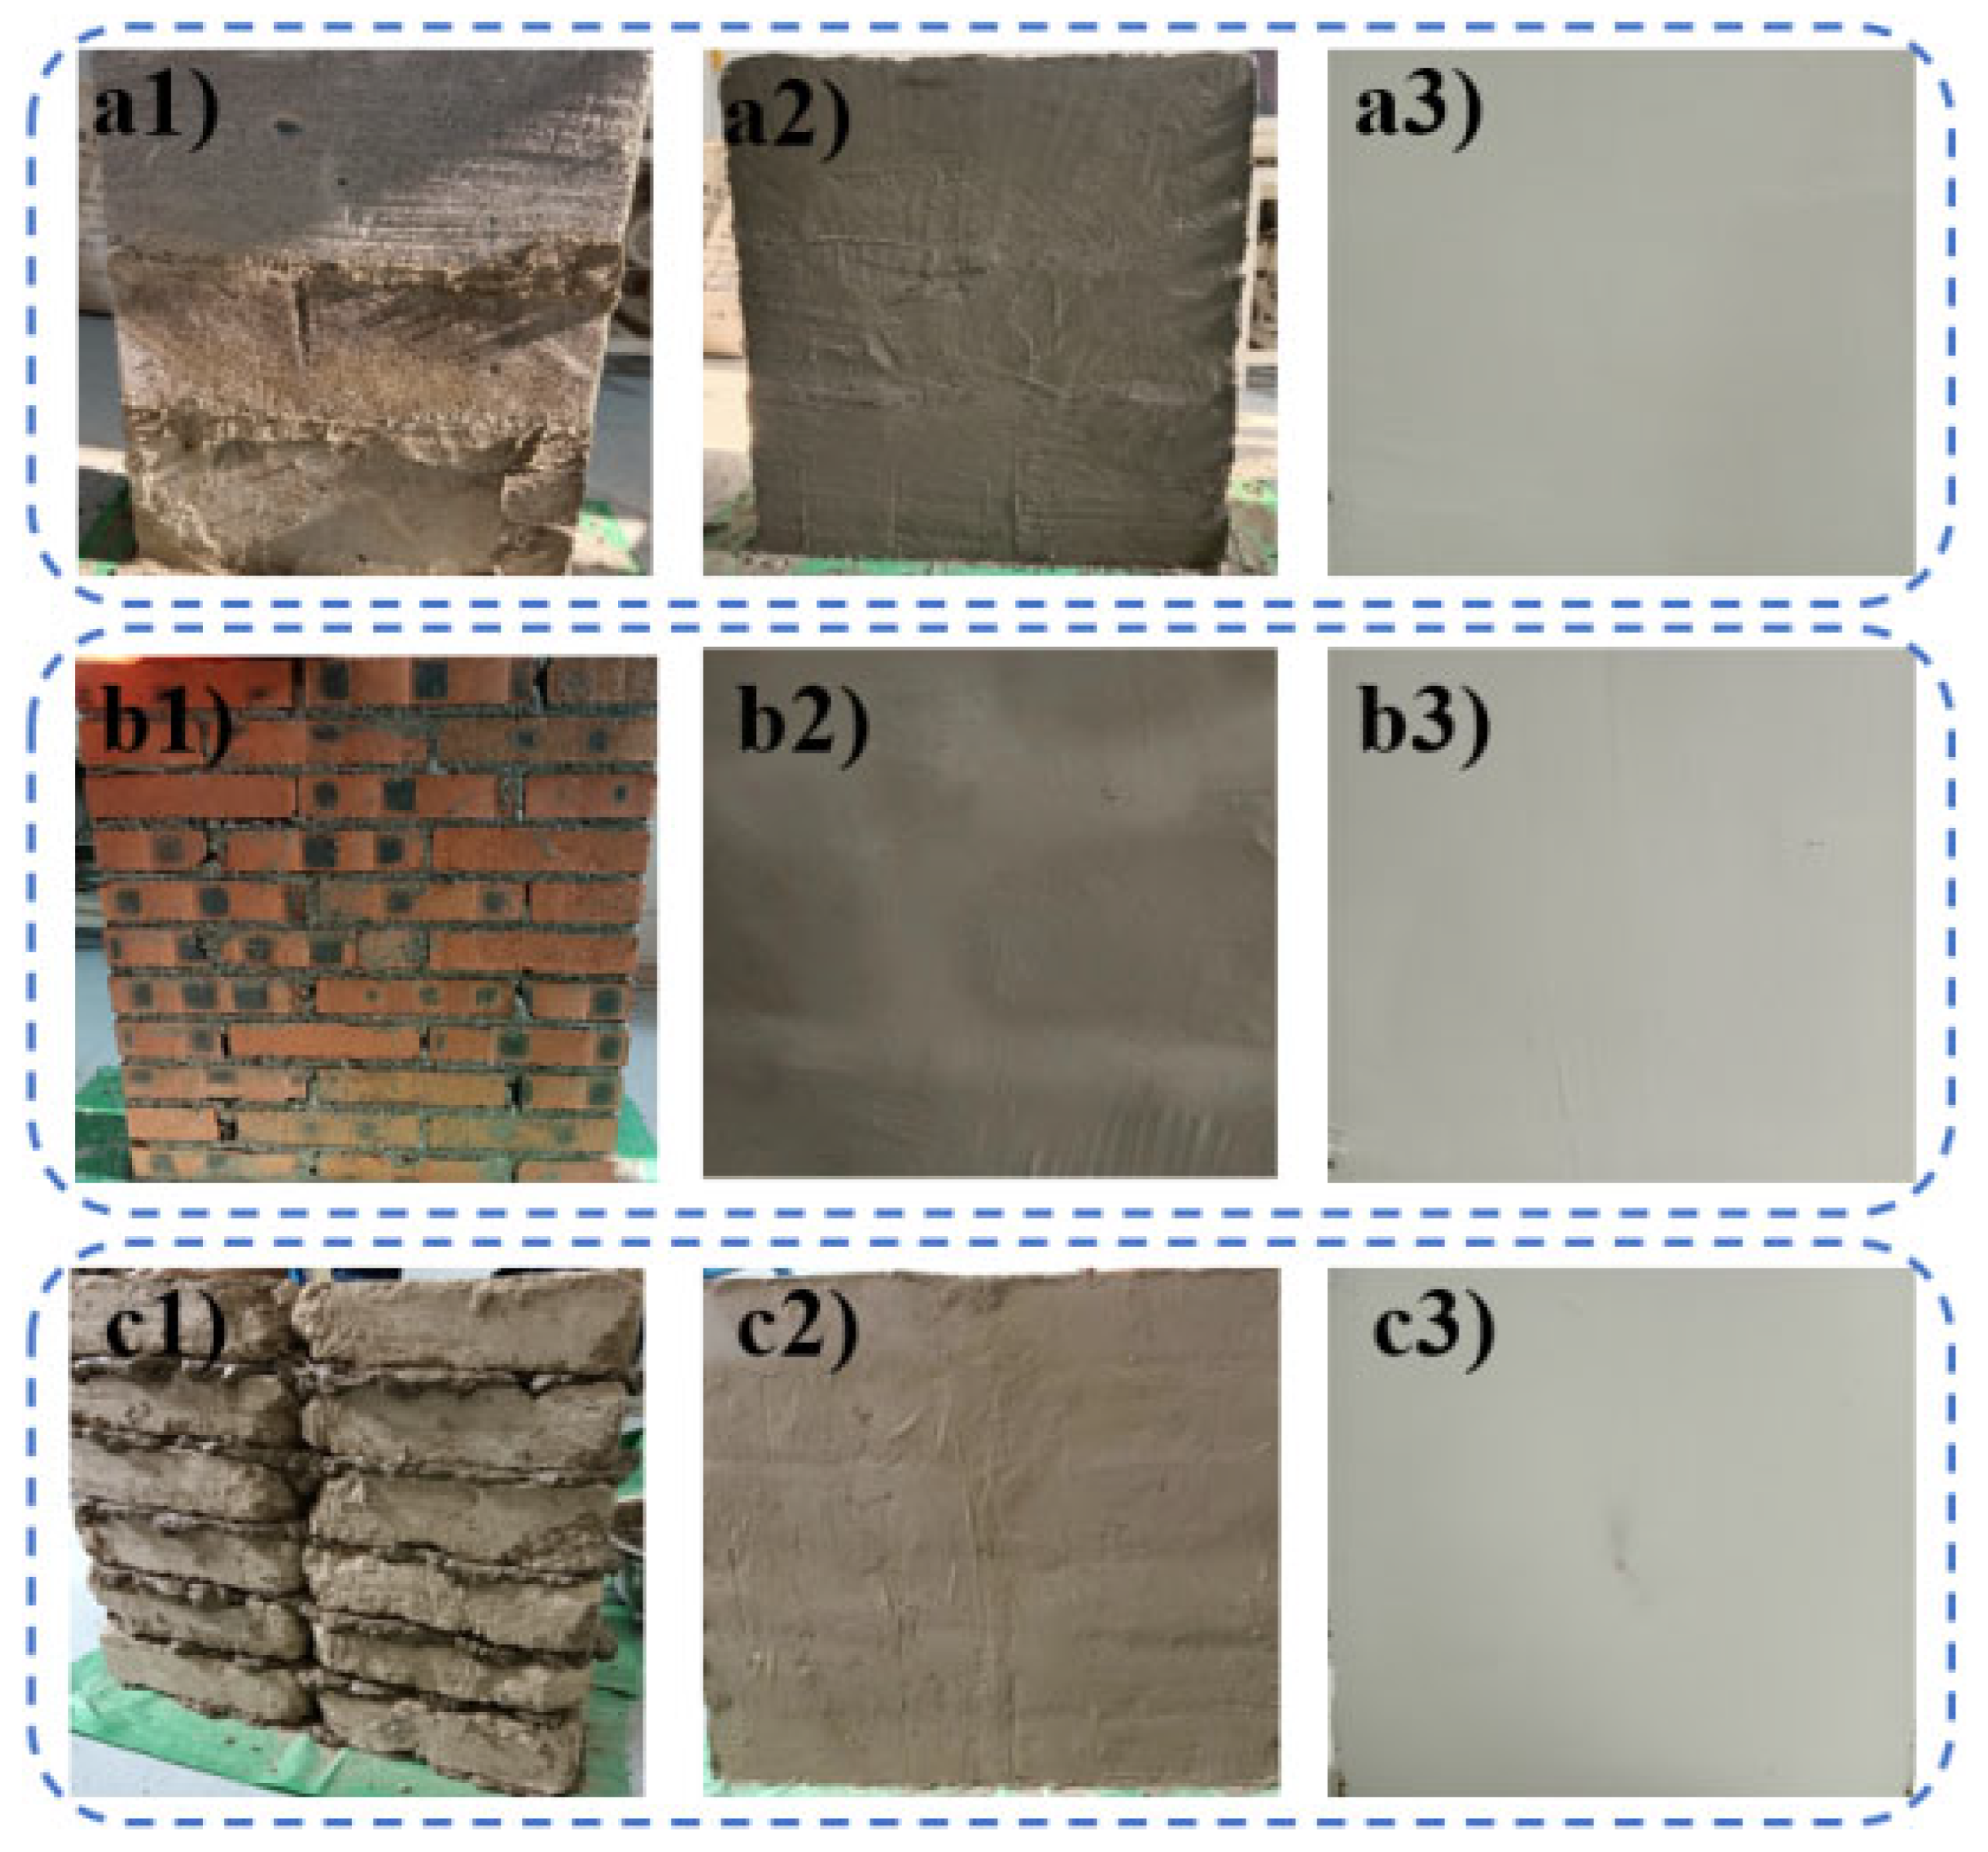
In this study, three different wall materials commonly used in construction were selected for experimentation: block brick walls (hereafter referred to as block walls), clay brick walls (brick walls), and adobe brick walls (earth walls), as shown in
Figure 2a,
Figure 2b, and
Figure 2c. Investigating the effects of thermal reflective coatings on these walls has significant representational value.
2.2. Film Preparation
Typically, civil buildings utilize three kinds of walls: block walls, brick walls, and earth walls. These walls differ in thermal conductivity, which significantly impacts their insulation performance. This study assessed the thermal reflection capabilities of these walls by applying thermal reflective coatings, with detailed configurations displayed in
Figure 2a1 to
Figure 2c3. The dimensions of each experimental wall were 0.6m in length, 0.25m in width, and 0.6m in height. After the walls dried completely, a layer of heat reflective coating was applied to each. Testing was conducted once the coatings had fully dried.
2.3. Test Method Characterization
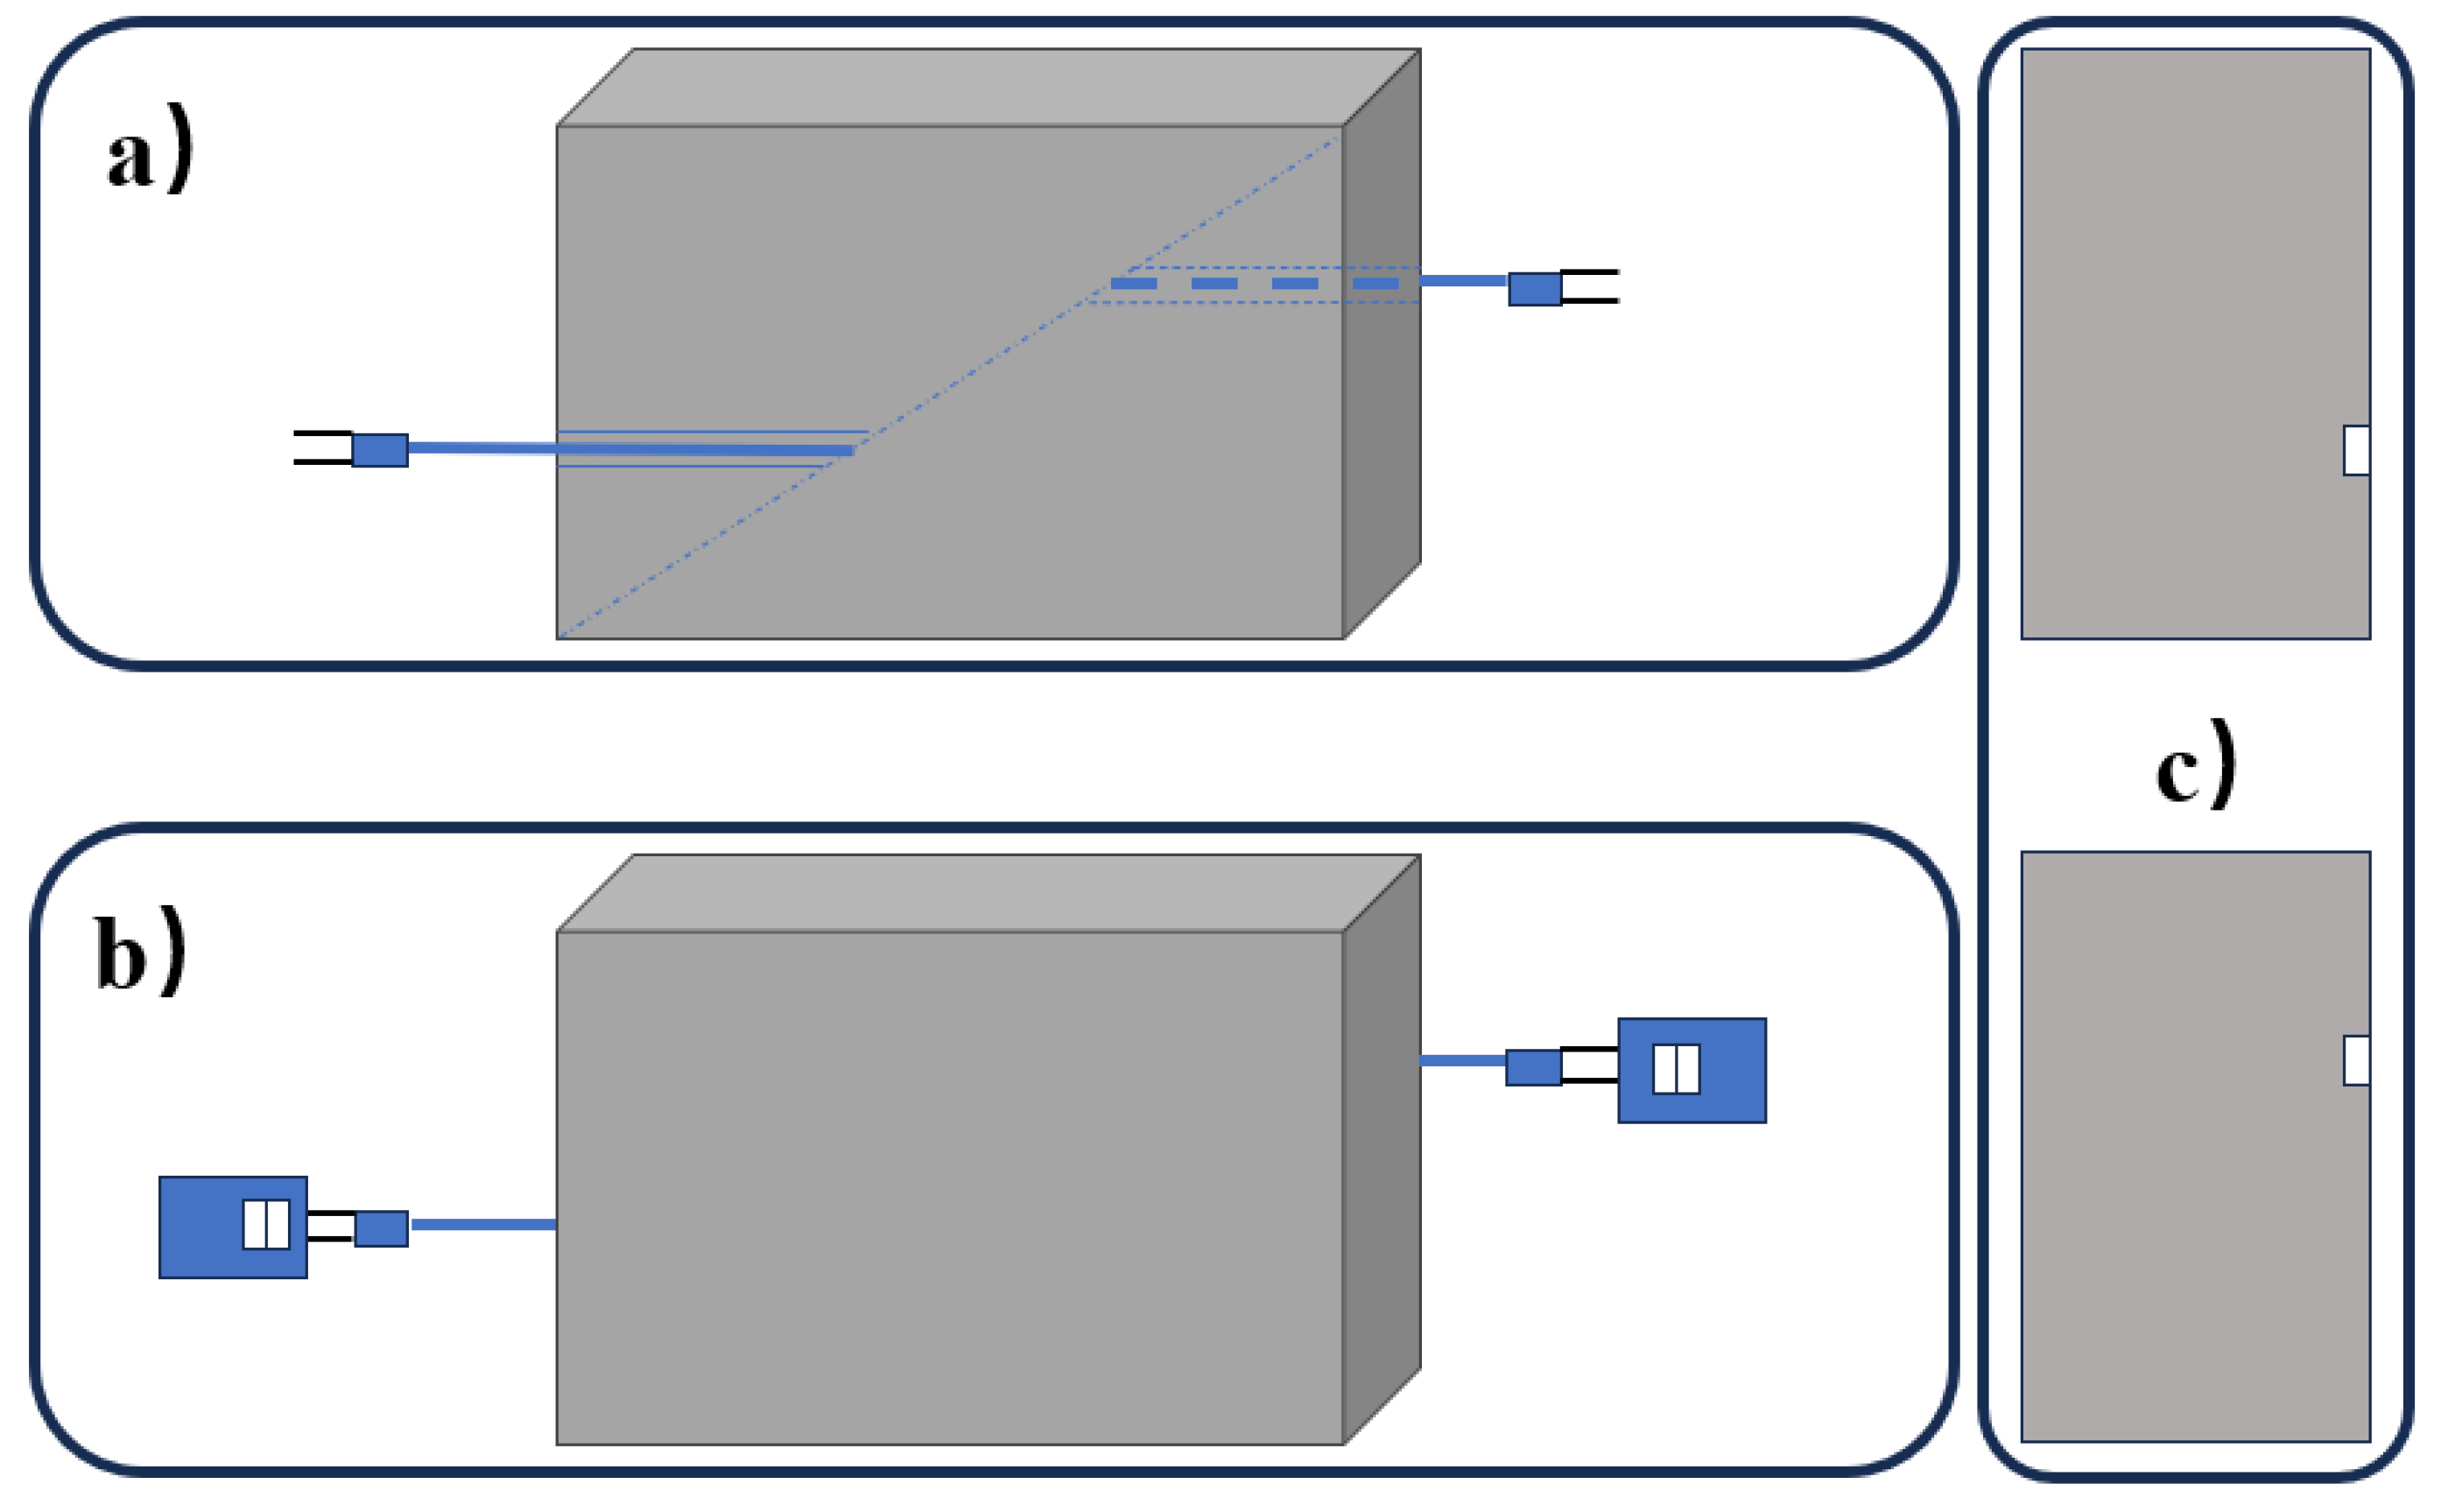
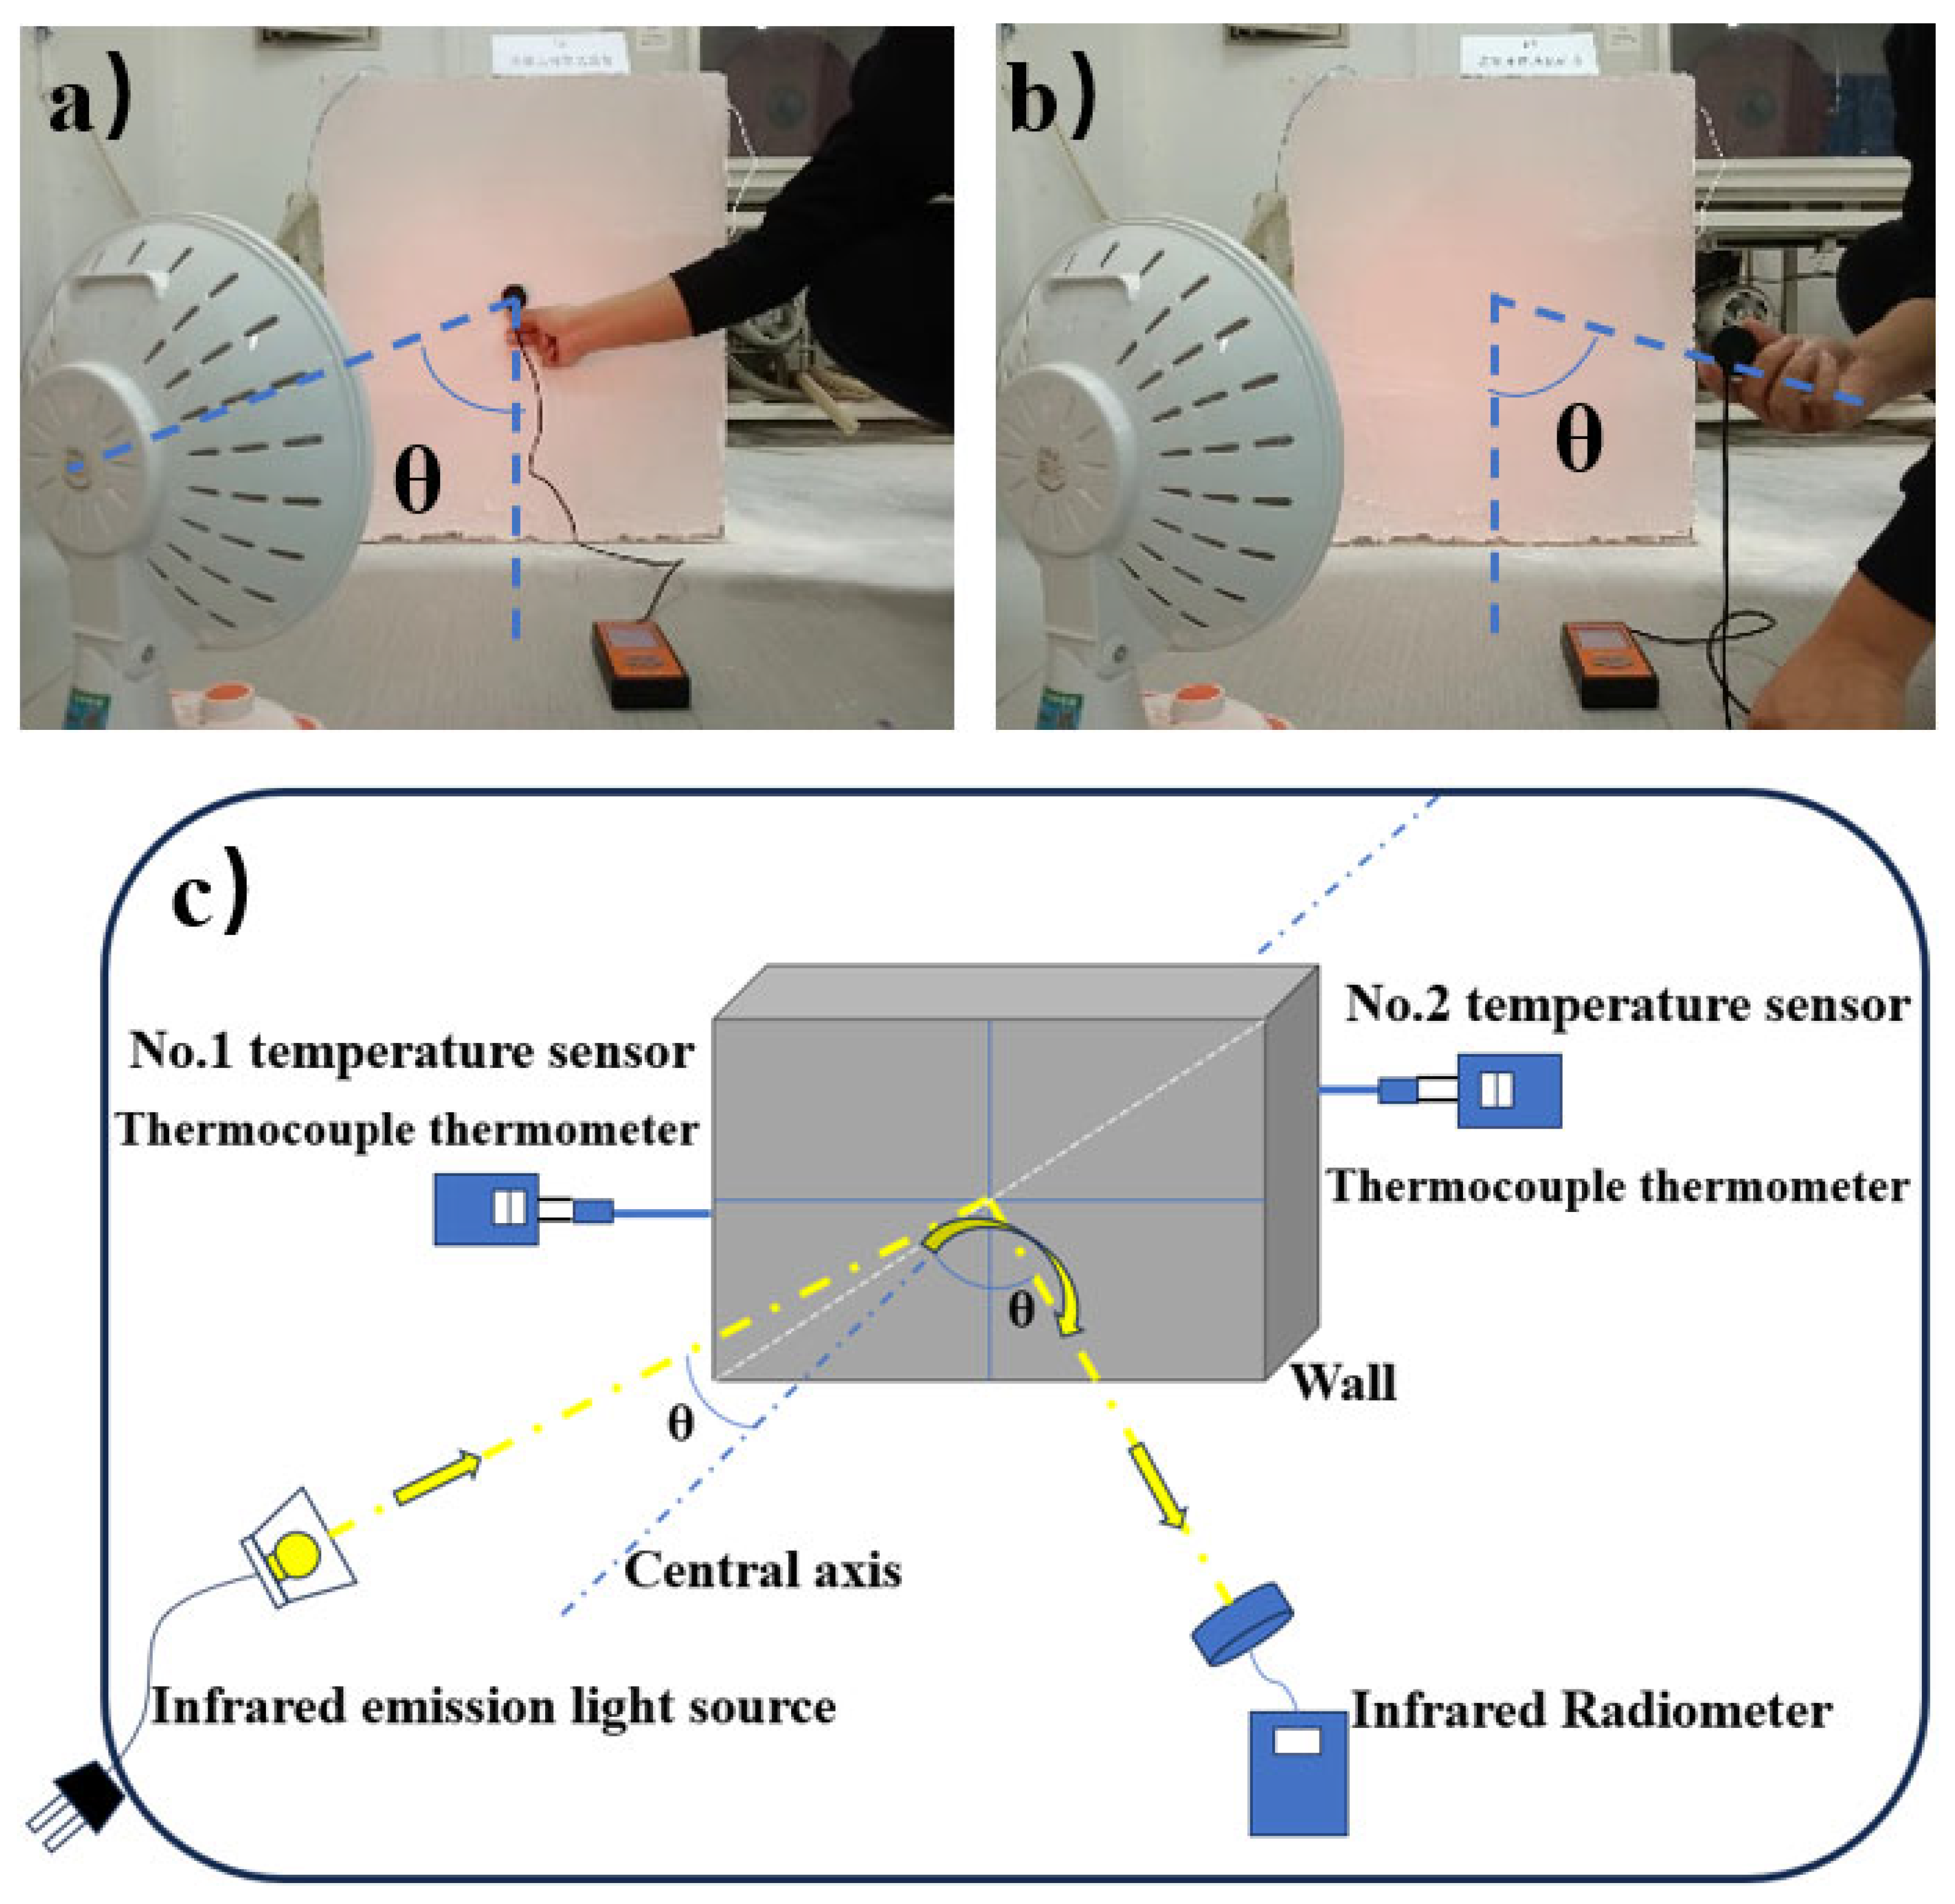
The study was conducted in the temperate monsoon climate of Tianjin, characterized by cold winters and hot summers, focusing on the insulation effects of coatings during winter. The experimental setup included an infrared radiometer (model LH-131), a reflective indoor heater (model RSN22-S07J, rated at 700W, 220V), and a thermocouple thermometer (model RE-Y2101B), as detailed in Figure 4c. The thermocouple thermometer recorded temperatures on both sides of the wall, using indoor reflective heaters as the heat source. The infrared radiometer measured the infrared heat flux, which spans a wavelength range of 0.76-1000 μm.
Heat flux is defined as the heat received or reflected per unit area of the wall. It is influenced by the wall's thickness, the temperature differential across the wall, and the wall material's thermal conductivity. This metric is crucial for evaluating both the heat dissipation performance and heat loss of materials. Currently, the evaluation of thermal reflective coatings in buildings primarily focuses on hemispherical emissivity and solar reflectivity. This experiment primarily examined how the wall material, the angle of heat source irradiation, and the duration of irradiation affect the insulation properties of the coatings. The photothermal and thermal reflection performance of the coating were assessed by measuring the temperature difference between the exterior wall and room temperature, as well as the heat flux reflectance before and after coating application.
The test is structured into two primary sections: measuring the temperature and heat flux of three different walls, and monitoring temperature data in the Earth Survey Building classroom. Prior to applying the coating, temperature sensors were installed at two equidistant points along a diagonal on the rear of each wall segment to ensure accurate data collection. These sensors were linked to thermocouple thermometers, as depicted in
Figure 3. Initially, the angle (θ) between the heat source's central axis and the vertical plane of the wall was set for various measuring points on the three walls, as illustrated in
a and 4b. It was necessary to log the temperature of the "bare wall" every 30 minutes, collecting 15 data sets, and of the "bare wall + heat source" every 30 seconds for a duration of 10 minutes. Subsequently, θ was adjusted from 10 degrees to 80 degrees in 10-degree increments to assess changes in temperature and heat flux. Following this, temperatures and reflected heat flux for the "wall after a coat of paint" were recorded every 30 minutes, with 15 data sets collected, and for the "wall + heat source after a coat of paint" every 30 seconds for 10 minutes. θ was similarly adjusted from 10 degrees to 80 degrees in 10-degree steps, and measurements continued for three days to evaluate stability.
To capture accurate and reliable data, measurements were taken from four points on each wall, with two points on each side. These points were located at the two-thirds positions along the diagonal of the wall, as shown in
Figure 4c. At the start of the experiment, the following were recorded: indoor and outdoor temperatures, indoor and outdoor humidity, radiator temperature, the temperature 60 cm from the radiator, radiator heat flux, and heat flux 60 cm from the radiator. The heat source was consistently positioned 60 cm from the center of the wall. Additionally, temperature fluctuations in the classroom were monitored before and after painting over a continuous three-day period.
3. Results and Discussion
3.1. Temperature Stability
3.1.1. Temperature Stability Test of Three Bare Walls under t the Heat Source
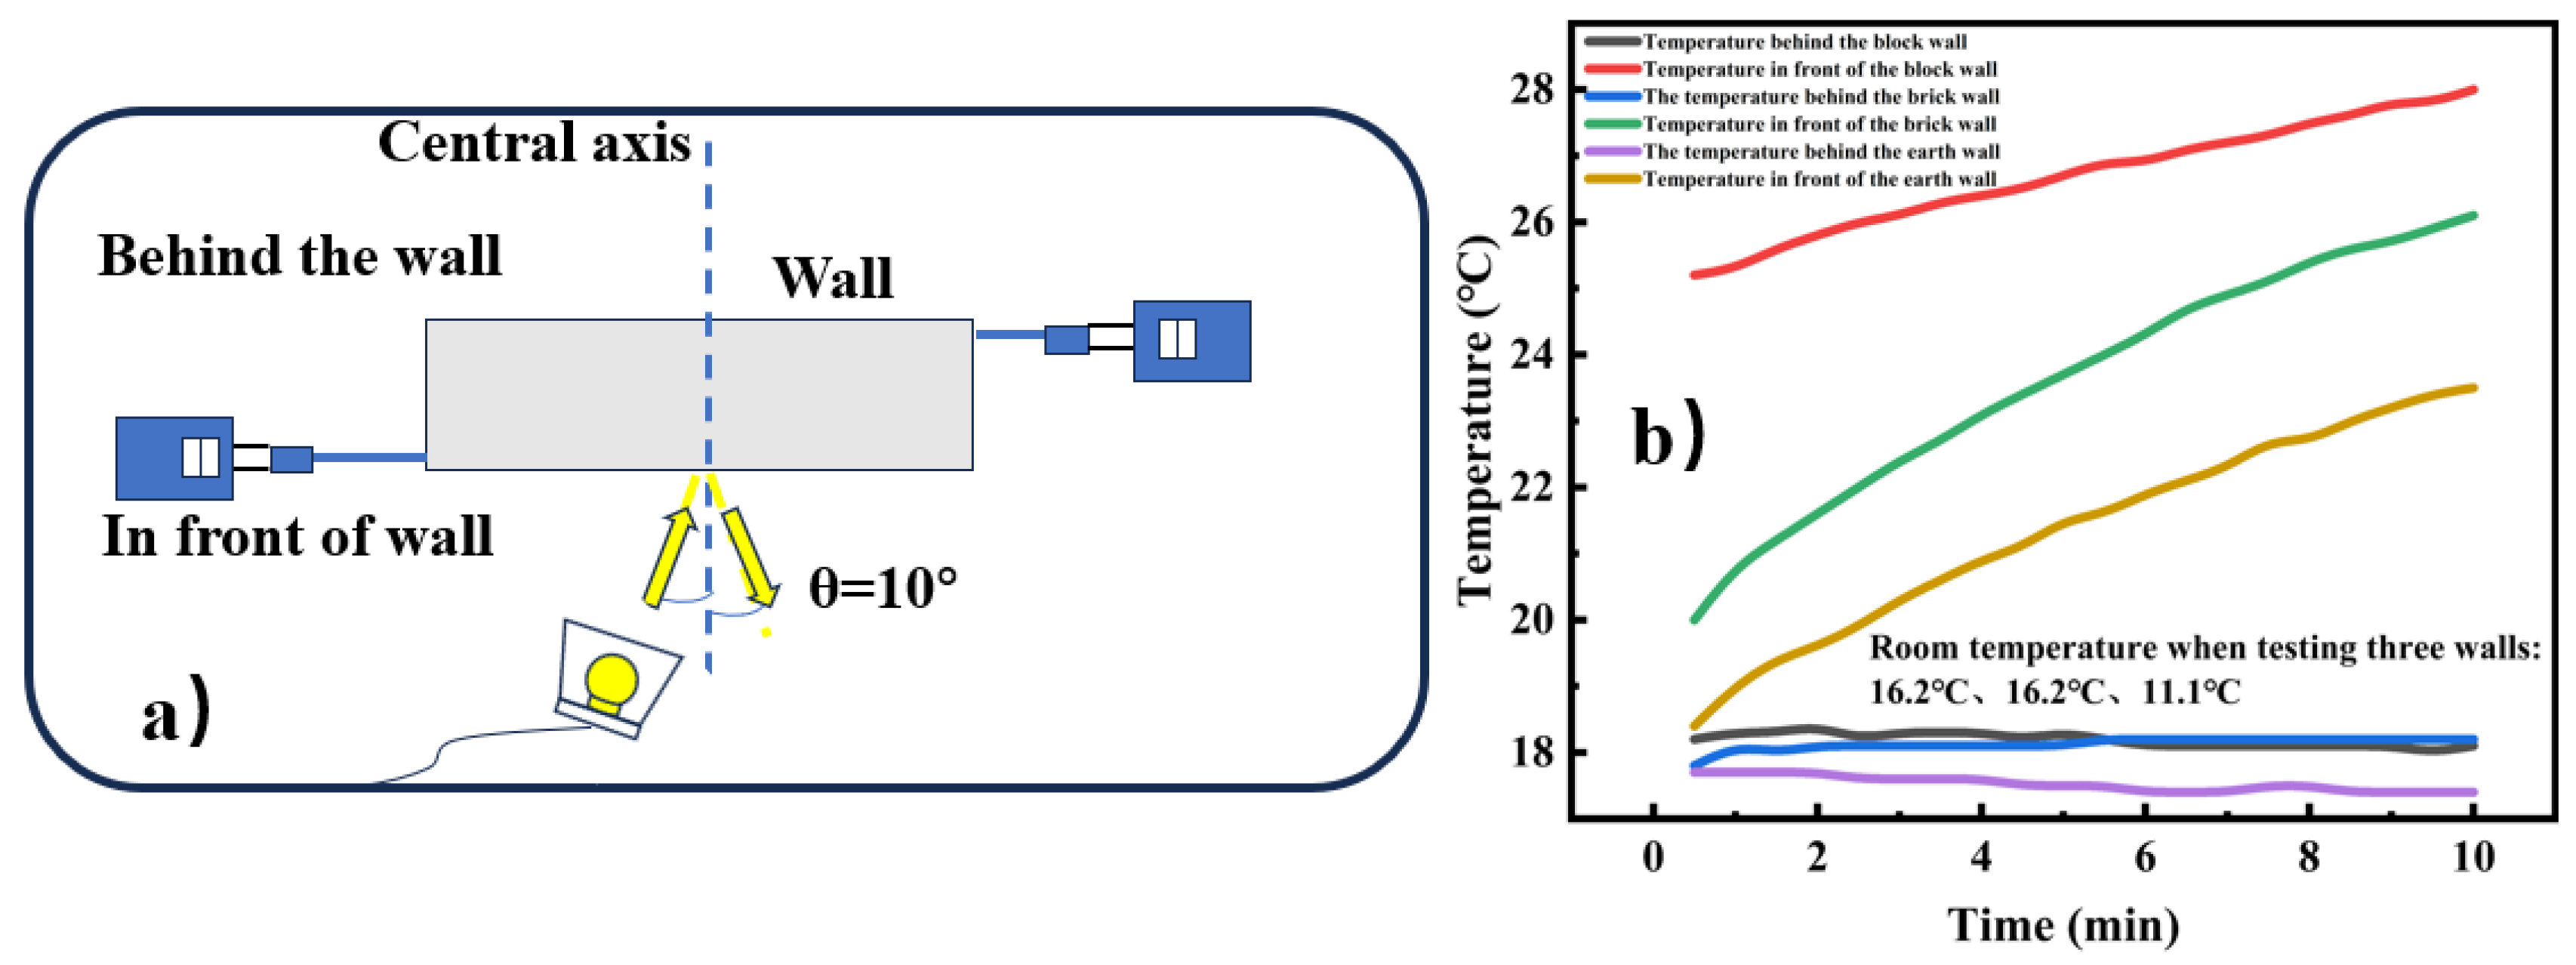
As illustrated in
Figure 5a and
Figure 5b, a temperature differential exists between the front and back of the wall when exposed to a heat source, confirming the wall's inherent thermal insulation capability. For instance, with θ set at 10°, the temperature difference between the front and back of the block wall can reach 7℃.
3.1.2. Temperature Stability Test of Bare and Coated Walls under the Heat Source
Figure 6a details temperature measurements for the block wall both bare and after applying a layer of paint. Initially, the room temperature was recorded at 16.2℃ and 20.4℃. The graph shows that one minute of heat exposure resulted in a temperature of 18.2℃ behind the bare wall, and 18.1℃ after ten minutes. The temperature at the measurement point behind the wall was consistently higher than the room temperature. With a layer of paint, the temperature behind the wall was 17.6℃ after both one minute and ten minutes of heat exposure. The temperature difference between the measurement point and the room temperature increased by 0.9℃ after painting, demonstrating the paint's effective insulation.
Figure 6b presents the temperature measurements for the brick wall, bare and painted. The room temperatures were 16.2℃ and 20.6℃, respectively. Initially, the temperature behind the bare wall was 17.8℃ after one minute of exposure and 18.2℃ after ten minutes, exceeding the room temperature. After applying paint, the temperature behind the wall remained at 18.3℃ after both one and ten minutes of exposure. The temperature difference between the measurement point and the room temperature increased by 0.3℃ after painting, indicating a favorable insulation effect.
As depicted in
Figure 6c, temperature measurements for the bare earth wall and the painted brick wall showed initial room temperatures of 17.1℃ and 20.4℃. One minute of exposure resulted in a temperature of 17.7℃ behind the bare wall, and 17.4℃ after ten minutes, slightly above the room temperature. Following painting, the temperature behind the wall was 19.6℃ after one minute and 19.7℃ after ten minutes of exposure, with a temperature increase of 0.4℃ compared to the room temperature, suggesting effective insulation. These findings preliminarily indicate that insulation effectiveness is related to wall material and thickness.
3.1.3. The Temperature of the Bare Wall and the Wall after Coating Changes with the Angle of Placement of the Heat Source
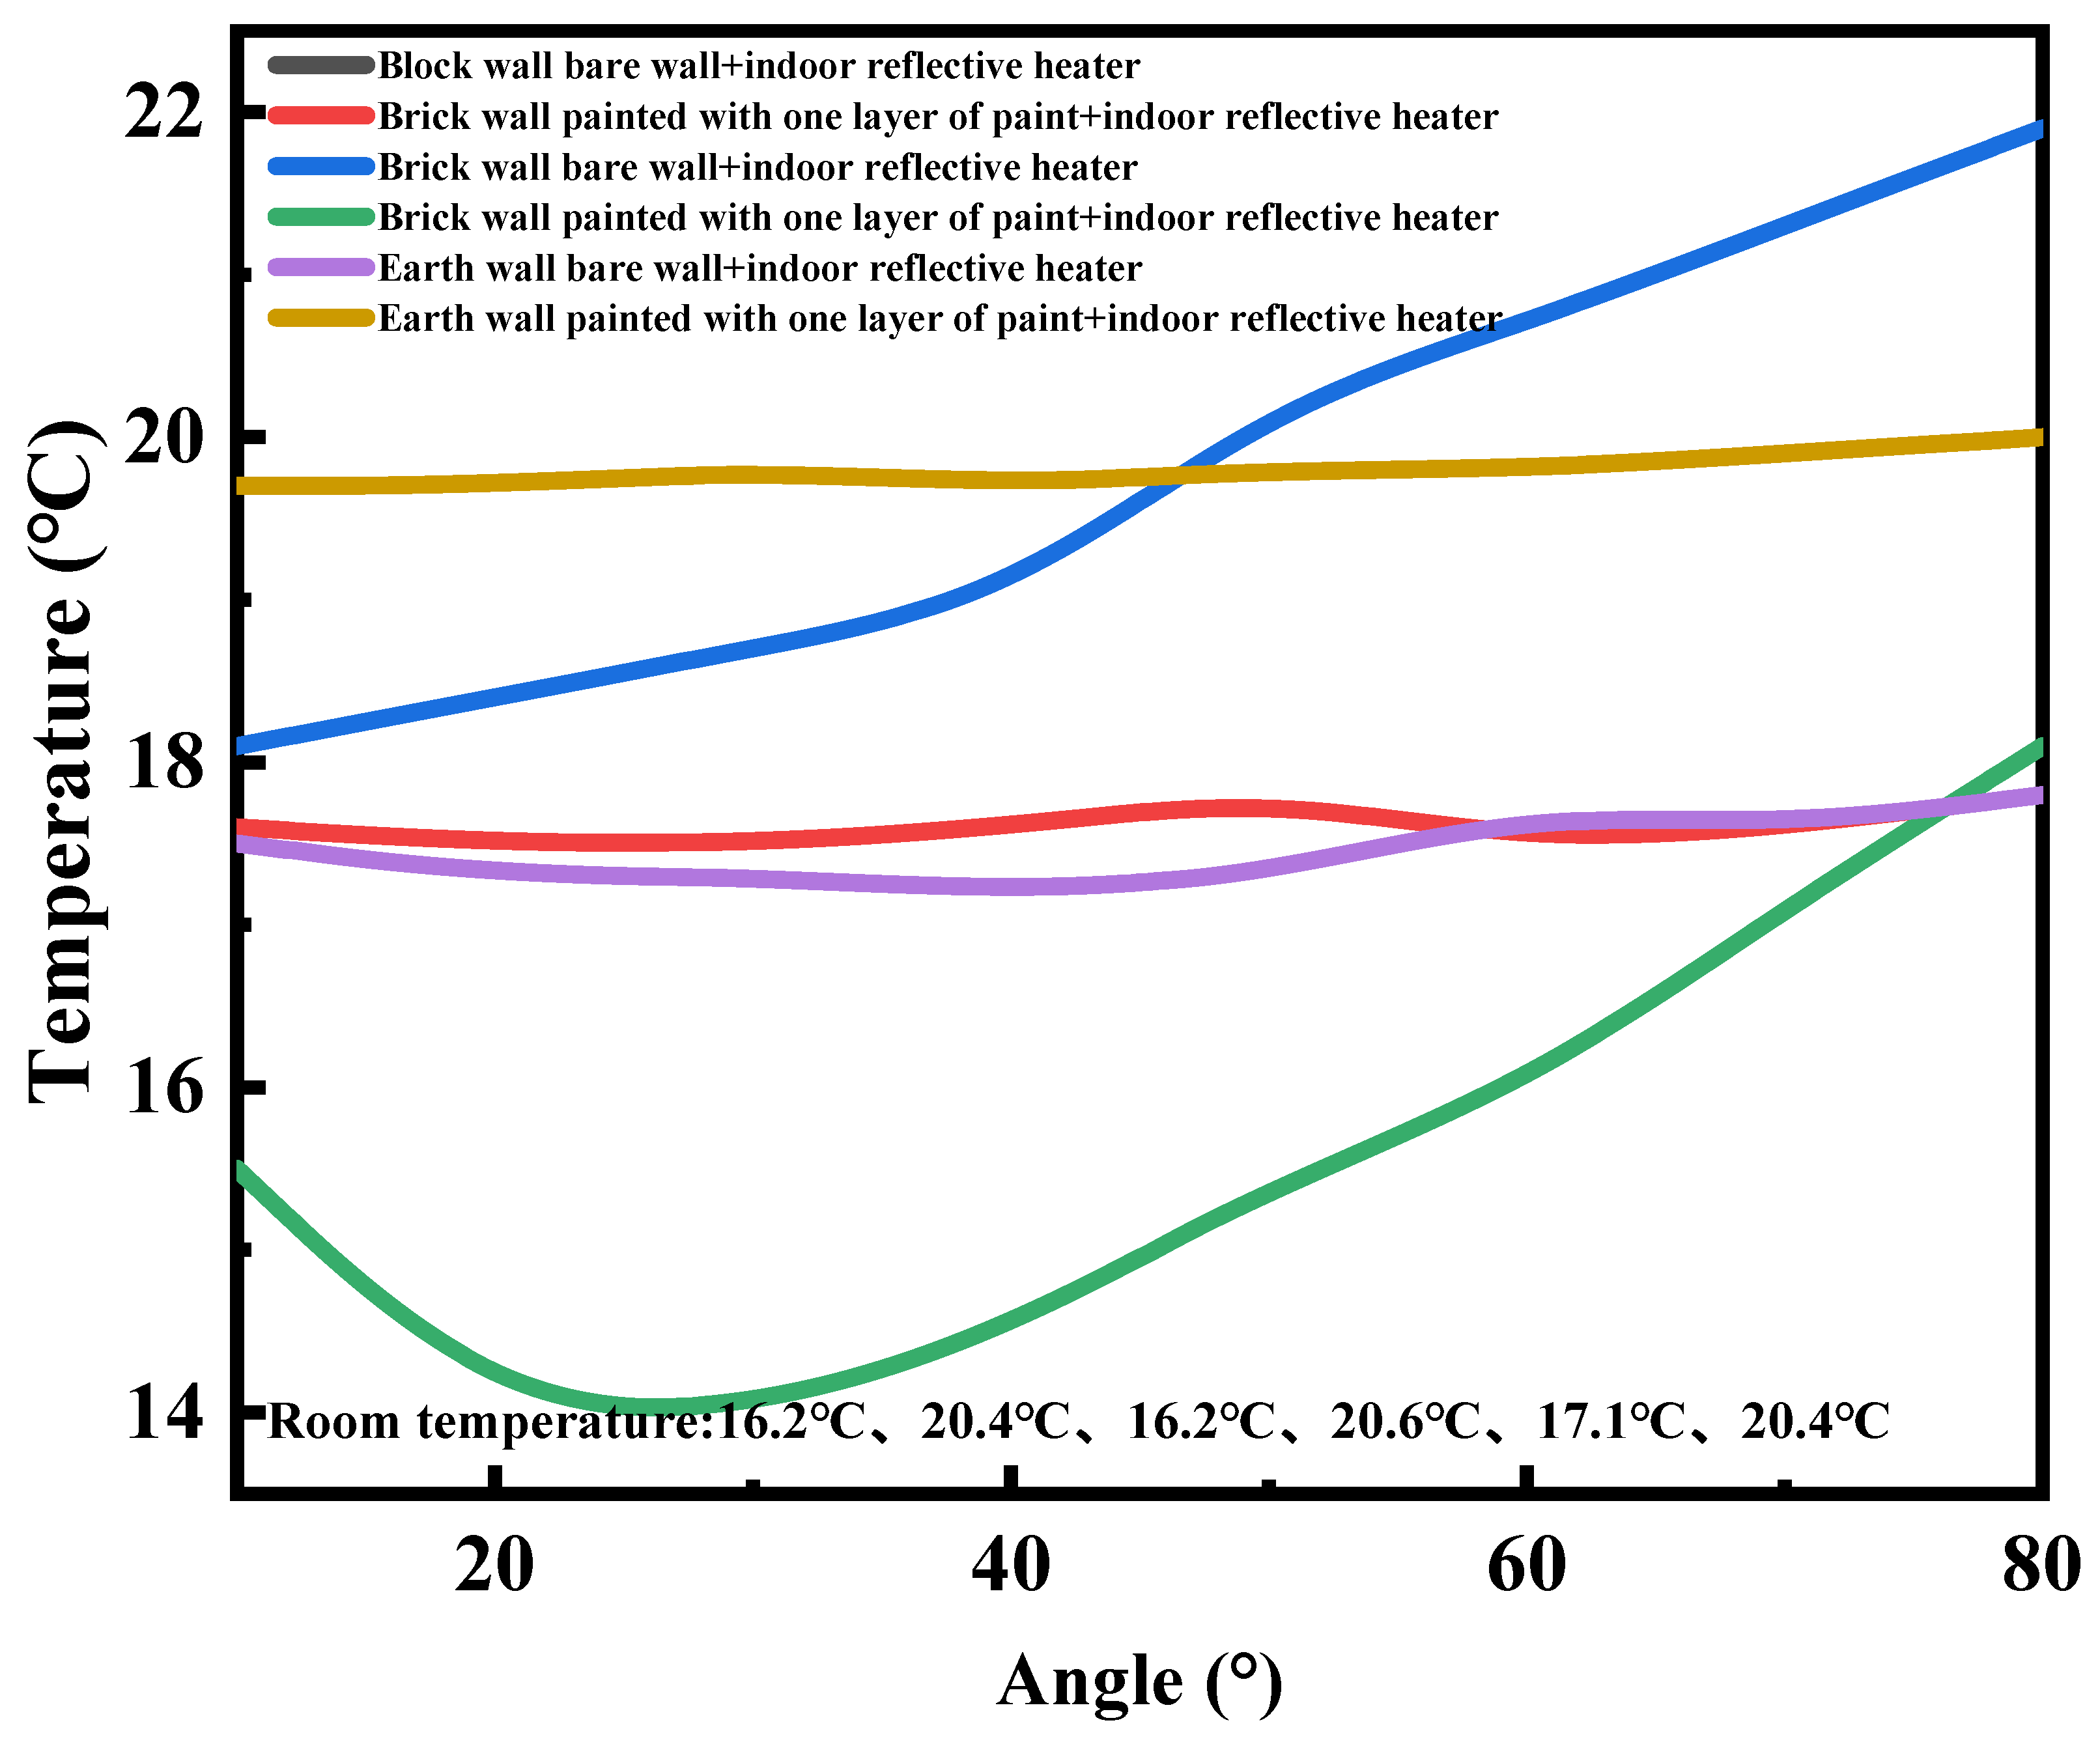
As shown in
Figure 7, temperature measurements were conducted on both bare and painted block walls, with room temperatures recorded at 16.2℃ and 20.4℃, respectively. The data indicated that temperatures behind the wall, both before and after painting, were similar, resulting in almost identical curves. In the temperature range of 10° to 50°, the temperature behind the bare wall was consistently above the room temperature when exposed to the heat source. However, after applying a coat of paint, the temperature behind the wall decreased by approximately 3°, with the most significant reduction observed at 60°. For the bare brick wall and painted brick wall, with room temperatures of 16.2℃ and 20.6℃ respectively, the temperatures behind the bare wall exceeded the room temperature from 10° to 80° when exposed to the heat source. After painting, the temperature behind the wall dropped, with the largest decrease at about 20°, showing a reduction of 6.6°C. Similarly, for the bare earth wall and painted earth wall, with room temperatures of 17.1℃ and 20.4℃ respectively, the temperatures behind the bare wall were higher than the room temperature from 10° to 80° under heat source exposure. After painting, the temperature behind the wall fell by approximately 0.7°C. These observations suggest that the optimal angle for applying the coating, which achieves the best insulation effect, varies among the three types of walls, indicating that insulation effectiveness is influenced by both the wall material and the angle of the light source.
3.1.4. The Temperature Stability of the Wall after One Coat of Paint is Tested for 3 Consecutive Days
Figure 8a illustrates the temperature measurements behind the painted block wall over three days, with room temperatures of 20.4℃, 20.6℃, and 20.4℃ and corresponding humidity levels of 56%, 49%, and 51%. The temperature behind the wall remained consistently about 3.0℃ lower than the room temperature. In
Figure 8b, for the coated brick wall, with room temperatures over three days of 20.4℃, 20.6℃, and 20.4℃ and humidity levels of 56%, 49%, and 51%, the temperature behind the wall stabilized at roughly 2.4℃ below the room temperature after painting.
Figure 8c shows the temperature measurements behind the coated earth wall, with room temperatures of 20.4℃, 21.3℃, and 20.7℃ and humidity levels of 84%, 78%, and 78% respectively. Here, the temperature behind the wall stabilized at about 0.9℃ below the room temperature after the paint application. Preliminary conclusions suggest that the insulation effect of the coating on the block wall is superior to that on the brick wall, and the insulation effects across all three wall types appear to be relatively stable over time.
3.1.5. Temperature Stability Test before and after Coating in Geodesic Building Classroom
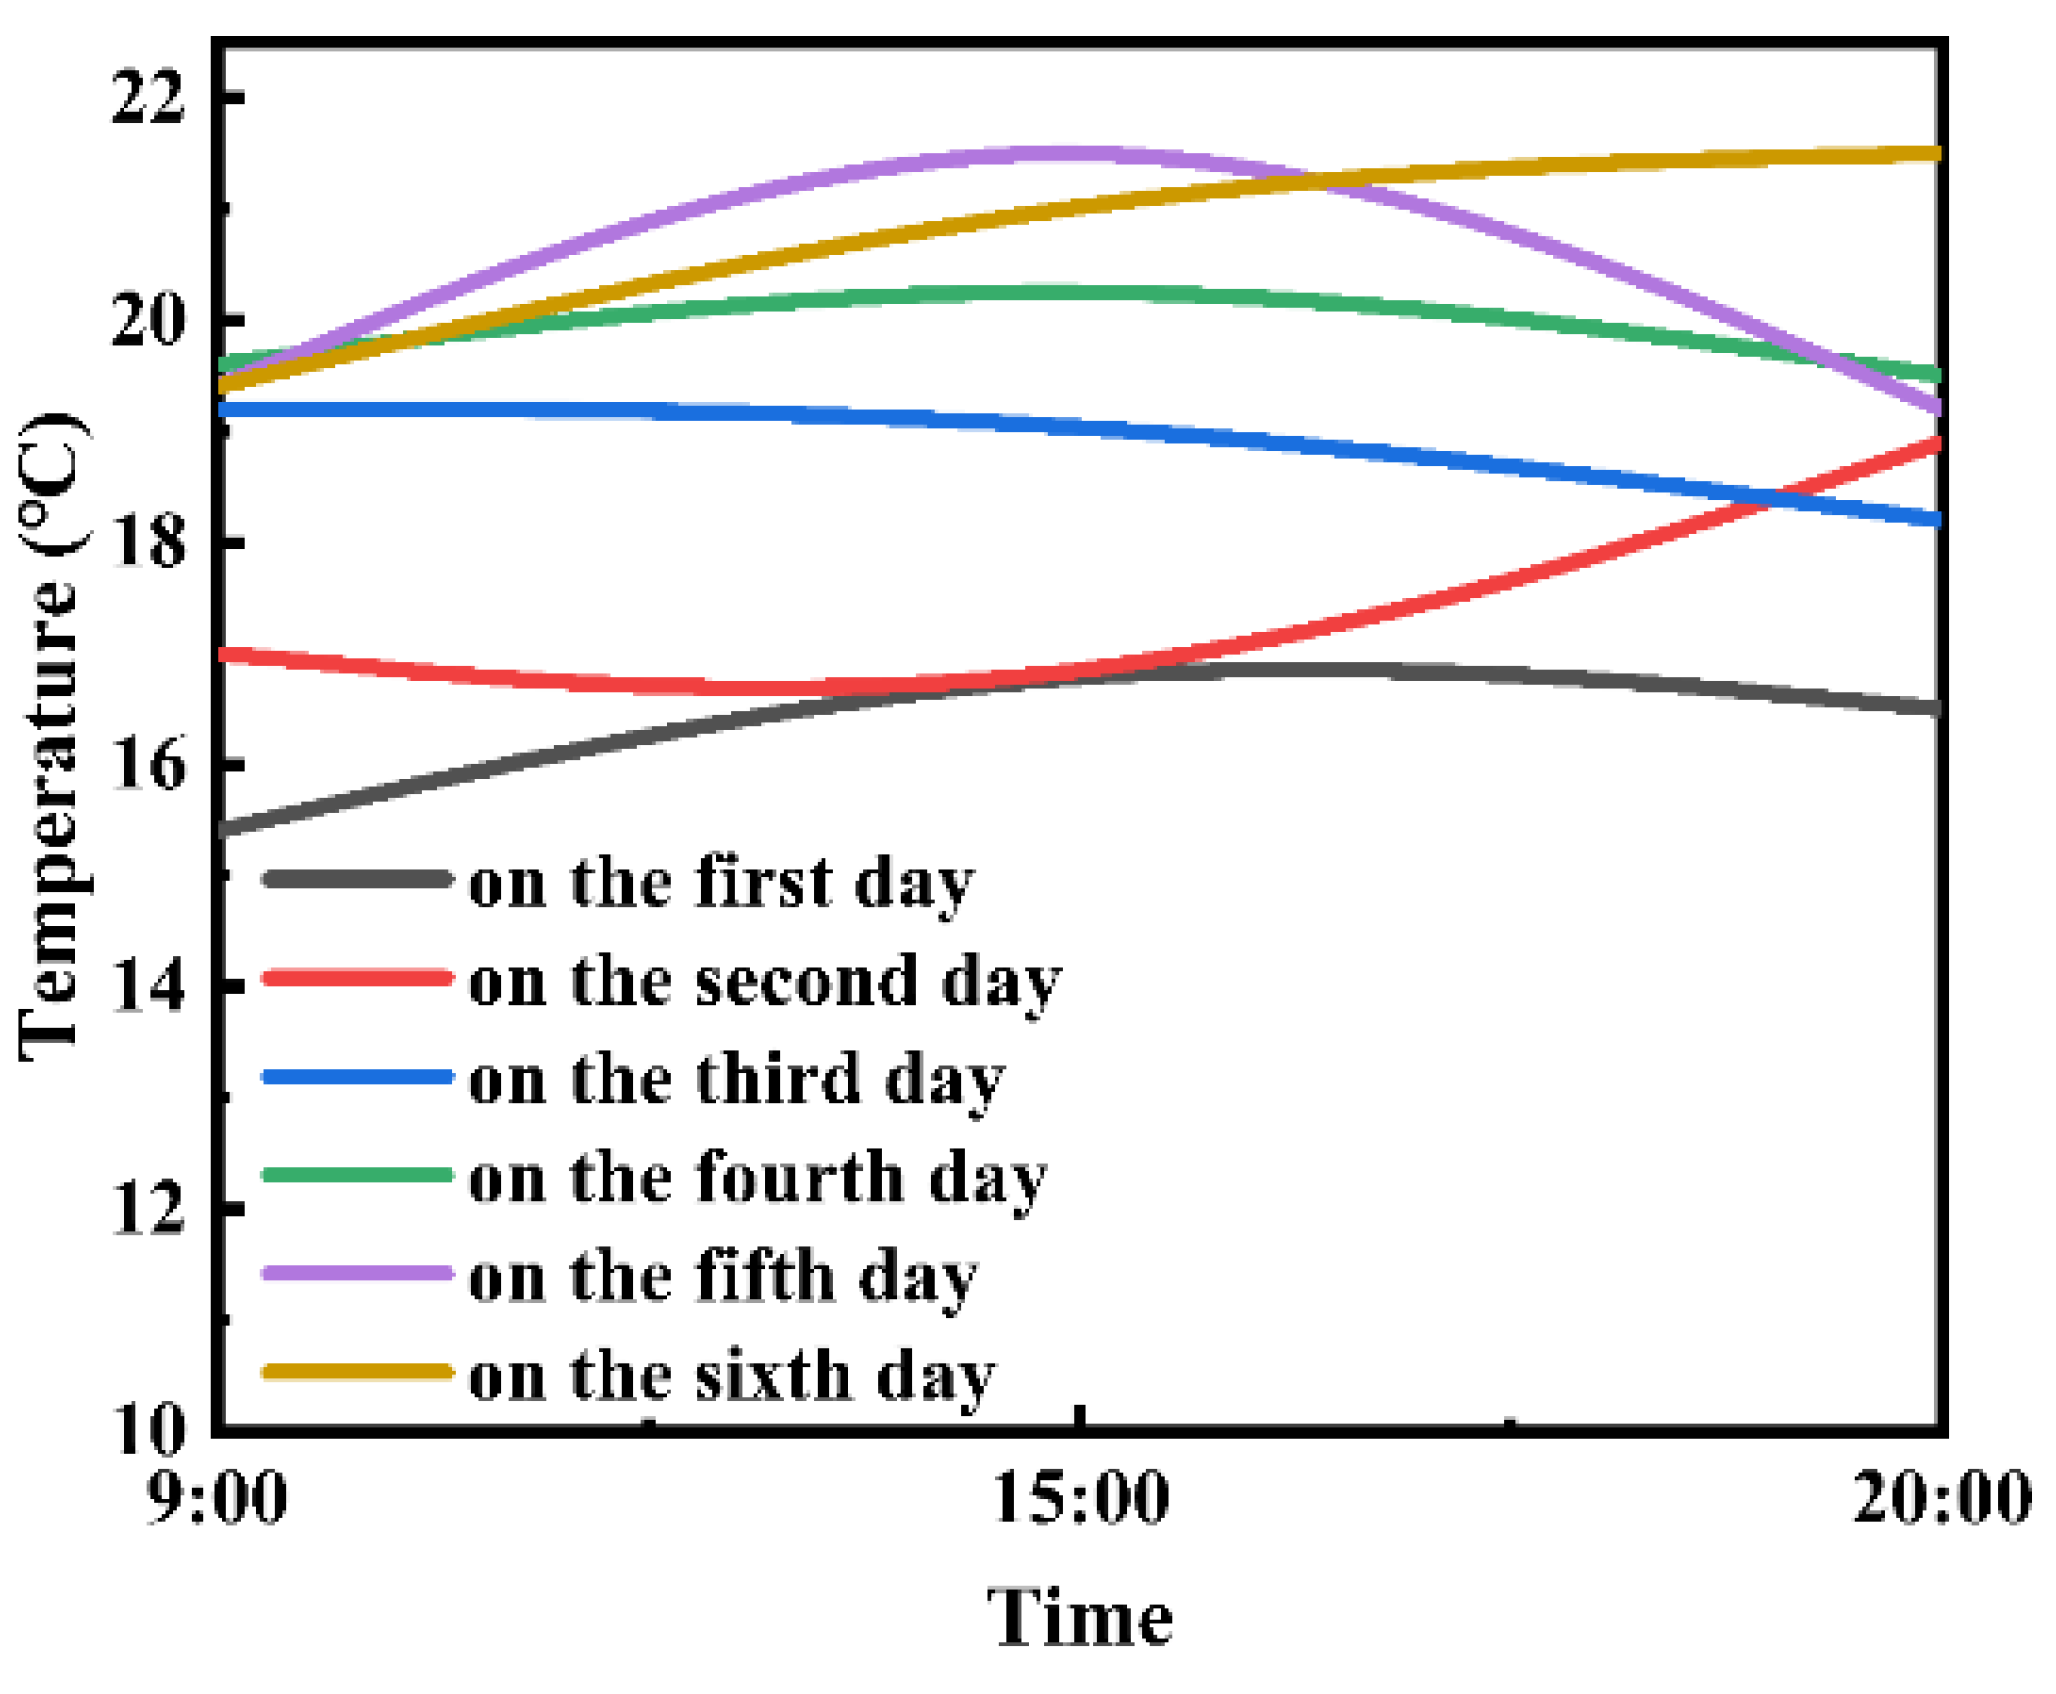
As shown in
Figure 9, before and after painting, the indoor temperature increased, and the insulation effect gradually became stable, and the indoor temperature difference reached about 4.5℃.
3.2. Thermal Reflection Characteristic
3.2.1. Comparison of Heat Flux Reflected by Three Bare Walls and Three Walls with One Coat of Paint
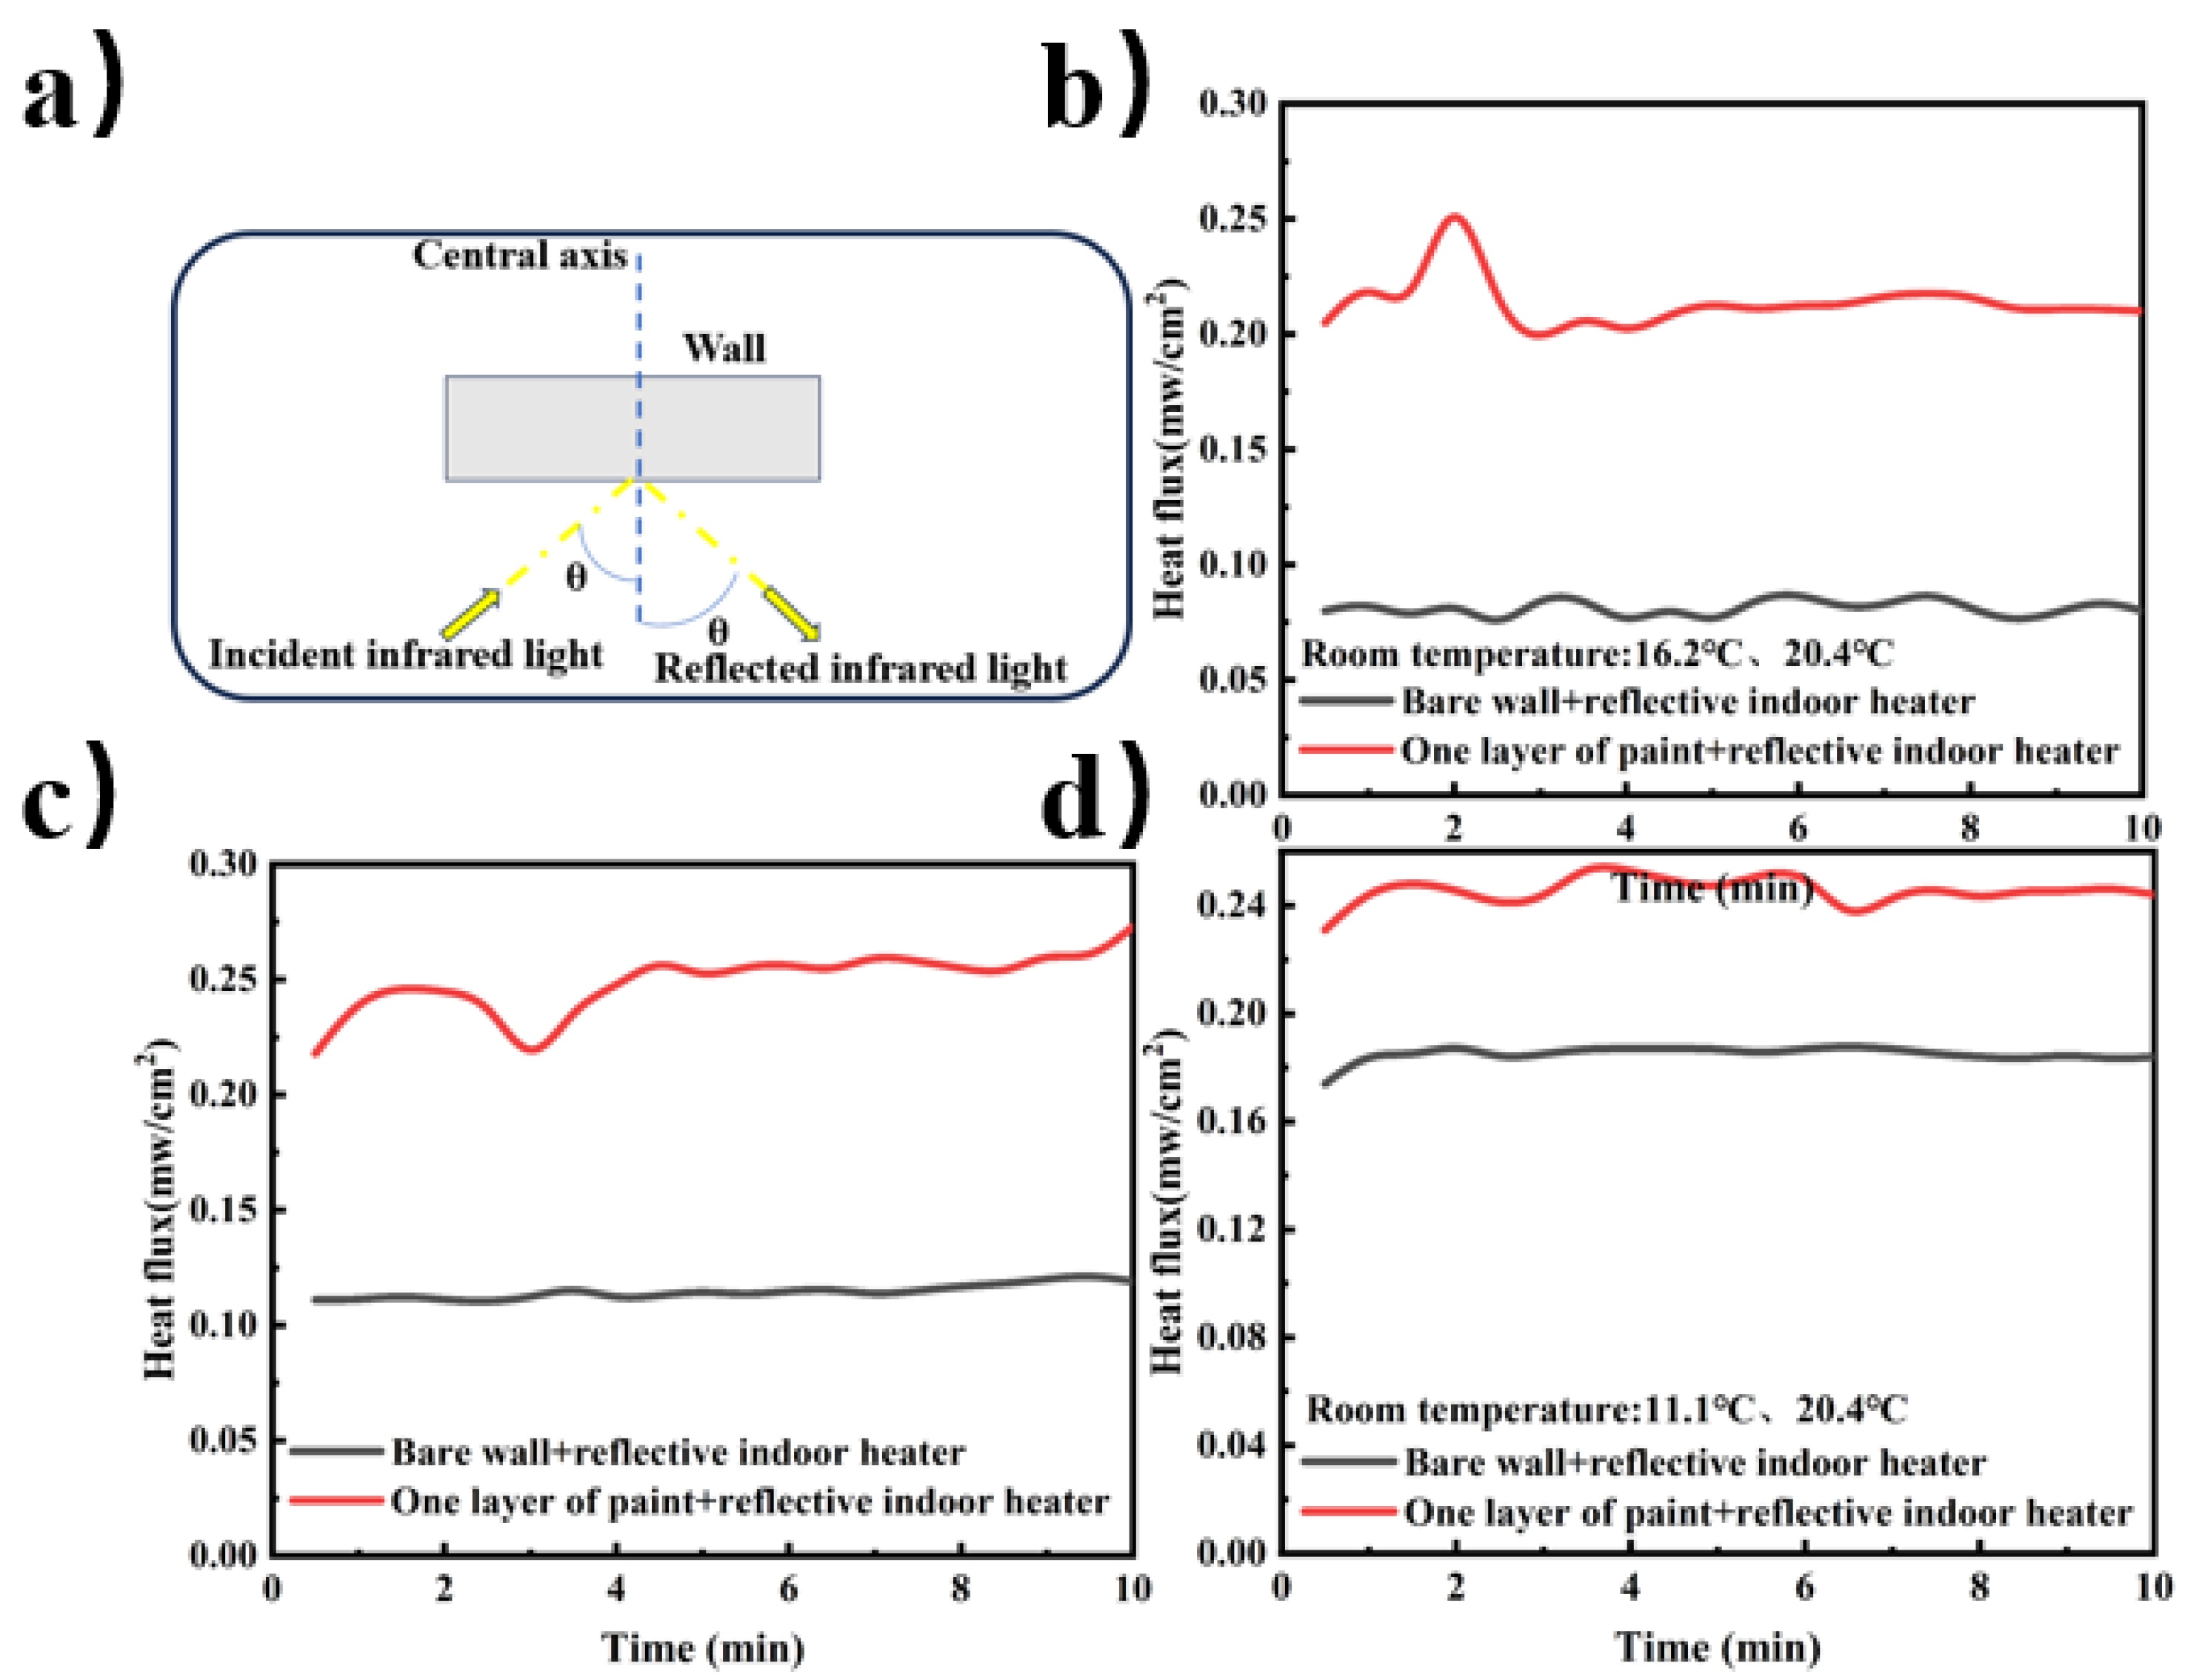
Figure 10.
a Schematic diagram of heat flux test.b The heat flux reflected by a bare wall and a coated block wall under the heat source.c Brick wall The heat flux reflected by a bare wall and a coated brick wall under the heat source.d Heat flux reflected by the heat source on bare and coated earth walls(θ is 10°~60°).
3.2.2. The Heat Flux Reflected by the Wall after a Coat of Paint Changes with the Placement Angle of the Heat Source
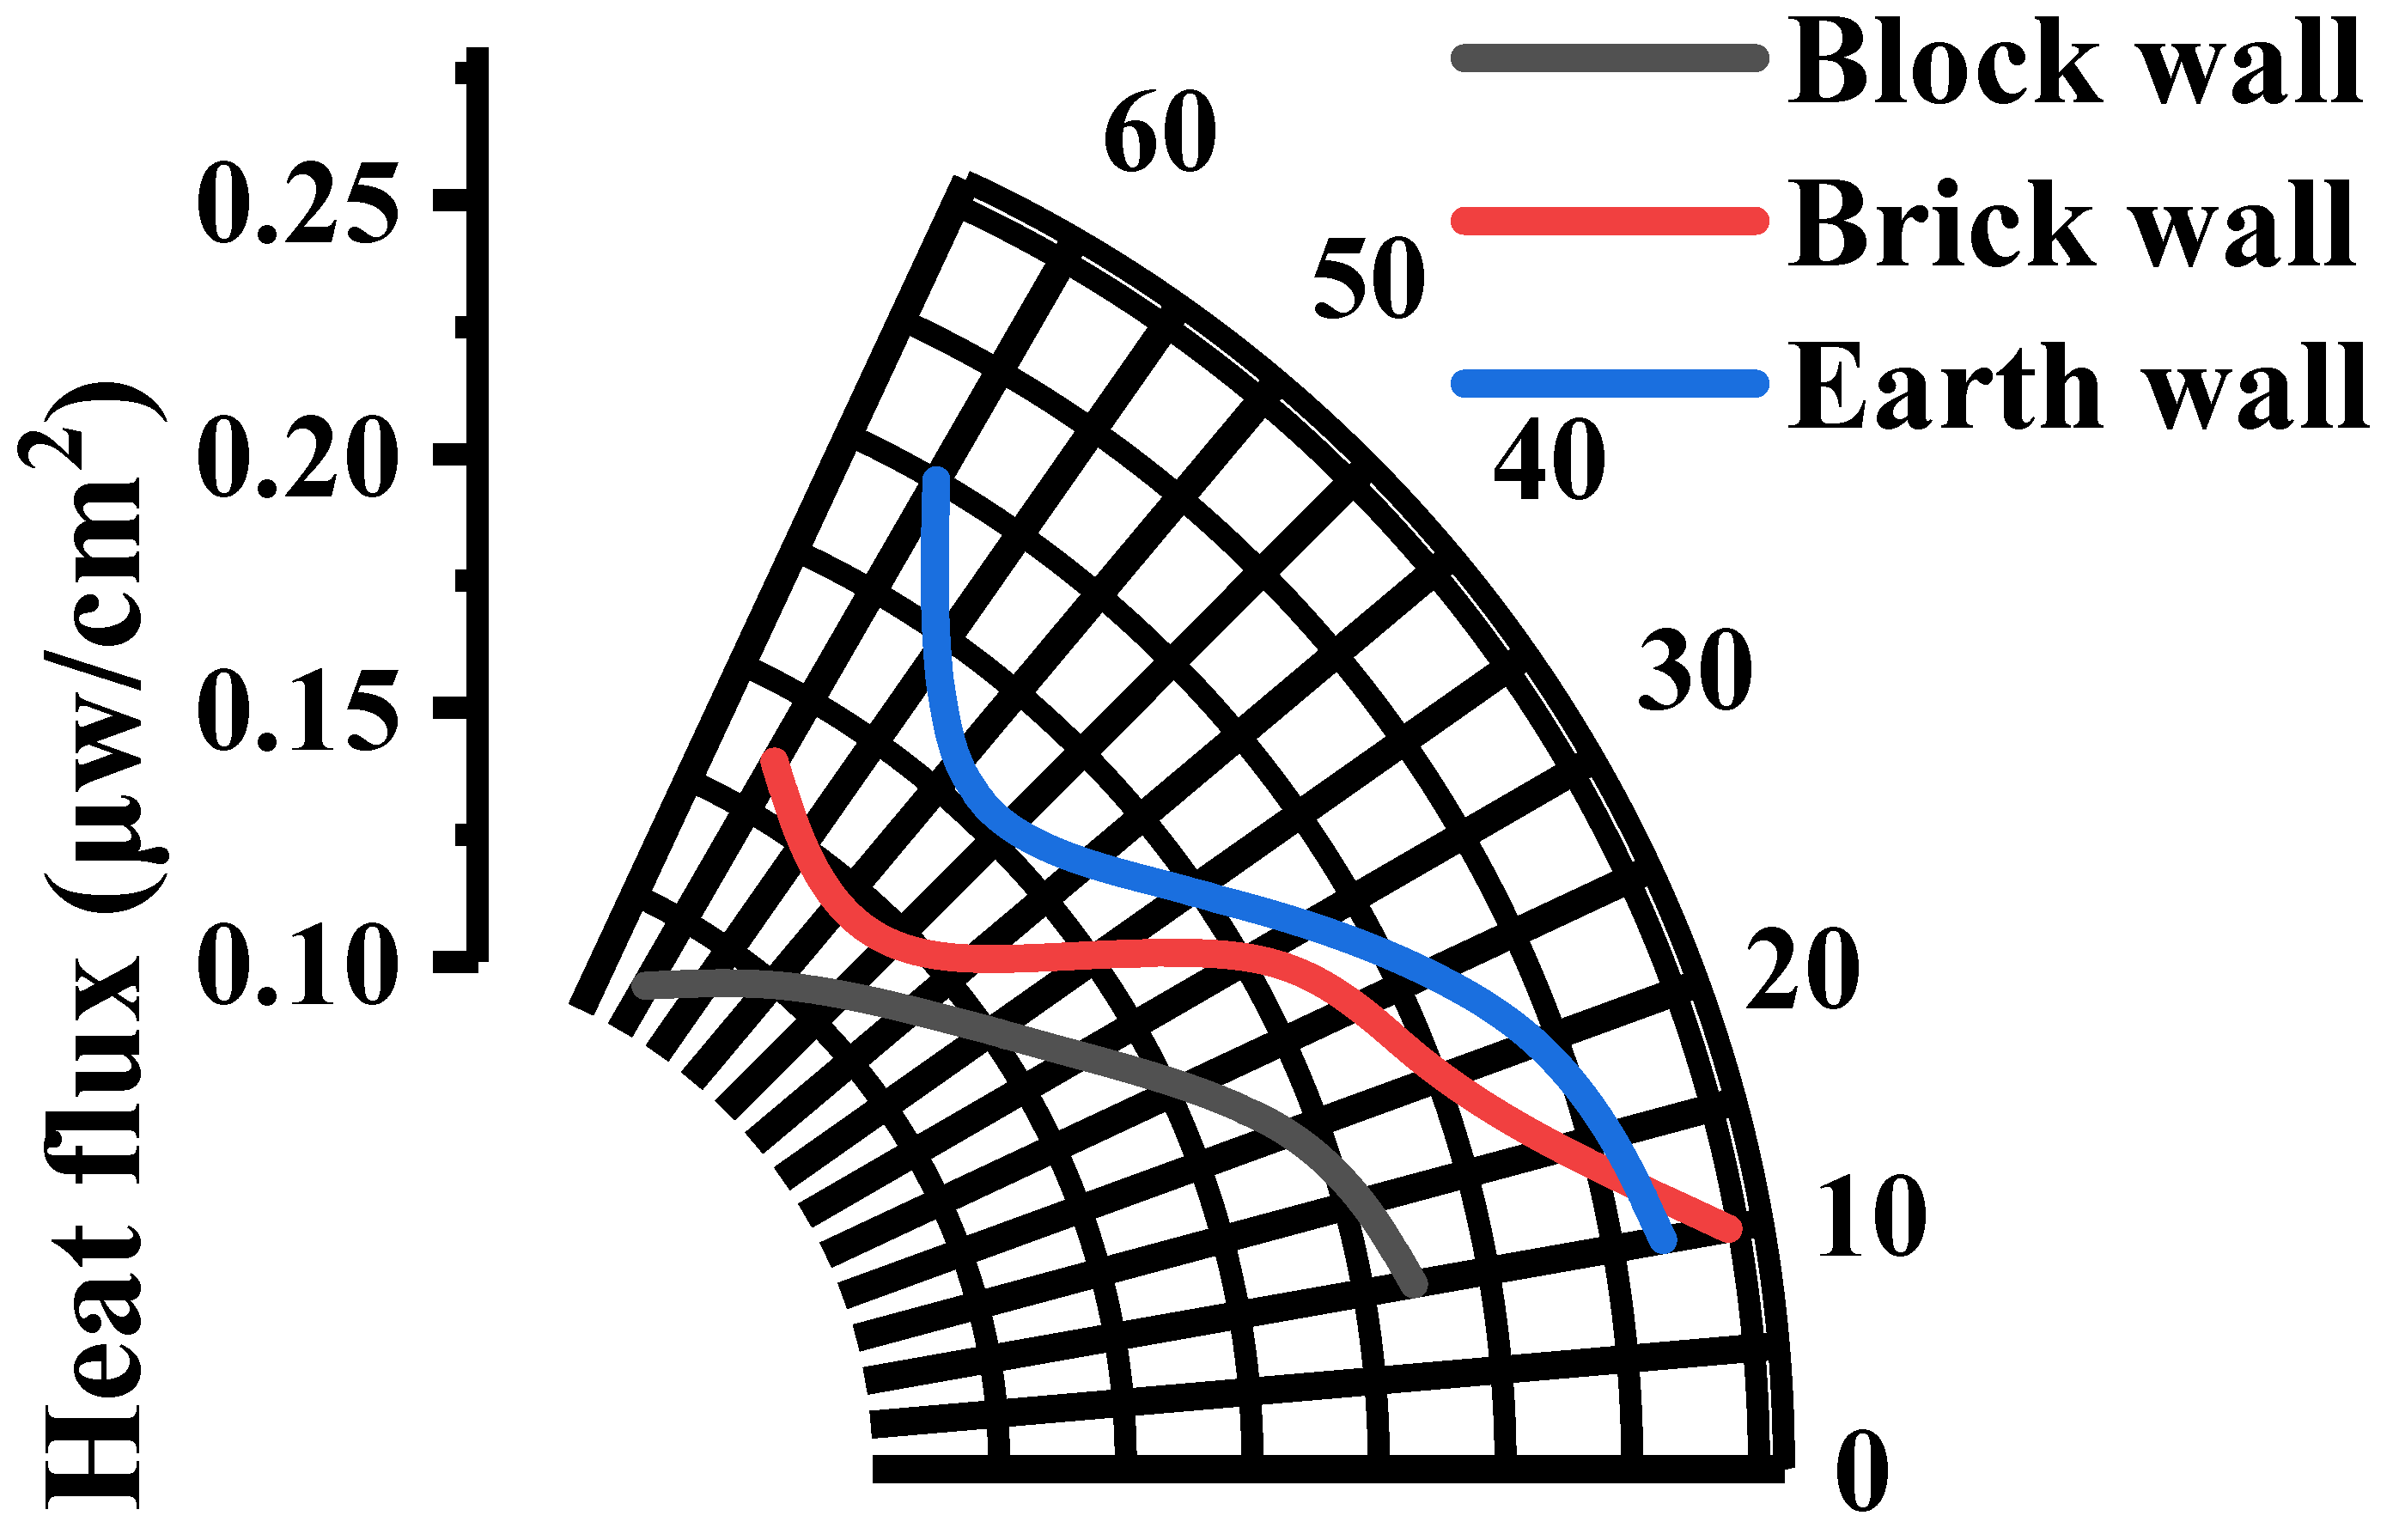
Figure 11 illustrates the test outcomes for the block wall, where external conditions significantly influenced the heat flux measurements at 70° and 80°, leading to the omission of related data and images. The experimental records show that when the indoor reflective heater is positioned at an angle of about 10°, the heat flux reaching the wall is 0.959 mw/cm². The highest heat flux reflection from the block wall, occurring at angles between 10° and 20°, is 0.211 mw/cm², giving a reflection ratio of 0.22. For the brick wall, external conditions also heavily impacted the measurements at 70° and 80°, and thus, these data points are excluded. When the heater is at an angle of about 10°, the incoming heat flux is 1.395 mw/cm². The peak reflection, observed between 10° and 20°, is 0.258 mw/cm², resulting in a reflection ratio of 0.18. Regarding the earth wall, external test conditions at 70° and 80° similarly necessitated the omission of data and visuals. The heat flux reaching the wall with the heater at approximately 10° is 1.199 mw/cm². The maximum reflection, noted between 10° and 20°, is 0.26 mw/cm², with a reflection ratio of 0.22.
In summary, after the application of the thermal insulation coating, the heat flux reflection ratios for the three walls are relatively similar, demonstrating a pronounced effect of the coating on heat flux reflection. The highest reflection occurs between angles of 10° and 20° for all wall types.
3.2.3. The Change in Heat Flux Reflected by the Wall for 3 Consecutive Days after a Coat of Paint Is Applied
As illustrated in
Figure 12, there is minimal variation in the heat flux reflection by the three walls over three consecutive days. According to
Table 1, the heat flux reflection ratio of the earth wall remains consistent over time, whereas the ratios for the block and brick walls show some variation, suggesting that the coating on the earth wall achieves a stable insulation effect more rapidly.
4. Conclusions
A systematic study was undertaken to examine the thermal reflection characteristics of walls with different base materials. The application of thermal reflective coatings substantially increased both the insulation temperature differential and the heat flux reflectivity of the walls. Composite inorganic coatings were found to effectively diminish both the heat absorption and reflective radiation of the walls, thereby reducing indoor energy consumption. In a comparative experiment conducted within a room, the indoor temperature difference was observed to reach approximately 4.5°C before and after the application of the coating. Heat reflective coatings demonstrated a pronounced effect on reflective heat flux, particularly when the θ ranged from 10° to 20°, during which the heat flux reflected by the wall was at its maximum. The heat flux reflectivity among the three types of walls showed no significant differences. This coating has proven suitable for various regions and settings, ensuring its effectiveness for long-term use.
Author Contributions
Conceptualization, J.S.; Methodology, J.S. and M.Y.W.; Validation, M.Y.W. and P.W.; Resources, J.S.; Data curation, M.Y.W and G.L.L.; Writing original draft, M.Y.W and Y.L , Writing review & editing, M.Y.W and M.Y.Y. All authors have read and agreed to the publishedyersion of the manuscriot.
Funding
This research received no external funding.
Institutional Review Board Statement
Not applicable.
Informed Consent Statement
Not applicable.
Data Availability Statement
No new data were created or analyzed in this study. Data sharing is not applicable to this article.
Conflicts of Interest
The authors declare no conflicts of interest.
References
- Zhou Z, Zhang Z, Huang J, Wang Y. Water-based intumescent fire resistance coating containing organic-modified glass fiber for steel structure. Journal of Cleaner Production. 2024;442:140897. [CrossRef]
- Zhao L, Yao S, Nan Y, Qin L, Yi S. Research Status and Development Trend of Sintered Solid Waste-based Wall Insulation Materials. Paper presented at: Journal of Physics: Conference Series2023.
- Zhang Y, Yin S, Mu H, Zhang X, Tan Q, Shao B. Study on the performance of lightweight roadway wall thermal insulation coating containing EP-GHB mixed ceramsite. Paper presented at: Building Simulation2024. [CrossRef]
- Zhang Q, Wang Q, Li Y, Li Z, Liu S. Effects and Mechanisms of Ultralow Concentrations of Different Types of Graphene Oxide Flakes on Fire Resistance of Water-Based Intumescent Coatings. Coatings. 2024;14(2):162. [CrossRef]
- Zhang L, Zhang A-N, He S-M, et al. Biomimetic Nanoporous Transparent Universal Fire-Resistant Coatings. ACS Applied Materials & Interfaces. 2024. [CrossRef]
- Tsapko Y, Kasianchuk I, Likhnyovskyi R, et al. DETERMINING THERMAL AND PHYSICAL CHARACTERISTICS OF WOOD POLYMER MATERIAL FOR PIPELINE THERMAL INSULATION. Eastern-European Journal of Enterprise Technologies. 2023;125(10). [CrossRef]
- Tokunaga J, Koide H, Mogami K, Hikosaka T. Comparative studies on the aging of thermally upgraded paper insulation in palm fatty acid ester, mineral oil, and natural ester. IEEE Transactions on Dielectrics and Electrical Insulation. 2016;23(1):258-265. [CrossRef]
- Seok PH, Prakash D. Development of a resilient cable joint for the insulation system of oil tanks. Journal of Mechanical Science and Technology. 2012/11/01 2012;26(11):3617-3624. [CrossRef]
- Porzuczek J. Comparative Study on Selected Insulating Materials for Industrial Piping. Materials. 2024;17(7):1601. [CrossRef]
- Lipkovich I, Tokareva A, Gracheva N, Panchenko S, Ukrainians M. Evaluation of thermal insulation of pipelines in the overhead method of laying in the climatic conditions of the South of Russia. Paper presented at: IOP Conference Series: Earth and Environmental Science2023.
- Guan J, Wei Z, Yan L, Tang X, Xu Z. Construction of organophosphate-functionalized α-zirconium phosphate towards fire-resistant, weather-resistant and antibacterial reinforcement of transparent fireproof coatings applied on wood substrates. Progress in Organic Coatings. 2024;190:108397. [CrossRef]
- Fang Y, Ma Z, Wei D, et al. Engineering Sulfur-containing Polymeric Fire-Retardant Coatings for Fire-Safe Rigid Polyurethane Foam. Macromolecular Rapid Communications. 2024:2400068.
- De Mets T, Prignon M, Knapen E. Lime-hemp as Wall Insulation-Hygrothermal Performance Analysis by Validated Simulations. Paper presented at: Journal of Physics: Conference Series2023. [CrossRef]
- Capolupo F, D’Alessandro C, Strazzullo P, Russo R, Musto M. Design and thermal test of high-vacuum insulator for heat delivery pipes. Paper presented at: Journal of Physics: Conference Series2024. [CrossRef]
- Alsaffar AKK, Alquzweeni SS, Al-Ameer LR, et al. Development of eco-friendly wall insulation layer utilising the wastes of the packing industry. Heliyon. 2023;9(11). [CrossRef]
- Zhuang XW, Li SH, Ma YF, et al. Preparation and performance research on phenolic insulation foam used low-temperature foaming technology. Advanced Materials Research. 2011;250:450-454. [CrossRef]
- Yu Z, Liang D. Study on preparation of insulation and flame retardant building materials with inorganic compound phenolic foam. Chemical Engineering Transactions. 2016;55:325-330.
- Yao JW, Hou ZM, Yao YS. Application of phenolic foam plate in the exterior wall thermal insulation. Applied Mechanics and Materials. 2012;174:1363-1366. [CrossRef]
- Tingley DD, Hathway A, Davison B, Allwood D. The environmental impact of phenolic foam insulation boards. Proceedings of the Institution of Civil Engineers-Construction Materials. 2017;170(2):91-103.
- Kowalska BZ, Szajding A, Zakrzewska P, Kuźnia M, Stanik R, Gude M. Disposal of rigid polyurethane foam with fly ash as a method to obtain sustainable thermal insulation material. Construction and Building Materials. 2024;417:135329. [CrossRef]
- Kabundu E, Mbanga S, Botha B, Ayesu-Koranteng E. Relative Comparison of Benefits of Floor Slab Insulation Methods, Using Polyiso and Extruded Polystyrene Materials in South Africa, Subject to the New National Building Energy Efficiency Standards. Energies. 2024;17(2):539. [CrossRef]
- Jensen NF, Rode C, Andersen B, Bjarløv SP, Møller EB. Internal insulation of solid masonry walls-Field experiment with Phenolic foam and lime-cork based insulating plaster. Paper presented at: E3S Web of Conferences2020. [CrossRef]
- Benchouia HE, Boussehel H, Guerira B, et al. An experimental evaluation of a hybrid bio-composite based on date palm petiole fibers, expanded polystyrene waste, and gypsum plaster as a sustainable insulating building material. Construction and Building Materials. 2024;422:135735. [CrossRef]
- Shen L, Tan H, Ye Y, He W. Using fumed silica to develop thermal insulation cement for medium–low temperature geothermal wells. Materials. 2022;15(14):5087. [CrossRef]
- Li Q, Chen H, Li Z. Preparation and properties of silicate inorganic external wall insulation materials based on heat storage. Thermal Science. 2023;27(2 Part A):941-948. [CrossRef]
- Jian J, Luo W, Liu H, Jiang Y. Numerical Simulation Verification of the Application of Inorganic Thermal Insulation Materials to the Surrounding Rock of Roadways. Paper presented at: Journal of Physics: Conference Series2023.
- Malewska E, Prociak A, Vevere L, et al. New Thermo-Reflective Coatings for Applications as a Layer of Heat Insulating Materials. Materials. 2022;15(16):5642. [CrossRef]
- Marwan M. The effect of wall material on energy cost reduction in building. Case Studies in Thermal Engineering. 2020;17:100573. [CrossRef]
- Lin Y, Liu Y, Jia G, Wang C, Li Y, Wu L. High heat-reflective and superhydrophobicity properties functional fabrics. Ceramics International. 2024. [CrossRef]
- Luo C-L, Zheng L-X, Jiao J-Y, et al. Enhanced passive radiative cooling coating with Y2O3 for thermal management of building. Optical Materials. 2023;138:113710. [CrossRef]
- Yuan J, Shimazaki Y, Zhang R, Masuko S, Cao S-J. Can retro-reflective materials replace diffuse highly reflective materials for urban buildings’ wall to improve outdoor thermal comfort? Heliyon. 2023;9(4).
|
Disclaimer/Publisher’s Note: The statements, opinions and data contained in all publications are solely those of the individual author(s) and contributor(s) and not of MDPI and/or the editor(s). MDPI and/or the editor(s) disclaim responsibility for any injury to people or property resulting from any ideas, methods, instructions or products referred to in the content. |
© 2024 by the authors. Licensee MDPI, Basel, Switzerland. This article is an open access article distributed under the terms and conditions of the Creative Commons Attribution (CC BY) license (http://creativecommons.org/licenses/by/4.0/).
