1. Introduction
The increase in the number of accumulated plastics and in the pressure, they exert on the environment have become vital world issues. Present research has identified that in the current world the generation of plastic waste is about 353 million tonnes per year with only 9% being recycled and the remaining 91% forming a part of the pollution and landfill [
1]. This is a critical matter which requires significant attention and further definite actions in order to reduce its impact. At the same time, the use of electronic devices has also contributed to the generation of these wastes through their disposal, where it is estimated that electronic waste ranges between 20 and 50 million tonnes globally [
2]. Indeed, this poses a double burden which highlights the importance of efficient methods of waste management for plastics as well as electronics.
Tyre waste is among the major forms of waste that have a negative impact on the immediate environment. In Australia, about 459000 tonnes of used tyres are disposed every year, and these come with potential dangerous like pollution, fire outbreak, and harm to the environment [
3,
4]. Therefore, the question of how to deal with this rising waste stream efficiently is critical to bestowing environmental sustainability to the future. One of such approaches includes using scraps and wastes like used tyres in construction applications especially in making concrete.
Recent works have also focused on the viability of incorporating waste tyres in concrete in a bid to recycle waste and enhance material properties. Use of tyre rubber in concrete has been found to have its advantages and disadvantages. Although it can enhance some characteristics such as earthquake performance and sound insulation, it commonly decreases compressive and tensile strength [
5]. This fine line between the material makes up and the intended application requires specific investigations to enhance the use of waste materials in concrete production.
The use of waste materials in non-structural concrete offers a complex solution to both environmental and economic issues. To make concrete, natural aggregates can be replaced with waste plastic and tyres since it has environmental benefits and may help limit various costs [
6]. However, this approach is not without its disadvantages. Several research have established a progressive reduction of the compressive strength of concrete with the incorporation of waste materials [
7]. The size distribution of the waste materials and the incorporation of superplasticizers are other factors that influence concrete characteristics [
8,
9].
However, the use of waste plastic and tyre rubber in concrete still holds great potential with regards to solving waste issues and environmental problems. Cement and concrete chemists ensure optimal combination of concrete mixtures that can result in lesser strength and at the same time can gain environmental advantage [
5].
The goals of this research are broad and encompassing in their approach. These include establishing the physical characteristics of waste plastic and tyre aggregates, assessing the usability of concrete mixtures containing waste plastic and tyre aggregates as reinforcements and determining the concrete’s compressive strength, tensile strength and flexural strength. Also, the research seeks to assess changes in LCA parameters with varying waste content percentages and recommend appropriate proportionality for non-structural concrete blends. The relevance of this research is highlighted based on optimum use of waste material like plastic and tyre rubber aggregates in building construction. Through examination of the material properties of these waste aggregates and their effect on the workability and strength of concrete, the study aims to improve the efficiency and sustainability of non-structural concrete. Further, the life cycle assessment shall reveal the environmental concerns which will be useful in the development of green concrete.
The use of waste materials, especially tyre and plastic waste in non-structural concrete has attracted a lot of interest in the recent past. Due to their characteristics, these waste materials can be used as a substitute for conventional aggregates in concrete mainly for non-structural uses such as pavements, sidewalks, and landscaping. Measurements of the performance mechanisms of non-structural concrete with tyre and plastic waste need to be taken in order to determine its feasibility and sustainability.
Knowledge of the physical characteristics of waste materials is essential to their ability to be used in concrete. For instance, plastic waste has been researched widely as a concrete aggregate material. Some of the studies have suggested that plastic waste can improve the performance of concrete in terms of strength, durability and workability (Belmokaddem et al. , 2020). However, there are limitations like low specific gravity of plastic compared to mineral aggregates and influence of particle size on the bond between particles and concrete matrix [
10]. The other factor that arises from the study is the chemical type of plastic waste which influences its compatibility with cement and other materials [
11].
Tyre waste which varies in its rubber content and particle size also has its own prospects and difficulties. Some of the benefits that have been realized from rubberized concrete are better workability and abrasion resistance, however; rubber always decreases compressive and flexural strengths [
12]. Some of the surface treatments include washing of the rubber surface with sodium hydroxide solutions, which improves the interaction between the rubber surface and cement [
13,
14].
The disposal and management of solid waste, for instance used tyres continues to be a challenge. Tyres have risk factors, for example the ability to hold water leading to mosquito breeding, and when burnt emits pollutants [
15,
16]. According to Mohammed et al. , (2012) [
17] billions of tyres are dumped worldwide annually raising concerns on environmental pollution and appropriate disposal. The above disadvantages could however be offset if tyre waste was well incorporated into concrete to produce useful construction materials.
Non-structural concrete, which is used in walkway, driveway, and ornamental work, can provide an opportunity to dispose of waste materials. As for this type of concrete, the functionality, durability, and aesthetics should be in harmony. The use of recycled aggregates and supplementary cementitious and waste materials in non-structural concrete has numerous ecological advantages, including sustainable construction and environmental protection [
18]. Studies on the performance mechanisms of non-structural concrete with plastic and tyre waste are directed towards improving ecological efficiencies and minimizing pollution levels across the globe. It is therefore important to appreciate how these waste materials affect concrete characteristics like workability, durability, and strength. Literature has established that incorporation of plastics and tyres decreases the strength of compression while use of tyre debris affects workability and durability [
19,
20]. But successfully integrating these systems requires knowledge of the ideal mixture compositions as well as the processes governing their interaction.
The key focus of this study is to design concrete mixtures that use waste plastic and tyres in their production while considering the mechanical properties and environmental impact. The focus of this work is to present guidelines for the use of these waste materials in non-structural concrete through the assessment of the material properties, workability and strength of the various concrete mixtures. This research is significant in expanding the knowledge of the use of waste materials in concrete production with the intention of improving the environmental status of the construction industry.
2. Proposed Approach
The research is focused on integrating plastic and tyre waste materials into non-structural concrete. It is emphasis on the rising concerns relating to environmental issues and the need for environmentally efficient construction techniques. The tendency of this research work is to provide a detailed assessment of the properties and performance behaviour of waste materials in concrete. This investigative approach entails the collection of data, performance of different tests and the use of the MATLAB software in the evaluation of the data gathered. This emphasis is on the sustainability and feasibility of using waste substances specially for the purpose of constructing non-structural and non-structural concrete elements.
2.1. Evaluation of Material Characteristics
One of the components of this work involves evaluating physical characteristics of waste plastics and tyre materials that will be used in the non-structural concrete. The key properties include the specific gravity, water absorption, and the bulk density.
Specific Gravity indicates density of waste material that was specified and tested. The nature of these waste materials and concrete aggregates should also be found out in order to categorize them [
21].
The measurement of water absorption is used equally in the assessment of the durability of concrete. Water absorbing material can detach the particles of concrete and results in its weak structure [
22].
Knowledge of waste aggregate mass and volume as well as other factors like bulk density is important [
23].
2.2. Evaluation of Performance Mechanisms
This work seeks to investigate the effectiveness of the performance mechanisms of waste plastic and tyre materials in non-structural concrete. These mechanisms shall be checked for workability, compressive strengths, flexural strength and tensile strength. These experiments vary the quantities of waste material [as shown in
Table 1] used in the mix to determine the impact of waste material exchange on accomplishment.
The slump test indicates the compactness and the appropriate application of concrete. Various proportions of waste material are introduced to find out the impact on concrete handling and shaping [
24].
The effectiveness of concrete can solely be measured by its compressive strength. The performance measure of the research is the compressive strength of concrete mixture at 28 days. It looks at the impact of varying replacement percentages of waste material. This is important in determining the concrete mechanical strength [
24].
Flexural strength is important for concrete under twisting or tension loads. Measuring the flexural strength of concrete at 28 days with different waste material replacements enables an assessment of its performance and endurance [
25].
Non-structural concrete uses require tensile resilience. Therefore, the study looks at the impact of waste material substitution on the tensile strength of the concrete at 28 days, in terms of tension load [
26].
2.3. Types of Concrete Grades Employed
In this study, as affected by the type of data available concrete grades have been utilized in the following manner for each waste aggregate replacement.
2.4. Life Cycle Assessment Data Evaluation
For this data evaluation, secondary data of life cycle assessment that have been underpinned by ISO 14040 were chosen [
27]. For this data evaluation data of tyre and plastic percentages of 0% – 30% mixes’ life cycle assessment data were gathered individually and during the data collected the following impact categories were of major concern.
Global warming (kg CO2 eq)
Ozone layer depletion (kg CFC-11 eq)
Terrestrial ecotoxicity (kg 1,4-DB eq)
Acidification (kg SO2 eq)
2.5. Data Collection Method
During this investigation, only the secondary academic articles published during the last fifteen years are examined. Applying this approach ensures that the investigation will incorporate the latest and correct field data available. Investigation and empirical data are important for coming up with conclusions during the investigation.
Since the analysis is done using MATLAB software, it is required that the collected data should have inputs and outputs. The inputs include data obtained from the fluctuating proportion of waste aggregate mix ranging from 0 to 30%. The output data collected for the mix percentages mentioned above include the following characteristics: Compressive strength, tensile strength, flexural strength and workability.
2.5. Data Analysis
The collected data is analyzed using MATLAB for visualization and correlation analysis. This application is selected because it has the capability to process and analyze various large datasets. The goal is to gain an understanding of the relations and dependencies between the information and create a basis for making judgmental and informative recommendations.
The study approach used to assess the efficiency of non-structural concrete with waste materials is particularly methodical and expansive. The first objective is to evaluate characteristics of waste materials and their effects on performance mechanisms. This is done by a series of experiments that assess the effects of waste materials at various replacement levels. The MATLAB application for data evaluation guarantees that the outcomes are well analyzed, and correlations from the dataset are well extracted.
This approach can ensure that the study findings are anchored on a solid foundation of existing knowledge, given that data is sourced from relevant and recent secondary research articles. This research helps in enriching understanding on the use of waste material in non-structural concrete including plastic and tyre waste. This integration has the potential to propagate sustainability and environmentally friendly ways of construction.
Figure 1 shows the research methodological process.
3. Results & Discussion
3.1. Material Properties of Plastic
3.1.1. Specific Gravity
The specific gravity of the plastic waste has fluctuations in terms of specific gravity values which has been calculated as shown in
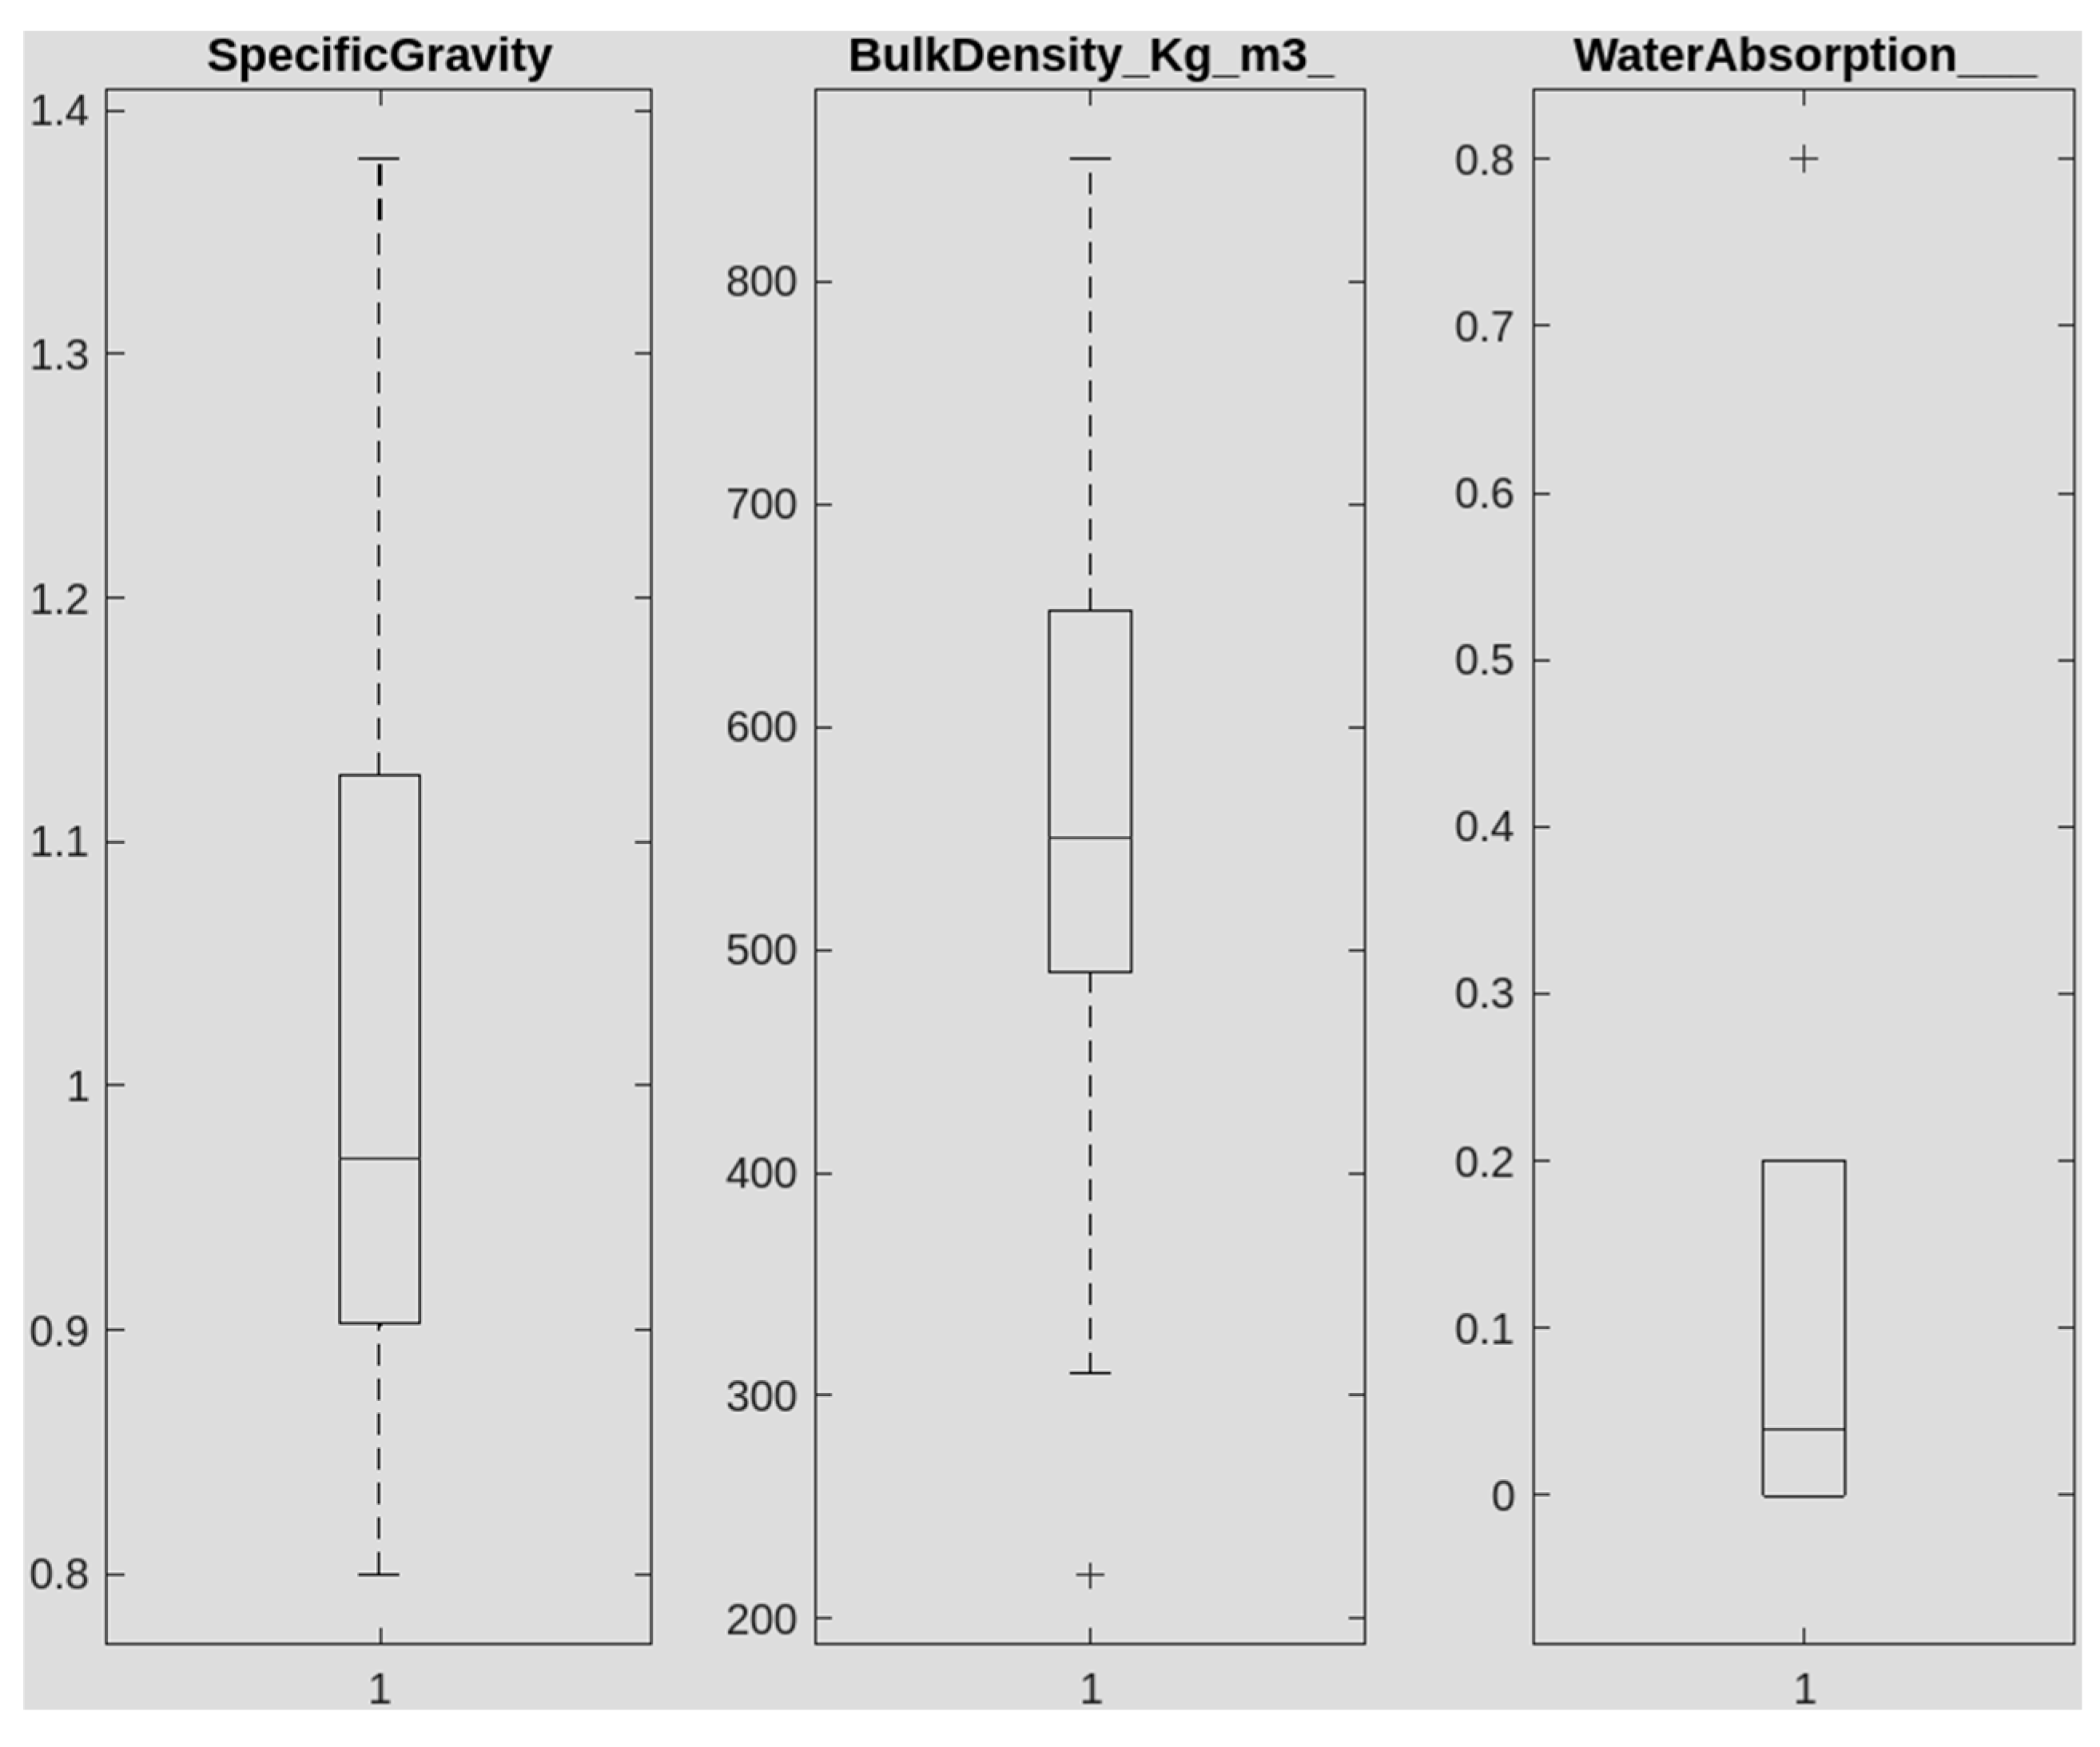
Figure 2. On this basis, the mean specific gravity has been calculated to be equal to 1.02, the least being 0.8 and the highest being 1.38. The variation in the specific gravity shows that waste materials in different articles have variable densities. The articles indicate that plastic waste is used in various forms such as in other particle sizes and forms of plastic. As a result of these factors, numerous values have developed from the following [
28,
29].
3.1.2. Water Absorption
The research revealed that waste containing plastic samples were able to absorb 0.18 water, with variations in the degree of 0 to 0.8, as shown in
Figure 3. This is due to the poor water absorption characteristic of plastic waste, which enhances the hardness of concrete. Particle shapes and types of plastics cause water absorption rates to be dissimilar with waste materials. These differences are important to recognize when choosing or combining waste products that will be used to create a concrete mixture [
29,
30].
3.1.3. Bulk Density
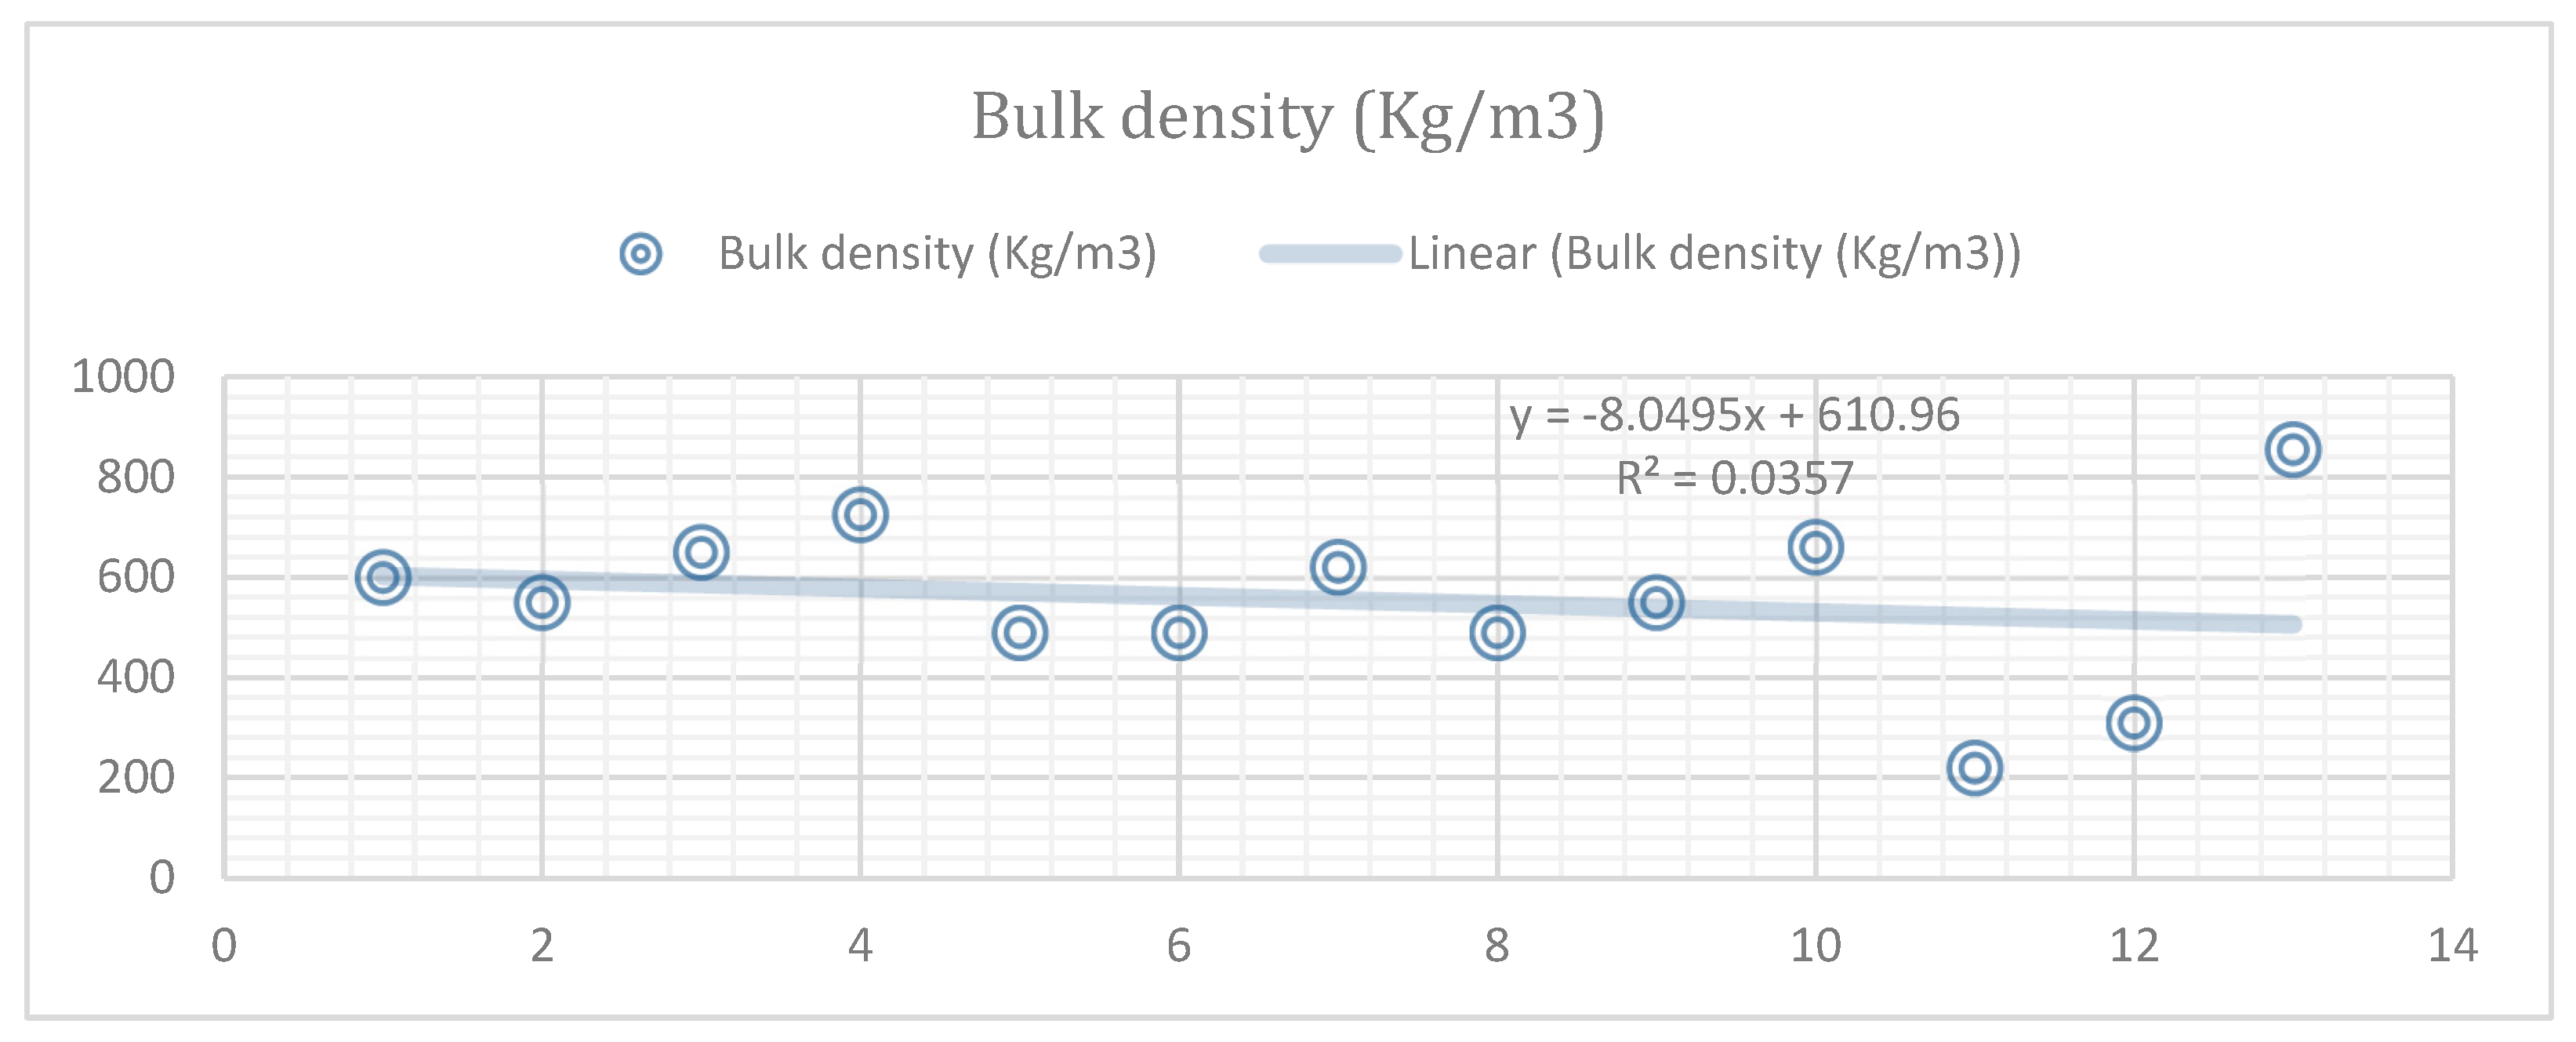
The average bulk density of waste plastics is 554.6 Kg/m³, it varies between 220 and 855 Kg/m³, as shown in
Figure 4. This is because of the fact that material varies in bulk density, because of the plastic waste material particle size. The range observed is caused by various research studies employing different sizes of plastic wastes, as shown in
Figure 5. Thus, bulk density is an essential factor in determining the concrete properties that influence its mix design. Effective bulk density is another significant characteristic of concrete, as it depends on its performance and durability [
31,
50].
3.2. Material Properties of Tyre
3.2.1. Specific Gravity
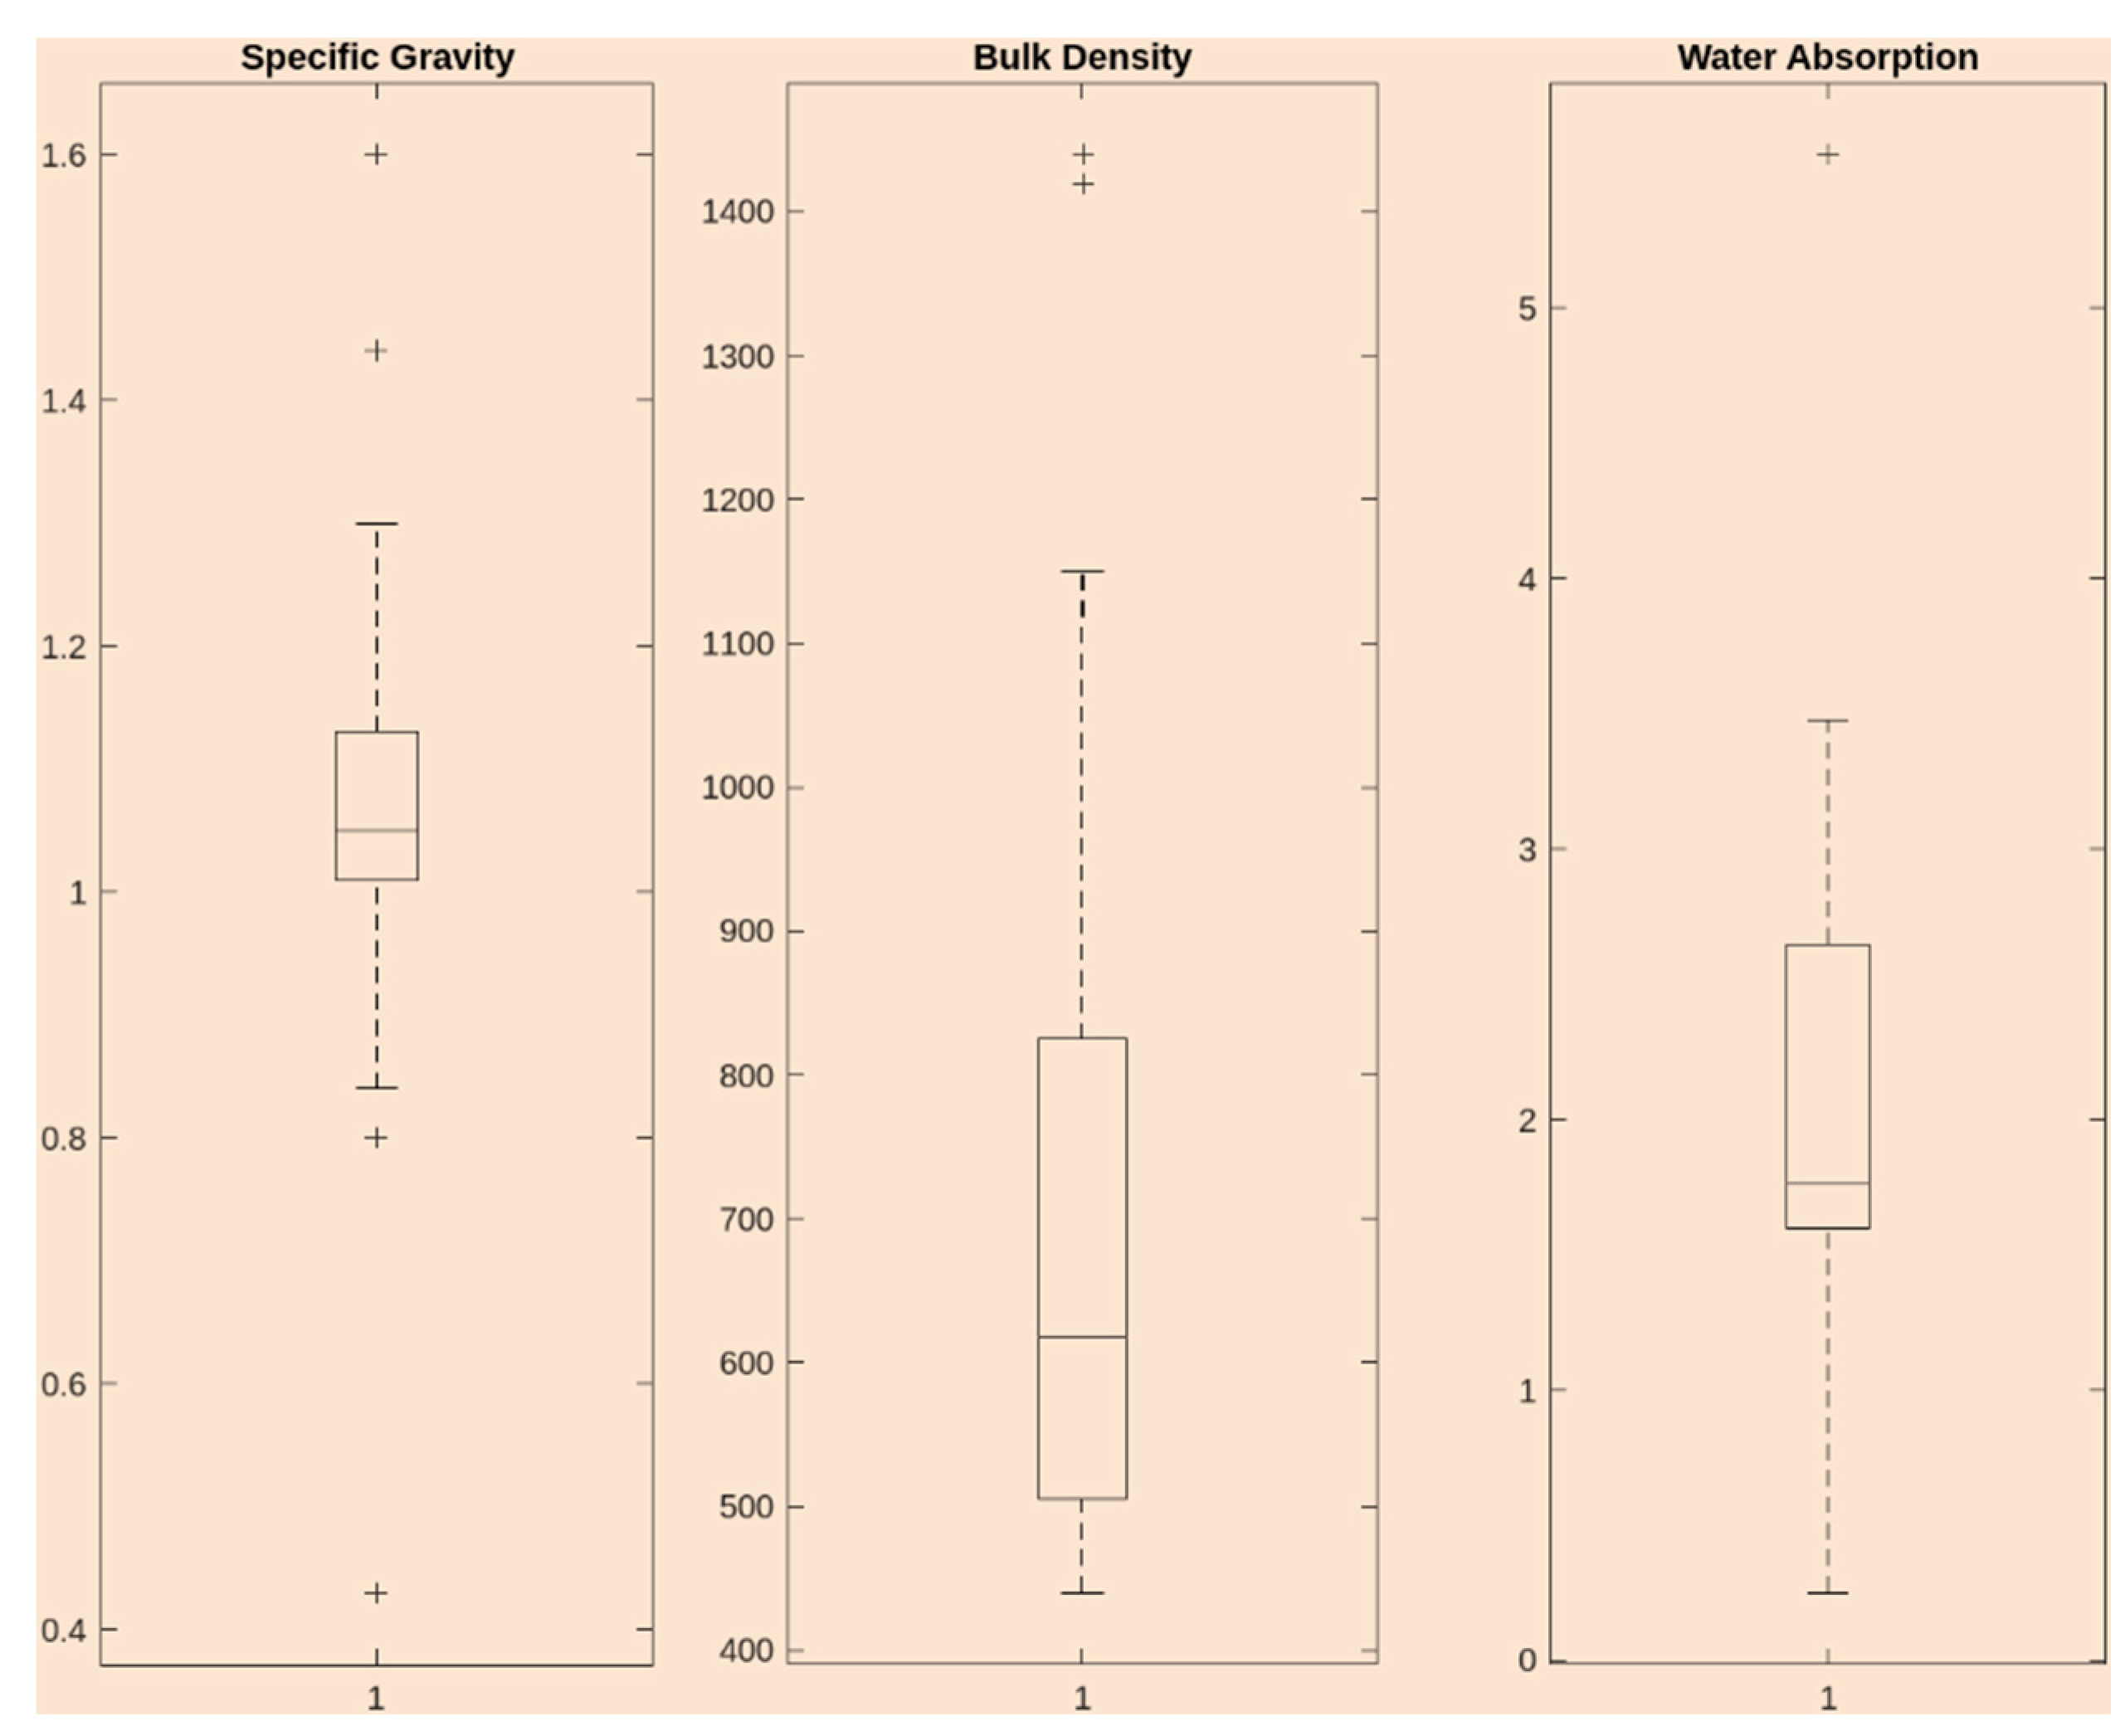
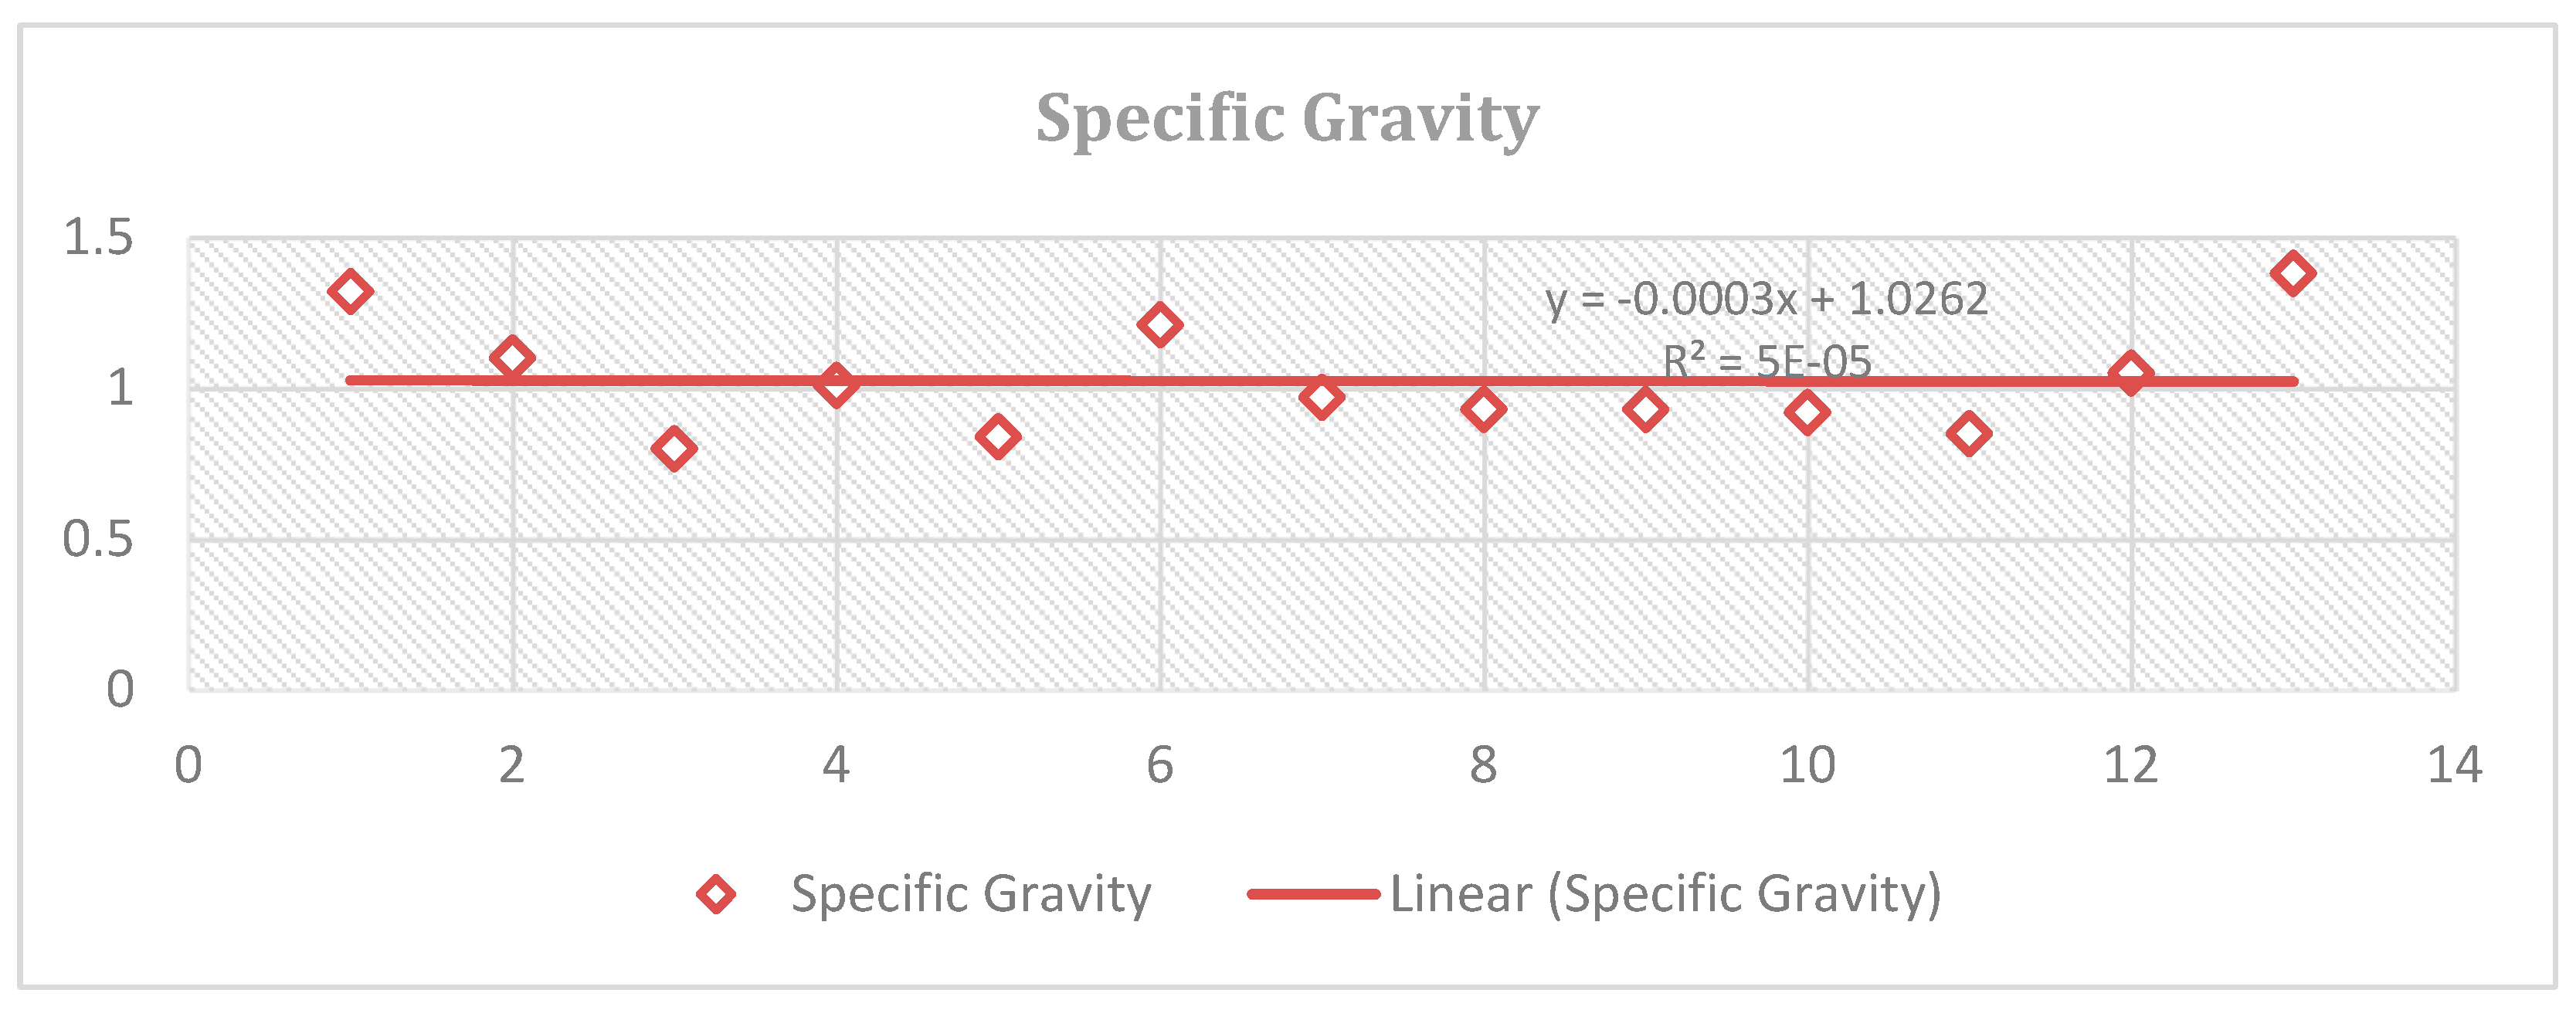
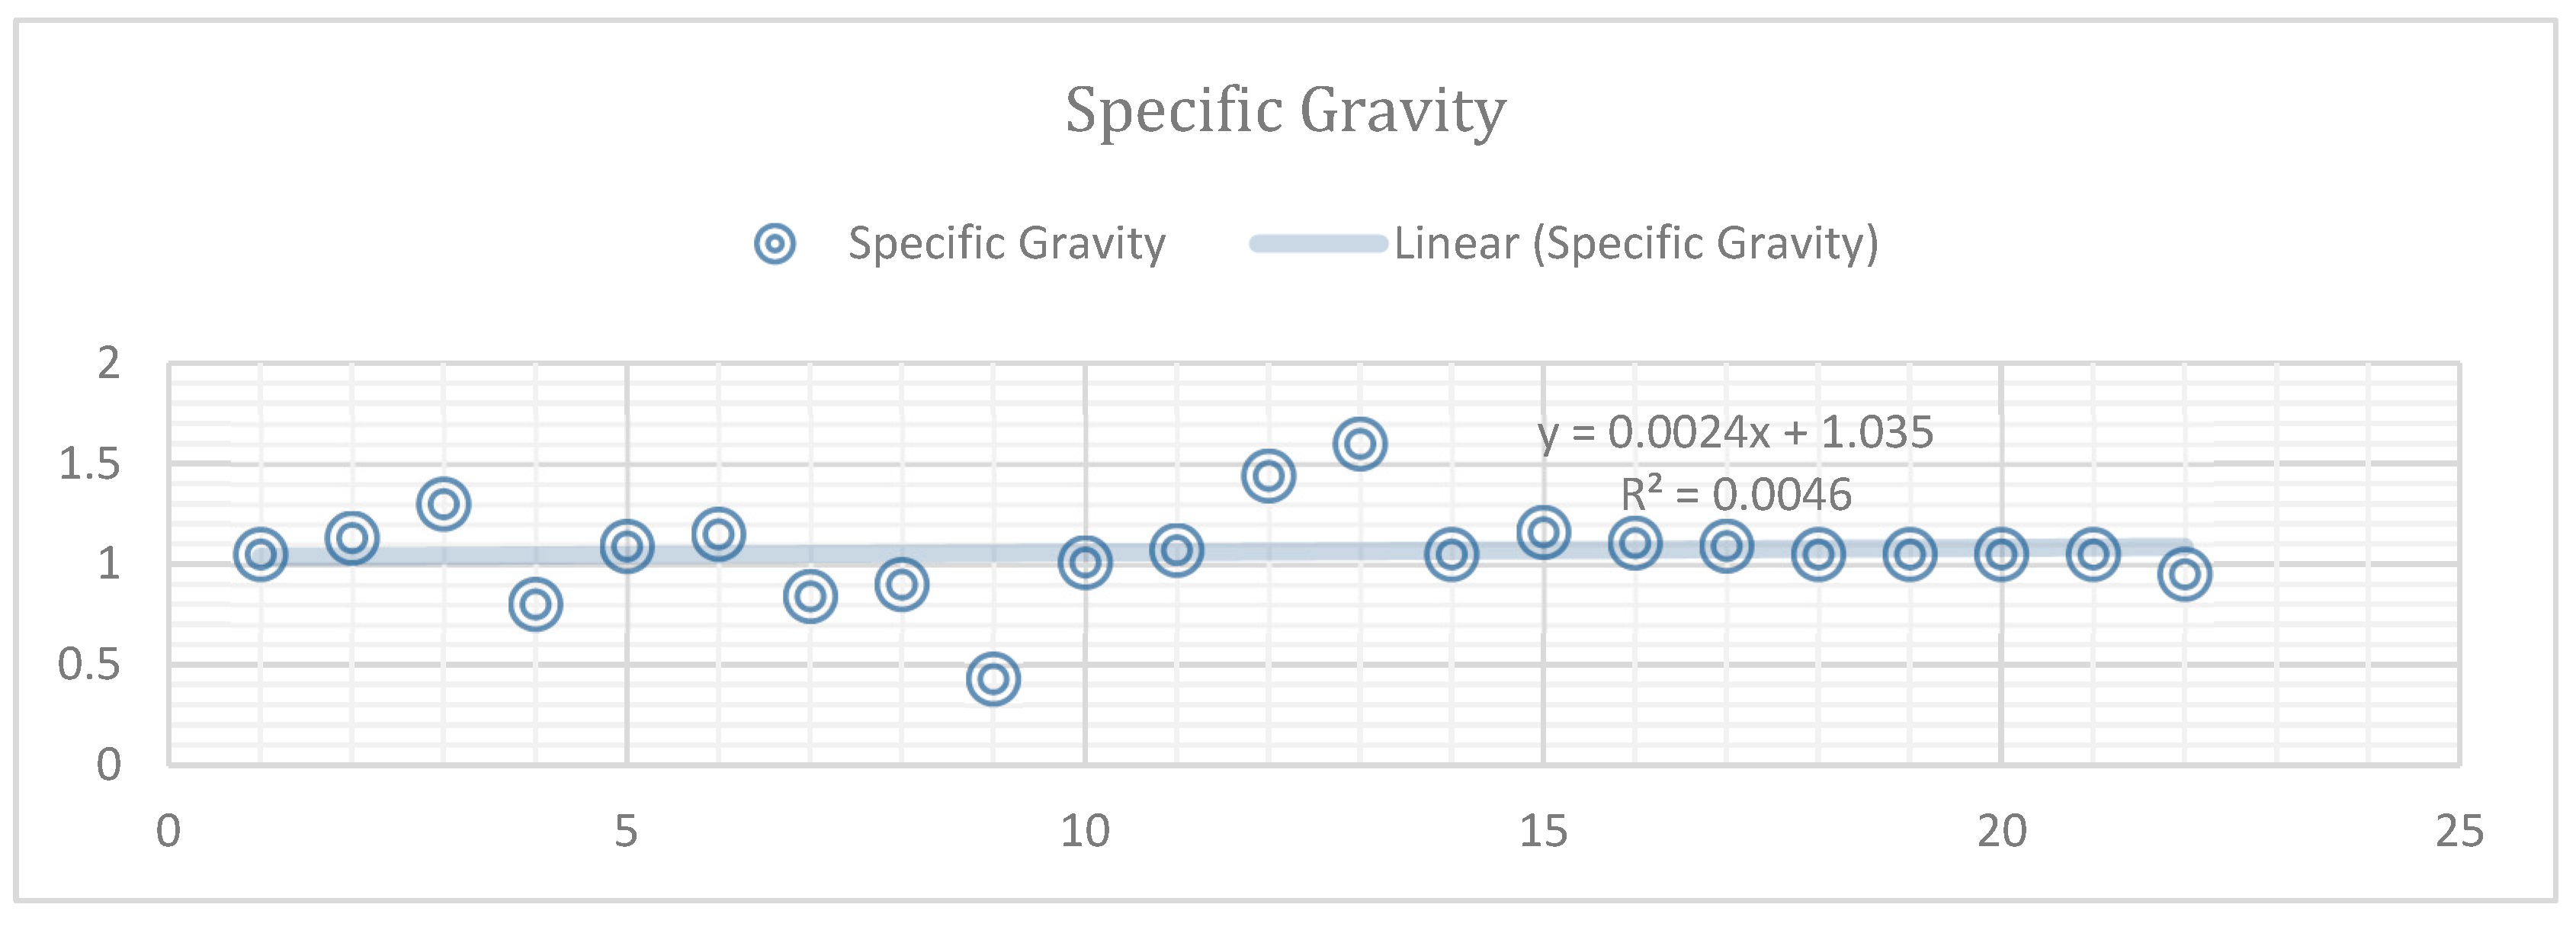
The specific gravity of tyre waste is a mean value of about 1.06, ranging from 0.43 to 1.44, as shown in
Figure 6. This variation of specific gravity of concrete can be attributed to variation of particle sizes of tyre waste used in concrete mixes by research studies. These differences can be attributed to the various tyre types and the method used in their processing. To concrete performance, specific gravity plays a very vital role. A higher specific gravity represents the particle density; in general, this has an impact on concrete strength and durability [
32,
48].
3.2.2. Water Absorption
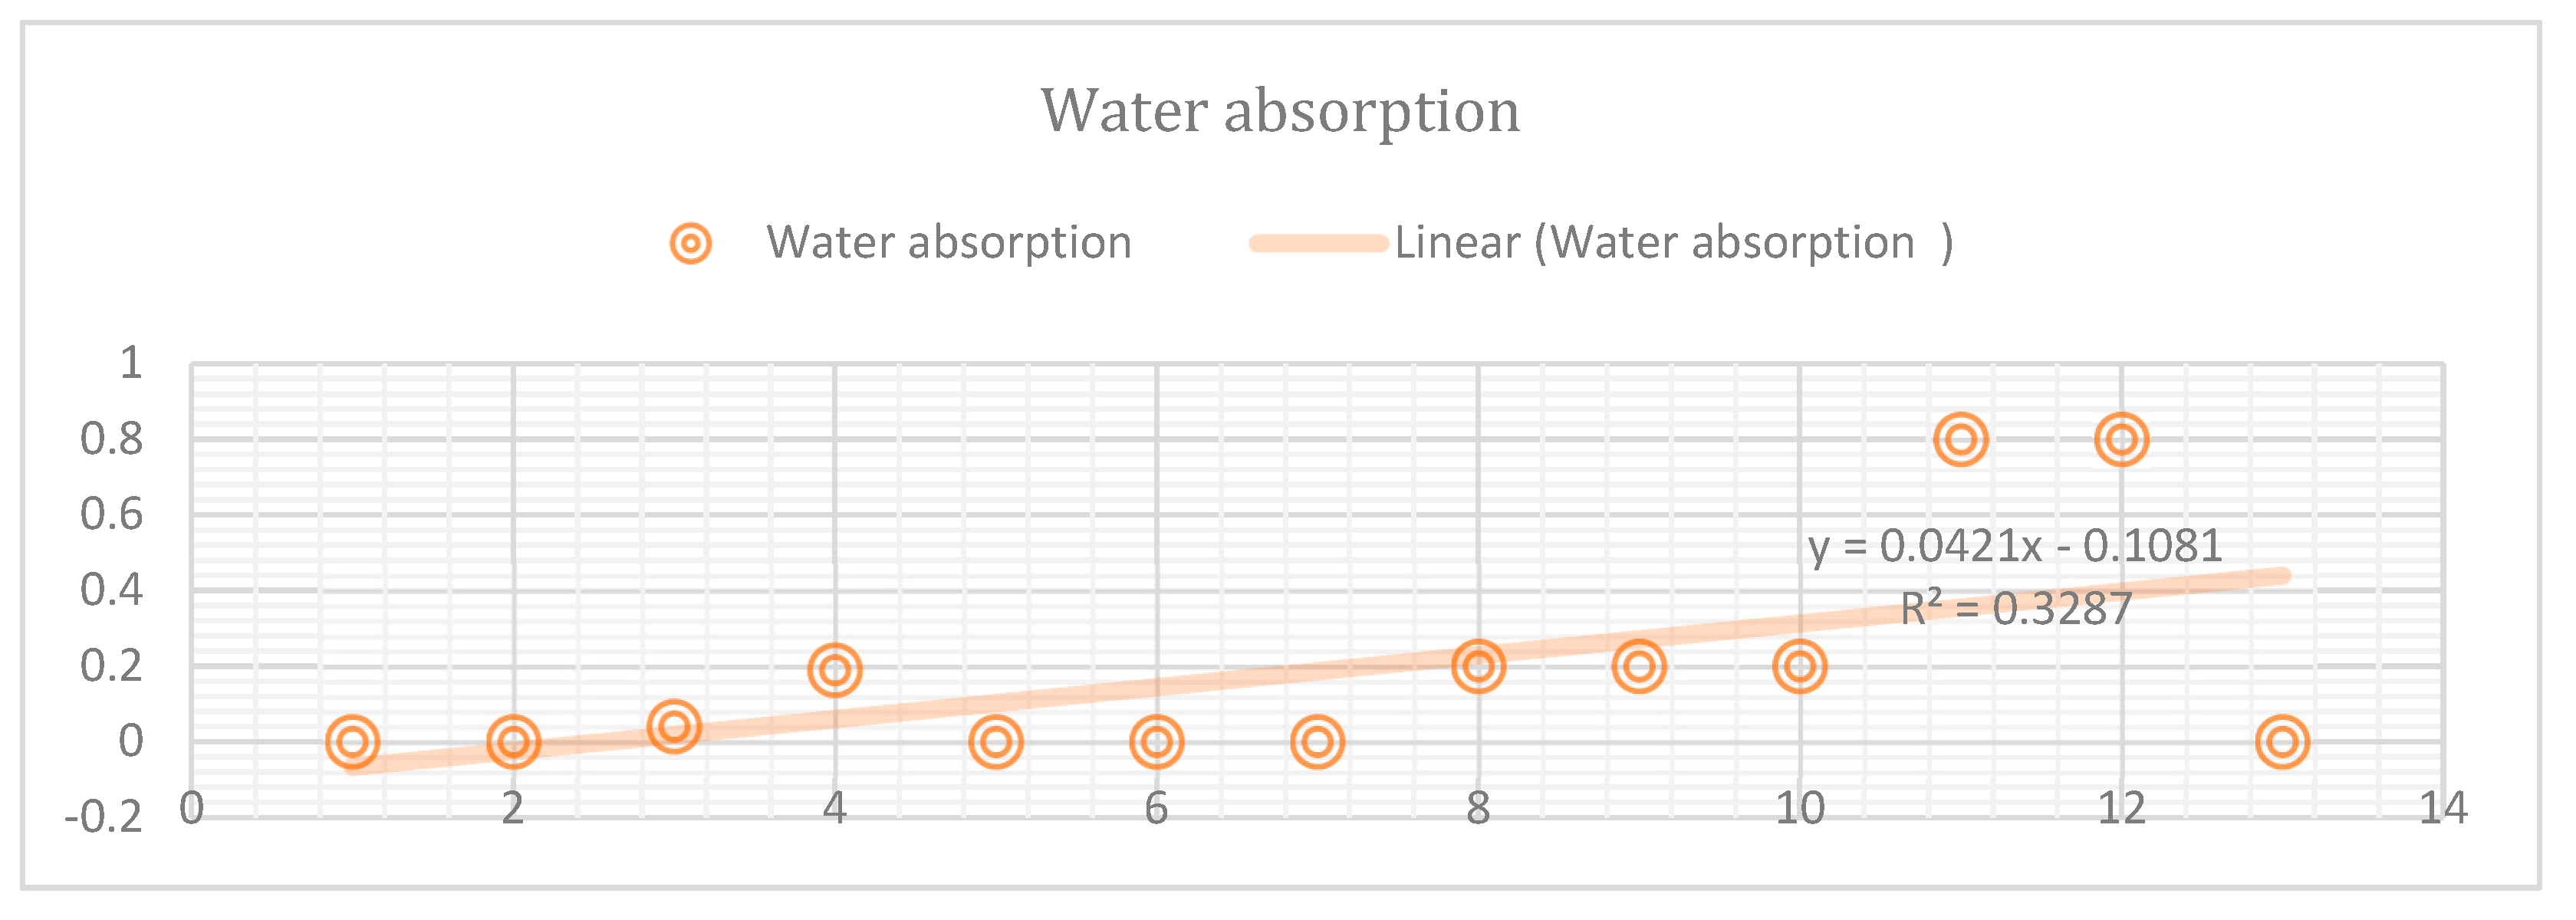
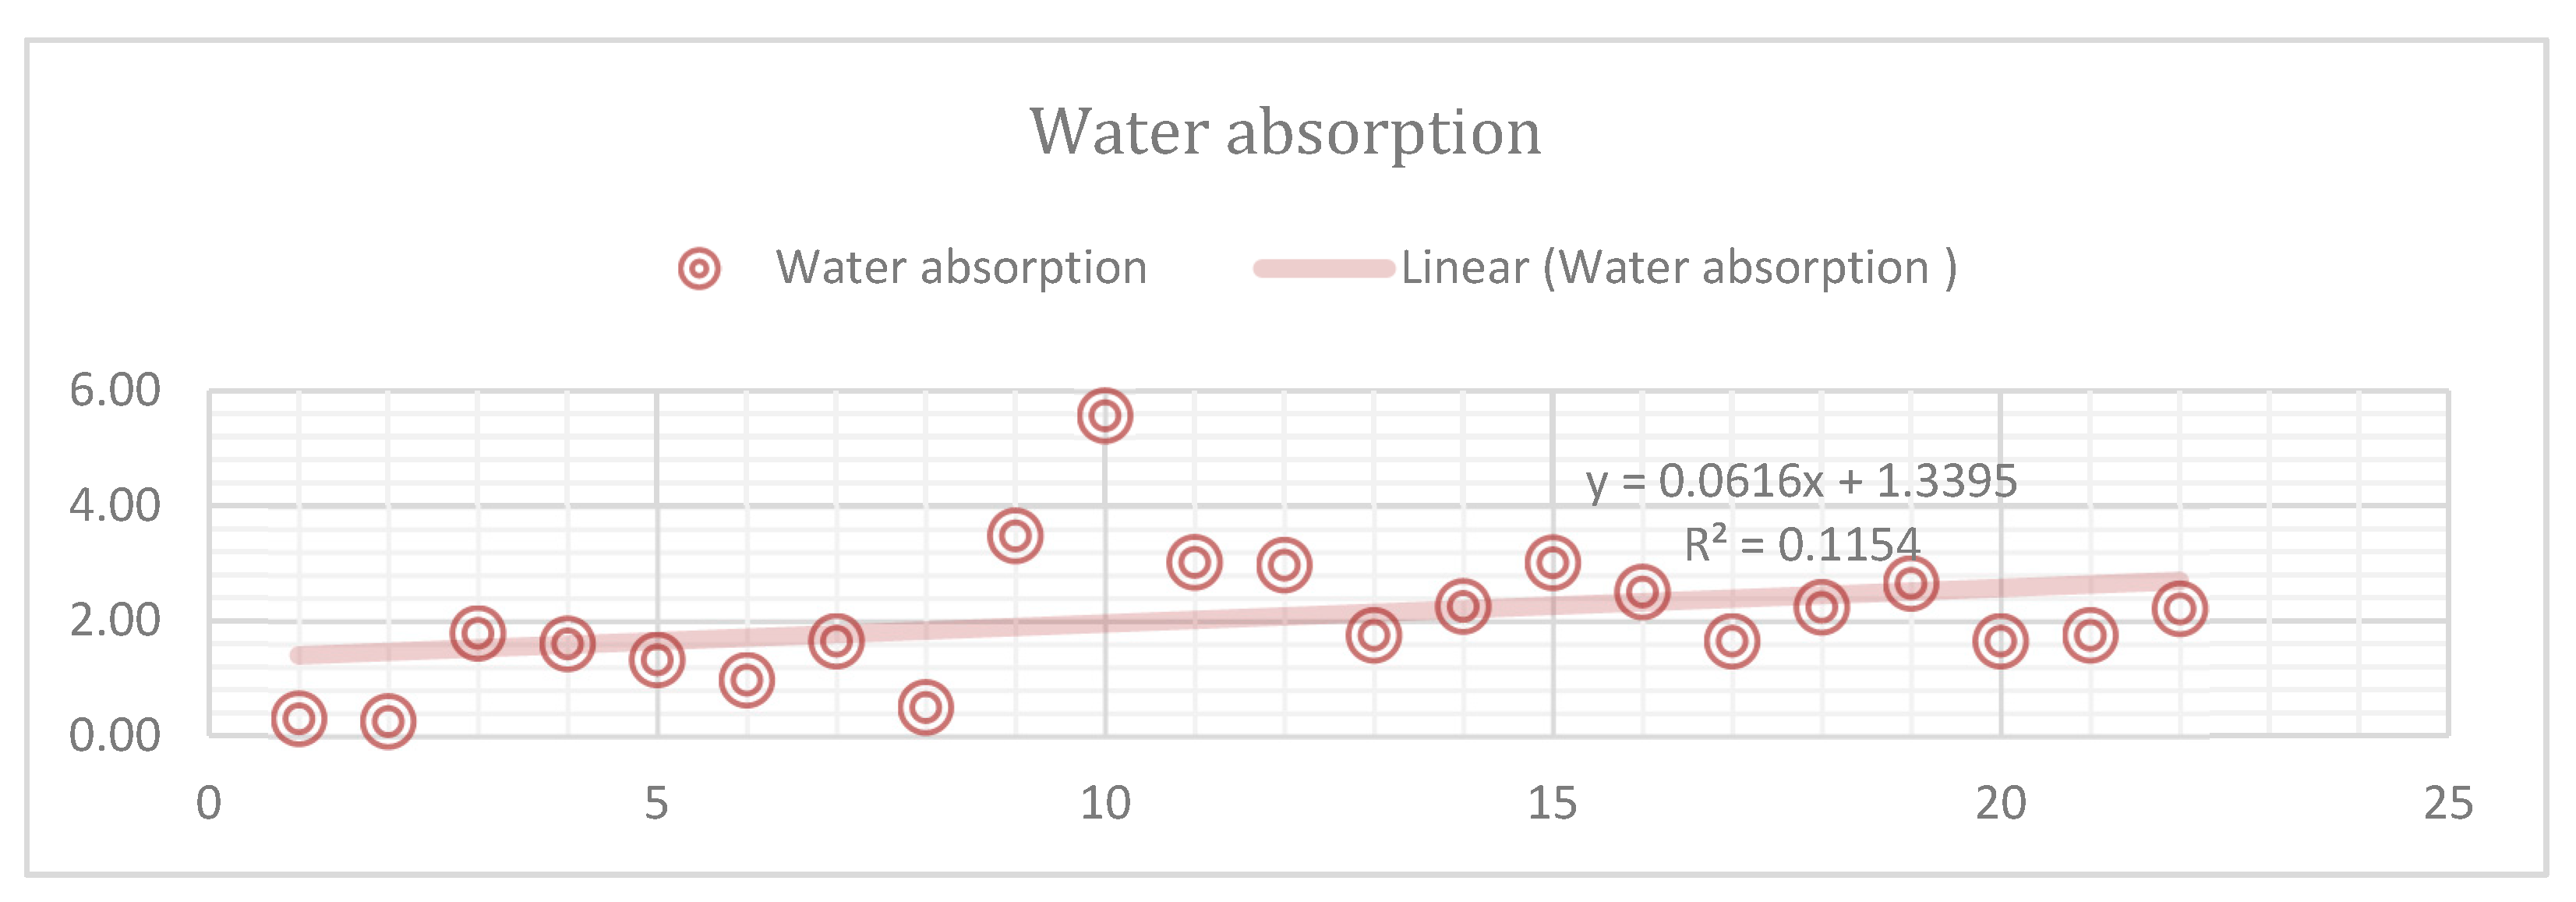
The average water absorption by tyre waste is 2.05, ranging from 0.3 to 5.57, as shown in
Figure 7. Because of the differences in the types of tyre waste and the particle size used in the investigations, water absorption values differ. Absorption of water depends on the composition of waste tyres and their processing. Changes in water absorption impact the durability of concrete and its resistance to environmental factors, as shown in
Figure 9. This parameter is critical to manage and maintain for proper performance and durability of concrete containing tyre waste [
33].
3.2.3. Bulk Density
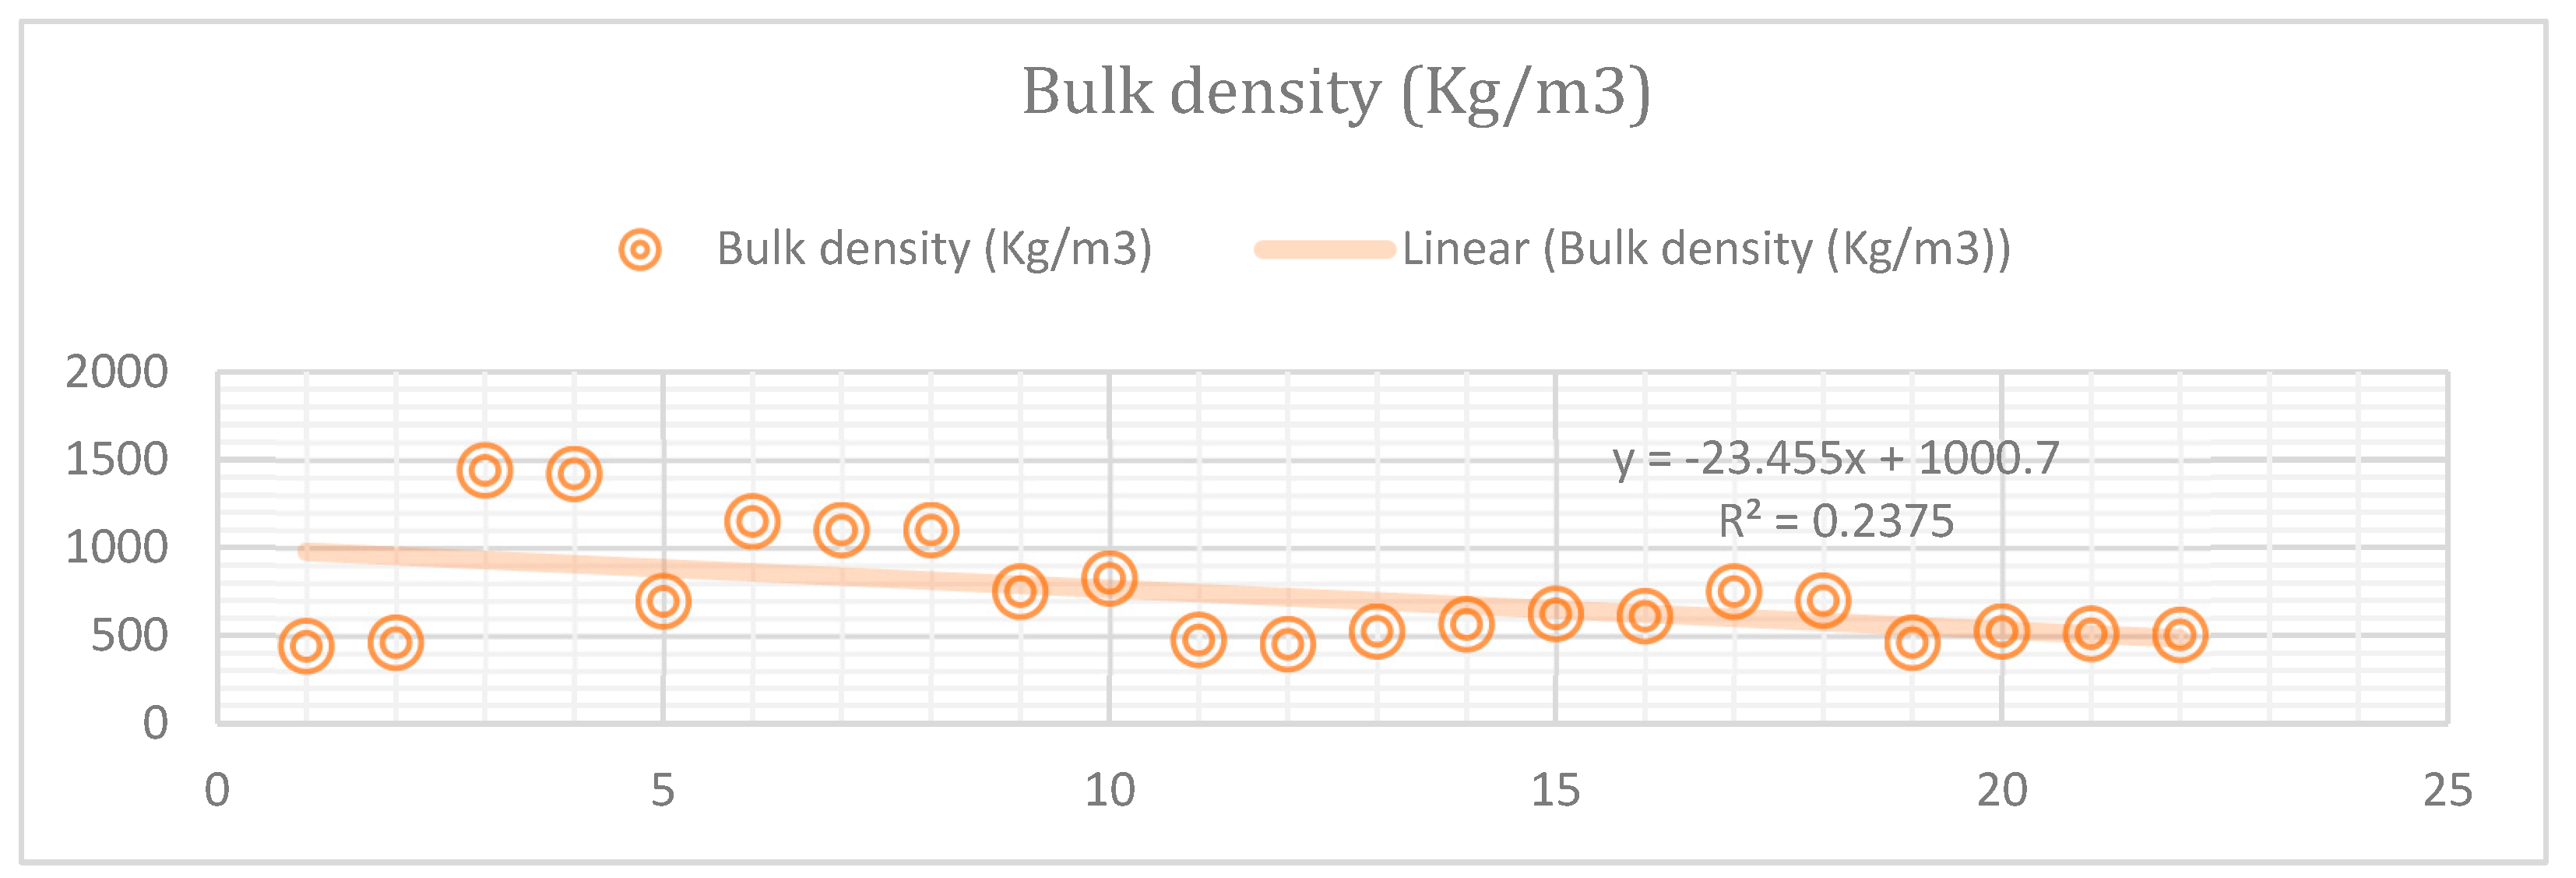
The average bulk density for tyre waste is 730.95 Kg/m³ with the values varying between 440 and 1440 Kg/m³ , as shown in
Figure 8. This variation is because of various research studies employing various particle sizes and composition of tyre waste, as shown in
Figure 9. Particle size distribution of larger tyre waste with lower bulk density value and smaller tyres with increased bulk density values influence concretes characteristics. While using tyre waste in enhancing the performance and properties of concrete that meet non-structural application and sustainability standards, bulk density becomes a critical factor to understand and manage [
34,
49].
Figure 8.
Bulk density variation of tyre.
Figure 8.
Bulk density variation of tyre.
Figure 9.
Tyre material properties variation box chart.
Figure 9.
Tyre material properties variation box chart.
3.3. Performance Characteristics
3.3.1. Slump Variation of Plastic
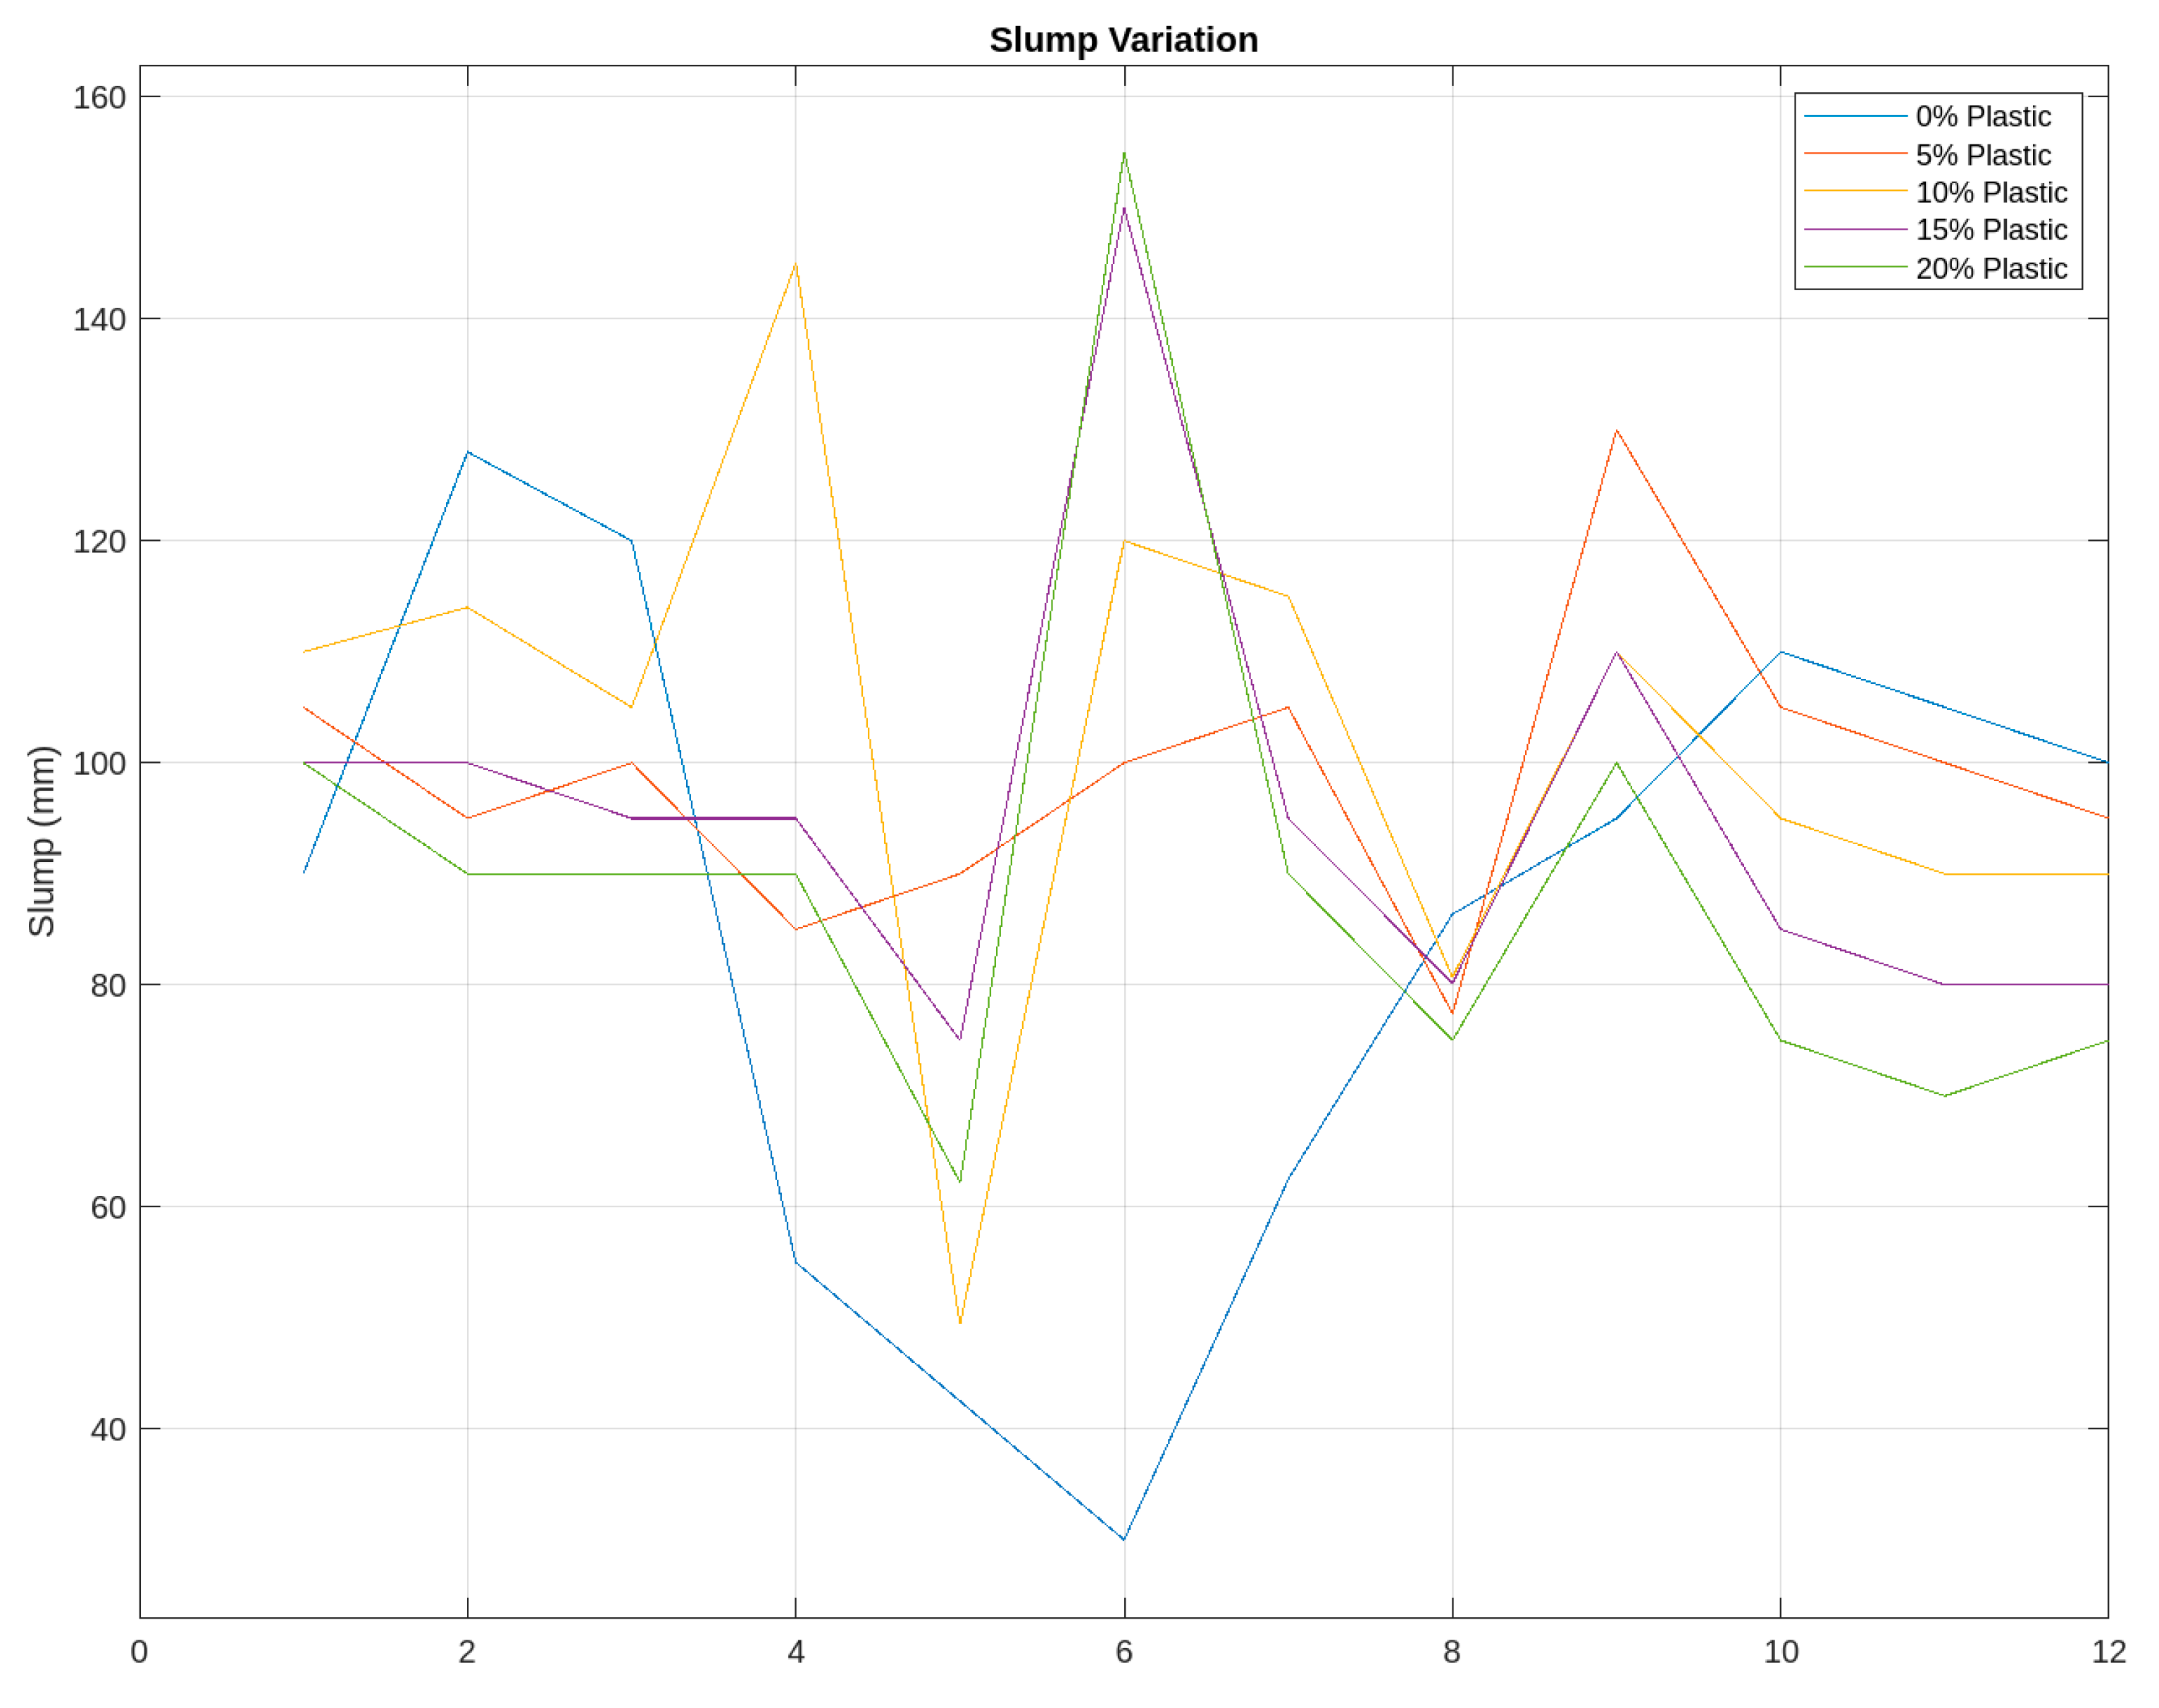
The slump values of plastic integrated concrete vary from 30 mm to 155 mm depending on the percentage of plastic aggregates. Data collections were employed to establish whether it was possible to replace 0% to 20% of plastic.
Figure 10 shows that there is no direct relationship between the fluctuation in slump and the fluctuation in plastic percentage. This is due to the fact that different research articles used different grade 20 mix designs in formulating their concrete mix. Concrete can be more or less workable depending on various mix design characteristics, for instance, water content, cement content, and water-cement ratios. Therefore, these observations are supported by that evidence [
28,
29].
3.3.2. Compressive Strength Variation of Plastic
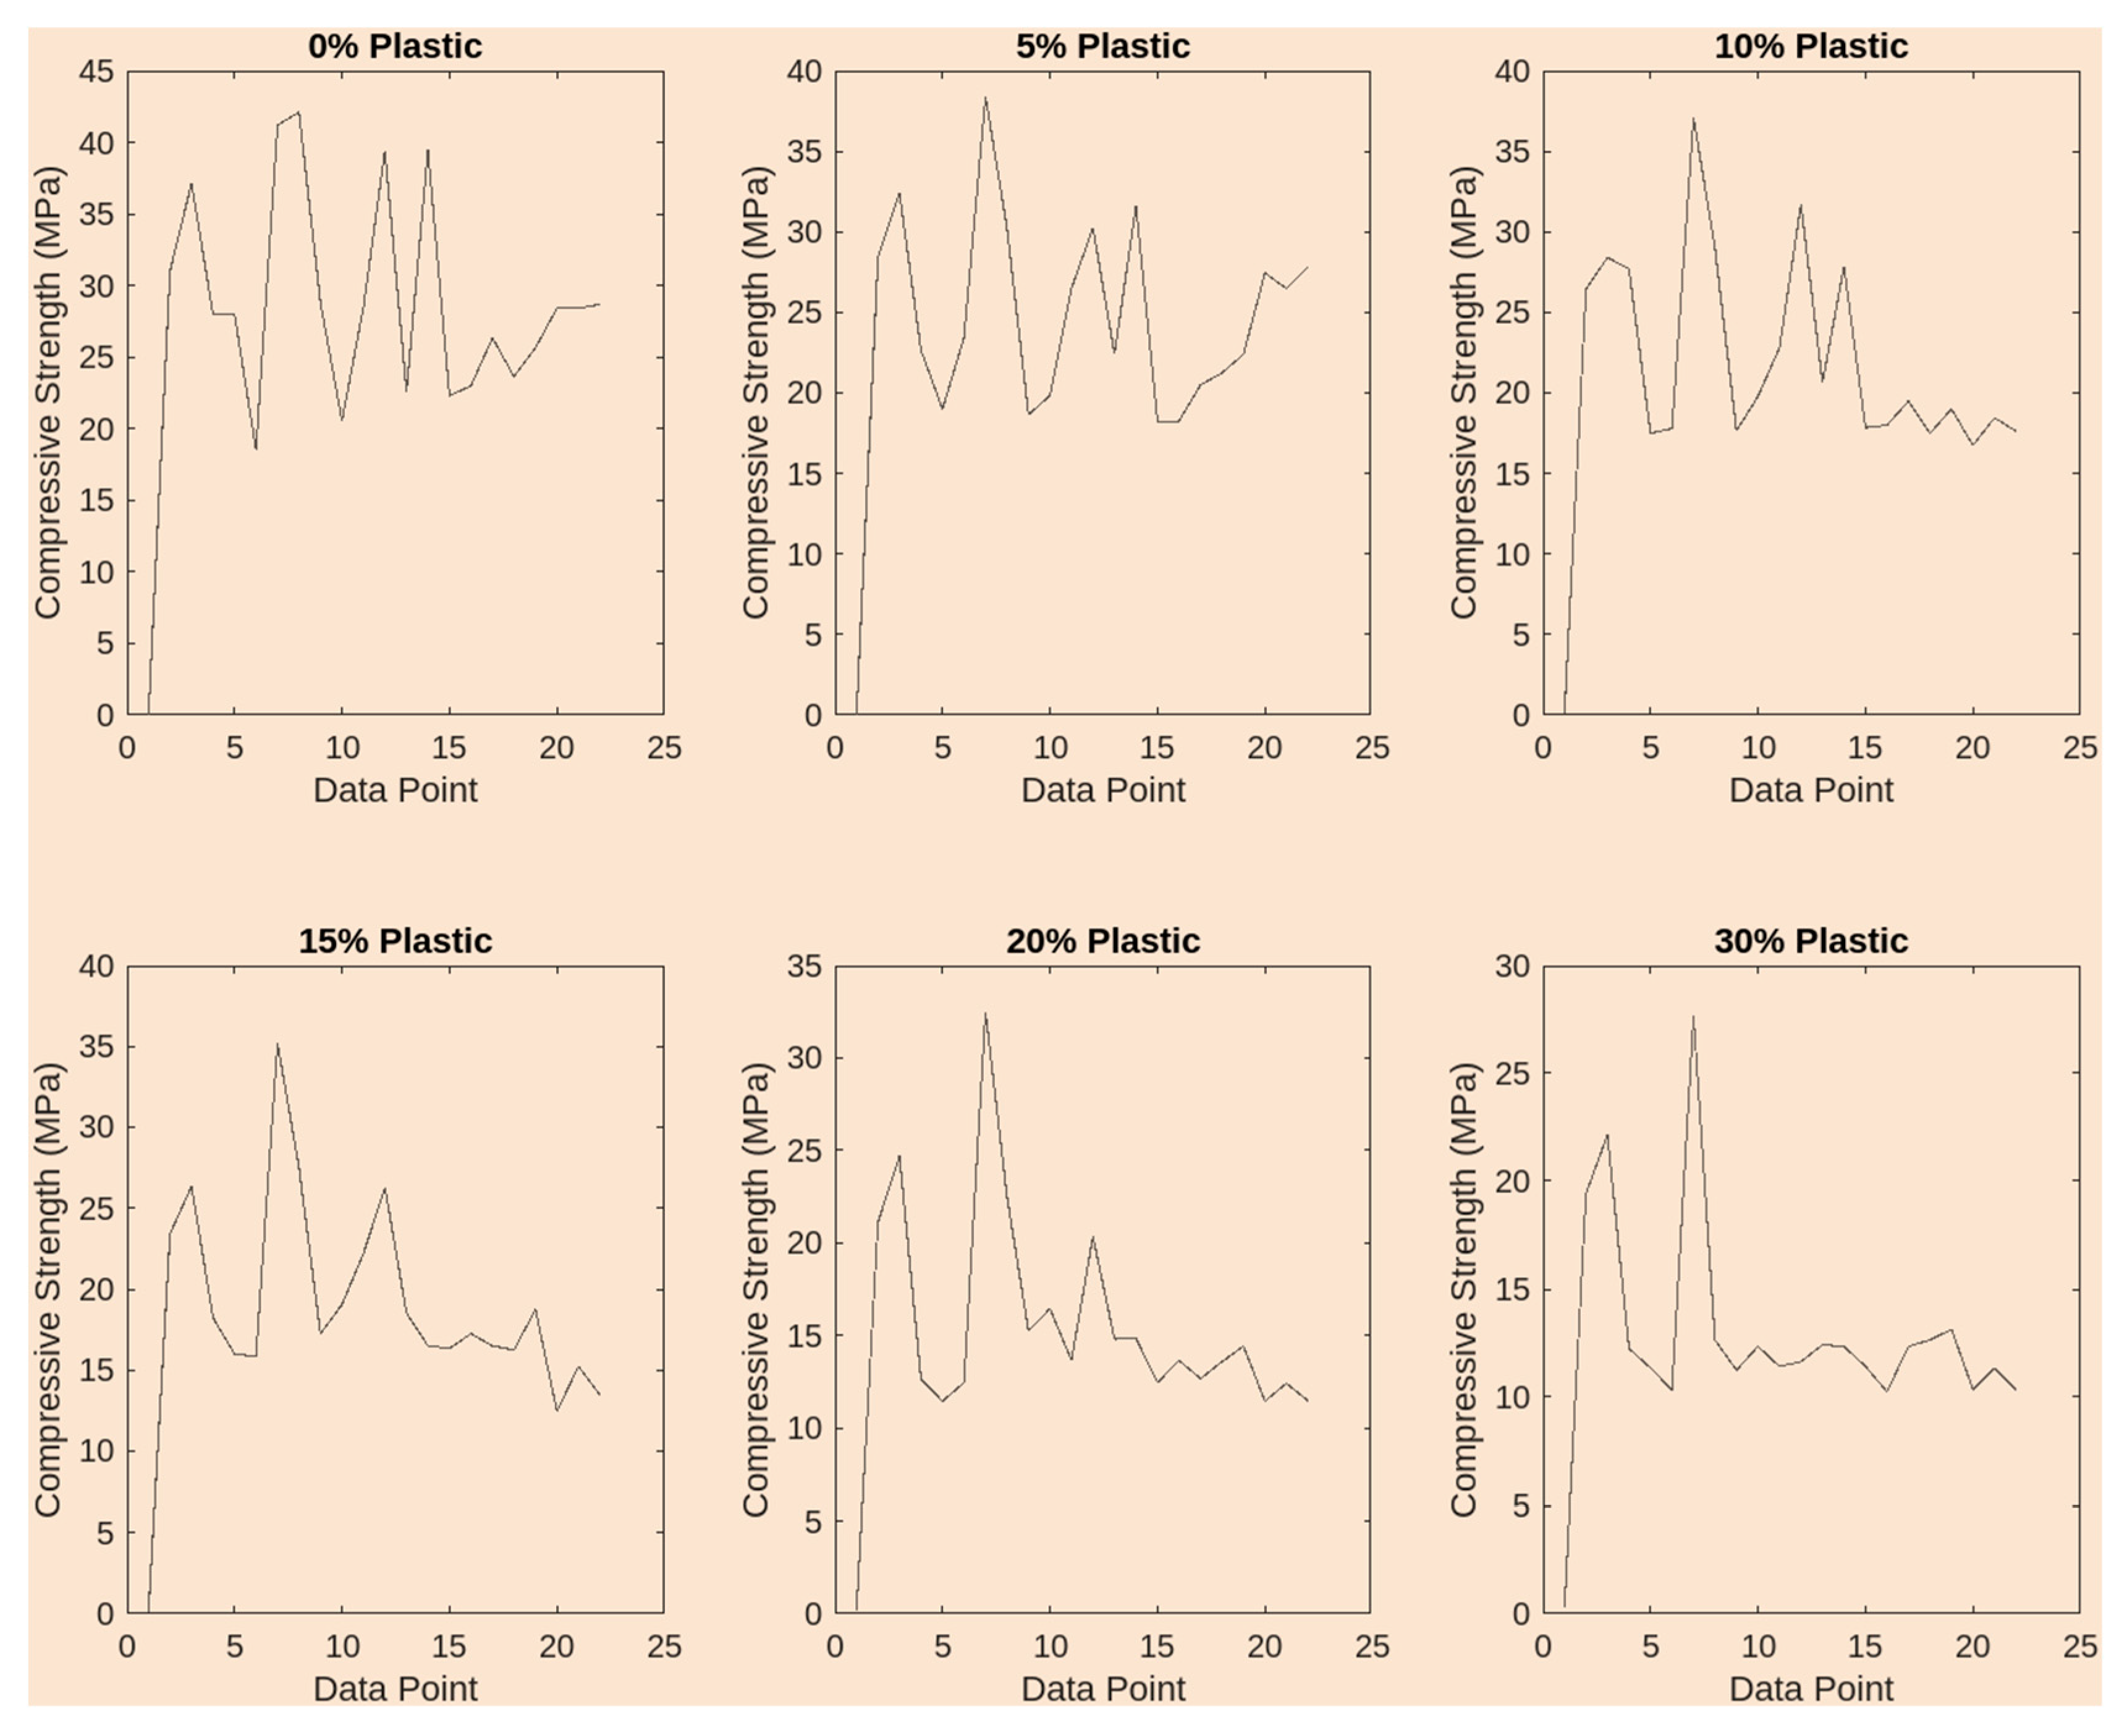
The compressive strength data were collected for plastic percentages between 0% to 30% in grade 20 concrete, as shown in
Table 2 and
Figure 11. The graph given in the paper presents the fluctuation of the compressive strength numbers over the plastic percentage. With the increase in the percentage of plastic, the 28-day compressive strength of grade 20 concrete reduces from 29. 14 MPa for 0% plastic to 1329 MPa for 30% plastic. These outcomes suggest that the plastic aggregate provides inadequate firmness to the load-bearing surface and is likely to fail under higher bearing loads [
36]. Therefore, there is a need to increase the proportion of plastic aggregate in concrete mixes through improving its bonding characteristics. However, given available data, it is not right to infer that a maximum of 10% of plastic can only take the design load of concrete [
35].
3.3.3. Flexural Strength Variation of Plastic
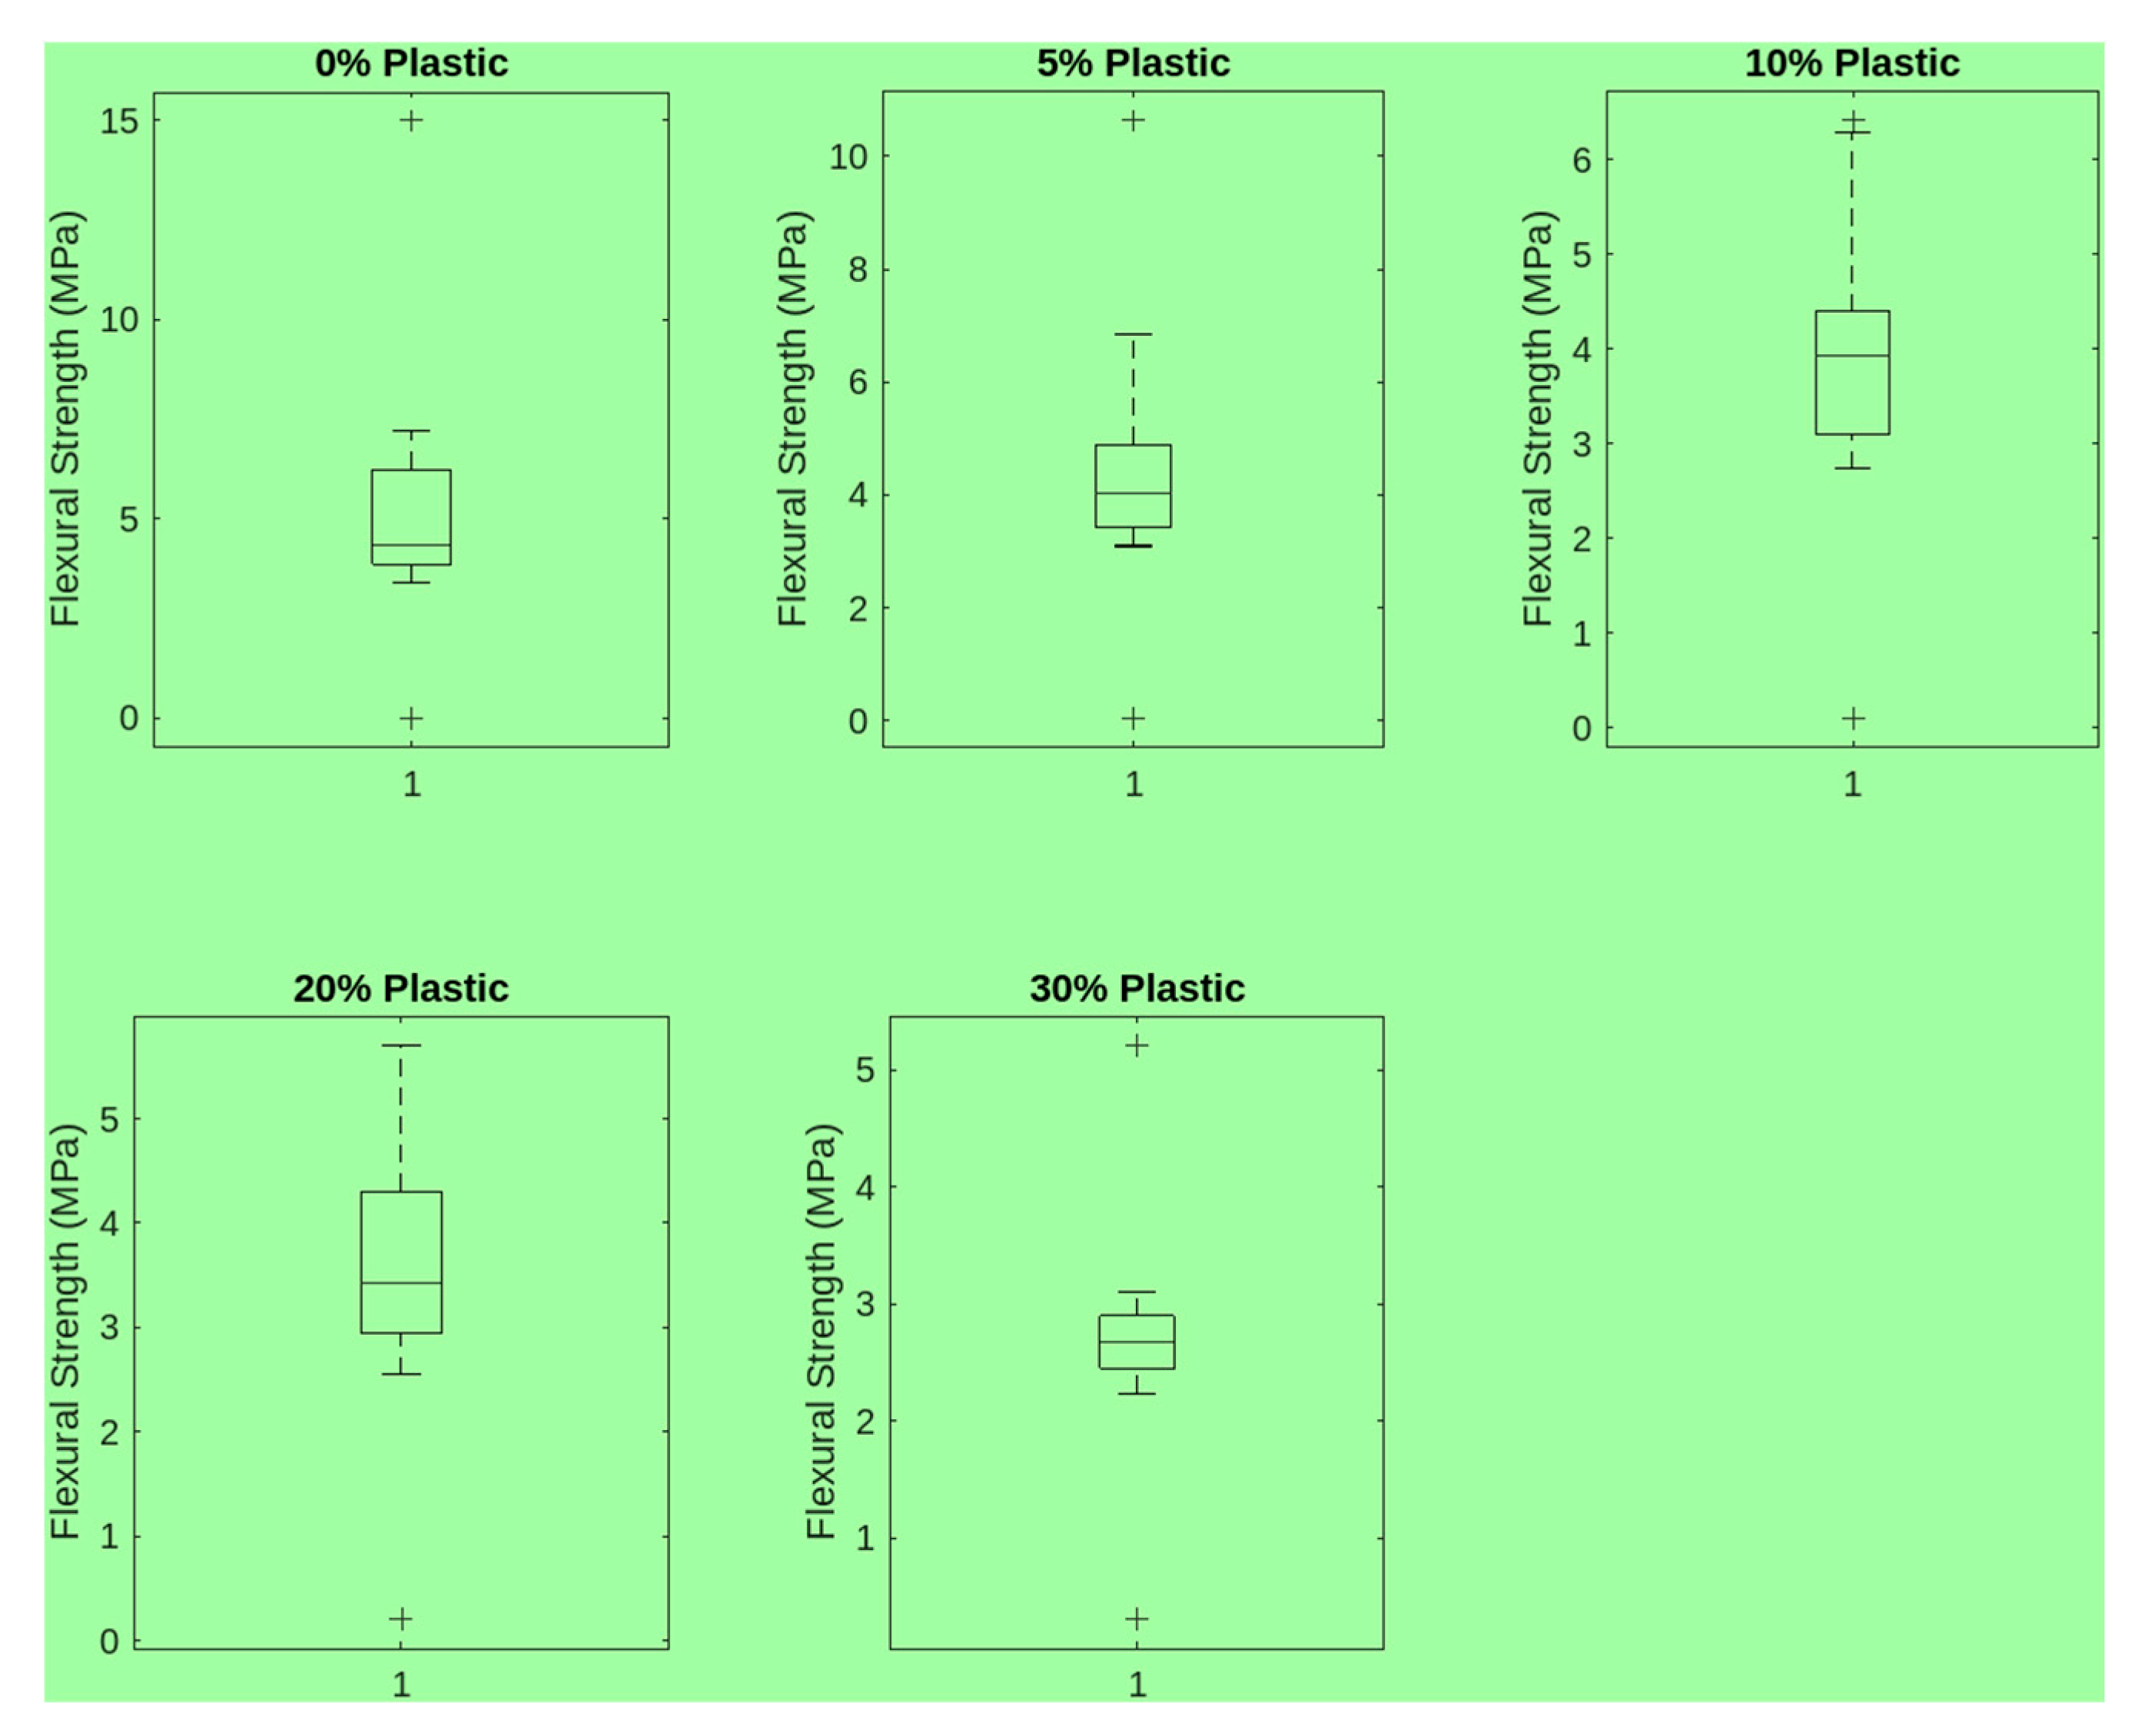
Investigations on the flexural strength trends show that there is a significant reduction in the strength of plastic integrated concrete as the proportion of the plastic concrete rises, as shown in
Table 3 and
Figure 12. The average flexural strength of the control mix (no plastic) is measured to be 5.89 MPa. However, this value reduces to 2.95 MPa, as the amount of plastic content is increased to 30%. These observations further support the previously made statement on the low bonding capacity of plastic aggregates [
36].
3.3.4. Tensile Strength Variation of Plastic
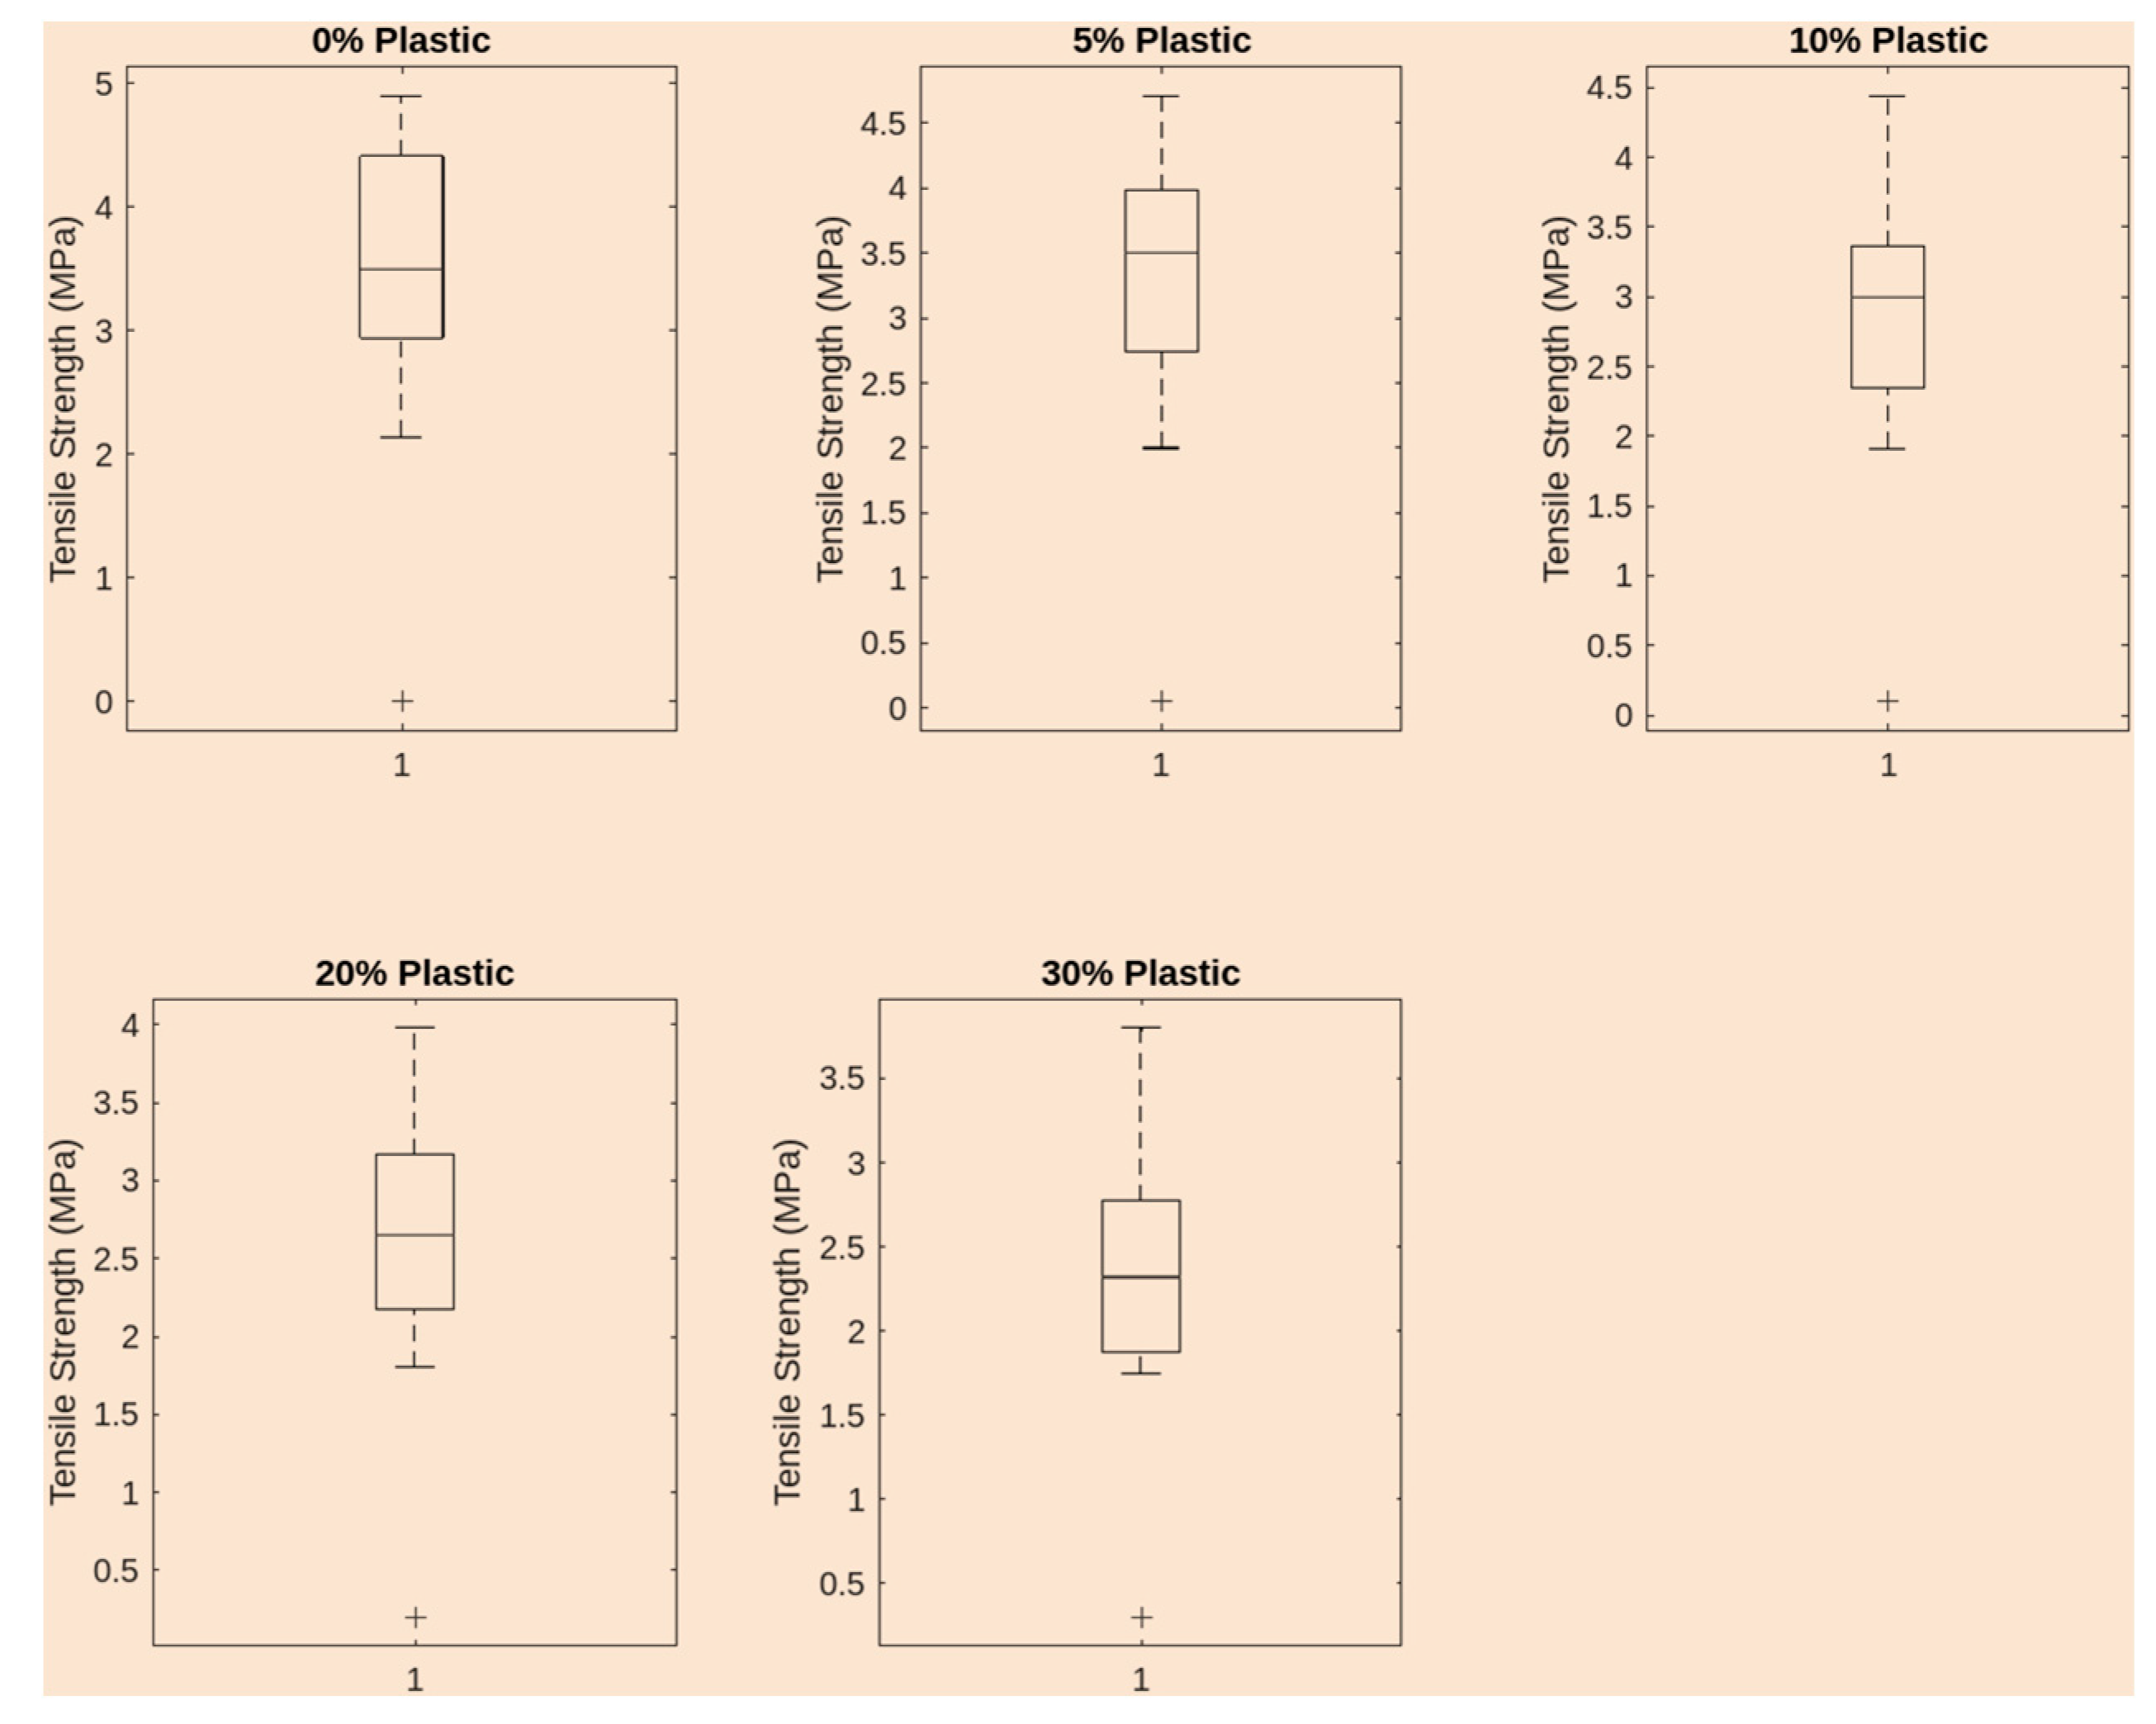
A high percentage of integrated plastic leads to reduced tensile strength of the plastic-integrated concrete. The mean tensile strength of the plastic mixture with no plastic content is 3.72 MPa, and then it lowers to 2.52 MPa when the content of the plastic is raised to 30%, as shown in
Table 4 and
Figure 13. The increment of plastic aggregate content reduces the tensile properties of concrete [
28].
3.3.5. Slump Variation of Tyre
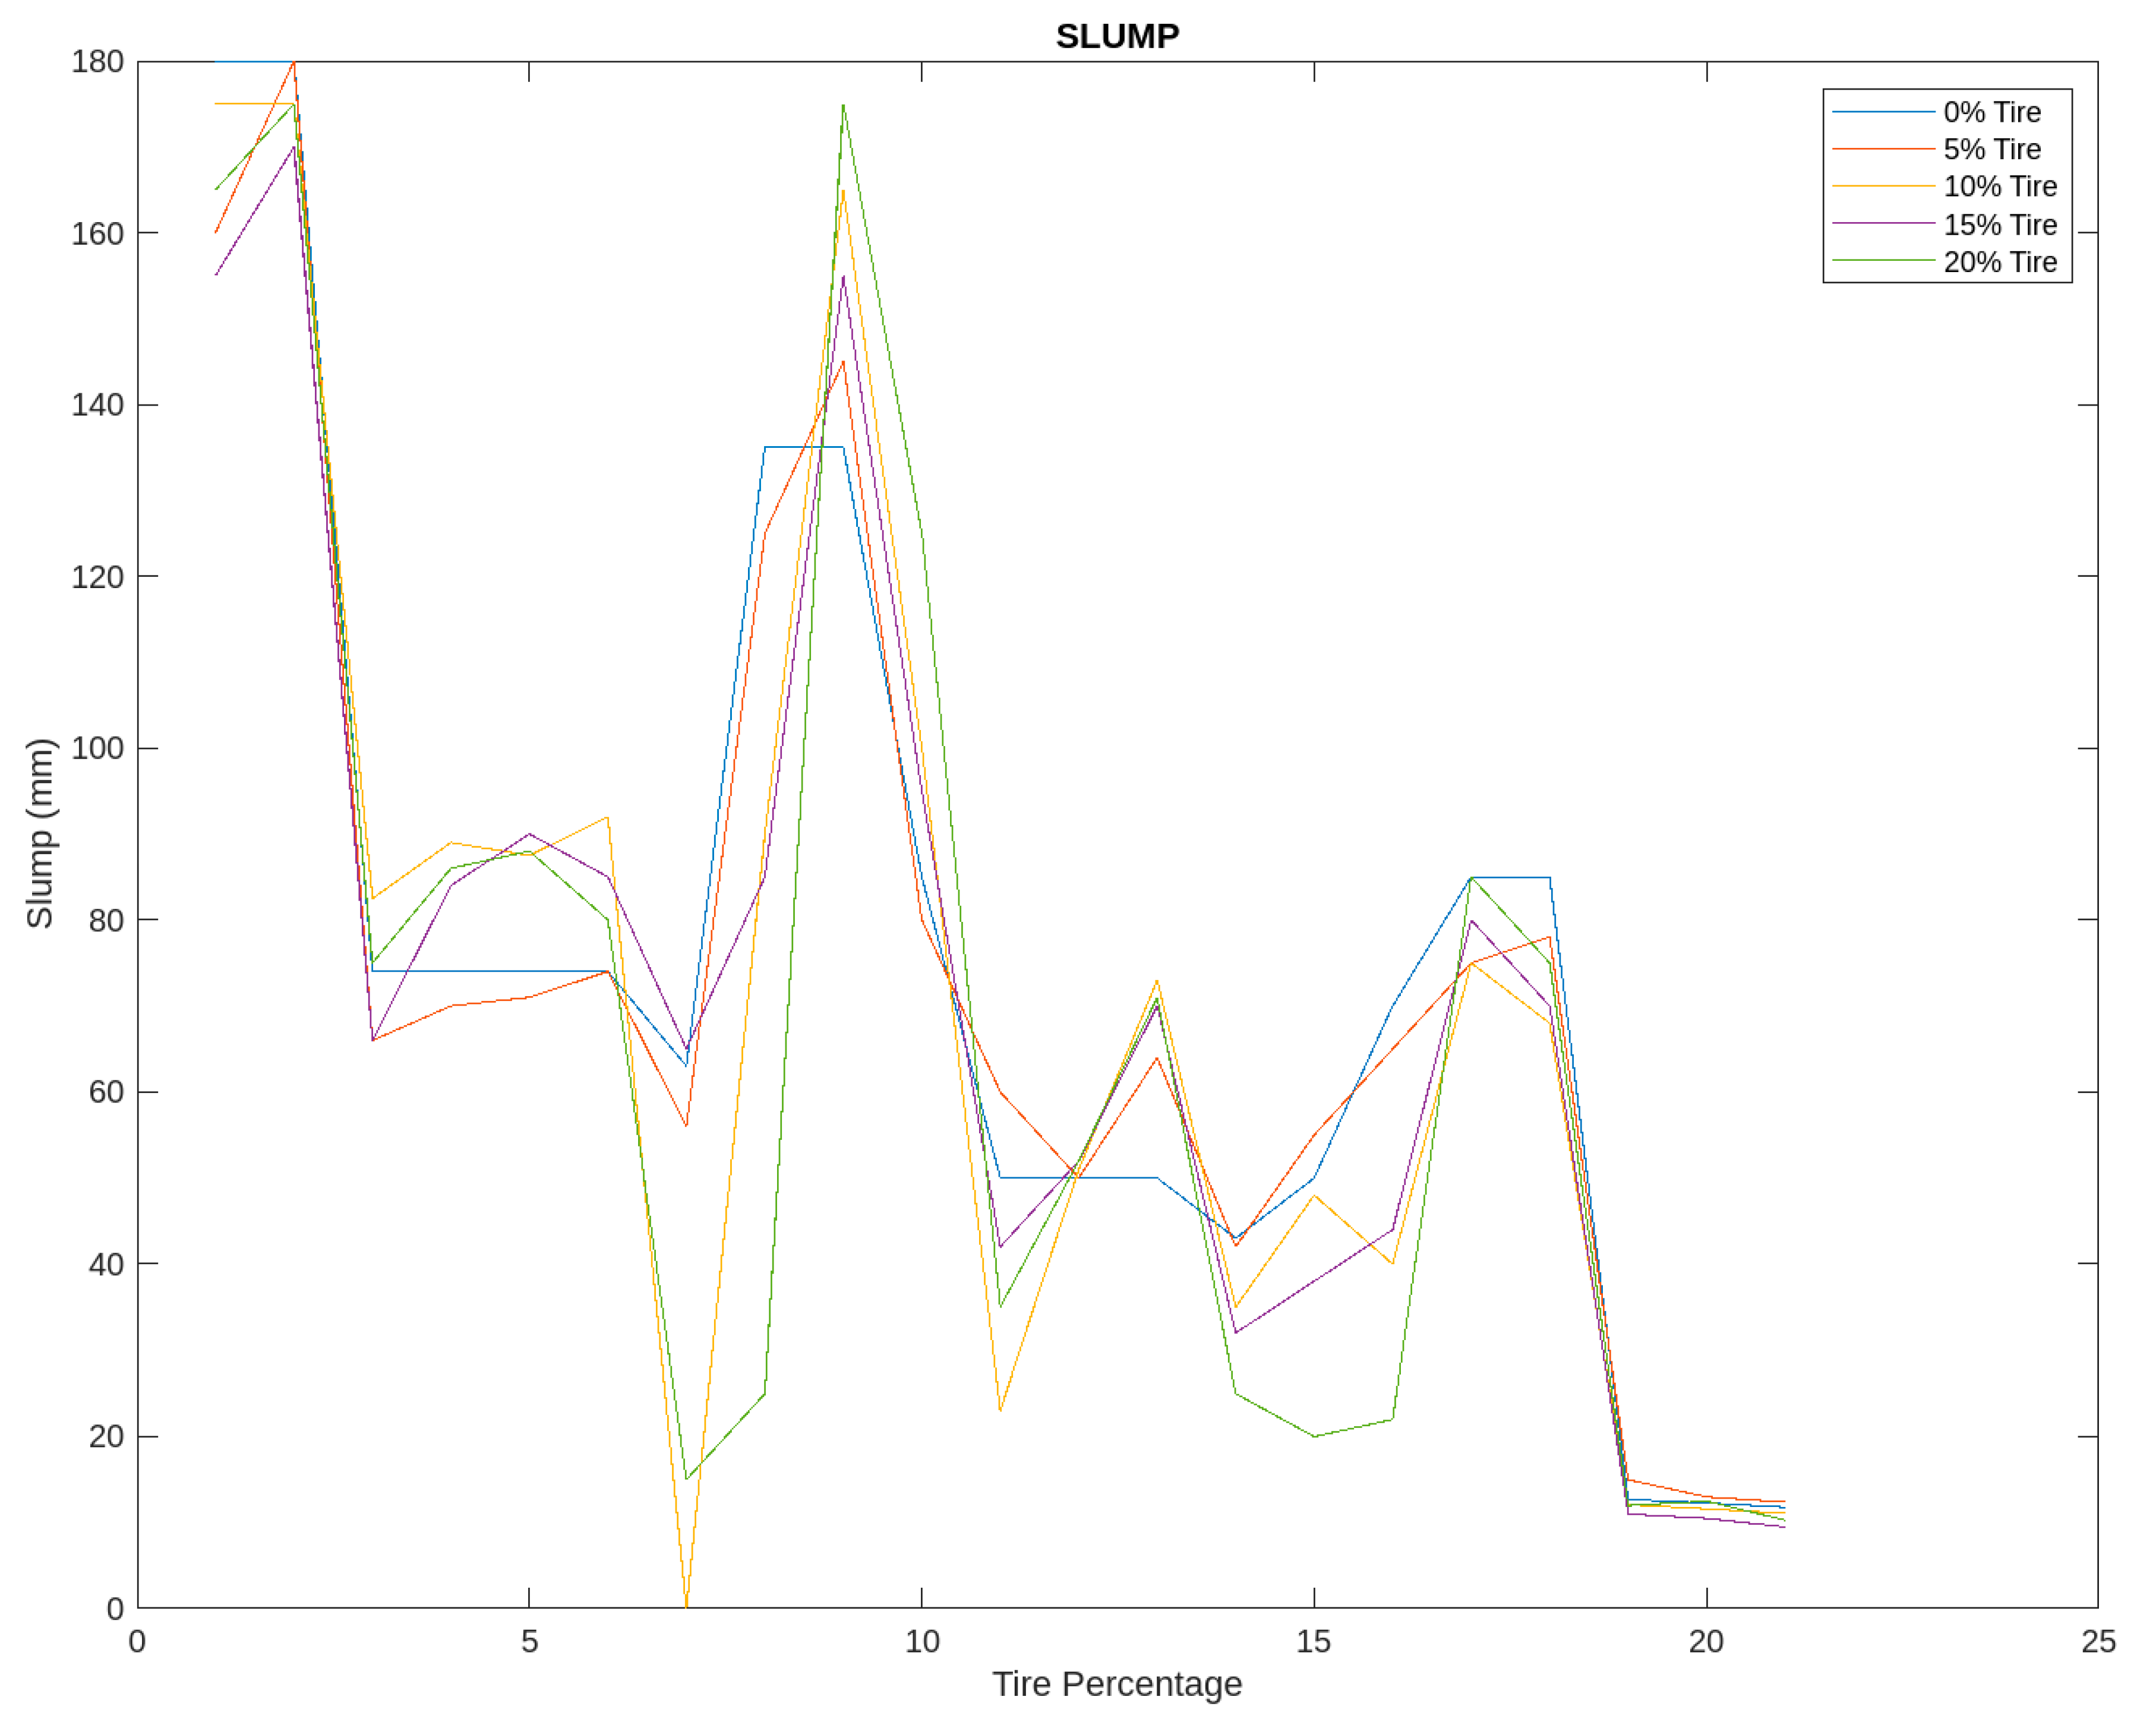
The incorporation of tyre waste in concrete has been observed to lead to a reduction in the slump value of the concrete with the increase in tyre content, as shown and
Figure 14. This pointed to the fact that as the proportion of tyre aggregates rose, the workability of the concrete reduced. This could be attributed to water absorption and low rigidity nature of tyre aggregate. Therefore, improving the properties of the tyre material would increase the controllability of concrete [
37].
3.3.6. Compressive Strength Variation of Tyre
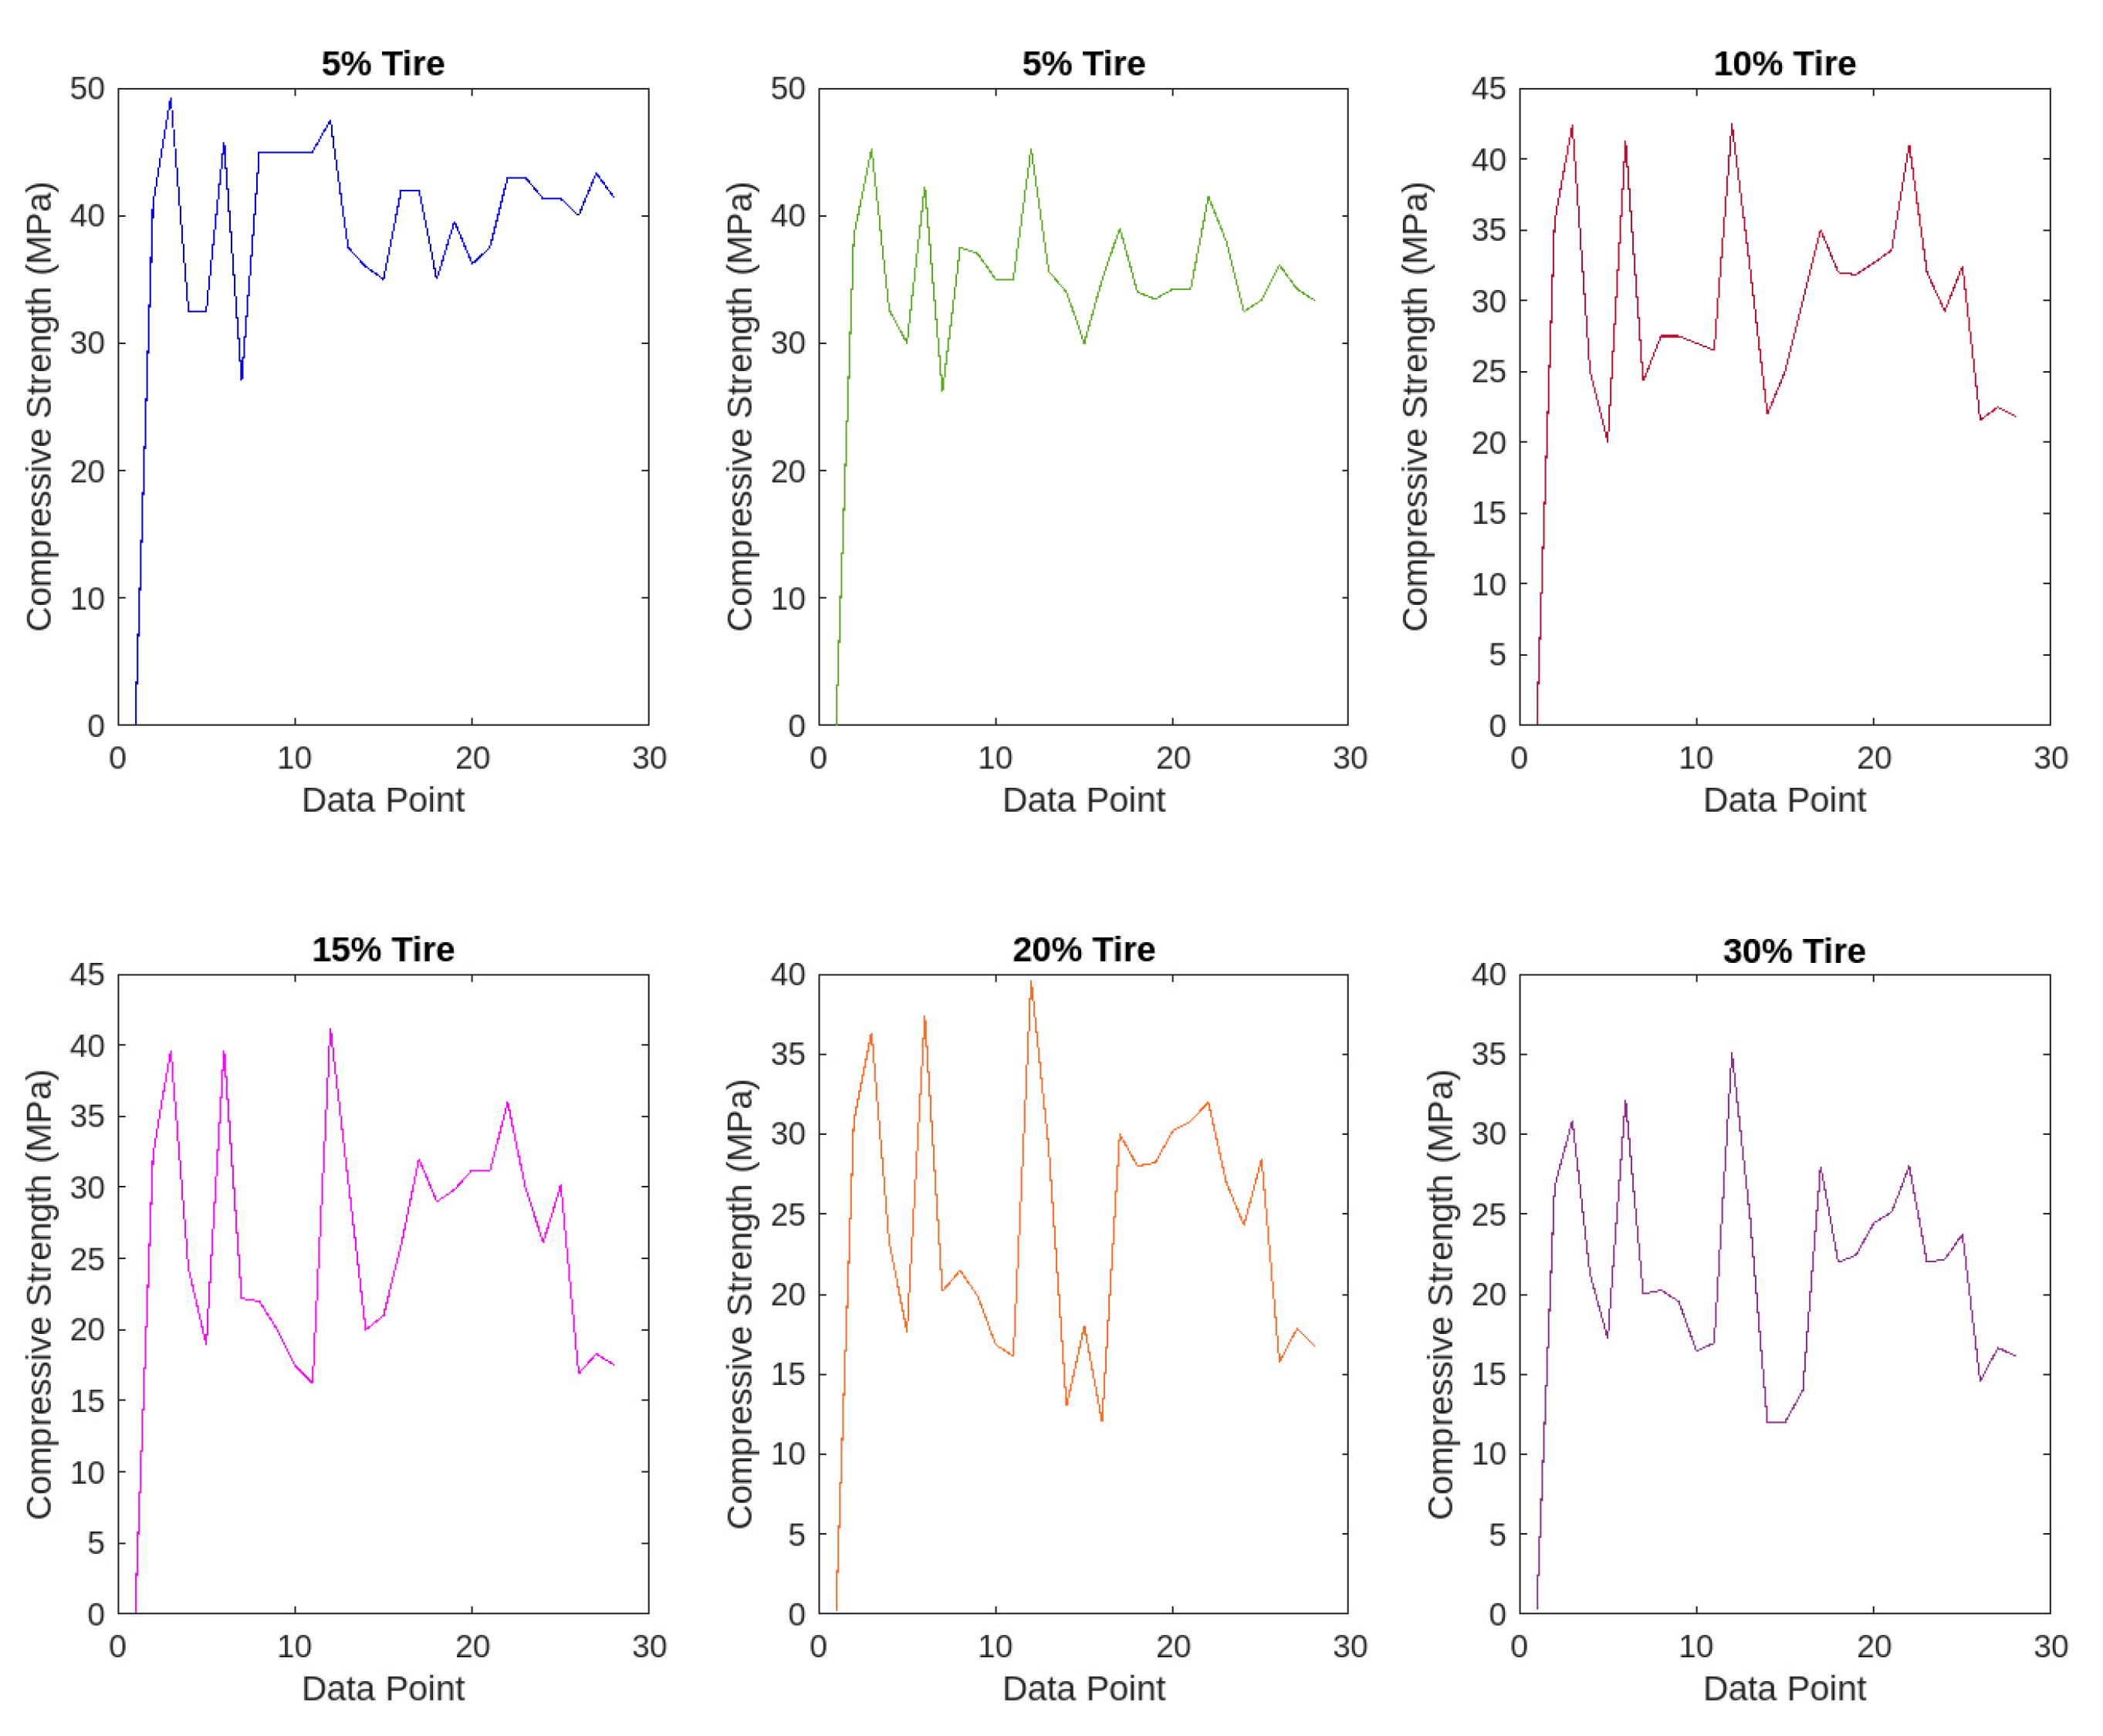
An increase in tyre content results in a reduction of the compressive strength of the block. Currently the strength has been reduced from 40.36 MPa for a plastic mix with 0% plastic content to 21.66 MPa when the plastic content is increased to 30%, as shown in
Table 5 and
Figure 15 The tyre aggregate is made of rubber, and it has low stiffness parameters. Consequently, these reductions in strength are observed [
38].
3.3.7. Flexural Strength Variation of Tyre
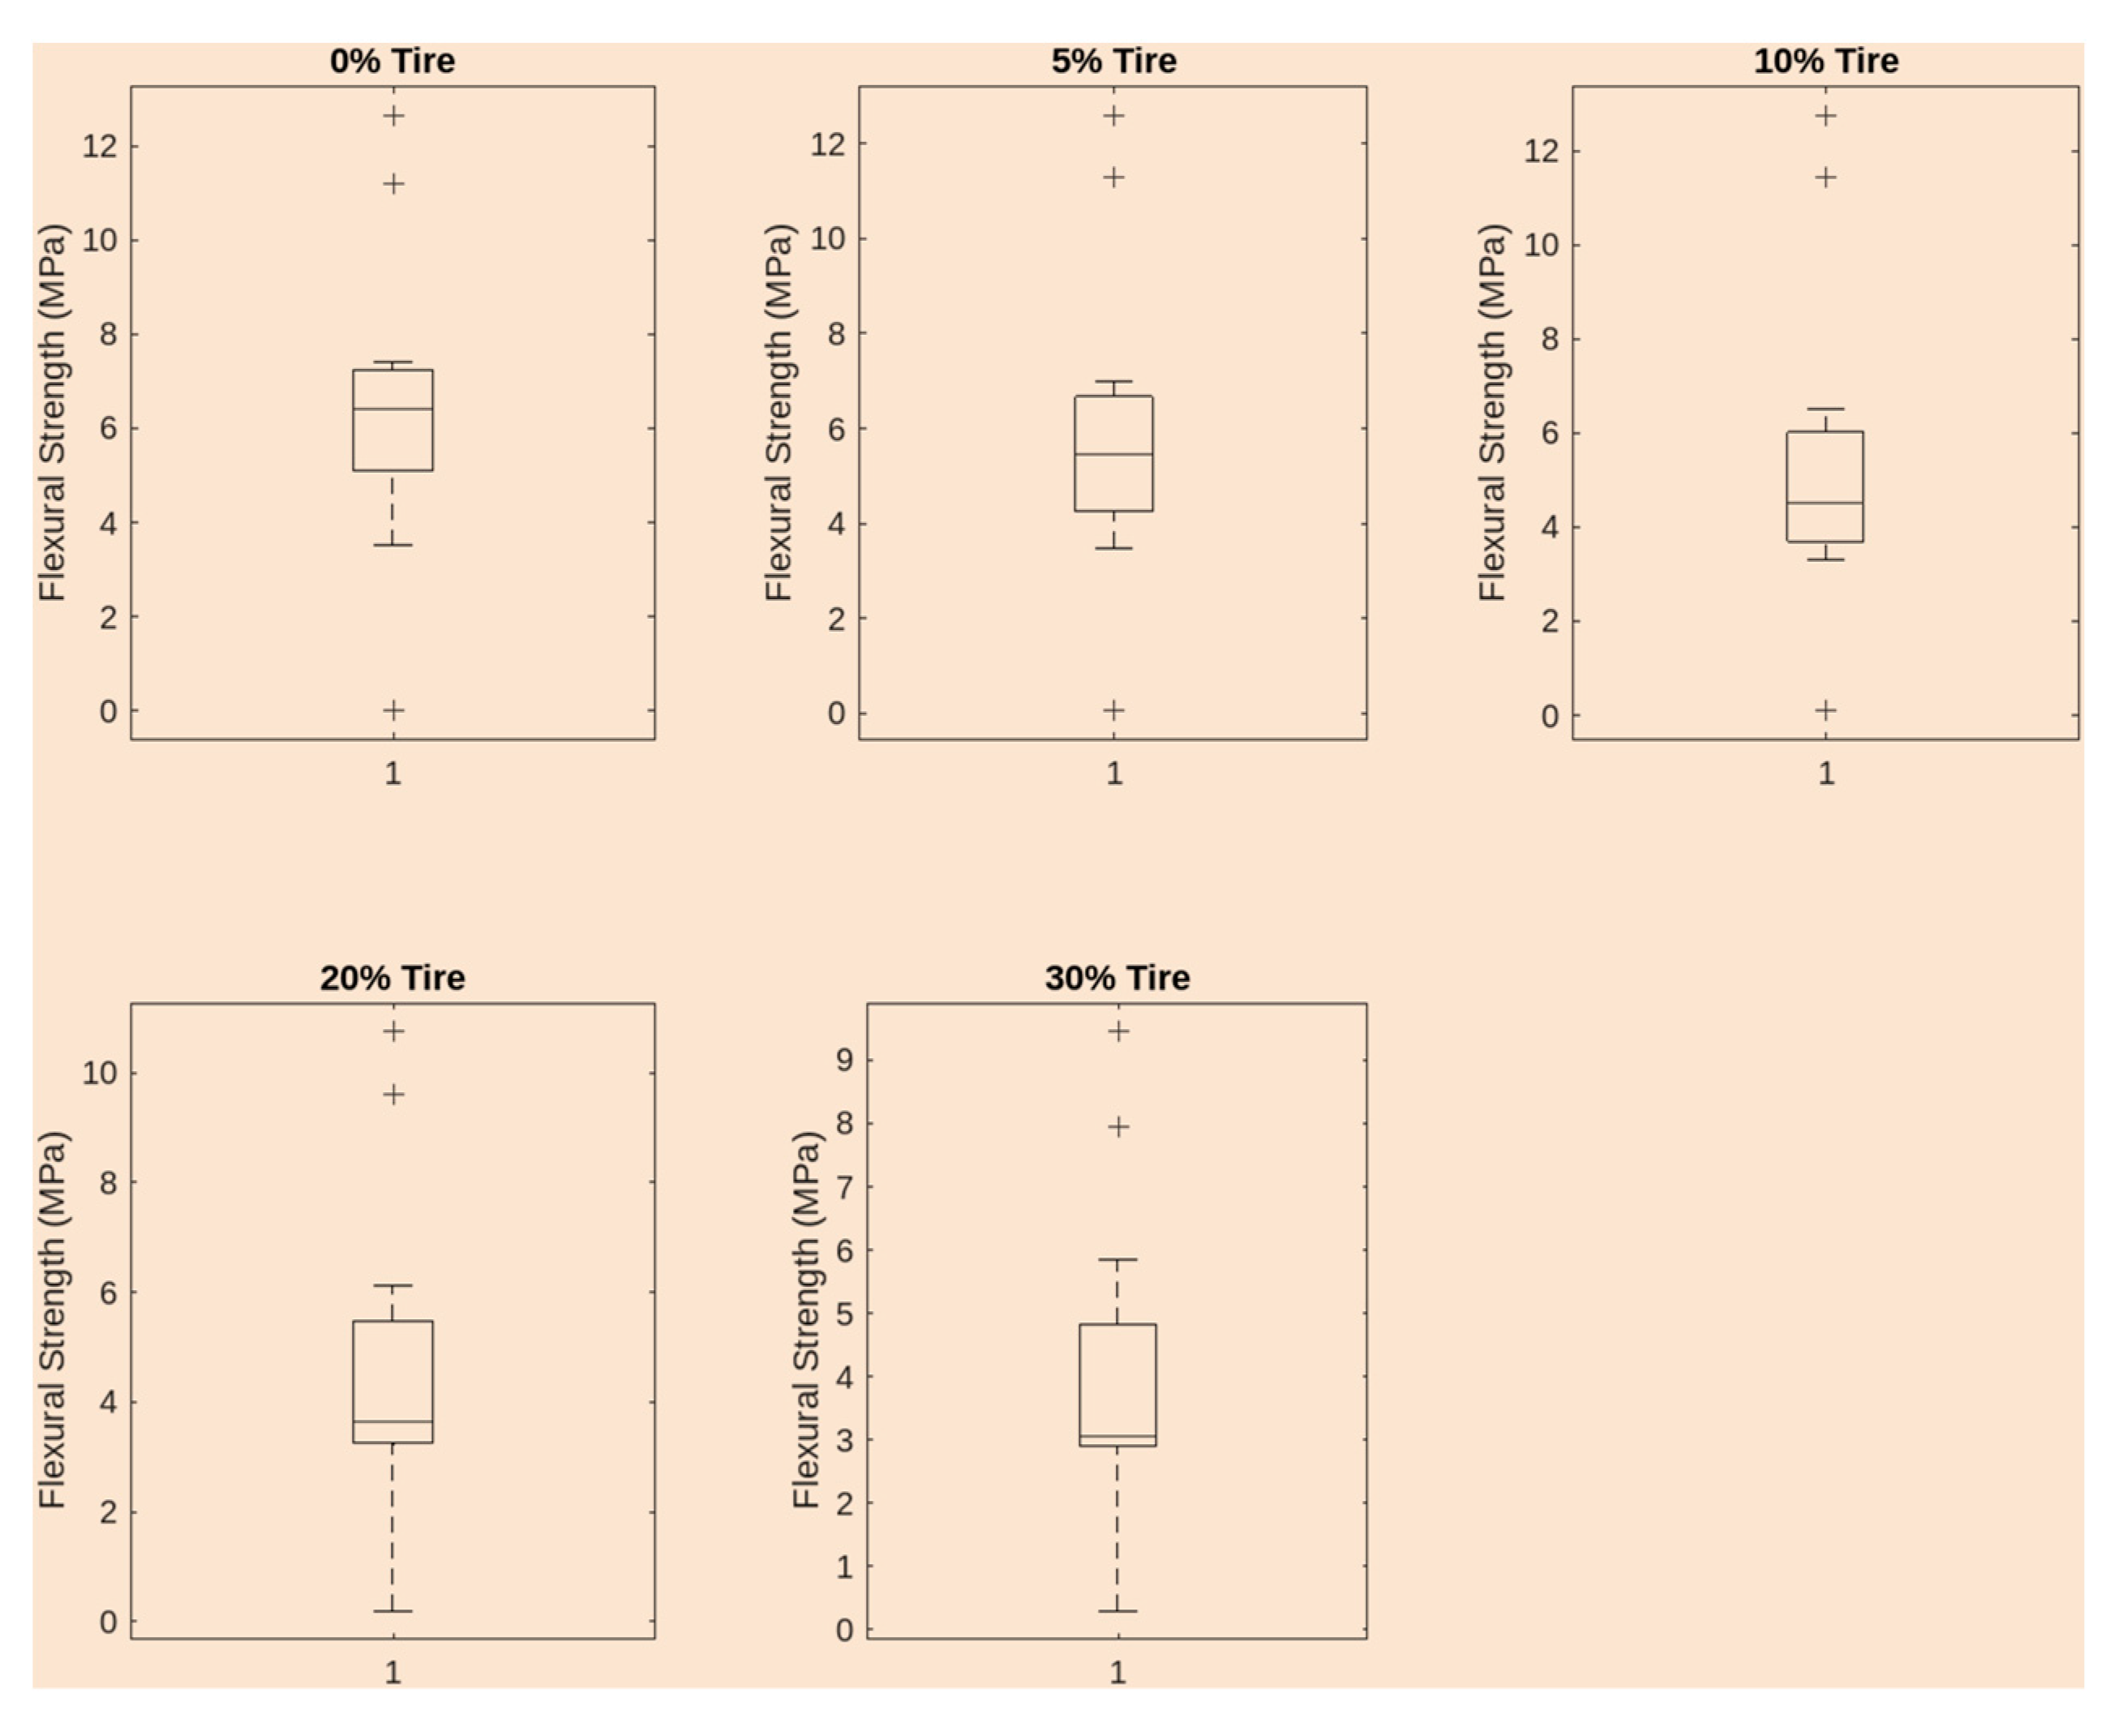
It was also observed that the flexural strength of tyre integrated concrete decreases with increase in tyre content. The mean flexural strength of the controlled mixture (containing 0% Tyre) is noted as 6.72 MPa, as shown in
Table 6 and
Figure 16. However, the above value comes down to 4.18 MPa when the tyre content is increased to 30%. Such observations also support the low stiffness characteristics of tyre aggregates [
37,
39].
3.3.8. Tensile Strength Variation of Tyre
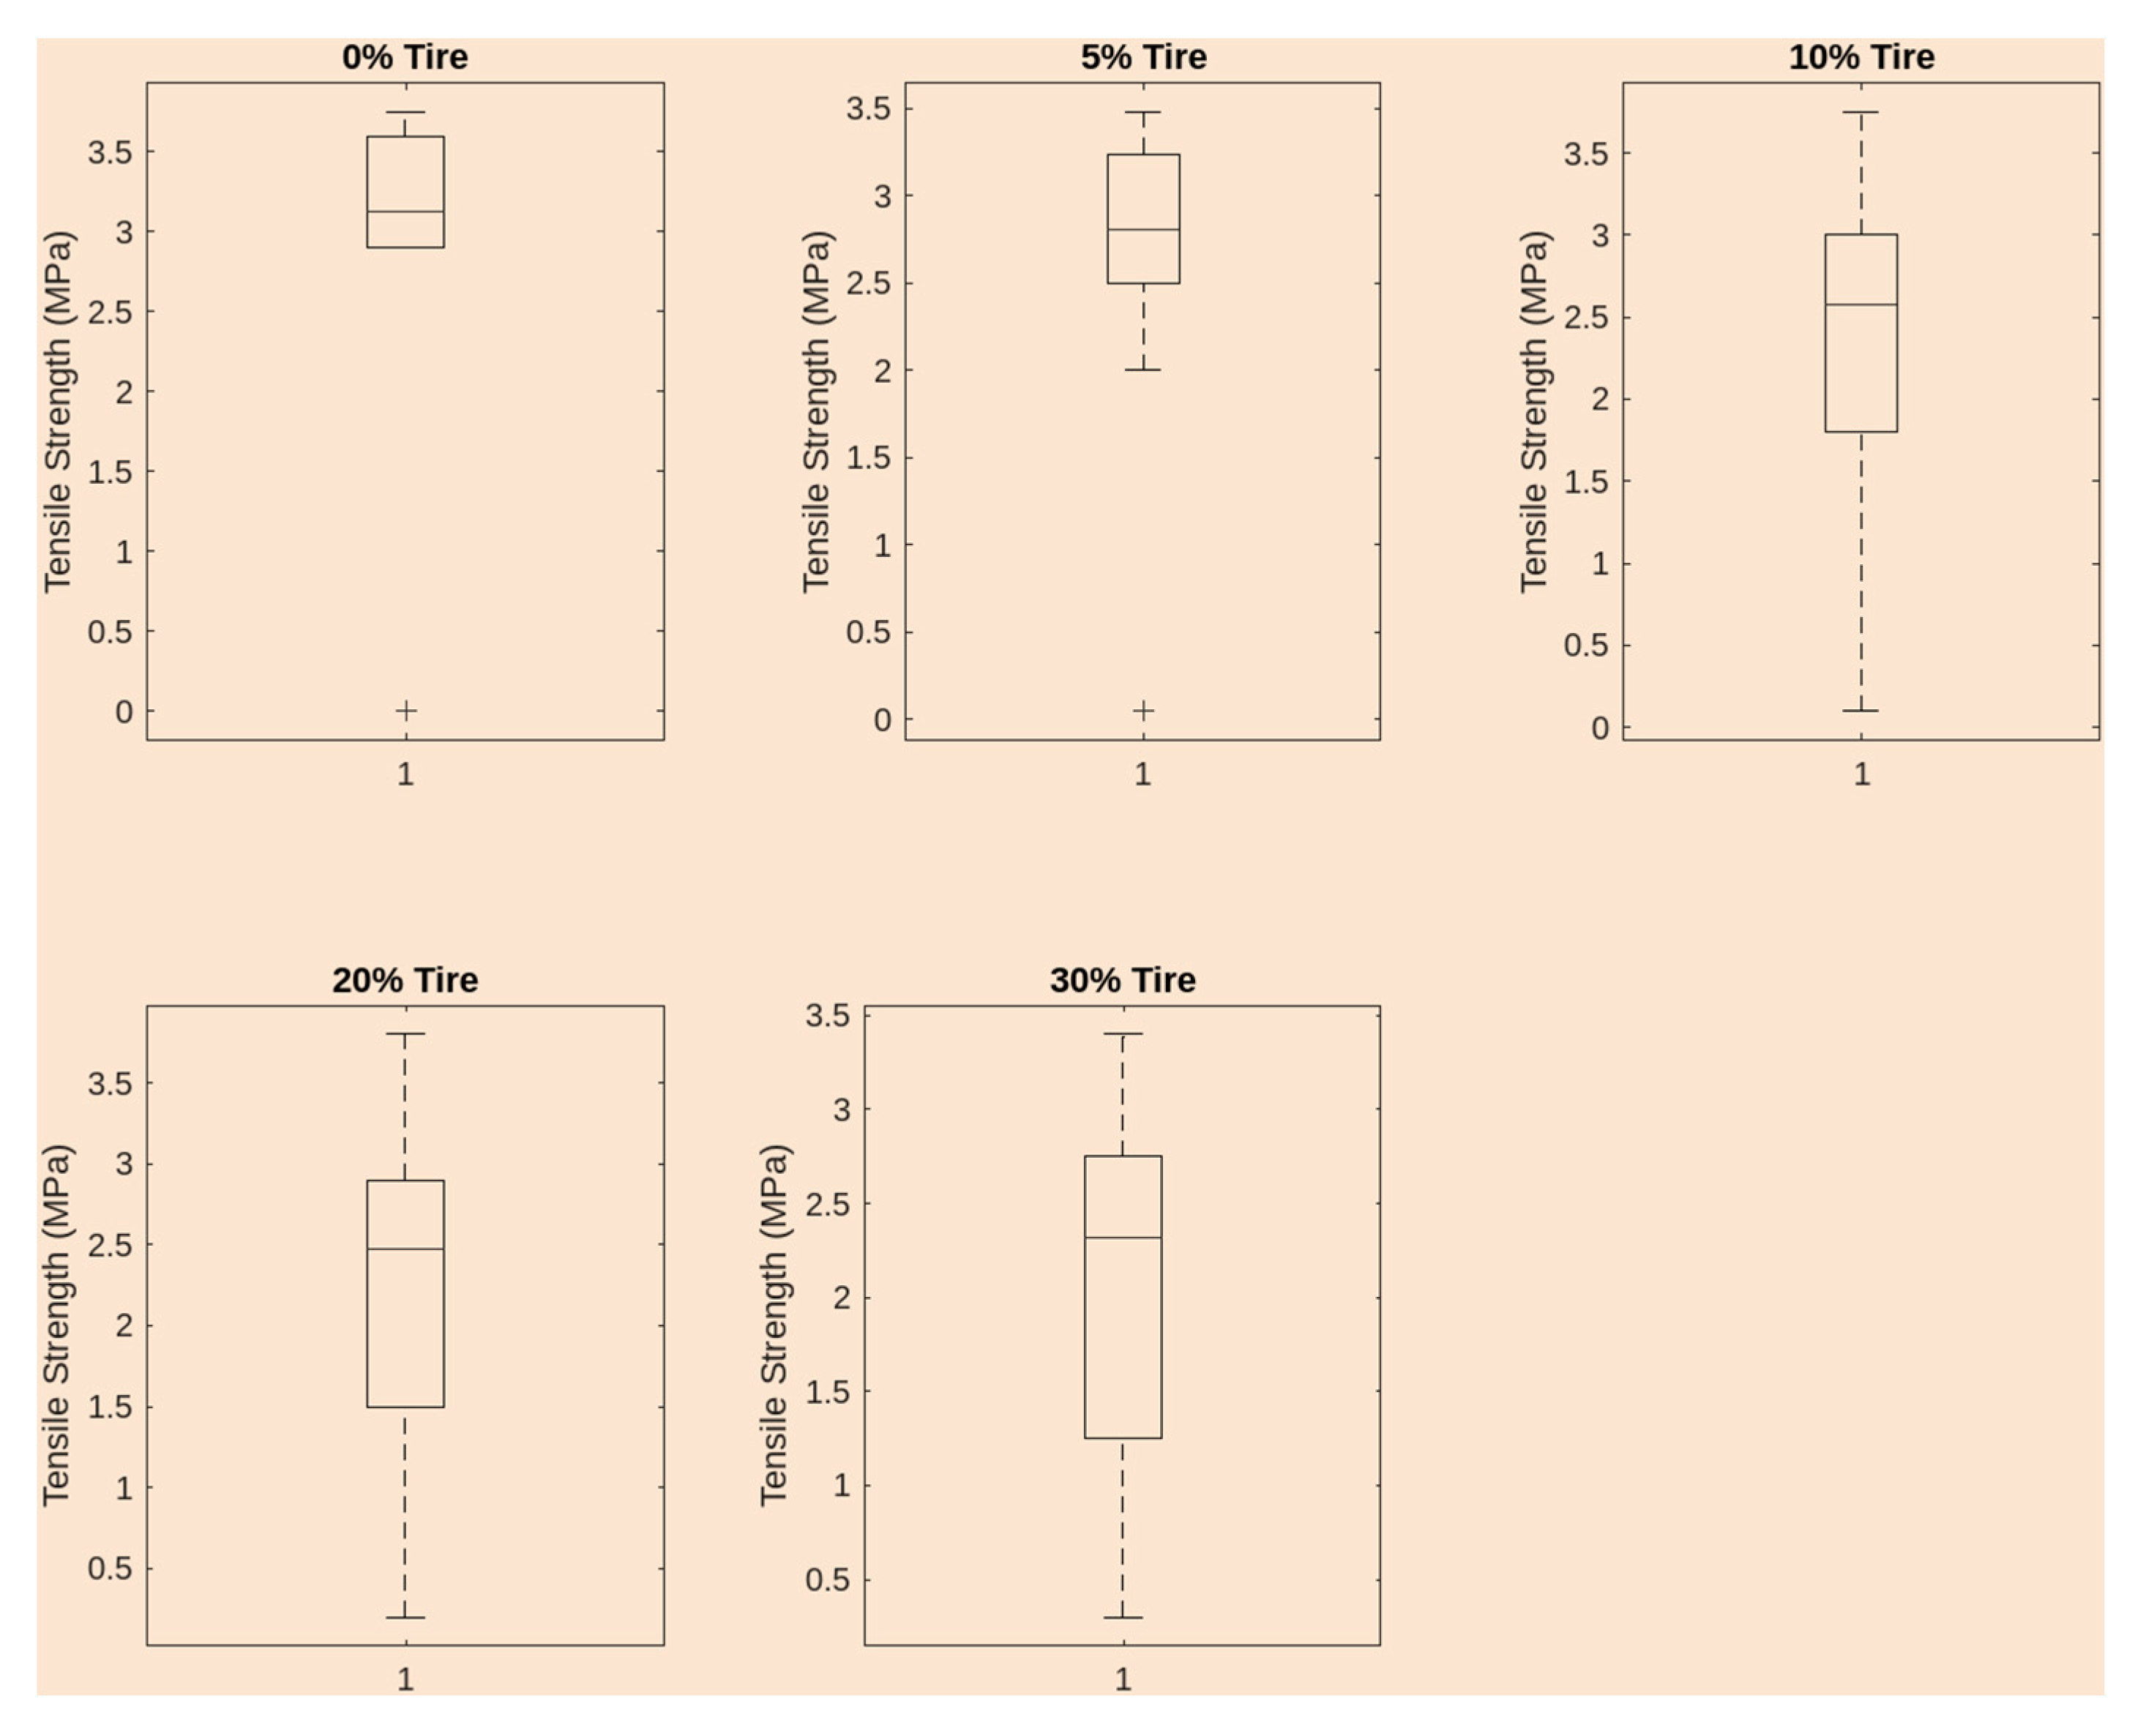
It was observed that the tensile strength of tyre-integrated concrete reduces as the proportion of tyre content increases. The mean tensile strength of the plastic-free mixture is stated to be 3.26 MPa. However, the value reduces to 2.27 MPa when the tyre content is increased to 30%, as shown in
Table 7 and
Figure 17. Which demonstrate the tensile strength reduction with the addition of tire content to the concrete mixes [
37].
3.4. Data Correlation Analysis of Plastic
Slump: The correlation coefficient value resulted in 0.0274 indicates a low positive correlation between percentage of plastic substitution and slump, as shown in
Table 8. The above fact reveals that there is a very slight increase in the slump value of the concrete mixture as the percentage of plastic is increased. This may have been implying that the higher the plastic content could improve slightly the of the mix [
28].
Compressive Strength: The value of the correlation coefficient is -0.6850 indicates that the higher the usage of plastic, the lower the strength of concrete. This will tell us that as the proportion of plastic is increased in the concrete mixture the compressive strength is significantly reduced. The incorporation of plastic in the structure could reduce the load bearing capacity of the concrete in compression, probably due to inherent properties of the plastic material which is not as rigid as traditional coarse aggregates [
30,
31].
Flexural Strength: Moreover, the linear correlation coefficient is - 0.4408, increase in plastic percentage level has a moderate negative relationship with the flexural strength. This mean that the higher the plastic, the lower the flexural strength would be. Plastic particles lead to the deterioration of bending resistance of a concrete element with an impact on its ability to bear loads [
36].
Tensile Strength: Let the value be -0.5020 as
Table 8 illustrates that there is moderate negative relationship between the amount of addition of plastic and tensile strength as the volume of plastic increase in the concrete mix the tensile strength decrease relative to the increase in the volume of added plastic. The recession of the plastic may cause defects on the concrete and thus it may make the concrete more susceptible of the tensile force and cracking [
28].
3.5. Pearson Correlation Analysis of Tyre
The Data Correlcation Analusis of Typre Propepties are Shown in Table 9
Slump: The significance of the correlation coefficient is -0.0532 showed a very minimum negative correlation between the percentage of tyre rubber content with the slump. This means that with the higher level of tyre rubber in the concrete mix the slump will be slightly low. However, this relation isn’t very close and the conclusion can be made that the concrete workability decreased with the increase of the rubber content but to some extent [
37].
Compressive Strength: Pearson correlation coefficient of –0.6955 is a strong negative relationship between the amount of tyre rubber added and the compressive strength. This shows that as the proportion of the tyre rubber in the mix increases there is a corresponding reduction in the compressive strength. The use of tyre rubber aggregates might lead to the deterioration of the concrete matrix and its ability to withstand compressive loads [
37,
38].
Flexural Strength: With the correlation coefficient of -0.3555 ( as showin in
Table 9) it was noticed a moderate negative relationship between the addition of tyre percentage and the flexural strength. This means that as the content of tyre rubber rises, the flexural strength is slightly reduced. The coarse aggregates of tyre rubber may hamper the capacity of the concrete to bear the bending stresses that can affect the structural integrity [
39].
Tensile Strength: Consequently the correlation coefficient is -0.4613, evident that the relationship between tyre addition percentages and tensile strength is moderately negative. This indicates that as the percentage of tyre rubber in the concrete mix increases, the rate at which the tensile strength reduces is slower. They have the possibility of forming the weakest phase of the concrete matrix which is more sensitive to tensile stresses and might crack [
37].
3.6. Life Cycle Assessment Impact Category Evaluation of Plastic Concrete Mixes
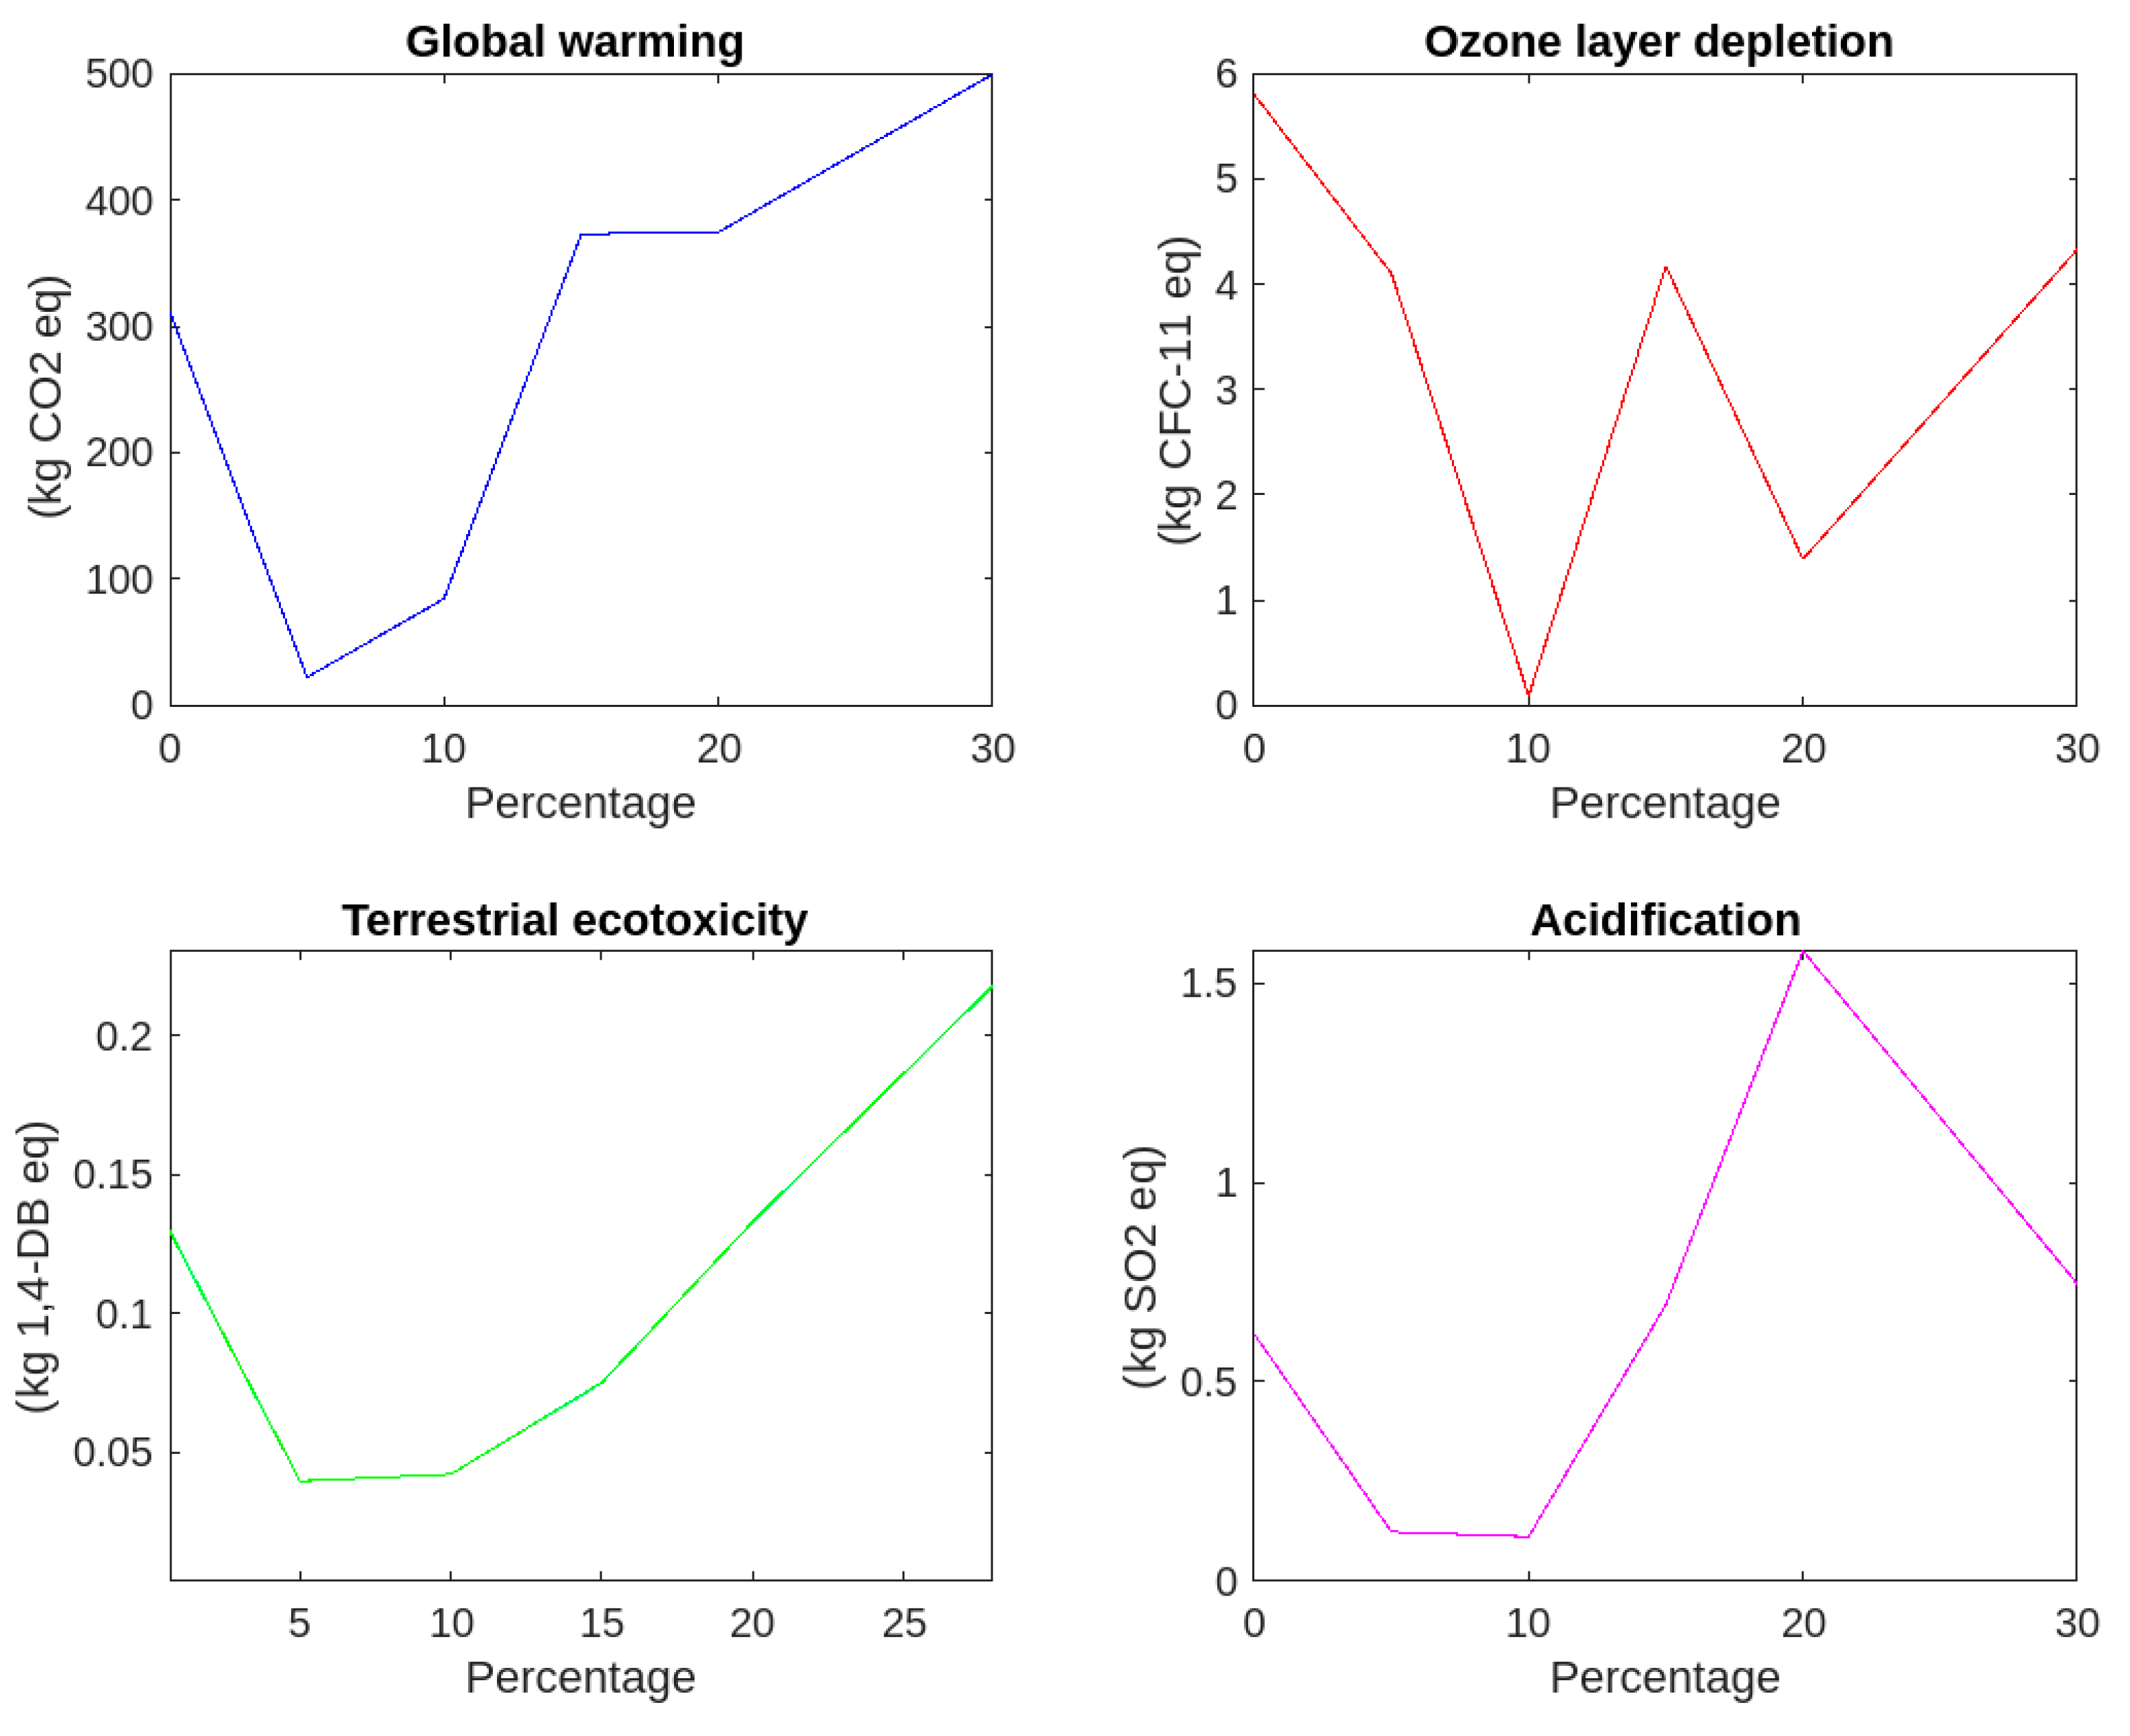
Table 10 and
Figure 18 display the life cylce analysis, assessment and evaluyation of plastic concrete mxtures.
Global Warming: Scientific data suggests that the global warming potential is not constant with different additions of plastics. Notably, an addition of 30% plastic has the greatest effect on global warming, which goes up to 499.4 kg CO2. This means that the percentage of plastic does not have a straight line relationship with the global warming potential. That recycling entails varying emission levels indicates that higher percentages cause a considerable rise in the emission of CO2 equivalents. It could be attributed to the energy demanding processes which involve management and recycling of plastics particularly where concentrations of plastics are high [
40,
41].
Ozone Layer Depletion: The result of the ozone layer is quite similar to other percentages of plastic waste (kg CFC-11 eq) and ranges from 0.000000092 to 0.0000058. This thus suggests that concrete systems which have plastics added to it in the mix might not pose a significant threat to the ozone layer, in each percentage difference. A small contrast in this category shows that uncovered plastics not much contribute to the depletion of the ozone layer as other environmental factors [
42,
43].
Terrestrial Ecotoxicity: The increase of the ecotoxicity impact on terrestrial ecosystems (kg 1,4-DB eq) is demonstrated as a nonuniform change with the addition of a plastic fraction. Lower numbers (0-10%) denote a low level of ecotoxicity while higher numbers (15-30%) represent high levels of ecotoxicity. This indicates that the relationship is not linear, in fact, as the number of the plastic particles increases the magnitude of the harm done to the terrestrial ecosystems also increases. While leaching of toxic components from plastic particles into the soil may have a role to play in this regard, this is yet to be determined [
44].
Acidification: Acidification potential in kg SO2 is a wave form that closely resembles the global warming potential curve. Plastic had the least acidification potential when the mixing plastic percentage was 0-10% and the highest acidification potential with 15-30% plastic percentages. As the proportion of the plastic component rises, it is possible to produce more and more acid. The processes of treatment and disposal that are associated with plastics wastes could lead to the release of acidic gases which in turn increases the degree of acidification of concrete mixes [
40,
45].
3.7. Life Cycle Assessment Impact Category Evaluation of Tyre Concrete Mixes
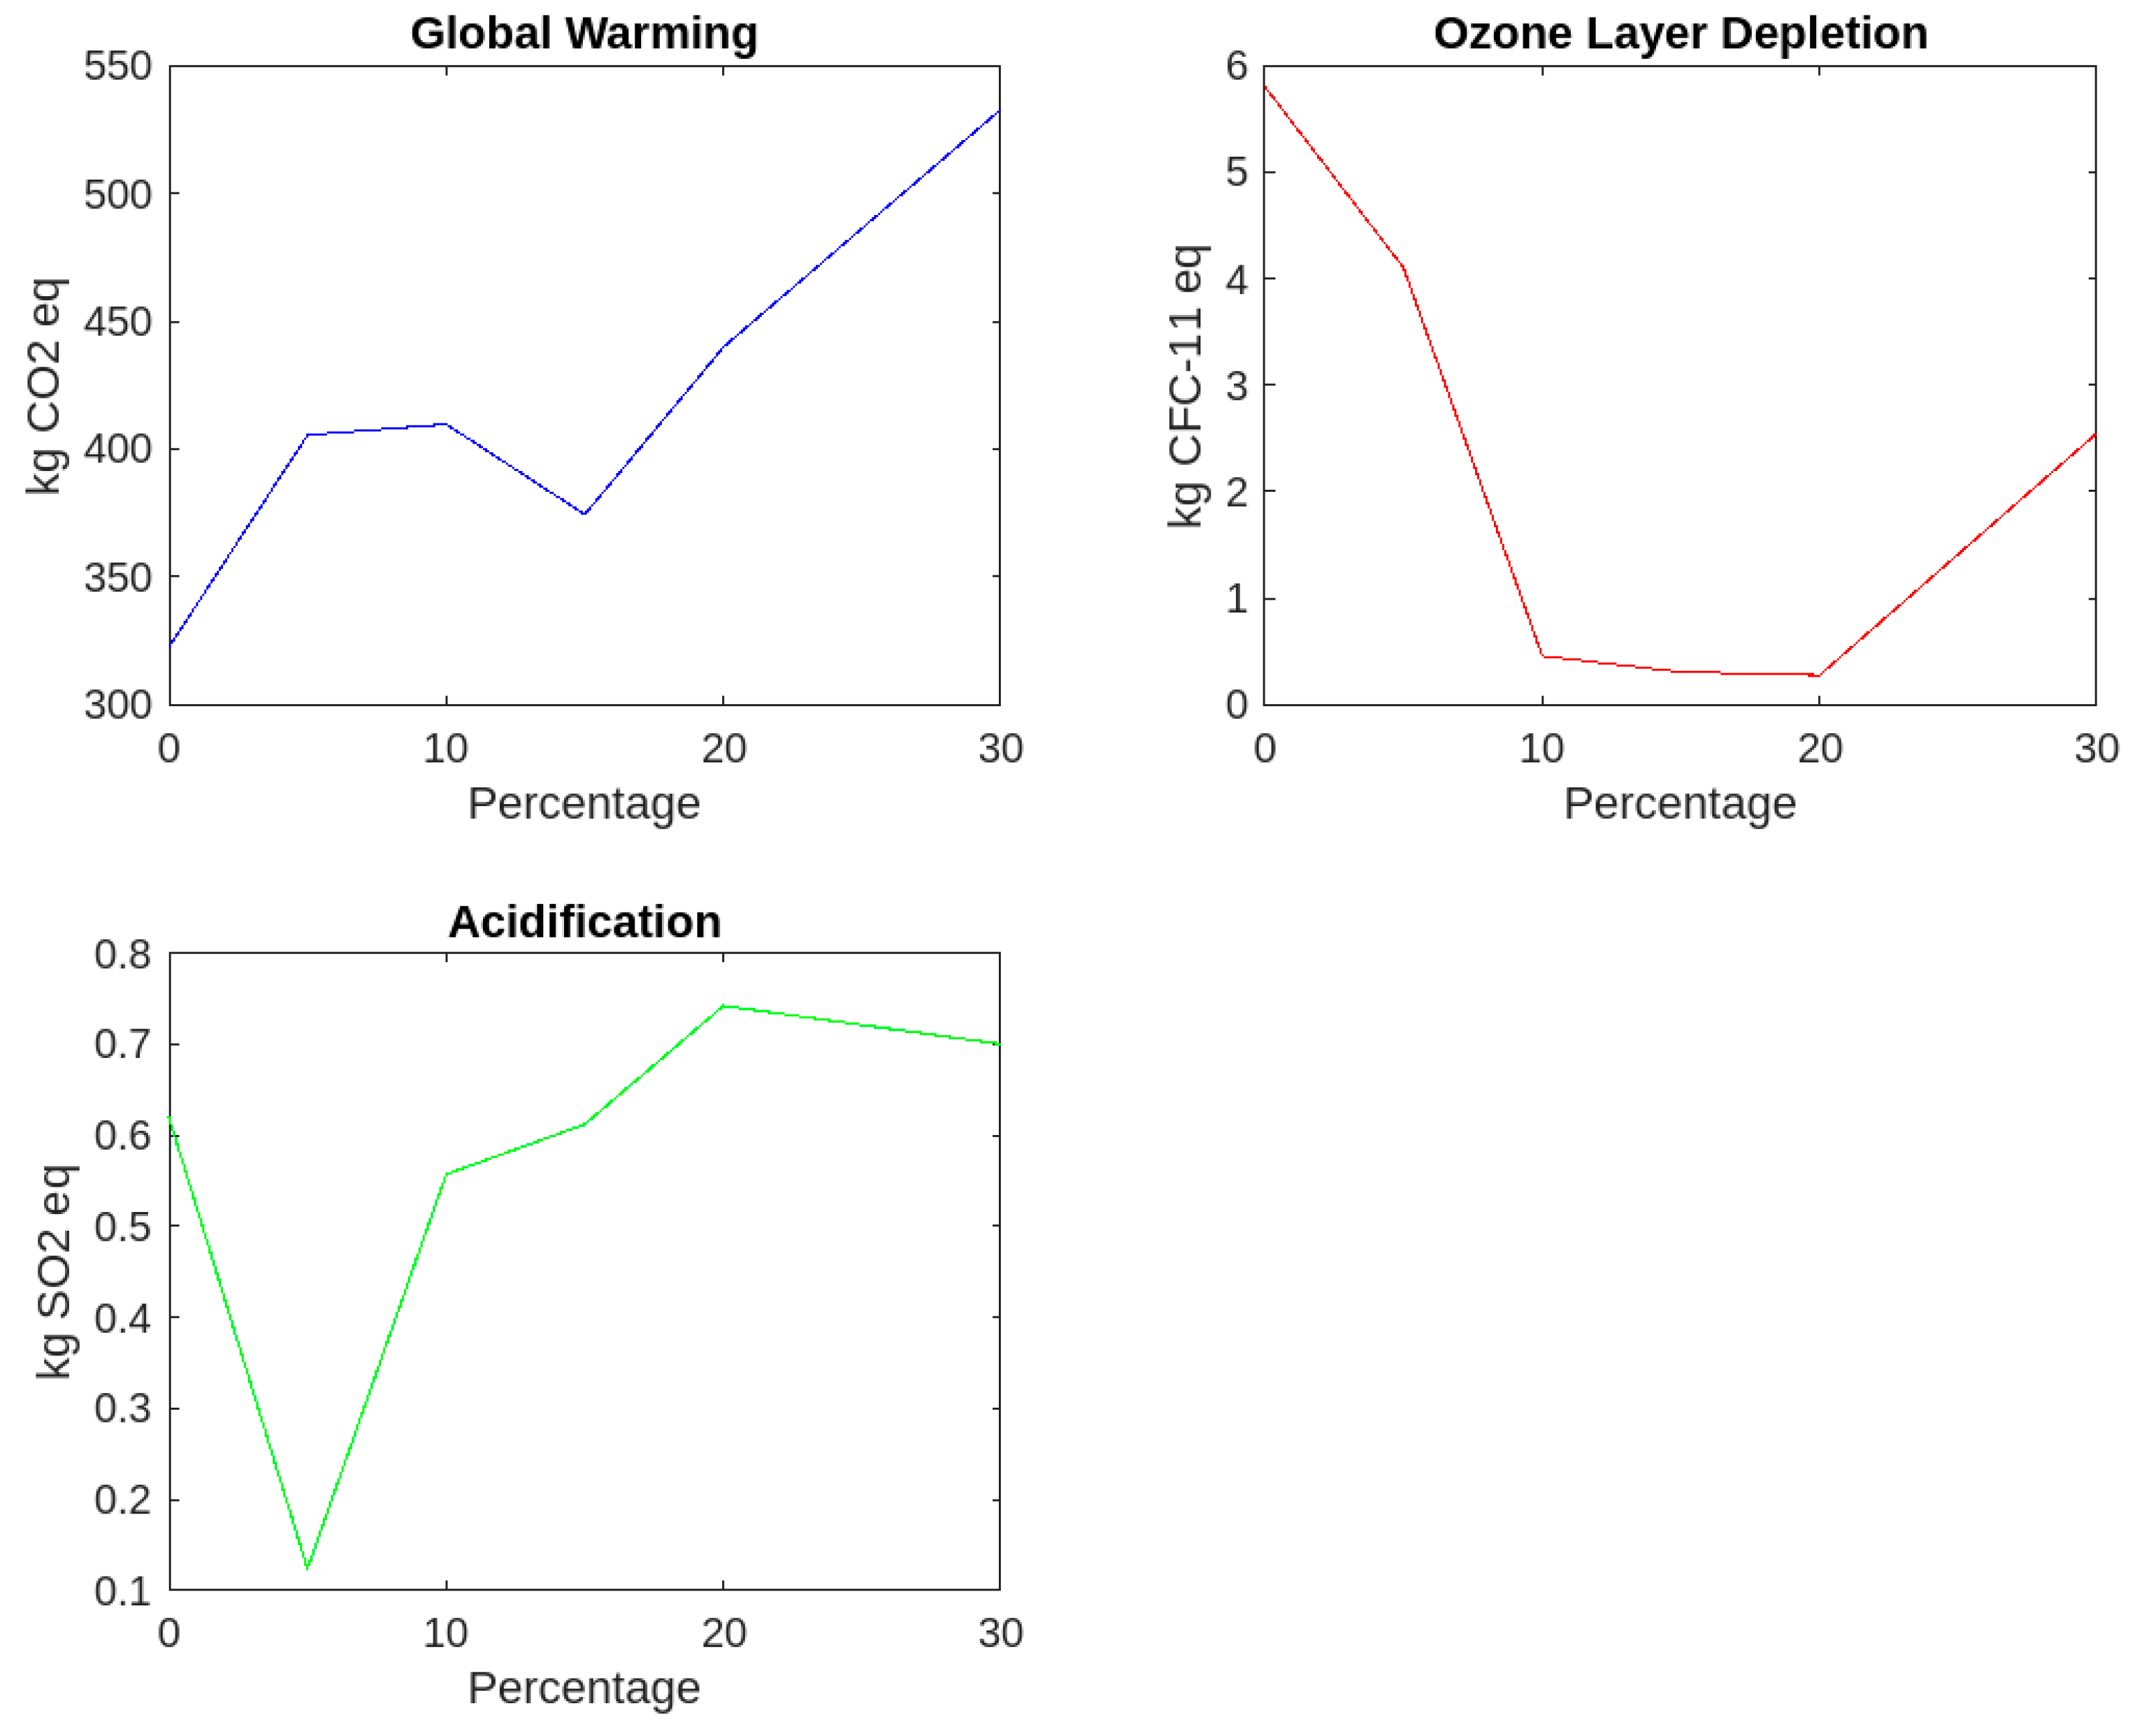
Table 11 and
Figure 19 display the life cylce analysis, assessment and evaluyation of tyre concrete mxtures.
Global Warming: From the data, it is apparent that the global warming potential (kg CO2 eq) increases proportionately with the increased percentage of the tyre rubber added. The graph indicates clearly the increasing trend as the percentage of the additives (30% tyre rubber) increases to its maximum value of 532.75 kg CO2. This means that there is a direct proportion between the percentage of tyre rubber used and the global warming potential whereby a higher percentage of tyre rubber content releases more carbon dioxide equivalents. The processes used in tyre rubber waste management and recycling; could, in fact, be accountable for these emissions thereby focusing on the environmental impacts should form part of the important aspect among the materials used in concrete mixes [
46,
47].
Ozone Layer Depletion: The variation in the effect on ozone layer depletion (kg CFC-11 eq) is insignificant when comparing the various tyre rubber percentages. The values are from 0.00000028 to 0.0000058, this confirms that the blend of rubber into tyres does not affect the depletion of the ozone layer even if the percentage is raised. This implies that other aspects must have a greater influence on the degradation of the ozone layer than the quantity of rubber in concrete blends [
44,
46].
Acidification: Higher tyre rubber share corresponds to higher acidification potential (kg SO2 eq). From the tyre content increase, it can be deduced that the abundance of tyre rubber as a component is directly proportional to the extent of acidification potential and thus leading to enhanced acidification potential. The findings that indicate that rubbers in tires, and their waste management, and disposal processes release acidic gases, thus increasing the degree of acidification in concrete mixtures. It is possible that measures to minimize the impact of acidification along with the addition of tyre rubber may be required [
45,
47].
3.7. Optimal Percentage of Waste Material Identification for Non-Structural Concrete Mix Designs
Optimal Percentage of Plastic Aggregate (10%) Was Selected for Grade 20 Non-Structural Concrete
The mechanical properties of the concrete containing 10% of the plastic aggregate were investigated extensively. The results obtained for the former showed that the compressive strength was 22.34 MPa which is conforming to Grade 20 standard, this shows ability of concrete to take axial force or pressure for confirmation of its suitability for non structural application [49 and 50]. The flexural strength was obtained at 4.30 MPa, which proves that the material effectively resists bending stresses and applies to structures with non-bearing purposes. Further, the tensile strength was determined as 3.15 MPa, which shows that concrete has minor tensile strength and does not cause the material to distort or break when under this pressure.
LCA also proved significant in defining the right mix design. Thus, the reduction of the concrete mix with 10% plastic aggregate was found to have a global warming potential of 84.6 kg CO2, showing that utilization of waste materials in concrete production has led to the improvement if the environmental bucket. The ozone layer depletion potential was established to be extremely low, equal to zero at 0.000000092 kg CFC-11 with prove that it has very little effect on the depletion of the ozone layer. The terrestrial ecotoxicity was expressed at 0.042 kg 1,4-DB, the mix does not represent a serious danger to the terrestrial environment. Finally, the acidification potential was estimated to be 0.112 kg SO2, putting the concrete mix in the middle of the range as far as the production of acid rain is concerned.
Optimal Percentage of Tyre Aggregate (10%) Was Selected for Grade 30 Non-Structural Concrete
The optimal percentage of tyre aggregate (10%) has been recommended for Grade 30 non-structural concrete that provides better mechanical property benefits and also environmentally friendly [
48,
49,
50]. The compressive strength of this concrete mix is affirmed at 30.17 MPa and good against vertical loads and pressure; therefore suitable for non-structural applications that do not need high strength.
Besides compressive strength, the concrete with 10% tyre aggregate has a flexural strength of 5.64 MPa. This parameter is useful in establishing the concrete’s capacity to handle bending stresses thus suitable for use in pavements, footpath, and precast products. The mix also has a tensile strength of 2.62 MPa which should be enough to prevent deflection or rupture in non-structural applications where tension forces are involved.
In addition to mechanical characteristics, it is also important to consider the environmental effects of employing tyre aggregate in concrete. The concrete mix has a global warming potential of 409.76 kgCO2, less than the embodied CO2 of other conventional methods of producing concrete. This environmental advantage confirms the importance of using waste material in the attempt to minimize the impacts of carbon footprint in constructions.
The mix also indicates low ozone layer depletion potential at 0.00000046 kgCFC-11. This minimal effect on the depletion of the ozone layer contributes to the sustainability objectives of minimizing harm on the environment, and recycling wastes. Further, the acidification potential of the concrete mix is determined as 0.557 kgSO2, which is a relatively small value contributing to formation of acid rains. This also works in favor of environmental sustainability since the mix offers less harm to the environment than the normal concrete.
5. Conclusions
The study covers availability of plastic and tyre aggregates for concrete, material characteristics, performance and environmental considerations. It seeks to analyze the impact of waste materials on concrete by analyzing specific gravity, water absorption, bulk density, and performance parameters such as slump, compressive strength, flexural strength, and tensile strength.
Particle size, shape and composition significantly influences the specific gravity, water absorption and bulk density of the aggregates like plastic and tyres. All these variations should be well controlled to achieve the best out of concrete and its durability. According to the test results, the plastic and tyre aggregates affect the workability and mechanical properties of concrete; and there is a general reduction of strength as the content of waste material increases it is therefore commendable to consider the proportion of waste material for the required performance.
Potential environmental impacts calculated using life cycle assessment (LCA) are global warming impact, ozone depletion impact, terrestrial ecotoxicity impact and acidification. It identified differences between the plastic and tyre aggregates in these categories, stressing the importance of taking into consideration environmental impacts when selecting materials and managing wastes.
The study found the ideal content to be 10% of plastic in the Grade 20 concrete and 10% of tyre aggregates in the Grade 30 concrete for non-structural concretes. Overall, this balance meets performance criteria and environmental objectives as it seeks the least amount of negative impact to the environment as much as possible utilization of waste.
This research offers insights into the incorporation of waste materials into non-structural concrete and the importance of adopting sustainable building construction approaches. It emphasizes how waste can be utilized to decrease the number of negative impacts of concrete production and contribute to resource efficiency and solving global problems of waste disposal within the construction sector.
Author Contributions
Project leader and supervision [N.S.M.], writing original draft [A.D.S.], data analysis [A.D.S.], review and editing [A.D.S.] and [ N.S.M.], resources and validation [A.D.S.] and [ N.S.M.], funding [ N.S.M.].
Funding
This research received no external funding.
Institutional Review Board Statement
Not applicable.
Informed Consent Statement
Not applicable.
Data Availability Statement
Not applicable.
Acknowledgments
Guidance and support received from the school of engineering Edith Cowan university is highly acknowledged.
Conflicts of Interest
The authors declare no conflict of interest.
References
- SGP and UNDP, “Study on Plastic Waste in the Republic of Moldova STUDY On management waste from PLASTIC,” 2023. Accessed: Mar. 21, 2024. [Online]. Available: https://www.undp.org/sites/g/files/zskgke326/files/2023-07/study_plastic_waste_in_moldova.pdf.
- M. Sabău and J. R. Vargas, “Use of e-plastic waste in concrete as a partial replacement of coarse mineral aggregate,” Computers and Concrete, vol. 21, no. 4, pp. 377–384, Apr. 2018. [CrossRef]
- TSA, “AUSTRALIAN TYRE CONSUMPTION AND RECOVERY,” Tyre Stewardship Australia, 2022.
- Almohana, A.I.; Abdulwahid, M.Y.; Galobardes, I.; Mushtaq, J.; Almojil, S.F. Producing sustainable concrete with plastic waste: A review. Environ. Challenges 2022, 9. [Google Scholar] [CrossRef]
- Pacheco-Torgal, F.; Ding, Y.; Jalali, S. Properties and durability of concrete containing polymeric wastes (tyre rubber and polyethylene terephthalate bottles): An overview. Constr. Build. Mater. 2012, 30, 714–724. [Google Scholar] [CrossRef]
- Li, X.; Ling, T.-C.; Mo, K.H. Functions and impacts of plastic/rubber wastes as eco-friendly aggregate in concrete – A review. Constr. Build. Mater. 2019, 240, 117869. [Google Scholar] [CrossRef]
- Batayneh, M.; Marie, I.; Asi, I. Use of selected waste materials in concrete mixes. Waste Manag. 2006, 27, 1870–1876. [Google Scholar] [CrossRef]
- Kumar, K.S.; Baskar, K. Recycling of E-plastic waste as a construction material in developing countries. J. Mater. Cycles Waste Manag. 2014, 17, 718–724. [Google Scholar] [CrossRef]
- Cwirzen, A. “Properties of SCC with industrial by-products as aggregates,” Self-Compacting Concrete: Materials, Properties and Applications, vol. 1, no. 1, pp. 249–281, 2020. [CrossRef]
- Al-Mansour, A.; Chen, S.; Xu, C.; Peng, Y.; Wang, J.; Ruan, S.; Zeng, Q. Sustainable cement mortar with recycled plastics enabled by the matrix-aggregate compatibility improvement. Constr. Build. Mater. 2022, 318. [Google Scholar] [CrossRef]
- Sadrmomtazi, A.; Dolati-Milehsara, S.; Lotfi-Omran, O.; Sadeghi-Nik, A. The combined effects of waste Polyethylene Terephthalate (PET) particles and pozzolanic materials on the properties of self-compacting concrete. J. Clean. Prod. 2016, 112, 2363–2373. [Google Scholar] [CrossRef]
- Gheni, A.A.; Alghazali, H.H.; ElGawady, M.A.; Myers, J.J.; Feys, D. Durability properties of cleaner cement mortar with by-products of tire recycling. J. Clean. Prod. 2019, 213, 1135–1146. [Google Scholar] [CrossRef]
- Tran, T.Q.; Thomas, B.S.; Zhang, W.; Ji, B.; Li, S.; Brand, A.S. A comprehensive review on treatment methods for end-of-life tire rubber used for rubberized cementitious materials. Constr. Build. Mater. 2022, 359. [Google Scholar] [CrossRef]
- G. N. Kumar, “USING TYRES WASTES AS AGGREGATES IN CONCRETE TO FORM RUBCRETE – MIX FOR ENGINEERING APPLICATIONS,” International Journal of Research in Engineering and Technology, vol. 03, no. 11, pp. 500–509, Nov. 2014. [CrossRef]
- Eldin, N.N.; Senouci, A.B. Measurement and prediction of the strength of rubberized concrete. Cem. Concr. Compos. 1994, 16, 287–298. [Google Scholar] [CrossRef]
- Sofi, A. Effect of waste tyre rubber on mechanical and durability properties of concrete – A review. Ain Shams Eng. J. 2018, 9, 2691–2700. [Google Scholar] [CrossRef]
- Mohammed, B.S.; Hossain, K.M.A.; Swee, J.T.E.; Wong, G.; Abdullahi, M. Properties of crumb rubber hollow concrete block. J. Clean. Prod. 2012, 23, 57–67. [Google Scholar] [CrossRef]
- Alyousef, R.; Ahmad, W.; Ahmad, A.; Aslam, F.; Joyklad, P.; Alabduljabbar, H. Potential use of recycled plastic and rubber aggregate in cementitious materials for sustainable construction: A review. J. Clean. Prod. 2021, 329, 129736. [Google Scholar] [CrossRef]
- Bhogayata, A.C.; Arora, N.K. Fresh and strength properties of concrete reinforced with metalized plastic waste fibers. Constr. Build. Mater. 2017, 146, 455–463. [Google Scholar] [CrossRef]
- Karunarathna, S.; Linforth, S.; Kashani, A.; Liu, X.; Ngo, T. Effect of recycled rubber aggregate size on fracture and other mechanical properties of structural concrete. J. Clean. Prod. 2021, 314, 128230. [Google Scholar] [CrossRef]
- Nadesan, M.S.; Dinakar, P. Mix design and properties of fly ash waste lightweight aggregates in structural lightweight concrete. Case Stud. Constr. Mater. 2017, 7, 336–347. [Google Scholar] [CrossRef]
- Zhang, S.P.; Zong, L. Evaluation of Relationship between Water Absorption and Durability of Concrete Materials. Adv. Mater. Sci. Eng. 2014, 2014, 1–8. [Google Scholar] [CrossRef]
- Horn, R. Aggregate characterization as compared to soil bulk properties. Soil Tillage Res. 1990, 17, 265–289. [Google Scholar] [CrossRef]
- Ismail, Z.Z.; Al-Hashmi, E.A. Use of waste plastic in concrete mixture as aggregate replacement. Waste Manag. 2007, 28, 2041–2047. [Google Scholar] [CrossRef]
- Shaikh, F.U.A.; Luhar, S.; Arel, H. .; Luhar, I. Performance evaluation of Ultrahigh performance fibre reinforced concrete – A review. Constr. Build. Mater. 2019, 232, 117152. [Google Scholar] [CrossRef]
- Ahmad, J.; Martínez-García, R.; De-Prado-Gil, J.; Irshad, K.; El-Shorbagy, M.A.; Fediuk, R.; Vatin, N.I. Concrete with Partial Substitution of Waste Glass and Recycled Concrete Aggregate. Materials 2022, 15, 430. [Google Scholar] [CrossRef] [PubMed]
- Goh, P.G.; Maghfouri, M.; Onn, C.C.; Loo, S.C. Life cycle assessment on recycled e-waste concrete. Case Stud. Constr. Mater. 2022, 17. [Google Scholar] [CrossRef]
- S, A. Experimental Study on the Mechanical behaviour of Concrete by Partial Replacement of Waste Iron Powder as Fine Aggregate: A Green Concrete Approach. August 2022 2020, 6, 126–130. [Google Scholar] [CrossRef]
- Manjunath, B.A. Partial Replacement of E-plastic Waste as Coarse-Aggregate in Concrete. Procedia Environ. Sci. 2016, 35, 731–739. [Google Scholar] [CrossRef]
- Ahmad, F.; Jamal, A.; Mazher, K.M.; Umer, W.; Iqbal, M. Performance Evaluation of Plastic Concrete Modified with E-Waste Plastic as a Partial Replacement of Coarse Aggregate. Materials 2021, 15, 175. [Google Scholar] [CrossRef] [PubMed]
- Arnandha, Y.; Satyarno, I.; Awaludin, A.; Irawati, I.S.; Prasetya, Y.; Prayitno, D.A.; Winata, D.C.; Satrio, M.H.; Amalia, A. Physical and Mechanical Properties of WPC Board from Sengon Sawdust and Recycled HDPE Plastic. Procedia Eng. 2017, 171, 695–704. [Google Scholar] [CrossRef]
- Khaloo, A.R.; Dehestani, M.; Rahmatabadi, P. Mechanical properties of concrete containing a high volume of tire–rubber particles. Waste Manag. 2008, 28, 2472–2482. [Google Scholar] [CrossRef]
- Sofi, A. Effect of waste tyre rubber on mechanical and durability properties of concrete – A review. Ain Shams Eng. J. 2018, 9, 2691–2700. [Google Scholar] [CrossRef]
- Etefa, G.; Mosisa, A. Waste Rubber Tires: A Partial Replacement for Coarse Aggregate in Concrete Floor Tile Production. Am. J. Civ. Eng. 2020, 8, 57. [Google Scholar] [CrossRef]
- Almohana, A.I.; Abdulwahid, M.Y.; Galobardes, I.; Mushtaq, J.; Almojil, S.F. Producing sustainable concrete with plastic waste: A review. Environ. Challenges 2022, 9. [Google Scholar] [CrossRef]
- Needhidasan, S.; Ramesh, B.; Prabu, S.J.R. Experimental study on use of E-waste plastics as coarse aggregate in concrete with manufactured sand. Mater. Today: Proc. 2019, 22, 715–721. [Google Scholar] [CrossRef]
- Ganjian, E.; Khorami, M.; Maghsoudi, A.A. Scrap-tyre-rubber replacement for aggregate and filler in concrete. Constr. Build. Mater. 2008, 23, 1828–1836. [Google Scholar] [CrossRef]
- Aiello, M.; Leuzzi, F. Waste tyre rubberized concrete: Properties at fresh and hardened state. Waste Manag. 2010, 30, 1696–1704. [Google Scholar] [CrossRef] [PubMed]
- Bravo, M.; de Brito, J. Concrete made with used tyre aggregate: durability-related performance. J. Clean. Prod. 2011, 25, 42–50. [Google Scholar] [CrossRef]
- Ersan, Y.C.; Gulcimen, S.; Imis, T.N.; Saygin, O.; Uzal, N. Life cycle assessment of lightweight concrete containing recycled plastics and fly ash. Eur. J. Environ. Civ. Eng. 2020, 26, 2722–2735. [Google Scholar] [CrossRef]
- Goh, P.G.; Maghfouri, M.; Onn, C.C.; Loo, S.C. Life cycle assessment on recycled e-waste concrete. Case Stud. Constr. Mater. 2022, 17. [Google Scholar] [CrossRef]
- M. T. Javadabadi, “Comparative Life Cycle Assessment of Incorporating Recycled PET Aggregates into Concrete,” Norwegian University of Science and Technology, 2008.
- Neo, E.R.K.; Soo, G.C.Y.; Tan, D.Z.L.; Cady, K.; Tong, K.T.; Low, J.S.C. Life cycle assessment of plastic waste end-of-life for India and Indonesia. Resour. Conserv. Recycl. 2021, 174, 105774. [Google Scholar] [CrossRef]
- Shi, X.; Mukhopadhyay, A.; Zollinger, D.; Grasley, Z. Economic input-output life cycle assessment of concrete pavement containing recycled concrete aggregate. J. Clean. Prod. 2019, 225, 414–425. [Google Scholar] [CrossRef]
- Alzard, M.H.; El-Hassan, H.; El-Maaddawy, T. Environmental and Economic Life Cycle Assessment of Recycled Aggregates Concrete in the United Arab Emirates. Sustainability 2021, 13, 10348. [Google Scholar] [CrossRef]
- M. Medine, Habib Trouzine, J. Barroso, and Hachemi Djadouni, “Life cycle assessment of concrete incorporating scrap tire rubber: Comparative study,” Revue Nature et Technologie, vol. 12, no. 2, pp. 1–11, Jun. 2020.
- Estanqueiro, B.; Dinis Silvestre, J.; De Brito, J.; Duarte Pinheiro, M. Environmental life cycle assessment of coarse natural and recycled aggregates for concrete. Eur. J. Environ. Civ. Eng. 2018, 22, 429–449. [Google Scholar] [CrossRef]
- N. S. Mashaan, A. H. N. S. Mashaan, A. H. Ali, M. R. Karim, and M. Abdelaziz, “Effect of crumb rubber concentration on the physical and rheological properties of rubberised bitumen binders,” International Journal of the Physical Sciences, vol. 6, no. 4, pp. 684–690, 2011.
- Mashaan, N.S. An overview of crumb rubber modified asphalt. Int. J. Phys. Sci. 2012, 7. [Google Scholar] [CrossRef]
- Mashaan, N.S.; Chegenizadeh, A.; Nikraz, H. Evaluation of the Performance of Two Australian Waste-Plastic-Modified Hot Mix Asphalts. Recycling 2022, 7, 16. [Google Scholar] [CrossRef]
Figure 1.
Research methodological process.
Figure 1.
Research methodological process.
Figure 2.
Specific gravity variation of plastic.
Figure 2.
Specific gravity variation of plastic.
Figure 3.
Water absorption variation of plastic.
Figure 3.
Water absorption variation of plastic.
Figure 4.
Bulk density variation of plastic.
Figure 4.
Bulk density variation of plastic.
Figure 5.
Plastic material properties variation box chart.
Figure 5.
Plastic material properties variation box chart.
Figure 6.
Specific gravity variation of tyre.
Figure 6.
Specific gravity variation of tyre.
Figure 7.
Water absorption variation of tyre.
Figure 7.
Water absorption variation of tyre.
Figure 10.
Slump variation plastic integrated concrete.
Figure 10.
Slump variation plastic integrated concrete.
Figure 11.
Compressive strength variation for each plastic percentage addition for concrete.
Figure 11.
Compressive strength variation for each plastic percentage addition for concrete.
Figure 12.
Flexural strength variation for each plastic percentage addition for concrete.
Figure 12.
Flexural strength variation for each plastic percentage addition for concrete.
Figure 13.
Tensile strength variation for each plastic percentage addition for concrete.
Figure 13.
Tensile strength variation for each plastic percentage addition for concrete.
Figure 14.
Slump variation tyre integrated concrete.
Figure 14.
Slump variation tyre integrated concrete.
Figure 15.
Compressive strength variation for each tyre percentage addition for concrete.
Figure 15.
Compressive strength variation for each tyre percentage addition for concrete.
Figure 16.
Flexural strength variation for each tyre percentage addition for concrete.
Figure 16.
Flexural strength variation for each tyre percentage addition for concrete.
Figure 17.
Tensile strength variation for each tyre percentage addition for concrete.
Figure 17.
Tensile strength variation for each tyre percentage addition for concrete.
Figure 18.
LCA impact category data with different plastic percentages.
Figure 18.
LCA impact category data with different plastic percentages.
Figure 19.
LCA impact category data with different tyre percentages.
Figure 19.
LCA impact category data with different tyre percentages.
Table 1.
Plastic replacement percentages of performance characteristics.
Table 1.
Plastic replacement percentages of performance characteristics.
| Performance characteristics |
Waste percentage |
| Slump |
0%, 5%, 10%, 15%, 20% |
| Compressive strength |
0%, 5%, 10%, 15%, 20%, 30% |
| Flexural strength |
0%, 5%, 10%, 20%, 30% |
| Tensile strength |
0%, 5%, 10%, 20%, 30% |
Table 2.
Average 28 days compressive strength variation with the plastic percentage.
Table 2.
Average 28 days compressive strength variation with the plastic percentage.
| G20 concrete Average Compressive Strength (MPa) 28 days |
|---|
| 0% |
5% |
10% |
15% |
20% |
30% |
| 29.14 |
25.06 |
22.34 |
19.46 |
15.94 |
13.29 |
Table 3.
Average 28 days flexural strength variation with the plastic percentage.
Table 3.
Average 28 days flexural strength variation with the plastic percentage.
| G20 Concrete Average Flexural Strength (MPa) |
|---|
| 0% |
5% |
10% |
20% |
30% |
| 5.89 |
5.02 |
4.30 |
3.79 |
2.95 |
Table 4.
Average 28 days flexural strength variation with the plastic percentage.
Table 4.
Average 28 days flexural strength variation with the plastic percentage.
| G20 Concrete Average Tensile Strength (MPa) |
|---|
| 0% |
5% |
10% |
20% |
30% |
| 3.72 |
3.47 |
3.15 |
2.82 |
2.52 |
Table 5.
Average 28 days compressive strength variation with the tyre % on G30 concrete.
Table 5.
Average 28 days compressive strength variation with the tyre % on G30 concrete.
| G30 concrete Average Compressive Strength (MPa) 28 days |
|---|
| 0% |
5% |
10% |
15% |
20% |
30% |
| 40.36 |
35.67 |
30.17 |
26.66 |
24.48 |
21.66 |
Table 6.
Average 28 days flexural strength variation with the tyre % on G30 concrete.
Table 6.
Average 28 days flexural strength variation with the tyre % on G30 concrete.
| G30 Concrete flexural Strength (Mpa) |
|---|
| 0% |
5% |
10% |
20% |
30% |
| 6.72 |
6.23 |
5.64 |
4.90 |
4.18 |
Table 7.
Average 28 days tensile strength variation with the tyre % on G30 concrete.
Table 7.
Average 28 days tensile strength variation with the tyre % on G30 concrete.
| G30 Concrete Tensile Strength (Mpa) |
|---|
| 0% |
5% |
10% |
20% |
30% |
| 3.26 |
2.88 |
2.62 |
2.49 |
2.27 |
Table 8.
Pearson correlation coefficient values for the Plastic.
Table 8.
Pearson correlation coefficient values for the Plastic.
| Property |
Slump |
Compressive strength |
Flexural strength |
Tensile strength |
| Correlation coefficient (MATLAB) |
0.0274 |
-0.6850 |
-0.4408 |
-0.5020 |
Table 9.
Pearson correlation coefficient values for the Tyre.
Table 9.
Pearson correlation coefficient values for the Tyre.
| Property |
Slump |
Compressive strength |
Flexural strength |
Tensile strength |
| Correlation coefficient (MATLAB) |
-0.0532 |
-0.6955 |
-0.3555 |
-0.4613 |
Table 10.
Life cycle assessment impact category evaluation of plastic concrete mixes.
Table 10.
Life cycle assessment impact category evaluation of plastic concrete mixes.
| Percentage /LCA Parameter |
Global warming (kg CO2 eq) |
Ozone layer depletion (kg CFC-11 eq) |
Terrestrial ecotoxicity (kg 1,4-DB eq) |
Acidification (kg SO2 eq) |
| 0% |
311.75 |
0.0000058 |
0.144 |
0.62 |
| 5% |
22.45 |
0.0000041 |
0.0395 |
0.124 |
| 10% |
84.6 |
0.000000092 |
0.042 |
0.112 |
| 15% |
372.98 |
0.00000417 |
0.075 |
0.693 |
| 20% |
374.46 |
0.00000139 |
0.133 |
1.58 |
| 30% |
499.4 |
0.00000433 |
0.24 |
0.745 |
Table 11.
Life cycle assessment impact category evaluation of tyre concrete.
Table 11.
Life cycle assessment impact category evaluation of tyre concrete.
| Percentage /LCA Parameter |
Global warming (kg CO2 eq) |
Ozone layer depletion (kg CFC-11 eq) |
Acidification (kg SO2 eq) |
| 0% |
322.56 |
0.0000058 |
0.62 |
| 5% |
405.5 |
0.0000041 |
0.124 |
| 10% |
409.76 |
0.00000046 |
0.557 |
| 15% |
374.45 |
0.00000031 |
0.612 |
| 20% |
439.9 |
0.00000028 |
0.742 |
| 30% |
532.75 |
0.00000255 |
0.7 |
|
Disclaimer/Publisher’s Note: The statements, opinions and data contained in all publications are solely those of the individual author(s) and contributor(s) and not of MDPI and/or the editor(s). MDPI and/or the editor(s) disclaim responsibility for any injury to people or property resulting from any ideas, methods, instructions or products referred to in the content. |
© 2024 by the authors. Licensee MDPI, Basel, Switzerland. This article is an open access article distributed under the terms and conditions of the Creative Commons Attribution (CC BY) license (http://creativecommons.org/licenses/by/4.0/).
