1. Introduction
The growing demand for environmentally friendly and accessible power solutions is driven by concerns over greenhouse gas emissions and pollution from thermal power plants and nuclear facilities. The development of a high-performing, reliable, and affordable battery charger for electric vehicles (EVs) is a top priority, requiring an AC-DC converter to meet system requirements. The pursuit of eco-friendly energy solutions, particularly in EVs, is largely driven by advanced technologies like AC-DC converters. he study presents a DC-DC converter with a customized PI controller, designed to achieve target output voltage and high current density, reducing overshoot in a lithium-ion battery setup.
The primary objective is to reduce the charging time significantly [
1]. The research presents a dual-directional DC-DC converter with a high amplification factor, ideal for integrating energy storage units with electric cars, using minimal components and duty cycle functions. [
2].This study proposes a novel configuration for DC-DC converters that are not isolated, utilizing voltage boost technique principles for high gain and low voltage applications [
3]. The study explores an experimental hybrid micro grid system, combining renewable energy sources like Wind Generator, Solar Array, Fuel Cell, and Energy Storage System with a battery for remote areas [
4]. The paper introduces a novel bidirectional switched Z-source DC-DC converter that effectively boosts voltage using a switched-capacitor methodology and inductors.
It also offers There is a broad spectrum of duty cycles available in both boost and buck modes, resulting in a substantial voltage conversion ratio [
5].The paper proposes various topologies of DC/DC converters, enhancing the efficiency and range of electric sports cars by adjusting the inverter's input voltage to various torque/speed conditions and utilizing Instead of utilizing SVPWM, synchronous modulation methods are employed within the WLTC [
6].This study explores resonant converter configurations, operational modes, modeling, control strategies, and unique design considerations, focusing on current topologies and control methods to create novel converter configurations and approaches[
7]. The research introduces a non-isolated multi-port power converter for electric vehicles, enabling the integration of various energy sources, improving load power allocation, and enhancing energy efficiency [
8]. The article examines the operation of a resonant tank power converter in electric vehicle applications, highlighting zero-voltage switching as a crucial technique for improving efficiency and reducing switching losses [
9]. This study investigates three-phase bidirectional/DC converters and DC/DC isolated full bridge converters, focusing on unity power factor control and dual active power control for EV battery charging and discharging.
[
10]. In this study of ACL type isolated dc-dc converters for safety and reliability in energy conversion applications is extensive, but their dynamic equivalence remains unsystematically understood.
[
11].Renewable energy sources, primarily solar and wind power, are being utilized for power generation and installed in electrical systems [
12]. Dynamic power management structures are widely used to integrate renewable energy sources and energy storage systems into DC buses.
. [
13,
14]. Research papers have extensively explored the energy management system (EMS) in various applications of hybrid PV-BAT systems, including electric vehicles, charging stations, electricity, and smart microgrids [
15]. Research papers explore energy management systems (EMS) in hybrid PV-BAT systems, comparing power management strategies and architectures for electric vehicles, charging stations, electricity, and smart micro grids.
[
16,
17]
. The study proposes various power management techniques for hybrid PV-BAT systems in off-grid residential households.
. [
18,
19]. Researchers propose the utilization of multiple sophisticated control techniques in order to meet various objectives within the realm of Energy Management Systems (EMSs). The development of EMSs involves the incorporation of a wide range of fields, such as linear and nonlinear algorithms. [20-22]. Recent research has proposed several control strategies for voltage, frequency regulation, and power management, including PI/PID linear controllers, fuzzy logic controllers (FLC), and artificial neural network controllers. [
23]. Comparative studies on online EMS will evaluate passive controllers and finite-state machine controllers, focusing on optimizing fuzzy control algorithm's superior functionality in hybrid power systems [
24].
The study proposes a fuzzy-tuned dynamic PI controller to regulate the high power content of the flywheel and supercapacitor using integrated state variables [
25].
This research paper investigates energy management in a DC microgrid, focusing on controlling limits and managing energy saturation. It examines distributing power loads based on ratings, regenerative braking, and regulating DC bus voltage to ensure power load fulfillment [
26].
The study introduces a novel PV-BAT system using adaptive CNN-based control and EMS, suitable for various industrial sectors; especially DC micro grids. The new EMS framework enhances supervisory control for power management, enhancing efficiency, security, and system performance by integrating control system constraints to improve energy balance.
A controller-based CNN with adaptive parameters improves DC bus voltage regulation, addressing system nonlinearities and reducing instability. An anti-windup compensator maintains linear range and optimal battery performance.A basic power flow management system enhances efficiency by minimizing component constraints and utilizing a straightforward structure to manage operations between PV units, BAT units, and loads. The study suggests using MATLAB/Simulink and microcontroller for simulation and experimentation is to ensure reliable energy delivery in unforeseen situations by improving state of charge equilibrium and minimizing direct current bus voltage variations.
3. SPMS
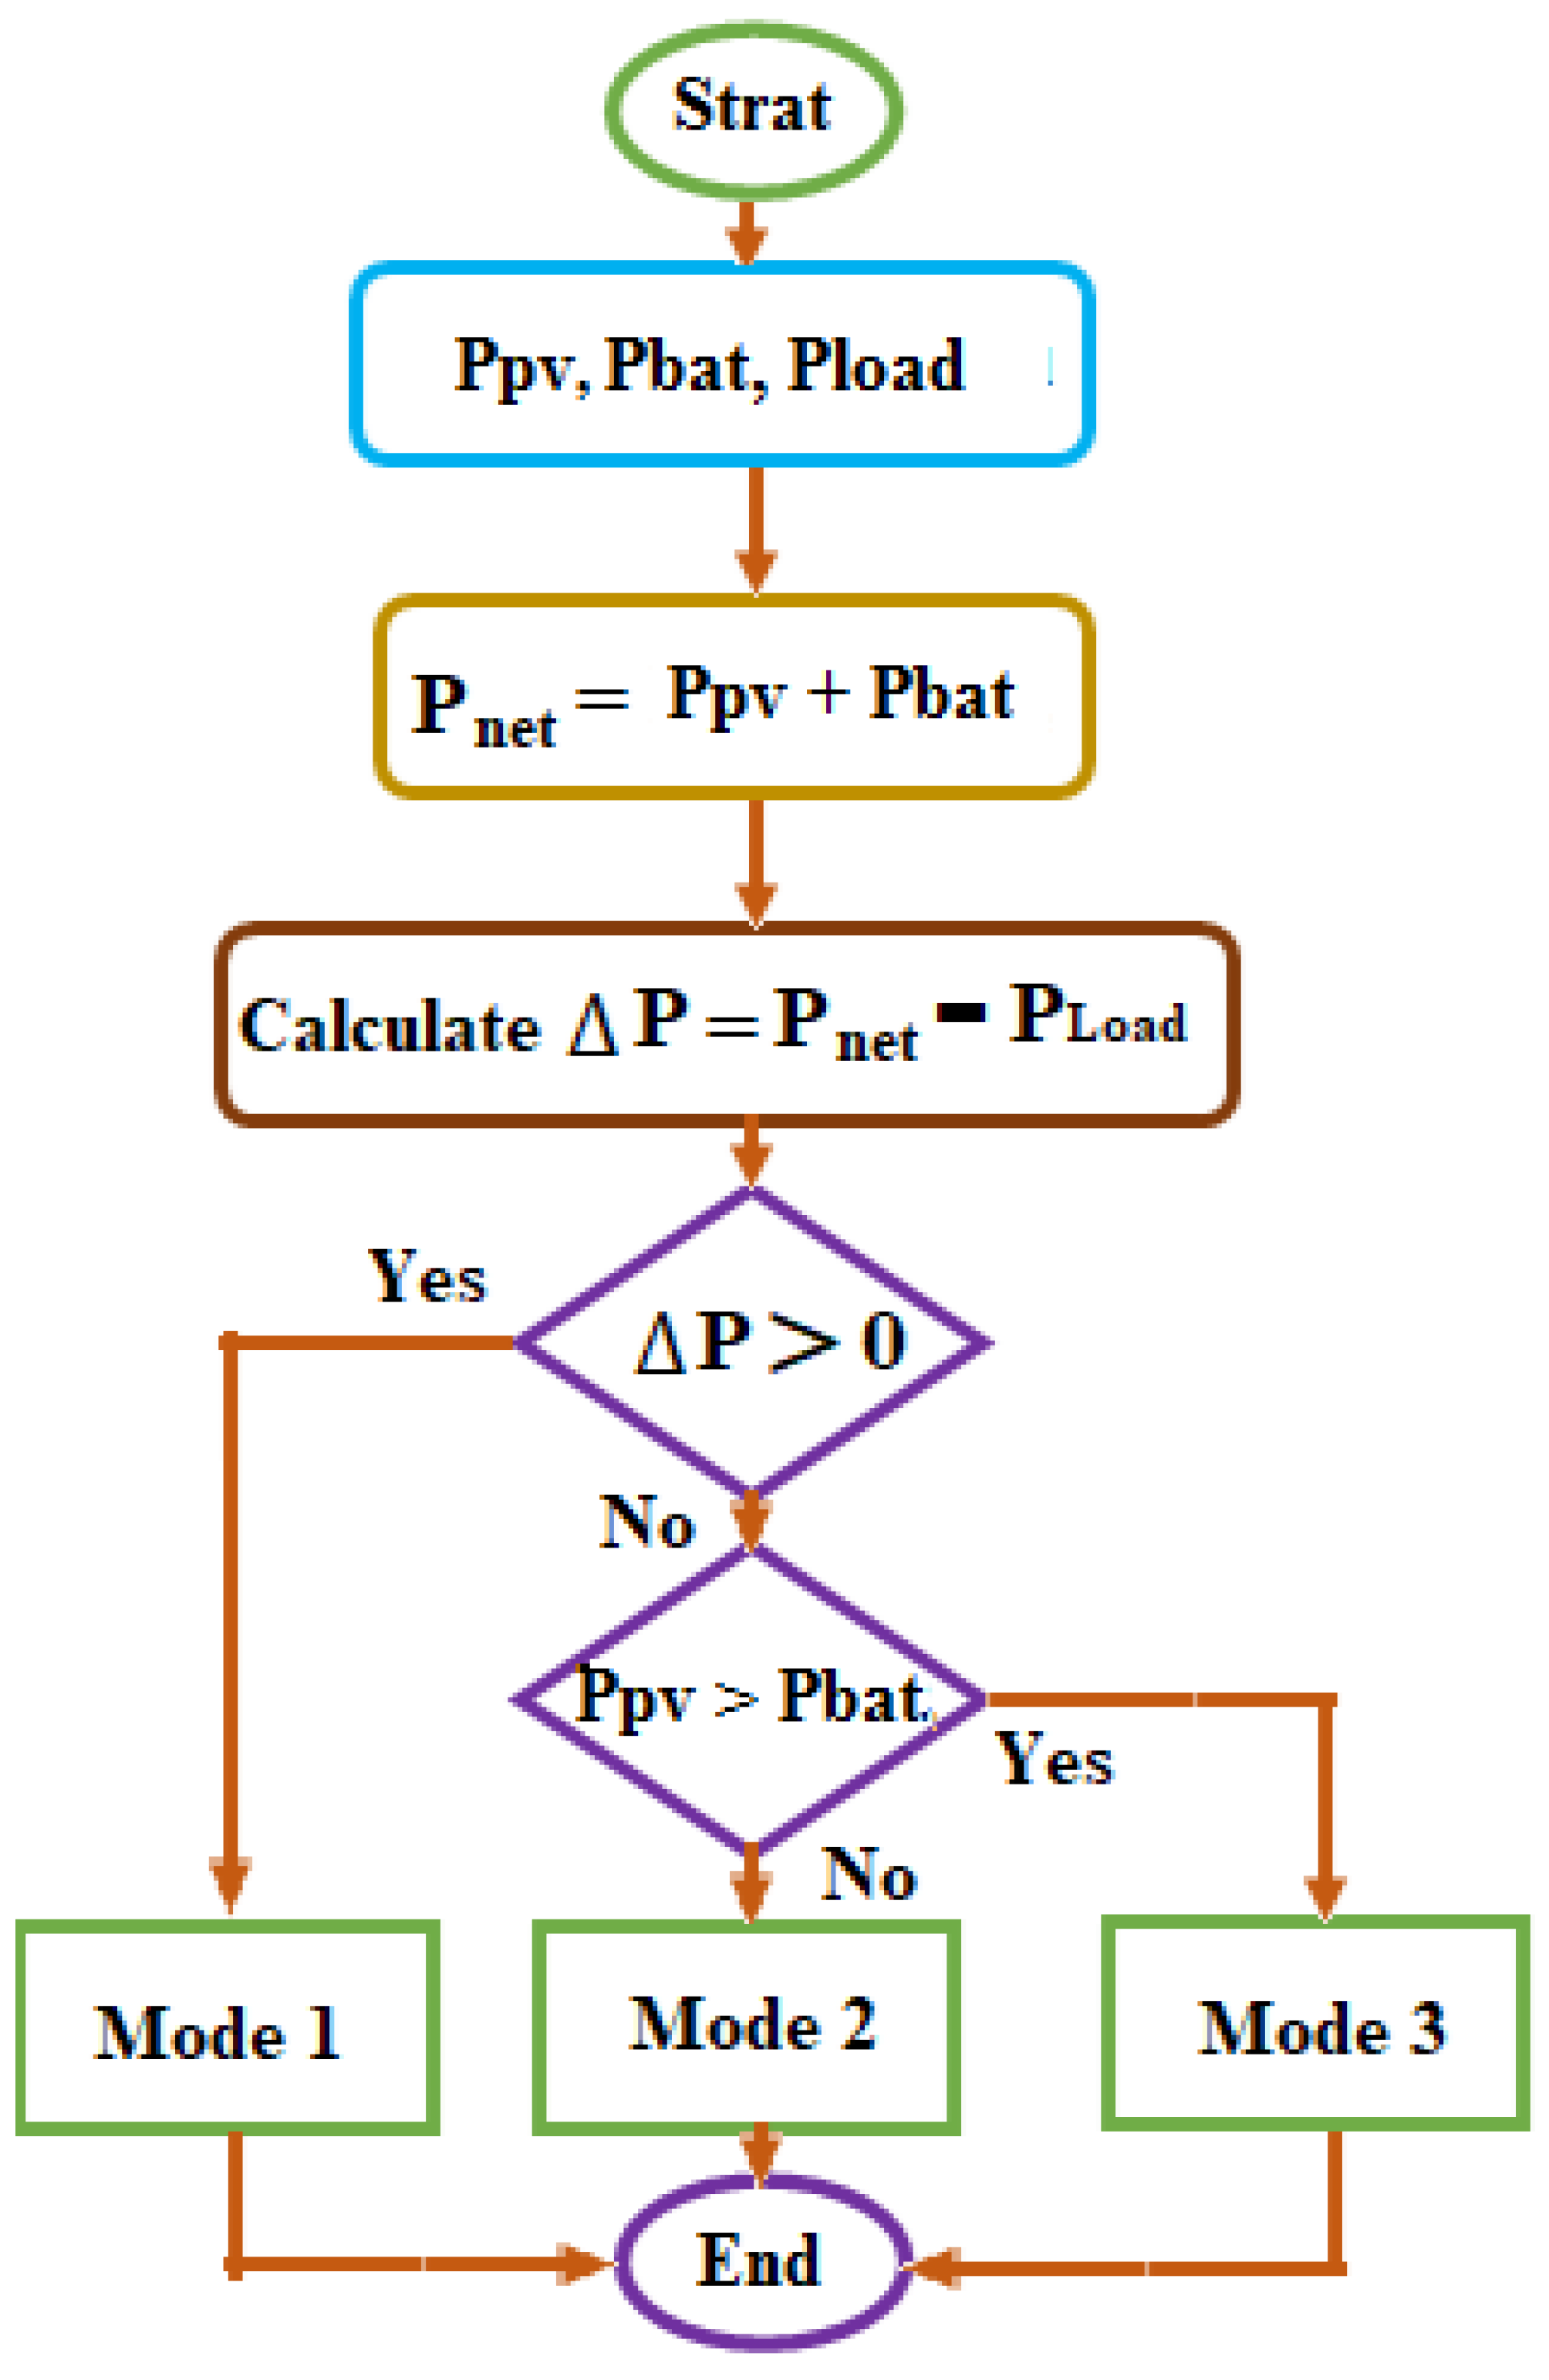
By using simulation block sets for logical switching (ON and OFF), the suggested SPMS controller algorithm is implemented. The controller monitors the Ppv, Battery power and compares it to the power at load(P
load). If the consumption is lower than the Ppv, extra power is delivered to a storage device. The load demands more power from the Battery stack than the PV system can provide.
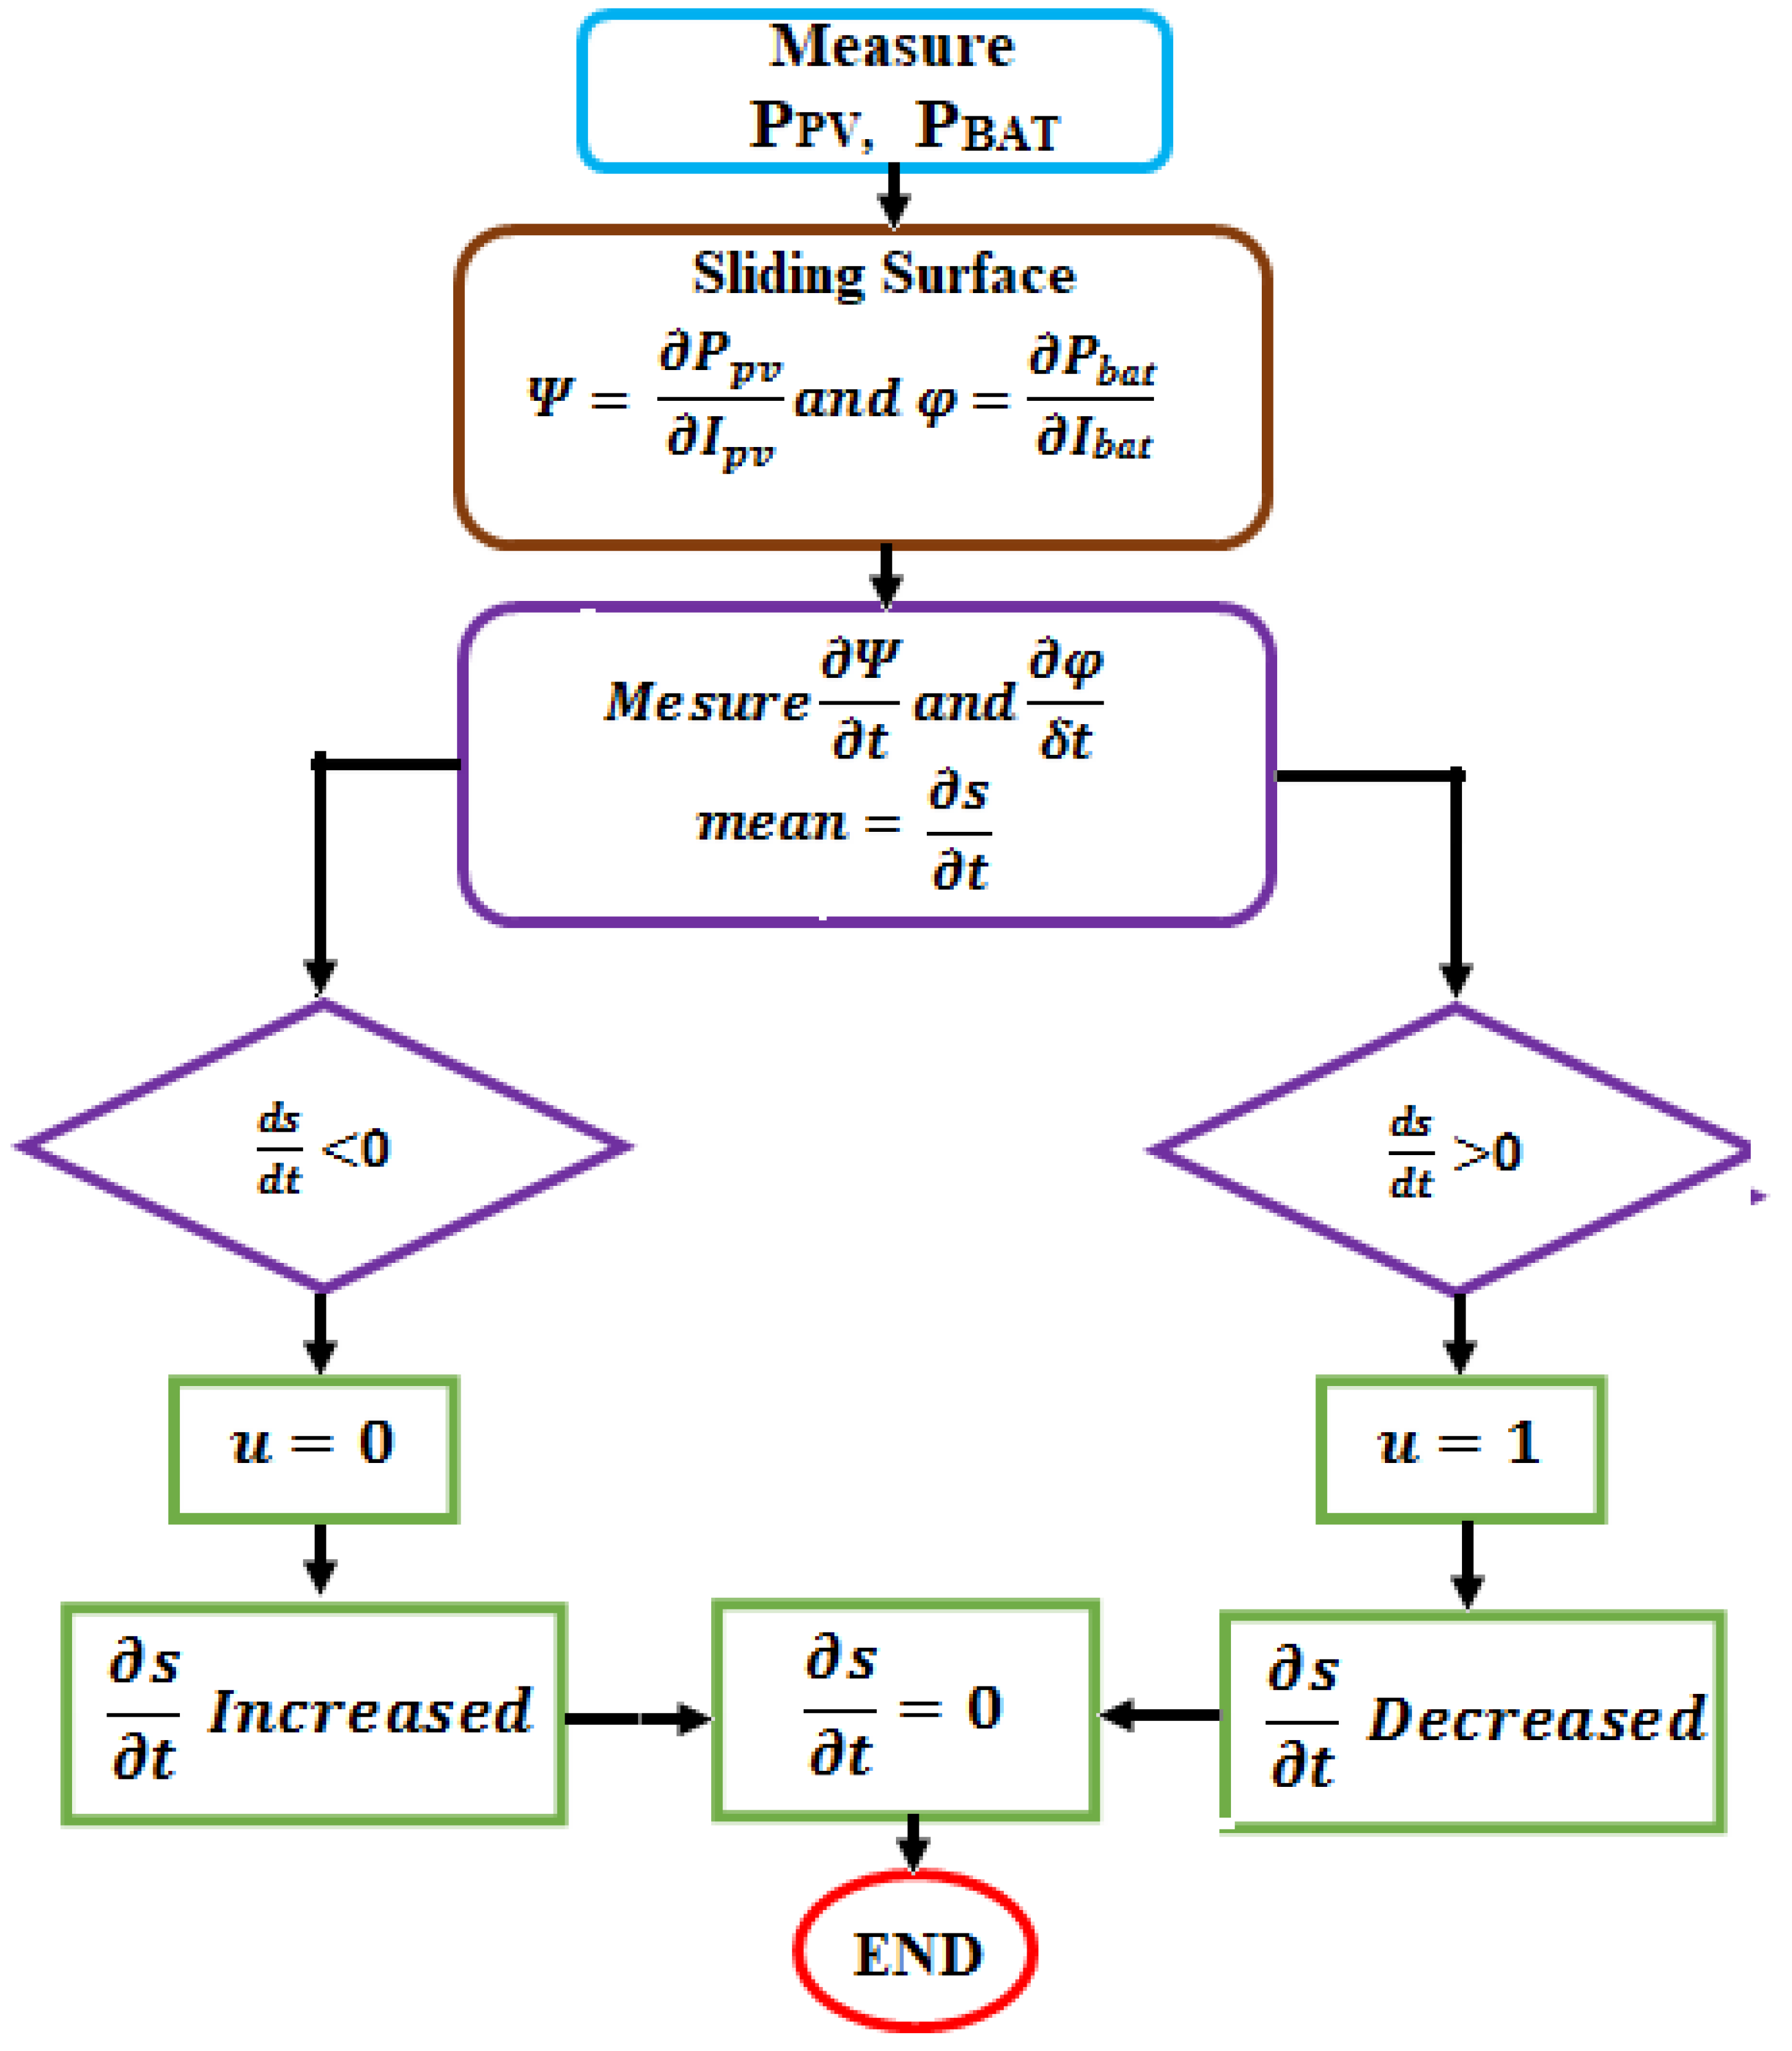
Figure 7 show the switching mechanism for the three separate SMC-CNN system controllers.
Figure 7.
SMC controller.
Figure 7.
SMC controller.
Mode 1: In this scenario, the photovoltaic power generated exceeds the amount required to meet the load demand.
In this particular case, the power generated by the photovoltaic system
falls short
, thus requiring the utilization of fuel cells to fulfill the power requirements. This compensating mode ensures that the power demand is met by combining the power from the photovoltaic system and the battery.
Mode 2: This mode is active when the PV generator supplies the energy
so battery added to
tosupply the load
Mode 3:In this case
hence the battery added to P
pv to supply the load
3.1. SMC Control
The sliding mode control technique is a nonlinear control strategy used to create robust controllers for complex, high-order, nonlinear dynamic systems in uncertain environments. One of the key elements of sliding mode control is the establishment of a sliding surface within the state space of the system. The procedure involves selecting a control law to guide the system towards a specific surface, and incorporating appropriate switching logic to maintain proximity.
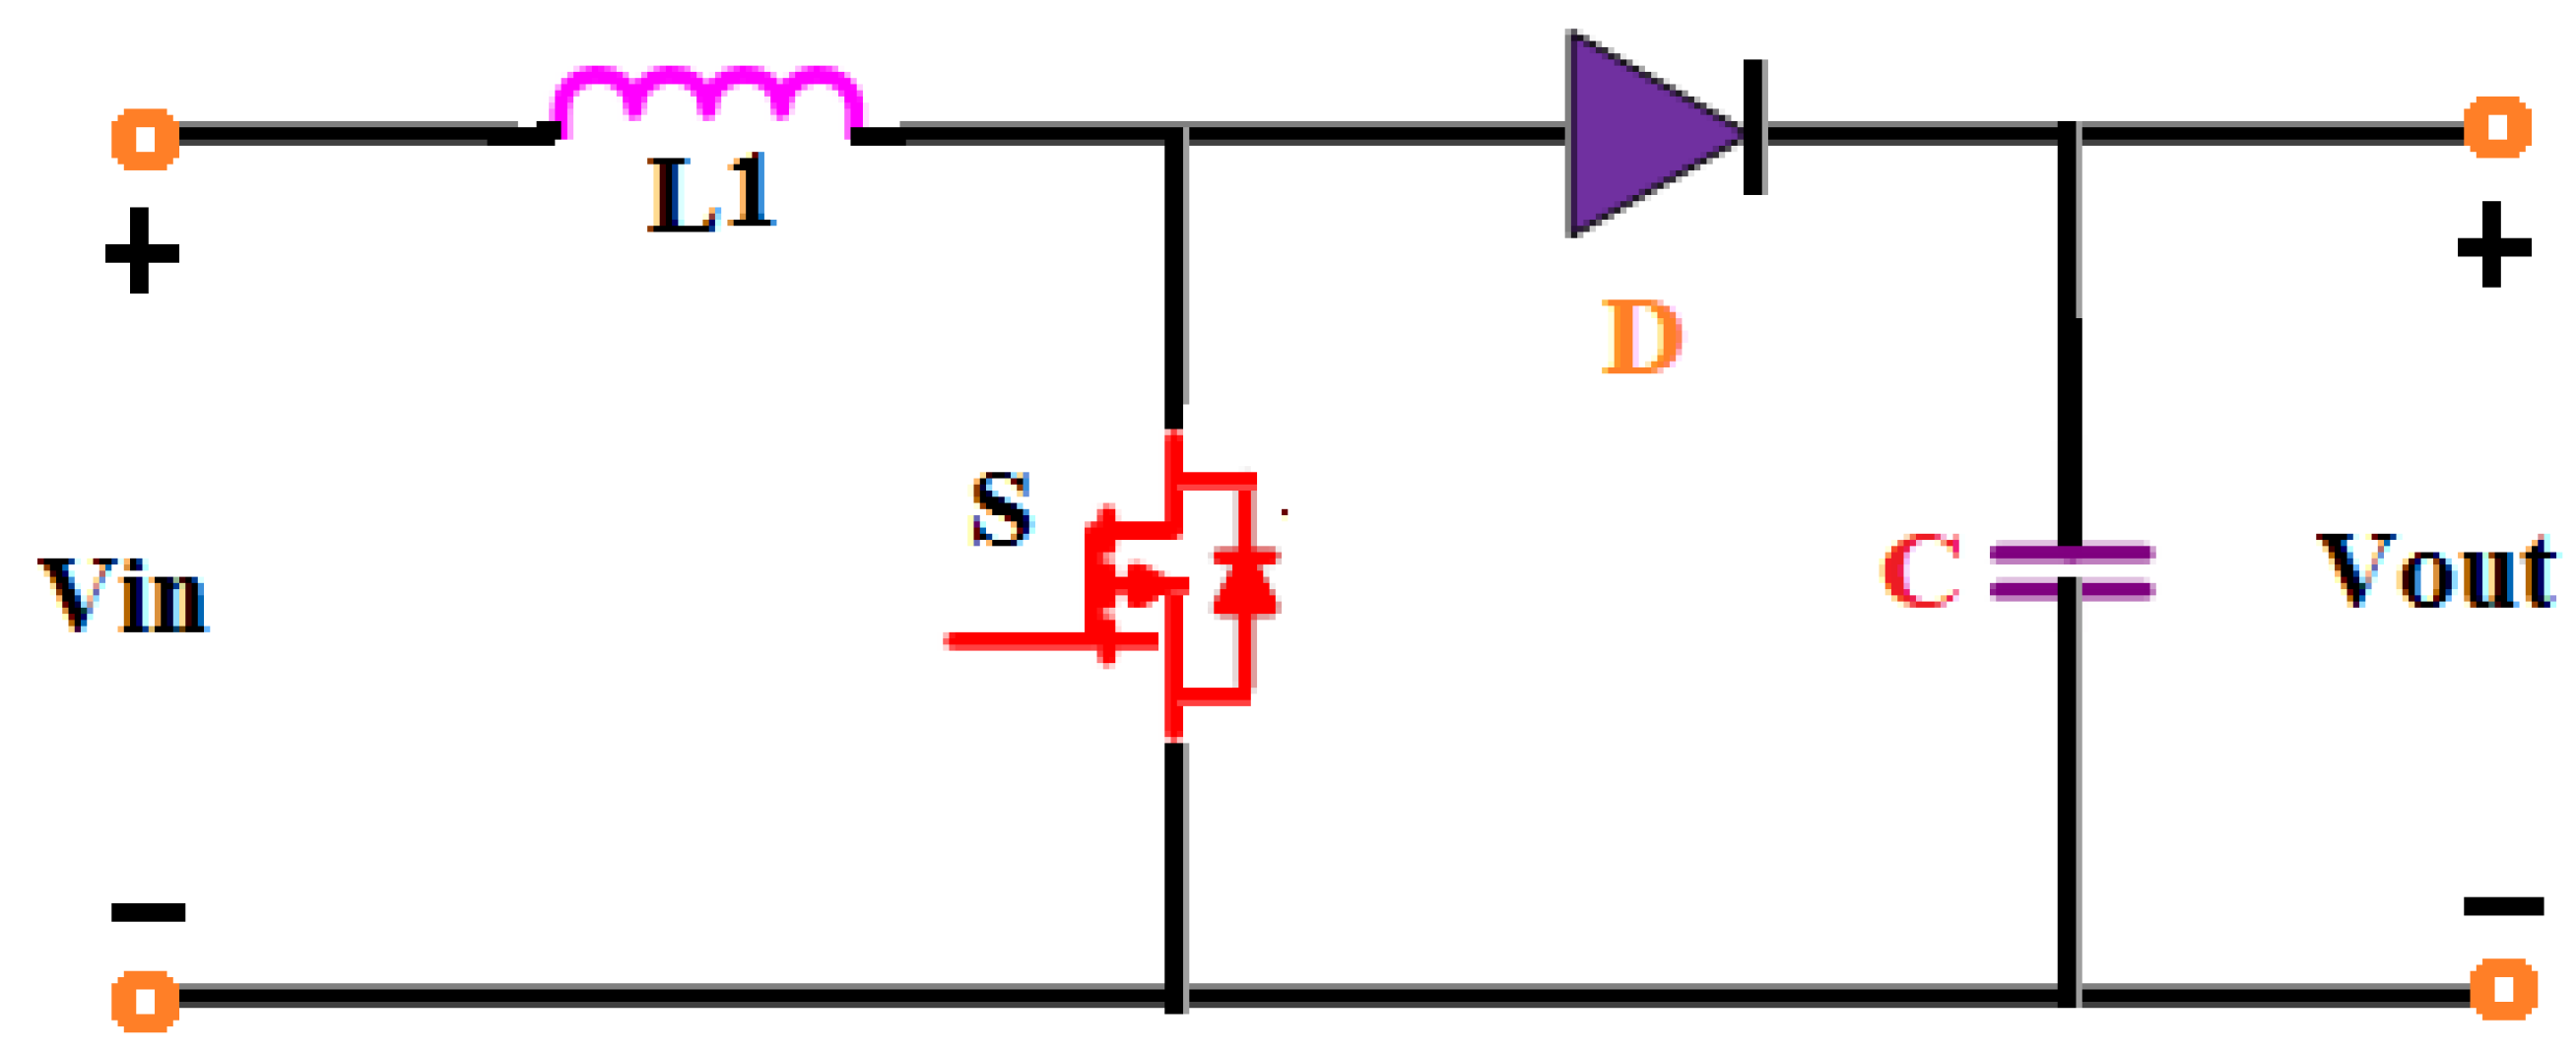
The utilization of the Sliding Mode Control (SMC) technique in conjunction with the Photovoltaic (PV) system is demonstrated in this study. The dynamic response of the DC/DC boost converter is influenced by the signal (u), which allows the SMC method to exert control over the switch of the boost converter transistor. The model provided accurately captures the behavior of the system.
Where PPV, Pbat, Power Sources of the system.
The PV power
(Ppv) and BAT power
(Pbat) are found as
Based on equation (2), the Sliding surface of the system is presented in equations (3) and (4).
Where sliding surface of PV, wind, SC and grid respectively
The control parameter of the SMC is obtained from equations (1) - (4).
The equation demonstrates that SMC can be represented by a unique duty cycle (d). (5),
The visequivalent control value, calculated using equation (6) as k is the gain constant, therefore,
The duty cycle range fluctuates from 0 to 1, thereby imposing certain limitations.
SMC logic are presented in equation (7),
The SMC controller finds the optimal operating point of the surface and compares with common dc bus voltage and produces the modulation index (MI). After that, the PWM signal employs a comparator to generate a control pulse with operating at a frequency of 3000 kHz and a
3.2. SMC-CNN Control
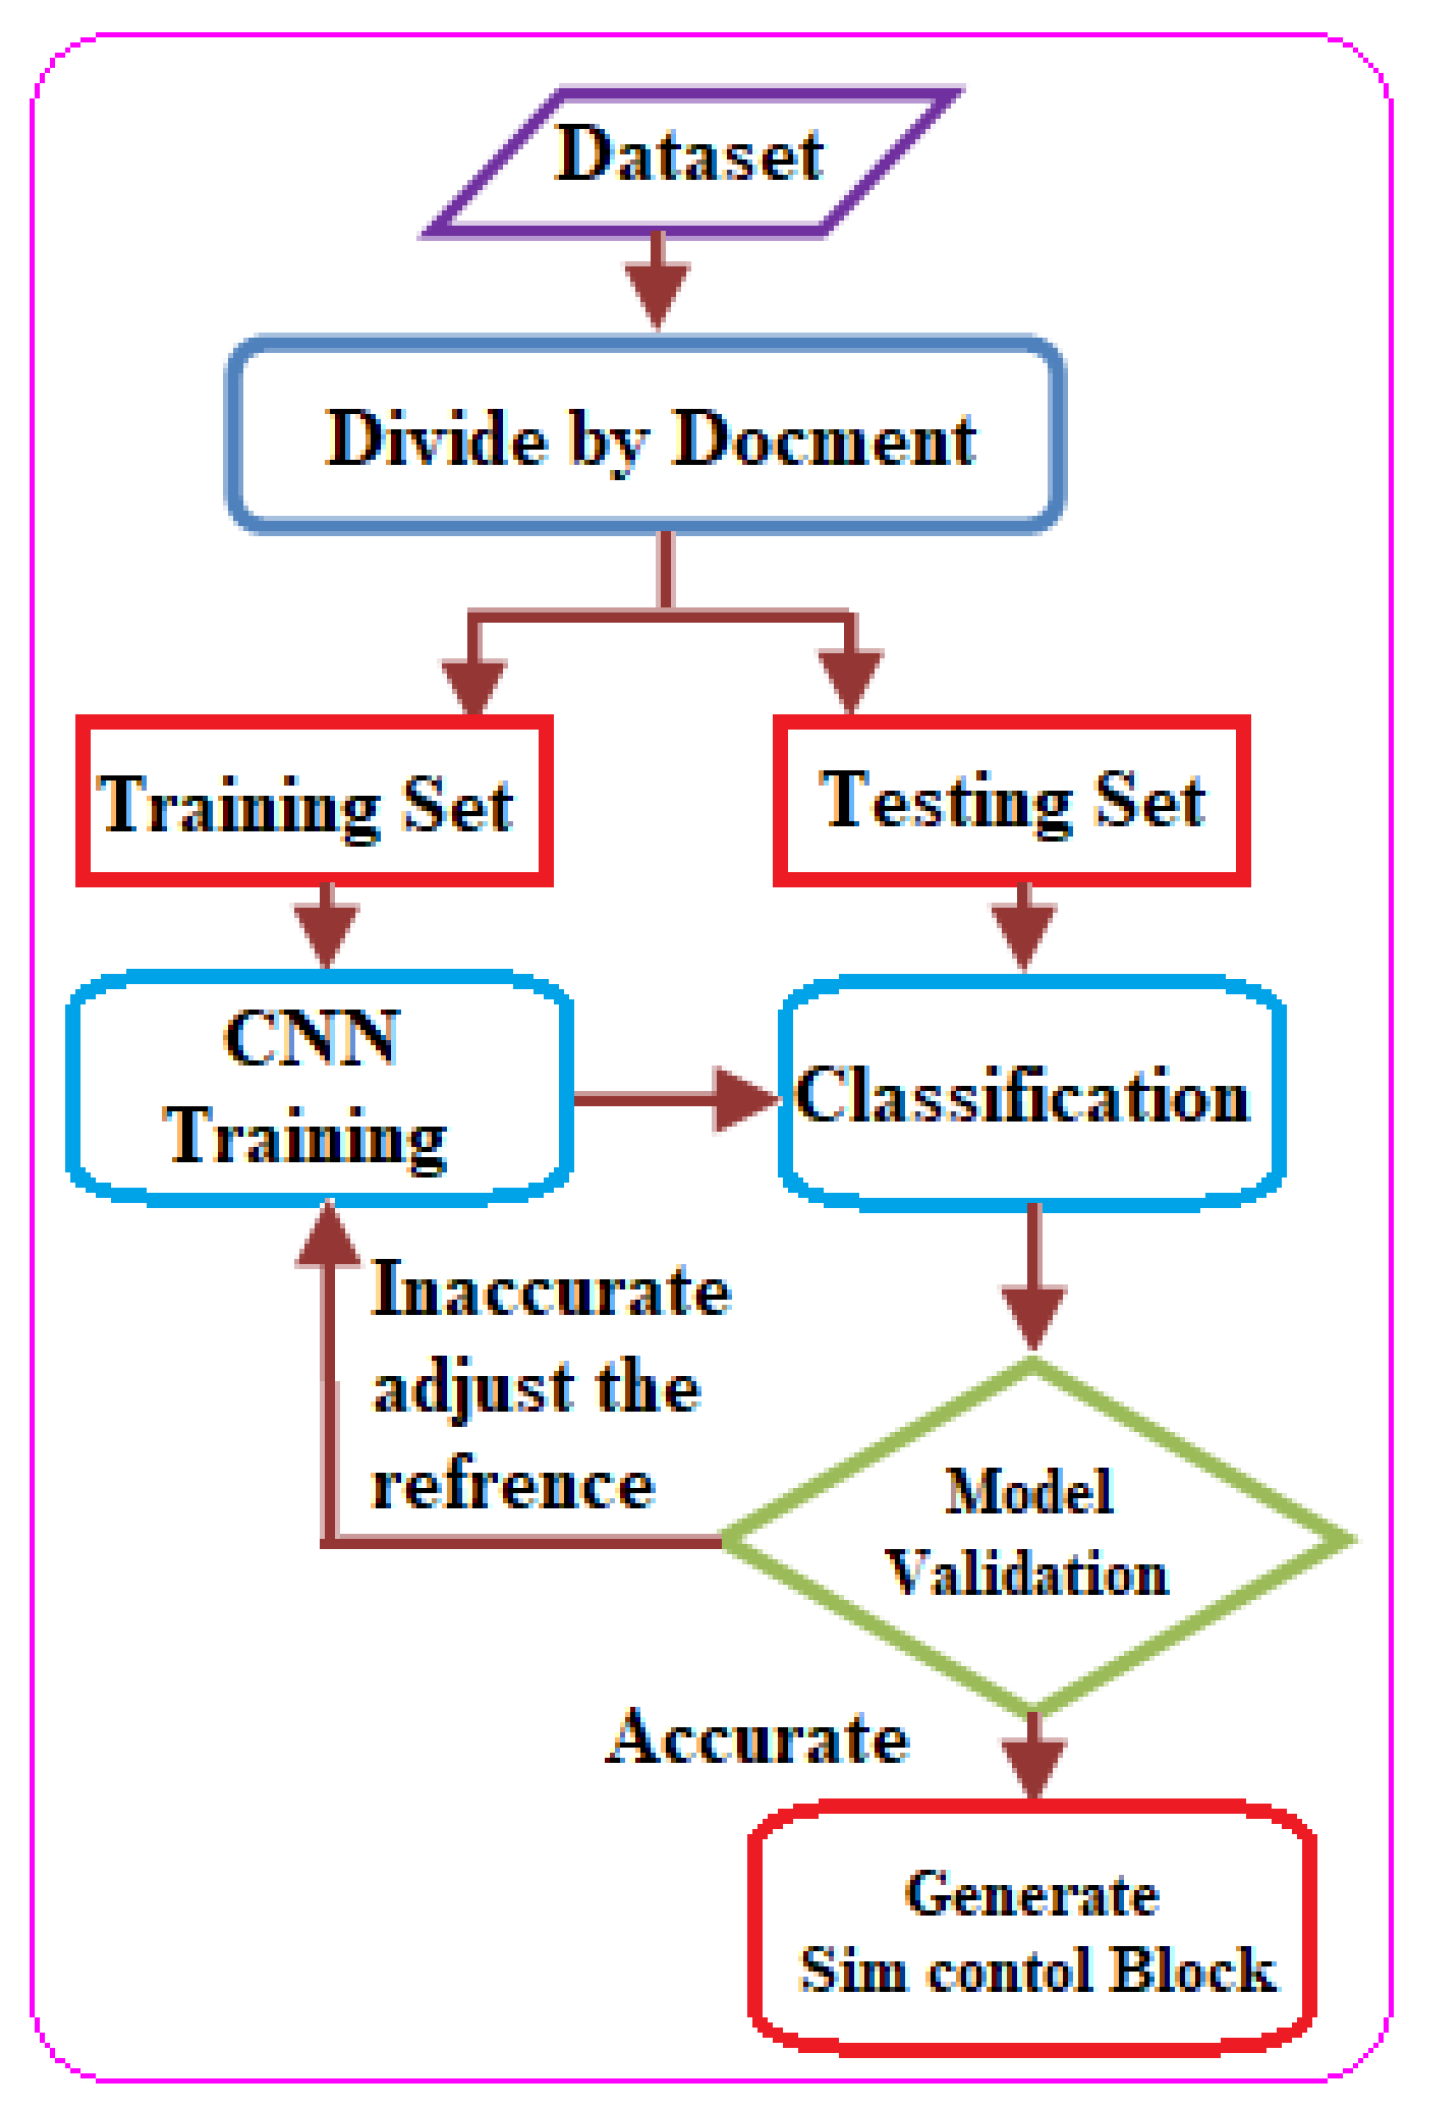
Convolutional Neural Network (CNN) represents a sophisticated form of Artificial Neural Network (ANN) specifically designed to handle time-series dataarchitecture shown in
Figure 9. The CNN architecture comprises three essential layers: The convolution layer, pooling layer, and fully-connected layer each serve distinct roles in a convolution neural network. Specifically, the convolution layer is designed to capture local features within the input data, while the pooling layer works to reduce the dimensionality of the input data.
Figure 8.
Architecture ofCNN.
Figure 8.
Architecture ofCNN.
Figure 9.
CNN Functional flow chart.
Figure 9.
CNN Functional flow chart.
The prediction of outputs is accomplished by utilizing the extracted features in the fully-connected layer. The convolution, which refers to the processing of the extracted local spatial variables and their connections with the input variables, can be represented by the following equation:
The inputs for the CNN are denoted by x.;
The symbol Ci represents the local feature corresponding to the ith output of the convolution layer;
- representsconvolution operation;
The current study opts for the nonlinear activation function ReLu to serve as the activation function f (・) within this particular model, with ReLu being mathematically represented as Eq. (23);
The bias matrix is denoted by b, where and denote the bias of the initial weight matrix and convolution kernel of the convolution layer, respectively; represents the total number of convolution kernels.
The database utilized in this study comprises 5000 patterns of PV voltage, PV current, battery voltage, current, SOC, EV drive parameters such as speed and reference voltage variables. This database has been split into two sub-databases, with 70% of the samples allocated for training the CNN, while the remaining 30% are utilized for testing and validating the network.
Figure 10 depicts the operational flow diagram of the CNN.The selected training sets aim to encompass the entire standard input range to achieve optimal performance, with a consistent temperature of 25°C and solar irradiation levels varying between 50 W/m
2 and 1050 W/m
2.
4. Simulation Result
The power management systems based on Matlab/Simulink and Proposed SMC-CNN, illustrated in
Figure 10, have been intricately crafted. PV and BAT systems are integrated with their respective DC-DC power converters within these systems. Furthermore, each unit integrates a DC bus and an electric vehicle (EV) DC Drive, both equipped with advanced control systems. SMC-CNN's power management system monitors PV and BAT power sources, fulfills load demands, and ensures efficiency. Voltage stabilization capacitor smooths voltage fluctuations, reducing bus voltage ripple. The modulation index must be adjusted continuously to maintain stable output voltage in a PV array, particularly during decreased sunlight and input voltage drop.
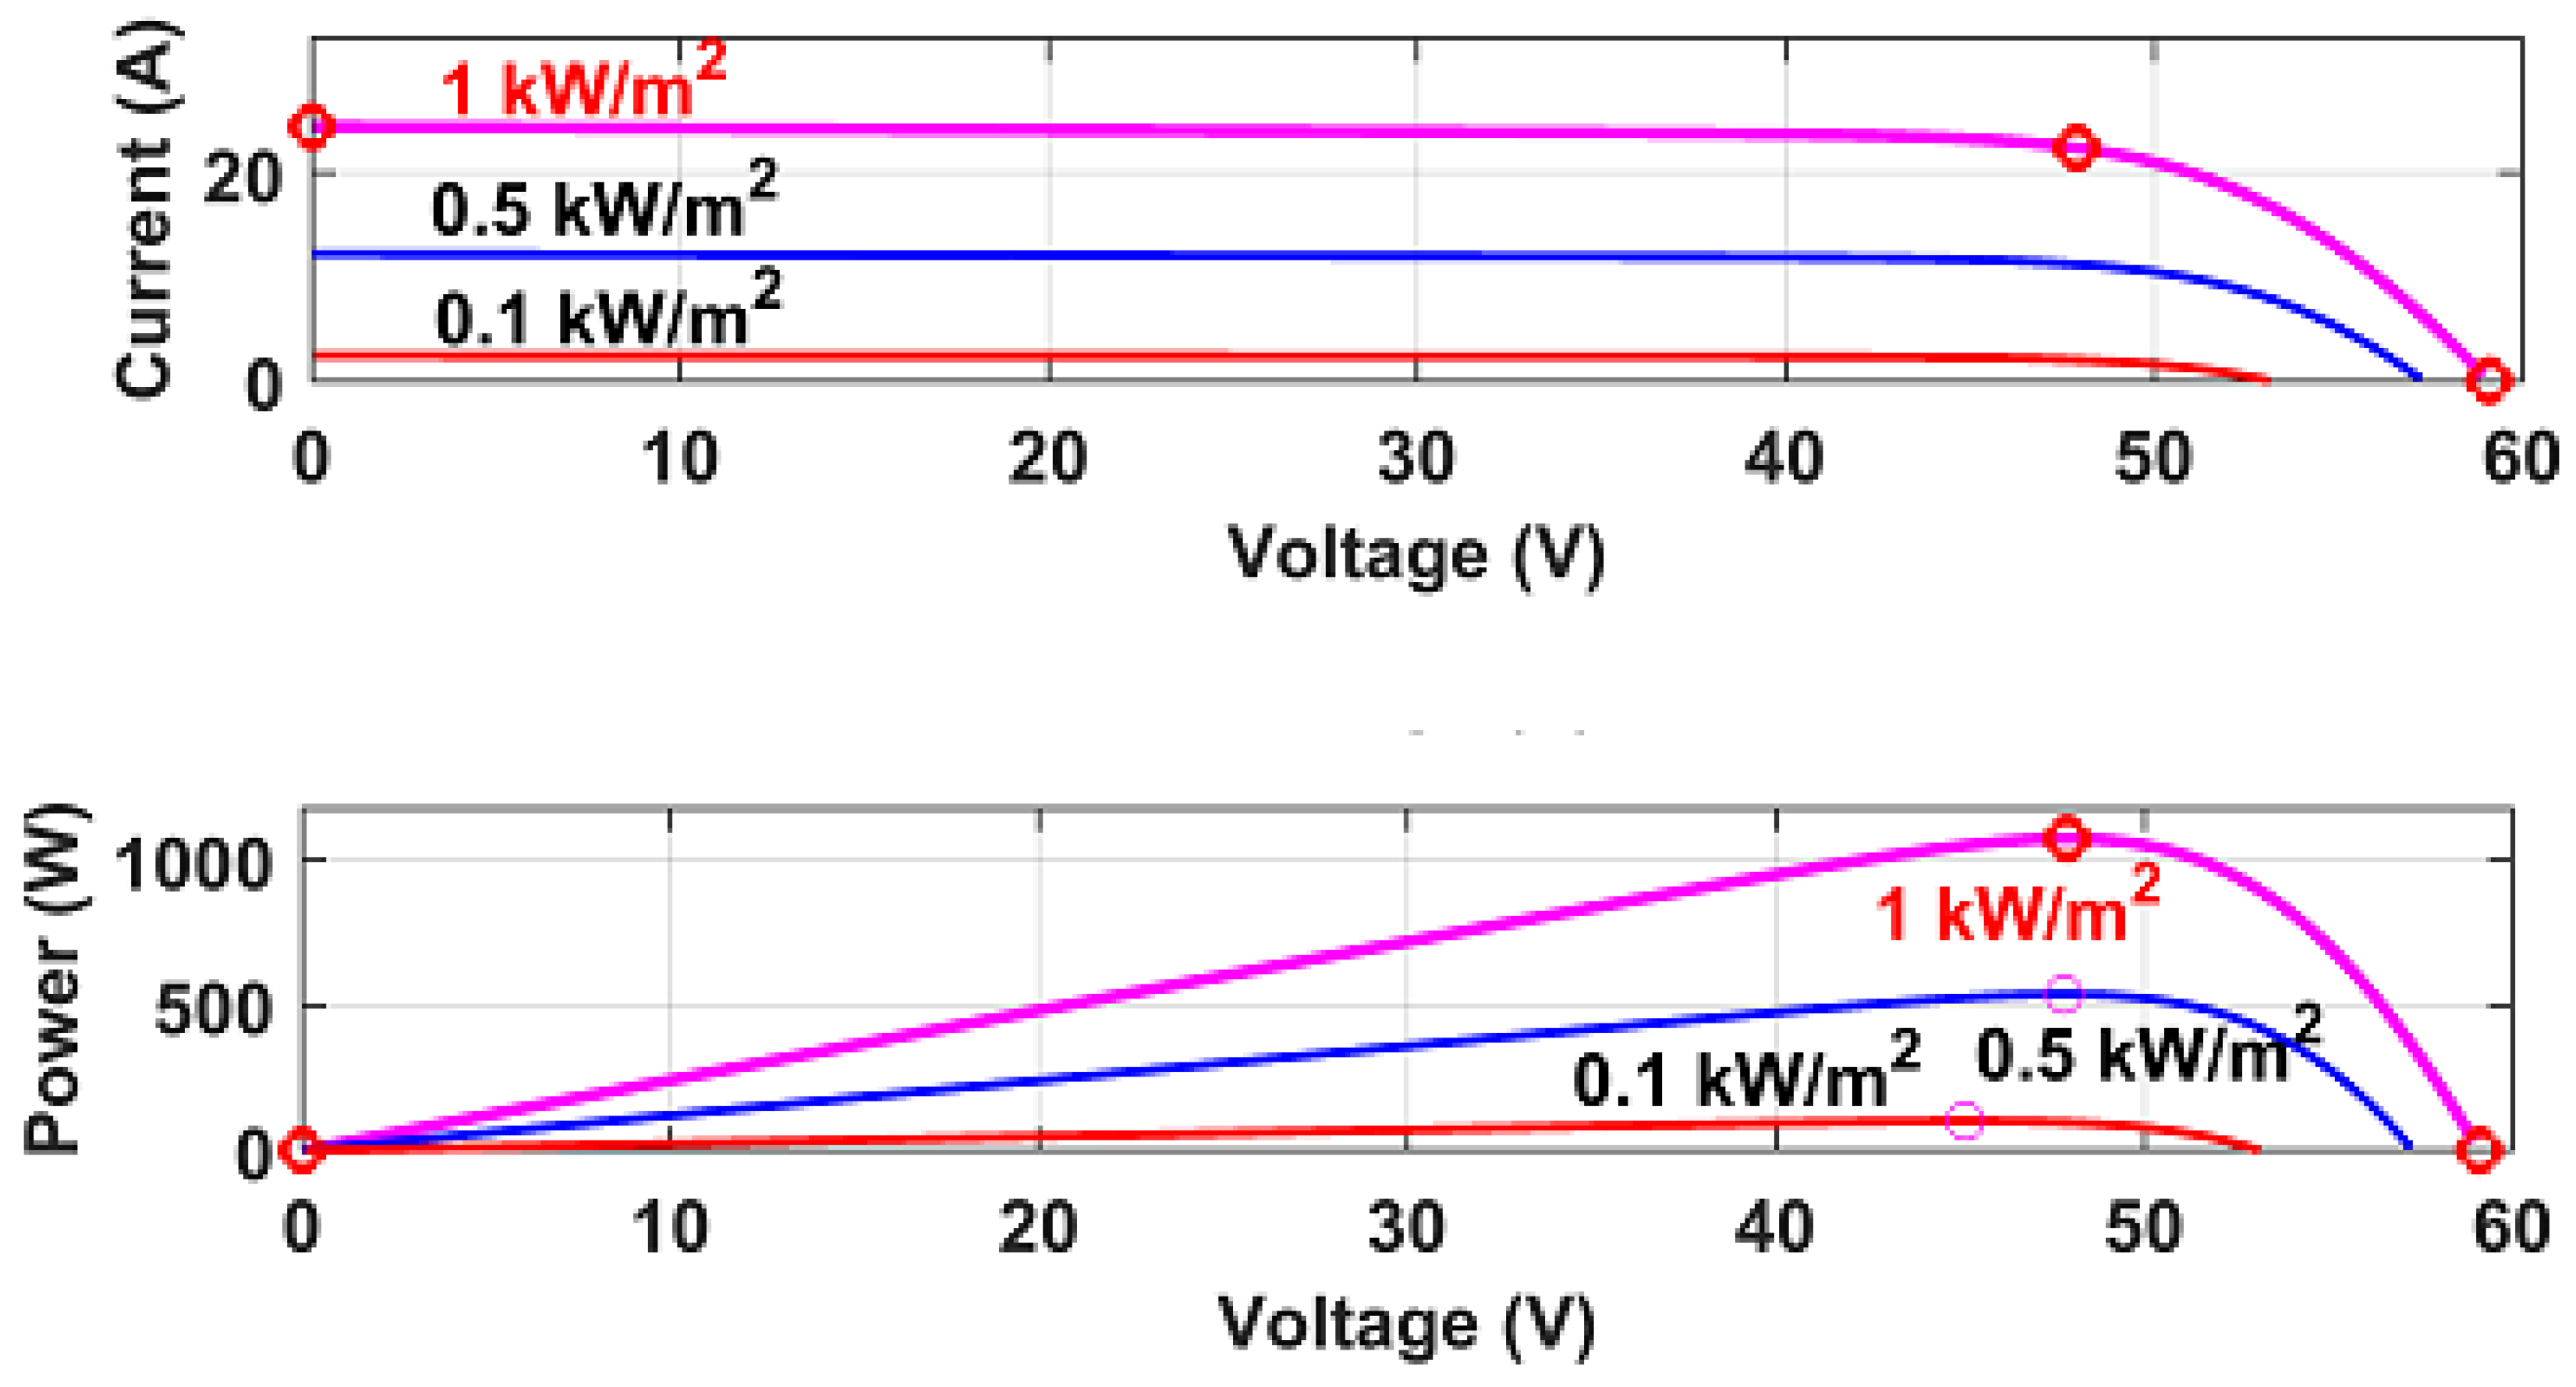
Converter Output Voltage Stability a well-designed PMS controller maintains converter output voltage stability by real-time adjusting modulation index and compensating for non-idealities in converter components. The converter's robust design, low-voltage ripple, and efficient control algorithms demonstrate its ability to handle transients effectively. The DC bus link capacitor is a crucial component in multi-converter systems, acting as a buffer to prevent short-term disturbances, ensuring system stability and performance.In consideration of a specific situation, the solar irradiance fluctuates within a predetermined range, with subsequent adjustments in charge and discharge configurations gradually decreasing to a specified minimum level, as illustrated in
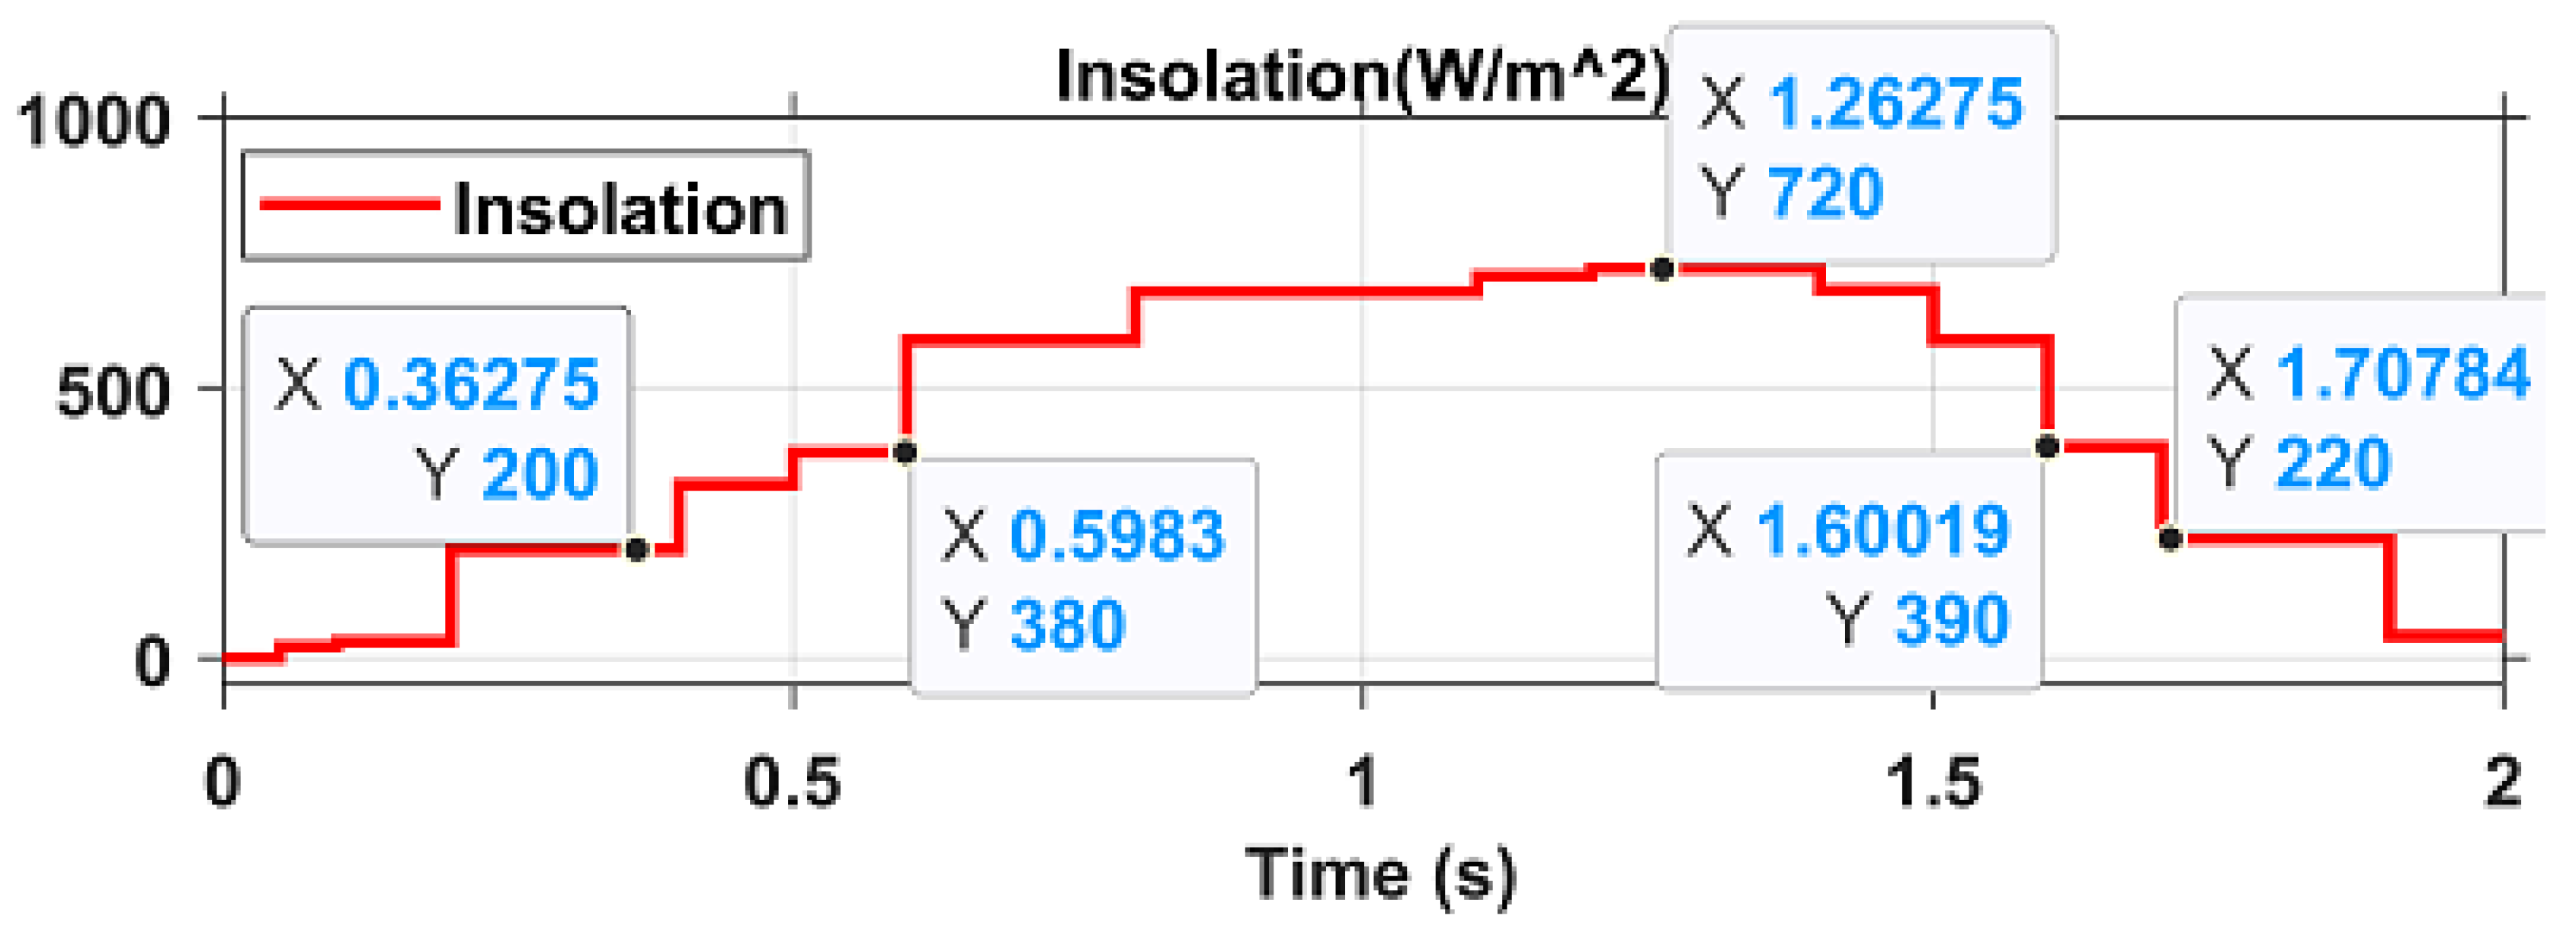
Table 5. In order to replicate a real- time scenario, the progressive alteration in irradiation is visually depicted in
Figure 11.
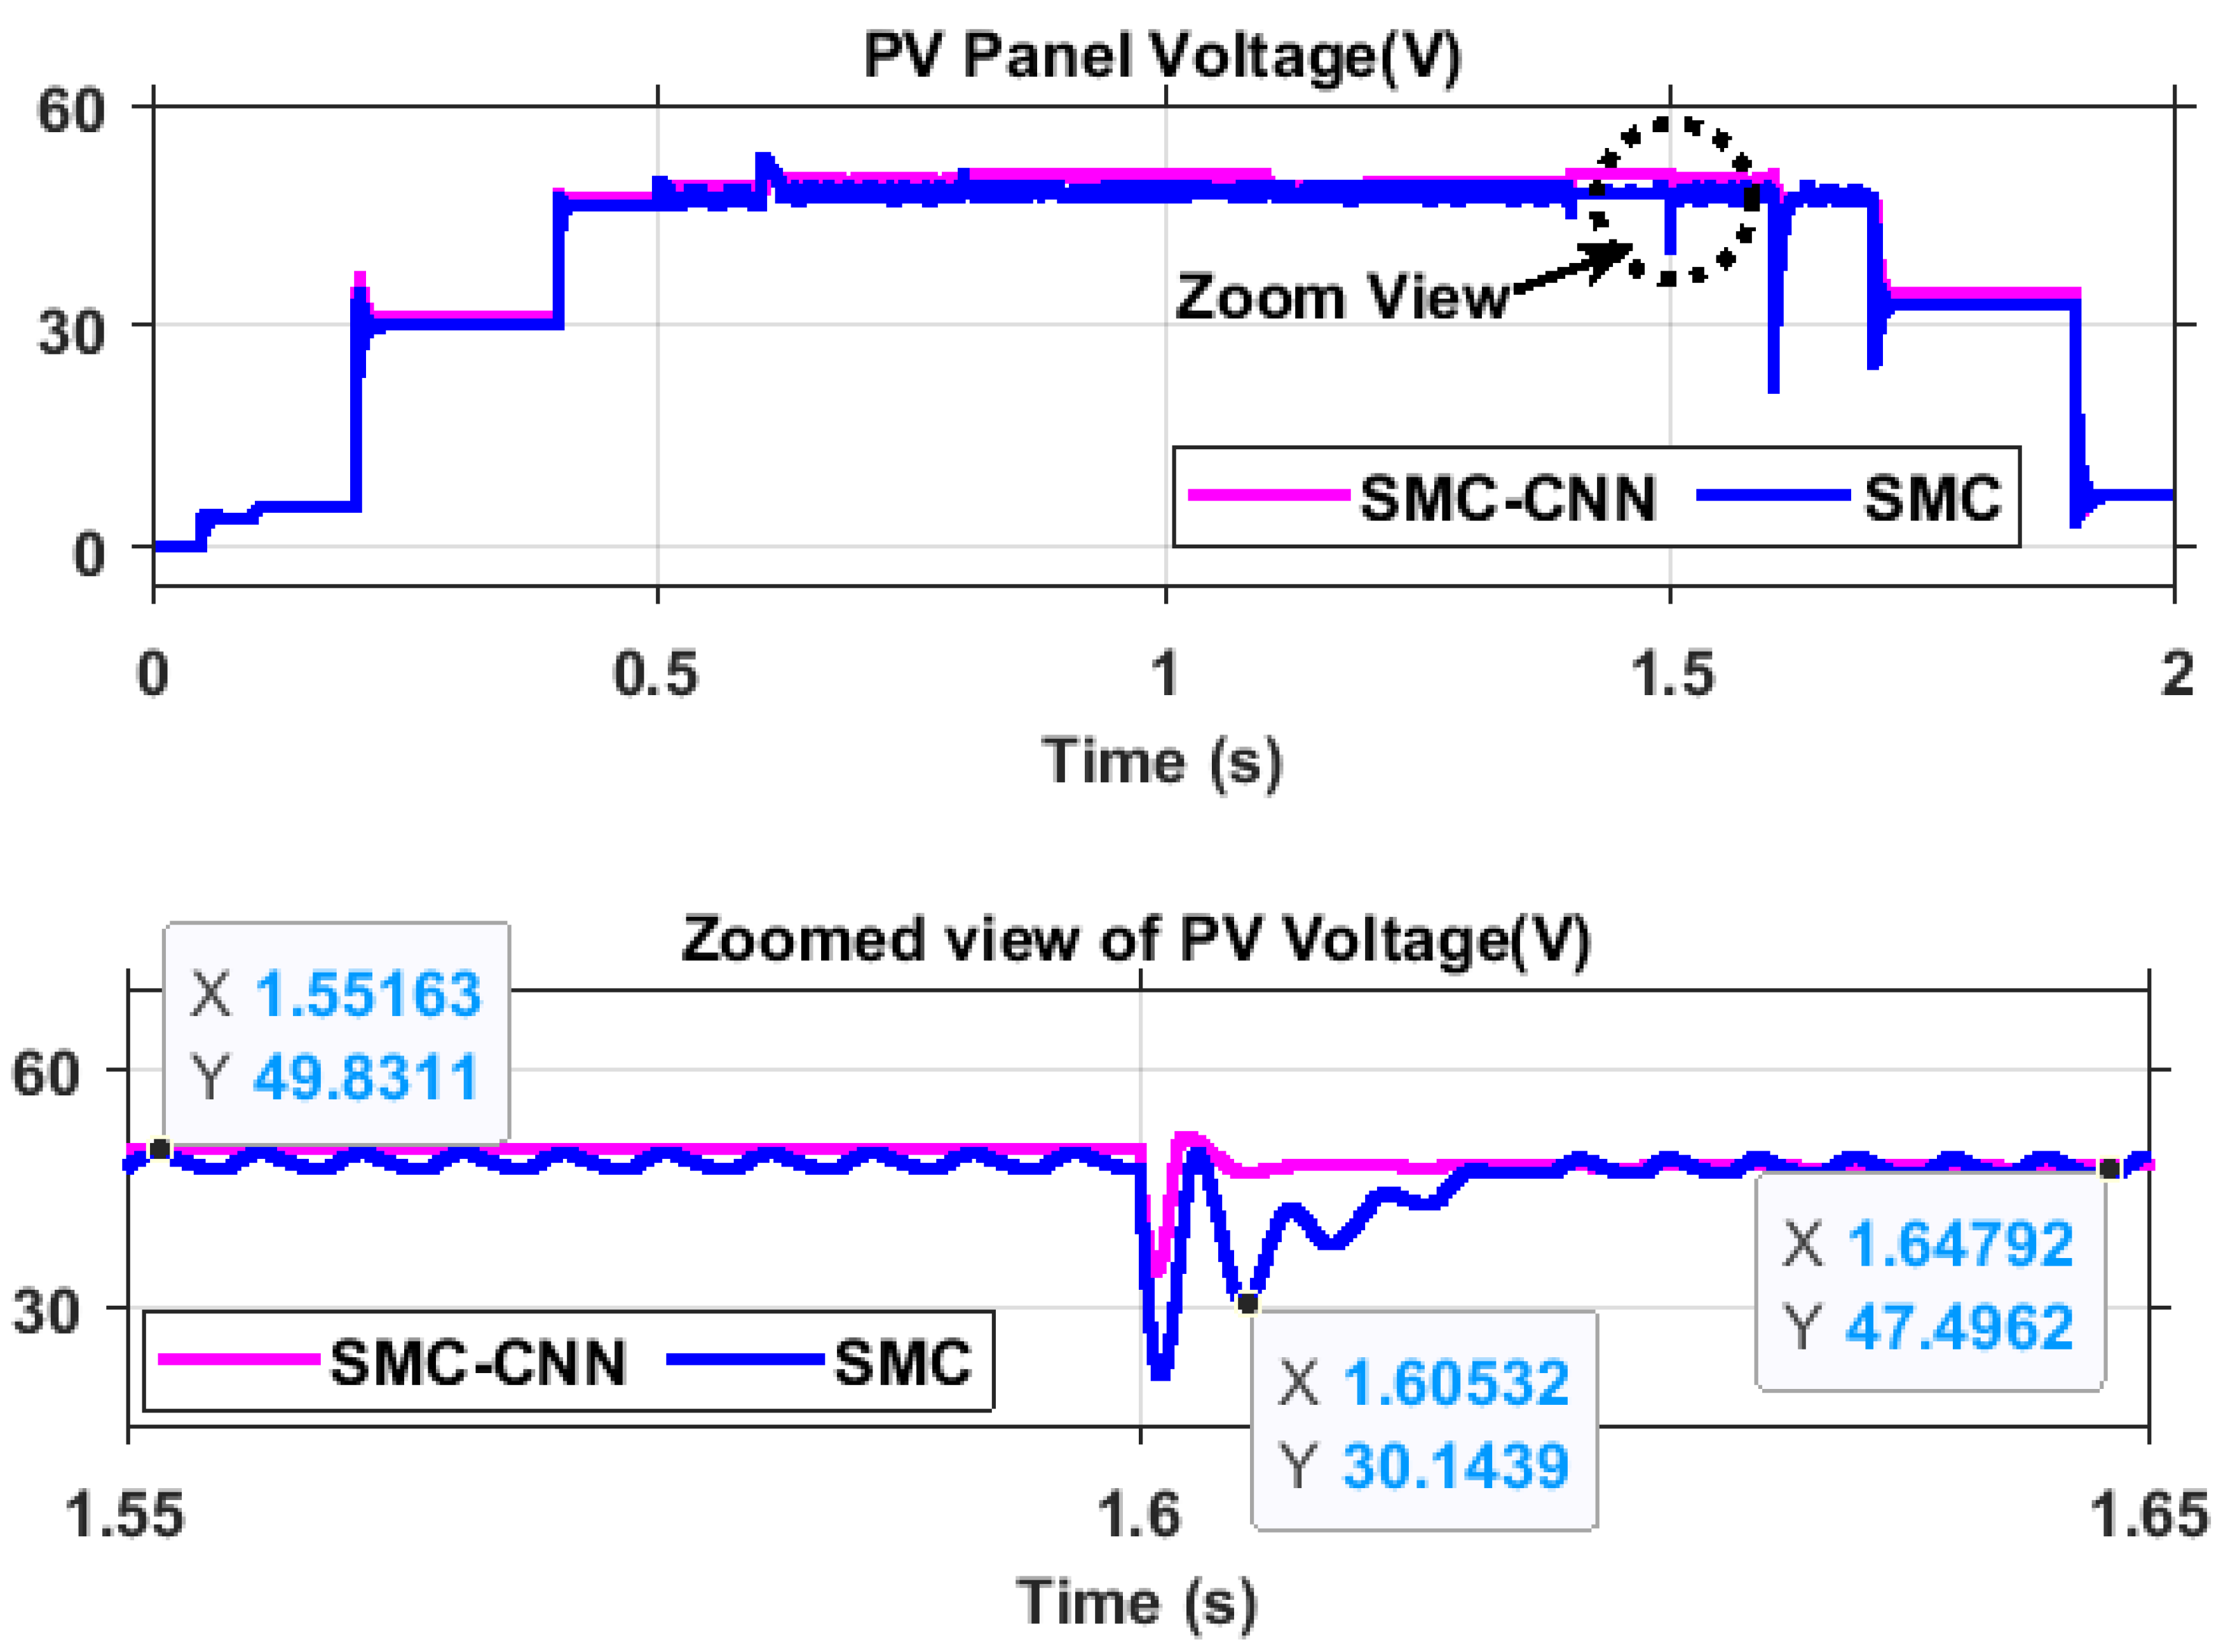
The various configurations showcased a range of patterns and scenarios present in the system, providing a comprehensive evaluation of how well the proposed scheme performs in different situations. Simulations were conducted to evaluate the effectiveness of these algorithms, covering a time frame from 0 seconds to 2.0 seconds, with a particular emphasis on electric vehicle (EV) propulsion and its critical load applications.
Figure 12.
(a) PV Panel Voltage,(b) Zoom View.
Figure 12.
(a) PV Panel Voltage,(b) Zoom View.
Figure 13.
(a) PV Panel Voltage ,(b) Modulation Index (c) Boost voltage (d) Zoom view of boost voltage.
Figure 13.
(a) PV Panel Voltage ,(b) Modulation Index (c) Boost voltage (d) Zoom view of boost voltage.
The study examines the effectiveness of different photovoltaic inputs under different atmospheric conditions, as well as the impact of environmental challenges and the availability of backup battery resources. This is achieved by implementing a suggested power management algorithm controller. Throughout the research, the simulation analysis focuses primarily on steady-state performance metrics. These metrics include load current, voltage ripple amplitudes, overshoot, and settling time duration. The analysis takes into account the dynamically changing insolation and the charge and discharge mode of operation.
Figure 12 (a)-(b) illustrates the corresponding simulated source parameter of PV panel voltage .
Figure 13(a)-(b) presented modulation Index and converter output voltage and its zoomed version.
Figure 13 (a-b) provide a comprehensive depiction of the crucial elements involved in the operation of a PV boost DC/DC converter. The modulation control strategy, the detailed analysis of the output voltage performance, and the stabilizing effect of the DC bus capacitor are all encompassed within the system. These illustrations emphasize the significance of meticulous control and resilient design in attaining both efficient and stable power conversion in PV systems.
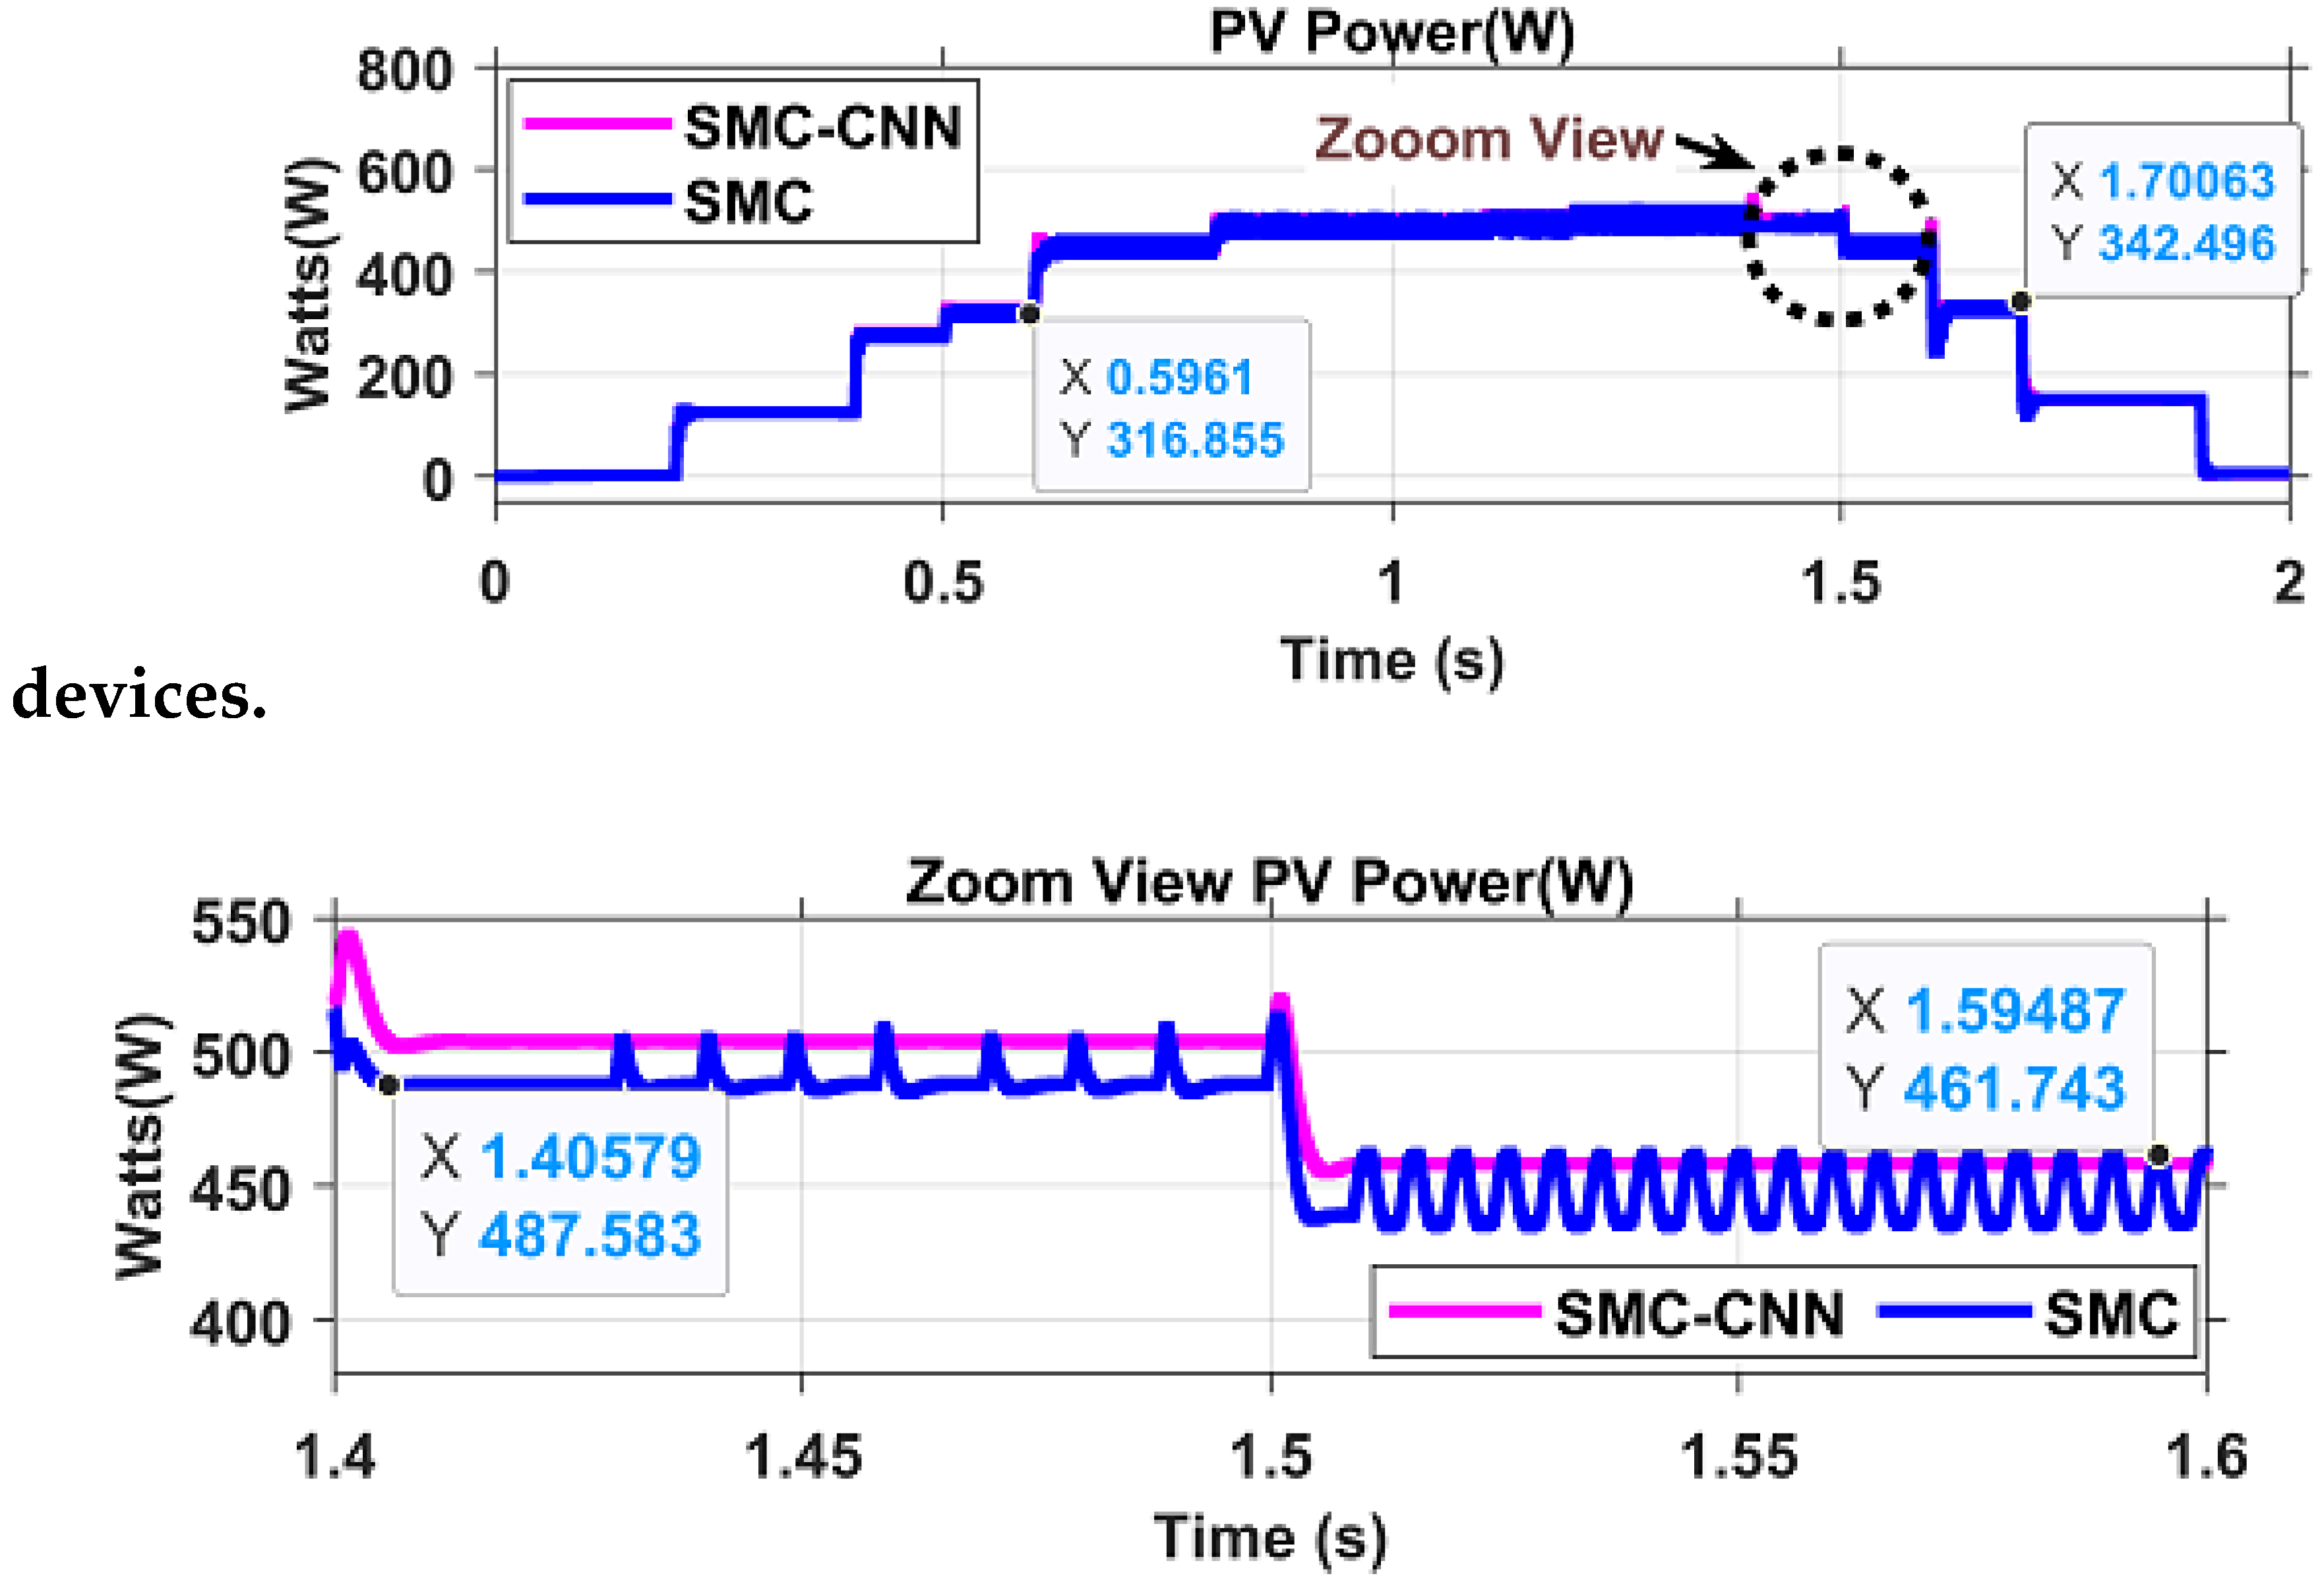
PV power
Figure 14 (a)-(b) The shared DC bus inverter capacitor is an essential element in systems where multiple converters or power sources contribute to a common DC bus. Its primary function is to ensure voltage stability on the DC bus by absorbing transients and delivering a consistent voltage level to downstream
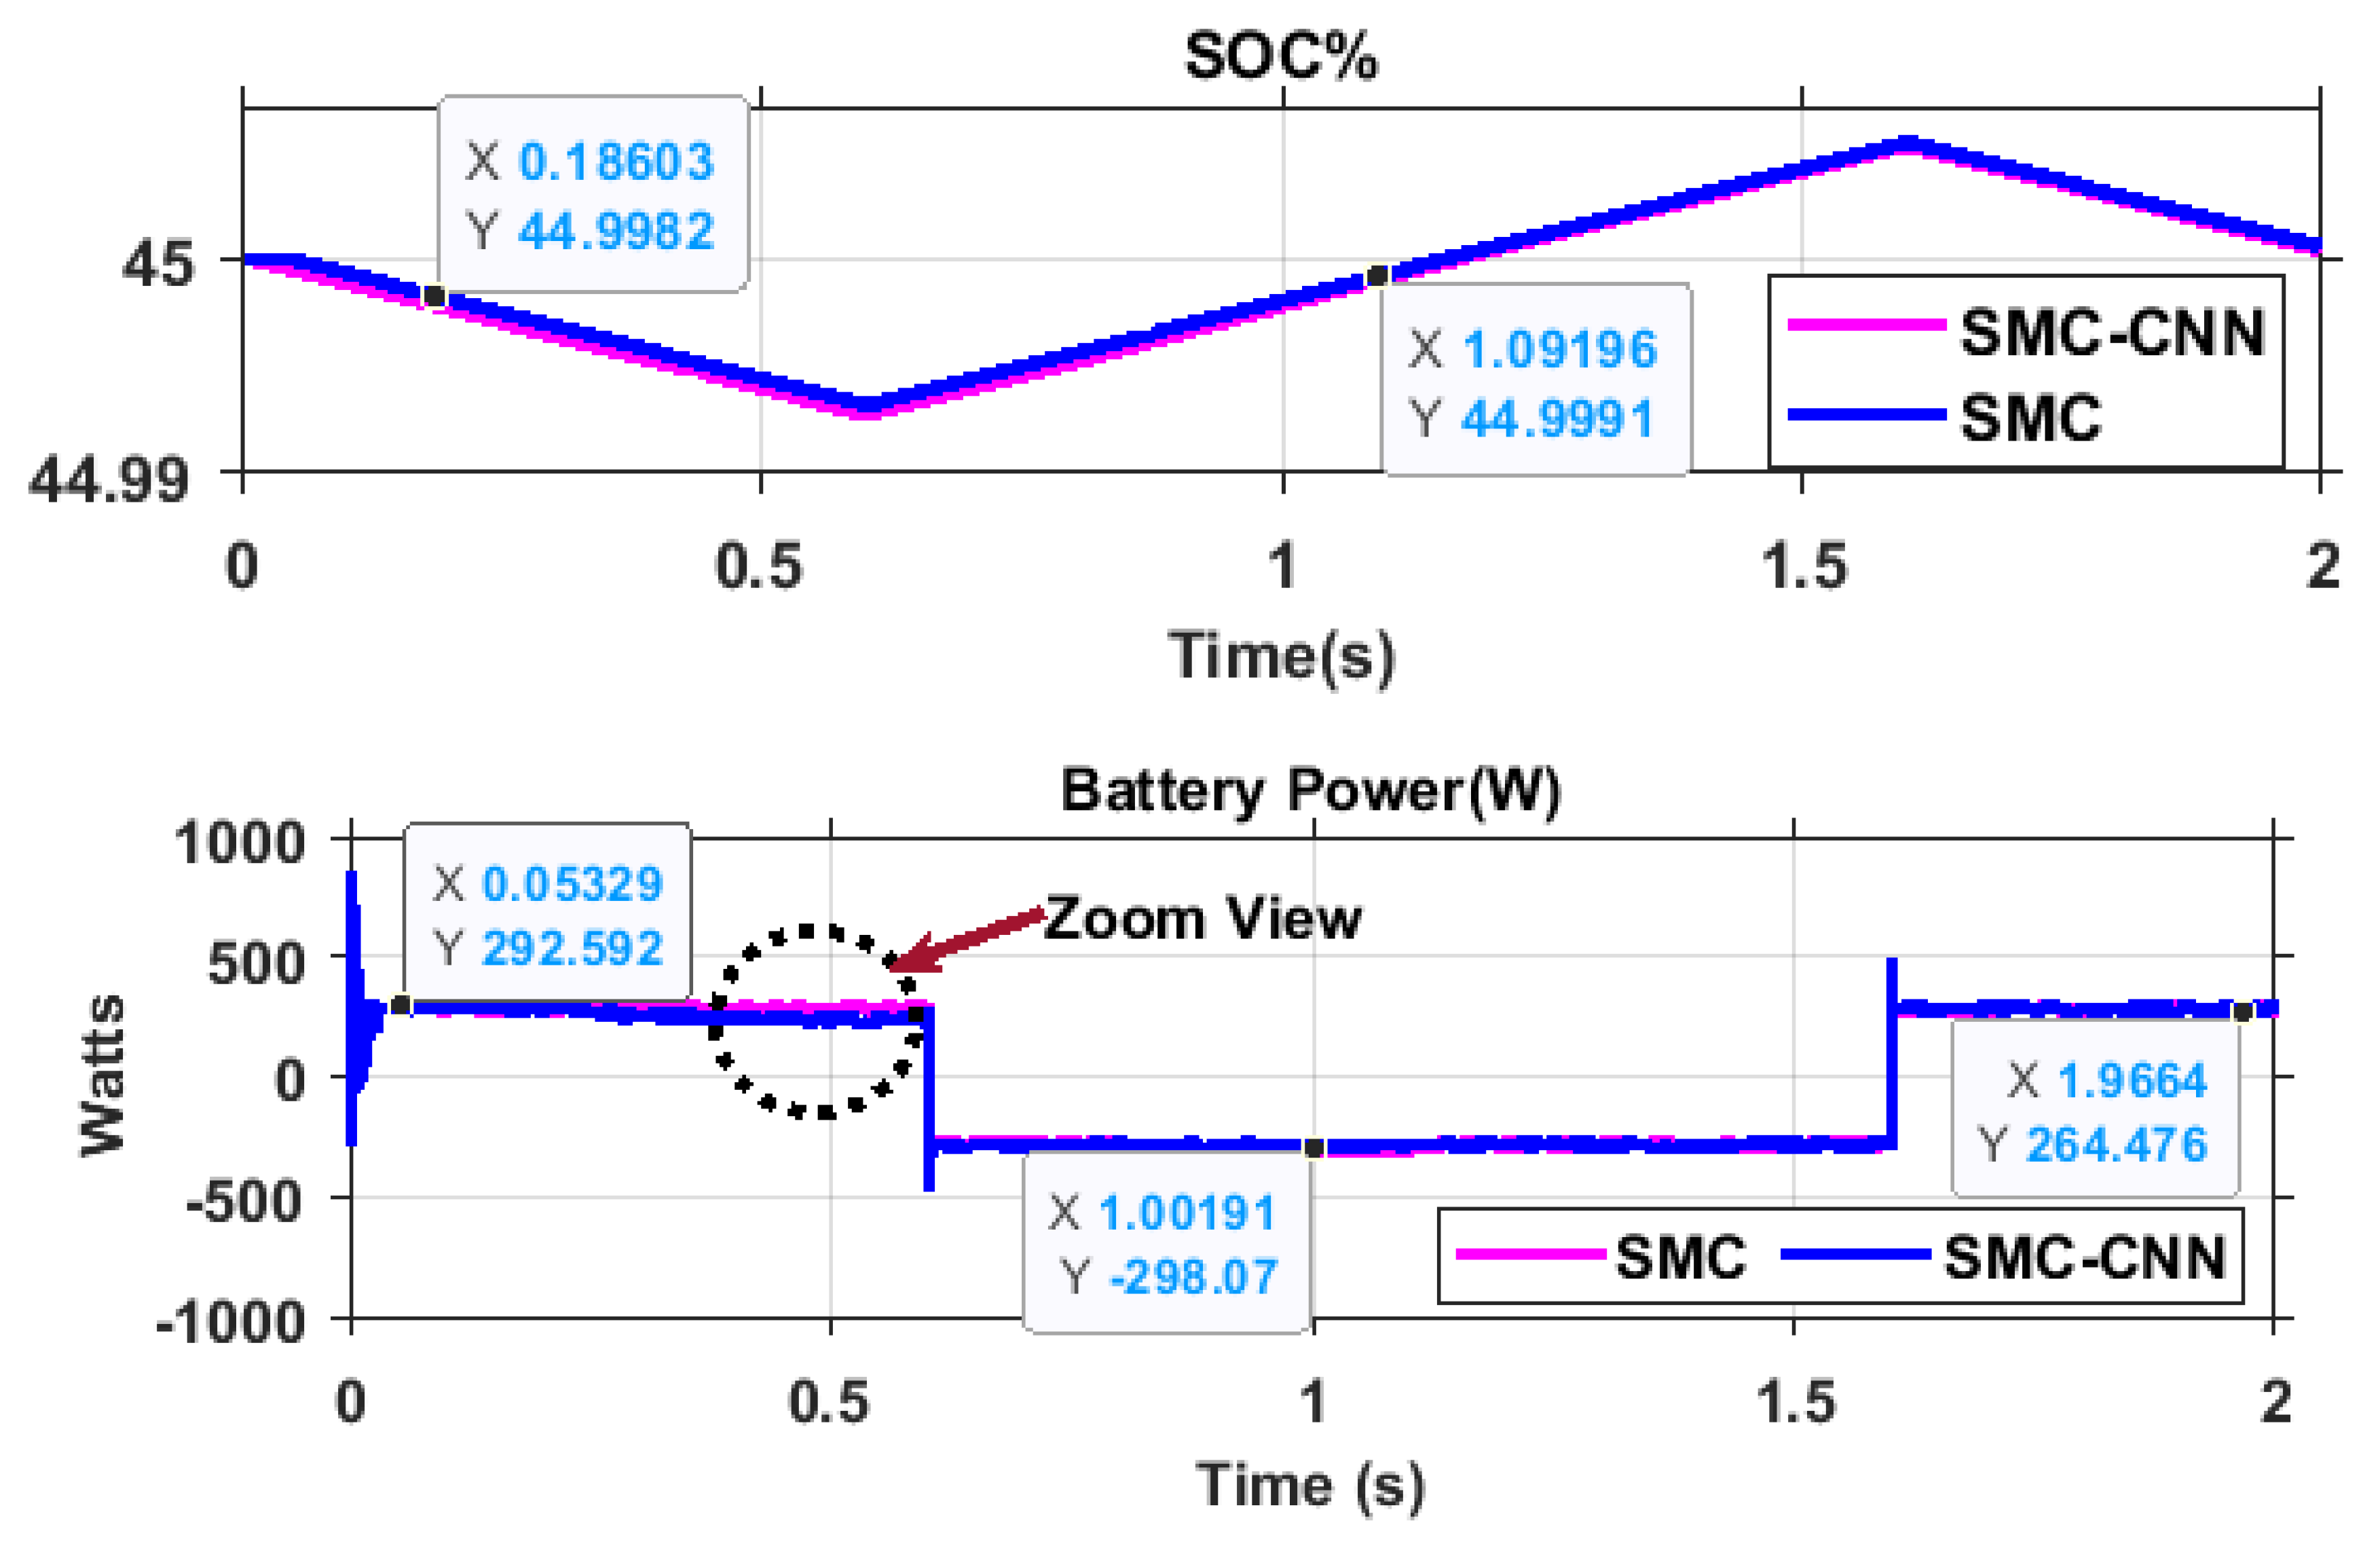
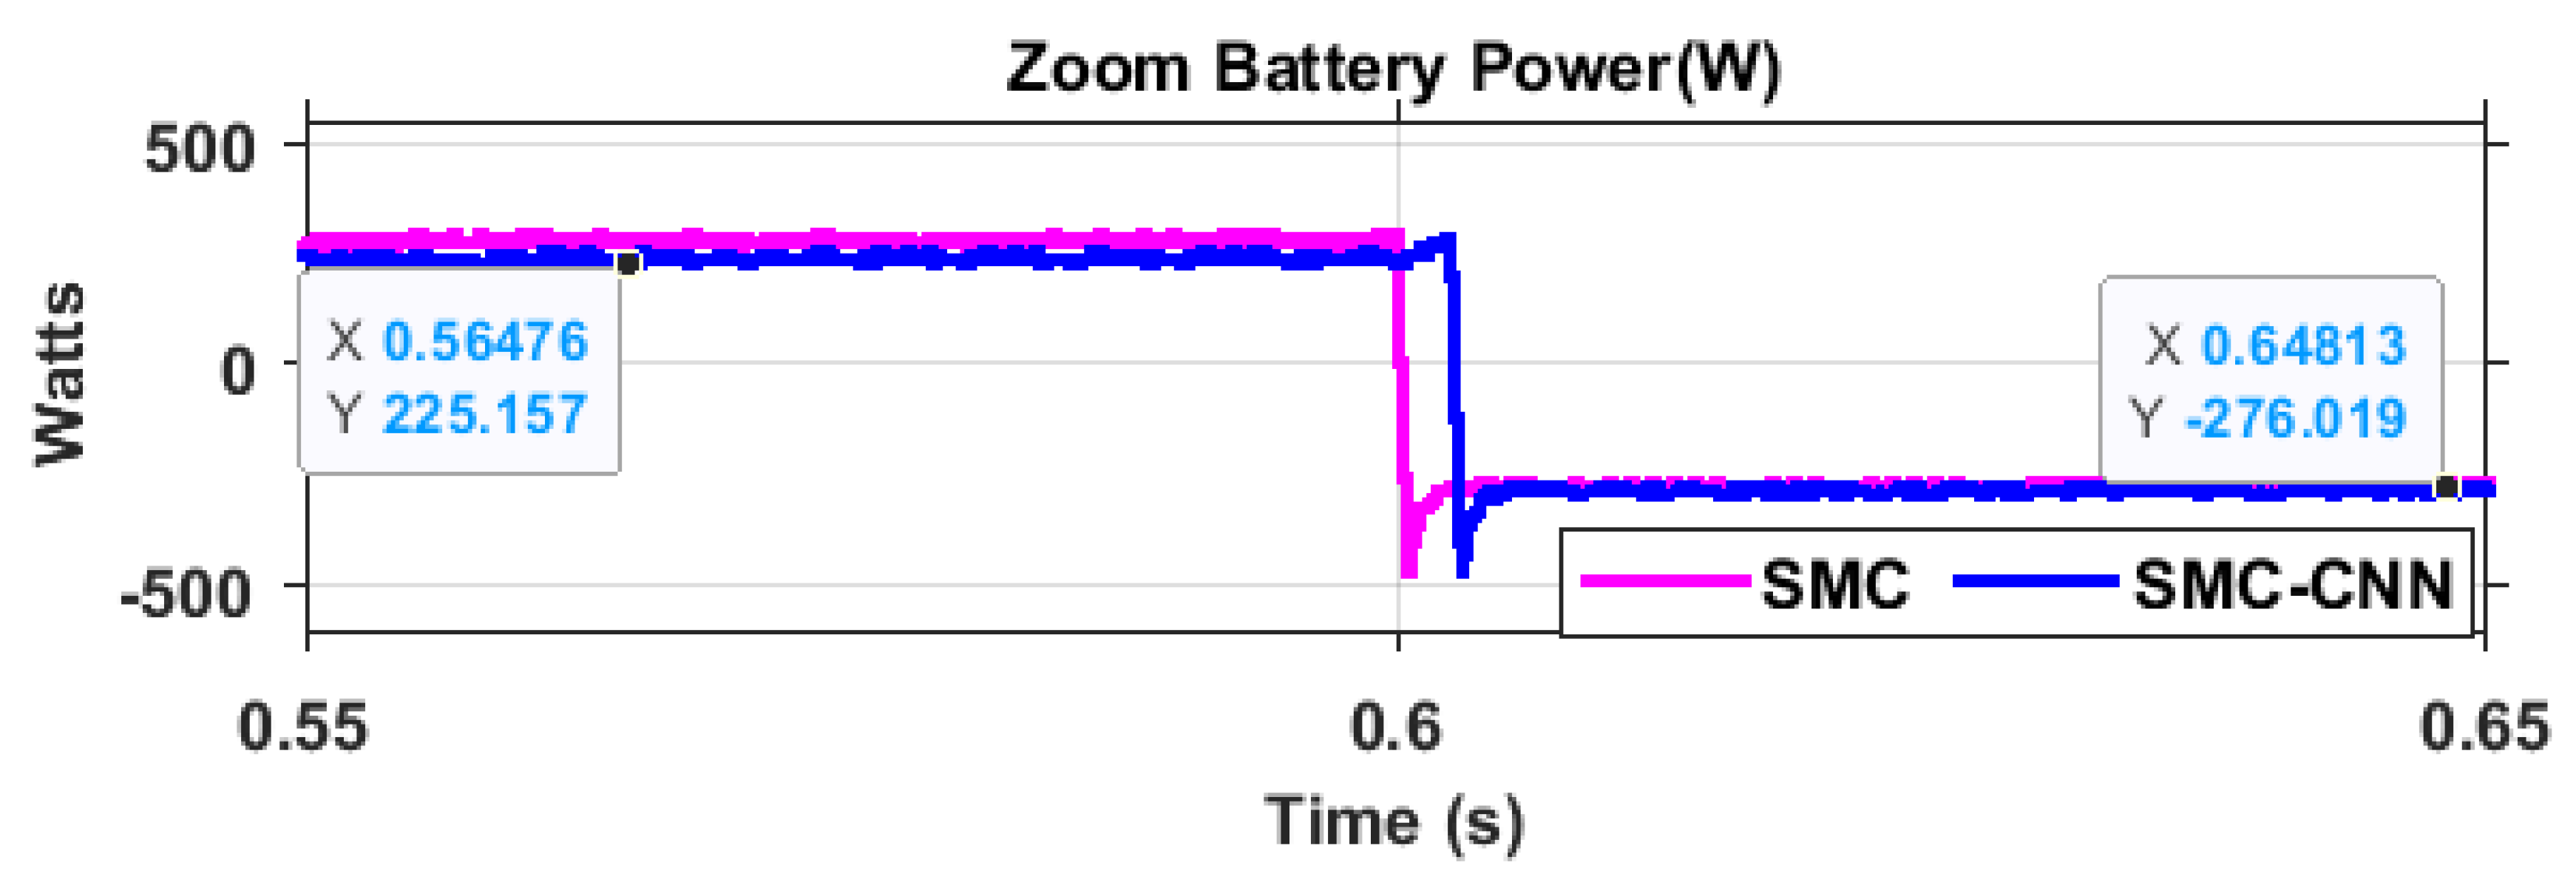
Figure 15(b-c) illustrates the anticipated power of the battery (W), showcasing the power response of the rear source battery. By examining the fluctuations in power, which is the outcome of multiplying voltage and current, the energy transfer to or from the battery can be determined. The zoomed-in view of
Figure 15(b) provides a closer analysis of these variations.
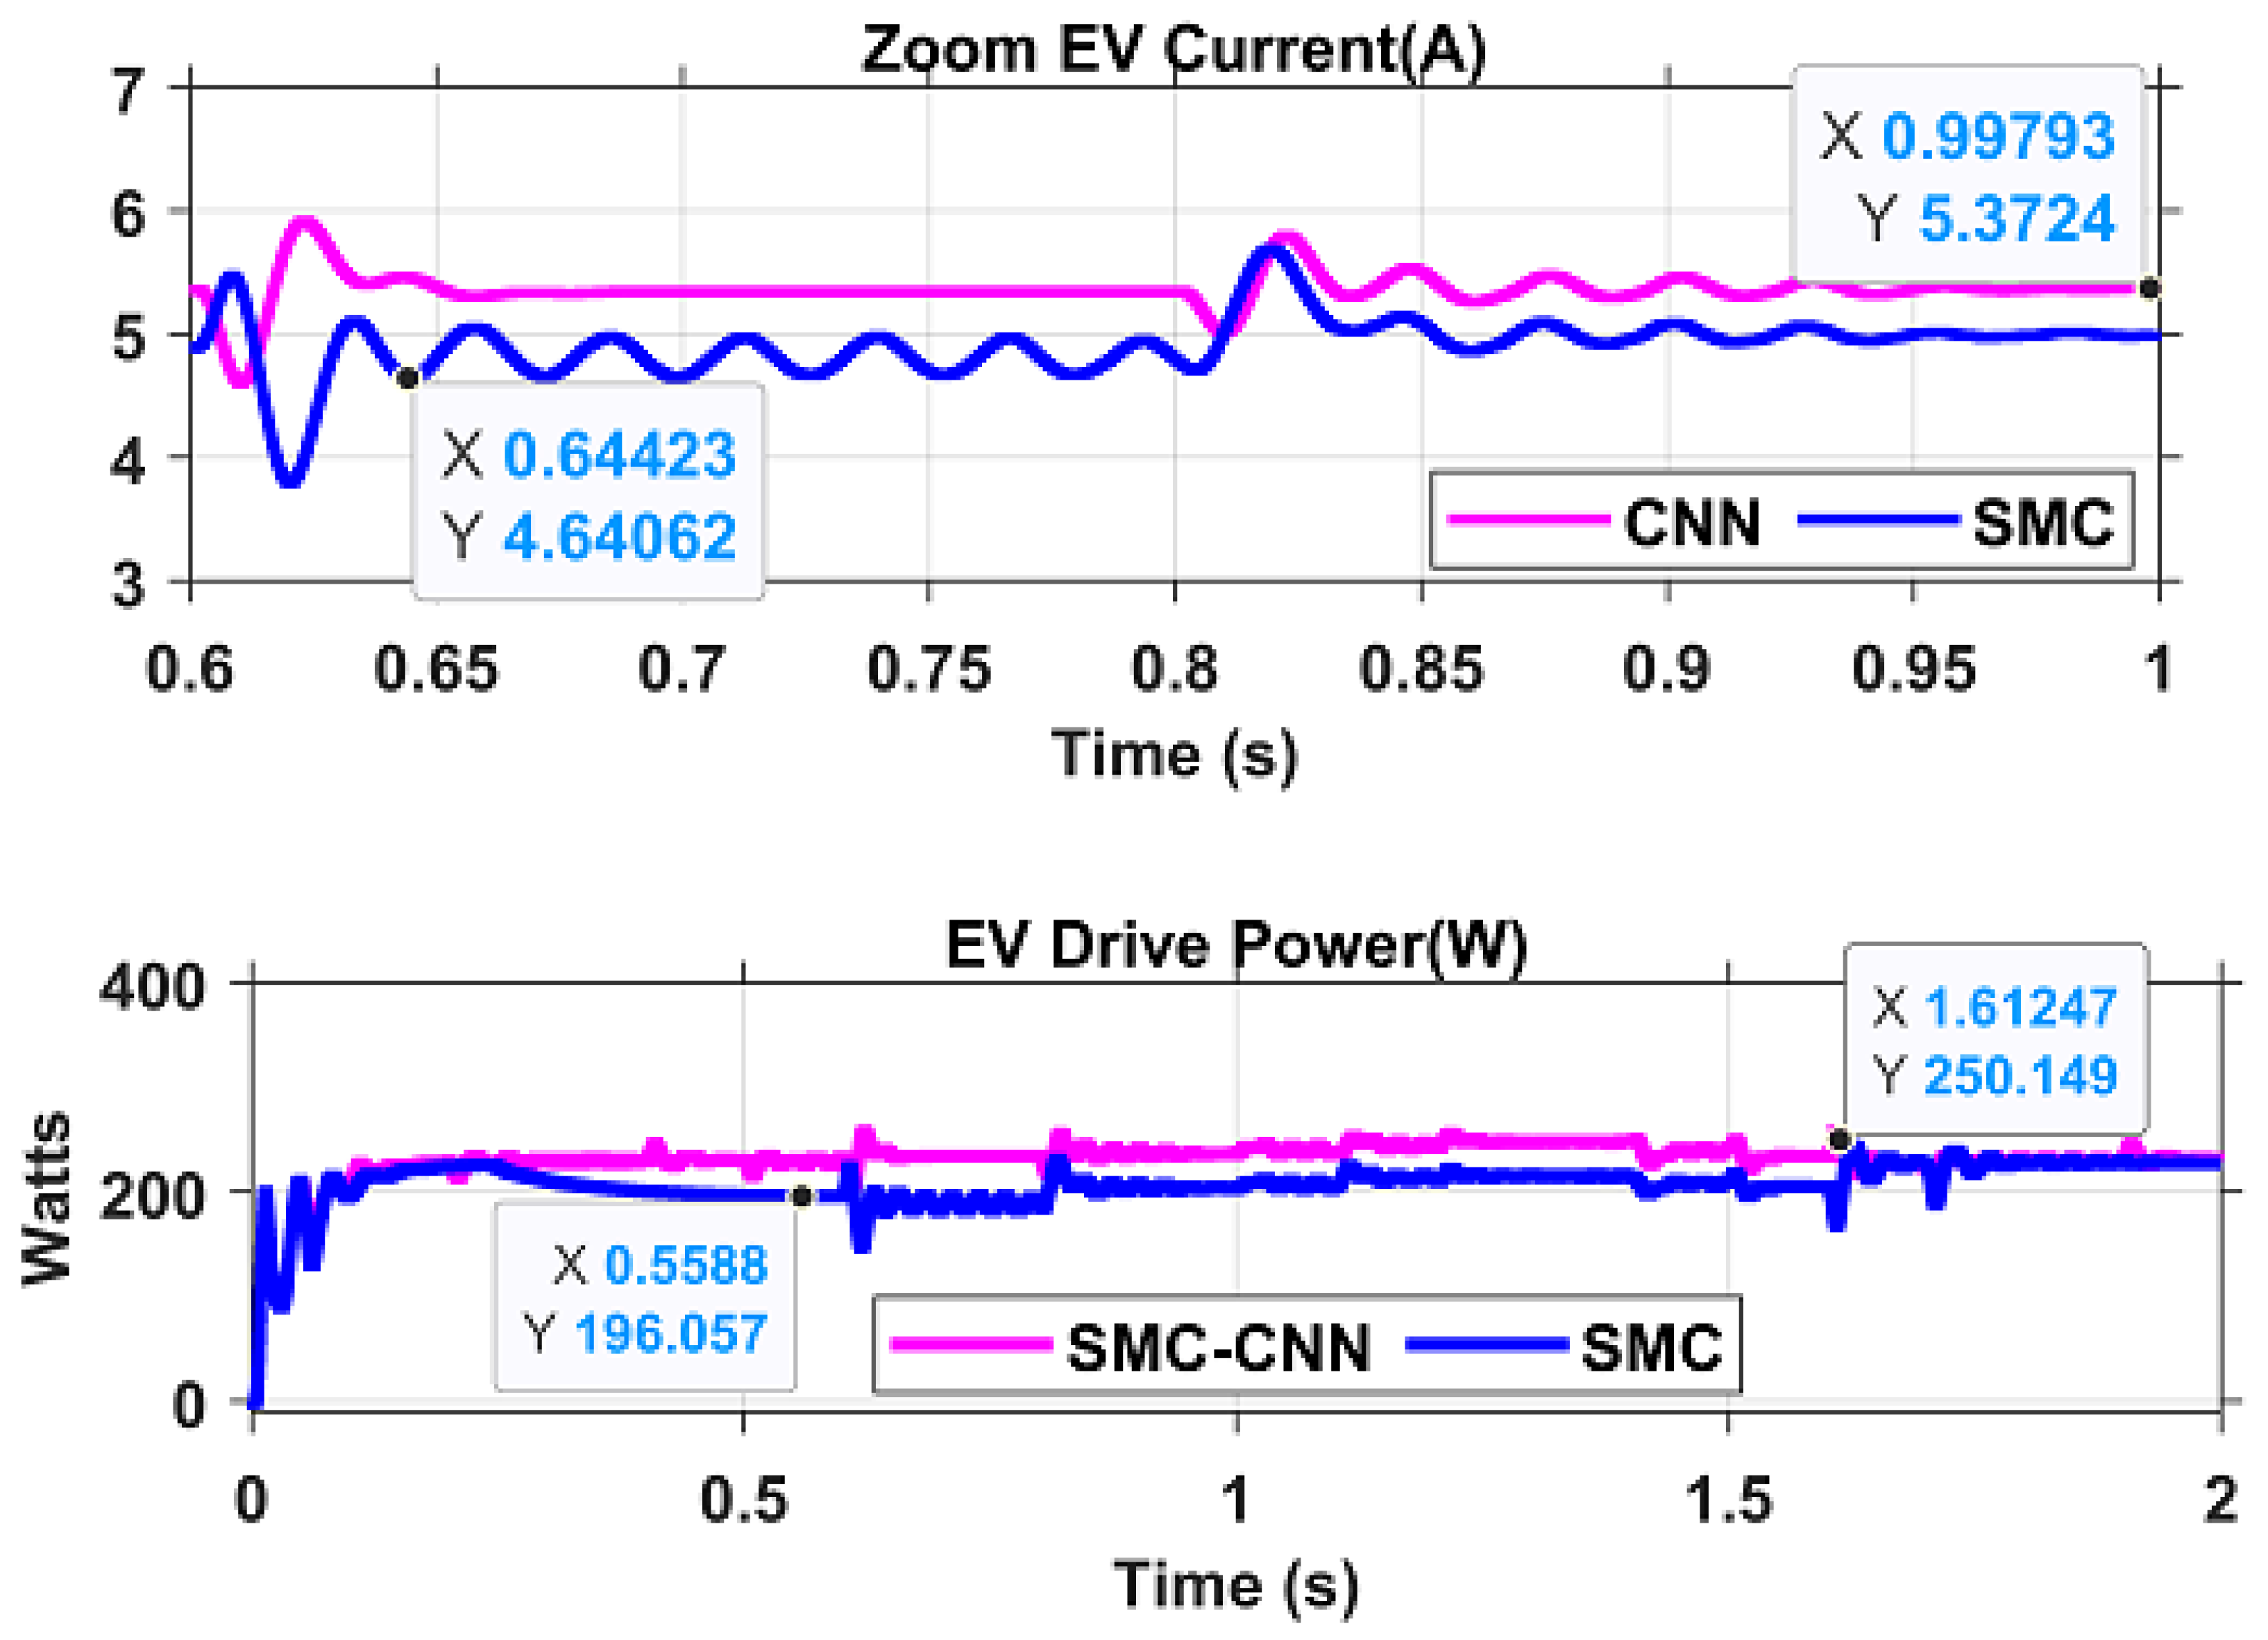
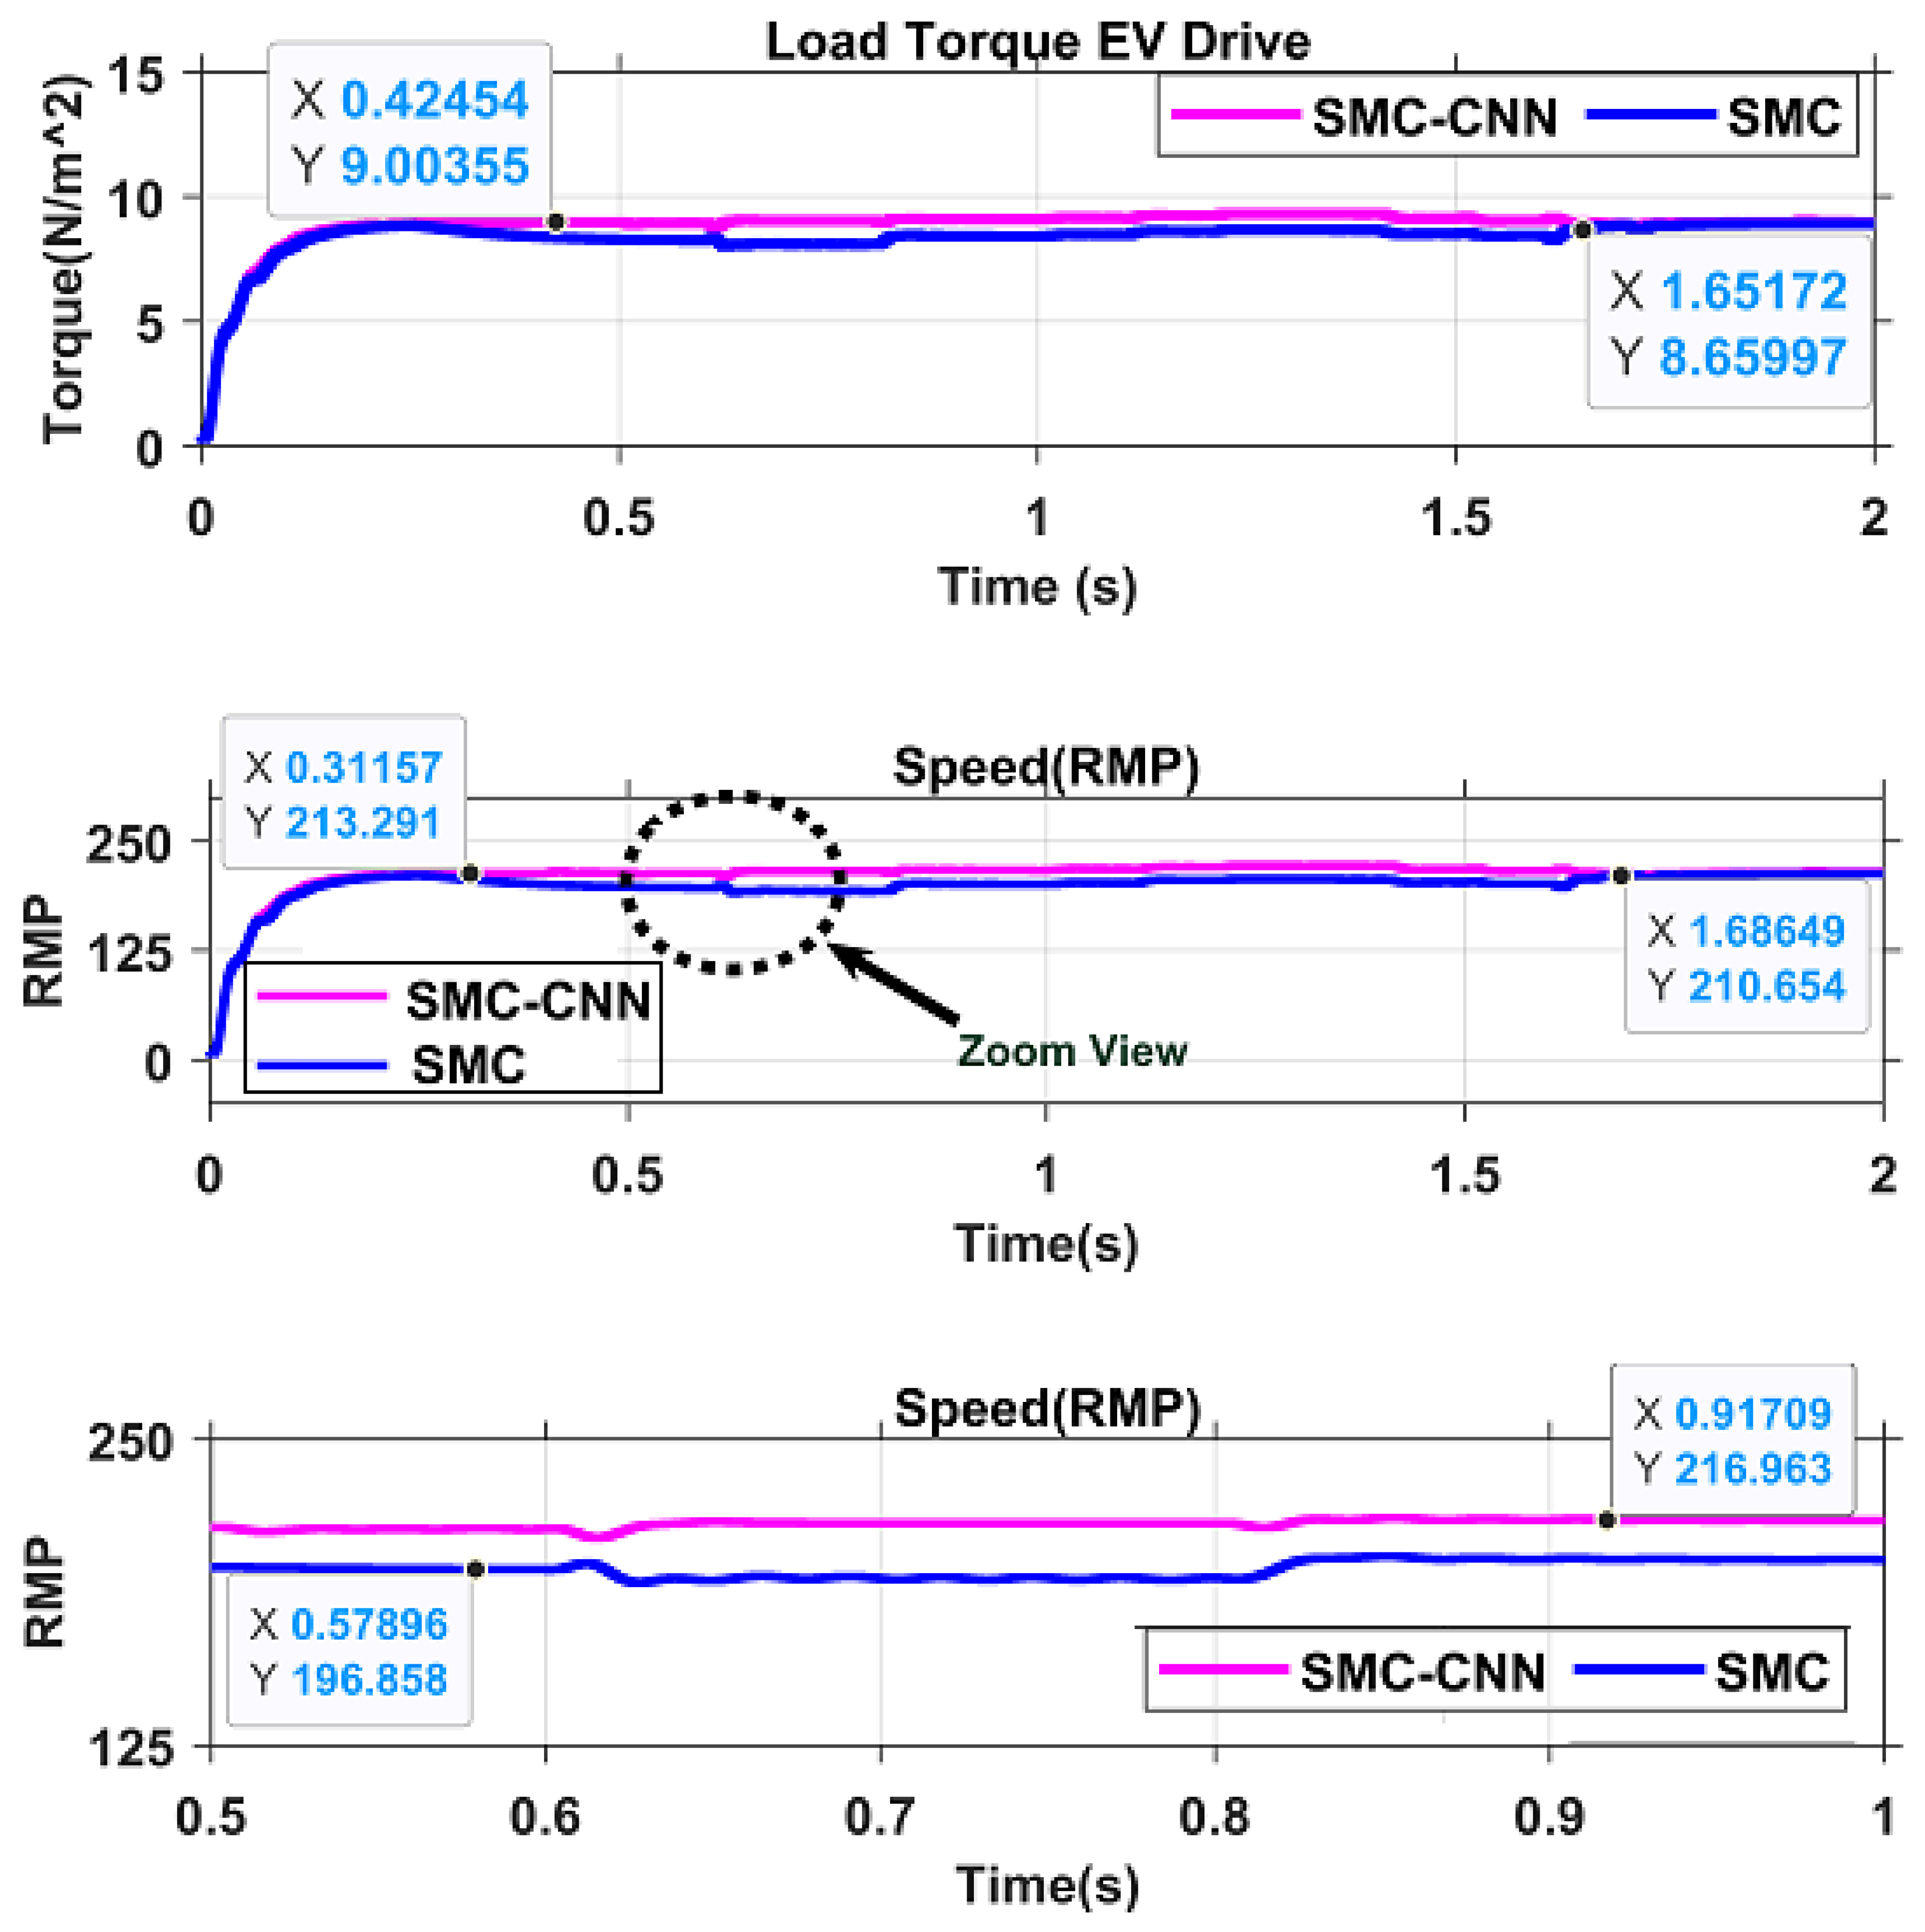
The examination goes deeper into the drive load voltage, load current torque, and drive speed values of the three main configurations of SMC and SMC-CNN, as shown in
Figure 8 and
Figure 9. It is important to highlight that the torque and speed values are recorded at 230.9, 199.20, 231.45, and 199.50 for SMC, demonstrating significant differences when compared to SMC-
CNN controller.
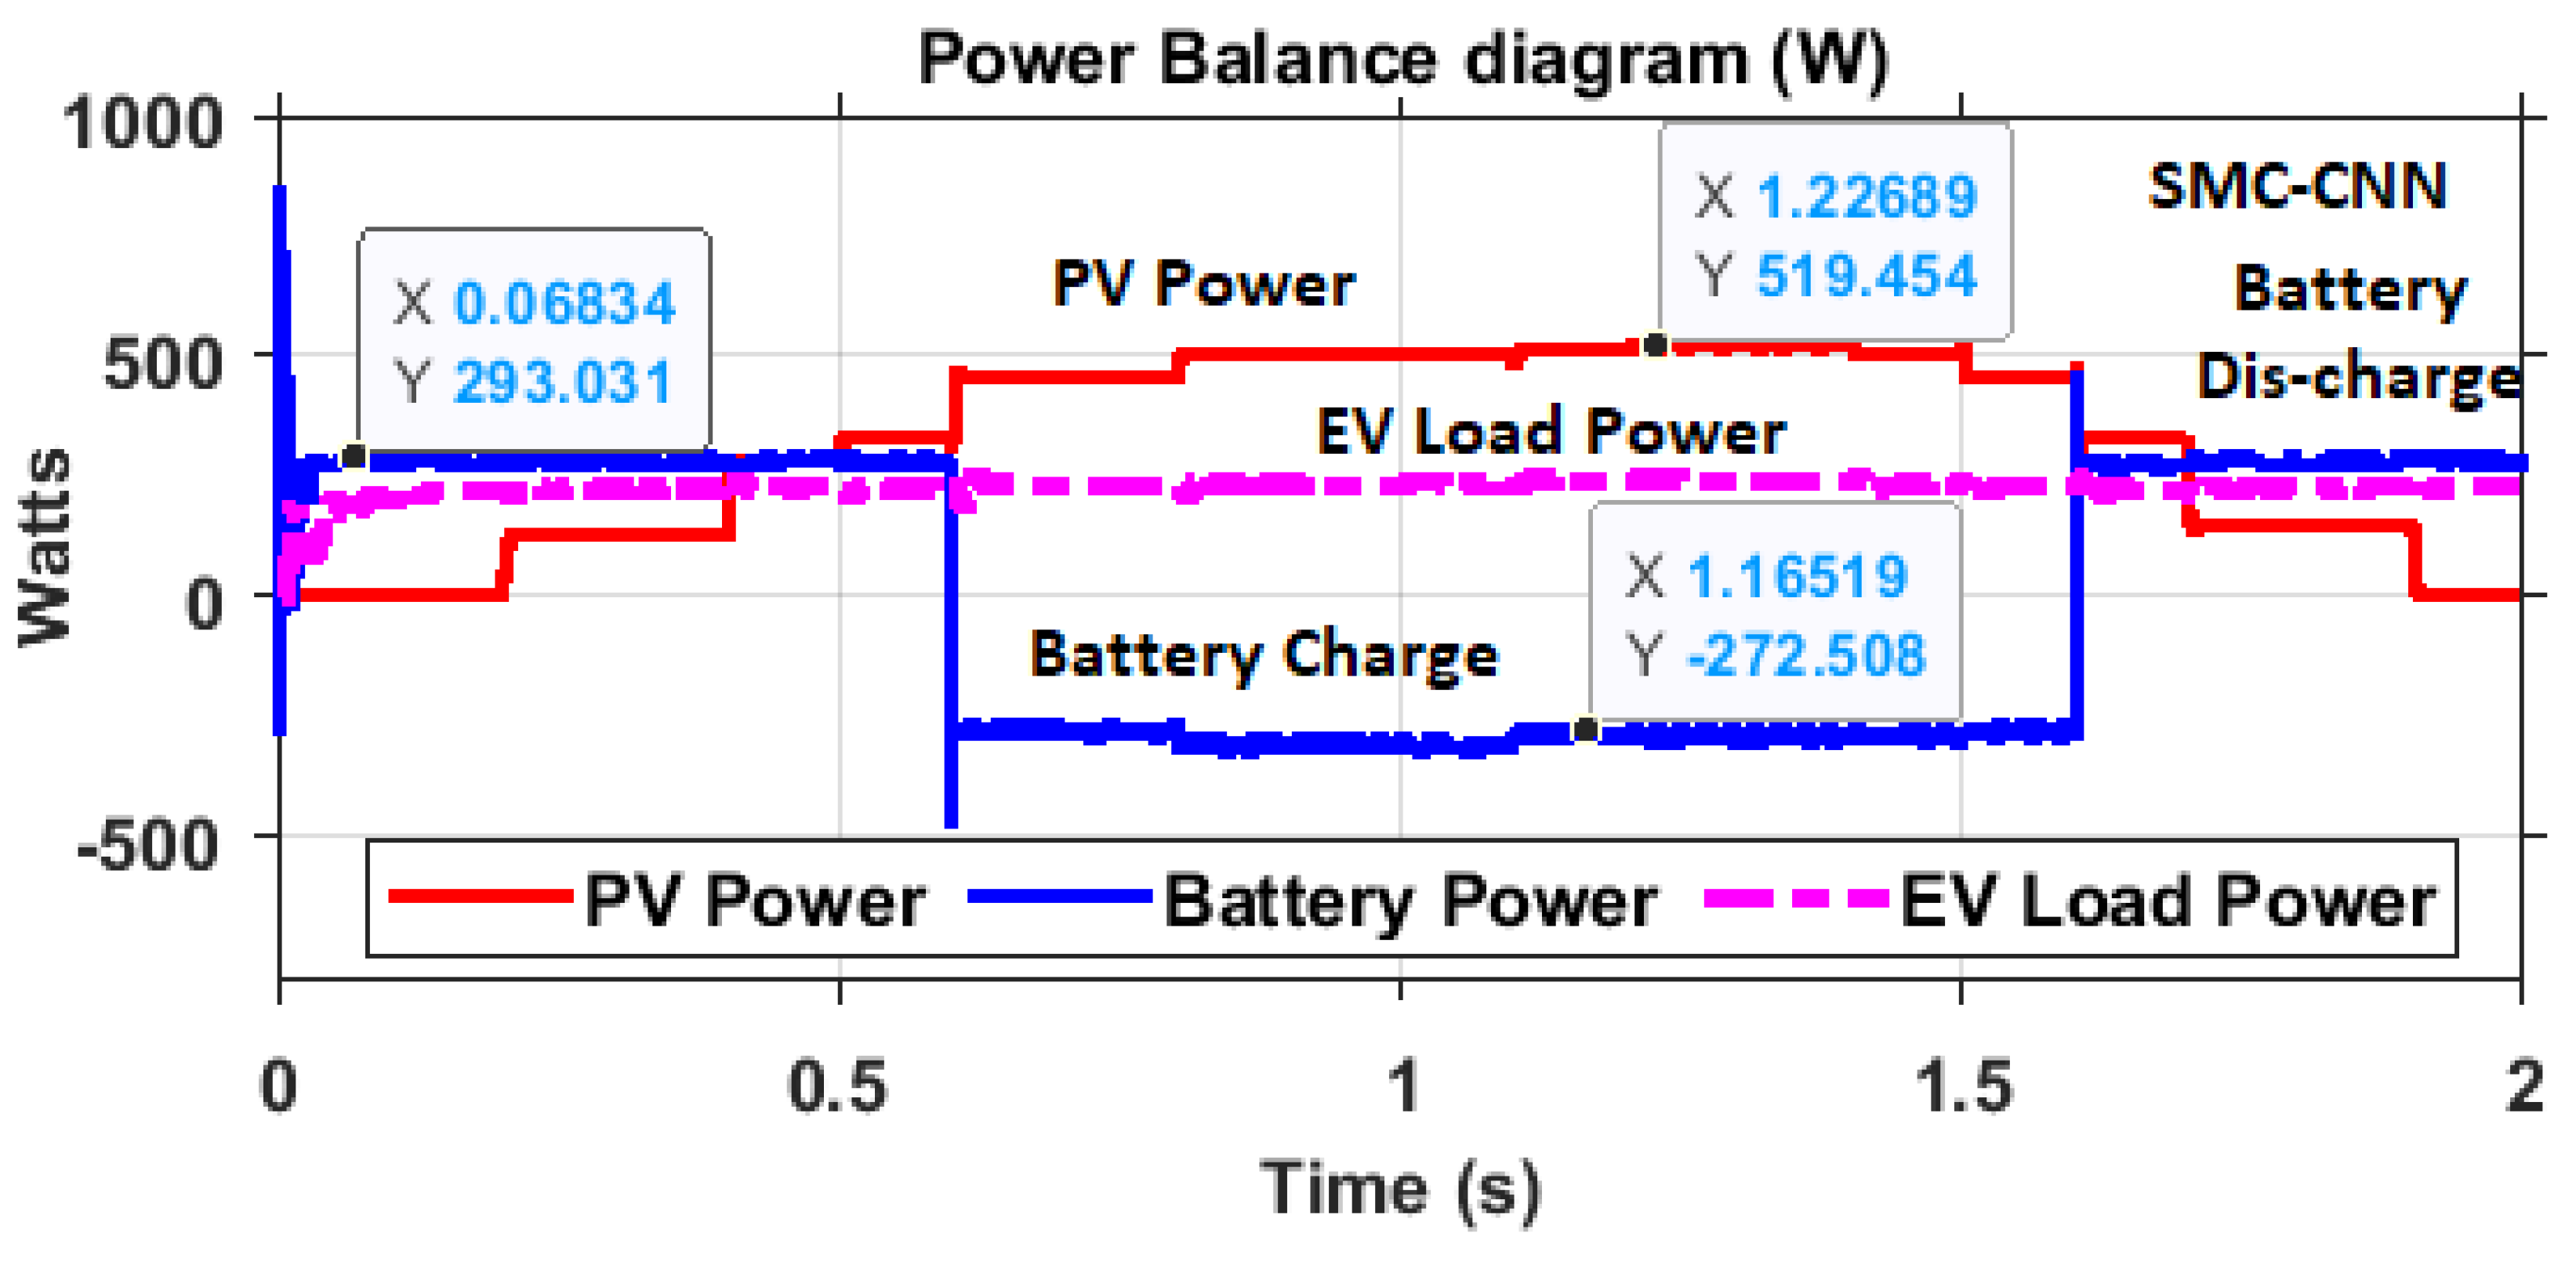
The conventional SMC controller's performance is evaluated by monitoring the transient values of voltage, current, and power until reaching a steady-state at 0.0965s. The observed values at steady-state are 619.80W for the auxiliary DC drive and 659.92W for the main DC drive. The duration of the period for battery charge mode operation is also determined. During the SP2 (0.6s to 1.6s) pattern, the PV insolation pattern shifted from 380, 587, 677, 706, 720, 680, and 587 to a different sequence. Throughout this period, when the PV power exceeded the load power, the surplus energy was stored in the battery. The PV power was utilized to manage both the EV Drive battery.
The time range for SP3 spans from 1.6s to 2.0s, indicating a PV insolation of 390 (W/m
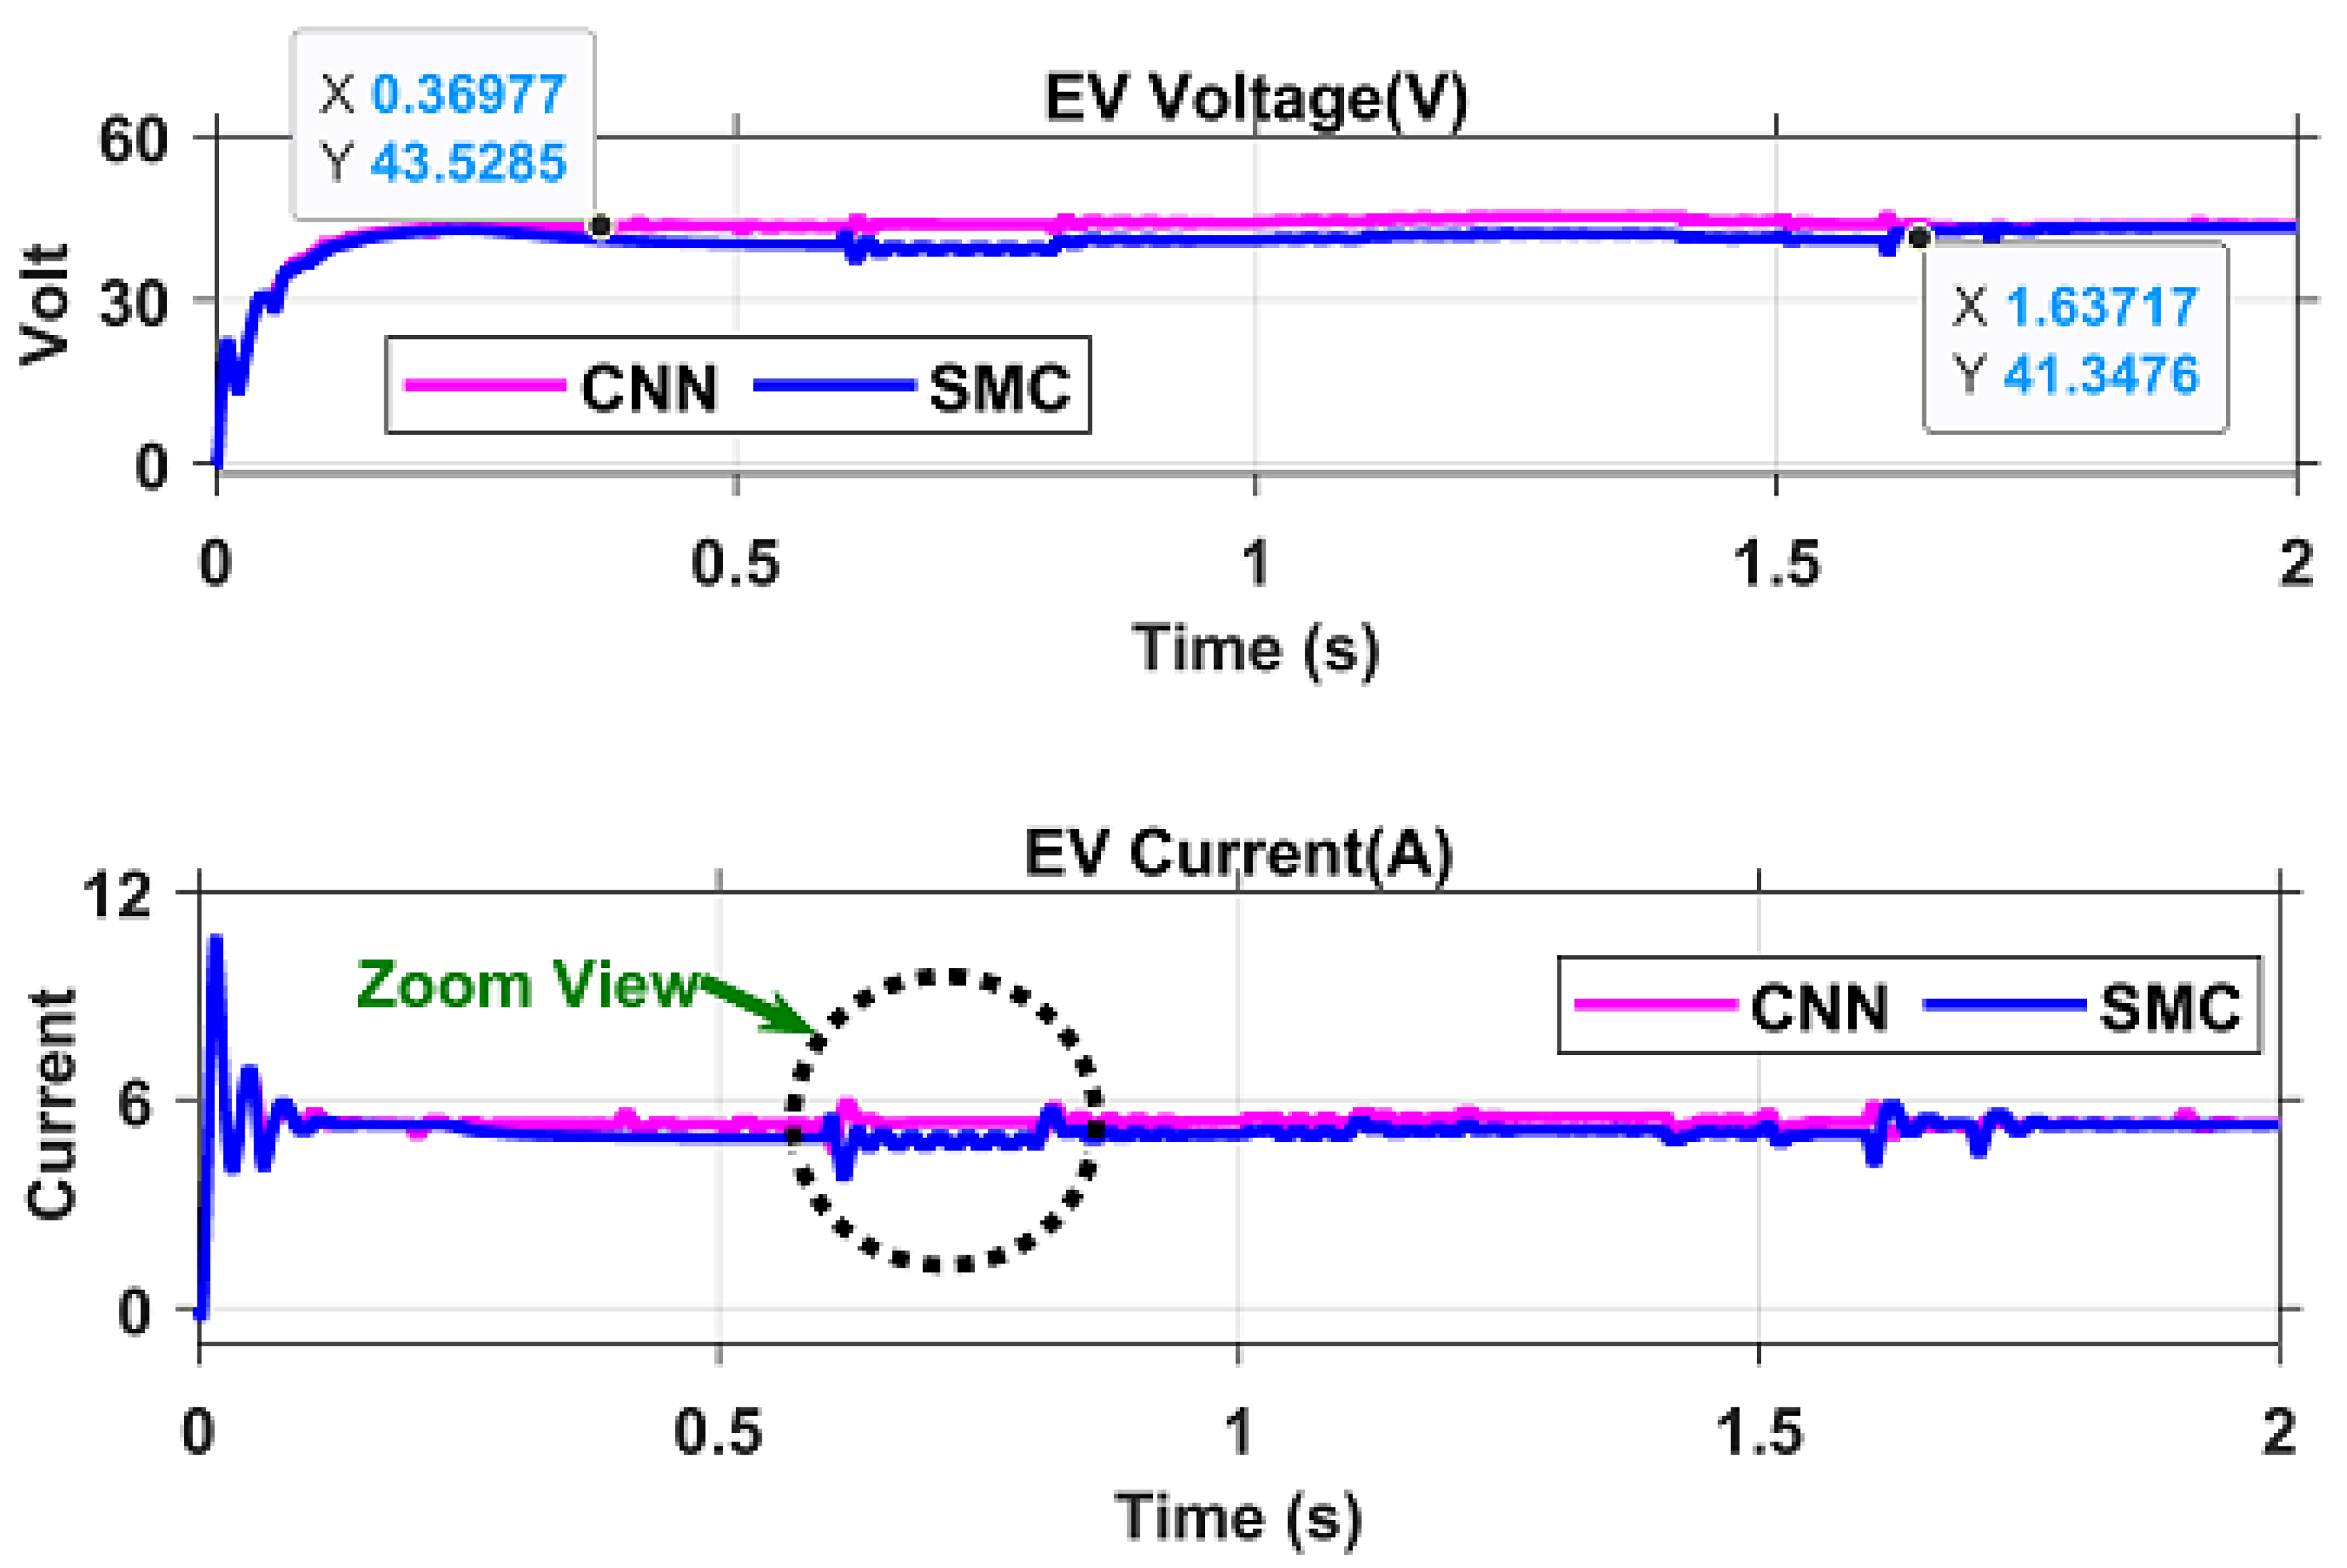
2) to 40 (W/m2) during observation. In the final configuration, both the PV system and battery system are utilized to effectively manage the load. This comprehensive examination is intended to offer insights into the system's performance under various loads, emphasizing key performance indicators and numerical data for a thorough assessment. The simulation results for voltage, current, and power for the three configurations are elaborately presented in
Figure 16, with power details tabulated in
Table 6, outlining the discharge battery and DC drive power of the proposed algorithms.
Figure 16.
EV Parameter (a) Voltage (b) Current (c) Zoom current (d)Power.
Figure 16.
EV Parameter (a) Voltage (b) Current (c) Zoom current (d)Power.
Figure 17.
Mechanical Parameter (a) EV Torque (b) EV speed(c)zoom View of speed.
Figure 17.
Mechanical Parameter (a) EV Torque (b) EV speed(c)zoom View of speed.
Table 6.
Simulation results.
Table 6.
Simulation results.
| Configuration |
Insolation
(W/m2) |
PV Power
(Watts) |
Battery Power
(Watts) |
Load Power
(Watts) |
| SMC |
SMC-CNN |
SMC |
SMC-CNN |
SMC |
SMC-CNN |
SP1
(Dis-Charge) |
30 |
10.25 |
12.25 |
292.59 |
293.50 |
203.89 |
225.89 |
| 200 |
121.50 |
124.68 |
281.41 |
292.90 |
203.87 |
231.54 |
| 320 |
270.21 |
282.26 |
241.85 |
292.24 |
225.169 |
232.76 |
| 380 |
316.855 |
328.68 |
235.06 |
293.61 |
200.44 |
227.43 |
SP2
(Charge) |
587 |
441.97 |
464.04 |
-272.14 |
-265.57 |
196.52 |
234.46 |
| 677 |
473.93 |
504.81 |
-273.09 |
-266.57 |
182.87 |
234.26 |
| 706 |
487.15 |
511.72 |
-300.93 |
-305.39 |
198.95 |
236.59 |
| 720 |
502.90 |
519..45 |
-300.42 |
-321.02 |
203.62 |
248.57 |
| 680 |
486.72 |
503.63 |
-296.67 |
-299.67 |
215.04 |
241.86 |
| 587 |
434.83 |
458.36 |
289.82 |
-202.74 |
206.50 |
231.90 |
SP3
(Dis-Charge) |
390 |
332.806 |
33.70 |
268.06 |
286.09 |
182.69 |
232.90 |
| 220 |
151.12 |
151.12 |
273.21 |
273.71 |
225.74 |
232.34 |
| 40 |
12.78 |
14.62 |
292.59 |
292.65 |
230.77 |
230.23 |
Table 7.
Mechanical Parameter.
Table 7.
Mechanical Parameter.
| Configuration |
Torque (Nm) |
Speed (RPM) |
| |
SMC |
SMC-CNN |
SMC |
SMC-CNN |
| SP1 |
8.354 |
9.003 |
204.678 |
213.291 |
| SP2 |
8.412 |
9.096 |
201.718 |
216.701 |
| SP3 |
8.651 |
8.972 |
210.654 |
218.365 |
The analysis delves further into the drive load voltage, load current, torque, and drive speed values of three major configurations of the SMC and SMC-CNN, as presented in
Figure 8 and
Figure 9, respectively. Notably, from
Table 5, the torque and speed values for the three different configurations of the SMC controller are as follows: torque values of 8.354, 8.412, and 8.65 with corresponding speeds of 204.678, 201.718, and 210.654, respectively. In comparison, the SMC-CNN configurations show torque values of 9.003, 9.096, and 8.972 with corresponding speed responses of 213.291, 216.701, and 218.365, respectively. These results indicate that the SMC-CNN configurations exhibit improved torque and speed values compared to the SMC configurations.
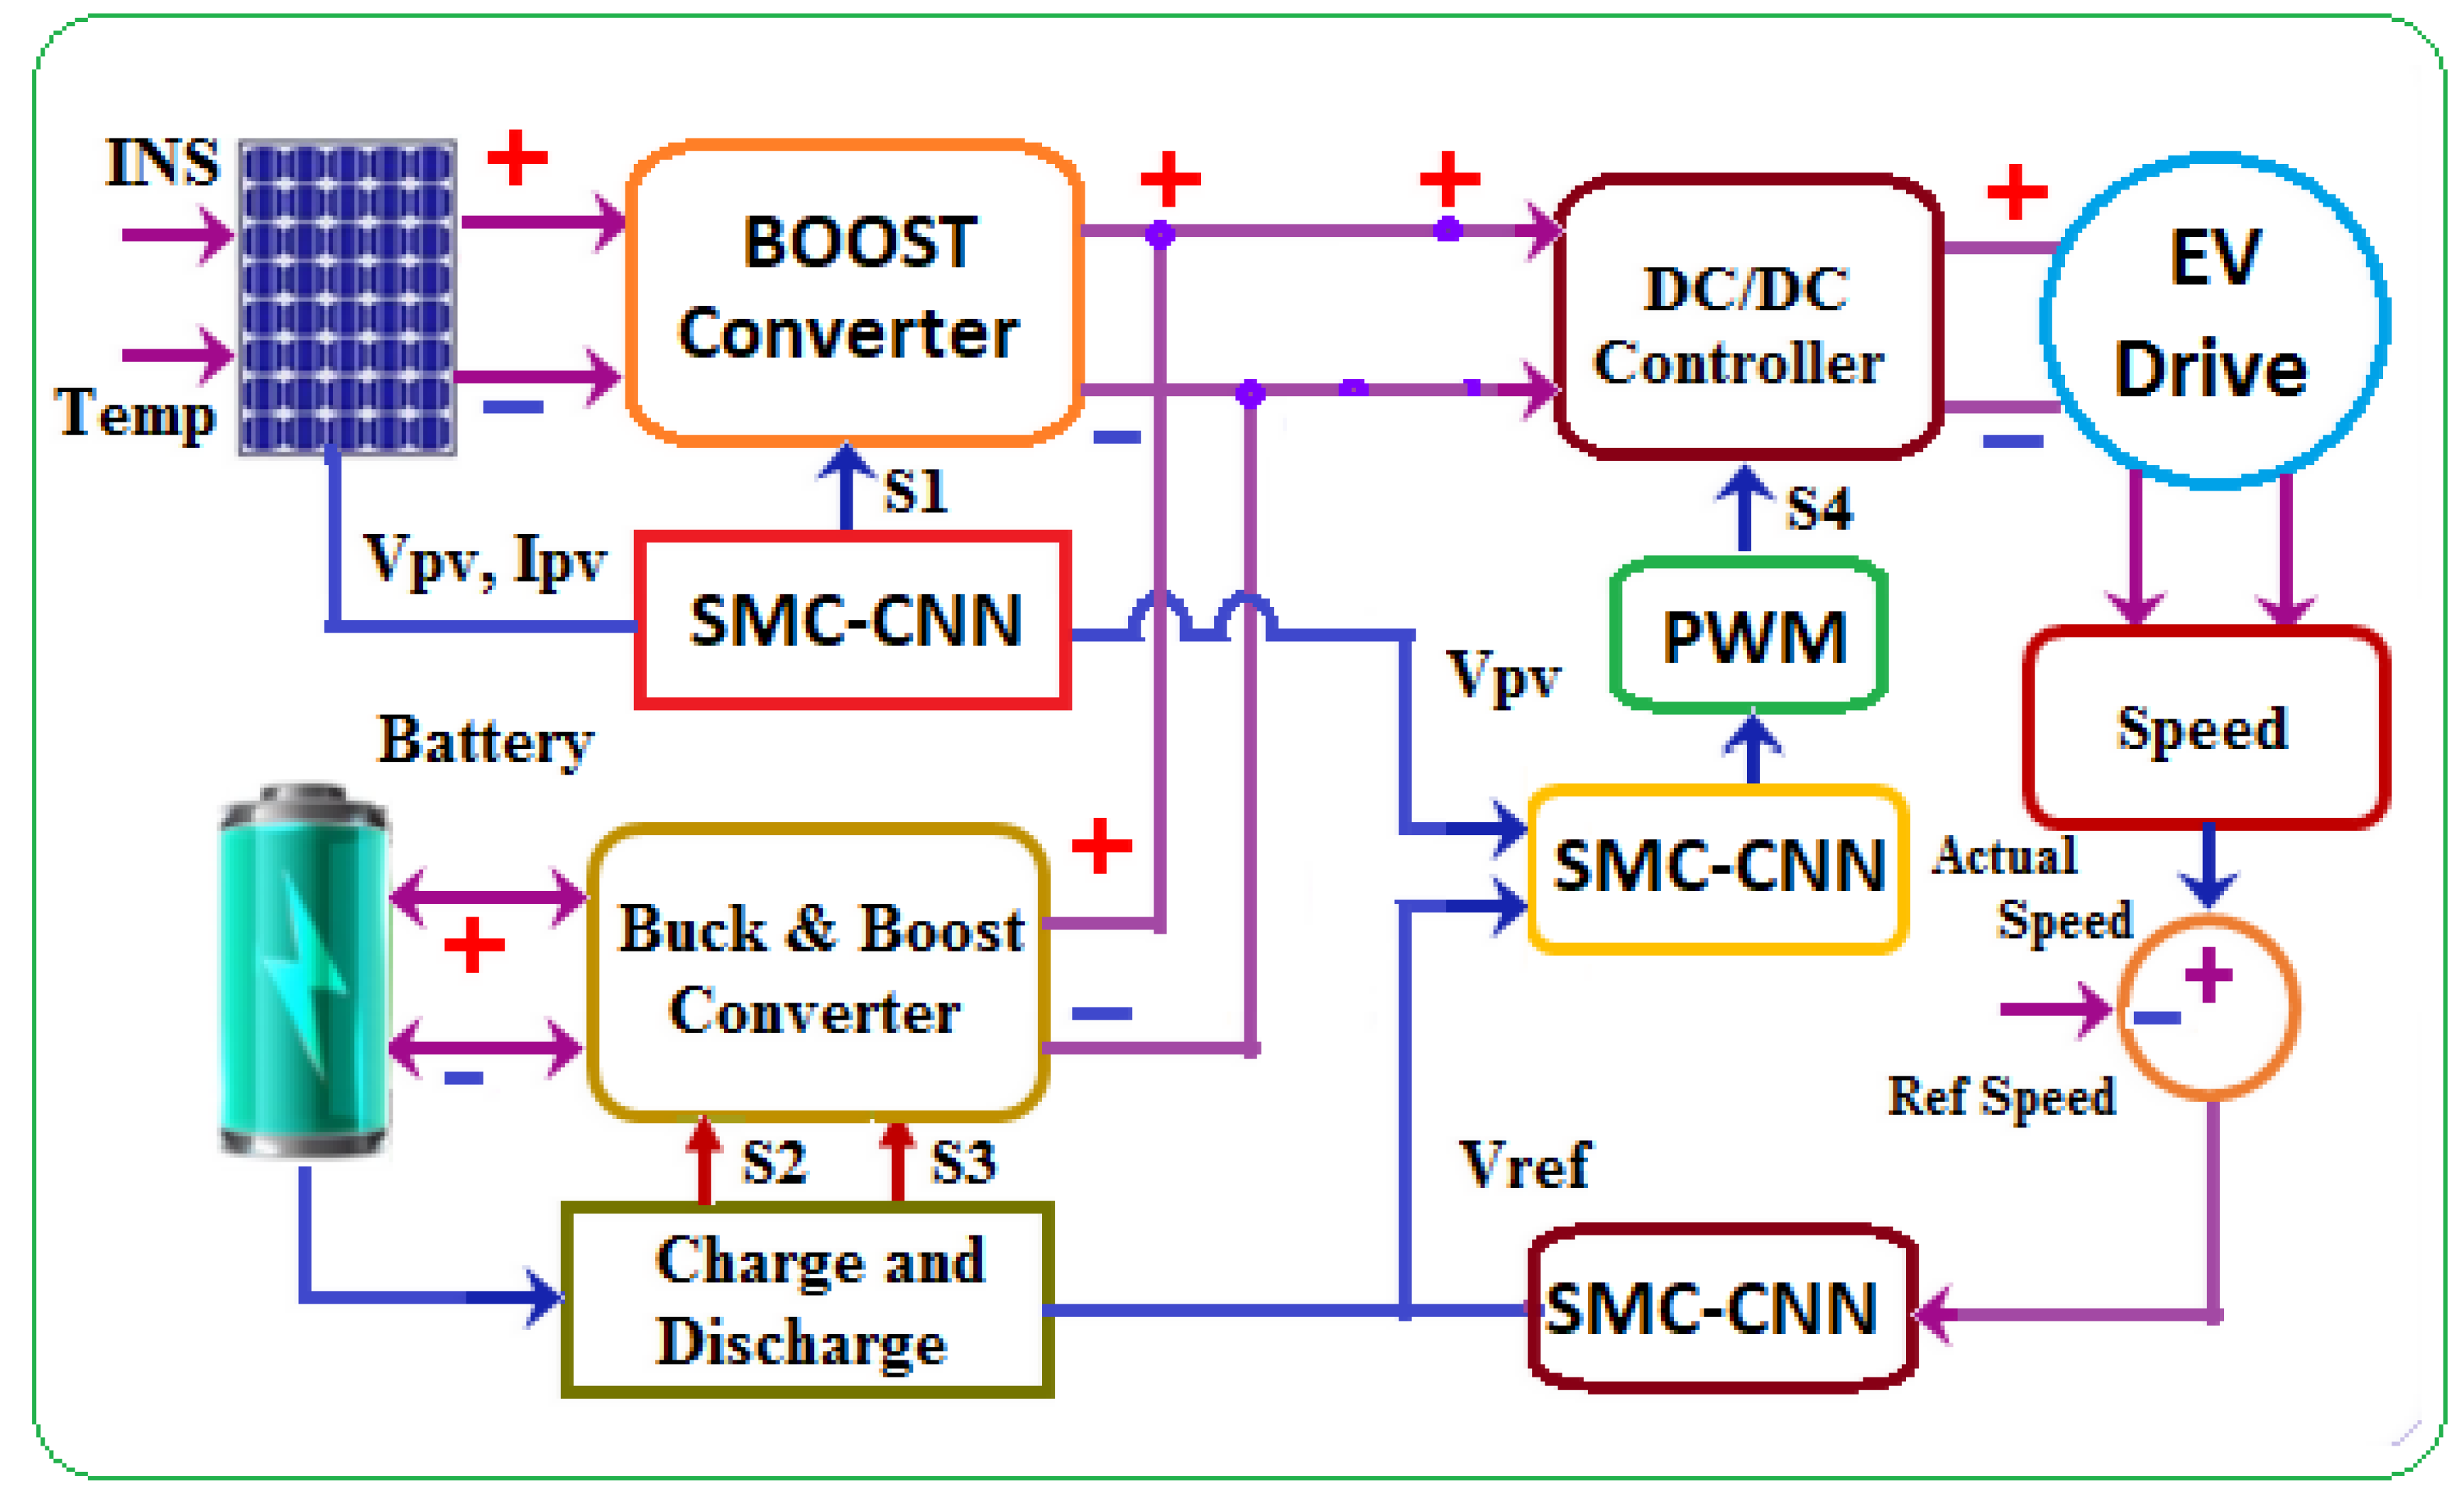
The
Figure 18 shows a power control system for off-grid EV drive applications, connecting the battery and PV arrays to the common DC drive load through separate converters. The photovoltaic (PV) array supplies electricity to both the direct current (DC) load and the battery during the charging process. Once the battery is fully charged, both the battery and PV arrays collectively provide power to the shared DC load. The text outlines battery charging and discharging conditions, power converter control in Mode1, Mode2, and Mode3 operations, and simulation results demonstrating dynamic system response during model changeover.
5. Experimental Verification
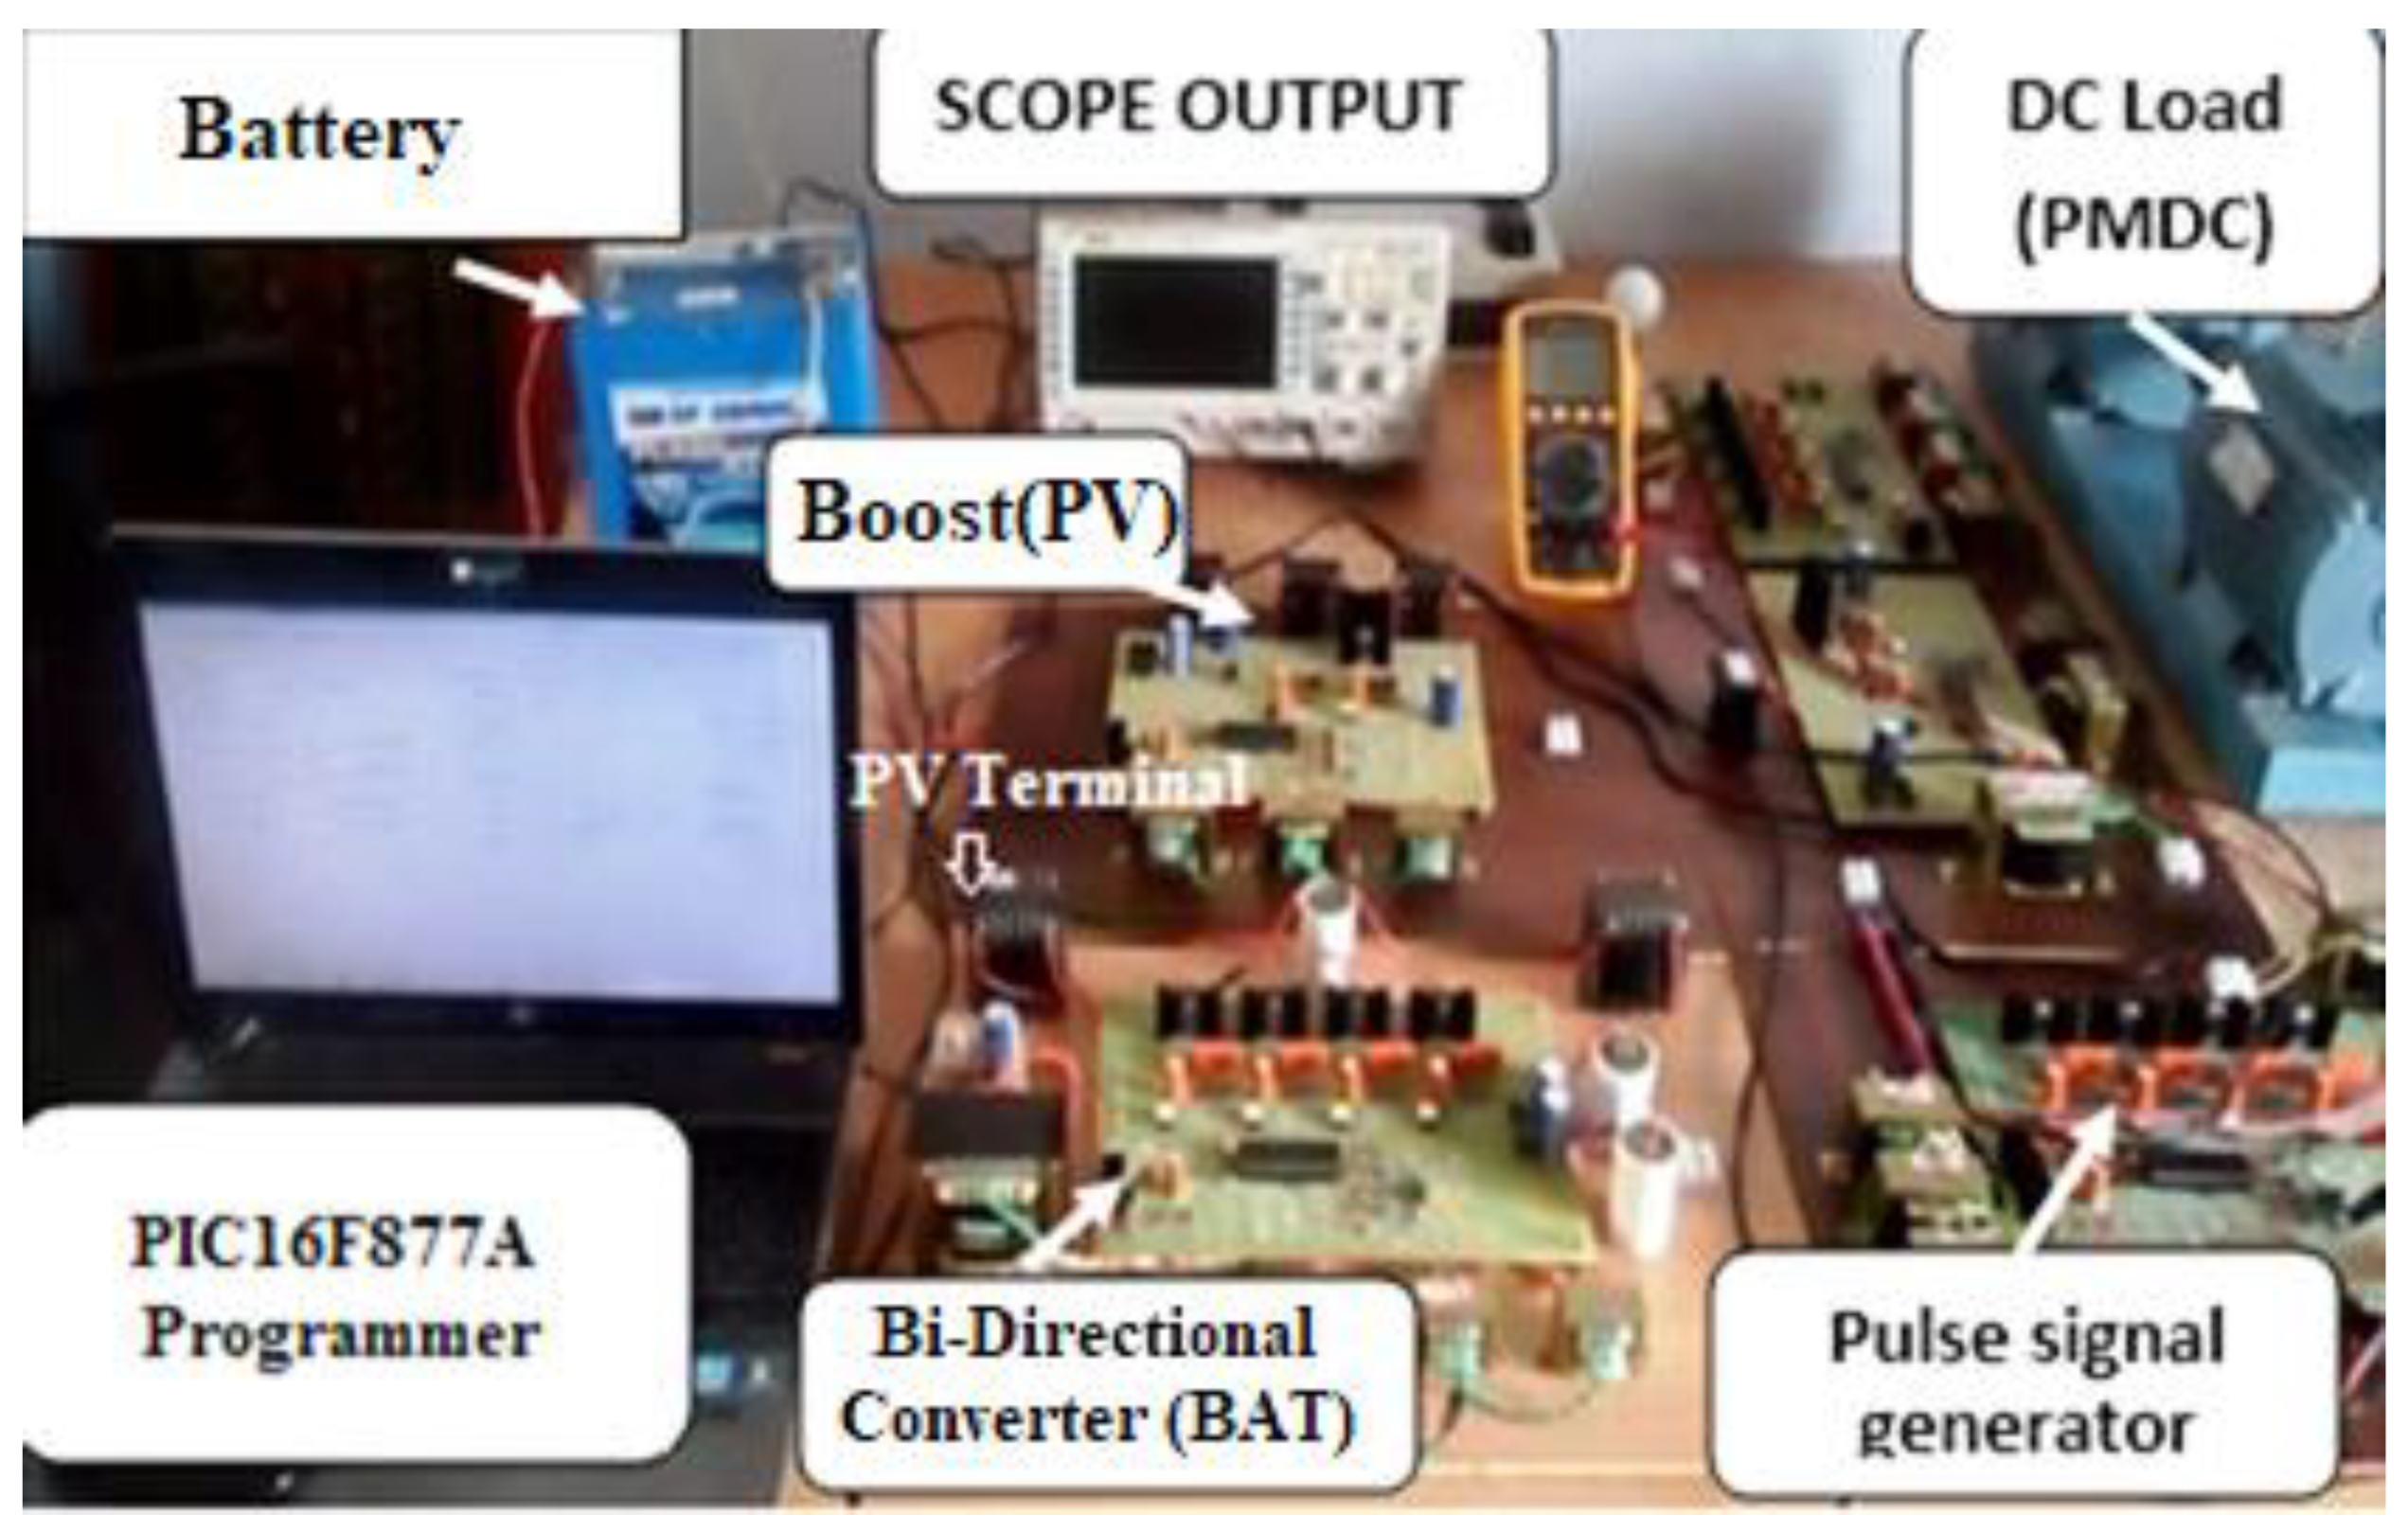
The proposed concept underwent assessment and a downsized experimental model was constructed. The created prototype satisfies the specified requirements. It incorporates a battery charging setup comprising two 12V and 35Ah batteries connected in series, with the experimental validation successfully conducted.
Figure 19 depicts a graphical portrayal of the proposed system.
The power electronics of a versatile power electronic prototype kit are equipped with open terminals, allowing for the integration of both the boost converter and bidirectional converter. The user has the flexibility to connect the power electronic switches and other components as needed. To ensure isolation between the control circuit and power circuit, the IC MCT2E is utilized for optical isolation.
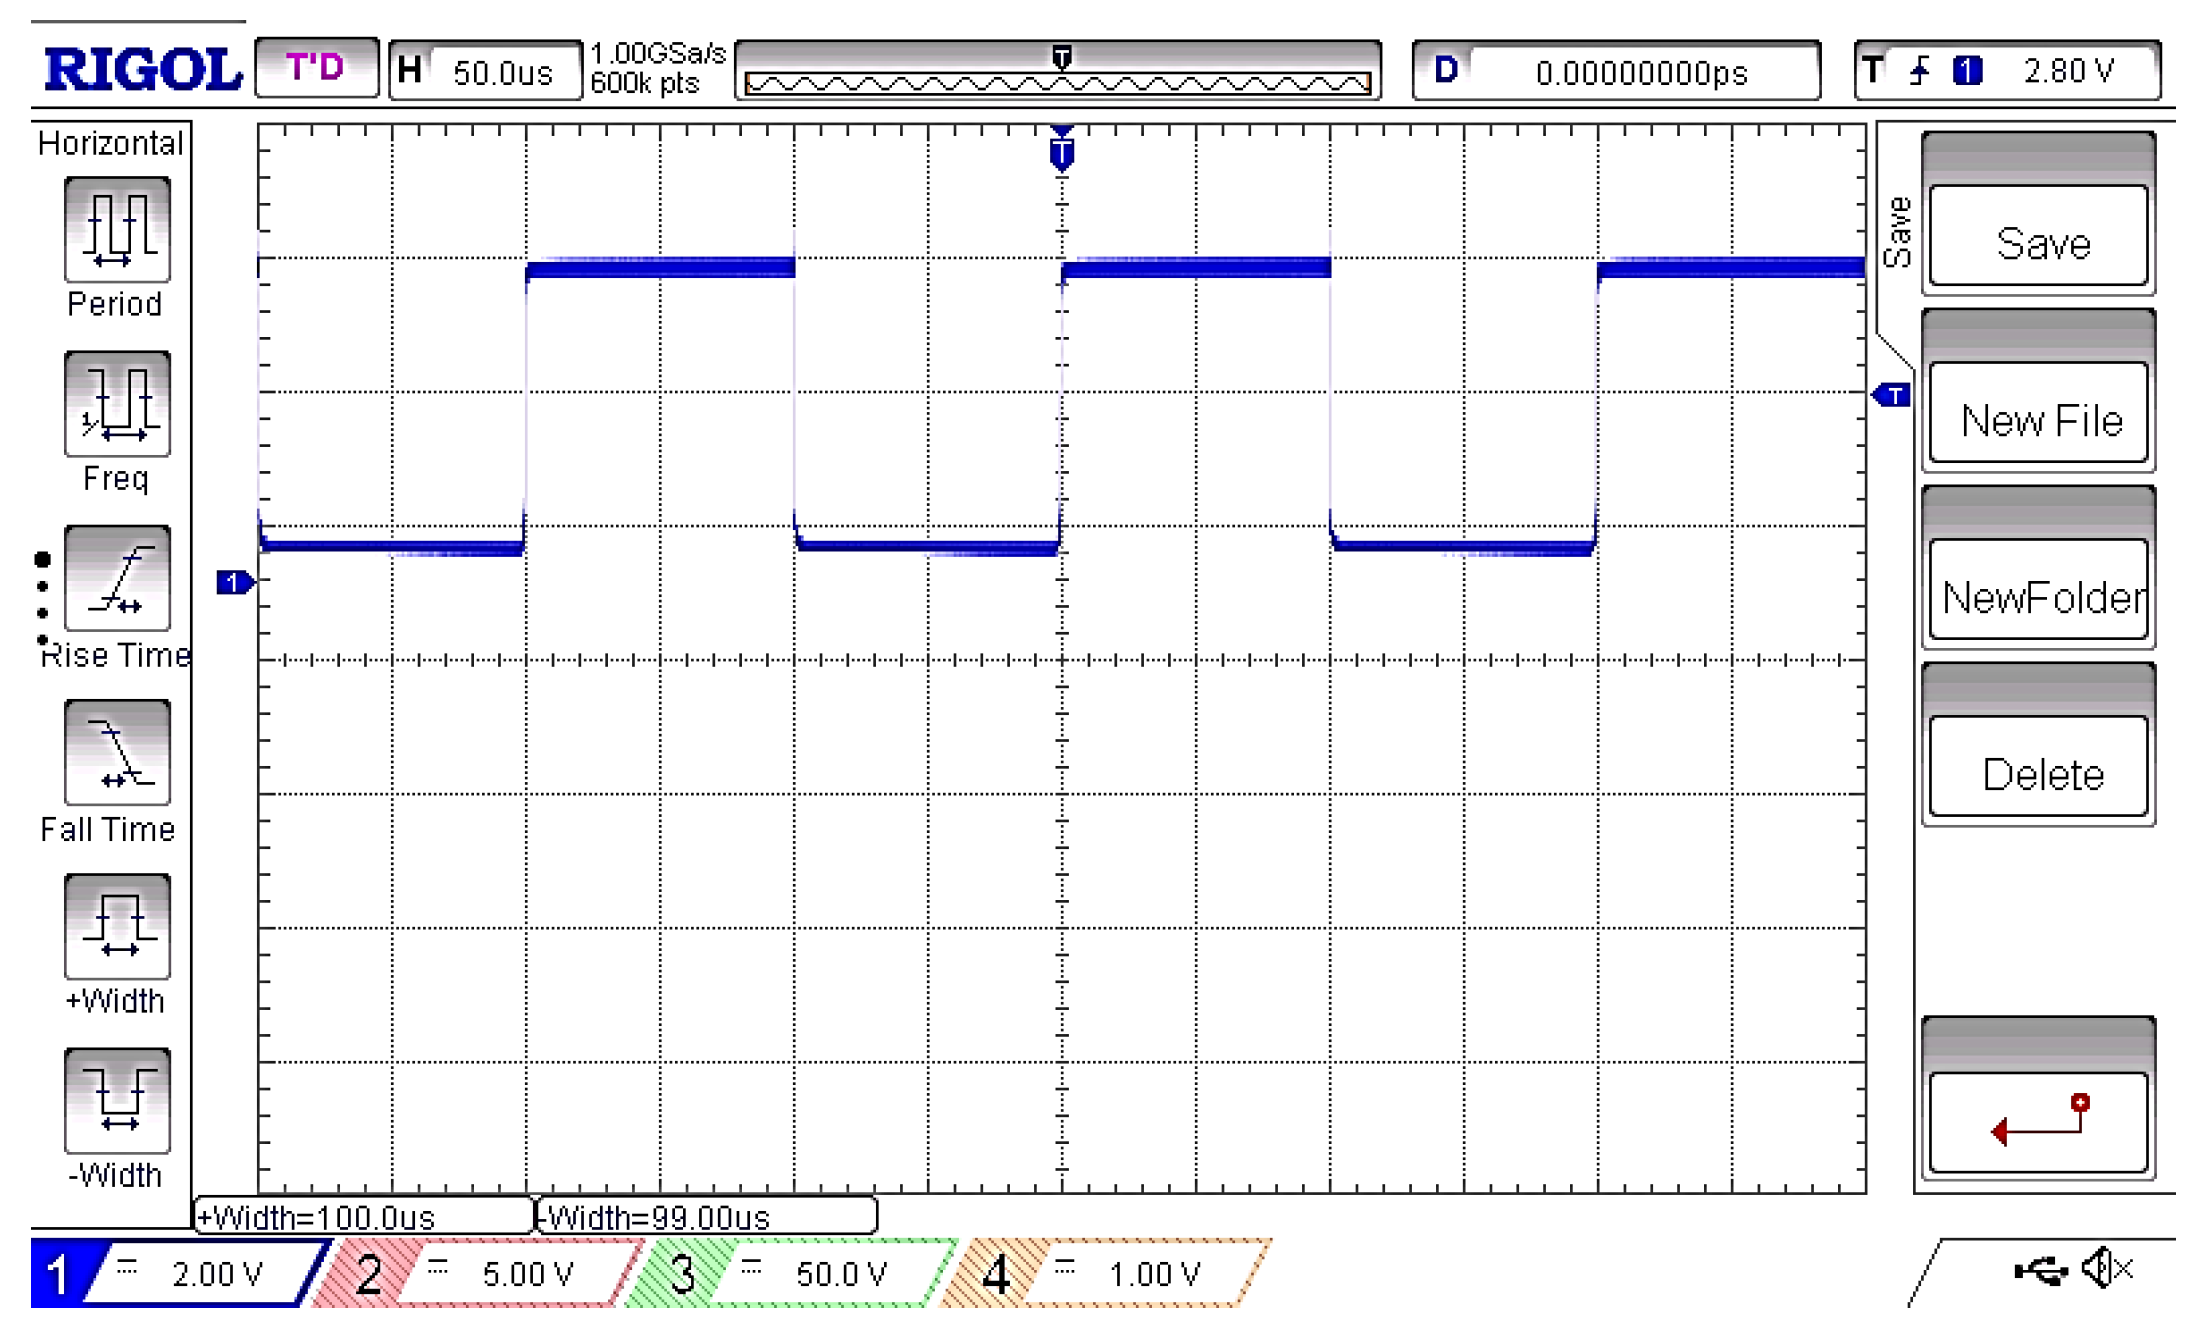
The MOSFET is controlled by the switching pulses illustrated in
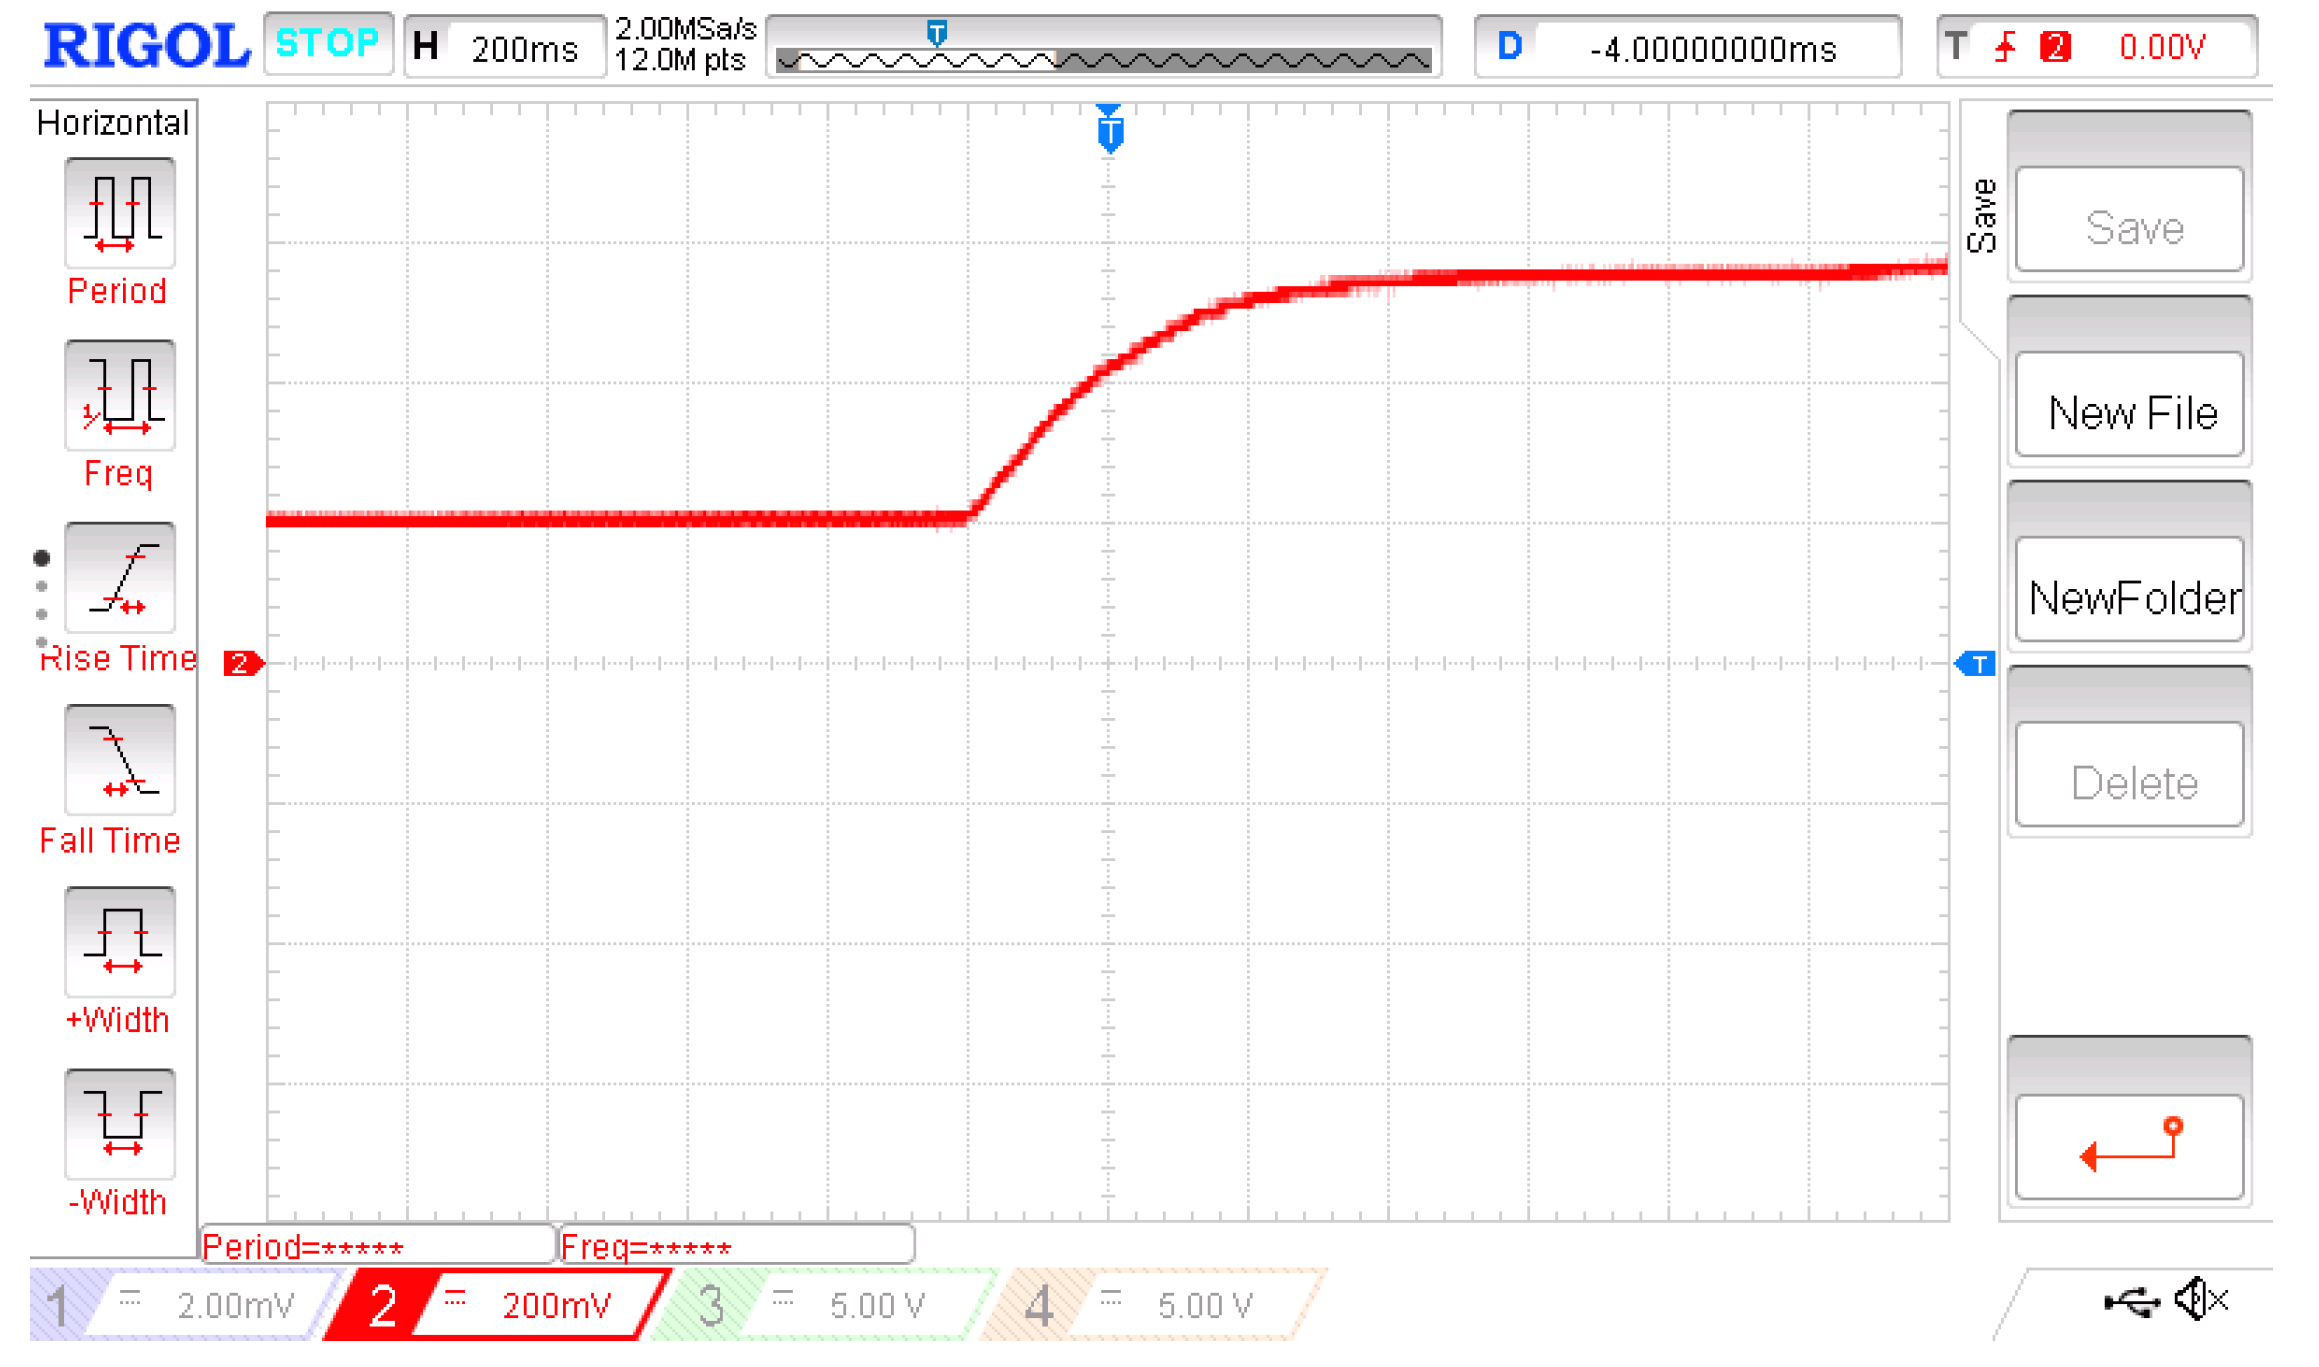
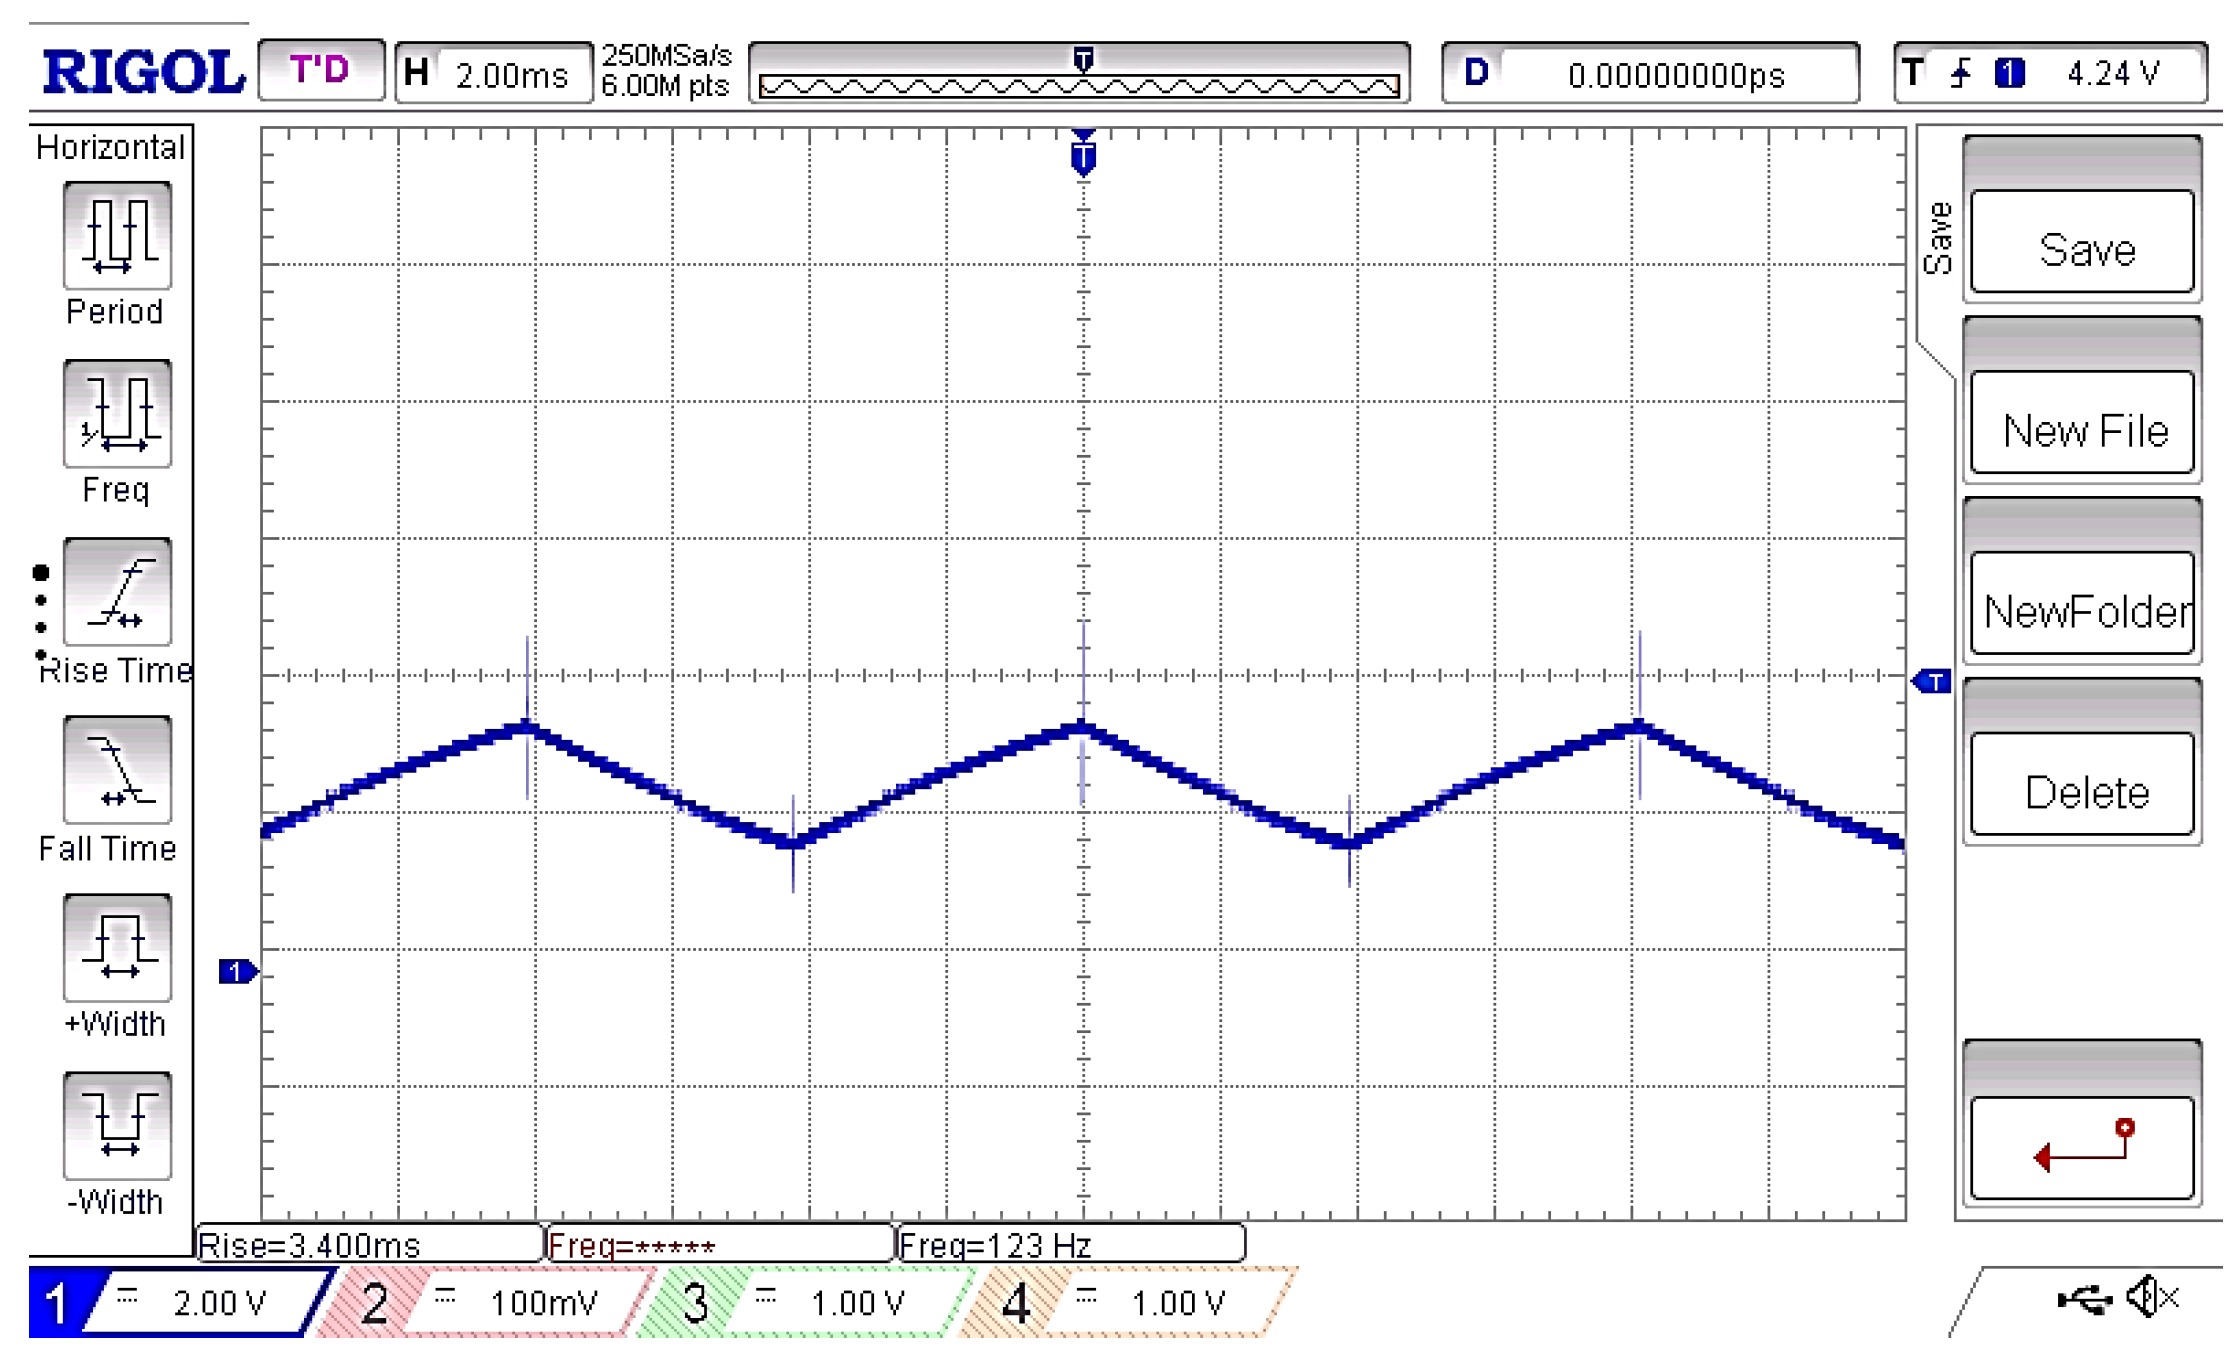
Figure 19. The Opto Isolator IC MCT2E facilitates the transmission of these switching pulses to the MOSFET gate. During the experimental procedure, the solar irradiance was modified from 200 w/m2 to 720 w/m2 using an artificial setup, resulting in the solar PV current depicted in
Figure 20. The SMC algorithm, integrated into the PIC 16F877A microcontroller, regulates the switching pulses shown in
Figure 21.
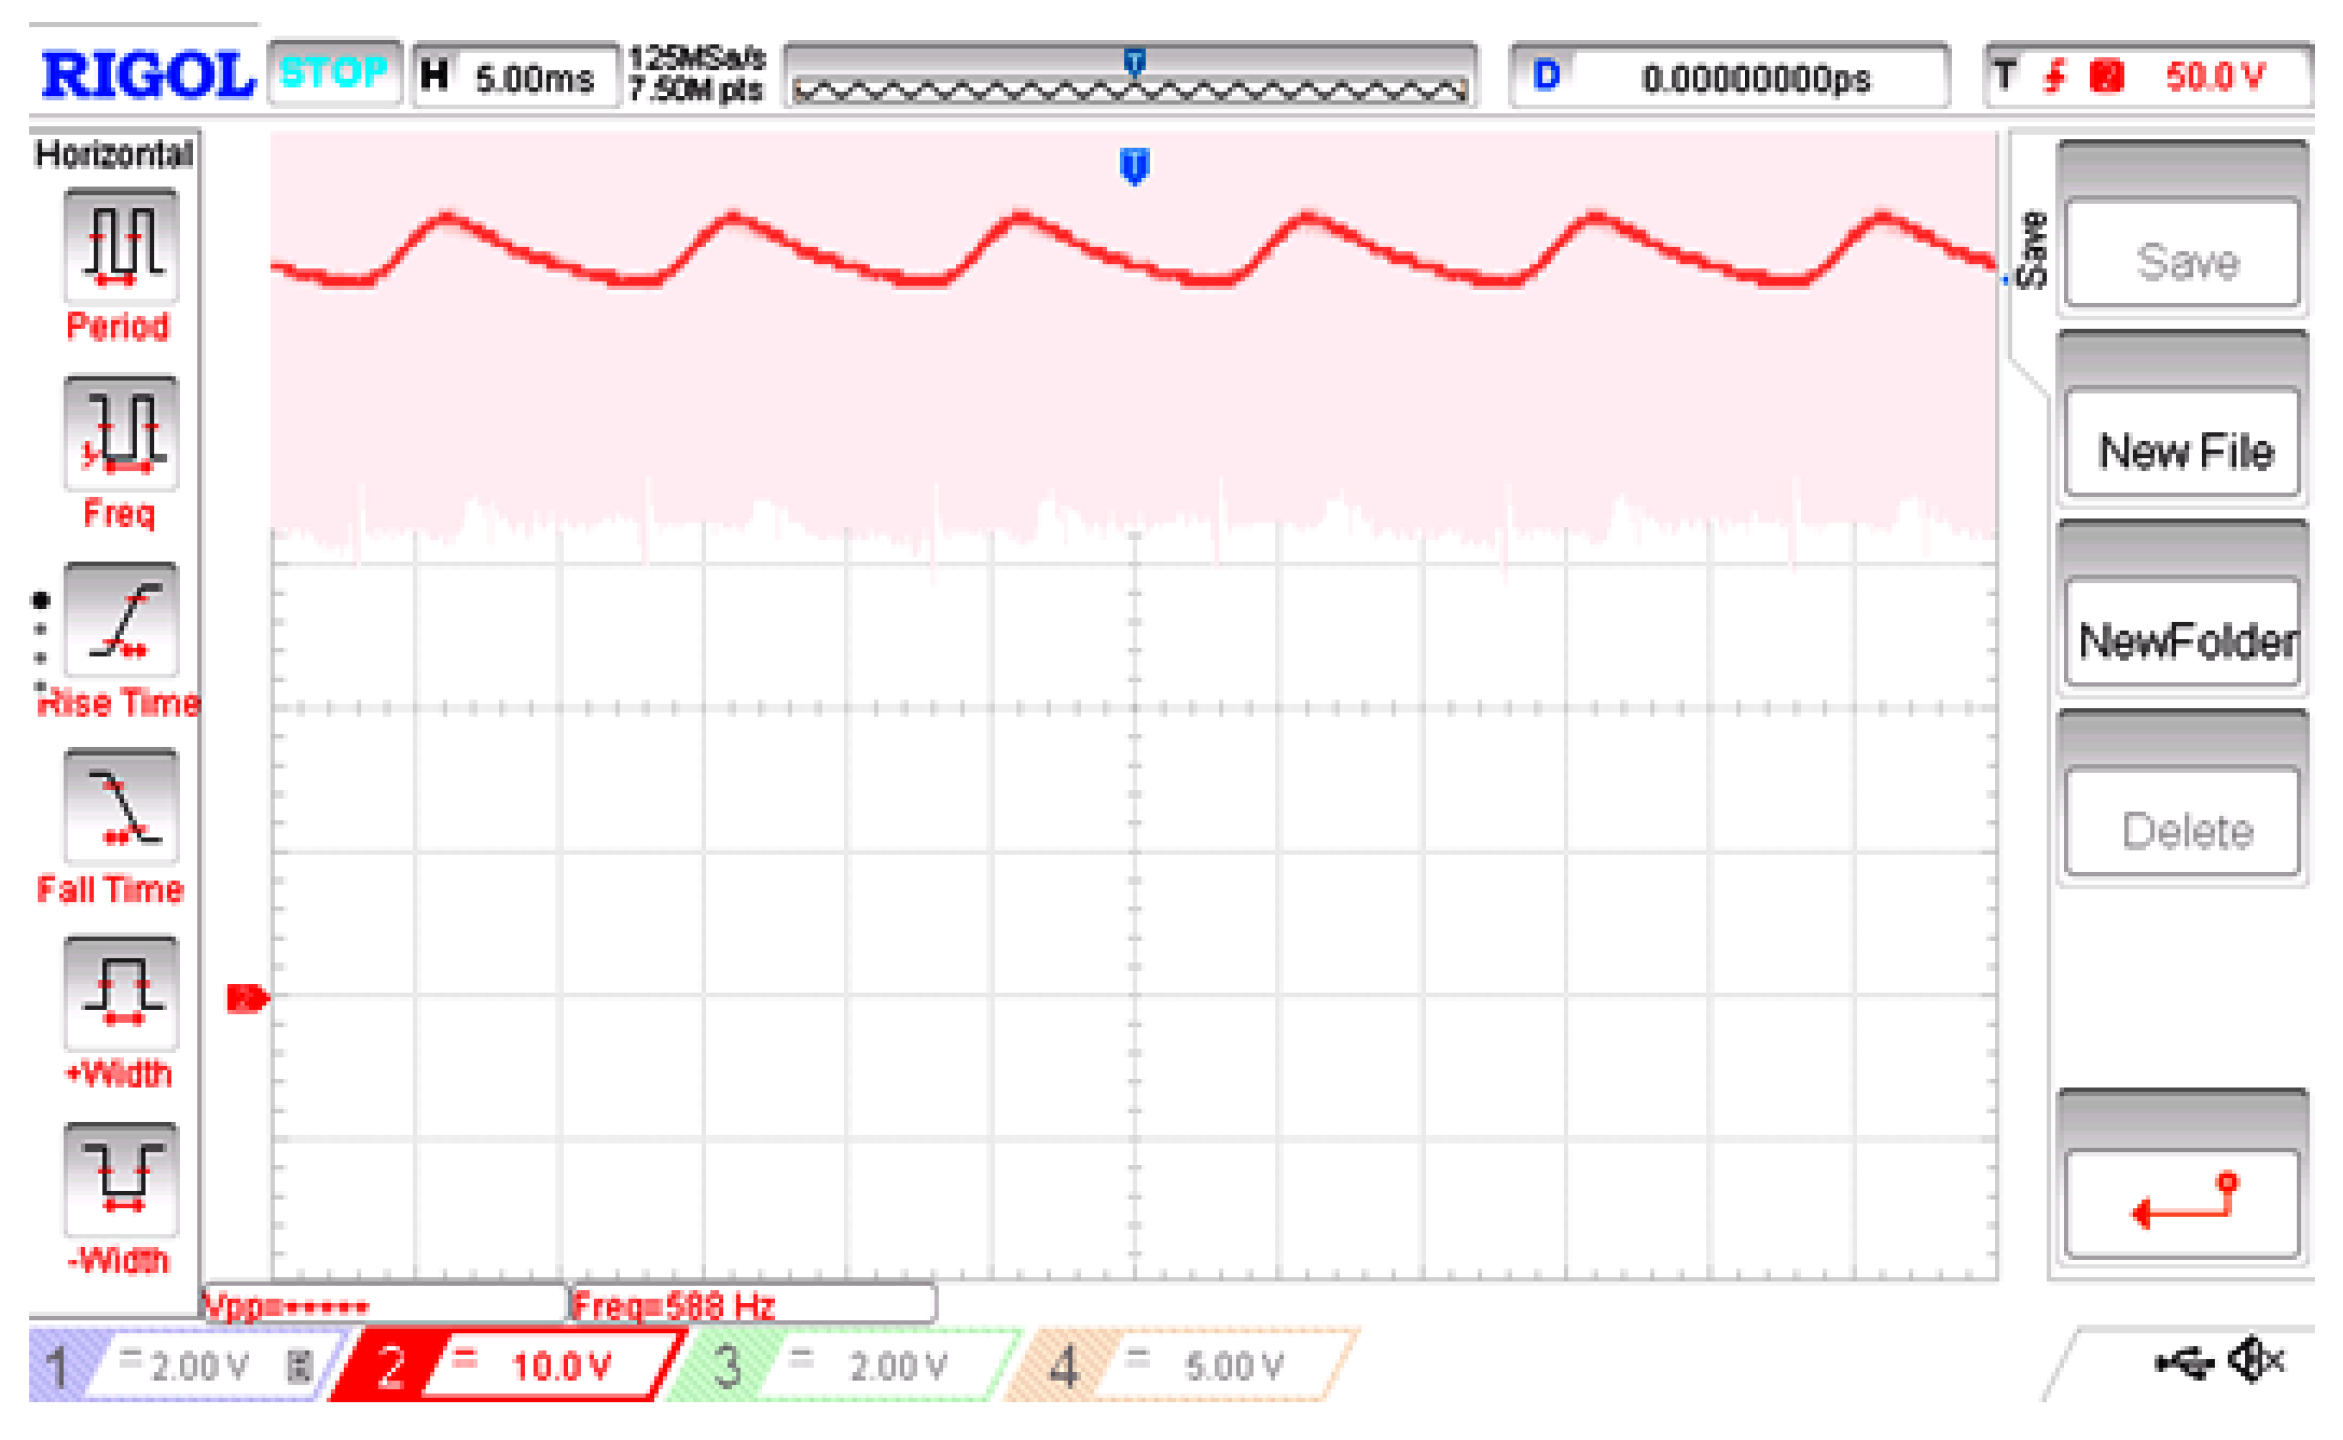
The abrupt alteration in solar irradiance has been noted to cause a rise in the DC link current, consequently boosting the power supplied to the EV drive for battery integration. The resulting current passing through the inductor (L) of the PV boost converter and the bidirectional battery is illustrated in
Figure 22 and
Figure 23, respectively.
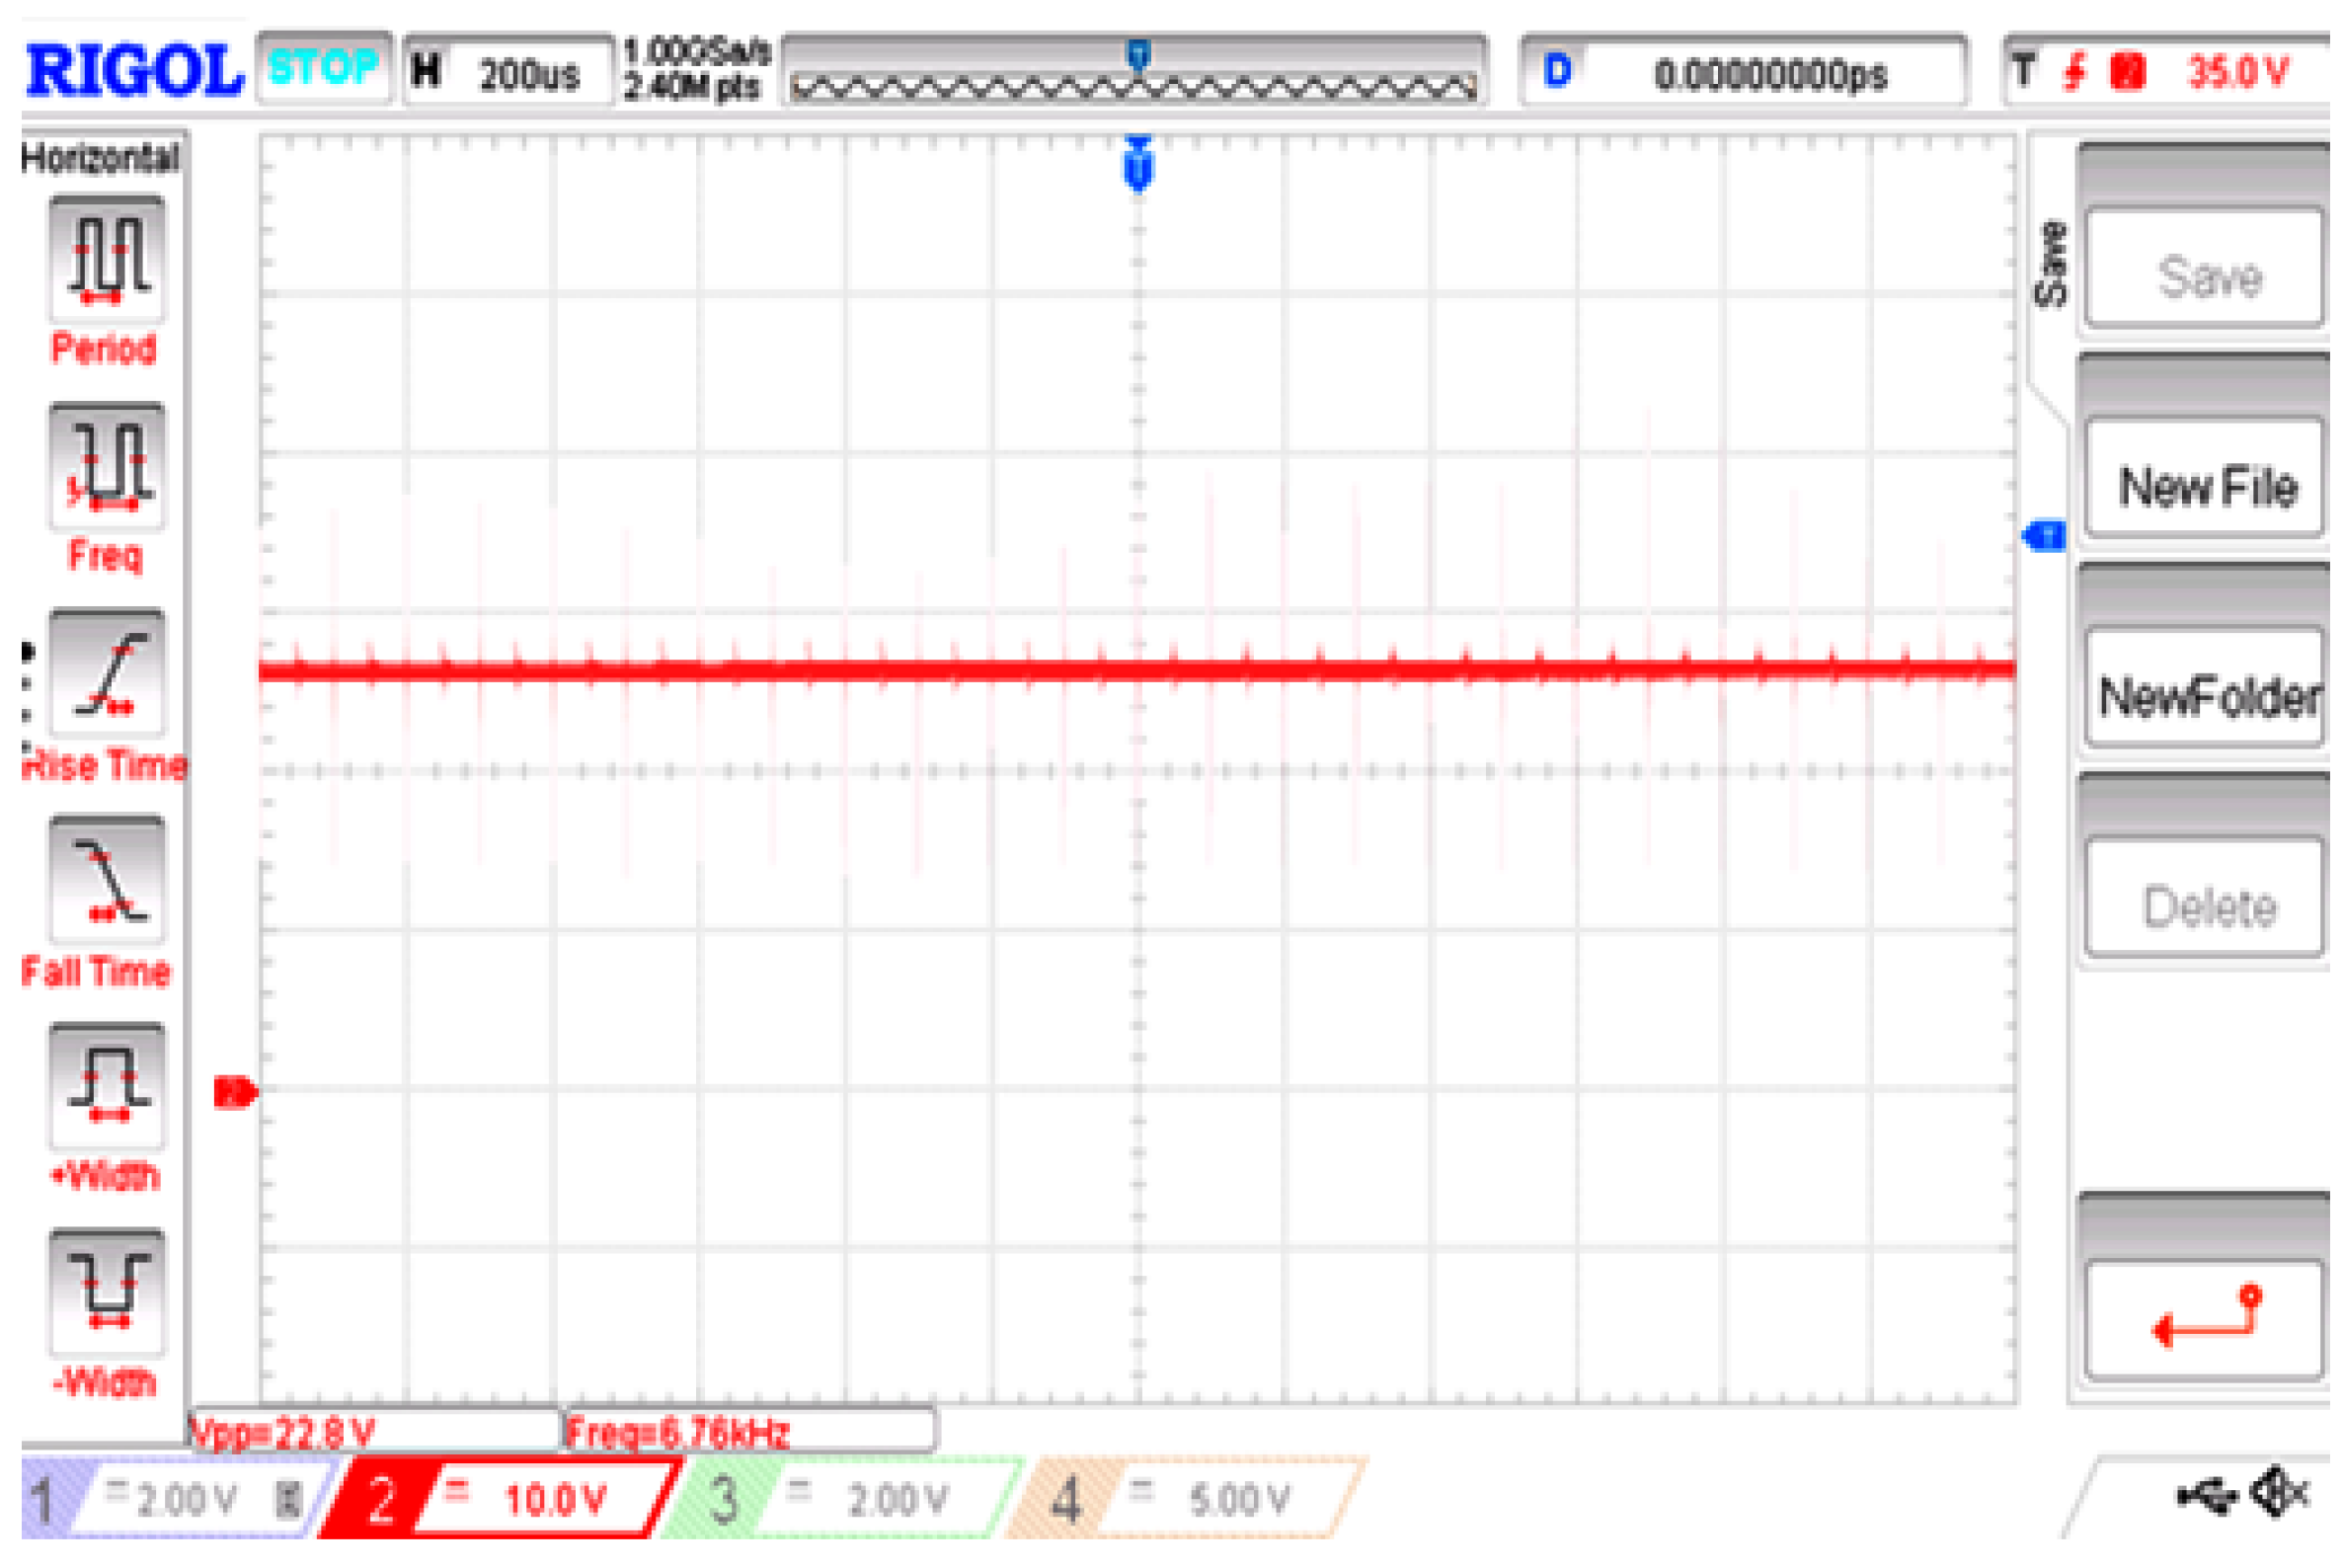
Figure 24 and
Figure 25 depict the PV voltage and battery voltage across the MOSFET of both the boost and bidirectional converters.
The prototype incorporates a PIC16F877A microcontroller, which allows for the attenuation of input and output voltages and currents. To power the microcontroller and the opto couplers, a DC power supply is obtained from separate 230 V/9 V transformers. It is important to note that the DC supplies for the opto couplers are unregulated, while the microcontroller receives a controlled 5 VDC power supply. The control programmer’s hex codes are generated in a C language programming environment after establishing the necessary wiring configuration based on the specific application requirements.
