1. Introduction
In recent years, the worldwide demand for milk has been risen as it has high nutritional value for children and adults (Montgomery et al., 2020). Specifically, within thirty years, milk production in the world has boosted from 522 million tons in 1986 to 798 million tons in 2016 (i.e., 53% increase) (FAO, 2018). Due to such a considerable growth of milk production, and, close relationship of industry of dairy products with the health of humans, the focus and concern on the safety and health of milk (and also all its products) has been increased as well. As a result, the attribute of safety throughout the dairy supply chain has been highlighted and success in fulfilling this attribute is considered to be one of the most important indicators reflecting performance of a dairy supply chain (Rubio et al., 201; Wu et al., 2018; Paraffin et al., 2018; Hassan et al., 2021; Mao et al., 2023; Qian et al., 2023).
With reference to the literature on systems engineering, the attribute of safety is defined as a system capability of avoiding harm to the environment and people (Wasson, 2015; Buede & Miller, 2016). The attribute of safety in a system is considered to be a system characteristic and closely related to some other characteristics of the system, especially the system reliability (Wasson, 2015). In fact, the system reliability characteristic is considered to be a prerequisite for realizing the attribute of system safety (Blanchard et al., 1990; Wasson, 2015). From perspective of systems engineering, reliability of a system is a non-functional system requitement and reflects the probability of a system performing its function under certain conditions without any failure for a specified period of time (Sarkar, 2016; Ozkan & Kilic, 2019; Mollajan et al., 2023). Both system reliability and safety are crucial system characteristics that can accurately predict future system behaviours, particularly in cases where the system's complexity level is high (Azadeh et al., 2015; Kabir and Papadopoulos, 2018).
Therefore, in order to effectively meet the safety requirement for a dairy supply chain, it is essential that the characteristic of reliability is fulfilled successfully throughout the chain. To this end, a reliable supply chain management is required. By definition, a reliable supply chain management considers effects of disasters at different levels, tries to successfully satisfy the reliability attribute in a supply chain, and adopt appropriate measures required to effectively deal with the undesirable influences (Diabat et al., 2019).
According to the literature on reliability in the supply chain, there are several definitions for this concept. Katsikeas et al. (2004) defined reliability in the supply chain as a dimension that encompasses various quality items such as delivery reliability, satisfactory order processing, the ability to keep promises, and communication-related items like regular communication, supplier believability, and honesty. Raut et al. (2019) described reliability in the supply chain as being well-maintained from the beginning of the production process through each level of activity within the chain, including loading, unloading, material handling, storage, transportation, and distribution of fresh food at the customer end. Lukinskiy et al. (2014) surveyed the concept of reliability in the supply chain and referred to it as the property of maintaining all characteristics of the supply chain and its links/elements within established values, such as faultlessness, durability, restorability, and conceivability. These values characterize the supply chain's ability to perform all of its functions in specific conditions in accordance with the terms of contracts between parties. Adenso Diaz (2012) described reliability in the supply chain as the probability that all required materials and products flowing through a supply network will arrive at their destination within a specified interval under stated conditions.
However, the literature on the dairy supply chain lacks significant efforts to clarify the notion of reliability. This study defines the reliability of a dairy supply chain as the ability to meet the needs and requirements of customers for dairy products in terms of targeted quantity, quality, timeliness, and health standards. By focusing on the reliability of the dairy supply chain, this study aims to evaluate its performance, as reliability is considered one of the most essential and informative indicators of the chain's overall performance as a system (Laura et al., 2007; Najmi and Makui, 2010; Motevali Haghighi et al., 2016; Sufiyan et al., 2019). In this regard, as a dairy supply chain may have several layers of complicated interconnected activities (Tavana et al., 2013), this research is not to only study the final inputs and outputs but to consider the internal activities and relationships between customers, manufacturers, and suppliers as well.
Commonly, in order to evaluate performance of a supply chain, the multi-criteria decision making (MCDM) methods are employed. In fact, by scoring and prioritizing a set of appropriate indicators, performance of the supply chain of interest is quantitatively measured and evaluated (Najmi and Makui, 2010; Chen et al., 2012; Büyüközkan and Güleryüz, 2016; Paradowski et al., 2021). However, due to some uncertain operational conditions that often originate from human judgment, and hence, inaccuracies and ambiguities which are mostly experienced in human interpretations, clear and crisp numbered data may not be available, and consequently, a proper description of the chain (i.e., the system of interest) may not be possible either (Shen et al., 2013). That is, some degree of vagueness may be experienced. In order to overcome this vagueness and ambiguity, many researchers adopt the fuzzy logic approach. In fuzzy logic, the main concept is the ability for objects to have partial membership in multiple subsets of the universal set rather than exclusively belonging to a single set (Gupta, 2015; Arab et al., 202). This involves considering the uncertainties involved in the decision-making process by developing appropriate fuzzy sets (Pourjavad and Shahin, 2018; Mina et al., 2021). That is, to evaluate performance of a supply chain, the fuzzy logic is incorporated into the MCDM methods (Kannan et al., 2009; Büyüközkan and Güler, 2021).
Employment of fuzzy-based MCDM models may include a large number of calculations required to be carried out for the purpose of pairwise comparisons (Orji and Wei, 2015; Pourjavad and Shirouyehzad, 2014; Pourjavad and Shahin, 2018). Therefore, employment of such an approach may lead to more difficulties in analysing the problem of evaluating performance of a (dairy) supply chain. In order to avoid these more difficulties but deal effectively with the vagueness that may often be with the values of criteria, the present study proposes utilization of the ‘Fuzzy Inference System’ (FIS), as an important fuzzy rule-based tool developed in supply chain management (Aqlan and Lam, 2015; Khan et al., 2018).
Therefore, since the present study focus is on the characteristic of reliability as a crucial characteristic for evaluating the performance of dairy supply chains, this study utilizes reliability indicators along with the Fuzzy Inference System (FIS) approach to address potential vagueness in the performance evaluation process. The specific objective is to evaluate the reliability of a dairy supply chain utilizing the FIS methodology. Moreover, as failure of a dairy supply chain may have some considerable negative effects on health of public, the present study evaluates the reliability characteristic at each level (supply, manufacturing, and distribution) of a dairy supply chain. Following this analysis, reliability of the entire chain is calculated integrately by applying the FIS outputs and the theory of reliability engineering.
In this groundbreaking study, the present study offers a multifaceted approach to enhancing reliability within the dairy supply chain, addressing critical gaps identified in existing literature. The main contributions of this study stand at the forefront of supply chain management innovation, presenting a novel and comprehensive definition of reliability specifically tailored to the intricacies of the dairy industry. Delving deeper, this study meticulously identifies and analyzes the factors influencing reliability across various levels of the dairy supply chain, spanning 'Supply', 'Manufacturing', and 'Distribution'. This holistic perspective allows for unparalleled insights into the mechanisms driving reliability within each segment of the supply chain. Moreover, the utilization of Fuzzy Inference Systems (FIS) in this study represents a paradigm shift in reliability assessment methodology, enabling more accurate and actionable results with ease. By leveraging cutting-edge technology and a nuanced understanding of supply chain dynamics, this studypioneers new pathways for optimizing reliability within the dairy sector, with far-reaching implications for industry practitioners, researchers, and stakeholders alike.
This paper is organized as follows:
Section 1 provided the introduction.
Section 2 presents an overview of relevant background materials and related works.
Section 3 outlines the methodology proposed in this study, while
Section 4 presents an application of the proposed methodology. Lastly,
Section 5 summarizes and discusses the findings and offers directions for future work.
2. Background and Materials
2.1. Reliability of a Supply Chain
A supply chain refers to the network of individuals or entities participating in the various stages of a product or service's life cycle (Khan et al., 2016; Wang et al., 2023). Based upon the definition earlier presented to clarify the concept of ‘reliability’, ‘reliability of a supply chain’ is the probability of the chain performing its function under certain conditions without any failure for a specified period of time. In practice, it may be so difficult to always design and develop supply chains with high reliability, however, chains with more reliability are always preferred (Ozkan and Kilic, 2019). Design of reliable chains usually involves conflicting objectives (e.g., lowest cost against highest reliability) (Marseguerra et al., 2005). Corresponding to structure of a chain, the respective mathematical formula on which the supply chain reliability, R
Sc (q), can be computed is presented in
Table 1. Regarding each formula, it is noted that R
i (q) represents the reliability of i
th component in the concerned supply chain.
2.2. Fuzzy Inference System
In 1965, Zadeh proposed the theory of fuzzy sets to deal with the uncertainty that may often be experienced in the real-world phenomenon by using formulas and mathematical modelling (Xu et al., 2021). This theory is capable of resolving the inherent ambiguity between human judgments and mental concepts in decision making problems (Xu et al., 2021; Khan et al., 2018).
Each member of the fuzzy set is characterized by a membership function, MF. MF is an important component of fuzzy logic and makes it critical to select the type of MF utilized in the system of interest (Ghorbani et al., 2013; Majumdar et al., 2021.; Shayganmehr et al., 2021). The most common and widely used fuzzy MFs are ‘Triangular’, ‘Gaussian’, and ‘Trapezoidal’ MFs. Each membership value, μ (x), lies in the interval [0,1] where the value ‘1’ indicates that the membership is complete while the value ‘0’ indicates that the membership is incomplete. Unlike the classical set theory, if the degree of membership, μA (x), has a value between 0 and 1, it is then concluded that x partially belongs to the fuzzy set A (Zadeh, 1965; Zimmermann, 1991; Asses Awan and Ali, 2019).
The ‘Triangular Fuzzy Number’, TFN, is a useful MF which is widely used compared to other common MFs, due to its direct computation and accuracy. This MF consists of three ranges: lower limit (l), middle limit (m) and upper limit (u). MF of the TFN is defined according to Equation (1) (Majumdar et al., 2021; Ghorbani et al., 2013; Shayganmehr et al., 2021);
A fuzzy expert system is developed to make a sound decision according to IF-THEN rules. The input of these rules is pillared upon both knowledge of experts and knowledge elicited from the literature (Fasanghari & Montazer, 2010).
Figure 1 displays the main components of an expert system (Mahanta & Panda, 2020);
Generally, the most famous fuzzy logic modelling techniques can be classified into three classes: ‘the Takagi–Sugeno–Kang models’; ‘the relational equation models’; and ‘the linguistic models’ (Mamdani type) (Mamdani & Assilian, 1975). In this regard, it is important to note that antecedents and consequences in linguistic models are fuzzy sets while the antecedent of Takagi-Sugeno-Kang models is fuzzy sets but the consequence includes linear equations (Pourjavad and Shahin, 2018).
2.3. Relevant Works and Gap Analysis in the Literature
As this study is interested in evaluation of reliability in dairy supply chains, works and researches carried out in three areas of ‘reliability in a supply chain’, ‘FIS in a supply chain’, and ‘dairy supply chains’ are addressed to be reviewed.
With respect to the concept of reliability in a supply chain, Katsikeas et al. (2004) examined supply chain reliability and identified several key factors that could affect it. These factors included qualitative indicators such as ‘order processing satisfaction’, ‘promise-keeping ability’, and ‘delivery reliability’, as well as communication-related factors like supplier honesty and believability, and regular communication. Lukinskiy and et al. (2014) defined reliability as the ability to maintain all characteristics of the supply chain and its links/elements at established values. These values include durability, faultlessness, conceivability, and restorability. They play a crucial role in determining the supply chain's ability to perform all tasks in a concrete manner, according to the terms outlined in the contract agreed upon by the parties involved. In addition, many of researchers addressed the concept of reliability in cold chains. In this regard, to estimate the probability of a risk that may happen in a complex supply chain, Zaitsev (2012) defined the reliability of the supply chain using the quantity and rate of the supply and actively utilized the theory of structural reliability. Adenso-Diaz et al. (2012) provided a verbal definition for supply chain reliability instead of a mathematical one. They defined it as the probability that all products and required materials flowing throughout the supply network can reach their intended destinations within a given distance and specified conditions. Taghizadeh and Hafezi (2012) modelled the probability of a risk in a supply chain as a reliability function. The developed models are consistent with the structures of the concerned supply chains. They also proposed a method based upon the developed model to accurately evaluate reliability of a given supply chain. He et al. (2016) developed a two-stage logistics supply chain (LSSC). Ha et al. (2018) also provided mathematical functions based upon the traditional reliability theory, mathematical definition of supply chain reliability, and basic structural reliability models for different types of supply chains. Raut et al. (2019) proposed a methodology to resolve the problem of food losses in fruits and vegetable supply chain. They clarified the attribute of reliability as protection of the production process in every stage of the supply chain (i.e., unloading, loading, transportation of materials, storage, and delivery of fresh food to the customer). Ozkan and Kilic (2019) presented a Monte Carlo simulation to estimate the reliability of a concerned supply chain. Zhang et al. (2020) analysed the transition relationship between supply chain states. They introduced a supplementary variable method and developed a reliability model for a supply chain system by using partial differential equations. The most relevant research found in this field, article of Zarei-Kordshouli et al. (2023) is that designed a dairy supply chain network considering sustainability and resilience of suppliers. They used reliability as one of the sustainability indicators and results showed reliability and quality are the most important indicators of sustainability aspect. To address gap of literature
With respect to application of FIS in a supply chain, Pourjavad and Shahin (2018) used fuzzy inference system for evaluation of ‘Green Supply Chain Management (GSCM) performance according to green criteria. Jain and Singh (2020) proposed a two-phase decision-making model using Fuzzy Interference System (FIS) coupled with fuzzy ‘Kano’ philosophy to select sustainable suppliers for large-scale industry. Shayghanmehr et al. (2021) investigated different factors to assess sustainability of multi-tier supply chains using hybrid approach include of a fuzzy expert system and an experimental study. Then, exploratory factor analysis was used to determine the most effective factors and evaluate the broad dimensions of sustainability and recognize the importance of structures. In Ashtrinezhad et al. (2018) used fuzzy inference system and fuzzy DEMATEL for evaluation and categorization of the suppliers. Torun et al. (2011) described the ability of fuzzy inference systems for supply chain risk management.
Several articles have highlighted risk factors that contribute to the failure of dairy supply chains. For example, Gorton et al. (2006) demonstrated how market failure in Moldova was caused by asymmetric information between processors and farmers, and discussed how a dairy company tried to address this issue. Zubair and Mufti (2015) conducted a literature review to identify potential supply chain risks, which they organized into a risk breakdown structure. They then ranked these risks based on their probability and impact using a questionnaire, and classified them as high, medium, or low risk within the network. Reiner et al. (2013) investigated in-store logistics processes for transporting dairy products from receiving docks to supermarket and hypermarket shelves. The successful implementation of in-store logistics related to perishable and sensitive items like dairy products is critical to food retailers' sales, profits, and image. The importance of maintaining temperature control throughout the dairy supply chain is also mentioned in this article. Finally, Cannas et al. (2020) studied the changes in intermodal rail-road transportation in the dairy supply chain by conducting multiple case studies at different stages of the supply chain.
Sustainability has become a popular paradigm and has received significant attention in dairy supply chain research (Cannas et al., 2020). For instance, Bourlakis et al. (2013) evaluated the sustainability performance of the dairy product chain and its members using key indicators related to flexibility, efficiency, product quality, and responsiveness. Chari and Ngcamu (2017) studied how disaster risks affect Zimbabwe's dairy supply chains and suggested that both the private sector and government should prioritize investing in disaster reduction strategies to improve the sustainable and effective performance of these supply chains. Meanwhile, Jouzdani and Govindeh (2021) investigated the interactions and interrelationships among all three aspects of sustainability in the dairy supply chain.
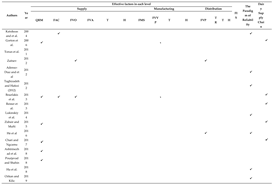
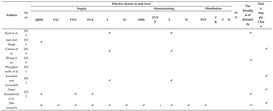
Table 2 provides a summary of the literature, which compares the features of the present study with those of previous studies.
According to
Table 2, the present study addresses the identified gaps in the literature on the dairy supply chains and is interested in analysing its reliability by extending a Fuzzy Inference System (FIS). The identified gaps in existing literature underscore critical oversights and untapped opportunities within the realm of dairy supply chain management:
A glaring gap emerges from the failure to comprehensively address the reliability of the dairy supply chain. While Zarei-Kordshouli et al. (2023) touch upon sustainability and resilience, their focus primarily veers towards these aspects, relegating reliability to a mere indicator for sustainability calculations. The present study recognizes reliability as a pivotal factor, filling the void by clearly defining and meticulously evaluating the reliability of this chain, thereby bridging a significant gap in the literature.
Despite the well-established utility of fuzzy inference systems in diverse fields such as sustainability and green supply chains, their potential remains untapped in assessing the reliability of supply chains, particularly within the dairy sector. The present study breaks new ground by harnessing the power of fuzzy inference systems to precisely gauge the reliability of the dairy supply chain, paving the way for innovative and accurate assessments previously unexplored in the literature.
Another notable gap lies in the insufficient attention paid to risk factors and failures across all levels of the dairy supply chain, leaving it vulnerable to potential collapse. Existing studies predominantly focus on distributors, neglecting the possibility of failures at other critical stages. The present study fills this void by comprehensively analyzing risk factors and failures across all levels of the dairy supply chain, shedding light on overlooked vulnerabilities and offering proactive strategies to mitigate risks and enhance resilience.
3. Methodology
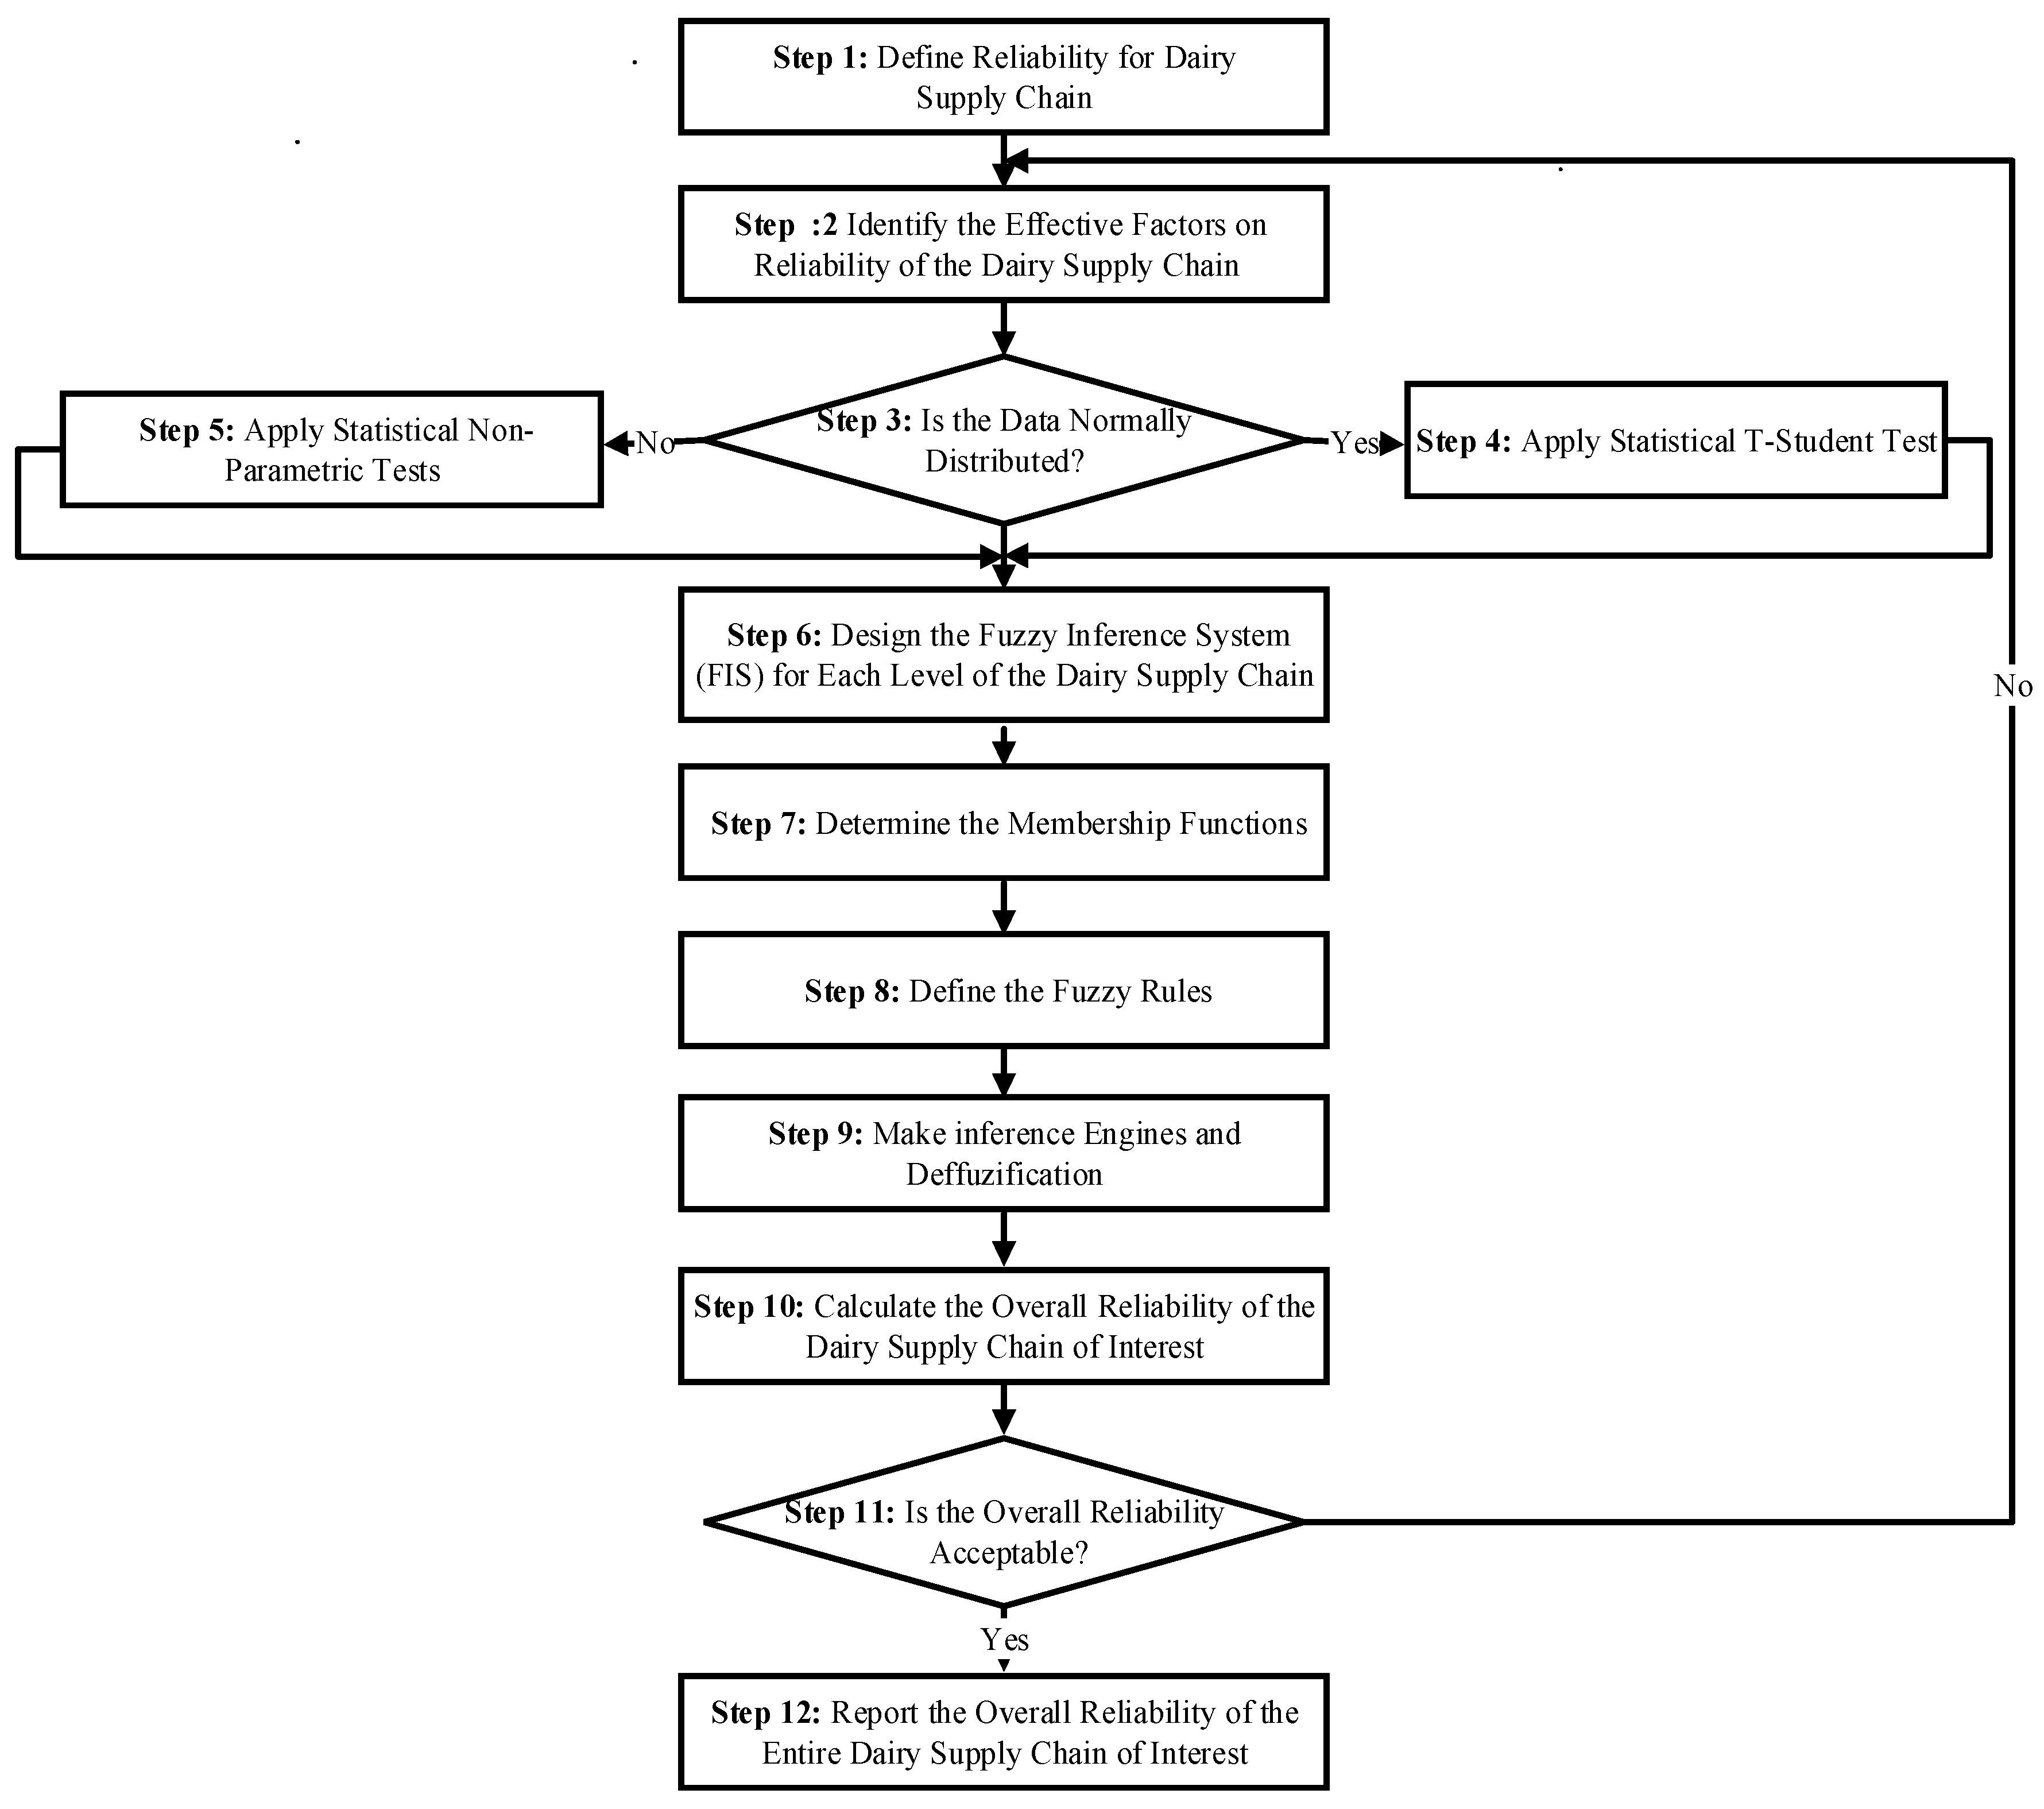
The method presented by this study is presented in
Figure 2. Overall, the proposed methodology provides a comprehensive approach for enhancing the reliability of the dairy supply chain by identifying effective factors and developing a reliable and efficient fuzzy inference system. In the next subsection, the details and steps of using the fuzzy inference system are explained.
3.1. Identification of Effective Factors
To unveil the essential components shaping the reliability of the dairy supply chain, this study embarks on a meticulous journey encompassing five pivotal steps;
Initially, the study sets out to define the reliability of the dairy supply chain, establishing a foundational understanding of this critical aspect (Definition of Reliability).
Following the definition, an exhaustive review of existing literature is conducted to identify factors pivotal for enhancing the performance and reliability of the dairy supply chain (Literature Review).
Through the comprehensive literature review, key factors influencing the reliability of the dairy supply chain are meticulously identified, forming the basis for further analysis (Factor Identification).
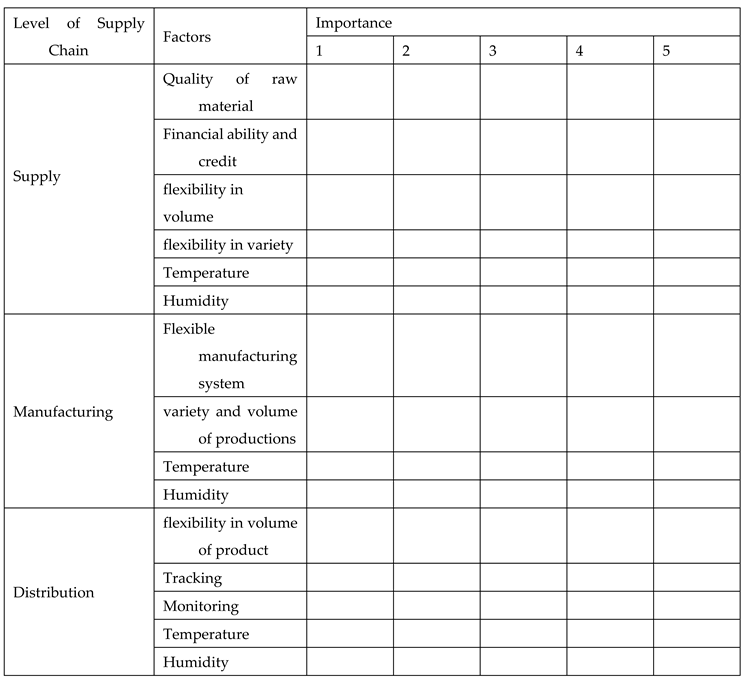
With the factors identified, a bespoke questionnaire is meticulously crafted, tailored to solicit invaluable insights from seasoned experts in the field (Questionnaire Design and Distribution) The questionnaire is available in
Appendix A.
Finally, the statistical significance of the identified factors is rigorously evaluated using the t-student test, leveraging state-of-the-art Minitab software for expert execution and analysis (Statistical Analysis). In fact, in order to rate the importance of each factor, a Likert scale ranging from 1 to 5 is used. Each expert assessed the significance of each factor and their average opinions are calculated. The factors as 'effective' are identified based on whether their average rating was greater than or equal to 3, which is the midpoint of the scale. Equation (2) formulates this step.
3.2. Fuzzy Inference System
At the heart of our methodology lies the development of a sophisticated fuzzy inference system tailored to each crucial level of the supply chain, namely the supplier, manufacturer, and distributor. This intricate process, delineated in the subsequent subsections, encapsulates steps 6 to 9 of our meticulously crafted methodology.
In the realm of fuzzy inference systems, the process of fuzzification emerges as a critical cornerstone, transforming inputs with deterministic values into appropriate fuzzy numbers. This pivotal process is akin to an artistic rendering, where inputs, whether from sensors, hardware measurements, or user inputs, are imbued with a degree of uncertainty. Given the inherently uncertain nature of factors influencing the stability of the dairy supply chain, fuzzification becomes indispensable, paving the way for nuanced analysis and informed decision-making.
Driving the inference engine forward are meticulously crafted IF-THEN rules, meticulously curated based on knowledge extracted from expert judgments. Employing the revered max − min method, our inference engine navigates through the intricate web of fuzzy logic, crafting rules that encapsulate the essence of reliability within the dairy supply chain. The Mamdani inference engine emerges as the lynchpin of our approach, wielding its prowess to extract rules governing the reliability of the dairy supply chain with unparalleled precision. Through a symphony of fuzzy set operations, implications, and aggregations, our methodology orchestrates a harmonious convergence of diverse inputs, culminating in a comprehensive assessment of reliability that transcends traditional paradigms.
The
max −
min method was used for two associations
a(ℎ,
l) and
b(
l,
b) delineated on Cartesian products
H ×
L and
L ×
W which results in new association
c defined on the product space
H ×
W (Equation (3)) (Fasanghari & Montazer, 2010);
Max and
Min operators are shown as ⋀ and ⋁ respectively. In the
Max −
Min method, the
Min operator is applied for AND conjunction and
Max operator is applied for OR disjunction. To calculate the membership of the clauses, there are three common types of inference engines including ‘Sugeno’, ‘Mamdani’, and ‘Tsukamoto’ (Khan et al., 2018). Since Mamdani is the most common inference engine that is widely used in the literature, in this research, this approach has been used to extract the rules governing the reliability of the dairy supply chain. Mamdani inference is used as Eq. (4): (Fasanghari & Montazer, 2010):
Mechanism of the Mamdani inference is as follows:
(1) If the rule has more than one input, the fuzzy set operations should be applied to achieve a single membership value.
(2) To reach the result of each rule, the implication (Min operator) method is applied.
(3) In a single fuzzy set, the outputs of each rule are combined using the fuzzy aggregation operator (Max operator) (Torun et al., 2011).
To determine the level of reliability of the dairy supply chain, its exact value should be determined. Given that result of the fuzzy expert system is in fuzzy format, it is necessary to convert the results into crisp numbers so that they can be perceived by users. In order to deffuzify the final results, different methods including ‘centre of gravity’, ‘average height’, and ‘peak’ can be applied. However, to reach the final result of the fuzzy expert system, out of all the available methods, the present study has chosen to employ the 'centre of gravity' (COG) method due to its common usage (Shokouhyar, 2019; Fasanghari, 2010; Shayganmehr et al., 2021). Equation (5) is used to deffuzify;
Where ∫ μ(x)dx and x denote the area and centre of gravity of the region.
3.3. Calculate Reliability of Supply Chain
The reliability of the dairy supply chain is determined through a comprehensive Fuzzy Inference System (FIS). Inputs to the FIS include various factors influencing the reliability of each level within the supply chain, while its output yields the reliability assessment for each stage. Although the primary objective is to ascertain the overall reliability of the entire supply chain, this calculation is grounded in established reliability concepts and formulas, as outlined in
Table 1.
3.4. Validation of Results
To validate the robustness and efficacy of the proposed methodology, expert opinions are solicited. This ensures alignment with industry standards and best practices, enhancing the credibility of the methodology. Furthermore, a Taguchi experiment is conducted to provide empirical validation, offering additional insights into the methodology's effectiveness and its ability to generate reliable results consistently. Through these validation measures, the methodology's reliability and applicability are thoroughly scrutinized, bolstering confidence in its utility for assessing and improving the reliability of dairy supply chains.
4. Case Study
To verify the proposed methodology, a real case in the Iranian dairy industry has been chosen to be studied. The dairy supply chain under investigation comprises two parallel suppliers, one manufacturer, and two parallel distributors. This study will take into account various types of dairy products such as milk, yogurt, ice cream, and others (refer to
Figure 3). Data required for this study were collected through three methods: library research, interviews, and researcher-made questionnaires.
To carry out the statistical analyses, the Minitab software is utilized. Additionally, the MATLAB software is employed for the design of the fuzzy inference system.
4.1. Identification of Effective Factors
To identify the factors influencing the subject, a review of similar research studies and interviewed experts in the field are conducted. Based on the literature and expert interviews, a set of factors, that are shown in
Table 3, is also extracted. With these factors in mind, a questionnaire using the Likert scale is designed to determine their relative importance, as assessed by the opinions of the experts.
Statistical Analysis
To analyse the data collected from questionnaires statistical tests are used. Since previous data suggested that the distribution of the dataset is normal, the t-test is employed to analyse the results according to
Table 4. Equation 2 formulates the hypotheses.
Since the confidence level is 0.95, any factors with a significance level of less than 0.05 have rejected the null hypothesis and are therefore removed from the list of effective factors. The remaining factors, highlighted in bold in
Table 4, were selected for designing the fuzzy inference system. As a result, three factors were identified as effective at the supply and manufacturing levels, while two factors were found to be effective at the distribution level of the studied supply chain.
4.2. Design of Fuzzy Inference System for Each Level of Supply Chain
In this section, a new approach is proposed to evaluate the performance of the reliable dairy supply chain using a fuzzy inference system. The inputs are the effective factors mentioned in the previous subsection (i.e., the subsection 5.1), and the output is the reliability of each level in the system. The implementation steps are outlined in subsection 2.2.
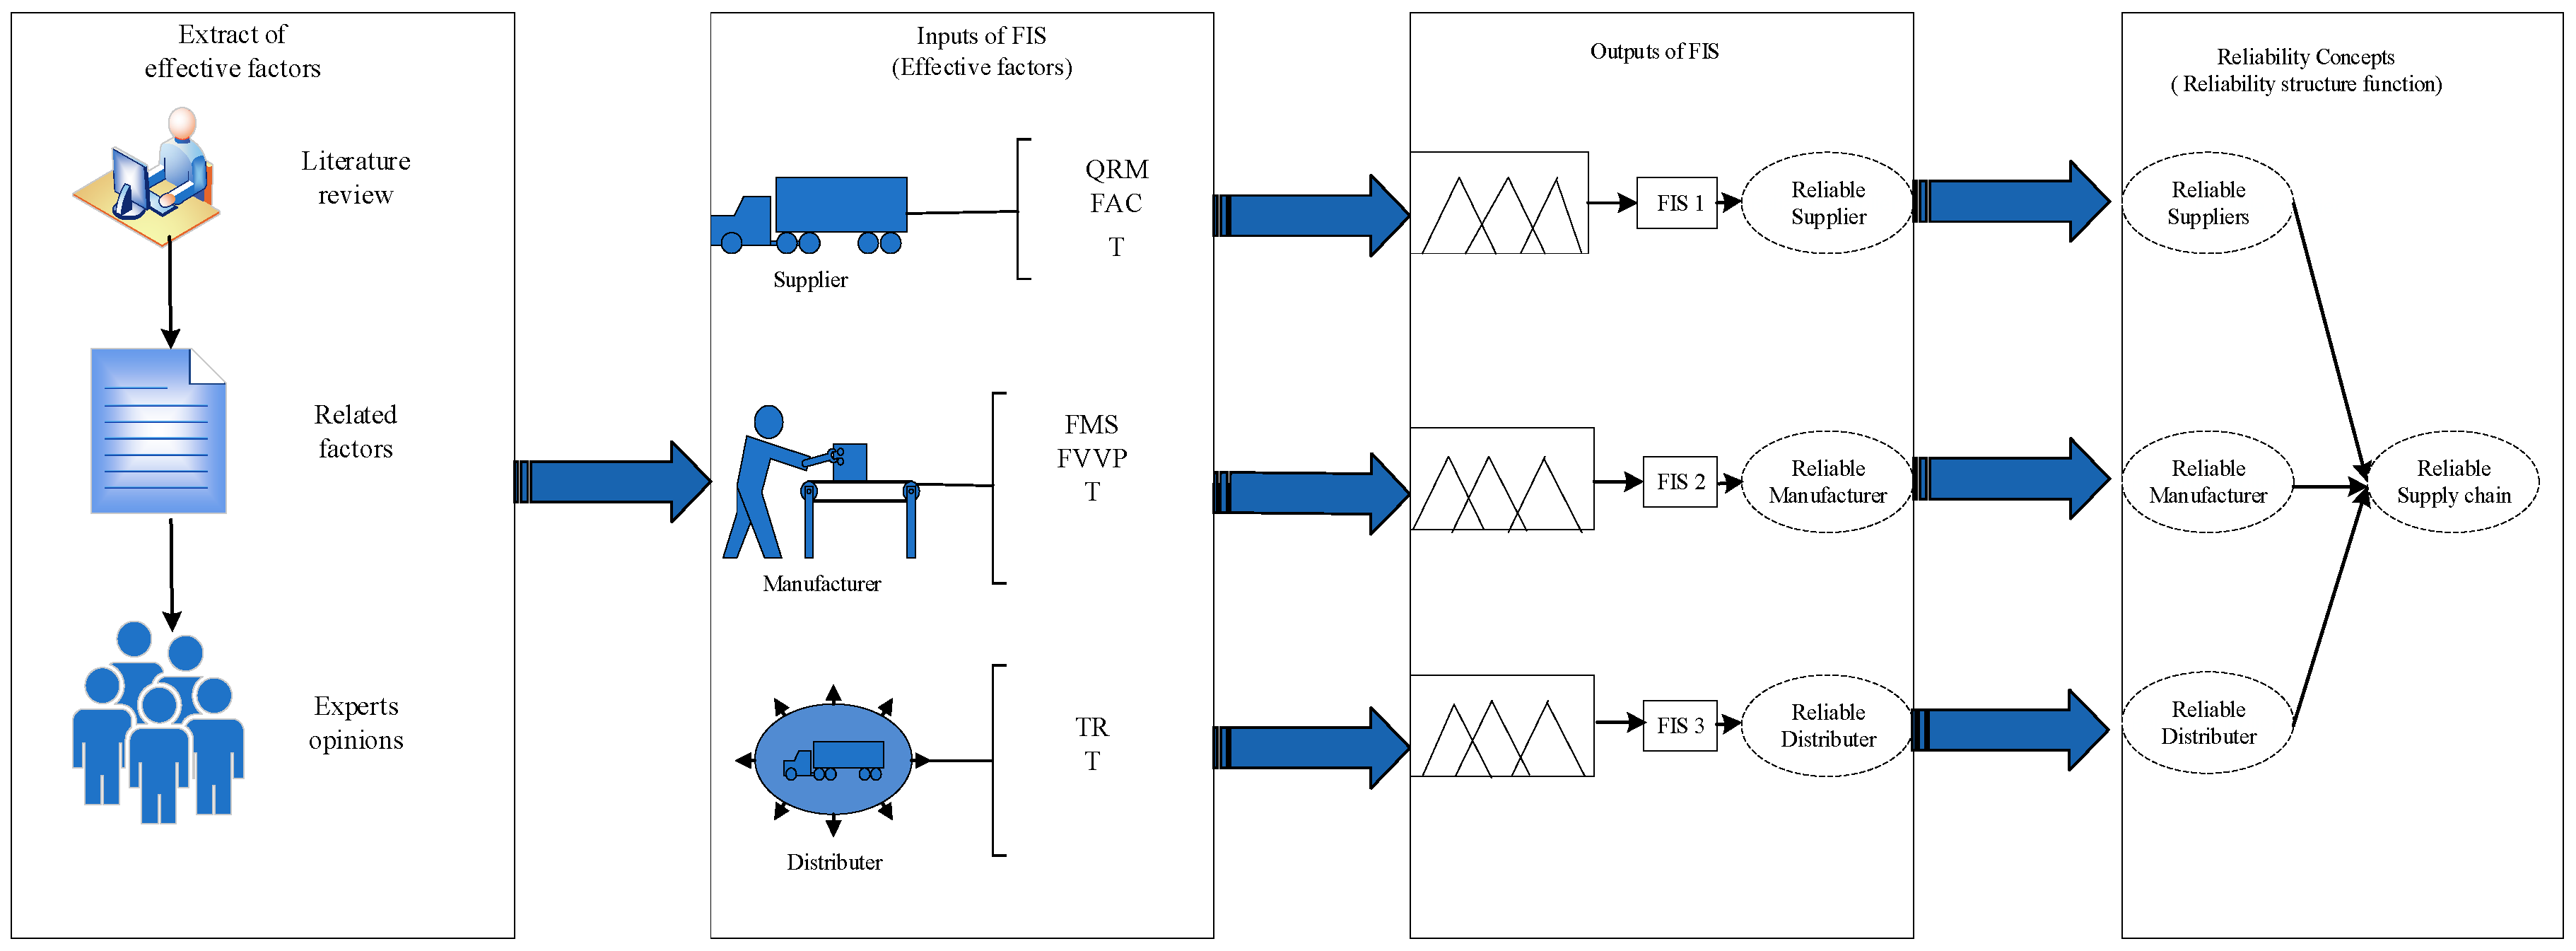
Figure 4 depicts the overarching schematic of the proposed model. As illustrated in the figure, three FISs have been designed for the proposed model. The inputs of these FISs are predefined effective factors of the reliable dairy supply chain that are utilized to evaluate the values of the main reliable supply, manufacturing, and distribution dimensions. It is important to note that the inputs (i.e., effective factors) of the FISs have been determined based on expert opinions and literature surveys.
To accurately assess the value of a reliable supplier, three key factors were selected for evaluation: the quality of raw materials (QRM), financial capacity and credit history (FAC), and temperature (T). These inputs were used to develop Fuzzy Inference System 1, FIS 1. FIS 2 was created by incorporating three additional inputs: flexible manufacturing systems (FMS), production flexibility in terms of volume and variety (FVVP), and temperature (T). Finally, Fuzzy Inference System 3 (FIS 3) was developed using two inputs: tracking (TR) and temperature (T). The outputs of these three systems are reliable supplier, reliable manufacturer, and reliable distributor.
4.2.1. Determining Membership Function
The Mamdani fuzzy inference system requires the use of fuzzy inputs, which in turn necessitates the definition of membership functions. To this end, three sets of membership functions have been presented for the input variables of the fuzzy inference systems (FIS 1, FIS 2, and FIS 3). The input fuzzy sets are in the form of linguistic rating variables and are equivalent to fuzzy numbers, which are presented in
Table 5. Unlike other factors, the linguistic terms used for temperature may vary depending on the type of product/material, and cannot be expressed simply as low, medium, or high. The status and corresponding linguistic terms for temperature based on the type of product/material are shown in
Table 6.
Table 6 provides examples of the three classes considered in the study. For class A, examples include ice cream and pizza cheese, while class B includes cheese, cream, and yoghurt. Class C comprises Ultra-High Temperature (UHT) milk and yogurt. Additionally,
Table 7 presents the five fuzzy sets used for membership functions in the output of the fuzzy inference systems modelled in this study.
4.2.2. Defining Fuzzy Rules
Setting rules is a crucial step in the development of Fuzzy Inference Systems (FIS). These rules are often more easily expressed in natural language rather than numerical terms and are frequently represented as "if-then" statements, which are executed using fuzzy conditional statements. An if-then rule consists of two parts: an antecedent that is compared against the inputs and a consequent that represents the resulting output. In Fuzzy Inference Systems, each rule is assigned a degree that is determined by how well it matches the input. This non-exact matching enables interpolation between different input states and minimizes the number of rules required to define the input-output relationship. One of the key advantages of FIS is that they allow for the representation of human knowledge as "As If - Then" fuzzy rules. Therefore, these rules play a crucial role in solving real-world problems. At this stage, a set of fuzzy linguistic rules is defined based on expert knowledge to implement the proposed Fuzzy Inference System (FIS) model, as described in Pourjavad and Shahin (2018). For instance, 12 rules are defined for FIS 1 and FIS 2, and 9 rules are determined for FIS 3, some of which are displayed in
Table 8. One such rule is: if the tracking performance is considered "Medium", and the temperature is rated as "Excellent", then the reliability of the distributor is deemed "Very Good".
4.2.3. Inference Engine and Defuzzification
The fuzzy interface engine is utilized to merge identified fuzzy sets based on the corresponding fuzzy rule and region. To convert the resulting fuzzy output to crisp output, a defuzzification process is employed. There are several approaches available for this process, including the bisector of area method (BOA), mean of maximum method (MOM), centre of area method (COA), largest of maximum method (LOM), and smallest method (SOM) (Sivanandam et al., 2007). In the proposed model, the COA method is adopted for all FISs. An example of the structure of FIS 2 viewers can be seen in
Figure 5.
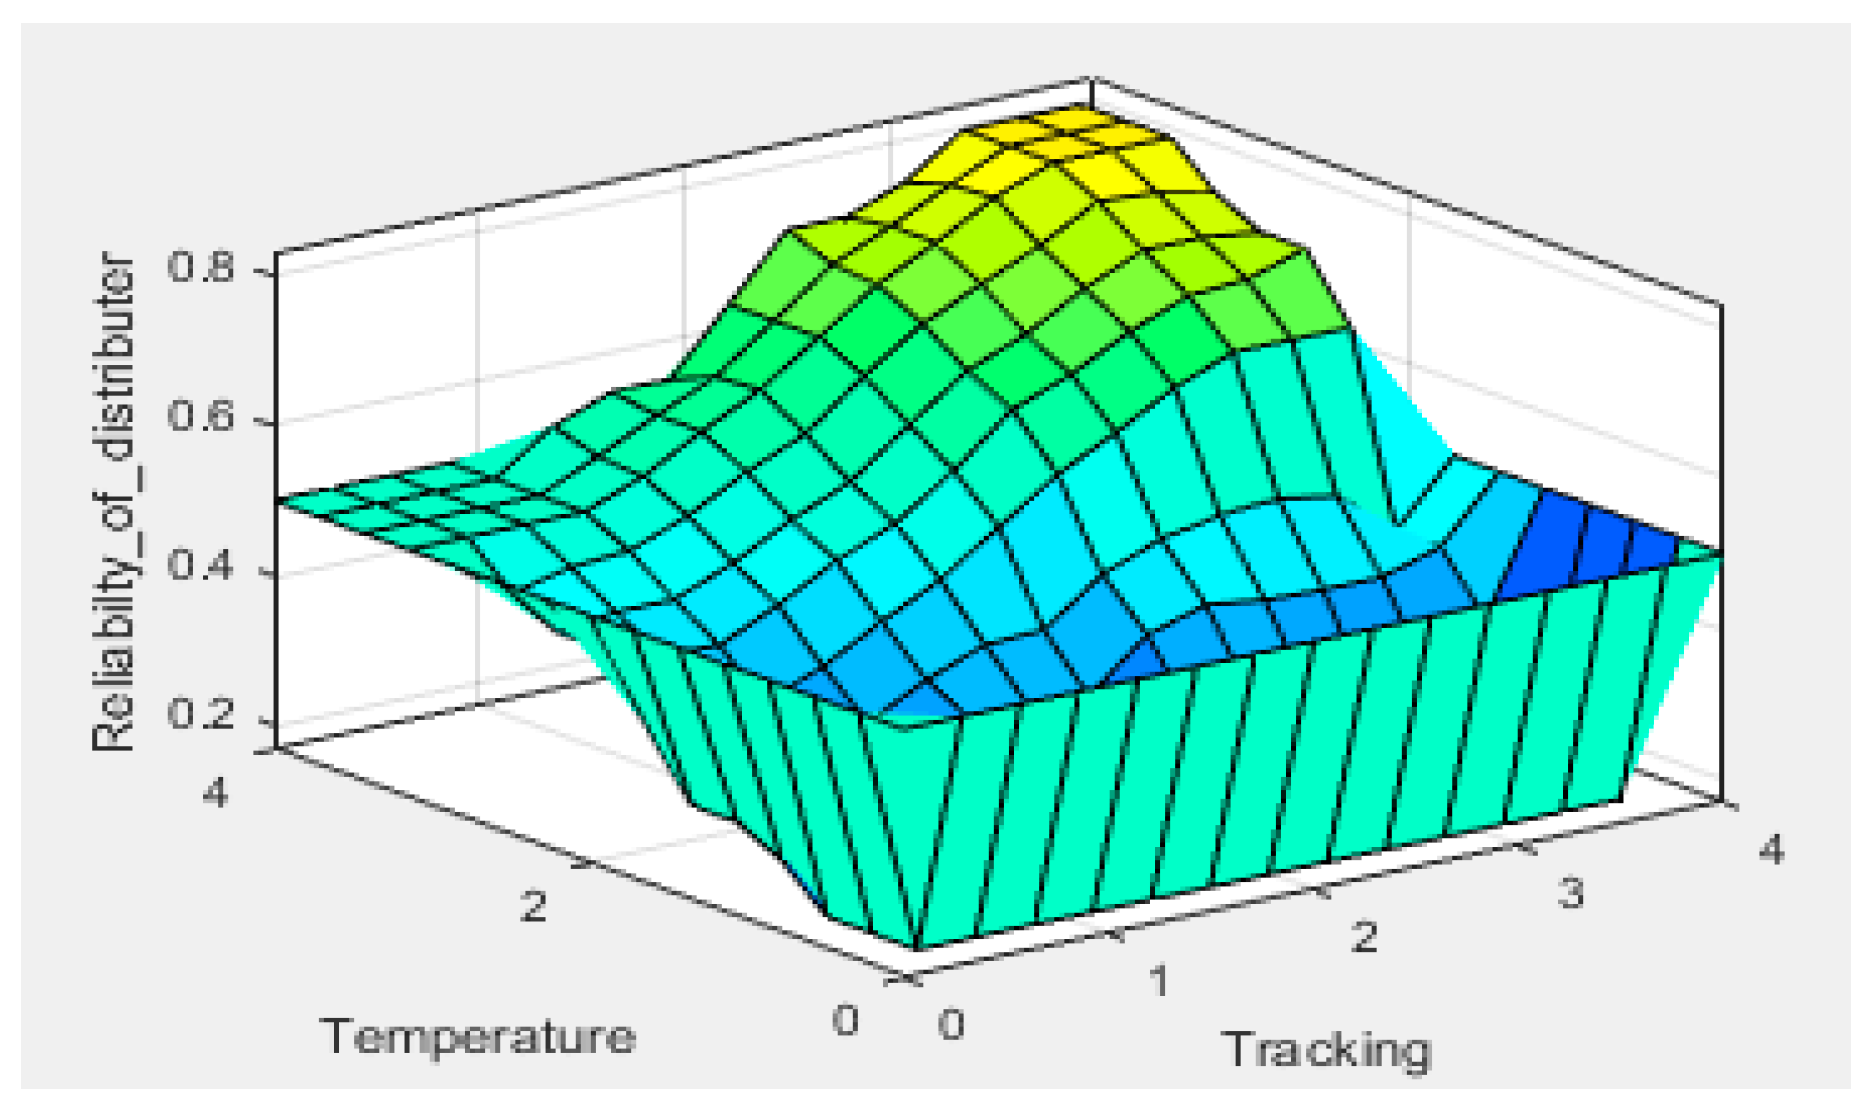
The results of the FISs are presented in
Figure 6,
Figure 7 and
Figure 8. FISs 1 and 2, which pertain to the supplier and manufacturer respectively, have three surfaces each due to having three inputs. However, FIS3 has only one surface because it has only two inputs. According to
Figure 6, all factors have an influence on output, although the effect of financial ability and credit is less than that of the other two factors. In
Figure 7, it can be seen that the variety and volume of products and flexible manufacturing have the same effect.
From
Figure 8, we can conclude that if the temperature is unsatisfactory, tracking does not affect reliability. Temperature is evident as the most effective factor at all levels across all figures.
4.3. Calculate Reliability of Supply Chain
Using established reliability concepts, the fuzzy inference system is designed for each supply chain level.
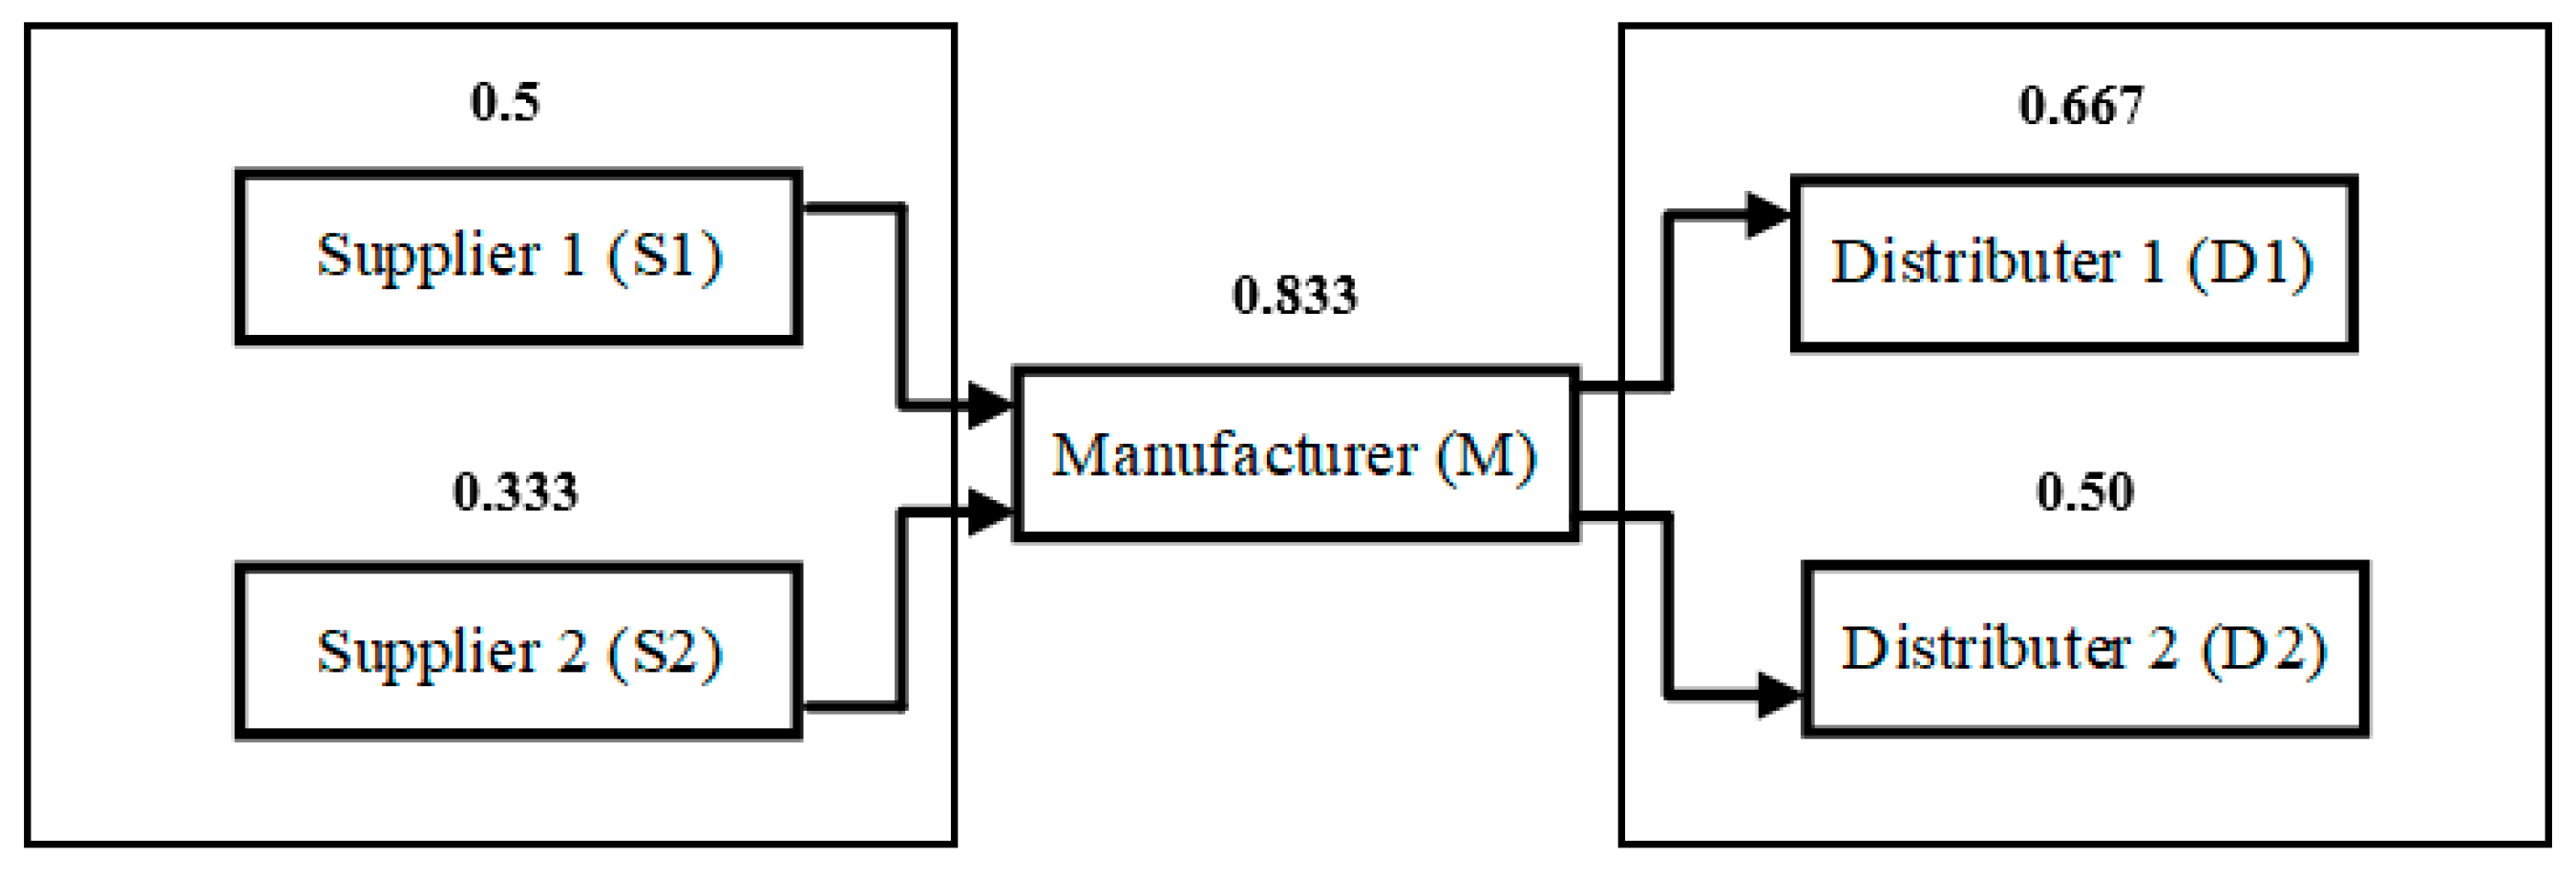
Figure 3 illustrates the supply chain, comprising two parallel suppliers, one manufacturer, and two parallel distributors, with inputs and outputs detailed in
Table 9.
To calculate the reliability of the supply chain, the formulas outlined in
Table 1 are utilized. As shown in
Figure 9, the reliability of each level in this example is determined using equations 6 to 8. The resulting reliability of the supply chain is found to be 0.046.
4.4. Validation of Results
To ensure the validity of our proposed methodology, expert opinions are sought from professionals in both the dairy supply chain field and in reliability analysis. Based on their evaluations, our methodology and resultant findings were approved.
In order to compare the factors at all levels of the supply chain (supplier, manufacturer, and distributor), we utilized the 3-level Taguchi method to validate our approach. Our experimentation showed that the reliability of each factor varied across different levels, as illustrated in
Table 10.
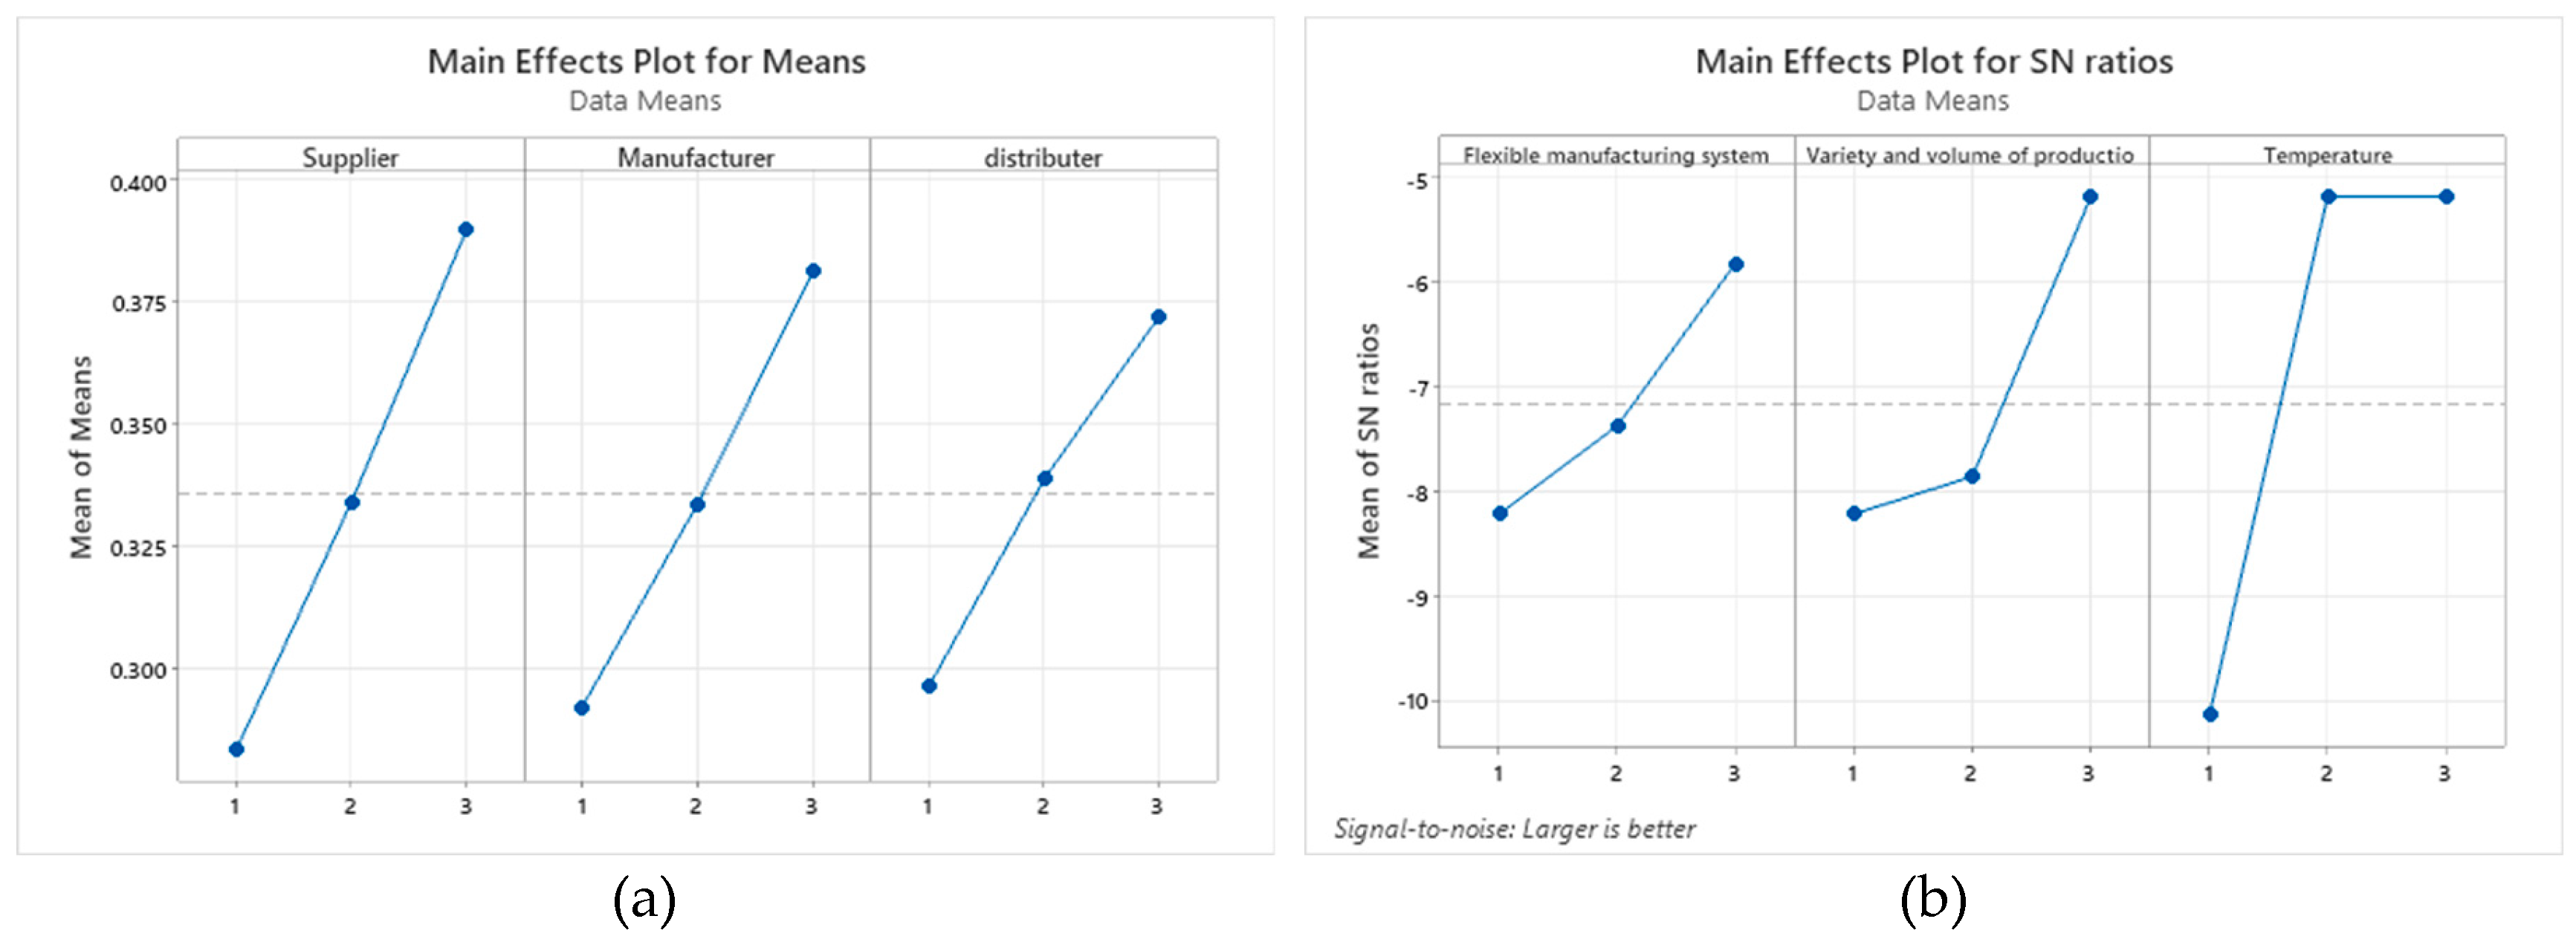
The value of supply chain reliability is determined by analysing various combinations of parameters, with the Taguchi method being implemented through the use of Minitab software. Based on
Figure 10, it was found that the optimal level of the parameters is A3B3C3, and all three factors (supplier, manufacturer, and distributor) have a significant impact on the reliability of the supply chain. In general, higher reliability of individual supply chain components leads to greater overall reliability of the entire supply chain.
Table 11 and
Table 12 reveal that suppliers have more influence than manufacturers and distributors on the reliability of the entire supply chain.
In the next step, the factors for each level of the supply chain are analysed, and a Taguchi experiment is designed.
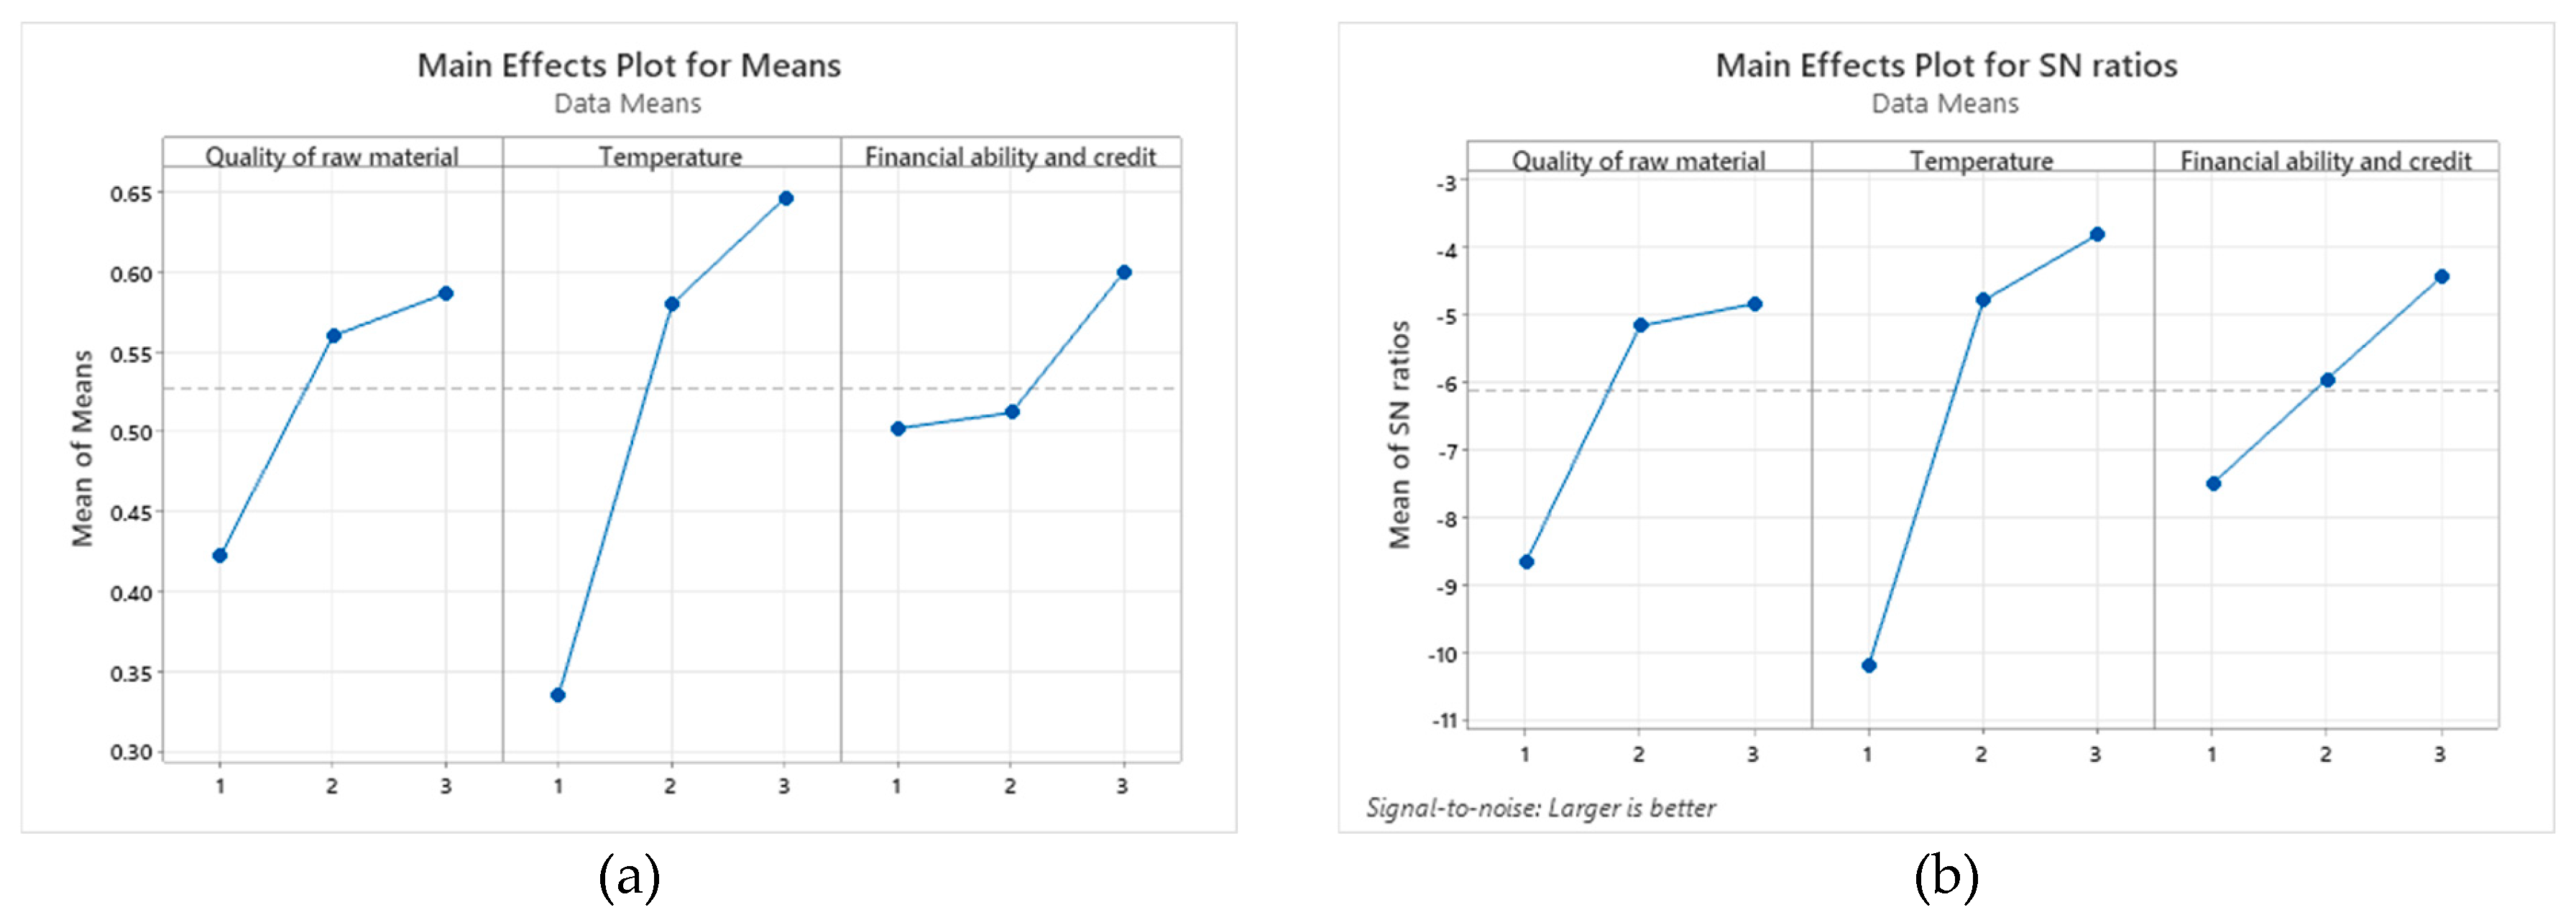
Table 13 outlines the levels of factors being considered. Based on
Figure 11, it appears that the supplier factors have the greatest impact on the overall system, with the optimal status being achieved when ‘Temperature’ is excellent, the ‘Quality of Raw Materials’ is high, and the supplier has strong ‘Financial Ability and Credit’.
Table 14 and
Table 15 further confirm that temperature has the greatest effect on the reliability of the supplier.
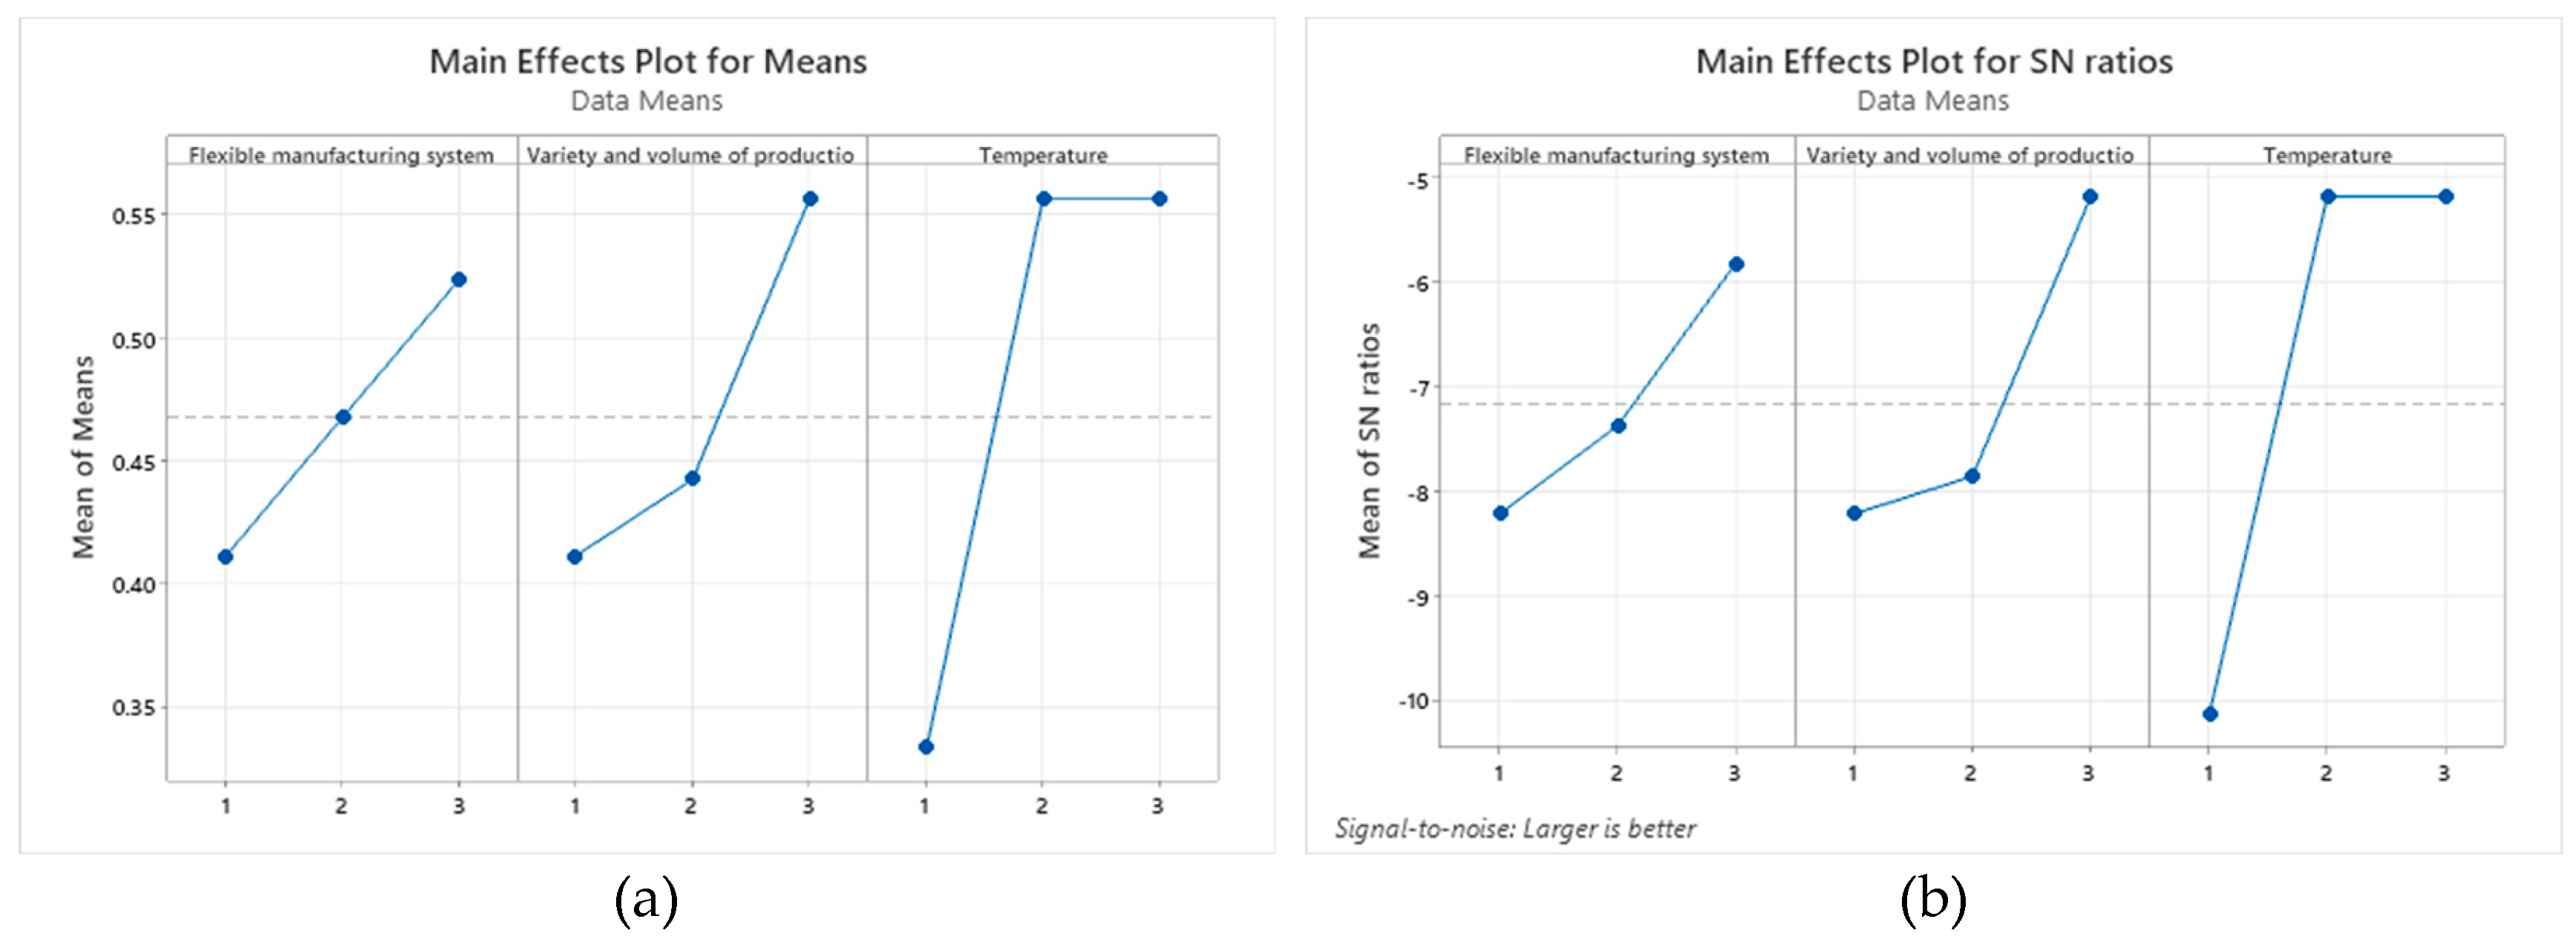
Figure 12 demonstrates that increased reliability in manufacturing can be achieved through high levels of flexible manufacturing systems, excellent temperature control, and strong financial ability and credit.
Table 16 and
Table 17 indicate that both product variety and volume and flexible manufacturing have relatively equal impacts on reliability, while temperature control has a greater impact compared to other factors.
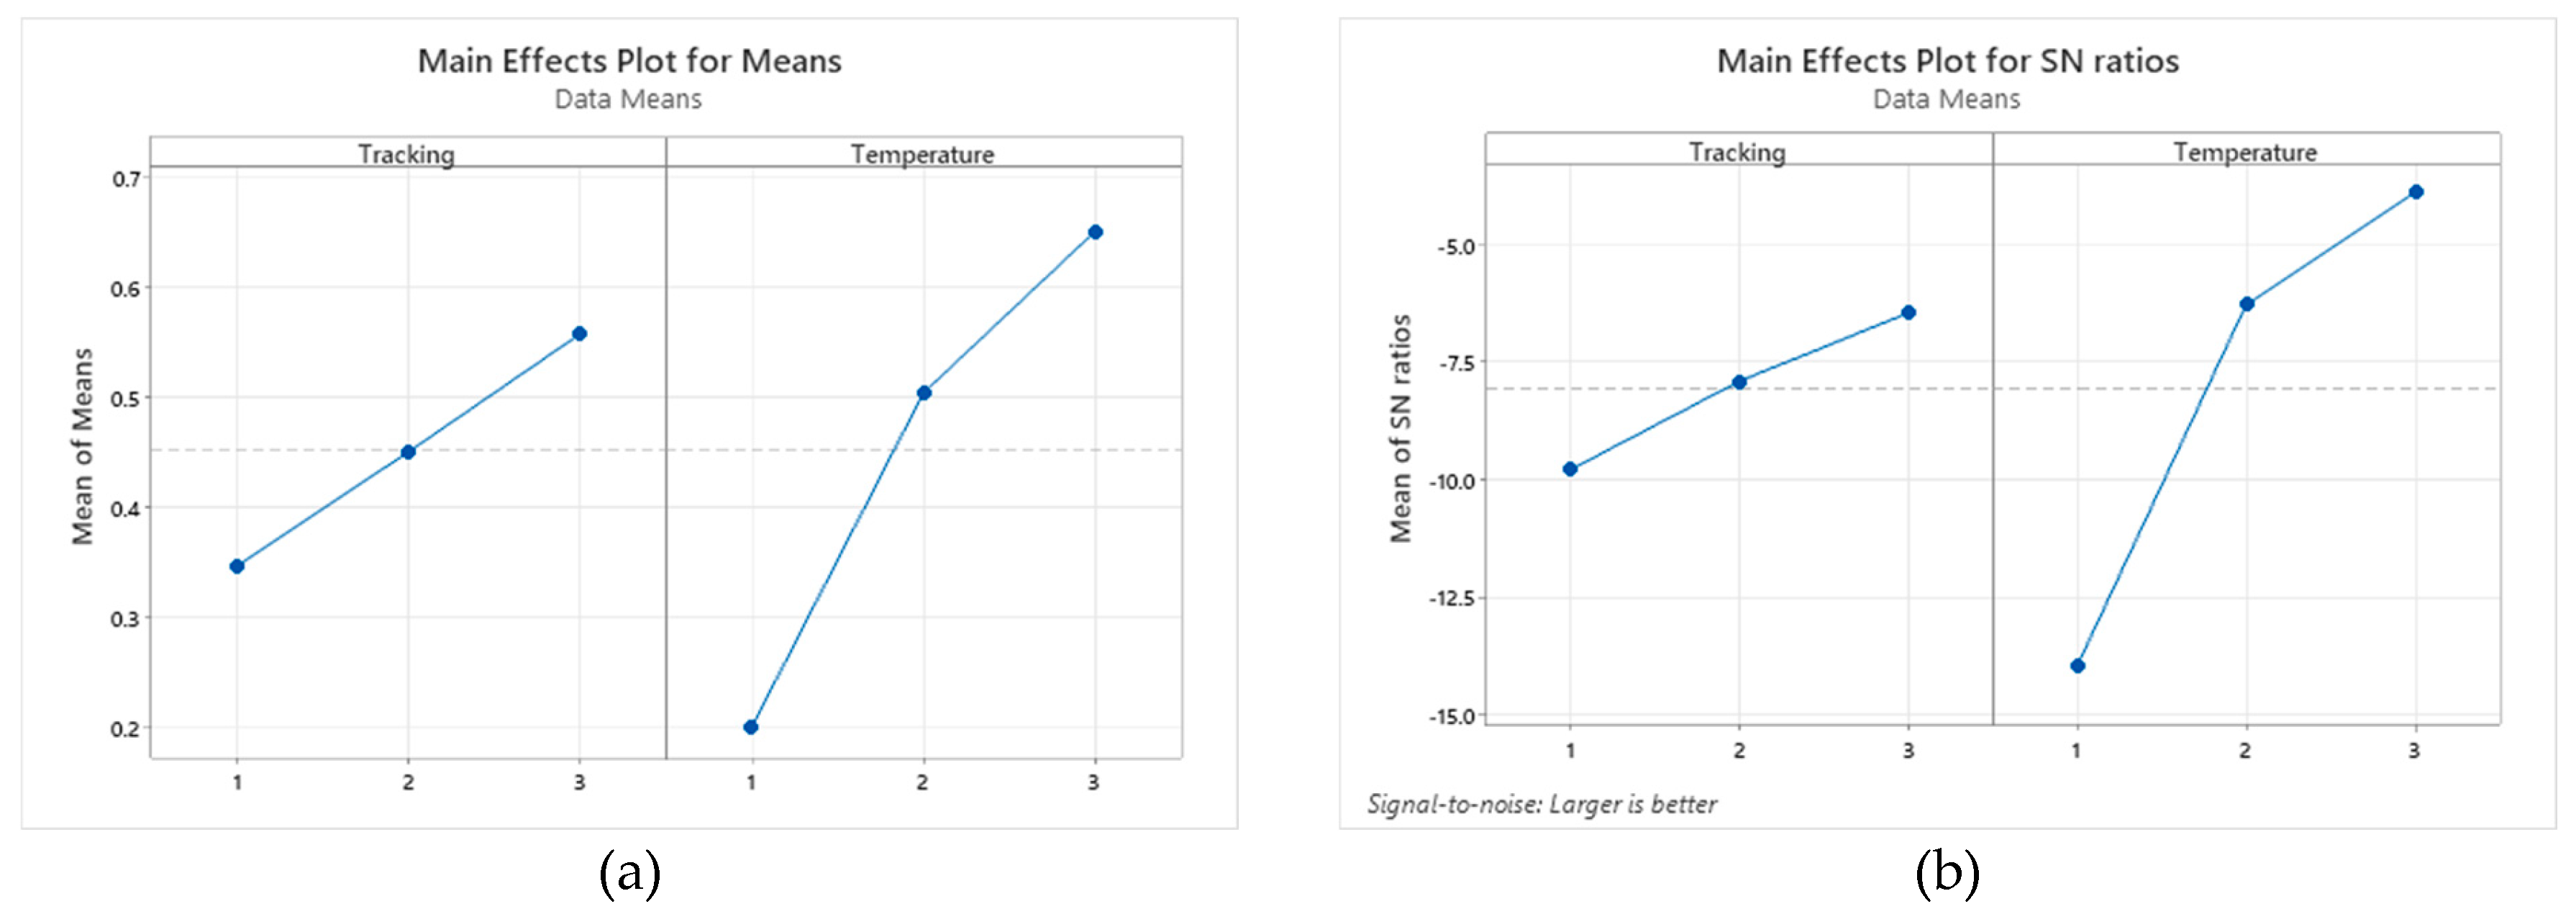
Based on
Figure 13, it can be inferred that if the temperature is classified as "excellent" and the tracking is rated as "high", then the reliability level of the distributor would also be high.
Table 18 and
Table 19 further indicate that temperature has a greater impact on the reliability of the distributor than tracking does.
The validation of the methodology is confirmed by the consistent results obtained from both the surfaces and the Taguchi experiments.
5. Conclusions and Discussion
The present study addressed performance of the dairy supply chain and emphasized the significance of reliability of the chain as a fundamental and critical attribute for fulfilling the safety requirements. In order to evaluate the performance of the dairy supply chain, the present study utilized the reliability attribute, which is an essential and informative system performance indicator. Despite importance of reliability in the dairy industry, there is a dearth of literature that clarifies the notion of reliability for this sector. To address this gap, this research defined reliability in the dairy supply chain as meeting customers' needs and requirements for dairy products concerning targeted levels of quantity, quality, time, and health.
Since reliability is one of the most crucial indicators of chain performance, this study was interested not only in examining final inputs and outputs but also in considering the internal activities and relationships between customers, manufacturers, and suppliers within the complex interconnected layers of the dairy supply chain. By focusing on the attribute of reliability, this study evaluated the performance of the dairy supply chain while taking into account all aspects of its operations, including production, transportation, storage, and distribution.
To assess the reliability of the dairy supply chain, this study analysed several key factors, such as timely delivery of products, adherence to quality standards at every stage of the chain, and maintaining consistent product availability to meet customer demand. The findings of this study indicated that reliable operations across the entire supply chain are crucial for ensuring safe and high-quality dairy products. Additionally, the study highlighted the need for effective communication and collaboration among all stakeholders involved in the dairy supply chain to achieve the desired level of reliability.
In order to reduce the volume of calculations and resolve vagueness that may be experienced in the process of performance evaluation for the concerned dairy supply chain, this study proposed the utilization of the Fuzzy Inference System (FIS) and applied this approach to the reliability indicator. Three fuzzy inference systems were designed to evaluate the reliability at different levels of the dairy supply chain: ‘supply’, ‘manufacturing’, and ‘distribution’. The identified effective factors at each level of the supply chain serve as inputs, while the output of the FISs is the reliability of these components. Based on the structure of the supply chain and relevant formulas, the reliability of different levels was combined, and the reliability of the entire supply chain was finally calculated. The proposed FIS approach offered a practical tool for evaluating the reliability performance of a supply chain and can be extended to other industries as well. In order to verify the proposed methodology, a real case in the Iranian dairy industry was chosen to be studied.
The dairy supply chain is a complex system that involves multiple stakeholders and processes. Enhancing the reliability of this supply chain is crucial to ensure that consumers receive high-quality dairy products that meet their expectations and do not pose any health risks. To achieve this objective, several factors need to be taken into account. The proposed methodology aimed at to identifying and analysing these factors and their impact on the performance of the dairy supply chain. By using Fuzzy Inference Systems (FISs), researchers and experts can input various factors and analyse their influence on the output surface of the system. This approach provides a comprehensive understanding of the different variables that affect the reliability of the supply chain.
Factors such as transportation, storage, packaging, and handling can significantly influence the quality and quantity of dairy products. These variables are interdependent and can affect each other's performance, making it essential to consider them collectively rather than in isolation. The FISs' output surface allows researchers and experts to examine the impact of individual and collective factors on the performance of the dairy supply chain.
Moreover, the proposed methodology in this study can aid in identifying potential bottlenecks or weaknesses in the dairy supply chain and developing strategies to address them. By analysing the factors that influence the reliability of the supply chain, companies can optimize their operations, reduce costs, and improve the overall quality of the dairy products delivered to consumers.
This study underscores the critical role of reliability in the dairy supply chain and its impact on product safety and quality. By elucidating the factors influencing reliability and proposing a robust methodology for its assessment, this research offers valuable insights for dairy industry stakeholders. Specifically, managers can leverage the findings to optimize supply chain operations, enhance product quality, and mitigate risks. Moreover, by prioritizing reliability as a key performance indicator, organizations can bolster consumer confidence, foster brand loyalty, and gain a competitive edge in the market.
While this study contributes significantly to our understanding of reliability in the dairy supply chain, it is essential to acknowledge its limitations and chart a course for future research. One potential limitation lies in the generalizability of the proposed methodology beyond the dairy sector. Future studies could explore adaptations or modifications required when applying the methodology to other industries, thereby enhancing its applicability and scalability. Additionally, further research could delve into the specific challenges and opportunities inherent in implementing the proposed methodology in diverse organizational contexts, providing valuable insights for practitioners and scholars alike.
While the methodology presented in this paper is applicable to the dairy sector, it is crucial to elucidate the specific considerations and adaptations required when extending it to other industries. Future research could explore how variations in supply chain structures, product characteristics, and stakeholder dynamics influence the application of the proposed methodology. By identifying industry-specific nuances and challenges, researchers can develop tailored approaches that accommodate diverse organizational contexts and enhance the reliability and performance of supply chains across different sectors.
To enhance the academic rigor of the paper, it is imperative to critically examine the limitations of the proposed methodology and identify areas for improvement. While the Fuzzy Inference System (FIS) offers a practical approach for evaluating reliability, future research could explore alternative methodologies or hybrid approaches to address potential shortcomings. Moreover, a comprehensive discussion on the limitations of the methodology, such as data availability, model complexity, and interpretability, would provide valuable insights for researchers and practitioners seeking to apply similar approaches in their respective domains.
Author Contributions
All authors have equally contributed to every aspect of the manuscript.
Conflicts of Interest
The authors declare no conflict of interest.
Appendix A. The Research Questionnaire
Dear Elites,
Greetings!
This questionnaire is presented for identifying factors that effect on reliability of dairy supply chain. Please determine importance of factors.
Thanks for your kind time, support, and attention!
References
- Adenso Diaz, B. M. C. G.-C. S. &. L. M., 2012. The impact of supply network characteristics on reliability. Supply Chain Management, 17, 263–276.
- Adenso Diaz, B., Mena, C., Garcia-Carbajal, S. & Liechty, M., 2012. The impact of supply network characteristics on reliability. Supply Chain Management, 17, 263–276. [CrossRef]
- Aqlan, F. & Lam, S. S., 2015. A fuzzy-based integrated framework for supply chain risk assessment. International Journal of Production Economics 161, 54–63. [CrossRef]
- Arab, S., Rezaee, K. and Moghaddam, G., 2021. A novel fuzzy expert system design to assist with peptic ulcer disease diagnosis. Cogent Engineering, 8, p.1861730. [CrossRef]
- Asses Awan, M. & Ali, Y., 2019. Sustainable modeling in reverse logistics strategies using fuzzy MCDM: Case of China Pakistan Economic Corridor. Management of Environmental Quality: An International Journal, 30, 1132–1151. [CrossRef]
- Azadeh, A., Sheikhalishahi, M. & Aghsami, A., 2015. An integrated FTA-DFMEA approach for reliability analysis and product configuration considering warranty cost. Production Engineering, 9, 635–646. [CrossRef]
- Bourlakis, M., Maglaras, G., Gallear, D. & Fotopoulos, C., 2013. Examining sustainability performance in the supply chain: The case of the Greek dairy sector. Industrial Marketing Management, 43, 56–66.
- Buede, D. M. & Miller, W. D., 2016. The engineering design of systems: models and methods. s.l.:John Wiley & Sons.
- Büyüközkan, G. & Güler, M., 2021. A combined hesitant fuzzy MCDM approach for supply chain analytics tool evaluation. Applied Soft Computing, 112, 107812.
- Büyüközkan, G. & Güleryüz, S., 2016. An integrated DEMATEL-ANP approach for renewable energy resources selection in Turkey. International Journal of production economics, 182, 435–448.
- Cannas, V. G., Ciccullo, F., Pero, M. & Cigilini, R., 2020. Sustainable innovation in the dairy supply chain:enabling factors for intermodal transportation. International Journal of Production Research, 58.
- Chari, F. & Ngcamu, B. S., 2017. An assessment of the impact of disaster risks on dairy supply chain performance in Zimbabwe. Cogent Engineering, 4, 1409389.
- Chari, F. and Ngcamu, B.S., 2017. An assessment of the impact of disaster risks on dairy supply chain performance in Zimbabwe. Cogent Engineering, 4, p.1409389.
- Chen, C. A., Lee, M. H. & Yang, Y. H., 2012. Branding Taiwan for tourism using ‘Decision Making Trial and Evaluation Laboratory’ and ‘Analytic Network Process’ methods. The Service Industries Journal, 32, 1355–1373.
- Diabat, A., Jabbarzadeh, A. & Khosrojerdi, A., 2019. A perishable product supply chain network problem with reliability and disruption considerations. International Journal of Production Economics, 212, 125–138.
- FAO, 2018. Infographics; Milk Facts. FAO,., Rome, Italy: Retrieved September 10, 2019.
- Fasanghari, M. & Montazer, G. A., 2010. Design and implementation of fuzzy expert system for Tehran Stock Exchange portfolio recommendation. Expert Systems with Applications, 37, 6138–3147.
- Ghorbani, M., Mohammad Arabzadeh, S. & Shahin, A., 2013. A novel approach for supplier selection based on the kano model and fuzzy MCDM. International Journal of Production Research, 51, 5469–5484.
- Gorton, M., Dumitrashko, M. & White, J., 2006. Overcoming supply chain failure in the agri-food sector: A case study from Moldova. Food Policy, 31, 90–103.
- Gupta, S., 2015. Use of triangular membership function for prediction of compressive strength of concrete containing nanosilica. Cogent Engineering, 2, 1025578.
- Gupta, S., 2015. Use of triangular membership function for prediction of compressive strength of concrete containing nanosilica. Cogent Engineering, 2, p.1025578.
- Ha, C., Jun, H. B. & Ok, C., 2018. A mathematical definition and basic structures for supply chain reliability: A procurement capability perspective. Computers & Industrial Engineering, 120, 334–345.
- Hassan, A. et al., 2021. Safety Failure Factors Affecting Dairy Supply Chain: Insights from a Developing Economy. Sustainability, 13, 9500.
- He, M. et al., 2016. Capability Coordination in Automobile Logistics Service Supply Based on Reliability. s.l., Procedia Engineering, 325–333.
- Jain, N. & Singh, A. R., 2020. Sustainable supplier selection under must-be criteria through Fuzzy inference system. Journal of Cleaner Production, 248, 119275.
- Jouzdani, J. & Govindeh, K., 2021. On the sustainable perishable food supply chain network design: A dairy products case to achieve sustainable development goals. Journal of Cleaner Production, 278, 123060.
- Kabir, S. & Papadopoulos, Y., 2018. A review of applications of fuzzy sets to safety and reliability engineering. International Journal of Approximate Reasoning, 100, 29–55.
- Kannan, G., NoorulHaq, A. & Devika, M., 2009. Analysis of closed loop supply chain using genetic algorithm and particle swarm optimization. International Journal of production, 47, 1175–1200.
- Katsikeas, C. S., PaparoidamisN, N. G. & Katsikea, E., 2004. Supply source selection criteria: The impact of supplier performance on distributor performance. Industrial Marketing Management, 33, 757–764.
- Khan, O., Stolte, T., Creazza, A. and Hansen, Z.N.L., 2016. Integrating product design into the supply chain. Cogent engineering, 3, p.1210478.
- Khan, S. A., Kusi-Sarpong, S., Arhin, F. K. & Kusi-sarpong, H., 2018. Supplier sustainability performance evaluation and selection: A framework and methodology. Journal of Cleaner Production, 205, 964–979.
- Laura, X., Xiao, X., Bin, M. & Ronald, L., 2007. AHP Based Supply Chain Performance Measurement System, Singapore: Singapore Institute of Manufacturing Technology.
- Lukinskiy, V., Lukinskiy, V. & Churilov, R., 2014. PROBLEMS OF THE SUPPLY CHAIN RELIABILITY EVALUATION. Transport and Telecommunication, 15, 120–129.
- Lundén, J. V. V. M. T. L. E. K. K. &. H. K. et al., 2014. Temperature control efficacy of retail refrigeration equipment. Food Control, 45, 109–114.
- Lundén, J., Vanhanen, V., Kotilainen, K., & Hemmin, 2014. Retail food stores’ internet based own-check databank records and health officers’ on-site inspection results for cleanliness and food holding temperatures reveal inconsistencies. Food Control, 35, 79–84.
- Mahanta, J. & Panda, S., 2020. Fuzzy expert system for prediction of prostate cancer. New Mathematics and Natural Computation, 16, 163–176.
- Majumdar, A., Sinha, S. K., Shaw, M. & Mathiyazhagan, K., 2021. Analysing the vulnerability of green clothing supply chains in South and Southeast Asia using fuzzy analytic hierarchy process. International Journal of Production Research, 95, 752–771.
- Mamdani, E. H. & Assilian, S., 1975. An experiment in linguistic synthesis with a fuzzy logic controller. International Journal of Man-Machine Studies, 7, 1–13.
- Mao, R., Ma, X., Hao, Y., Pen, G., Zheng, X., Yang, N., Teng, D. and Wang, J., 2023. Perspective: A proposal on solutions of modern supply chain construction for lactoferrin. Journal of Dairy Science, 106, pp.7329-7335.
- Marseguerra, M., Zio, E., Podofillini, L. & Coit, D. W., 2005. Optimal design of reliable network systems in presence of uncertainty. IEEE Transactions on Reliability, 54, 243–253.
- Mina, H., Kannan, D., Gholami-Zanjani, S. M. & Biuki, M., 2021. Transition towards circular supplier selection in petrochemical industry: A hybrid approach to achieve sustainable development goals. Journal of Cleaner Production, 286, 125273.
- Mollajan, A., Iranmanesh, S. H. & Tavakkoli-Moghaddam, R., 2023. A systems approach to improve reliability of a contract by Modularising contract’s information flow architecture: a new contribution to risk mitigation in projects management. Enterprise Information Systems, 17, 1971773.
- Montgomery, H., Haughey, S. A. & Elliott, C. T., 2020. Recent food safety and fraud issues within the dairy supply chain (2015–2019). Global Food Security, 26, 100447.
- Motevali Haghighi, S., Torabi, S. A. & Ghasemi, R., 2016. An integrated approach for performance evaluation in sustainable supply chain networks (with a case study). Journal of Cleaner Production, 137, 579–597.
- Najmi, A. & Makui, A., 2010. Providing hierarchical approach for measuring supply chain performance. International Journal of Industrial Engineering Computations, 1, 199–212.
- Orji, I. J. & Wei, S., 2015. An innovative integration of fuzzy-logic and systems dynamics in sustainable supplier selection: a case on manufacturing industry. Computers & Industrial Engineering, 88, 1–12.
- Ozkan, O. & Kilic, S., 2019. A Monte Carlo Simulation for Reliability Estimation of Logistics and Supply Chain Networks. IFAC PapersOnLine, 52, 2080–2085.
- Paradowski, B., B˛ aczkiewicz, A. & W˛ atróbski, J., 2021. Towards proper consumer choices - MCDM based product selection. s.l., Procedia Computer Science, 1347–1358.
- Paraffin, A. S., Zindove, T. J. & Chimonyo, M., 2018. Perceptions of Factors Affecting Milk Quality and Safety among Large- and Small-Scale Dairy Farmers in Zimbabwe. Journal of Food Quality.
- Pourjavad, E. & Shahin, A., 2018. The application of Mamdani fuzzy inference system in evaluating green supply chain management performance. International Journal of Fuzzy Systems, 20, 901–912.
- Pourjavad, E. & Shirouyehzad, H., 2014. Analyzing maintenance strategies by FANP considering RAM criteria; a case study. International Journal of Logistics Systems and Management, 18, 302–321.
- Qian, C., Murphy, S.I., Lott, T.T., Martin, N.H. and Wiedmann, M., 2023. Development and deployment of a supply-chain digital tool to predict fluid-milk spoilage due to psychrotolerant sporeformers. Journal of Dairy Science, 106, pp.8415-8433.
- Raut, R. D., Gardas, B. B., Narwane, V. S. & Narkhede, B. E., 2019. Improvement in the food losses in fruits and vegetable supply chain - a perspective of cold third-party logistics approach. Operations Research Perspectives, 6, 100117.
- Reiner, G., Teller, C. & Kotzab, H., 2013. Analyzing the Efficient Execution of In-Store Logistics Processes in Grocery Retailing—The Case of Dairy Products. Production and Operations Management, 22, 924–939.
- Rubio, R., Licón, C.C., Berruga, M.I., Molina, M.and Molina, A., 2011. Occurrence of aflatoxin M1 in the Manchego cheese supply chain. Journal of dairy science, 94, pp.2775-2778.
- Sarkar, S., 2016. Internet of Things—Robustness and reliability. In: Internet of Things. s.l.:Elsevier, 201–218.
- Shayganmehr, M., Kumar, A., Luthra, S. & Garza-Reyes, J. A., 2021. A framework for assessing sustainability in multi-tier supply chains using empirical evidence and fuzzy expert system,. Journal of Cleaner Production.
- Shen, L. et al., 2013. A fuzzy multi criteria approach for evaluating green supplier's performance in green supply chain with linguistic preferences. Resources, Conservation and Recycling, 74, 170–179.
- Shokouhyar, S., Seifhashemi, S., Siadat, H. & Ahmadi, M. M., 2019. Implementing a fuzzy expert system for ensuring information technology supply chain. Expert Systems, 36, e12339.
- Sivanandam, S., Sumathi, S. & Deepa, S., 2007. Introduction to Fuzzy Logic Using MATLAB. Berlin: Springer.
- Sufiyan, M., Haleem, A., Khan, S. & Khan, M. I., 2019. Evaluating food supply chain performance using hybrid fuzzy MCDM technique. Sustainable Production and Consumption, 20, 40–57.
- Taghizadeh, H. & Hafezi, E., 2012. The investigation of supply chain’s reliability measure:a case study. Journal of Industrial Engineering International, 8, 1–10.
- Tavana, M. et al., 2013. A new network epsilon-based DEA model for supply chain performance evaluation. Computers & Industrial Engineering, 66, 501–513.
- Torun, H., Oztaysi, B. & Kahraman, C., 2011. A Fuzzy Inference System for Supply Chain Risk Management. Practical Applications of Intelligent Systems, 124, 429–438.
- Wang, H. et al., 2023. Collaborative decision-making in supply chain management: A review and bibliometric analysis. Cogent Engineering, 10, 2196823.
- Wang, H., Long, Z., Chen, J., Guo, Y. and Wang, A., 2023. Collaborative decision-making in supply chain management: A review and bibliometric analysis. Cogent Engineering, 10, p.2196823.
- Wasson, C. S., 2015. System engineering analysis, design, and development: Concepts, principles, and practices. s.l.:John Wiley & Sons.
- Wu, X. et al., 2018. Challenges to improve the safety of dairy products in China. Trends in Food Science & Technology, 76, 6–14.
- Xu, W. J., He, L. J. & Zhu, G. Y., 2021. Many-objective flow shop scheduling optimisation with genetic algorithm based on fuzzy sets. International Journal of Production Research, 59, 702–726. [CrossRef]
- Zadeh, L. A., 1965. Fuzzy sets. Information and Control, 8, 338–353.
- Zaitsev, E., 2012. Supply chain reliability modelling. Scientific Journal of Logistics, 8, 61–69.
- Zarei-Kordshouli, F., Paydar, M. M., & Nayeri, S. (2023). Designing a dairy supply chain network considering sustainability and resilience: a multistage decision making framework. Clean Technologies and Environmental Policy, 25, 2903-2927. [CrossRef]
- Zhang, M., Chen, J. & Chang, S. H., 2020. An adaptive simulation analysis of reliability model for the system of supply chain based on partial differential equations. Alexandria Engineering Journal, 59, 24012407. [CrossRef]
- Zimmermann, H., 1991. Fuzzy Set Theory and Its Applications. Dordrecht: Kluwer Academic.
- Zubair, M. & Mufti, N. A., 2015. Identification and Assessment of Supply Chain Risks Associated with Dairy Products Sector. Journal of Basic & Applied Sciences, 11, 167-175. [CrossRef]
Figure 1.
Fuzzy Expert System Components (Mahanta & Panda, 2020).
Figure 1.
Fuzzy Expert System Components (Mahanta & Panda, 2020).
Figure 2.
Flowchart Displaying the Methodology of the Study.
Figure 2.
Flowchart Displaying the Methodology of the Study.
Figure 3.
System Schematic.
Figure 3.
System Schematic.
Figure 4.
Overall Schematic of the Proposed Model.
Figure 4.
Overall Schematic of the Proposed Model.
Figure 5.
Rule Viewer of the Proposed FIS 2.
Figure 5.
Rule Viewer of the Proposed FIS 2.
Figure 6.
(a) Situation of temperature-financial ability and credit with respect to reliability. (b) Situation of quality of raw material-financial ability and credit with respect to reliability. (c) Situation of temperature- quality of raw material with respect to reliability.
Figure 6.
(a) Situation of temperature-financial ability and credit with respect to reliability. (b) Situation of quality of raw material-financial ability and credit with respect to reliability. (c) Situation of temperature- quality of raw material with respect to reliability.
Figure 7.
(a)Situation of temperature-flexible manufacturing system with respect to reliability. (b) Situation of flexible manufacturing system –variety and volume of production with respect to reliability. (c) Situation of variety and volume of production - temperature with respect to reliability.
Figure 7.
(a)Situation of temperature-flexible manufacturing system with respect to reliability. (b) Situation of flexible manufacturing system –variety and volume of production with respect to reliability. (c) Situation of variety and volume of production - temperature with respect to reliability.
Figure 8.
Situation of Temperature-Tracing with Respect to Reliability.
Figure 8.
Situation of Temperature-Tracing with Respect to Reliability.
Figure 9.
Values of Reliability.
Figure 9.
Values of Reliability.
Figure 10.
(a) Mean of Means for the Entire supply chain. (b) Mean of Signal to Noise ratio for the Entire supply chain.
Figure 10.
(a) Mean of Means for the Entire supply chain. (b) Mean of Signal to Noise ratio for the Entire supply chain.
Figure 11.
(a) Mean of Means for Supplier. (b) Mean of Signal to Noise ratio for Supplier.
Figure 11.
(a) Mean of Means for Supplier. (b) Mean of Signal to Noise ratio for Supplier.
Figure 12.
(a) Mean of Means for Manufacturer. (b) Mean of Signal to Noise Ratio for Manufacturer.
Figure 12.
(a) Mean of Means for Manufacturer. (b) Mean of Signal to Noise Ratio for Manufacturer.
Figure 13.
(a) Mean of Means for Distributer. (b) Mean of Signal to Noise Ratio for Distributer.
Figure 13.
(a) Mean of Means for Distributer. (b) Mean of Signal to Noise Ratio for Distributer.
Table 1.
Formulas of Reliability.
Table 1.
Formulas of Reliability.
| System Structure |
Operation |
RSC (q) |
| Series |
If all the components work correctly, the system works |
|
| Parallel |
If the components fail the system will fail |
1- |
| Parallel-Series |
The series subsystems are connected in parallel |
1- |
| Series-Parallel |
The parallel subsystems are connected in series |
|
| k-out-of-n |
System works if k or more among n components work properly |
|
Table 2.
Features of the Present Research Compared to the Relevant Researches.
Table 2.
Features of the Present Research Compared to the Relevant Researches.
Table 3.
Extracted Factors.
Table 3.
Extracted Factors.
| Level |
Factors |
| Supply |
Quality of raw material |
| Financial ability and credit |
| Flexibility in volume |
| Flexibility in variety |
| Temperature |
| Humidity |
| Manufacturing |
Flexible manufacturing system |
| Variety and volume of production |
| Temperature |
| Humidity |
| Distribution |
Flexibility in volume of product |
| Tracking |
| Temperature |
| Humidity |
Table 4.
Results of the Statistical T-Student Test.
Table 4.
Results of the Statistical T-Student Test.
| Level |
Factors |
T-Value |
Significance level |
| Supply |
Quality of raw material |
2.07 |
0.974 |
| Financial ability and credit |
3.62 |
0.999 |
| Flexibility in volume |
-7.02 |
0.000 |
| Flexibility in variety |
-9.20 |
0.000 |
| Temperature |
0.00 |
0.500 |
| Humidity |
-2.22 |
0.019 |
| Manufacturing |
Flexible manufacturing system |
2.29 |
0.983 |
| Variety and volume of production |
0.33 |
0.626 |
| Temperature |
1.16 |
0.871 |
| Humidity |
-1.99 |
0.030 |
| Distribution |
Flexibility in volume of product |
-4.49 |
0.000 |
| Tracking |
0.74 |
0.765 |
| Temperature |
5.51 |
1.000 |
| Humidity |
-8.75 |
0.000 |
Table 5.
Linguistic Terms for FISs Inputs.
Table 5.
Linguistic Terms for FISs Inputs.
| Factor |
Linguistic Factors |
Fuzzy Triangular Number |
| Temperature |
Unsatisfactory
Good
Excellent |
(0,1,2)
(1,2,3)
(2,3,4) |
| Other factors |
Low
Medium
High |
(0,1,2)
(1,2,3)
(2,3,4) |
Table 6.
Statues and Related Linguistic Terms of Temperature.
Table 6.
Statues and Related Linguistic Terms of Temperature.
| Type of Product/Material |
Status |
Linguistic Terms |
A
|
Frozen (< -18°C) |
Excellent |
| Refrigerated (1°C < x<4°C) |
Good |
| Room temperature (15°C < x<25°C) |
Unsatisfactory
|
B
|
Frozen (< -18°C) |
Good |
| Refrigerated (1°C < x<4°C) |
Excellent |
| Room temperature (15°C < x<25°C) |
Good |
| C |
Frozen (< -18°C) |
Unsatisfactory |
| Refrigerated (1°C < x<4°C) |
Good |
| Room temperature (15°C < x<25°C) |
Excellent |
Table 7.
Linguistic Terms for FISs Outputs.
Table 7.
Linguistic Terms for FISs Outputs.
| Factor |
Linguistic Factors |
Fuzzy Triangular Number |
| Reliability |
Unsatisfactory
Satisfactory
Good
Very good
Excellent |
(0,1/6,2/6)
(1/6,2/6,3/6)
(2/6,3/6,4/6)
(3/6,4/6,5/6)
(4/6,5/6,1) |
Table 8.
Inference Rules of FIS 3.
Table 8.
Inference Rules of FIS 3.
| Rules |
IF |
THEN |
| Tracking |
Temperature |
| 1 |
Low |
Unsatisfactory |
Unsatisfactory |
| 2 |
Medium |
Excellent |
Very good |
| ⁝ |
⁝ |
⁝ |
⁝ |
| 9 |
High |
Excellent |
Excellent |
Table 9.
Inputs and Outputs of Example.
Table 9.
Inputs and Outputs of Example.
| Level (FIS) |
Input |
Value of Input |
Value of Output (Reliability) |
| Supplier 1 (FIS1) |
Temperature |
2 |
0.5 |
| Quality of raw material |
3 |
| Financial ability and credit |
1 |
| Supplier 2 (FIS1) |
Temperature |
1 |
0.333 |
| Quality of raw material |
2 |
| Financial ability and credit |
1 |
| Manufacturing (FIS2) |
Temperature |
3 |
0.833 |
| Flexible manufacturing system |
3 |
| Variety and volume of productions |
3 |
| Distribution 1 (FIS3) |
Temperature |
2 |
0.667 |
| Tracking |
3 |
| Distribution 2 (FIS3) |
Temperature |
3 |
0.5 |
| Tracking |
1 |
Table 10.
The Value of Factors of Entire Supply Chain.
Table 10.
The Value of Factors of Entire Supply Chain.
| Factors |
Level 1 |
Level 2 |
Level 3 |
| Supplier |
0.5 |
0.6 |
0.7 |
| Manufacturer |
0.6 |
0.7 |
0.8 |
| Distributer |
0.7 |
0.8 |
0.9 |
Table 11.
Signal to Noise Ratios for Entire Supply Chain.
Table 11.
Signal to Noise Ratios for Entire Supply Chain.
| Level |
Supplier |
Manufacturer |
Distributer |
| 1 |
-11.162 |
-10.939 |
-10.774 |
| 2 |
-9.579 |
-9.600 |
-9.614 |
| 3 |
-8.240 |
-8.441 |
-8.591 |
| Delta |
2.923 |
2.499 |
2.183 |
| Rank |
1 |
2 |
3 |
Table 12.
Mean of Means for Entire Supply Chain.
Table 12.
Mean of Means for Entire Supply Chain.
| Level |
Supplier |
Manufacturer |
Distributer |
| 1 |
0.2833 |
0.2920 |
0.2963 |
| 2 |
0.3340 |
0.3337 |
0.3387 |
| 3 |
0.3897 |
0.3813 |
0.3720 |
| Delta |
0.1063 |
0.0893 |
0.0757 |
| Rank |
1 |
2 |
3 |
Table 13.
The levels of Effective Factors.
Table 13.
The levels of Effective Factors.
| Factors |
Level 1 |
Level 2 |
Level 3 |
| Temperature |
Unsatisfactory |
Good |
Excellent |
| Others |
Low |
Medium |
High |
Table 14.
Signal to Noise Ratios Supplier.
Table 14.
Signal to Noise Ratios Supplier.
| Level |
Quality of raw material |
Temperature |
Financial Ability and Credit |
| 1 |
-8.668 |
-10.205 |
-7.501 |
| 2 |
-5.161 |
-4.782 |
-5.952 |
| 3 |
-4.831 |
-3.798 |
-4.437 |
| Delta |
3.837 |
6.407 |
3.064 |
| Rank |
2 |
1 |
3 |
Table 15.
Mean of Means for Supplier.
Table 15.
Mean of Means for Supplier.
| Level |
Quality of raw material |
Temperature |
Financial Ability and Credit |
| 1 |
0.4223 |
0.3357 |
0.5023 |
| 2 |
0.5600 |
0.5800 |
0.5120 |
| 3 |
0.5867 |
0.6467 |
0.6000 |
| Delta |
0.1643 |
0.3110 |
0.0977 |
| Rank |
2 |
1 |
3 |
Table 16.
Signal to Noise Ratios Manufacturer.
Table 16.
Signal to Noise Ratios Manufacturer.
| Level |
Flexible Manufacturing System |
Variety and Volume of Production |
Temperature |
| 1 |
-8.219 |
-8.219 |
-10.144 |
| 2 |
-7.375 |
-7.859 |
-5.173 |
| 3 |
-5.819 |
-5.173 |
-5.173 |
| Delta |
2.400 |
3.046 |
4.970 |
| Rank |
3 |
2 |
1 |
Table 17.
Mean of Means for Manufacturer.
Table 17.
Mean of Means for Manufacturer.
| Level |
Flexible Manufacturing System |
Variety and Volume of Production |
Temperature |
| 1 |
0.4113 |
0.4113 |
0.3335 |
| 2 |
0.4675 |
0.4425 |
0.5567 |
| 3 |
0.5233 |
0.5567 |
0.5567 |
| Delta |
0.1120 |
0.1453 |
0.2232 |
| Rank |
3 |
2 |
1 |
Table 18.
Signal to Noise Ratios Distributer.
Table 18.
Signal to Noise Ratios Distributer.
| Level |
Tracking |
Temperature |
| 1 |
-9.790 |
-13.979 |
| 2 |
-7.914 |
-6.290 |
| 3 |
-6.465 |
-3.900 |
| Delta |
3.325 |
10.079 |
| Rank |
2 |
1 |
Table 19.
Mean of Means for Distributer.
Table 19.
Mean of Means for Distributer.
| Level |
Tracking |
Temperature |
| 1 |
0.3467 |
0.2000 |
| 2 |
0.4500 |
0.5033 |
| 3 |
0.5567 |
0.6500 |
| Delta |
0.2100 |
0.4500 |
| Rank |
2 |
1 |
|
Disclaimer/Publisher’s Note: The statements, opinions and data contained in all publications are solely those of the individual author(s) and contributor(s) and not of MDPI and/or the editor(s). MDPI and/or the editor(s) disclaim responsibility for any injury to people or property resulting from any ideas, methods, instructions or products referred to in the content. |
© 2024 by the authors. Licensee MDPI, Basel, Switzerland. This article is an open access article distributed under the terms and conditions of the Creative Commons Attribution (CC BY) license (http://creativecommons.org/licenses/by/4.0/).


