1. Introduction
The Zagros Basin is a significant hydrocarbon-rich territory with 77 billion barrels (bbl) of oil resources and 45 trillion cubic feet of recoverable gas reserves [
1,
2,
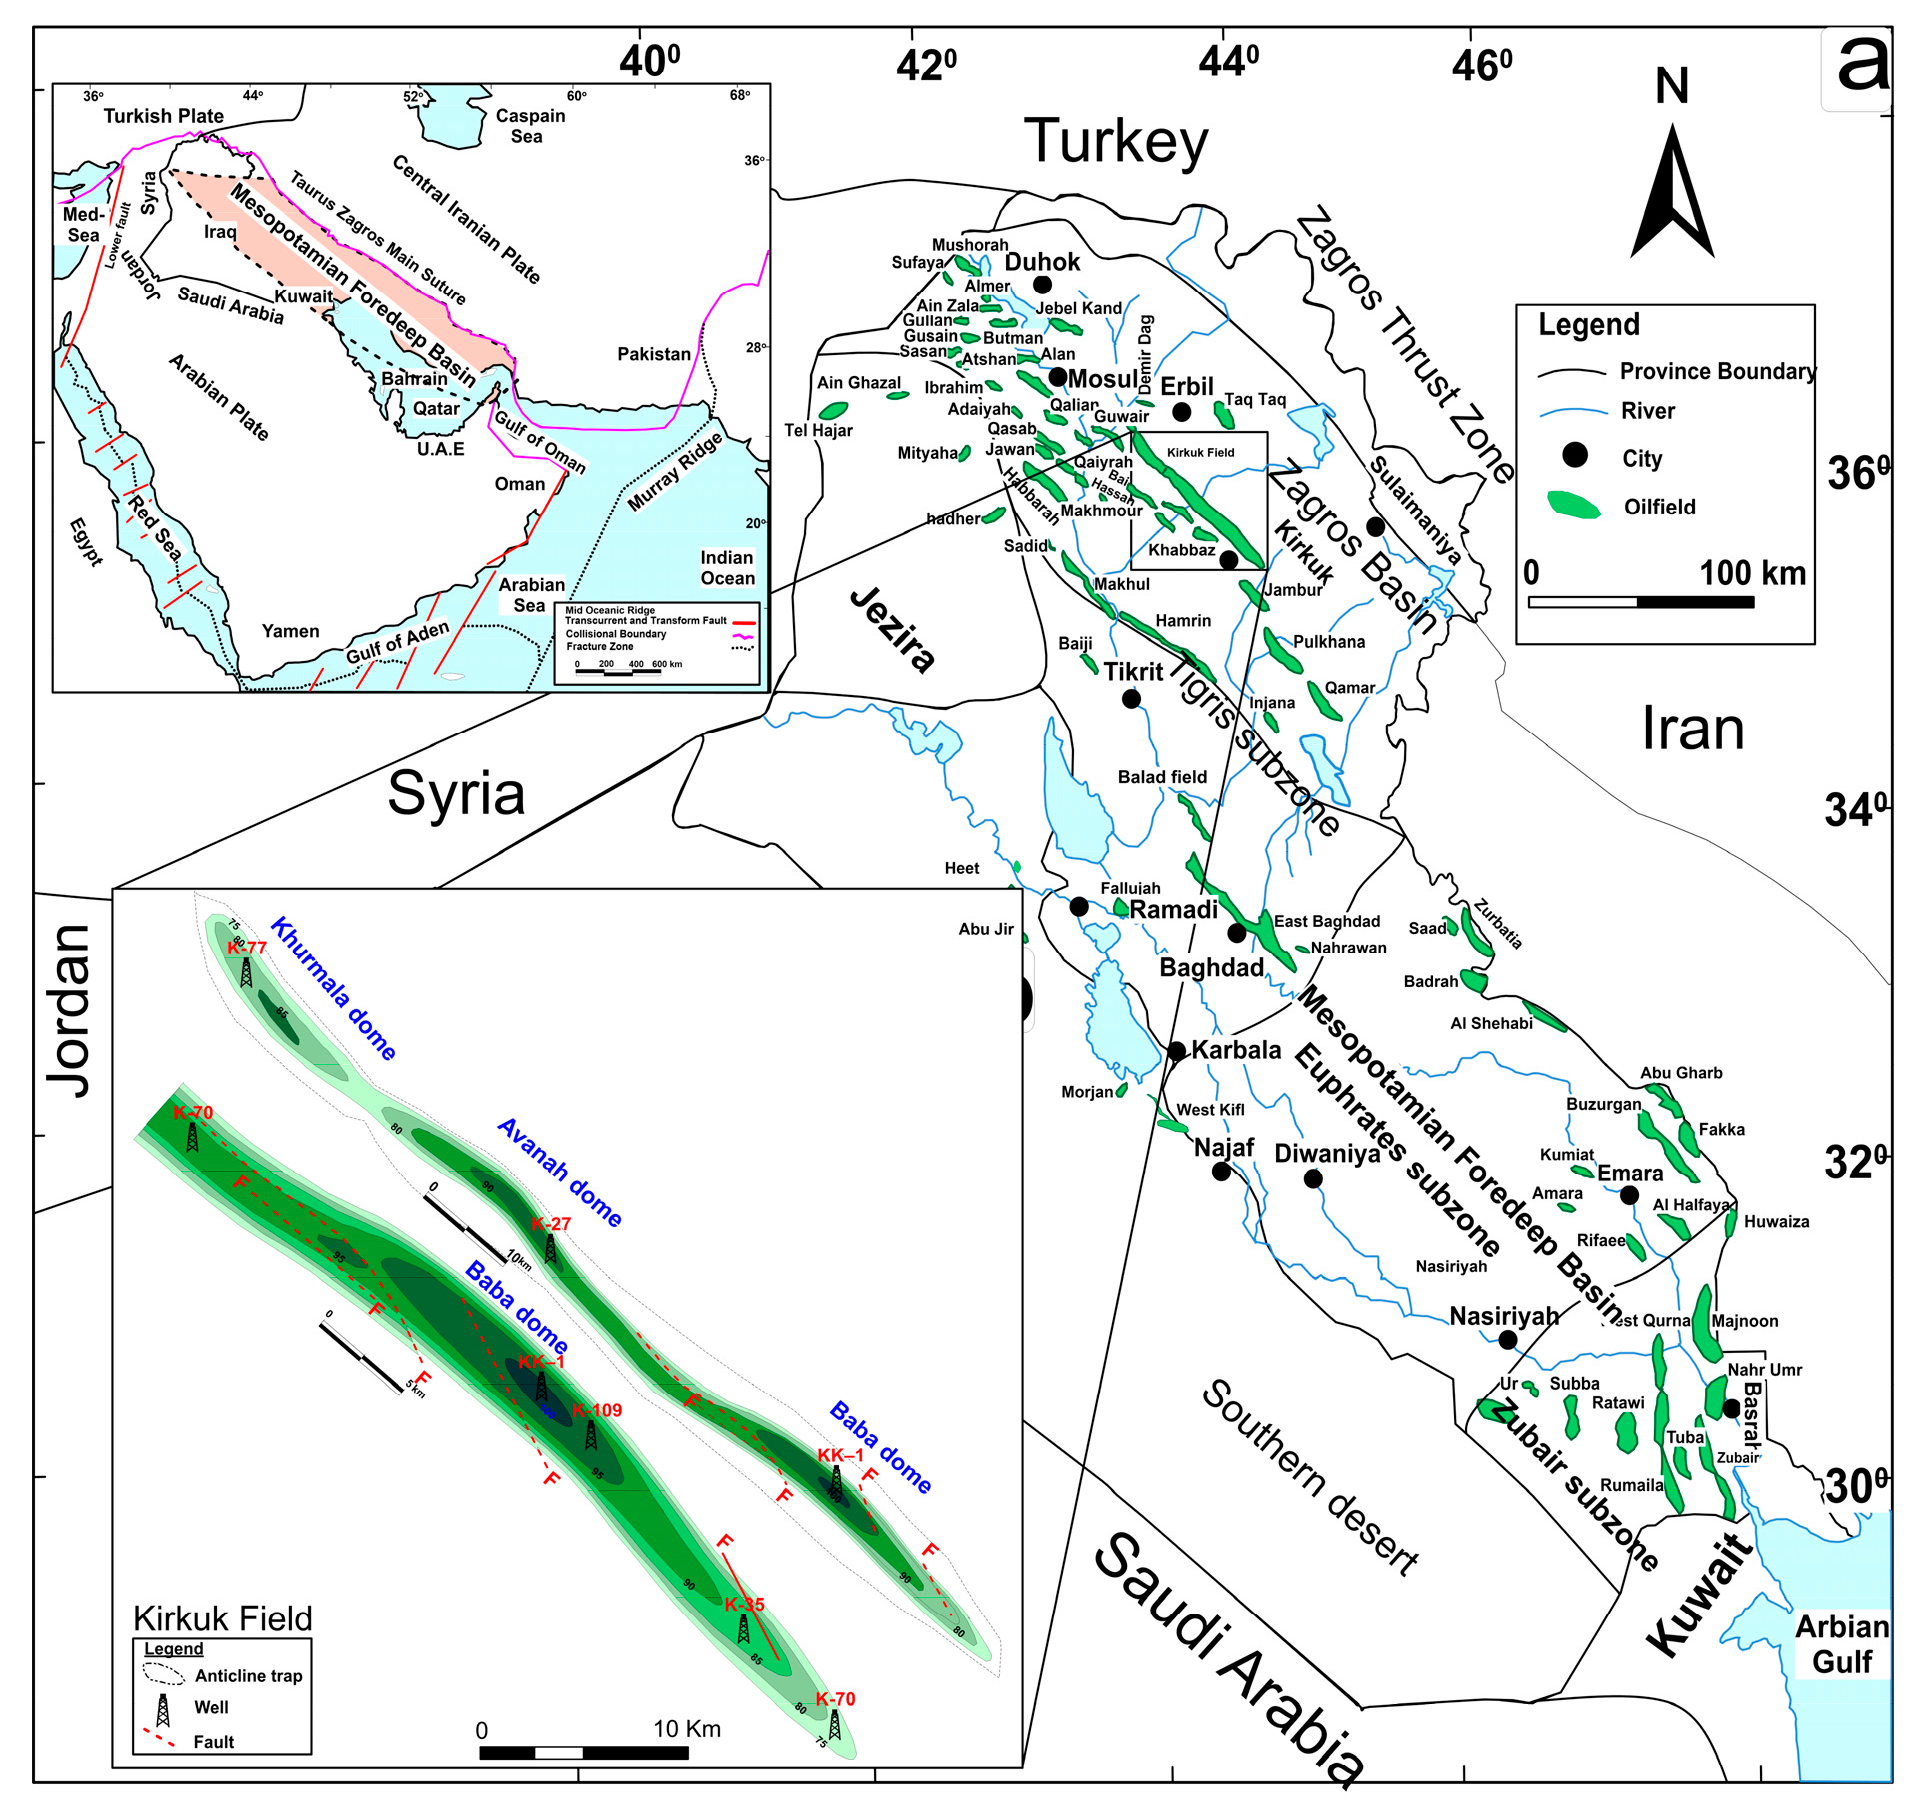
3]. This study emphasizes the Kirkuk field, which is located northern Zagros basin, is a primary target of the current investigation because of its oil and gas resources. The Zagros basin is considered a vital hydrocarbon province, containing the most prominent petroleum-rich fields, such as the Kirkuk, Bai Hassan, Jambur, Qaiyarah, Makhamur, and Pulkhana fields in the Kirkuk region, Ain Zalah, and Butmah fields in the Mosul block, as well as Faka, Abu Gurab, Buzurgan, and Huwazia in the southern part of the Zagros basin (
Figure 1).
The Iraqi Petroleum Corporation (IOC) regularly initiated hydrocarbon explorations throughout this region from 1926-1931. The petroleum-based exploration, production, and development in the area piqued the attention of both researchers and petroleum companies [
3,
4,
5,
6,
7,
8,
9,
10,
11,
12,
13]. There are several Jurassic-Miocene rock formations discovered in the Zagros Basin, including significant source and reservoir rocks [
6,
14,
15,
16,
17,
18,
19,
20]. Most of the hydrocarbon exploration in the Kirkuk field is limited to the carbonate-rich reservoir intervals of the Bajwan and Baba formations (e.g., Al-Jwaini and Gayara, 2018). Moreover, the Zagros Basin comprises a variety of oil exploration source rocks, comprising organic-rich limestone and sub-ordinate shales mostly from Jurassic-Cretaceous sequences, including Sargelu, Najmah/ Naokelekan, Chia Gara, and Balambo formations [
11,
22,
23,
24]. Such intervals represent significant oil and gas resources in Iraq, and an assessment of their generation capability is essential to recognize their potential for conventional hydrocarbon resources. The above findings imply that organic-rich strata of the Sargelu, Najmah, Chia Gara, and Balambo formations are organic-rich deposits with overall organic carbon values of up to 12 wt% with Types II and III kerogens (oil-gas-prone) and consequently could be primary sources of hydrocarbons with a higher generation potential.
Despite the above, the organic-rich Chia Gara Formation and associated oils in the Zagros basins and the Kirkuk field (
Figure 1) have remained poorly studied in previously published works [
25,
26,
27,
28]. The main objective was to provide a comprehensive overview of conventional hydrocarbon resource exploration across the Zagros Basin. Forty-seven bituminous-rich samples from the Chia Gara deposit were retrieved from the KK–109 well in the Kirkuk field. The objectives were as follows: (a) describe the quantity and quality of organic materials, together with the thermal maturation of potential Tithonian–Berriasian source rocks, (b) Simulation involving burial and timing of petroleum generation and expulsion in order to determine a genetic relationship between the expelled crude oils and the possible source rocks from Chia Gara strata in the Kirkuk field, Zagros Basin.
2. Geological Background
Exploration for oil and gas in Iraq is highly reliant on the Arabian Plate’s tectonic activities and paleo-structural development. The Arabian Plate consists of two distinct parts (1) the Arabian Shield and (2) the Arabian Platform. Iraq represents part of the Arabian platform and can be subdivided into five different tectonostratigraphic zones bordered by significant faults: the thrust and folded zones (Zagros basin), the Tigris, Euphrates, and Zubair subzones (Mesopotamian Basin), the Rutbah, Jezira, and Salman zones [
29,
30]. Zagros basin covers over 553.000 km2 of Turkey, northeastern Syria, Iraq, and the northern to southeastern Iranian provinces, making it the second-largest basin in the Middle East [
31,
32,
33]. On the east, the Zagros Mountains border this basin, while on the west, the Mesozoic stable shelf (Pitman et al., 2004). Zagros Basin is an elongated fold region separated into two suture zones: the Inner and Outer Zagros sutures. The former includes Kirkuk embayment within Iraq as well as Dezful embayment in addition to Lurestan and Fars Arcs located in Iran governorate. The Kirkuk embayment contains vital oilfields, including the study area (Kirkuk field), in addition to other fields such as Hamrin, Bai Hassan, Taq Taq, Demir Dagh, and Jambur fields located in the thrust and folded zones (
Figure 1a).
The opening of Neo-Tethys throughout the Triassic–Middle Cretaceous eras marked the significant tectonic activity in the study area, reaching up to 4000 km in width and resulting in an accumulation of approximately 4.505 meters of thick sediments dating Middle Jurassic–Middle Miocene times, including significant source rocks and reservoir pay zones [
34,
35]. Furthermore, The Jurassic-Cretaceous source rocks were better preserved due to graben and semi-graben development [
36]. During the Late Cretaceous and Miocene-Pliocene periods, multiple stages of convergence (subduction) between the Turkish-Iranian plates and the Arabian platform occurred, resulting in vast erosional events and the construction of the Zagros Mountains and anticlinal structures in Iraq [
20,
37,
38]. Main tectonic activity in the Arabian platform has led to the Kirkuk field’s construction, comprising long, asymmetric anticlines separated by narrower synclines and marked by thrust faults (
Figure 1b; McQuarrie 2004; Ameen 1992).
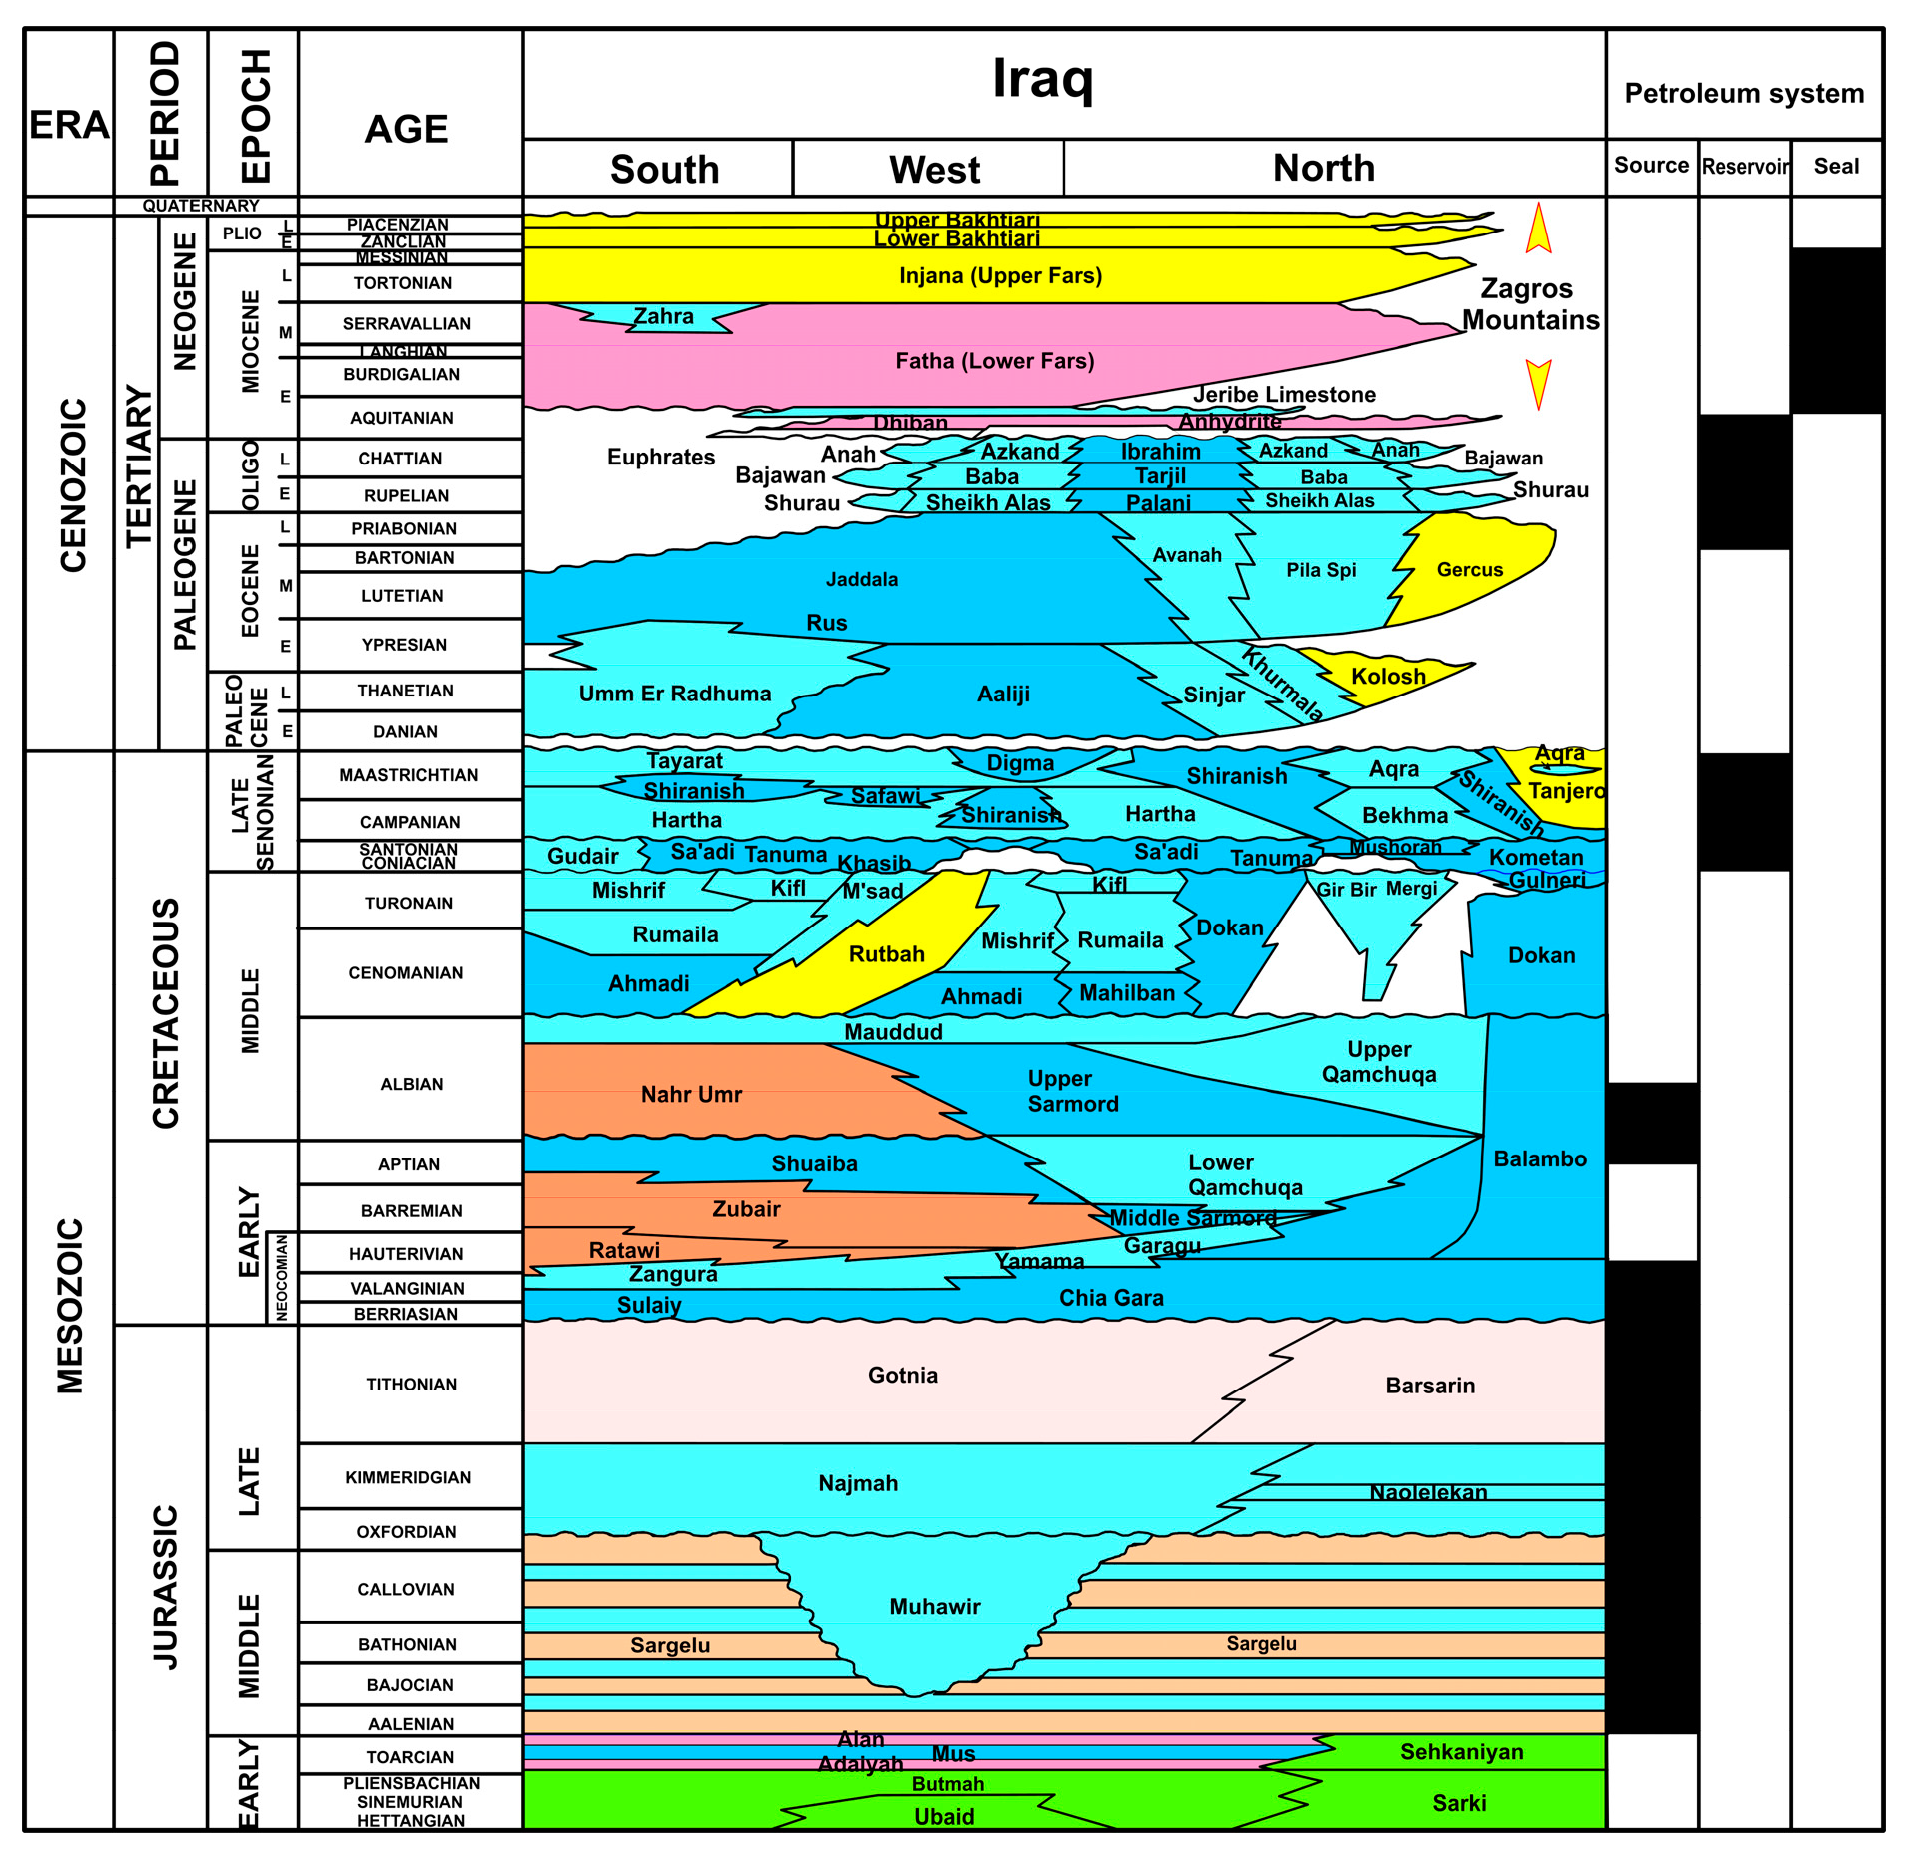
As shown in
Figure 2, the primary lithostratigraphic sequences in northern Iraq accumulated from the Jurassic to the Tertiary periods consisted of marine and subordinate lagoon sediments consisting of thick carbonate-shale sedimentary rock intervals (Buday, 1980). The Chia Gara Formation’s stratigraphic bedrock will be the emphasis of this study.
The Chia Gara Formation has been dated and ascribed to the Late Jurassic-Early Cretaceous (Tithonian-Berriasian) based on Calpionella Alpina sp. and Celliptica sp. [
40]. Wetzel (1950) was the first to describe the Chia Gara interval at the type section in the Chia Gara anticline near Amadia Province, northeastern Iraq [
40]. This formation consists of a sequence of limestones and shale beds bearing ammonite faunas and diverse species of ostracods, foraminifera, and Radiolaria that extends throughout northern and southern Iraq’s Zagros-Mesopotamian foredeep basins. In the type section, the formation’s thickness reached 233 meters [
41,
42]. Furthermore, the Chia Gara interval in the study area (i.e., Kirkuk field) consists mainly of thick strata (250 m) of organic-rich carbonate and shale units. The organic-rich Chia Gara interval is overly the Gotnia (anhydrite) Formation with unconformable contact. It is overlined by the Balambo, Garau, and Zangura formations from northern to southern Iraq, respectively (
Figure 2). Following the deposition of carbonate-rich and condensed shales, the Balambo and Garau formations were deposited [
30,
40,
43].
3. Materials and Methods
3.1. Sample Preparation and Organic-Geochemical Procedures
The Iraqi Petroleum Company (IPC) and Iraqi Northern Petroleum Corporation (INPC) provided forty-seven core and cutting samples. Rock samples have been retrieved from the Tithonian–Berriasian Chi Gara interval (KK–109 well) in the Kirkuk Filed, Zagros Basin, Northern Iraq (
Figure 1;
Table 1). The collected samples have been analyzed in GeoMark Research Ltd. (Houston, Texans; United States).
Collected samples were comprehensively analyzed for total organic carbon (TOC wt%), followed by pyrolysis Rock-Eval (
Table 1).
Before the TOC and pyrolysis analytical approach, rock samples were washed several times with distilled waters to remove contamination and perhaps other drilling fluid components from the acquired cuttings samples. Collected samples were pulverized and reacted with hydrochloric acid (HCl) in a conical flask to dissolve carbonates and transferred into the LECO-C230 combustion furnace to measure TOC. This infrared detector-based combustion furnace is used to monitor carbon contents. In the presence of oxygen (O2), carbon atoms oxidize to carbon dioxide (CO2) during the combustion process performed by the LECO-C230 analyzer. After removing moisture and particles, CO2 contents are determined using an infrared solid-state detector.
Following the method outlined by Lafargue et al. (1998), pyrolysis was performed on 100 mg of the pulverized samples using a Rock-Eval-6 (fully automatic RE-6) analyzer. This equipment was used to determine several parameters listed in
Table 1 (1) free HCs content (S
1) and (2) non-volatile hydrocarbons yielded by thermal degradation (S
2), (3) released CO
2 during kerogen combustion (S
3), (4) maximum recorded temperature (Tmax), produced during pyrolysis cracking [
44,
45,
46]. Other variables were also estimated, including the Hydrogen Index (HI mg HC/g of TOC), Oxygen Index (OI mg CO
2/g of TOC), Production Index (PI mg HC/g of rock), and Production yield (PY mg HC/g of rock) [
47,
48].
3.2. 1D Basin Modeling Procedure
The primary goal of the 1-D modeling techniques of the sedimentary basin was to reconstruct and evaluate the hydrocarbon generation, burial histories, and tining of HC expulsion of the Tithonian–Berriasian succession within Kirkuk oilfield, Iraq. The KK–109 well was drilled to the maximum depth of the Jurassic Mus Formation (
Figure 2;
Table 2), which was utilized to simulate these models. Kirkuk Oilfield’s well location has been selected from unpublished reports from Iraqi North Petroleum Company (NOC) and well data of the target well (
Table 2).
Geological evidence and organic geochemical data were used as input parameters for the PetroModTM (v2012.2) modeling software to simulate the burial and thermal history of the study region. This mathematical software enables users to evaluate the sedimentary basin to predict the thermal maturation and timing of hydrocarbon generation as well as their expulsion.
The burial histories and maturation models of the KK–109 well were constructed utilizing data from the studied wells, including lithology types, stages of deposition, and erosions. Unpublished well-reports provide these data from Iraqi NOC (Table 4), in addition to the geological, Stratigraphical, and petroleum geological information of Iraqi regions [
29,
30,
41,
49]. The boundary conditions in the PetroModTM software, such as paleo water depths (PWD), the temperature among sedimentary rocks and waters (SWIT), and paleo heat flow (PHF), represent significant variables for reconstructing basin models [
50]. In the current study, PWD has been provided by Al-Ameri and Wadie (2015); Al-Khafaji et al. (2021); Faqi, 2016; Gharib et al. (2021); Hakimi et al. (2018) [
11,
16,
51,
52,
53]. Furthermore, PetroModTM (v2012.2) software was used to estimate SWIT values for various geological eras [
54].
The thermal history of sedimentary basins is commonly defined by heat flow (HF), even though it is difficult to estimate it specifically throughout geological history. Consequently, vitrinite reflectance (%VRo) was usually utilized as a dataset to establish the HF and was further applied to examine the maturation of probable source rock intervals [
11,
55,
56]. In the current work, %Roˈs were calculated from pyrolysis Tmax values (optical %Ro data unavailable) utilizing the following equation [
57]: %VRo=(0.018×pyrolysis Tmax-7.16). The computed %VRo values were used to predict HF using Sweeney and Burnham’s calibrated (EASY%Ro) values. TOC content and HI data (
Table 1) were also utilized as input parameters to construct hydrocarbon generation/expulsion models across geologic periods.
Most of the Iraqi oil was found to be sourced from kerogens Type-II-S [
58]. Consequently, Type-II-S kerogen (kinetic parameters) were utilized as an input parameter in the PetroModTM (v2012.2) program to simulate the basin models (i.e., Hydrocarbon generation and expulsion) of the Upper Jurassic–Lower Cretaceous intervals.
4. Results
4.1. TOC Contents and Pyrolysis Rock-Eval
The TOC content and programmed Rock-Eval pyrolysis data including S
1, S
2, S
3, and Tmax, as well as calculated parameters HI, OI, PI, S1/TOC, and S
1+S
2 of the Chia Gara (Tithonian–Berriasian) Formation in the Zagros Basin, Iraq, are shown in
Table 1.
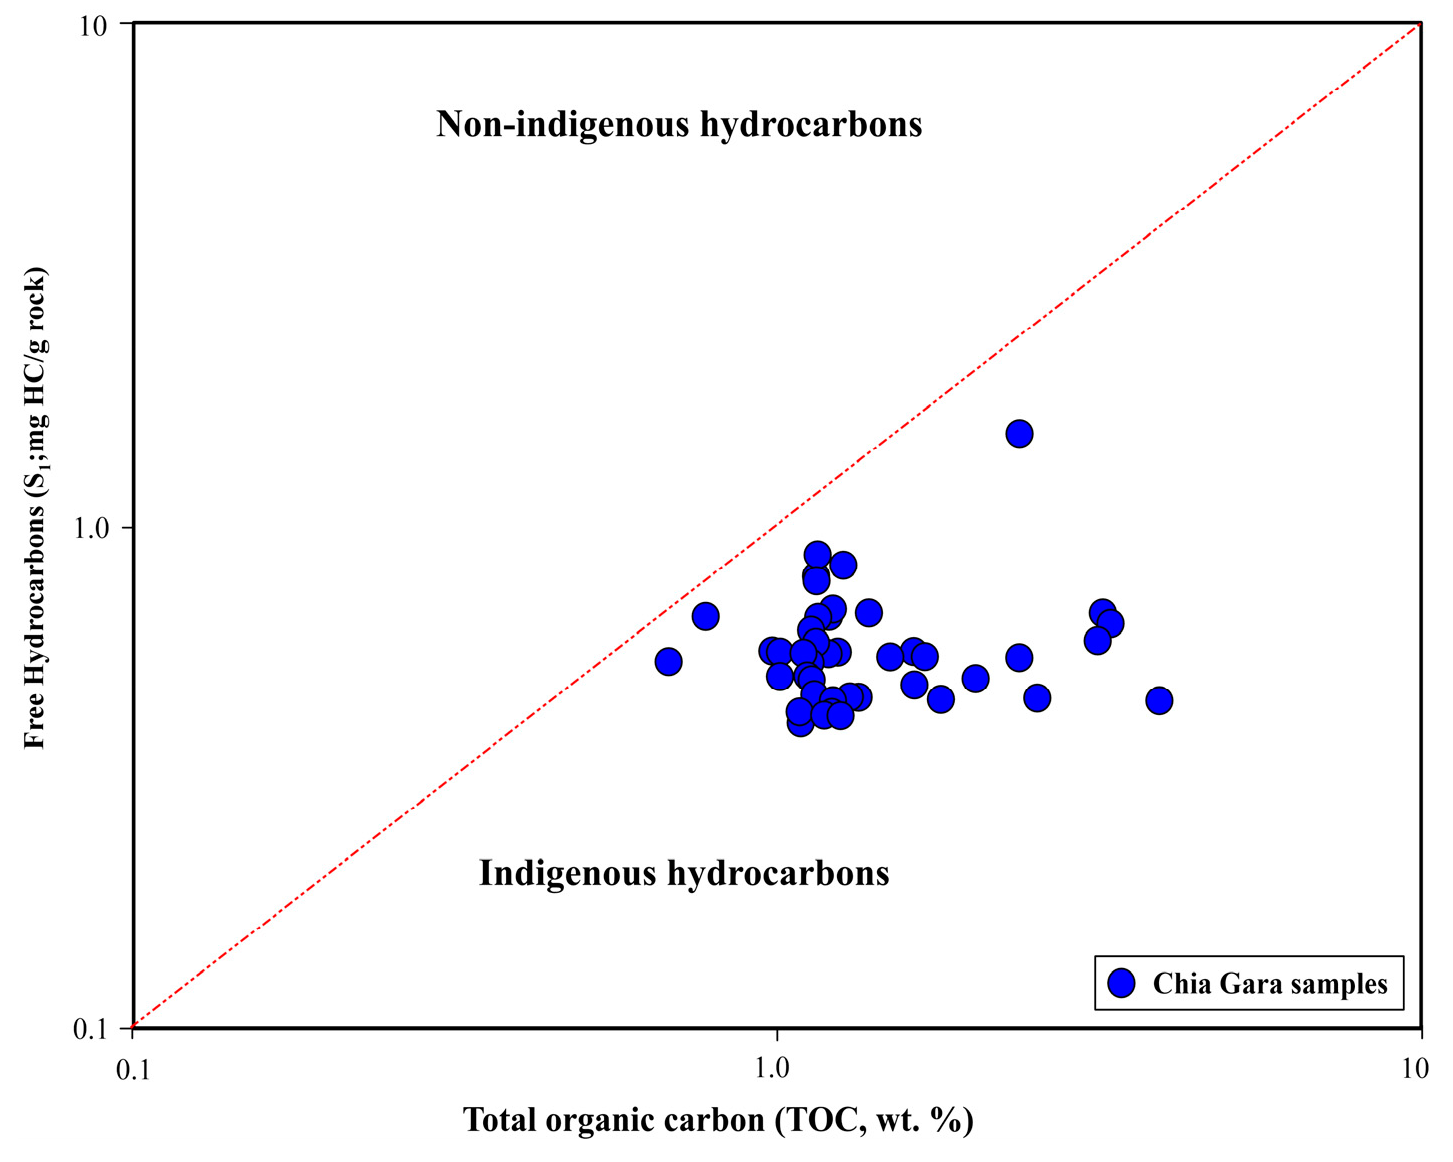
In this study, the Chia Gara Formation has TOC in the range of 0.68–3.95 wt% with an average of approximately 1.50 wt%, indicating varying organic richness across the study area. All analyzed samples have low S
1 between 0.4–0.87 mg HC/g of rock with an average of 0.55 mg HC/g of rock, indicating a range of pre-existing hydrocarbons within the rock matrix relative to high TOC values. This confirms that all of the analyzed samples from the Chia Gara Formation contain syngenetic hydrocarbons, as illustrated in
Figure 3 [
59,
60]. The generation potential or S
2 exhibits a moderate to good potential, from 2.69 to 7.87 mg HC/g of rock with an average of 4.67 mg HC/g of rock. This suggests that large amounts of kerogen can generate hydrocarbons during thermal maturation. The remaining quantity of oxygen-contained organic matter or S
3, exhibits some variation and ranges from 0.43 to 2.07 mg CO
2/g of rock with an average of 1.16 mg CO
2/g of rock.
Figure 3.
Cross plots of Rock-Eval results: TOC versus S1 plot.
Figure 3.
Cross plots of Rock-Eval results: TOC versus S1 plot.
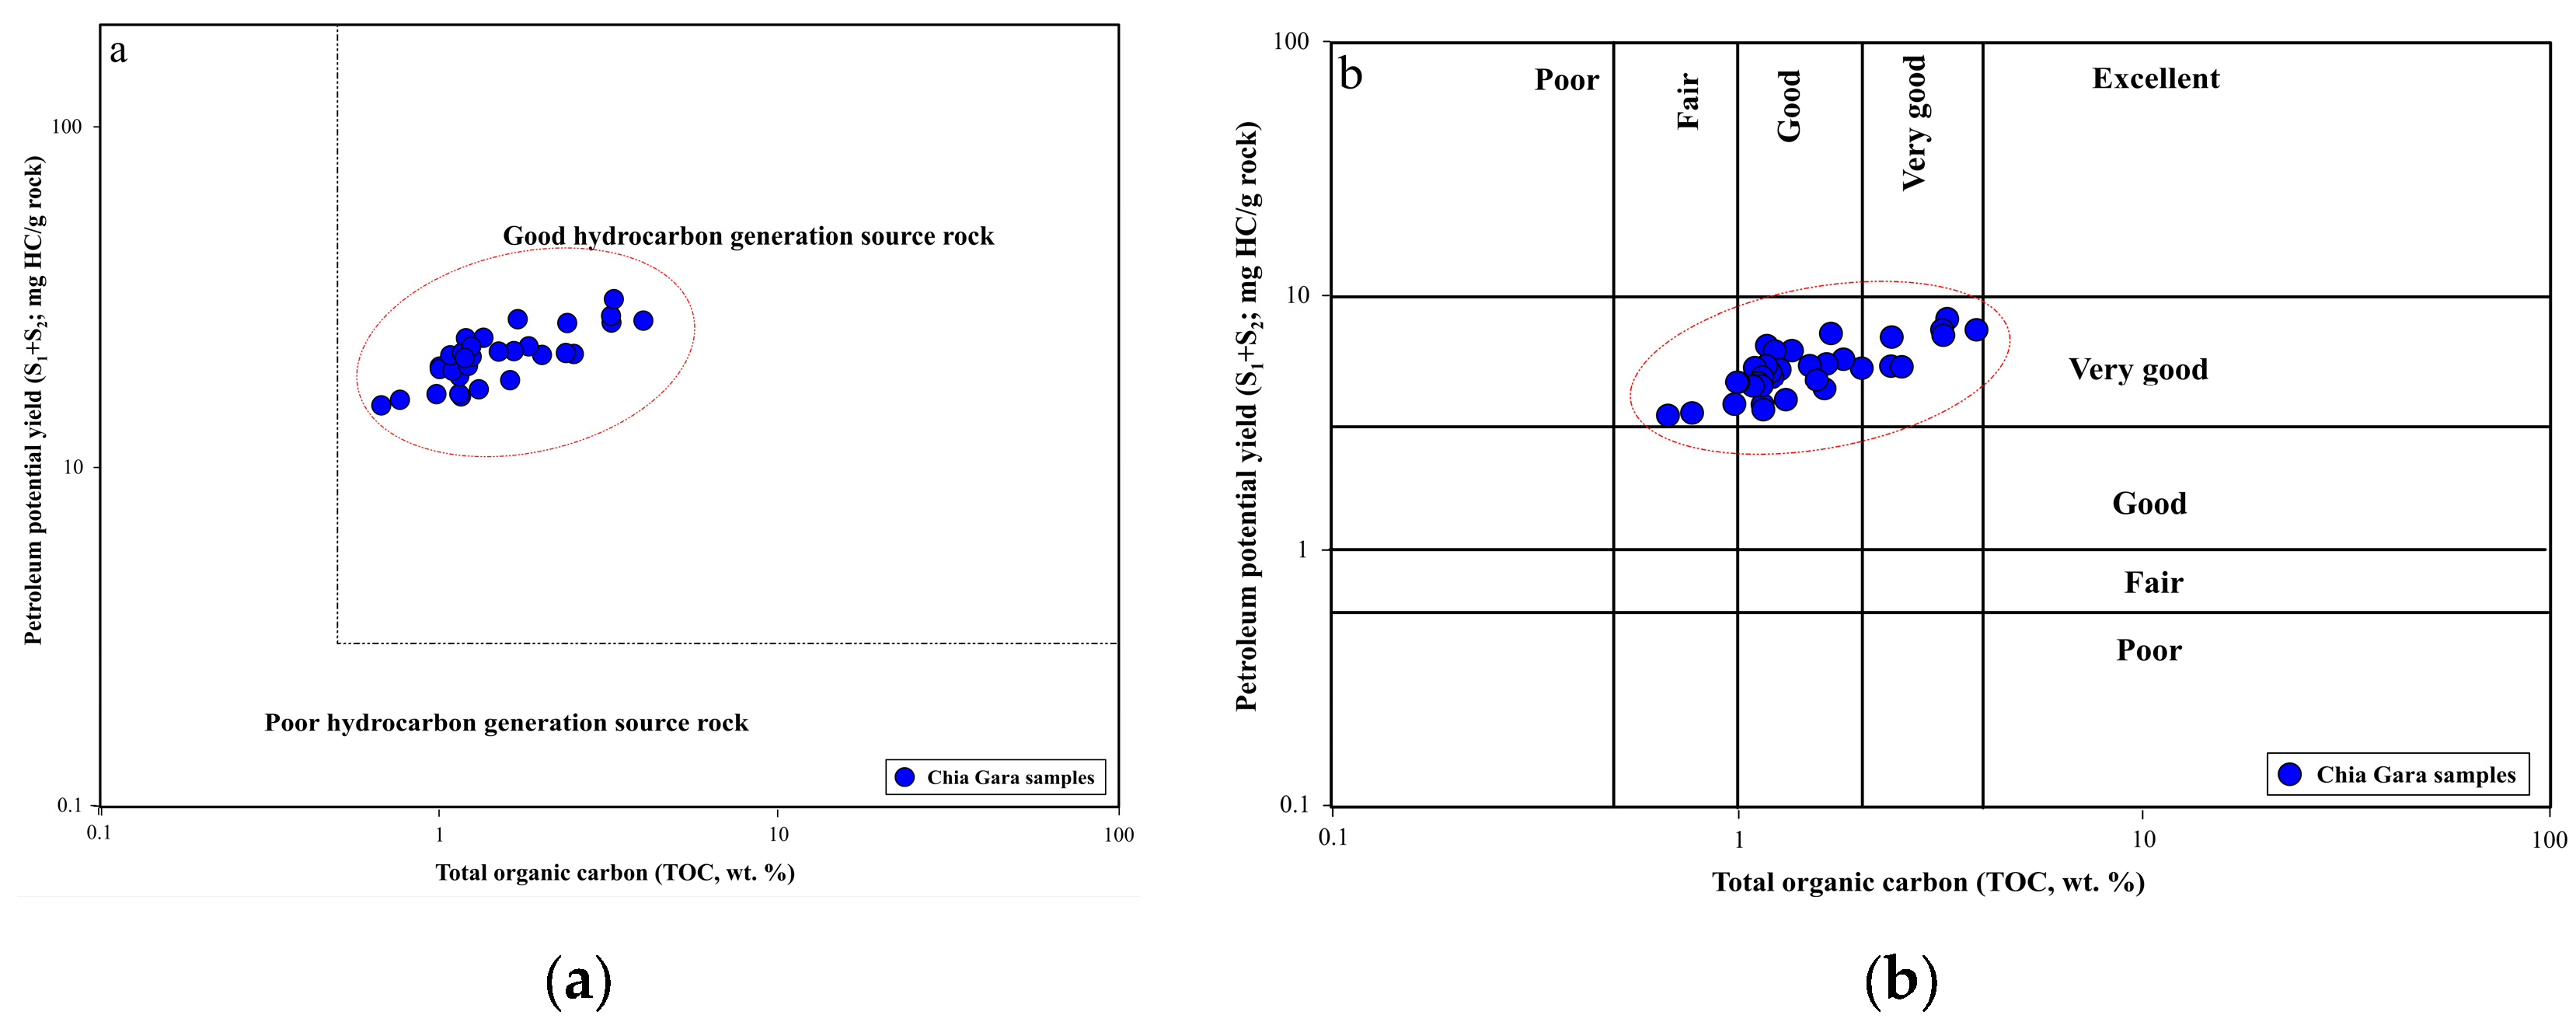
Figure 4.
Cross plot of TOC versus PY mg (HC/gm rock), showing that the analyzed Middle Jurassic to Lower Cretaceous (Chia Gara) samples from the KK–109 well in Kirkuk field with fair to very-good potential for HC generation.
Figure 4.
Cross plot of TOC versus PY mg (HC/gm rock), showing that the analyzed Middle Jurassic to Lower Cretaceous (Chia Gara) samples from the KK–109 well in Kirkuk field with fair to very-good potential for HC generation.
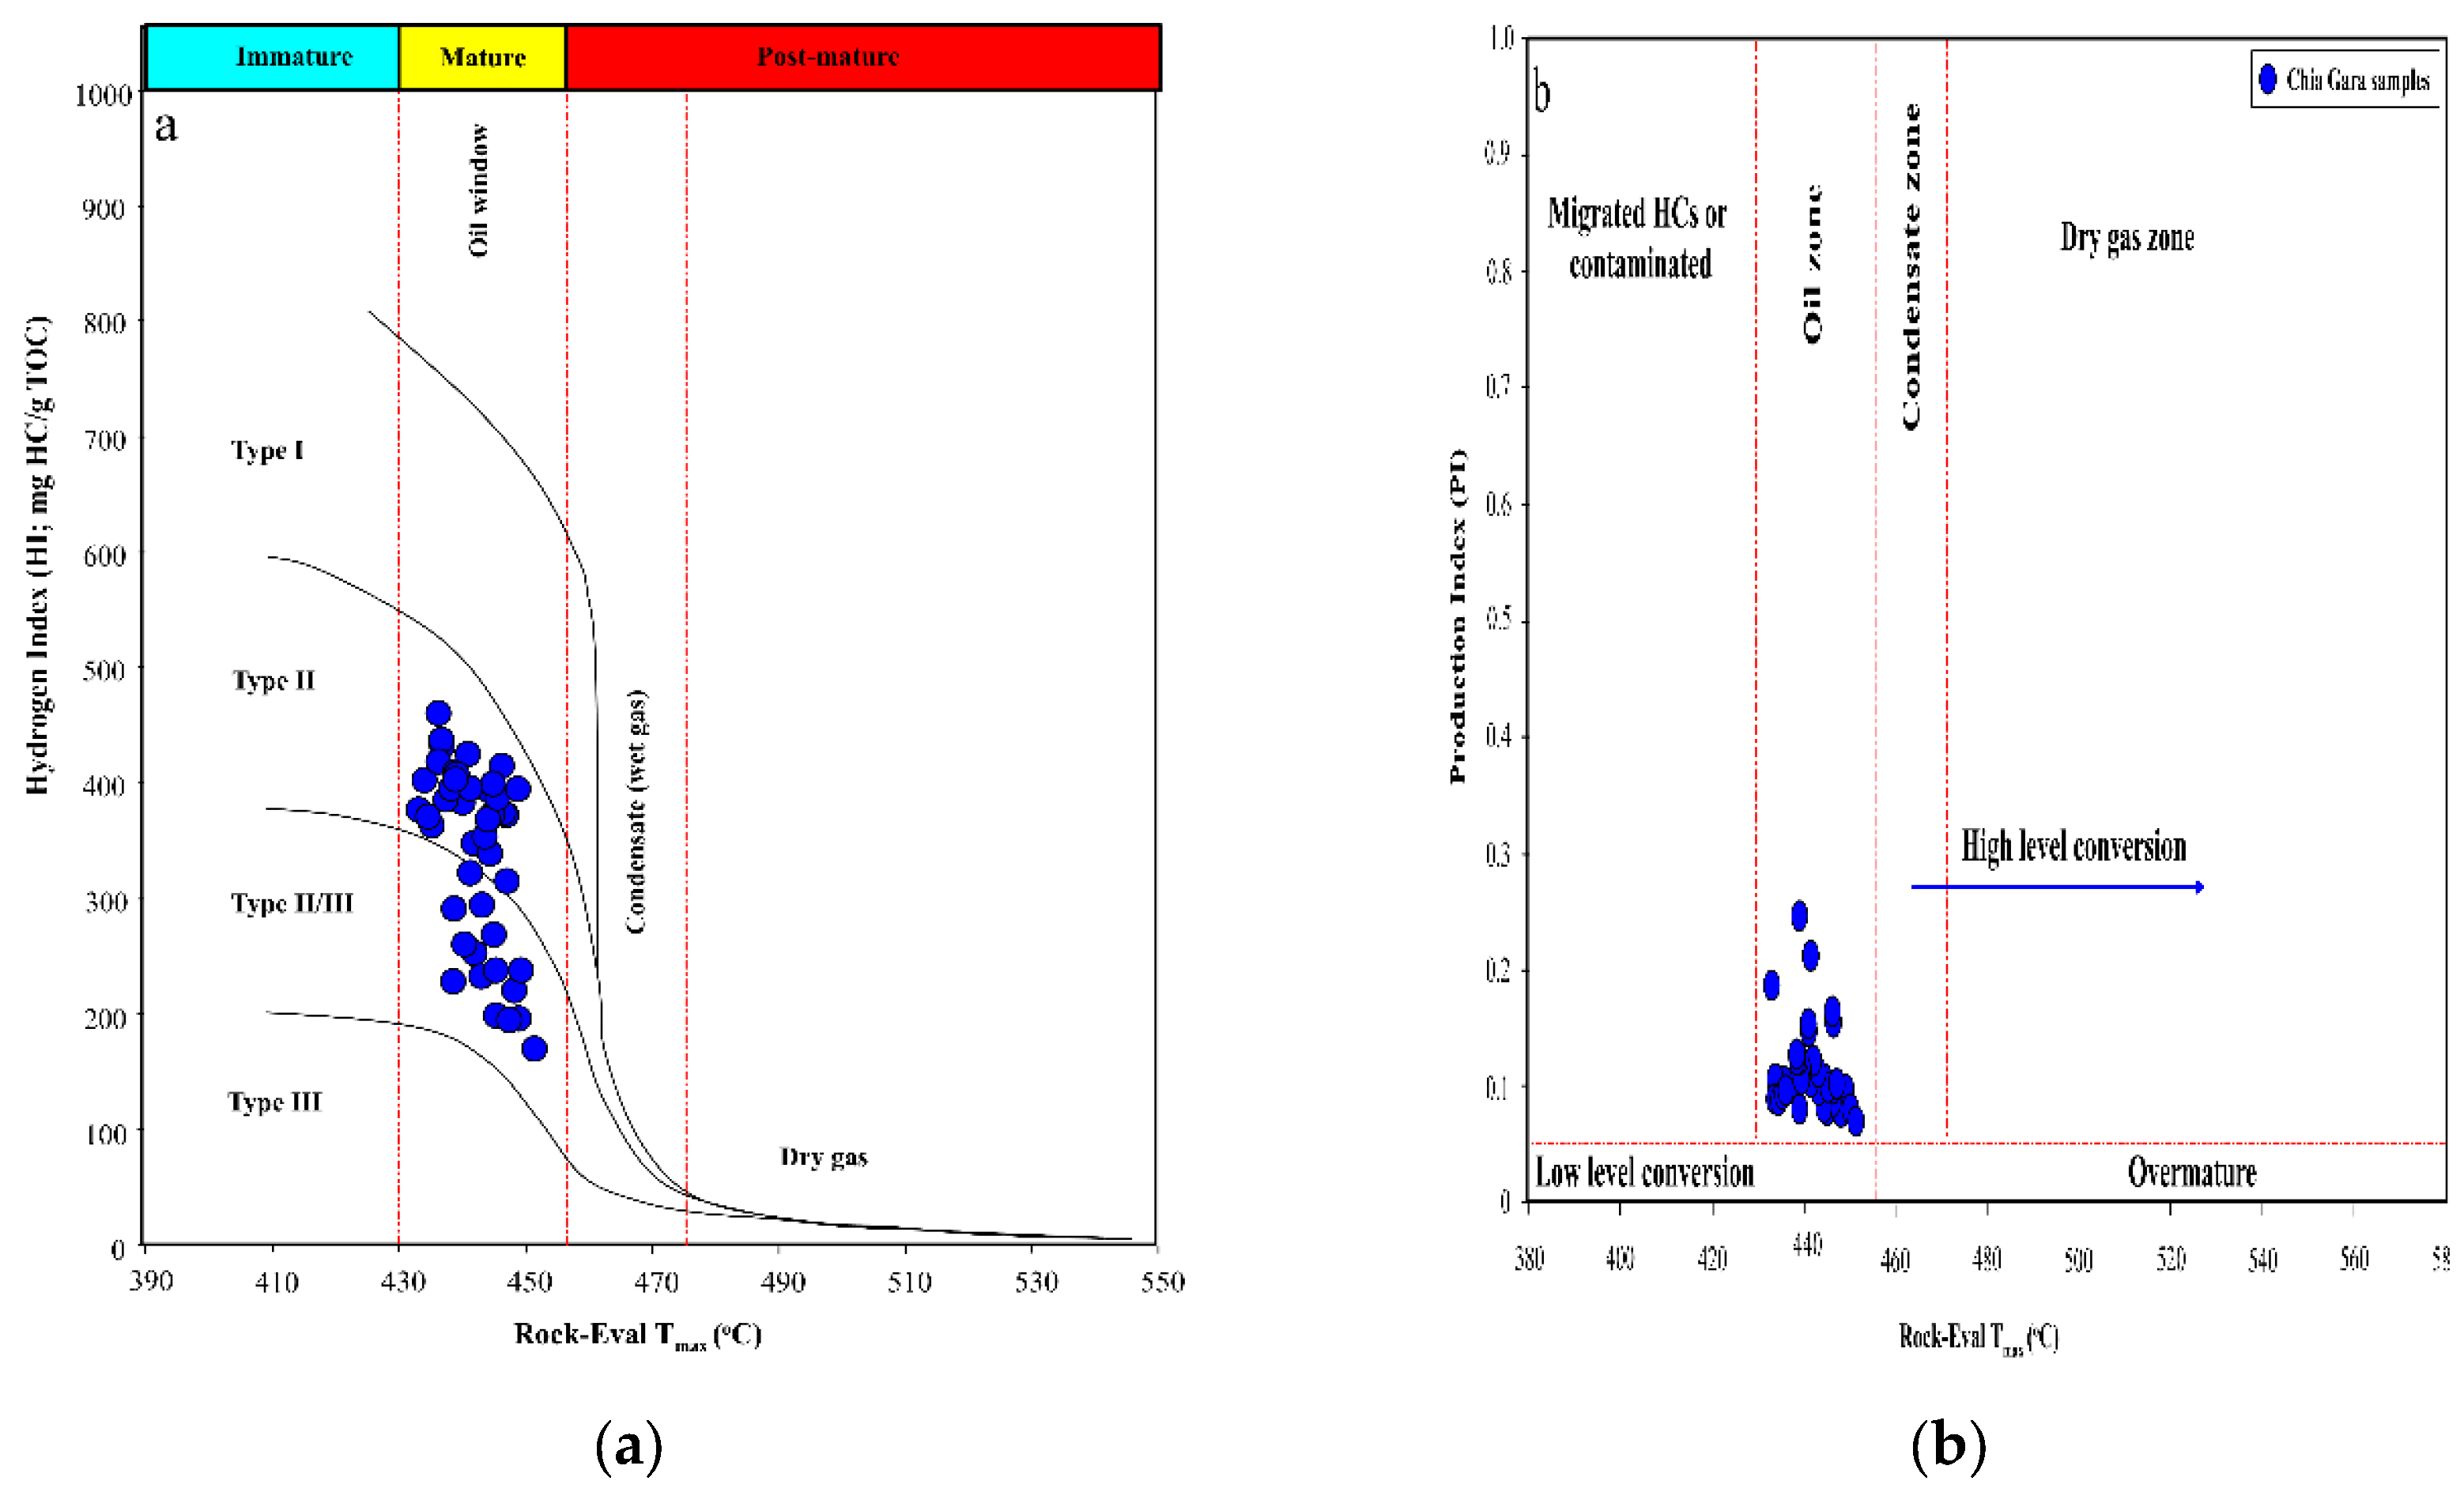
Maturity Parameters including Tmax, HI, and OI are presented in
Table 1. Tmax values range from 433 to 451°C. The Hydrogen Index (HI) is used to determine kerogen types and thermal maturity of the source rocks. Calculated HI values as the ratio of S
2 to TOC for the analyzed source rock intervals vary from 171 to 462 mg HC/g of TOC. Notably, most samples exhibit HI values exceeding 200 mg HC/g of TOC. The Oxygen Index (OI), representing the ratio of S
3 to TOC, shows a wider variation, ranging from 14 to 170 mg CO
2/g of TOC. Depending on the S
1 and S
2 values, calculated PI values are in the range of 0.08–0.24 HC/g of TOC (average= 0.11) for examined Chia Gara samples (
Table 1), with the highest PI values of 0.24 HC/g of TOC obtained from sample number 21. On the other hand, calculated PY values are in the range of 3.37–8.52 (
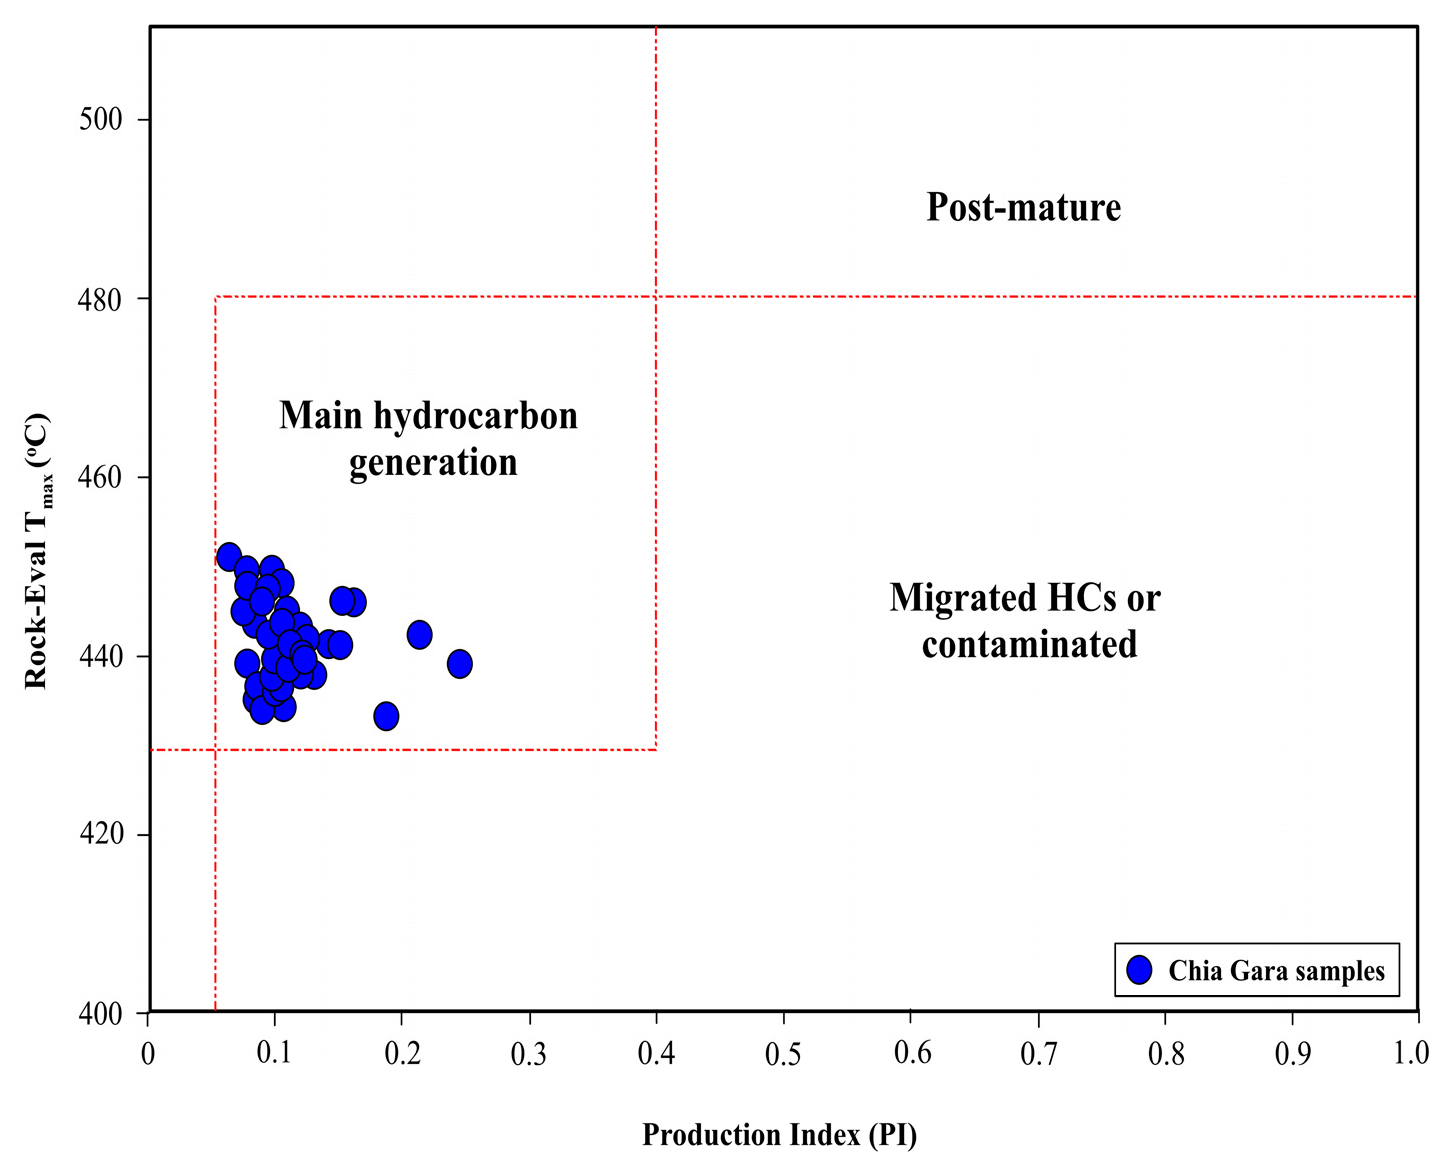
Table 1). According to the Rock-Eval analysis data results, it can be noted that Rock-Eval pyrolysis Tmax values are high, mainly in the range of 433–451
oC 442 with an average of 442
oC (
Table 1;
Figure 5b and
Figure 6).
Figure 5a and
Figure 6 reveal a positive link between the Tmax values acquired by Rock-Eval pyrolysis and HI, PI values estimated for the investigated rock samples demonstrate mature source rocks interval.
4.2. Basin Modeling and Thermal History
Recognizing the thermal history development of sedimentary basins is crucial for estimating the maturation history and hydrocarbon generation potential from the basin’s source rocks as well as for hydrocarbon migration [
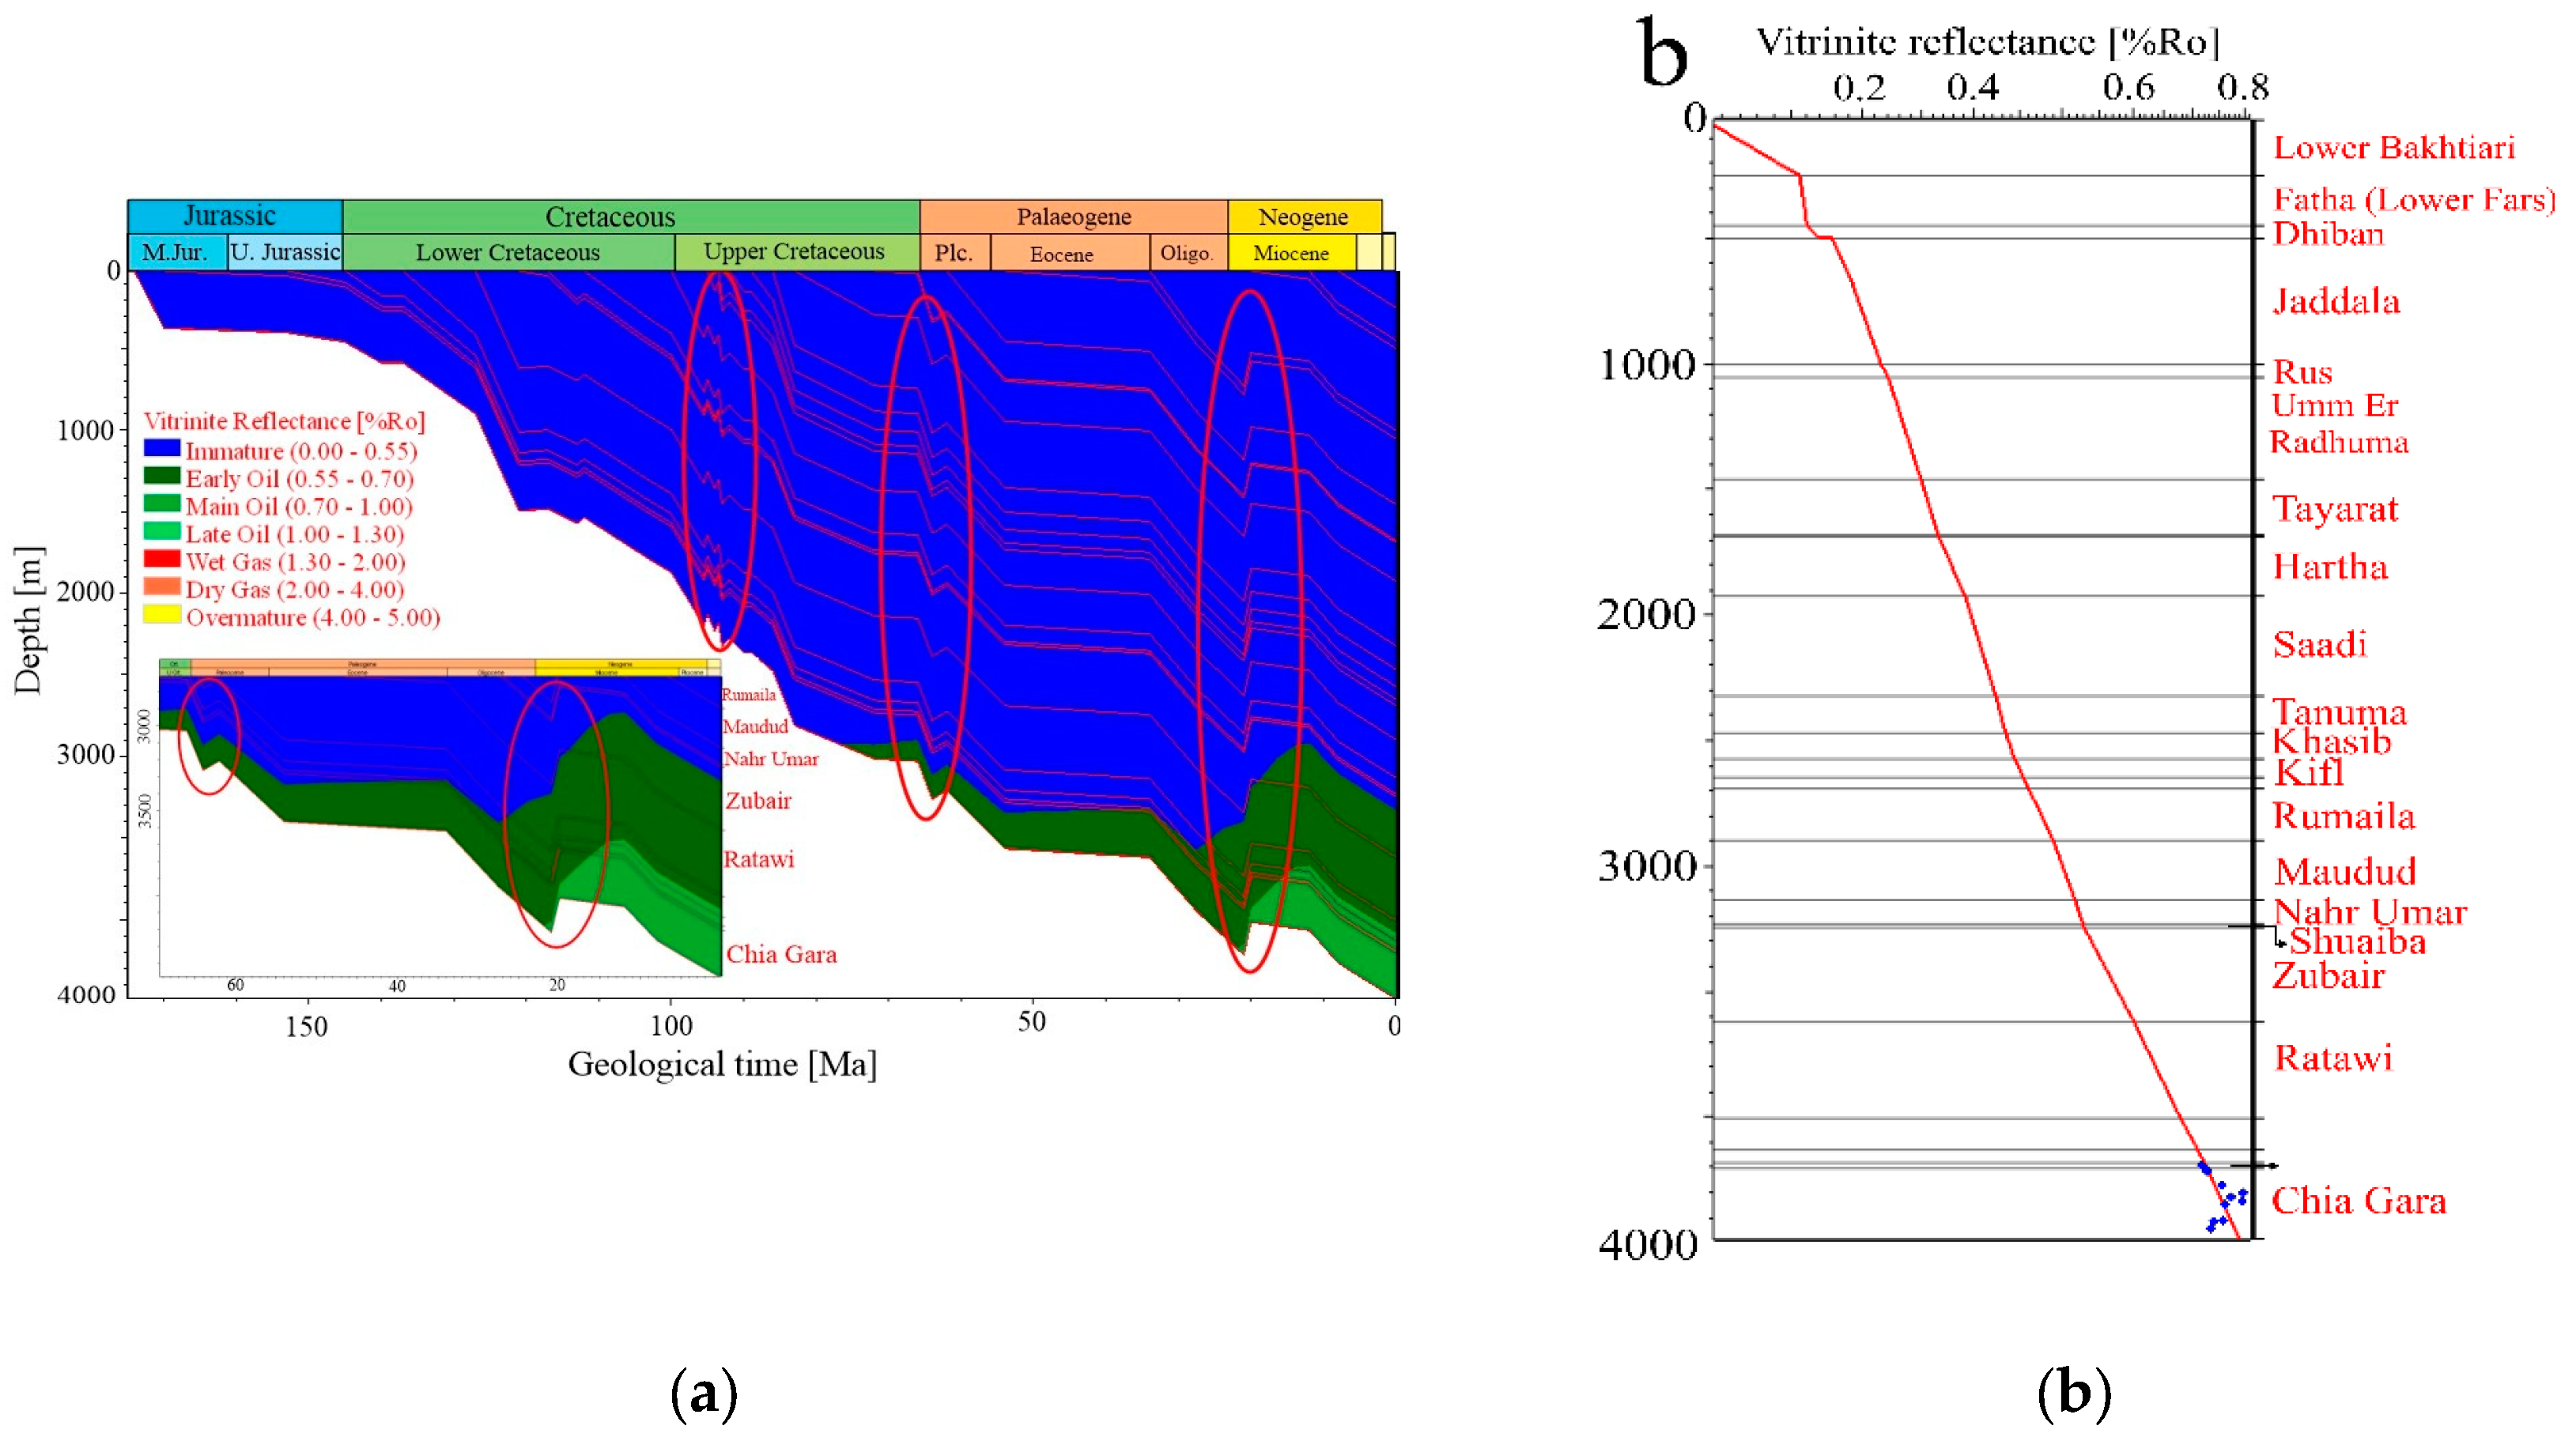
61]. 1-D PetroModTM (v2012.2) simulations were performed on a KK–109 well from the Kirkuk oilfield. The burial and thermal history models, including vitrinite reflectance (%Ro) and transformation ratios (%TR), are presented in
Figure 7 and
Figure 8. The burial history model (
Figure 7) shows that the examined source rock formations were buried to depths greater than 3000 m. This model (
Figure 7) also confirmed a total of six erosional stages associated with tectonic events of convergent boundaries across the Arabian, Iranian, and Anatolian plates from the Cretaceous (113–92 Ma) to the Early Miocene (22 Ma) (e.g., Ameen 1992; Beydoun 1993; Pitman et al. 2004; Gharib et al. 2021, 2024). In conjunction with the erosional intervals, the paleo-heat flow is a relevant parameter and significantly affects the output of maturation models. In this study, suitable heat flow values are determined to be 45 to 64 mW/m2 (
Table 2), based on a comparison of Sweeney and Burnham’s maturity EASY%Ro model with calculated data in the examined well (
Figure 7). A good match is obtained between calculated %Ro values from Rock-Eval Tmax data and the modeled EASY%Ro values. The calculated %Ro values range from 0.69 to 0.80%, while modeled EASY%Ro values range from 0.71 to 0.80% (
Table 2;
Figure 7b).
During the Upper Cretaceous to Miocene age (83–22 Ma), the Chia Gara Formation underwent an initial phase of oil generation consistent with modeled EASY%Ro values between 0.71–0.80% (
Table 2;
Figure 8). From the Miocene continuing to the current day (22–0 Ma), the Chia Gara Formation experienced the peak phase of oil expulsion, with %Ro values ˃0.71 and %TR ˃55% (
Figure 8).
5. Discussion
5.1. Abundance of Organic Matter
The TOC contents and pyrolysis results can be used to evaluate the organic matter content and quality as well as the thermal maturity of the possible source rocks [
48,
64,
65]. The organic matter richness of examined rock samples is generally expressed as TOC content in wt%. The minimum acceptable TOC value for carbonate-rich rocks indicating good generation potential of rock is ˃ 1.0 wt% [
48,
66].
The Upper Jurassic–Lower Cretaceous rock interval, i.e., the Tithonian–Berriasian (Chia Gara) Formation possesses overall high organic content (
Figure 3), as evidenced by the TOC as well as the S
1 and S
2. All samples from the Chia Gara formations have syngenetic hydrocarbon content (
Figure 3), as evidenced by the TOC versus S
1 plot [
59,
60]. TOC values of 29 samples exceed 1.0 %, illustrating that these intervals possess above-average quantities of organic matter with the potential to yield considerable amounts of hydrocarbons in the Kirkuk field.
The analyzed Upper Jurassic–Lower Cretaceous samples, Chia Gara Formation samples show fair to very good source rock potential (
Figure 4), as evidenced by TOC content of up to 2.84 wt.%, S
1 up to 1.60 mg HC/gm rock, and S2 up to 5.69 mg HC/gm rock. These findings may indicate anoxic conditions and moderate sedimentation rates. The higher generation potential of these source rocks within the Zagros basin is predominantly influenced by various parameters related to depositional environmental conditions, including anoxia, sea level change, and preservation of organic matter.
5.2. Organic Matter Types and Thermal Maturation
Thermal maturity is one of the critical parameters for source rock evaluation. Hydrocarbon generation is related to the maturation levels of source rocks. In the current study, geochemical and biomarker maturity indicators, including Rock-Eval data (
Table 1) and the distributions of steranes and hopanes, were used to evaluate the thermal maturity of organic matter.
The analyzed samples revealed high Rock-Eval Tmax values (433–451°C). Higher values are associated with greater maturity, while lower values are consistent with lesser mature organic matter. Subsequently, the organic matter in the examined samples is likely in the oil window. The Hydrogen Index (HI), calculated as the ratio of S2 to TOC, varies from 199 to 462. Notably, most samples exhibit HI values exceeding 200, which is generally indicative of kerogen Type II with minimal content of mixed Type II/III kerogen with good potential for oil generation (
Figure 5a). this finding is also confirmed by the cross plot of Tamx versus production index (PI) as presented in
Figure 5b. The Oxygen Index (OI), representing the ratio of S
3 to TOC, shows a wider variation, ranging from 14 to 170. Lower OI values suggest a lesser abundance of oxygen-containing organic matter, which is favorable for hydrocarbon generation potential.
The PI of source rocks can also be used as a thermal maturity indicator. It can be defined as a ratio of the quantity of hydrocarbons generated to the total hydrocarbons that the organic matter can generate [
67,
68]. The source rock samples with low PI values of < 0.10 specify immature source rock intervals, while higher values (0.10-0.30) are associated with higher oil generation potential. This study’s PI value reaches up to 0.24 HC/g of TOC (
Figure 5b and
Figure 6), indicating that the examined rock samples are mainly the oil window.
Based on pyrolysis Tmax and HI data (
Table 1,
Figure 5a), most analyzed samples from the Upper Jurassic–Lower Cretaceous interval are thermally mature. This is consistent with the combination of Tmax and PI (
Figure 5b and
Figure 6), indicating that the studied samples at thermal maturity were equivalent to the oil window.
5.3. Mechanism for Oil Generation and Expulsion
The geochemical results of the KK–109 well highlighted four potential source rock intervals within the Zagros basin. 1-D basin models showed the hydrocarbon generation and expulsion timing of the examined source rock interval.
The burial history model and subsidence curves (
Table 2;
Figure 7a) show that the Jurassic succession has a long burial history (174–145 Ma) with relatively low subsidence rates (~11 m), leading to the accumulation of approximately ~329 m of organic-rich sedimentary rocks. During the Cretaceous-Tertiary period (
Figure 7), the sedimentation rate and subsidence were elevated, leading to a current thickness of ~4000 m.
The basin model (
Figure 7), shows that the Cretaceous period (145–64 Ma) is characterized by a rapid sedimentation rate with a subsidence rate of about ~31 per Ma resulting in a current thickness of ~2530. Low sedimentation rate and subsidence of about ~3 m per Ma were observed during the Tertiary period, leading to a current thickness of about ~193 m. The burial history model (
Table 2;
Figure 7a) shows erosional events of about 405 m of sedimentary rocks within the study region, till the Late Miocene. The thermal history model and curve display (
Table 2;
Figure 8) show that the source rock intervals reached the onset of the early oil window (modeled EASY%Ro from 0.71 to 0.80).
As mentioned earlier, oil generation from the organic-rich rocks occurred around 83 million years (Ma) ago throughout the Upper Cretaceous. This finding is consistent with the early maturation process associated with the limestone rocks containing Types II/III and III kerogen (
Figure 5a) with reasonably high TOC content (
Table 1;
Figure 3 and
Figure 4). During the Early Miocene (~22 Ma), the oil expulsion reached aligns with modeled EASY%Ro ranging from 0.71 to 0.8. The presence of limestone influences the chemical characteristics of hydrocarbons, originating during the initial stages of maturation due to the Type II–S kerogen content. Carbonate sedimentary rocks exhibit the ability to capture heat flow from the rest of the rocks, indicative of suboptimal thermal conductivity.
This observation aligns with the recorded low API values and elevated sulfur content as presented in
Table 2. The time plots of the %TR and %Ro maturity curves (
Figure 8) show that the oil generation phase started around 83 Ma in the Upper Cretaceous, from the Chia Gara Formation, corresponding with %TR between 15 and 49% and modeled %Ro values between 0.55 and 0.70% and oil expulsion reached around 22 Ma in the Miocene and continued to the present day, consistent with TR > 0.55% at 0.71 to up to 0.8 of %Ro. The substantial thickness of the overlying sedimentary rocks likely exerted significant pressure that may have augmented the oil expulsion from the Chia Gara interval (
Figure 8). However, at this time, the expelled oil underwent secondary migration upward to the shallow stratigraphic units through the vertical pathway provided by faults.
6. Conclusions
This investigation was conducted on a suite of extracted rocks and oil samples from the Kirkuk oilfield in the Zagros Basin, combining organic geochemical and 1-D basin modeling techniques. The conclusions are:-
The Upper Jurassic–Lower Cretaceous Chia Gara Formation is organic-rich with TOC values ranging between 0.68–3.95 wt.% and has fair to very-good generation potential, consistent with the deposition of these intervals under reducing conditions.
The predominance of Types II/III and III kerogens implies extremely oil-prone source units based on HI, Tmax, and OI linkages. Both PI and Tmax data revealed that all examined samples of the studied formation have reached thermal maturity levels of the oil generation stage.
Burial and thermal history models were validated by the kinetic results to assist in predicting the time of hydrocarbon generation and expulsion. Models show that the onset of hydrocarbon generation began in the Upper Cretaceous (84 Ma) mostly from the Chia Gara Formation. The models also suggest that petroleum expulsion began during the Miocene (~22 Ma) from the Chia Gara Formation at over 55% %TR with %Ro of more than 0.71 %Ro and continued to the current day. The expelled oils are subsequently trapped in the Oligocene reservoir rocks.
Author Contributions
Abbas F. Gharib: Conception, Data collection, Analysis tools, Project Management, Wrote the first draft of the manuscript.
Funding
This research received no external funding.
Data Availability Statement
Data will be available upon request.
Acknowledgments
The author would like to acknowledge the Iraqi Oil Exploration Company for approving and granting permission to utilize the data for this research. We also extend our gratitude to GeoMark Research Ltd. (Houston, Texans; United States) for evaluating all the rock and crude oil samples, which were essential for the completion of this study.
Conflicts of Interest
The authors declare no conflicts of interest.
References
- Horn, M.K., Oil, G., Fields, G.: Selected Features of Giant Fields, Using Maps and Histograms. North. 1868, 78, 340 p. (2004).
- Horn, M.K.: Selected Features of Giant Fields, Using Maps and Histograms. AAPG Mem. 10068, 340 (2004).
- Verma, M.K., Ahlbrandt, T.S., Al-gailani, M.: Petroleum reserves and undiscovered resources in the total petroleum systems of Iraq : Reserve growth and production implications. GeoArabia. 9, 51–74 (2004).
- Zeinalzadeh, A., Moussavi-harami, R., Mahboubi, A.: Basin and petroleum system modeling of the Cretaceous and Jurassic source rocks of the gas and oil reservoirs in Darquain field, south west Iran. J. Nat. Gas Sci. Eng. 26, 419–426 (2015). [CrossRef]
- Al Ahmed, A.A.N.: Determination and applications of chemical analysis to evaluate Jurassic hydrocarbon potentiality in Northern Iraq. Arab. J. Geosci. 6, 2941–2949 (2013). [CrossRef]
- Al-Ameri, T.K., Al-Nagshbandi, S.F.: Age assessments and palynofacies of the Jurassic oil source rocks succession of North Iraq. Arab. J. Geosci. 8, 759–771 (2015). [CrossRef]
- Naqishbandi, S.F., Jabbar, W.J., Al-Juboury, A.I.: Hydrocarbon potential and porosity types of the Geli Khana Formation (Middle Triassic), Northern Iraq. Arab. J. Geosci. 8, 739–758 (2015). [CrossRef]
- Hakimi, M., Al Ahmed, A., Abdula, R., Mohialdeen, I.: Generation and expulsion history of oil-source rock (Middle Jurassic Sargelu Formation) in the Kurdistan of north Iraq, Zagros folded belt: Implications from 1D basin modeling study. J. Pet. Sci. Eng. 162, (2017). [CrossRef]
- Saberi, M.H., Rabbani, A.R., Ghavidel-syooki, M.: Hydrocarbon potential and palynological study of the Latest Ordovician - Earliest Silurian source rock (Sarchahan Formation) in the Zagros Mountains, southern Iran. Mar. Pet. Geol. 71, 12–25 (2016). [CrossRef]
- Al-Ameri, T.K., Zumberge, J.: Middle and Upper Jurassic hydrocarbon potential of the Zagross Fold Belt, North Iraq. Mar. Pet. Geol. 36, 13–34 (2012). [CrossRef]
- Hakimi, M.H., Najaf, A.A., Abdula, R.A., Mohialdeen, I.M.J.: Generation and expulsion history of oil-source rock (Middle Jurassic Sargelu Formation) in the Kurdistan of north Iraq, Zagros folded belt: Implications from 1D basin modeling study. J. Pet. Sci. Eng. 162, 852–872 (2018). [CrossRef]
- Kobraei, M., Rabbani, A.R., Taati, F.: Source rock characteristics of the Early Cretaceous Garau and Gadvan formations in the western Zagros Basin–southwest Iran. J. Pet. Explor. Prod. Technol. 7, 1051–1070 (2017). [CrossRef]
- Al-Beyati, F.M., Kadhim, L.S., Haseeb, M.T., Mahdi, A.Q.: Hydrocarbon source potential of the Upper Jurassic Naokelekan Formation, Northwestern Zagros Basin, Northern Iraq: An organic geochemical approach. Kirkuk Univ. Journal-Scientific Stud. 12, 43–57 (2017). [CrossRef]
- El Nady, M.M., Ramadan, F.S., Hammad, M.M., Lotfy, N.M.: Evaluation of organic matters, hydrocarbon potential and thermal maturity of source rocks based on geochemical and statistical methods: Case study of source rocks in Ras Gharib oilfield, central Gulf of Suez, Egypt. Egypt. J. Pet. 24, 203–211 (2015). [CrossRef]
- Aexander, R., Kagi, R.I., Woodhouse, G.W.: Geochemical correlation of Windalia oil and extracts of Winning Group ( Cretaceous) potential source rocks, Barrow subbasin, Western Australia. Am. Assoc. Pet. Geol. Bull. 65, 235–250 (1981). [CrossRef]
- Al-Ameri, T., Wadie, S.: Petroleum System Modeling of Halfaya Oil Field South of Iraq. Iraqi J. Sci. 56, 1446–1456 (2015).
- Al-Juboury, A.I., McCann, T.: The Middle Miocene Fatha (Lower Fars) Formation, Iraq. GeoArabia. 13, 141–174 (2008).
- Al-Qayim, B., Rashid, F.: Reservoir characteristics of the Albian upper qamchuqa formation carbonates, Taq Taq oilfield, Kurdistan, Iraq. J. Pet. Geol. 35, 317–341 (2012). [CrossRef]
- Baban, D., Hussein, H.S.: Characterization of the Tertiary reservoir in Khabbaz Oil Field, Kirkuk area, Northern Iraq. Arab. J. Geosci. 9, 237 (2016). [CrossRef]
- Beydoun, Z.R., Clarke, M.W.H., Stoneley, R.: Petroleum in the Zagros basin: A late tertiary foreland basin overprinted onto the outer edge of a vast hydrocarbon-rich paleozoic-mesozoic passive-margin shelf: Chapter 11. (1992).
- Al-Jwaini, Y.S., Gayara, A.D.: Upper Palaeogene-Lower Neogene Reservoir Characterization in Kirkuk, Bai Hassan and Khabaz Oil Fields, Northern Iraq. Tikrit J. Pure Sci. 21, 86–101 (2018).
- El Diasty, W.S., El Beialy, S.Y., Mahdi, A.Q., Peters, K.E.: Geochemical characterization of source rocks and oils from northern Iraq: Insights from biomarker and stable carbon isotope investigations. Mar. Pet. Geol. 77, 1140–1162 (2016). [CrossRef]
- Damoulianou, M.E., Kolo, K.Y., Borrego, A.G., Kalaitzidis, S.P.: Organic petrological and geochemical appraisal of the Upper Jurassic Naokelekan Formation, Kurdistan, Iraq. Int. J. Coal Geol. 232, 103637 (2020). [CrossRef]
- Hakimi, M.H., Abdullah, W.H., Mohialdeen, I.M.J., Makeen, Y.M., Mustapha, K.A.: Petroleum generation characteristics of heterogeneous source rock from Chia Gara formation in the Kurdistan region, northern Iraq as inferred by bulk and quantitative pyrolysis techniques. Mar. Pet. Geol. 71, 260–270 (2016). [CrossRef]
- Mohialdeen, I.M.J., Hakimi, M.H., Al-Beyati, F.M.: Biomarker characteristics of certain crude oils and the oil-source rock correlation for the Kurdistan oilfields, Northern Iraq. Arab. J. Geosci. 8, 507 – 523 (2015). [CrossRef]
- Mohialdeen, I.M.J., Hakimi, M.H., Al-Beyati, F.M.: Geochemical and petrographic characterization of Late Jurassic-Early Cretaceous Chia Gara Formation in Northern Iraq: Palaeoenvironment and oil-generation potential. Mar. Pet. Geol. 43, 166–177 (2013). [CrossRef]
- Mohialdeen, I.M.J., Hakimi, M.H.: Geochemical characterisation of Tithonian-Berriasian Chia Gara organic-rich rocks in northern Iraq with an emphasis on organic matter enrichment and the relationship to the bioproductivity and anoxia conditions. J. Asian Earth Sci. 116, 181–197 (2016). [CrossRef]
- Edilbi, A.N.F., Sherwani, G.H.: Petrography and source rock potential of Chia Gara Formation (Late Jurassic–Early Cretaceous) in Northern Iraq and Kurdistan Region. J. Pet. Explor. Prod. Technol. 9, 1801–1818 (2019). [CrossRef]
- Jassim, S.Z., Goff, J.C.: Geology of Iraq. DOLIN, sro, distributed by Geological Society of London (2006).
- Buday, T.: The regional geology of Iraq, V.I, stratigraphy and Paleogeography. State Organization for Minerals, Directorate General for Geological Survey (1980).
- Traverse, A.: Paleopalynology: Second Edition. Springer Netherlands (2009).
- Al-Ameri, T.K., Naser, M.E., Pitman, J., Zumberge, J., Al-Haydari, H.A.: Programed oil generation of the Zubair Formation, Southern Iraq oil fields: Results from Petromod software modeling and geochemical analysis. Arab. J. Geosci. 4, 1239–1259 (2010). [CrossRef]
- Pitman, J.K., Steinshouer, D., Lewan, M.: Petroleum generation and migration in the Mesopotamian Basin and Zagros fold belt of Iraq: Results from a basin-modeling study. GeoArabia. 9, 41–72 (2004). [CrossRef]
- Alsharhan, A.S., Nairn, A.E.M.: The Geological History and Structural Elements of the Middle East. Sediment. Basins Pet. Geol. Middle East. 15–63 (2003). [CrossRef]
- Alsharhan, A.S., Nairn, A.E.M.: Sedimentary Basins and Petroleum Geology of the Middle East. Elsevier (2003).
- Sadooni, F.N., Alsharhan, A.S.: Stratigraphy, lithofacies distribution, and petroleum potential of the Triassic strata of the northern Arabian plate. Am. Assoc. Pet. Geol. Bull. 88, 515–538 (2004). [CrossRef]
- Ameen, M.S.: Effect of basement tectonics on hydrocarbon generation, migration, and accumulation in Northern Iraq. Am. Assoc. Pet. Geol. Bull. 76, 356–370 (1992). [CrossRef]
- Ameen, M.S.: Possible forced folding in the Taurus–Zagros Belt of northern Iraq. Geol. Mag. 128, 561–584 (1991). [CrossRef]
- McQuarrie, N.: Crustal scale geometry of the Zagros fold-thrust belt, Iran. J. Struct. Geol. 26, 519–535 (2004). [CrossRef]
- Bellen, R.C.C. van, Dunnington, H. V, Wetzel, R.: Lexique stratigraphique international: Asie. 10.a. Iraq. (1959).
- Aqrawi, A.A.M., Horbury, A.D., Sadooni, F.N., Goff, J.C.: The Petroleum Geology of Iraq. Scientific Press (2010).
- Sachsenhofer, R., Bechtel, A., Gratzer, R., Rainer, T.: Source rock maturity, hydrocarbon potential and oil - source-rock correlation in well Shorish-I, Erbil province, Kurdistan region, Iraq. J. Pet. Geol. 38, (2015). [CrossRef]
- Harland, W.B., Armstrong, R.L., Cox, A. V, Craig, L.E., Smith, A.G., Smith, D.G.: A geologic time scale 1989. Geol. J. 27, 199–199 (1992). [CrossRef]
- Behar, F., Valérie, B., Penteado, H.: Rock-Eval 6 Technology: Performances and Developments. Oil Gas Sci. Technol. 56, (2001). [CrossRef]
- Espitalié, J., Deroo, G., Marquis, F.: La pyrolyse Rock-Eval et ses applications. Troisième partie. Rev. Inst. Fr. Pét. 41, 73–89 (1986). [CrossRef]
- Lafargue, E., Marquis, F., Pillot, D.: Rock-Eval 6 applications in hydrocarbon exploration, production, and soil contamination studies. Rev. l’Institut Fr. du Pet. 53, 421–437 (1998). [CrossRef]
- Peters, K.E.: Guidelines for Evaluating Petroleum Source Rock Using Programmed Pyrolysis. Am. Assoc. Pet. Geol. Bull. 70, (1986). [CrossRef]
- Peters, K.E., Cassa, M.R.: Applied Source Rock Geochemistry. In: The Petroleum System—From Source to Trap. pp. 93–120. American Association of Petroleum Geologists (1994).
- Buday, T., Jassim, S.Z.: The Regional geology of Iraq: Vol. 2, Tectonics Magmatism, and Metamorphism. GEOSURV, Baghdad, 352pp. 445 (1987).
- Welte, D.H., Horsfield, B., Baker, D.R.: Petroleum and Basin Evolution. Springer Berlin Heidelberg, Berlin, Heidelberg (1997).
- Faqi, A.: The role of the Baluti Formation within Triassic petroleum systems in Kurdistan: Akre-Bijeel Block, Gara and Ora anticlines: An organic geochemical and basin modelling approach, (2016).
- Al-Khafaji, A.J., Hakimi, M.H., Mohialdeen, I.M.J., Idan, R.M., Afify, W.E., Lashin, A.A.: Geochemical characteristics of crude oils and basin modelling of the probable source rocks in the Southern Mesopotamian Basin, South Iraq. J. Pet. Sci. Eng. 196, 107641 (2021). [CrossRef]
- Gharib, A.F., Özkan, A.M., Hakimi, M.H., Zainal Abidin, N.S., Lashin, A.A.: Integrated geochemical characterization and geological modeling of organic matter-rich limestones and oils from Ajeel Oilfield in Mesopotamian Basin, Northern Iraq. Mar. Pet. Geol. 126, 104930 (2021). [CrossRef]
- Wygrala, B.P.: Integrated study of an oil field in the southern Po Basin, Northern Italy. PhD thesis, University of Cologne, Germany. https://juser.fz-juelich.de/record/153416, (1989).
- Makeen, Y.M., Abdullah, W.H., Pearson, M.J., Hakimi, M.H., Elhassan, O.M.A., Hadad, Y.T.: Thermal maturity history and petroleum generation modelling for the Lower Cretaceous Abu Gabra Formation in the Fula Sub-basin, Muglad Basin, Sudan. Mar. Pet. Geol. 75, 310–324 (2016). [CrossRef]
- Dunnington, H. V: Generation, migration, accumulation, and dissipation of oil in Northern Iraq. GeoArabia. 10, 39–84 (2005). [CrossRef]
- Jarvie, D.M., Claxton, B.L., Henk, F., Breyer, J.T.: Oil and shale gas from the Barnett Shale, Ft. In: Worth Basin, Texas (abs.): AAPG Annual Meeting Program. p. A100 (2001).
- Pitman, J.K., Franczyk, K.J., Anders, D.E.: Marine and nonmarine gas-bearing rocks in Upper Cretaceous Blackhawk and Neslen formations, eastern Uinta Basin, Utah: Sedimentology, diagenesis, and source rock potential. Am. Assoc. Pet. Geol. Bull. 71, 76–94 (1987). [CrossRef]
- Jin, H., Sonnenberg, S.A.: Source rock potential of the Bakken Shales in the Williston Basin, North Dakota and Montana: AAPG Search and Discovery article 20156, (2012).
- Hunt, J.M.: Petroleum geochemistry and geology ( textbook). W.H. Freeman (1995).
- Metwalli, F.I., Pigott, J.D.: Analysis of petroleum system criticals of the Matruh–Shushan Basin, Western Desert, Egypt. Pet. Geosci. 11, 157–178 (2005). [CrossRef]
- Gharib, A.F., Haseeb, M.T., Ahmed, M.S.: Geochemical investigation and hydrocarbon generation–potential of the Chia Gara (Tithonian–Berriasian) source rocks at Hamrin and Kirkuk fields, Northwestern Zagros Basin, Iraq. IOP Conf. Ser. Earth Environ. Sci. 1300, 12037 (2024). [CrossRef]
- Beydoun, Z.R.: Evolution of the Northeastern Arabian Plate Margin and Shelf: Hydrocarbon Habitat and Conceptual Future Potential. Rev. l’Institut Français du Pétrole. 48, 311–345 (1993). [CrossRef]
- Waples, D.W.: Geochemistry in Petroleum Exploration. Springer Netherlands, Dordrecht (1985).
- Espitalié, J., Deroo, G., Marquis, F.: La pyrolyse Rock-Eval et ses applications. Première partie. Rev. Inst. Fr. Pét. 40, 563–579 (1985). [CrossRef]
- Hunt, J.M.: Petroleum Geochemistry and Geology. W.H. Freeman (1996).
- Peters, K.E., Cassa, M.R.: Applied Source Rock Geochemistry. In: The Petroleum System—From Source to Trap. pp. 93–120. American Association of Petroleum Geologists (1994).
- Tissot, B.P., Welte, D.H.: Petroleum Formation and Occurrence. Springer Berlin Heidelberg, Berlin, Heidelberg (1984).
|
Disclaimer/Publisher’s Note: The statements, opinions and data contained in all publications are solely those of the individual author(s) and contributor(s) and not of MDPI and/or the editor(s). MDPI and/or the editor(s) disclaim responsibility for any injury to people or property resulting from any ideas, methods, instructions or products referred to in the content. |
© 2024 by the authors. Licensee MDPI, Basel, Switzerland. This article is an open access article distributed under the terms and conditions of the Creative Commons Attribution (CC BY) license (http://creativecommons.org/licenses/by/4.0/).

