1. Introduction
As the foundation of long-span bridge construction, the mass concrete pile cap will bring great hidden dangers to the safety and stability of bridge engineering once the temperature cracks caused by temperature stress occur. There needs to be a unified understanding of mass concrete in various countries. The American Concrete Association defines a concrete structure as one that must control its hydration heat during construction to prevent cracks due to excessive volume as mass concrete [
1]. The Japanese Architectural Society: A concrete structure with a minimum size of more than 0.8m and a temperature difference of more than 25 ° C during construction is called a mass concrete [
2]. The International Prestressed Concrete Association (FIP) stipulates that all concrete members with a minimum size of more than 0.6m and a cement content of more than 3400kg/m can be called mass concrete [
3]. It is stipulated in the ' Mass Concrete Construction Specification ' GB5049-2018 that the minimum geometric size of the concrete structure is not less than lm, or the concrete that is expected to cause harmful cracks due to the temperature change and shrinkage caused by the hydration of the cementitious material in the concrete is mass concrete [
4].
Although countries worldwide have yet to make uniform provisions on the specific geometric size or dosage of mass concrete, many scholars have generated a large amount of heat inside the mass concrete structure during construction, and it is not easy to emit. Therefore, the internal temperature of the mass concrete is high, and its surface is greatly affected by the ambient temperature, so its surface temperature is low. The stress caused by the significant temperature difference between the inner and outer surfaces is the main factor leading to cracks in the mass concrete structure. Therefore, appropriate temperature control measures must be taken during construction [
5,
6,
7,
8,
9,
10,
11]. The Soviet Hydraulic Research Institute, the United States Bureau of Reclamation, and other research institutions systematically analyzed and studied the early temperature cracks of mass concrete in the middle of the 20th century. Based on the design of mass concrete and temperature control during construction, a series of calculation methods and control measures were proposed [
12,
13,
14]. Nikolay Aniskin proposed to replace the water in the concrete mixture with ice. Based on the principle of energy balance in the heat transfer process, a formula for calculating the amount of ice required was established to control the initial temperature of the concrete mixture. The results show that the maximum temperature and temperature difference in mass concrete depends primarily on the initial temperature of the concrete mixture [
15]. T.C. Nguyen et al. believed that using a 7cm sand layer can prevent and limit the cracks in the early stage of mass concrete blocks and reduce the temperature difference of mass concrete [
16]. Trong Chuc Nguyen et al. used the numerical method to draw the temperature-time history diagram and determined the maximum temperature of the concrete structure under different sizes, the initial temperature of the concrete mixture, cement content, and other parameters. The obtained temperature nomogram was compared with the finite element method results, and the results were in agreement. It can predict the maximum temperature in the mass concrete structure and prevent the formation of temperature cracks [
17].
Alamayreh M I et al. designed a cooling system using cold water or cooling air in the air conditioning pipeline at about four °C to cool the concrete aggregate and found the best refrigerant under different working conditions through the numerical model [
18]. Seo Tae-Seok et al. proposed a vertical pipe cooling method suitable for slender mass concrete such as retaining walls and bridge towers [
7]. T.C. Nguyen studied the temperature field and temperature stress of mass concrete under the action of a cooling water pipe system. At the same time, the temperature field and cracking index of mass concrete with a cooling water pipe system temperature of 15 °C were measured [
19]. Joo-Kyoung Yang studied the relationship between the thermal conductivity of the pipe wall and the concrete during the cooling of the cooling pipe and established the thermal convection coefficient function of the pipe wall and the concrete based on the flow velocity, pipe diameter, and pipe thickness [
20]. Lawrence.AM et al. first used the finite element method to calculate and then measured the early strength development and crack formation of concrete mixed with different cementitious materials through experiments. Finally, the numerical simulation was combined with the actual operation to verify the accuracy of the calculation results [
21]. Xue et al. carried out duct cooling experiments on concrete walls with embedded bellows, used ultrasonic detectors to explore the development of crack depth under different airflow velocity conditions, and judged the optimal airflow velocity to control crack development through stress distribution [
11]. Adek Tasri et al. studied the influence of three kinds of post-cooling pipes with different materials on mass concrete's temperature stress and temperature gradient. It was found that the concrete temperature obtained by using steel cooling pipes was 70% and 36% lower than that obtained by using PVC and PEX cooling pipes, respectively, which can weaken the cracking risk caused by core area expansion and concrete surface shrinkage. However, the tensile stress generated by steel tubes is 25.3% and 12.7% higher than that of PVC and PEX tubes [
22].
It effectively reduces the rise in adiabatic temperature and internal and internal surface temperature differences in mass concrete by changing the composition of the concrete or adding inhibitors. However, applying to mass concrete with different mix ratios and construction conditions is difficult. By arranging the pipe cooling system in the mass concrete, cooling the internal concrete through cold water or cold air is also a standard means in the construction process of mass concrete. However, the research on the pipe cooling system primarily focuses on the water temperature, and there are few studies on the pipe diameter and flow rate. Therefore, this paper first designs the layout mode of the pipe cooling system of the main pier cap of a super-large bridge and compares it with the field-measured data. Then, the effects of concrete molding temperature, surface convection coefficient, and ambient temperature on the rise of internal adiabatic temperature, surface temperature, and internal surface temperature difference of mass concrete were systematically analyzed. Finally, the quantitative analysis of the influence of various parameters (flow rate, water temperature, and effective pipe diameter) of the mass concrete pipe cooling system on the cooling effect provides a benchmark for the test of the mathematical model of the mass concrete-pipe cooling system and the design of the pipe cooling system.
2. Concrete Parameters and Numerical Modeling
2.1. Physical Thermal Parameters of Concrete
The length, width, and height of the mass concrete cap of a bridge are 26.40m × 20.90m × 5.00m, respectively, and the concrete mix ratio is shown in
Table 1.
The thermal conductivity of concrete is the heat conductivity of the unit volume of concrete in unit time, and the medium on both sides is the unit temperature difference。 The specific heat capacity of concrete is the heat required for the temperature of concrete per unit mass to increase by 1°C. The thermal conductivity, specific heat capacity, and adiabatic temperature rise of concrete can be calculated according to formulas (1), (2), and (3), respectively.
where
,
,
,
,
and
represent the percentage of concrete per cubic meter of concrete, cement, sand, gravel, water, fly ash (%). Where
,
,
,
,
and
represent the thermal conductivity of concrete, cement, sand, stone and water respectively, which can be valued according to
Table 2.
where
,
,
,
,
and
represent the specific heat capacity of concrete, cement, sand, stone, water, and fly ash, respectively, which can be valued according to
Table 3.
where
is the total calorific value of concrete (kJ/m
3),
is the hydration heat of cement (kJ/Kg),
is the amount of concrete cementitious material (kg/m
3), and
is is the adjustment coefficient. The value is shown in
Table 4.
The thermal conductivity of concrete is 2.573 , the specific heat capacity is 0.926 , and the adiabatic temperature rise is 67.92 °C.
2.2. Numerical Modeling
2.2.1. Basic Setting
The plane size of the cap is 26.4m × 20.9m, and the height is 5m. The cap is poured and formed simultaneously, and the finite element software Midas Civil is used for modeling. The following settings are made during the modeling process:
(1) Assuming that the pile cap is a homogeneous body, the heating rate of each node in the model is the same.
(2) Assuming that the initial temperature of the pile cap is the same.
(3) Assuming that the surface convection coefficient of each side of the pile cap is the same, considering the foundation's influence on the concrete's heat dissipation.
(4) Assuming that the influence of steel bars and other materials inside the cap is ignored, the influence of heat preservation and moisture retention during construction is considered.
(5) The concrete molding temperature and ambient temperature are obtained by field measurement. According to the thermal insulation measures (steel formwork and thermal insulation materials) in the construction process, the surface convection coefficient of the pile cap surface is calculated to be , and the surface convection coefficient without considering the thermal insulation measures is .
(6) The foundation size is larger than the cap size. According to experience, the foundation size is considered 30.9m × 36.4m × 3m. The foundation's specific heat capacity and thermal conductivity are 0.2 and 1.7. All the nodes around the foundation are consolidated. That is, all rotation and translation are restrained.
2.2.2. Arrangement of Pipe Cooling System
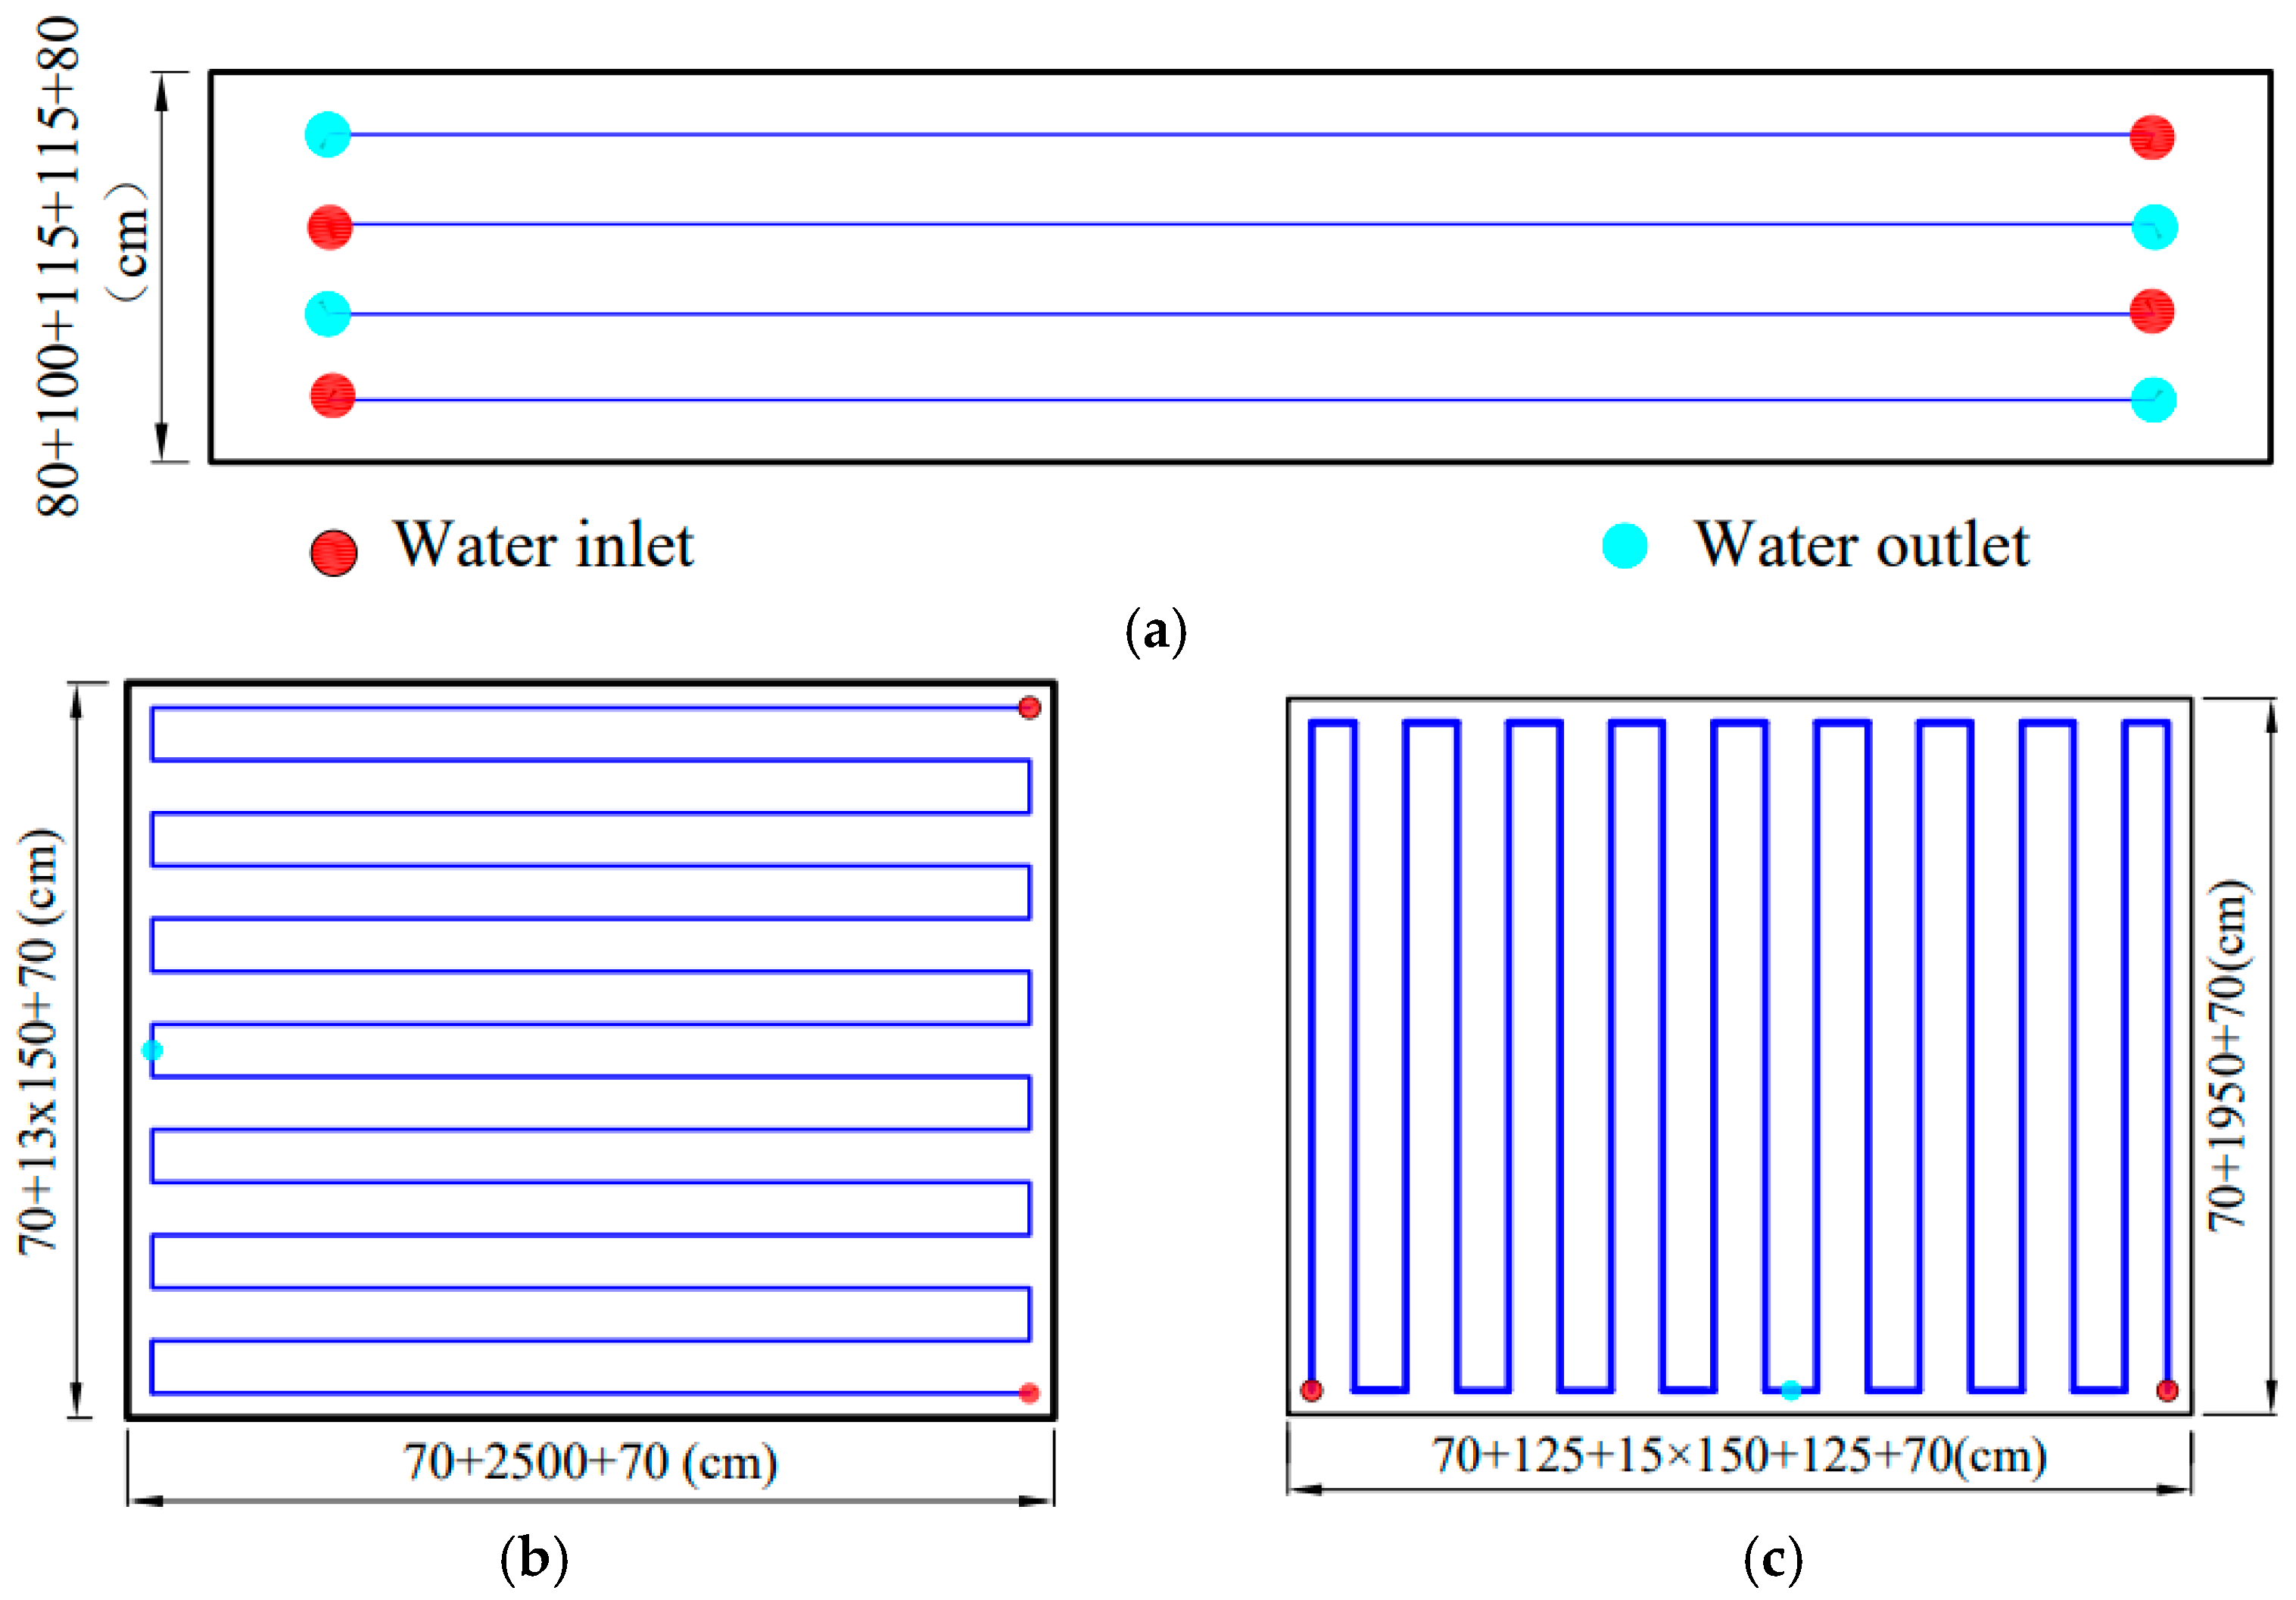
The pipe cooling system is used for internal cooling during the cap construction. The water pipe of the pipe cooling system is a thin-walled iron pipe with an effective diameter of 40 mm, and the water inlet rate of the cooling pipe is 6 m
3/h per pipe. The water temperature of the inlet is corrected according to the field measurement. Four layers of independent inlet and outlet pipe cooling systems are arranged on the pile cap. The arrangement of the pipe cooling system is shown in
Figure 1.
2.2.3. Numerical Model of Cap
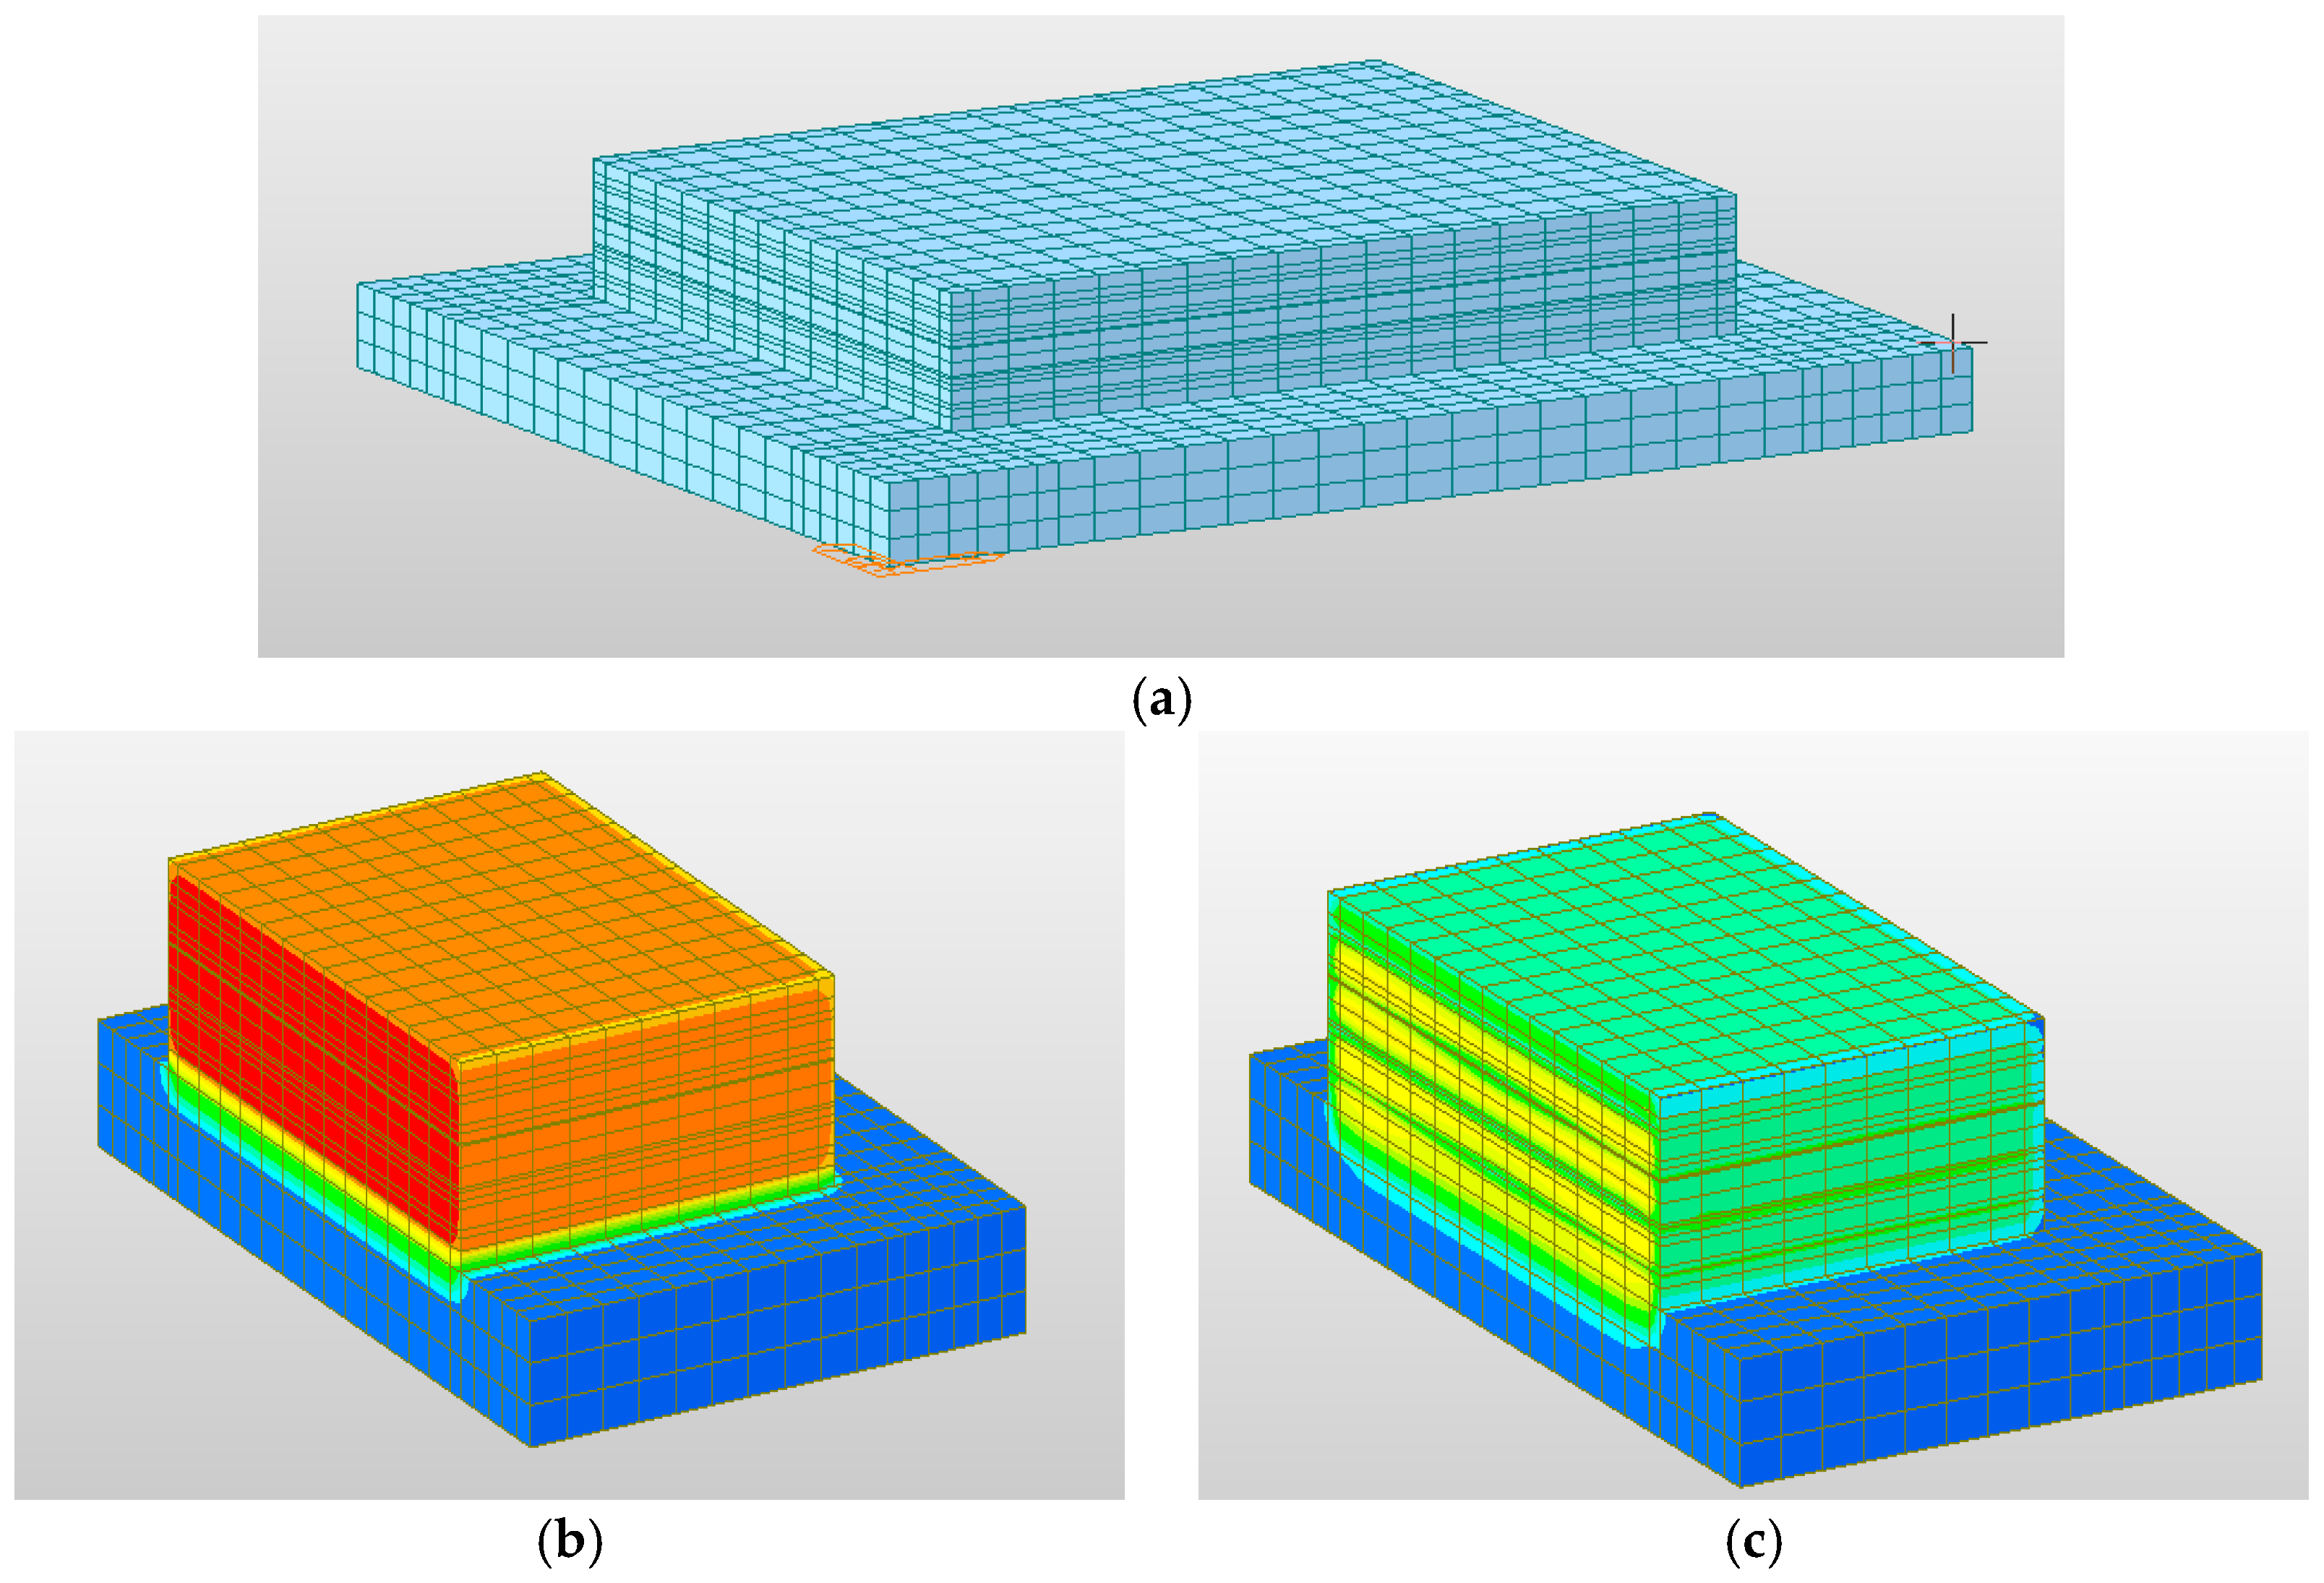
The pile cap's hydration heat state is analyzed using the finite element software Midas Civil. In the model, the internal pipe cooling system of the main pier cap is simulated by the connection between the nodes, and the low-temperature fluid in the pipe cooling system is considered according to the load.
Figure 2 is the temperature field distribution inside the pile cap and foundation model and the pile cap with or without pipe cooling system (the mold temperature is tentatively set at 20°C, the water temperature is 20 °C, the ambient temperature is 20 °C, and the other parameters are shown in
Section 2.1).
As shown in
Figure 2, when the pipe cooling system is not arranged, a large amount of heat is generated inside the cap due to cement hydration, and the ability of concrete to transfer heat is poor. The internal temperature of the cap is high, and the surface of the mass concrete cap has heat exchange with the air, resulting in a surface temperature reduction rate more significant than the internal cooling rate of the concrete. At this time, there is a temperature difference on the inner surface of the cap. If the temperature difference is too significant, the temperature stress caused by it will lead to temperature cracks in the central pier cap. After the pipe cooling system is arranged, the internal temperature field of the pile cap is redistributed, and the internal temperature is significantly reduced, which can significantly improve the internal temperature difference and reduce the risk of temperature cracks. For mass concrete, it is generally required that the internal maximum temperature does not exceed 75°C, and the temperature difference between the inner surface of the concrete should not be more significant than 25°. Therefore, the following analysis takes the internal maximum temperature and the maximum temperature difference between the inner surface as the analysis object.
3. Field Test Data and Parameter Sensitivity Analysis
3.1. Test Instrument and Measuring Point Arrangement for Field Test
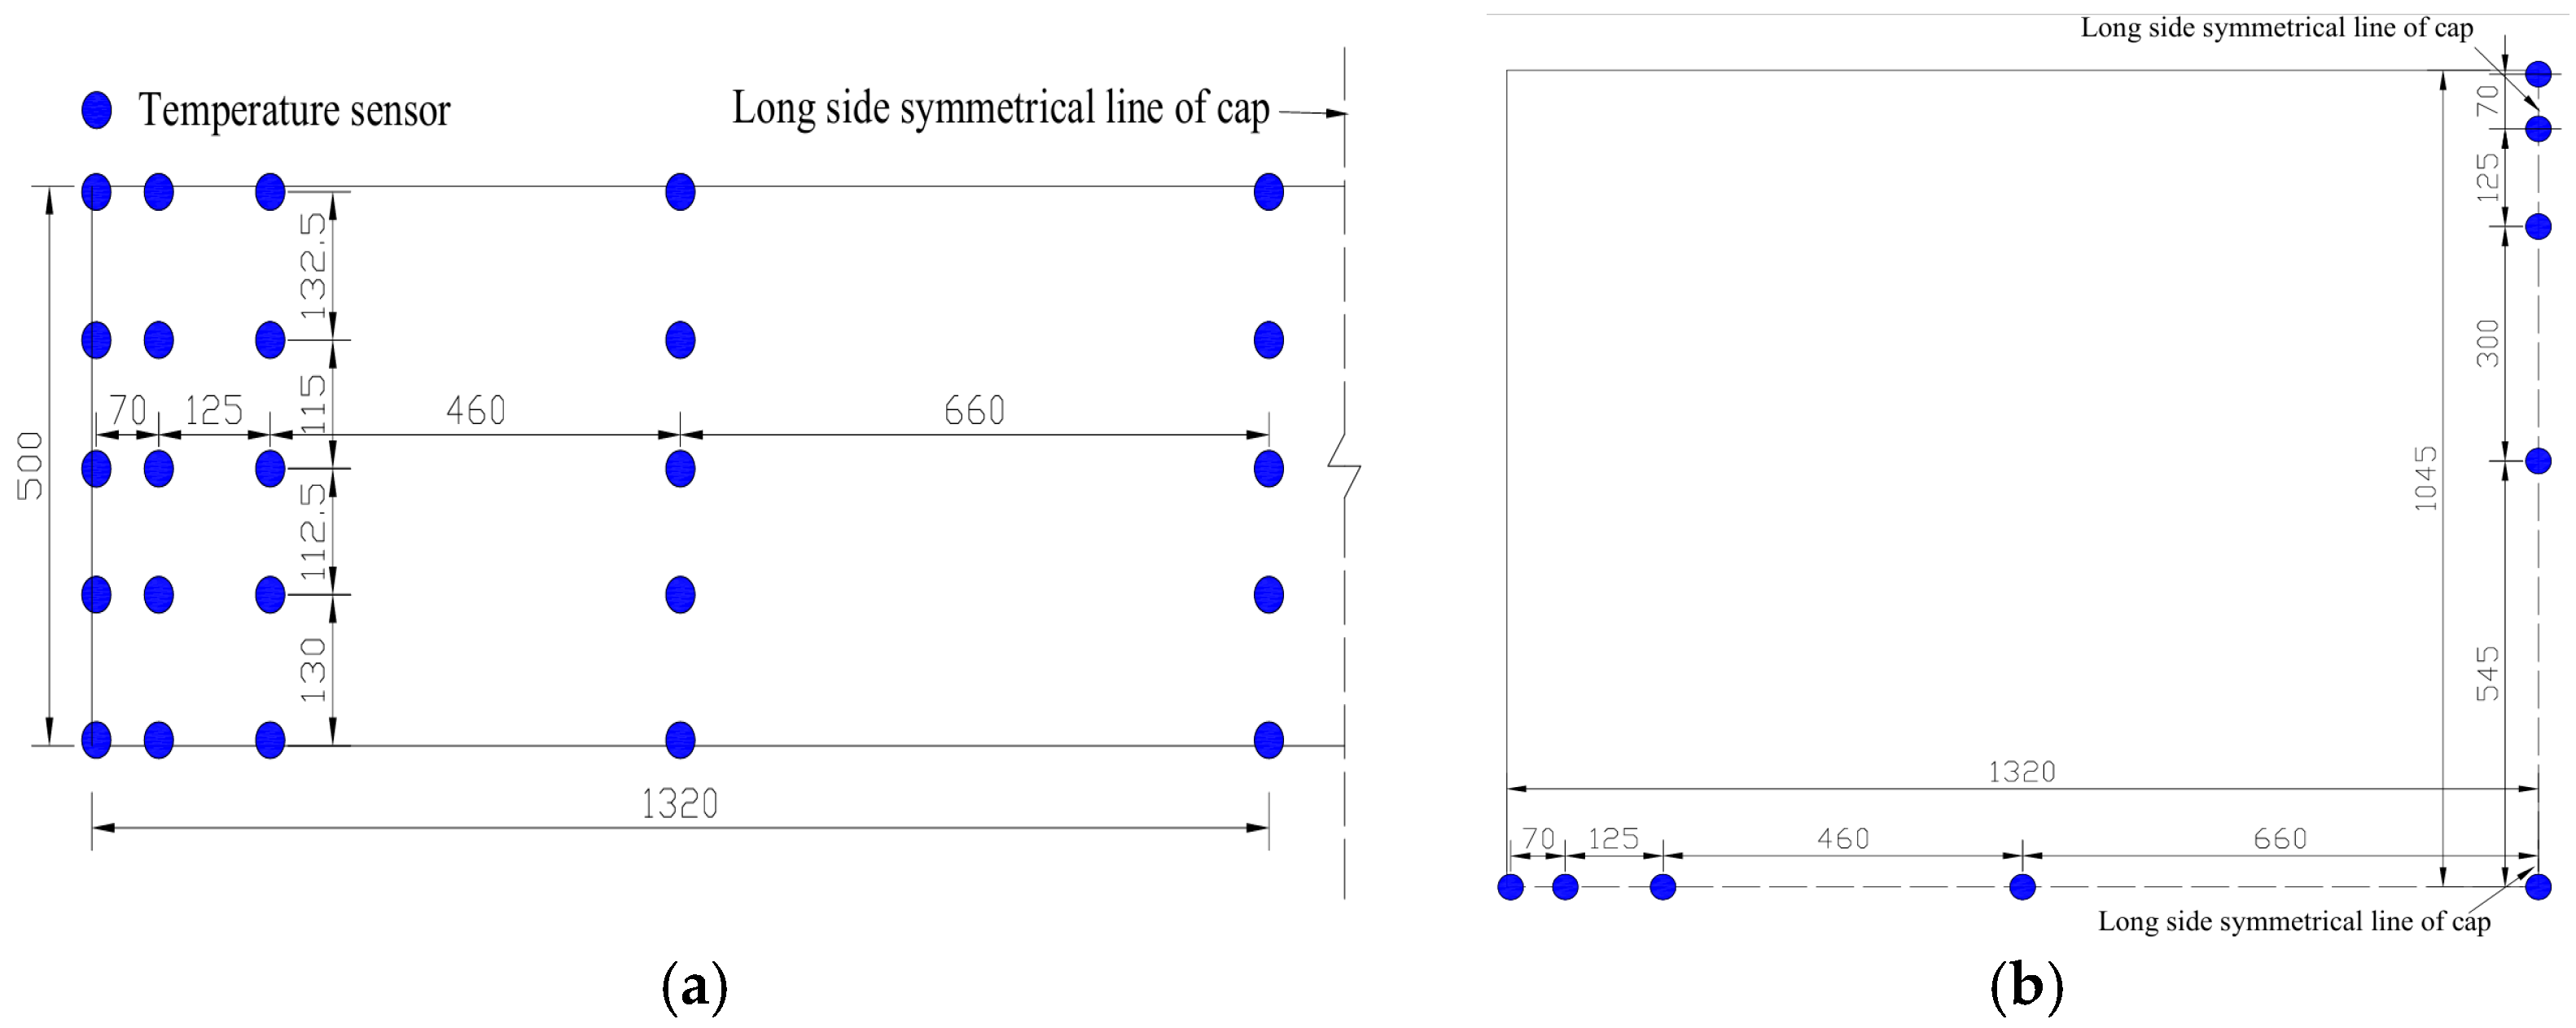
The center of the pile cap is symmetrical, so the temperature sensor is only arranged in 1/4 of the pile cap, and the automatic temperature acquisition module is used to collect the temperature data. Five layers are arranged in the vertical direction of the main pier cap, and there are 9 measuring points in each layer. Five temperature sensors and two temperature sensors for monitoring the ambient temperature are arranged for the inlet and outlet of the pipe cooling system, and a total of 52 temperature sensors are arranged. The specific layout position of the temperature sensor is shown in
Figure 3.
The temperature is monitored every 2 hours during the pouring stage and the heating stage of the pile cap, the temperature is monitored every 4 hours after the pile cap enters the cooling stage, and the temperature is monitored every 12 hours after the cooling rate is stable. When the difference between the surface temperature of the cap and the ambient temperature is less than 20 °C, the temperature measurement is stopped.
3.2. Analysis of Field Measured Data
The temperature difference between the inner surface of the mass concrete cap should be less than 25 °C, which is the decisive factor affecting the temperature stress of the concrete. Therefore, the maximum value of internal adiabatic temperature rise, surface temperature, and internal surface temperature difference of the cap are analyzed using field-measured data. In the construction process of A# and B# pile caps, the average temperatures of the field environment are 1°C and 18°C, the average temperatures of the concrete into the mold are 13 °C and 16 °C, the inlet temperatures of the pipe cooling system are 8°C and 20℃. The surface convection coefficient is
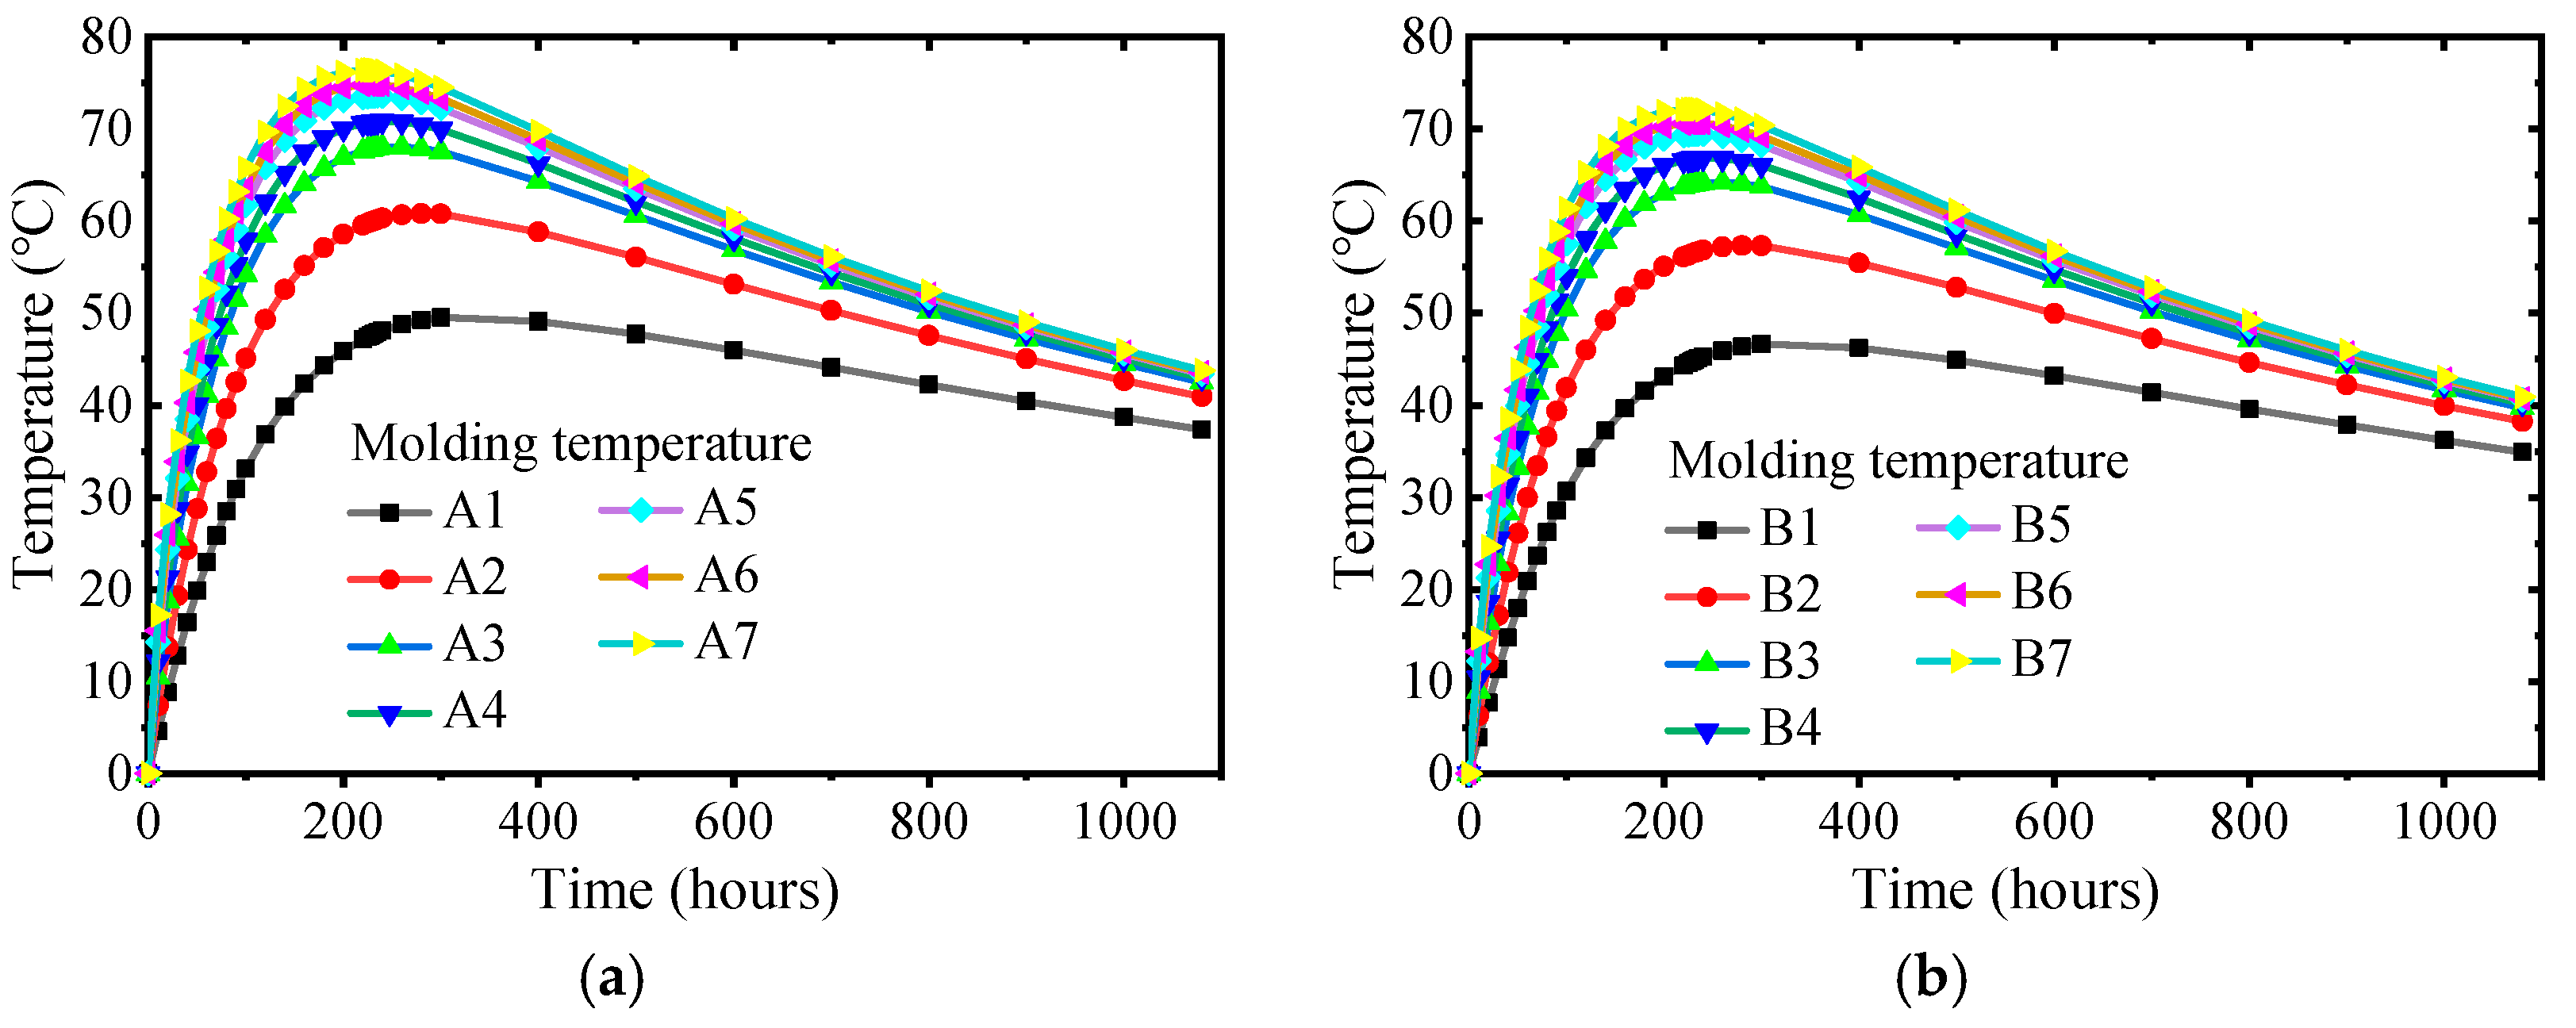
during the cap construction, and the model without heat preservation is calculated for comparison. The temperature rise curves of A# and B# caps are shown in
Figure 4.
As shown in
Figure 4, for A# cap, the maximum measured internal adiabatic temperature rise is 46.2°C (160h). In the finite element results, it is 46.2°C (97h) when considering the heat preservation measures and 46°C (97h) when not considering the heat preservation measures. For B# cap, the maximum measured internal adiabatic temperature rise is 54.1°C (61h). In the finite element results, it is 58°C (83h) when the heat preservation measures are considered, and it is 57.6°C (83h) when the heat preservation measures are not considered. It can be seen that for mass concrete with the same mix ratio and mold temperature, after fully considering the pipe cooling system and ambient temperature, the presence or absence of heat preservation measures has little effect on the maximum adiabatic temperature rise inside the concrete in the finite element model. The measured value is lower than the theoretical value at the initial stage of concrete pouring. The measured value of the rise in internal adiabatic temperature is lower than the calculated value of the model at the initial stage of concrete pouring. Because the cooling water temperature is low at the initial stage of pouring, the heat exchange between the internal concrete and the pipe cooling system is sufficient, the cooling water temperature rises rapidly in the later stage, and the cooling effect is significantly reduced. The finite element software is more accurate for calculating the maximum adiabatic temperature rise inside the concrete, but the calculation of the occurrence time needs to be more accurate.
Figure 4 shows that the measured value of the surface temperature of the pile cap is greatly affected by the ambient temperature and fluctuates wildly. However, it is consistent with the calculated value of the surface temperature of the finite element model considering the heat preservation measures. Therefore, reasonable heat preservation measures significantly improve the surface temperature of the pile cap, which can significantly improve the surface temperature of the pile cap. Affected by the fluctuation of the surface temperature of the pile cap, the internal surface temperature difference also fluctuates, and it is basically consistent with the calculated value of the finite element model, considering the thermal insulation measures. However, in the later monitoring stage, the internal surface temperature difference of the calculated model value considering the heat preservation measures has begun to decrease. However, the measured data still fluctuate around the maximum temperature difference and show a slight increase. The main reason is that the peak value of the measured data of the highest core temperature inside the concrete appears late and lasts for a long time.
3.3. The Influence of Concrete Molding Temperature
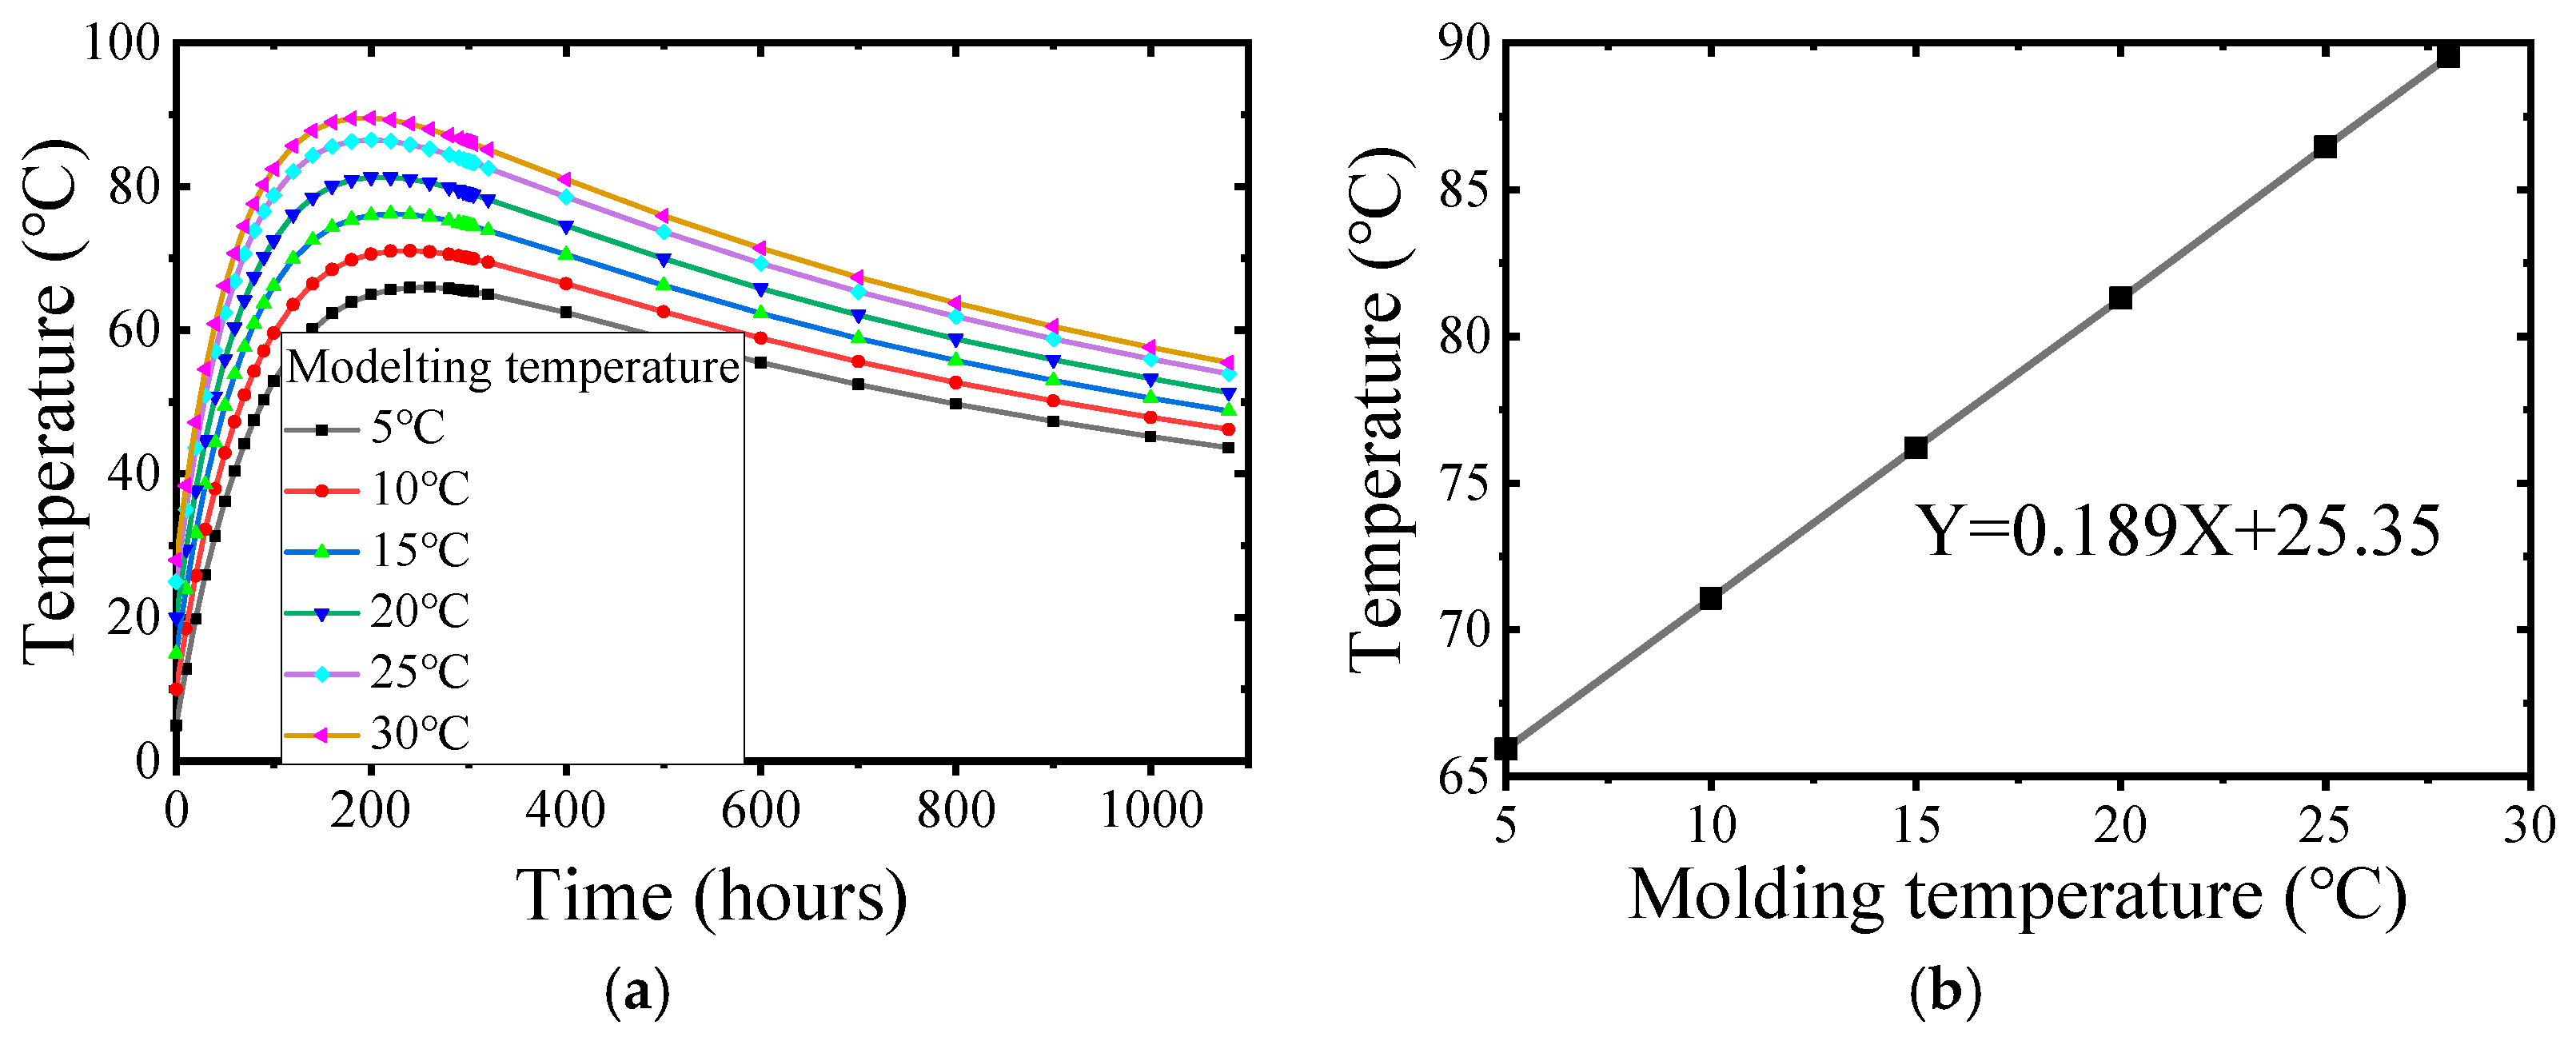
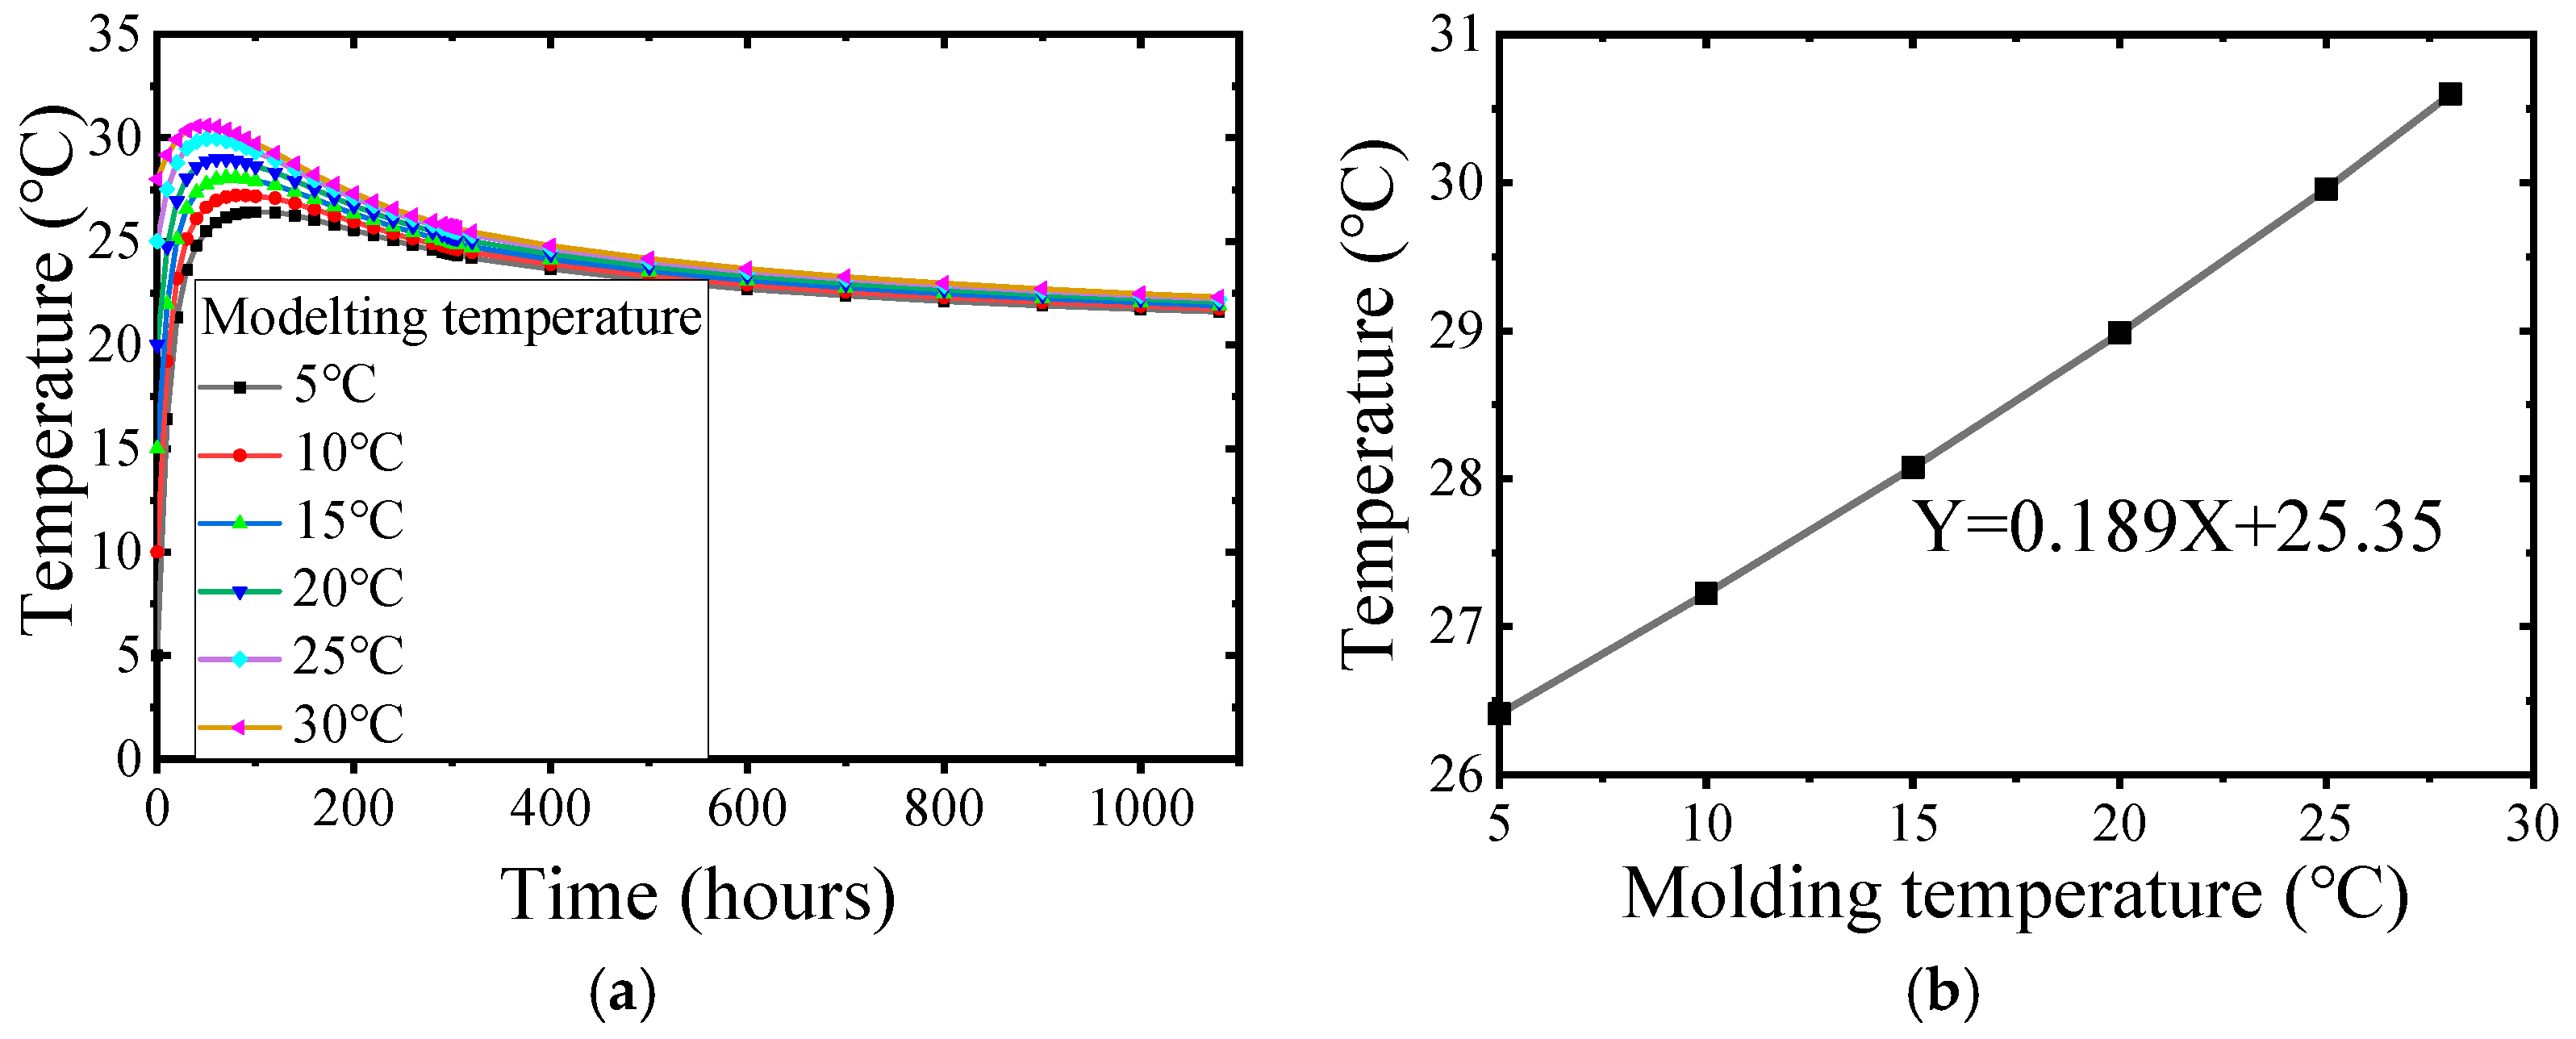
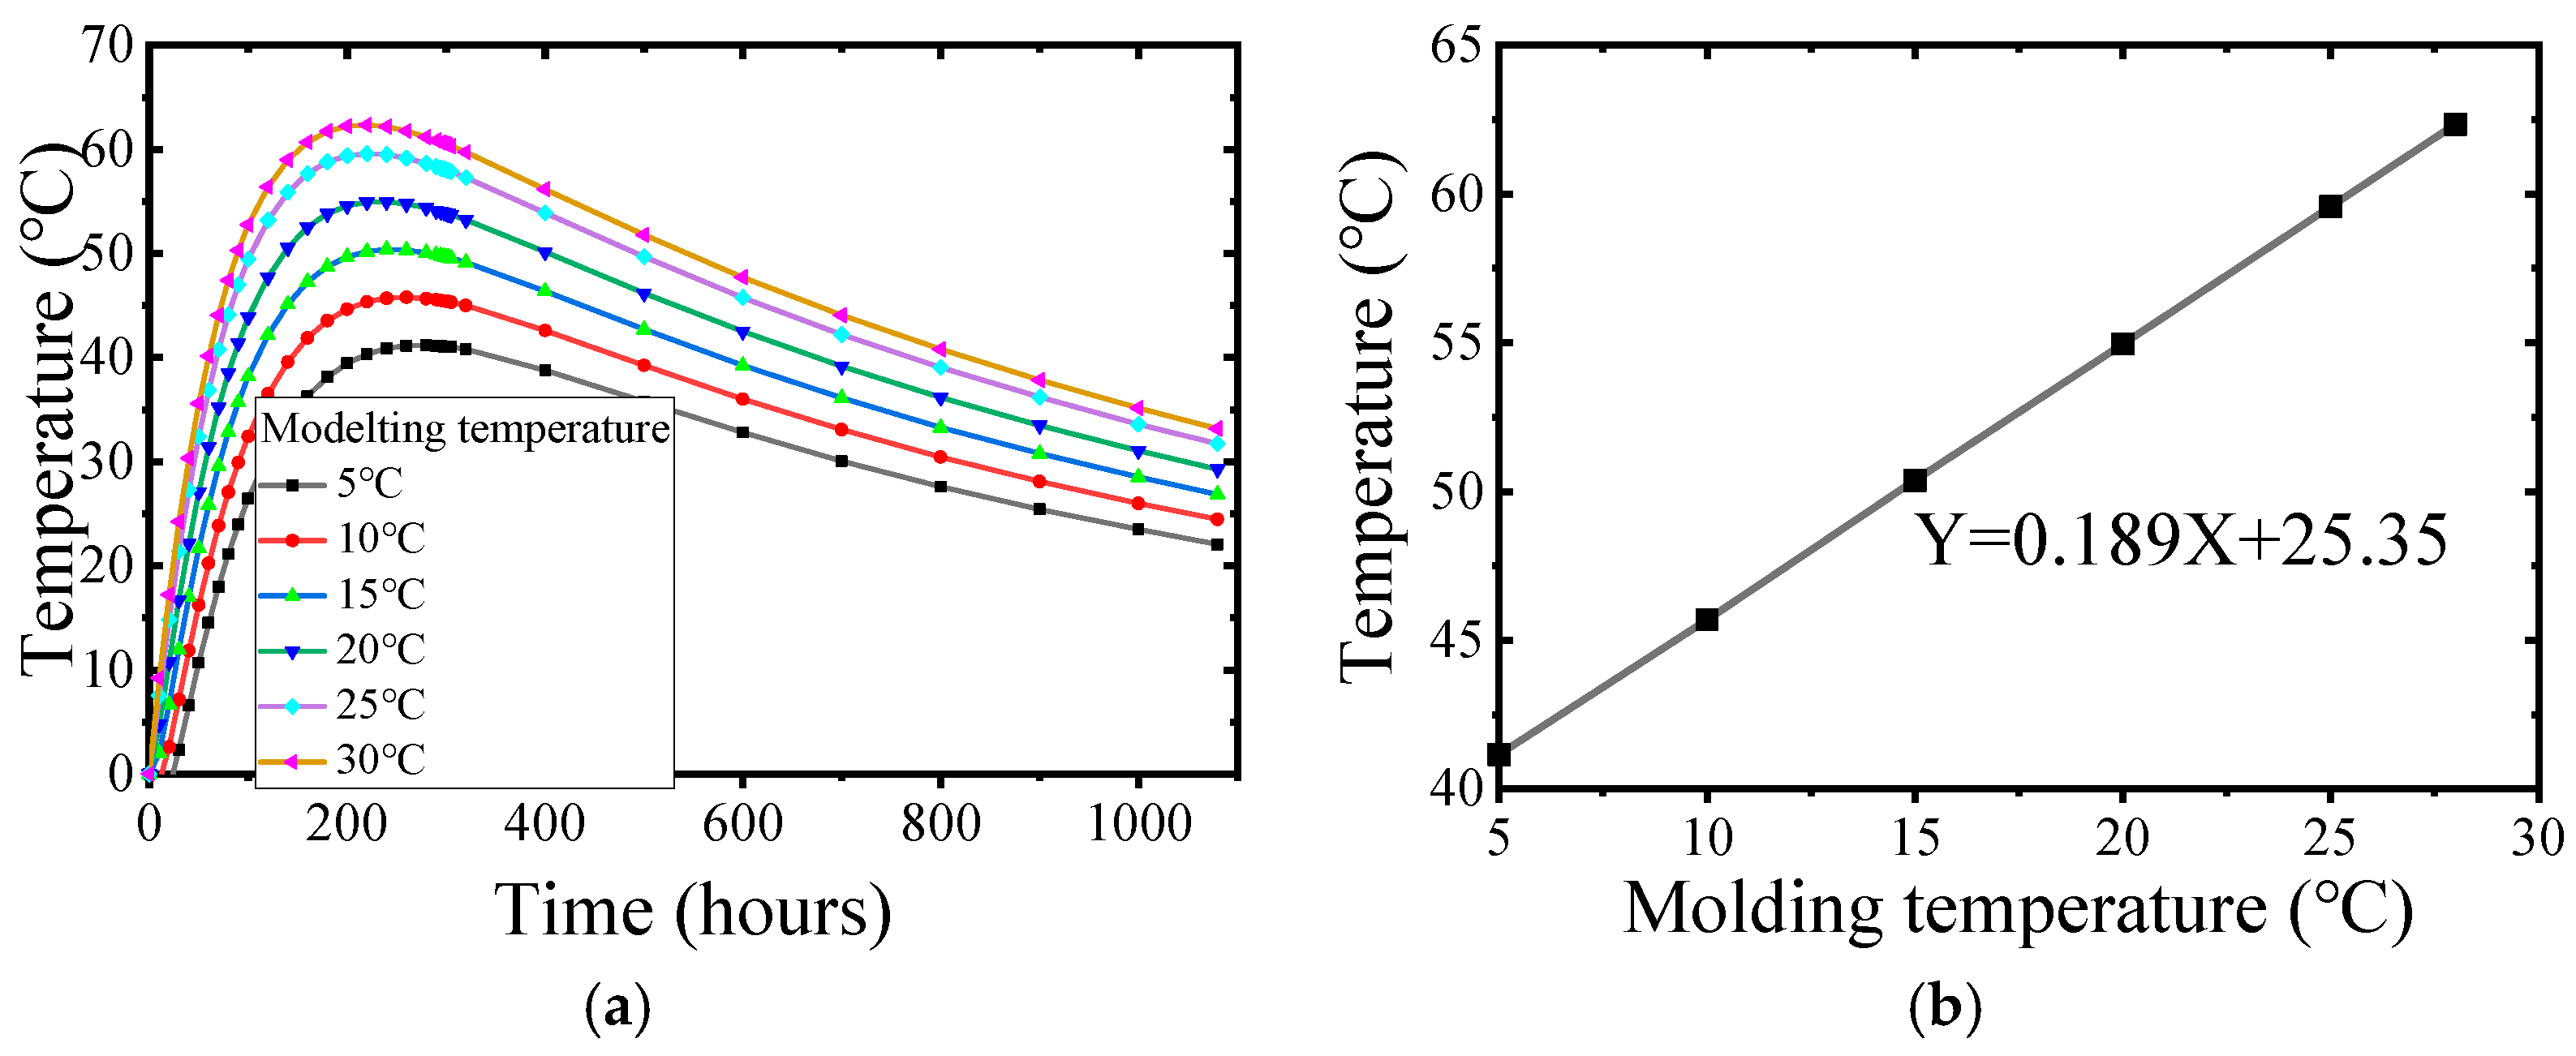
The standard value of concrete molding temperature is 5°C ~ 28°C (values 5, 10, 15,20,25,28 °C). The size of the cap is consistent with the previous text. The surface of the cap is naturally cooled, and no pipe cooling system is arranged. The influence of different molding temperatures on the internal adiabatic temperature rise, surface temperature and internal surface temperature difference of mass concrete caps was analyzed by setting the construction environment temperature to 20 °C.
Figure 5,
Figure 6 and
Figure 7 show the internal adiabatic temperature rise, surface temperature, and internal surface temperature difference at different concrete molding temperatures.
In
Figure 5, the maximum internal adiabatic temperature rises with the increase in concrete molding temperature. The theoretical adiabatic temperature rise of the concrete is 67.92°C, and the relationship between the molding temperature and the internal adiabatic temperature rise is Y = 1.026X + 60.80. Due to the heat dissipation of the surface and the heat exchange between the foundation and the cap, the maximum internal adiabatic temperature rise is less than the theoretical calculation of the adiabatic temperature rise plus the concrete molding temperature. However, the internal adiabatic temperature rises and reaches the highest temperature at different molding temperatures. The internal adiabatic temperature rise is approximately 1°C for every 1°C increase in the molding temperature.
As shown in
Figure 6, the maximum surface temperature increases with the increase in molding temperature, and the relationship between the molding temperature and the maximum adiabatic temperature rise is Y = 0.189X + 25.35. Due to the influence of ambient temperature and surface convection coefficient, the maximum temperature the concrete surface can reach under natural heat dissipation conditions is much smaller than the core temperature inside the cap. 0.2°C approximately increases the maximum surface temperature for every 1°C increase in the molding temperature.
In
Figure 7, the internal surface temperature difference increases with the increase of concrete molding temperature, and the relationship between the molding temperature and the maximum internal surface temperature difference is Y = 0.931X + 36.43. 0.95 °C approximately increases the maximum internal surface temperature difference for every 1°C increase in the molding temperature.
3.4. The Influence of Ambient Temperature and Surface Convection Coefficient
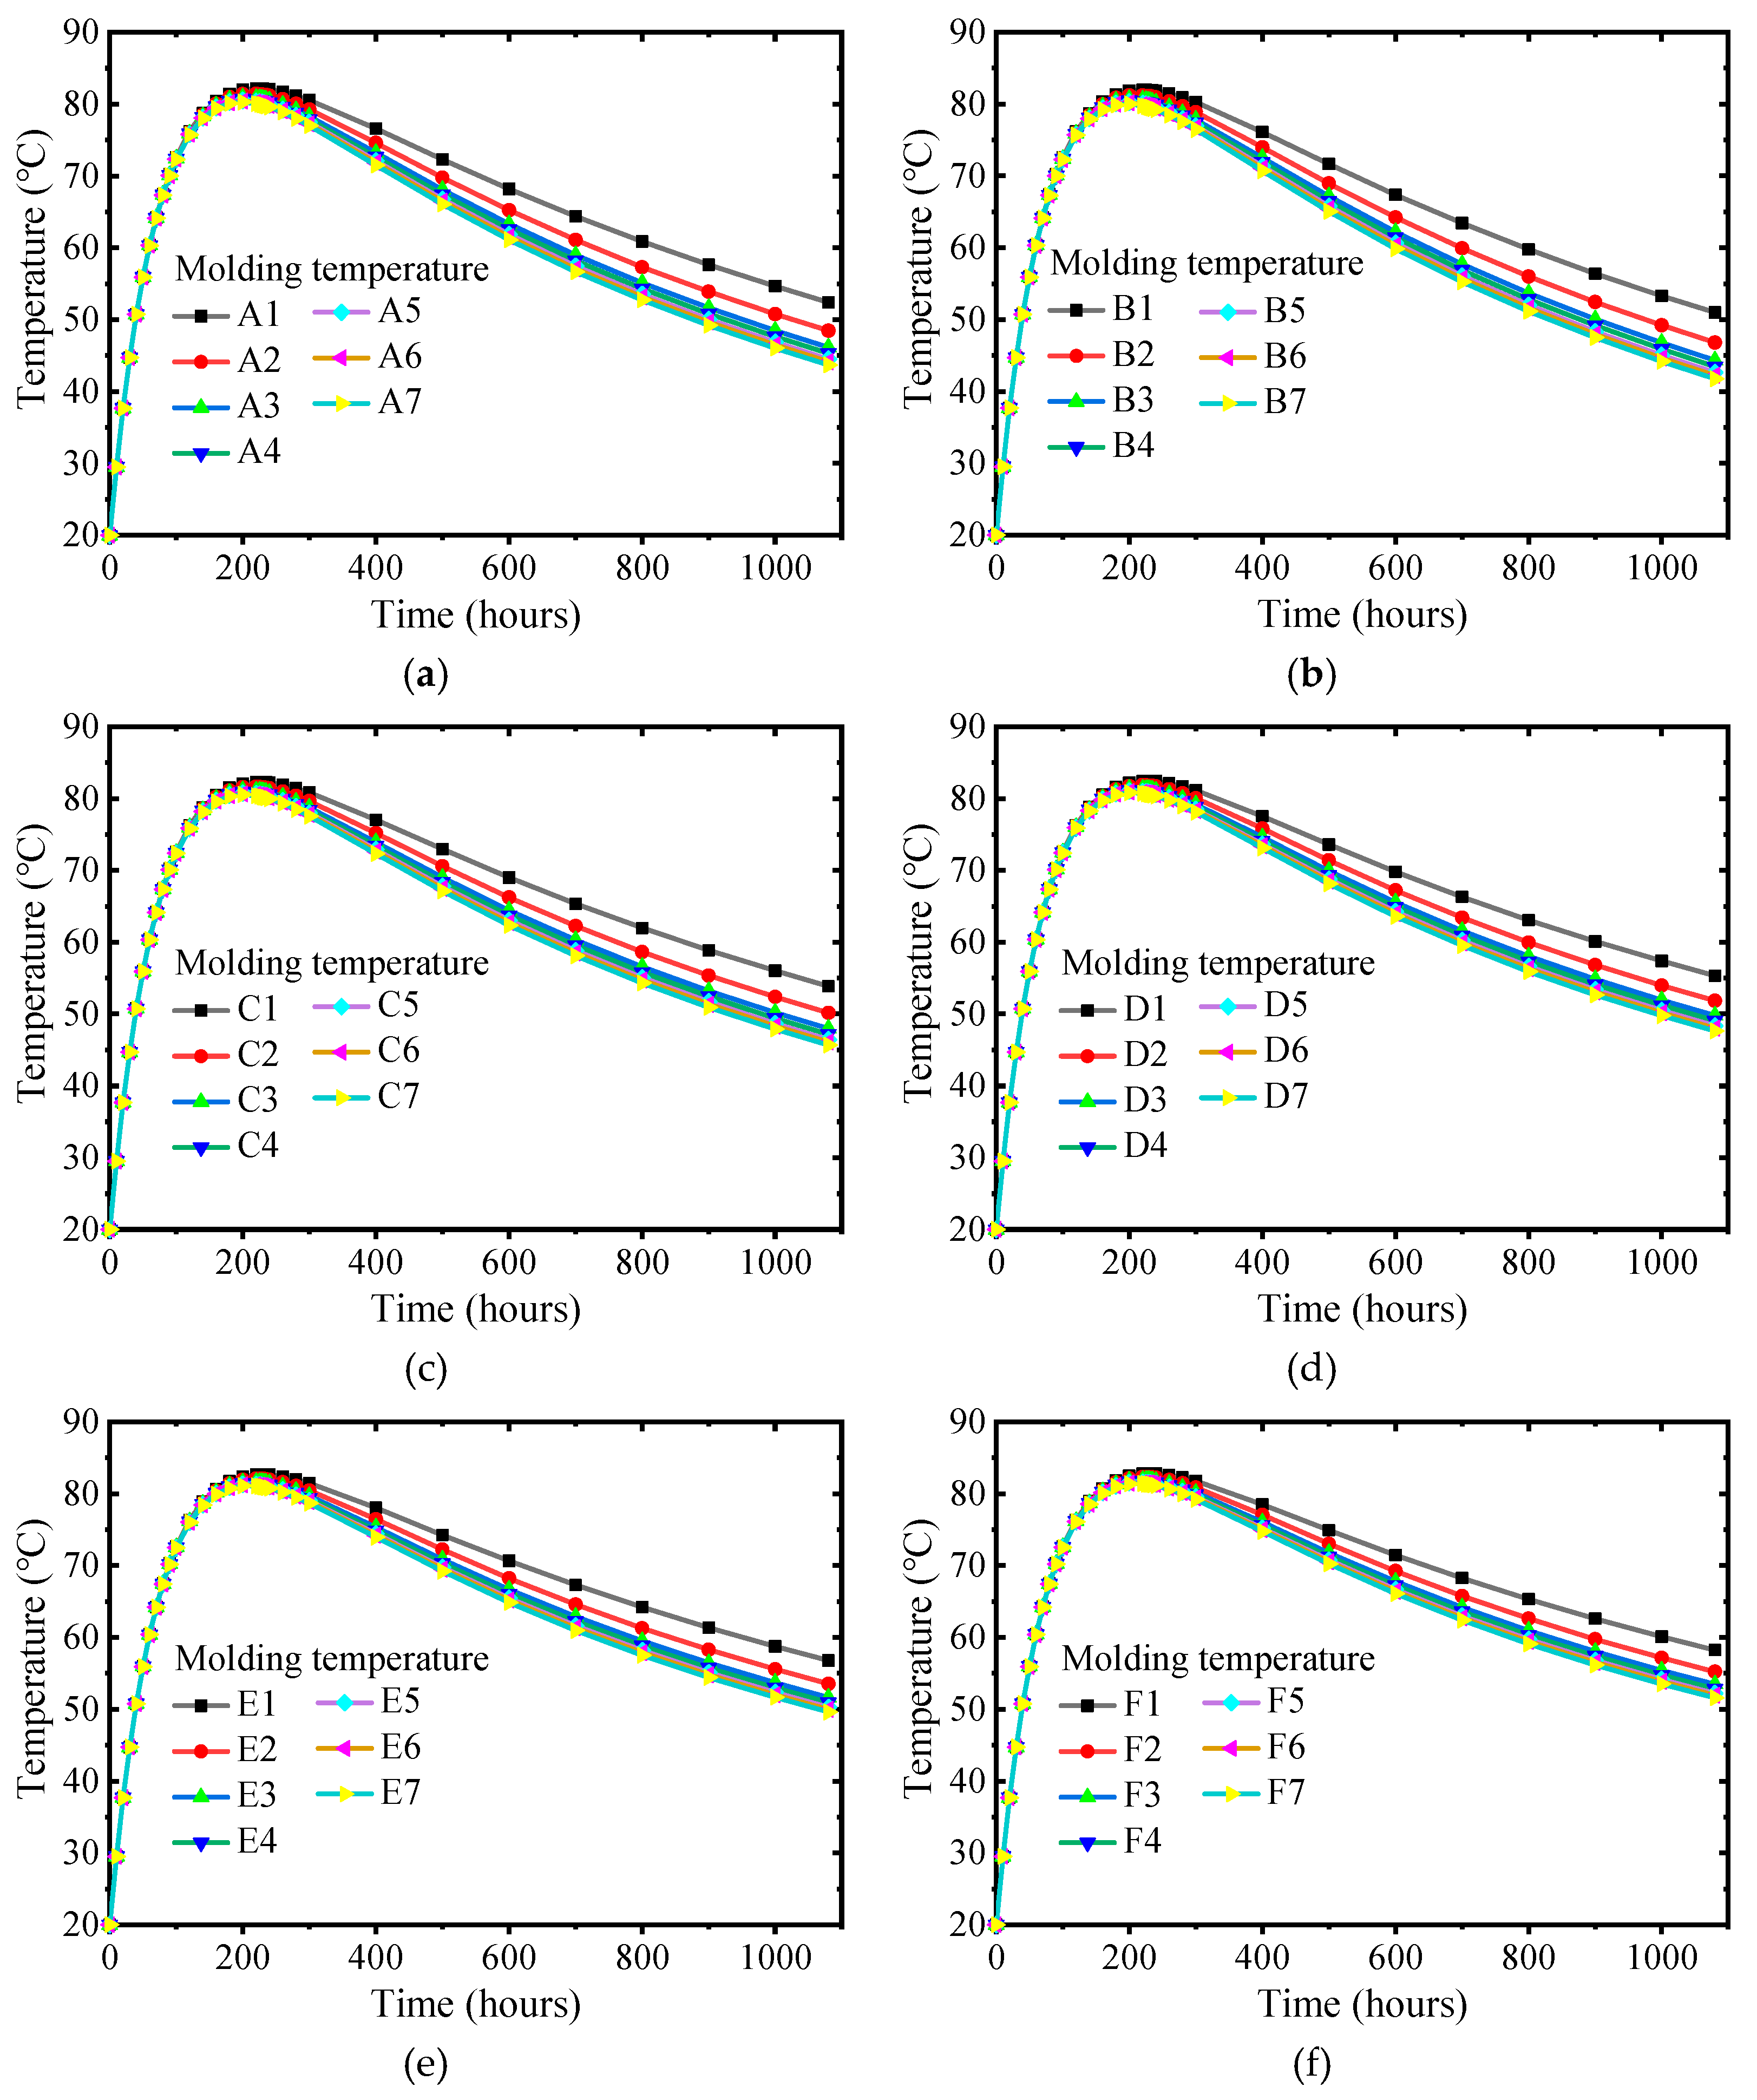
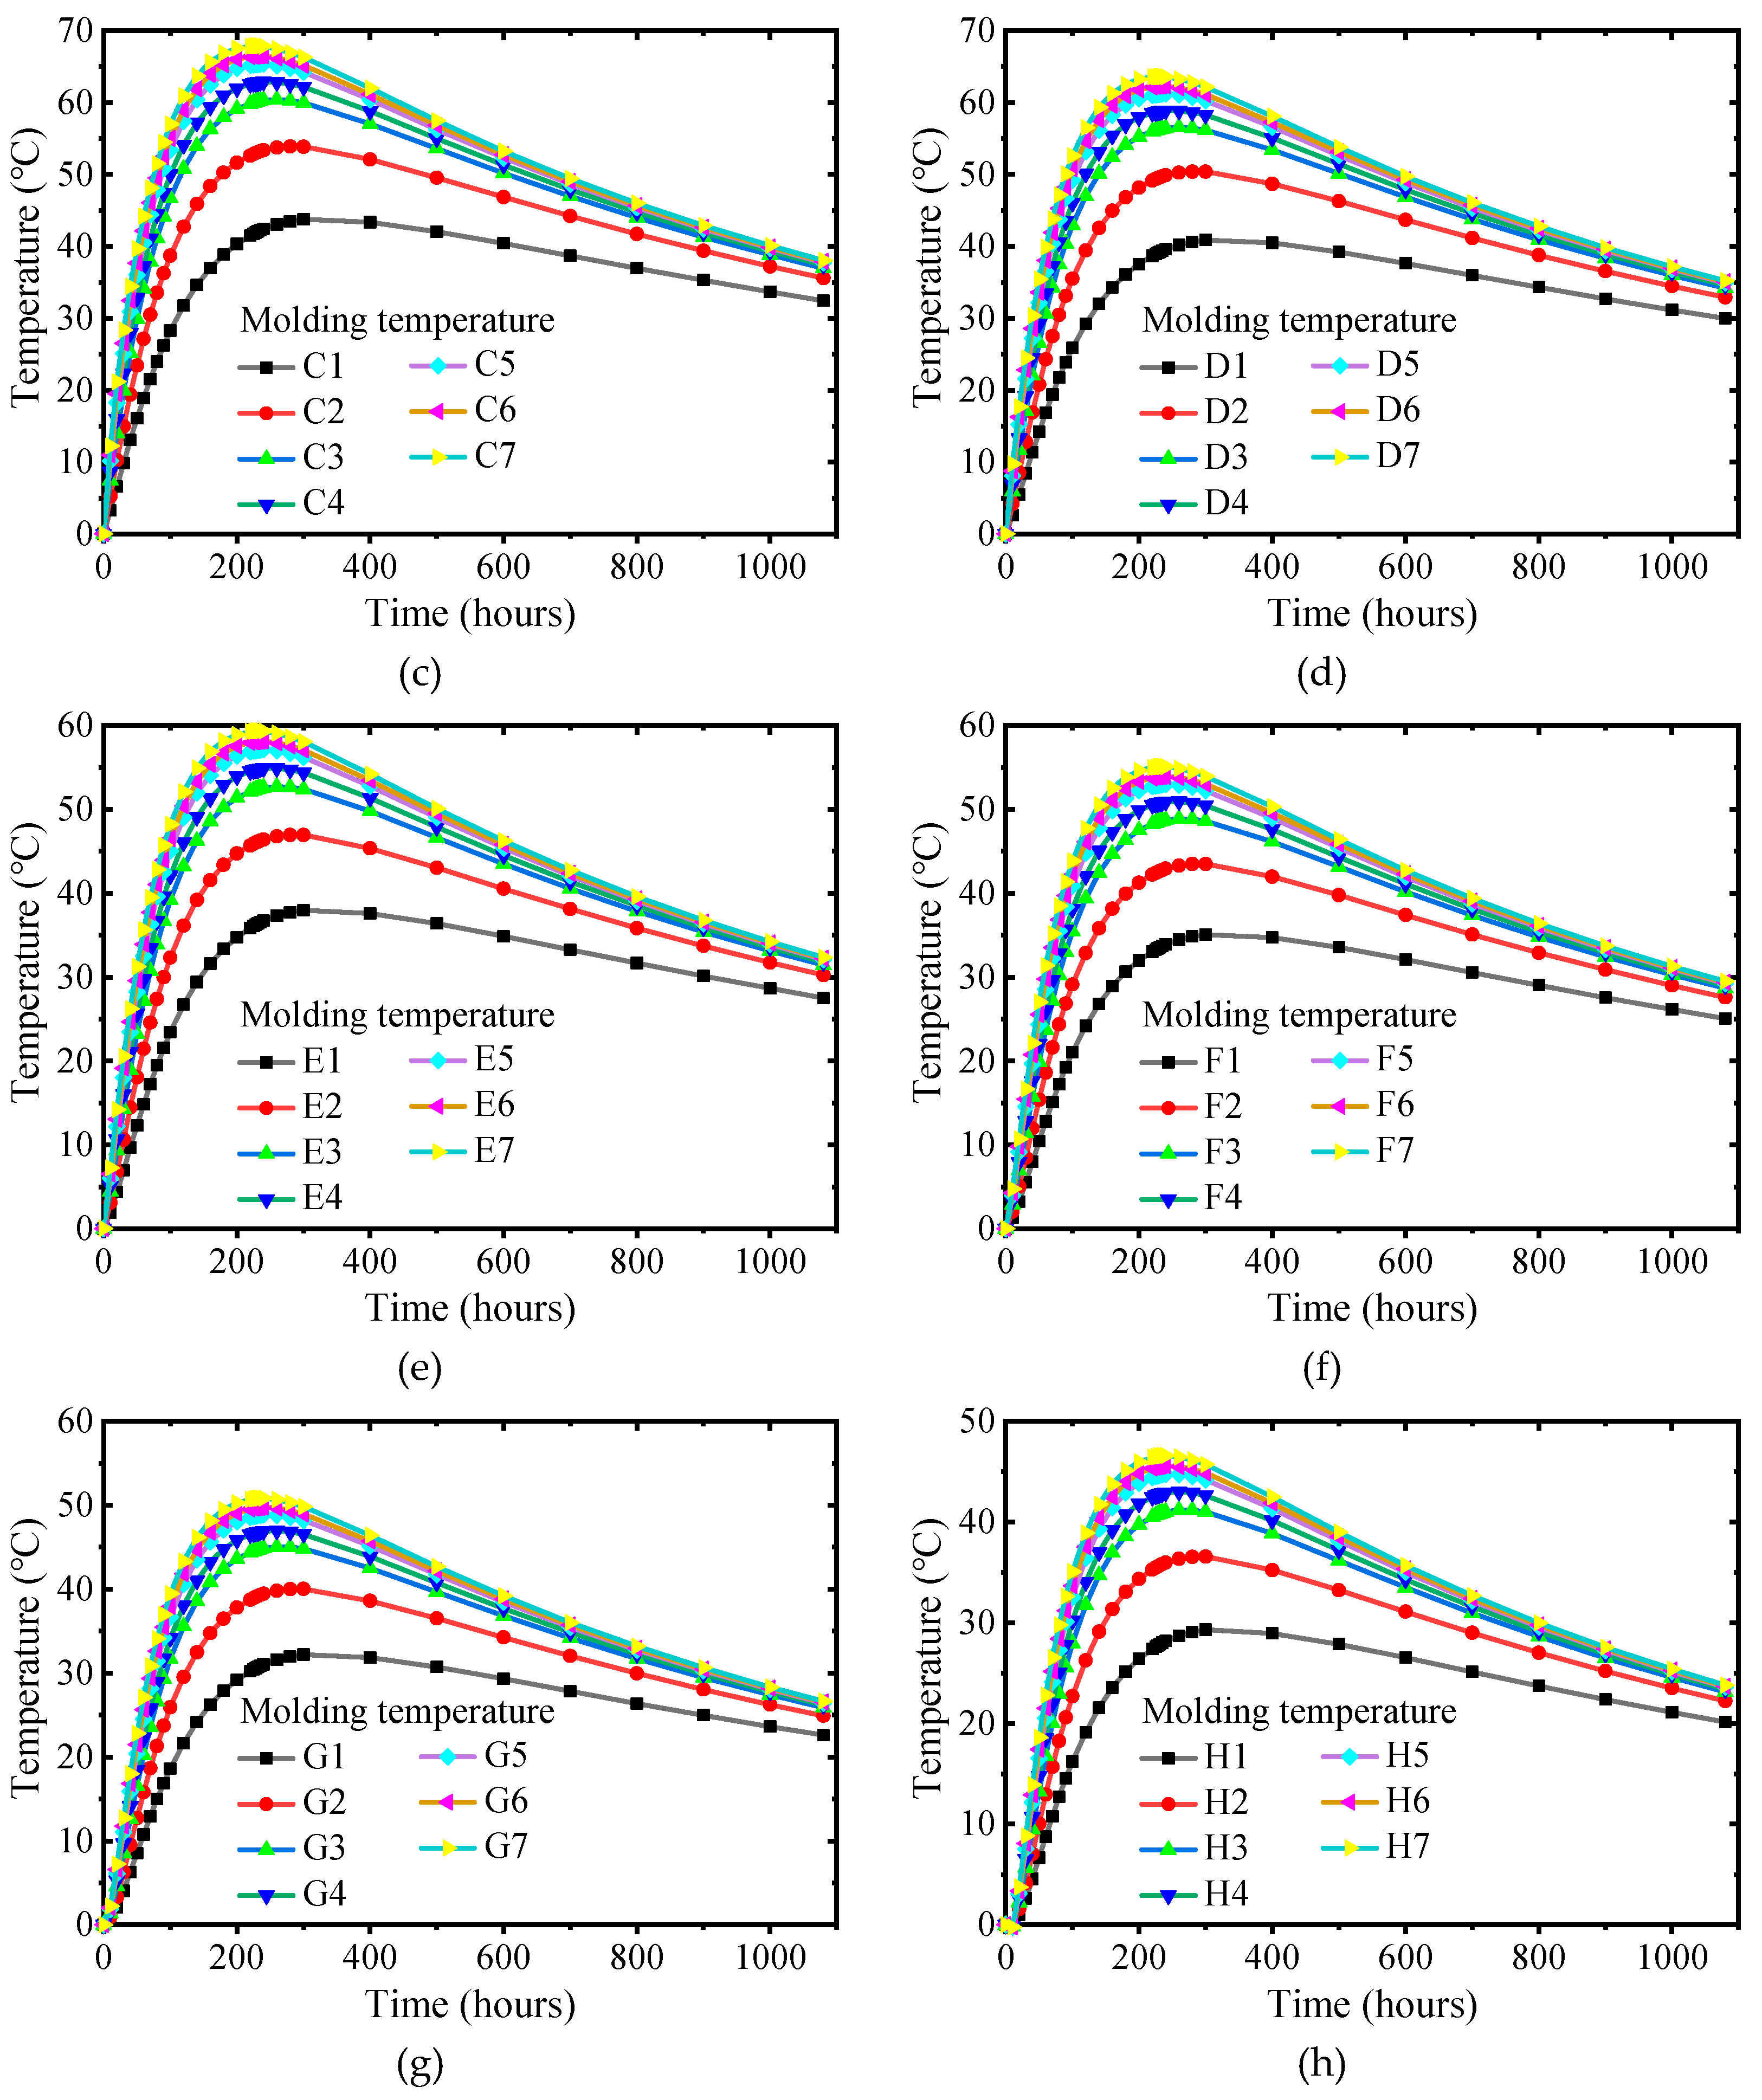
The molding temperature is set to 20 °C without considering the pipe cooling system. The ambient temperature range is −5°C ~ 30°C. According to the previous study, the range of surface convection coefficient is
~
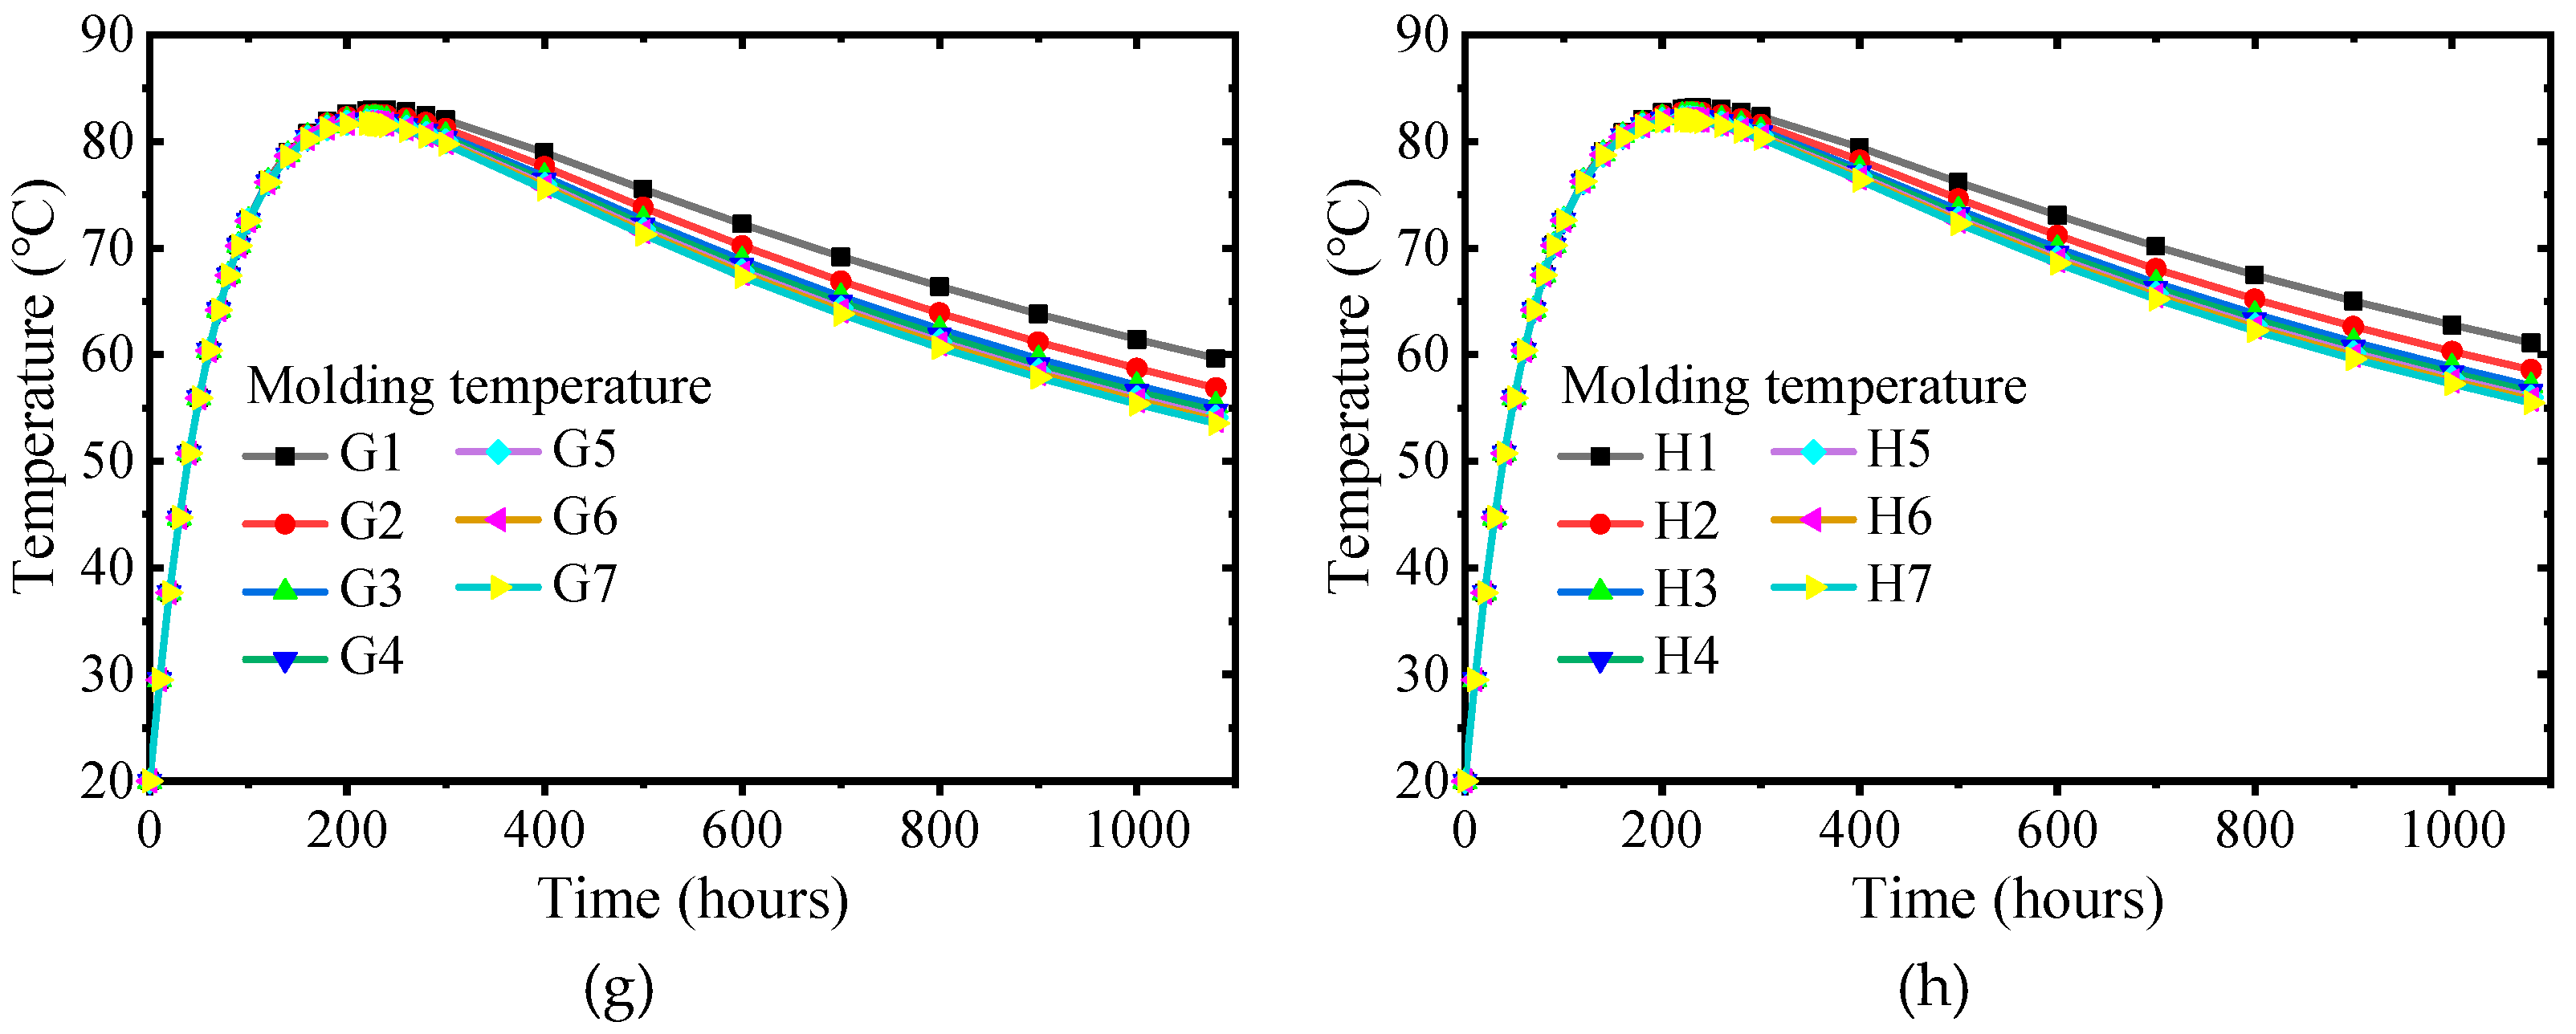
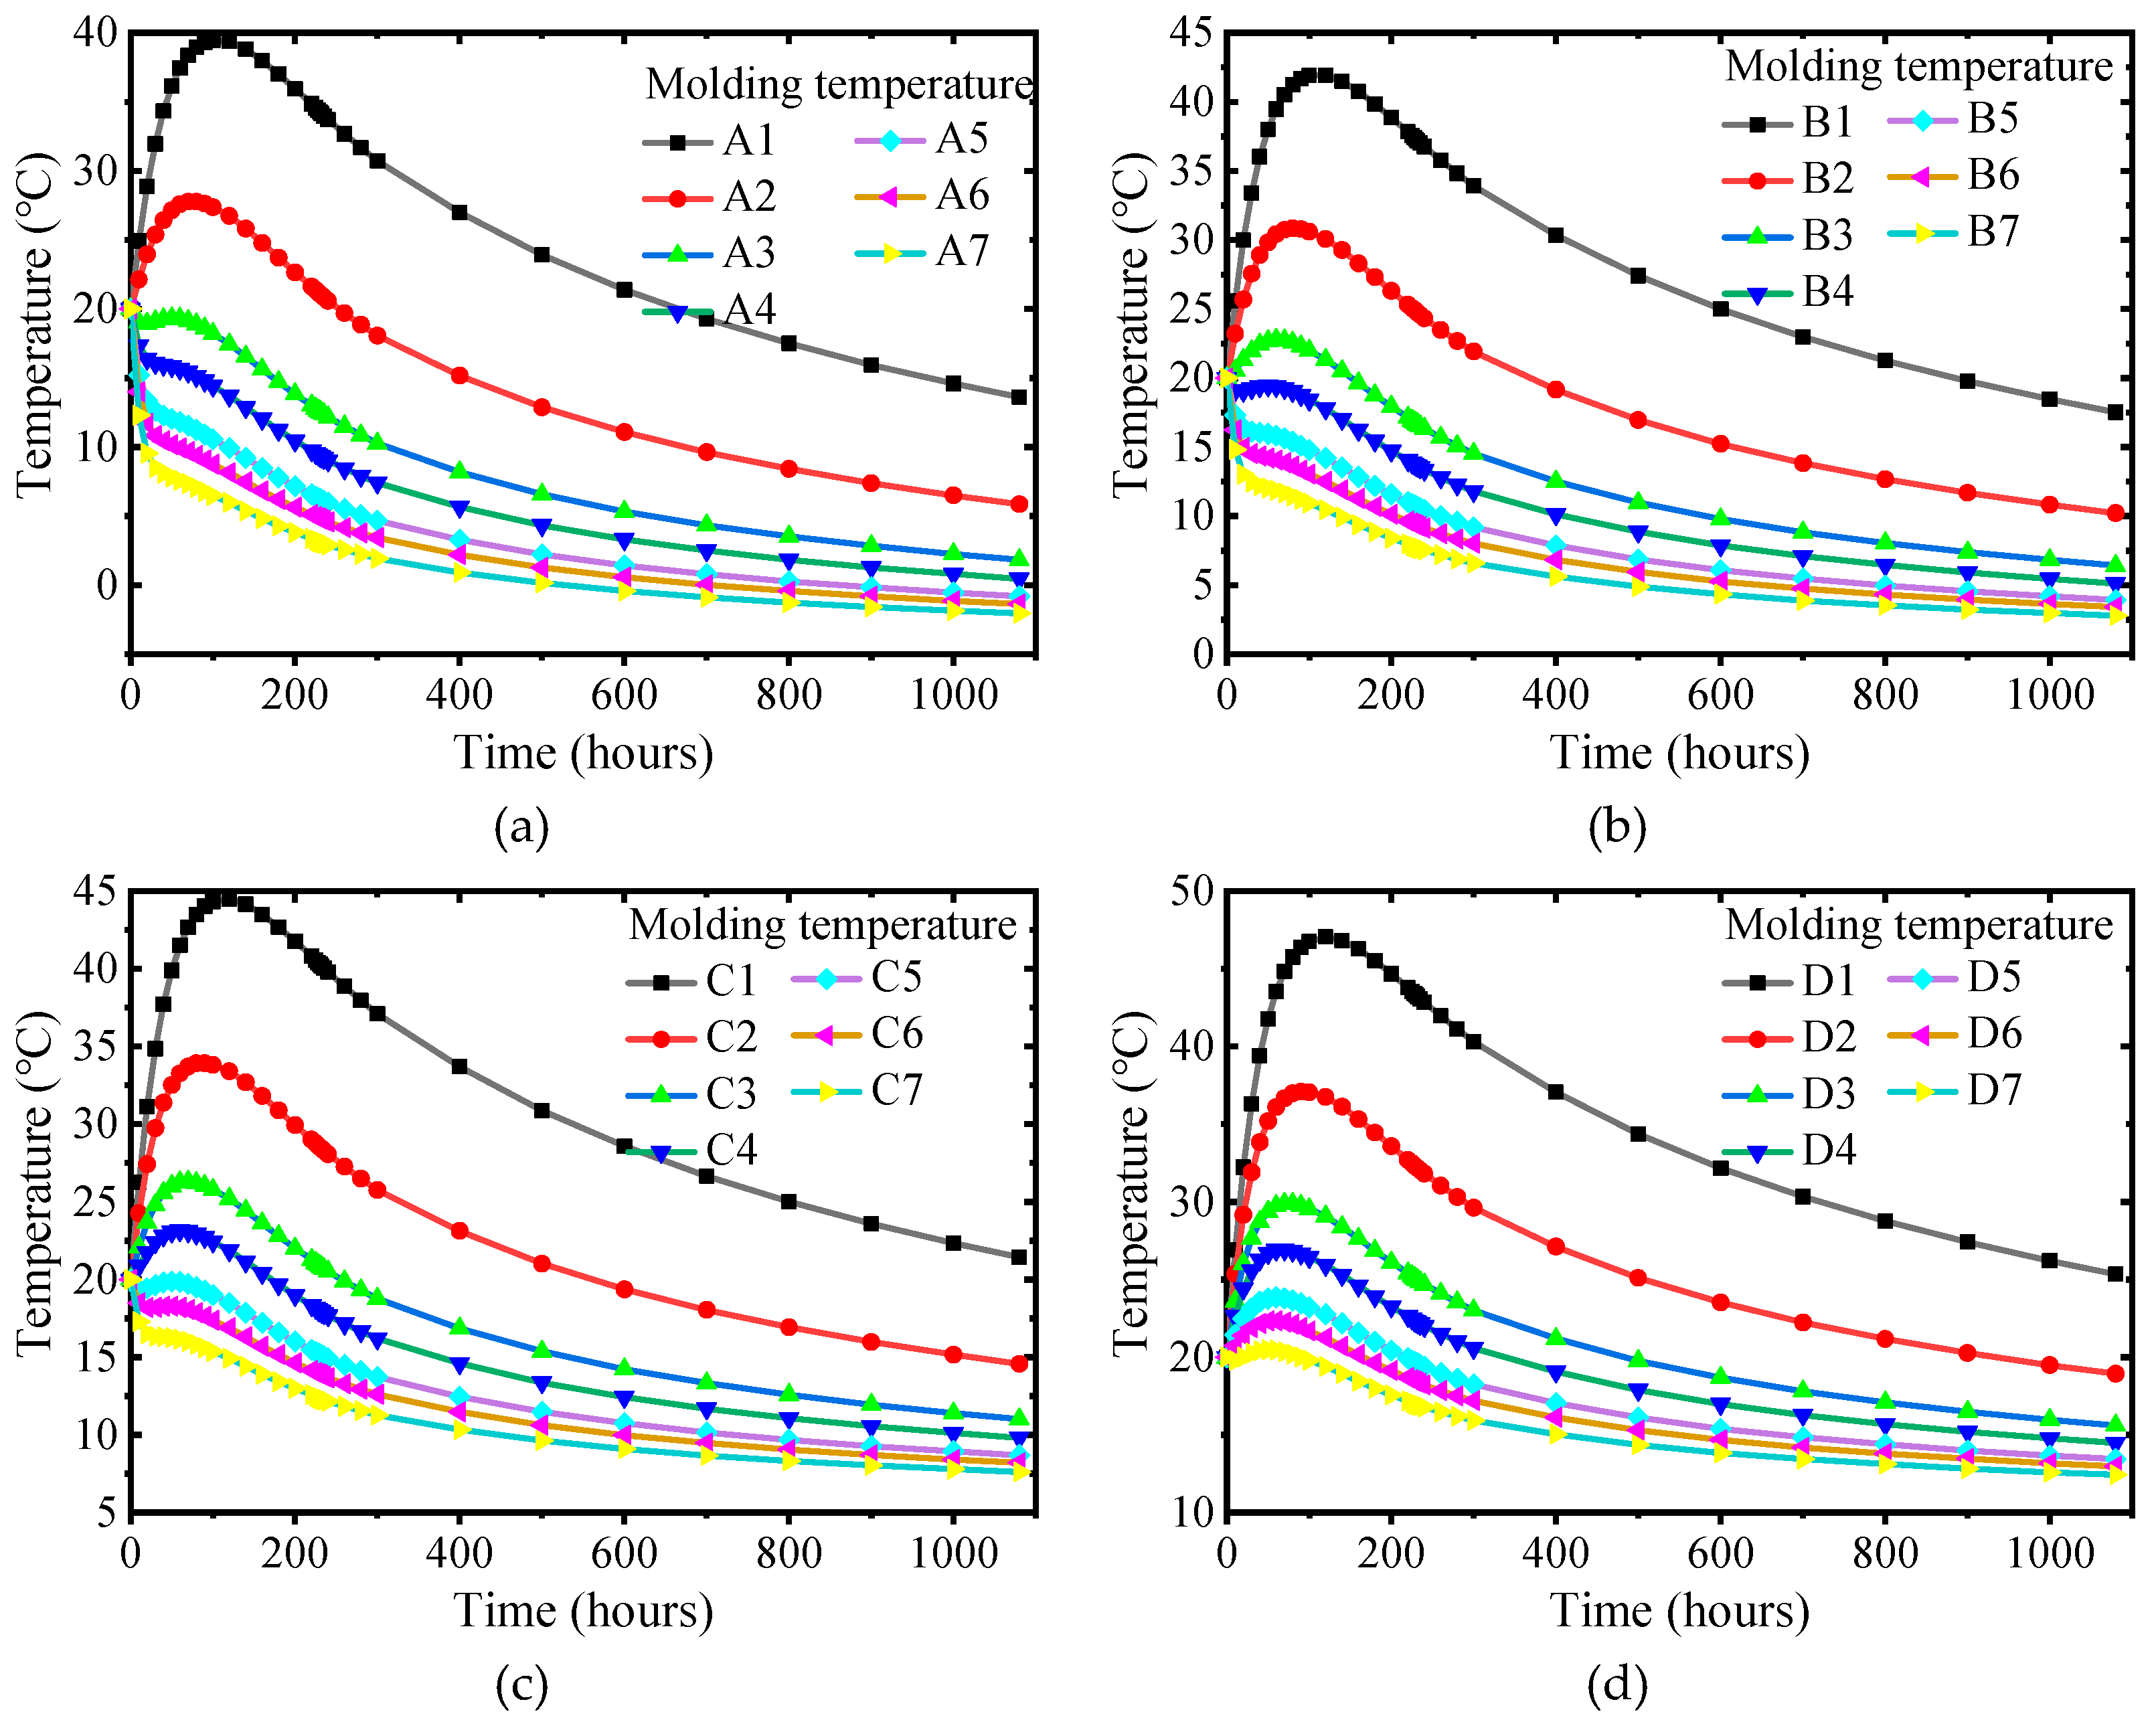
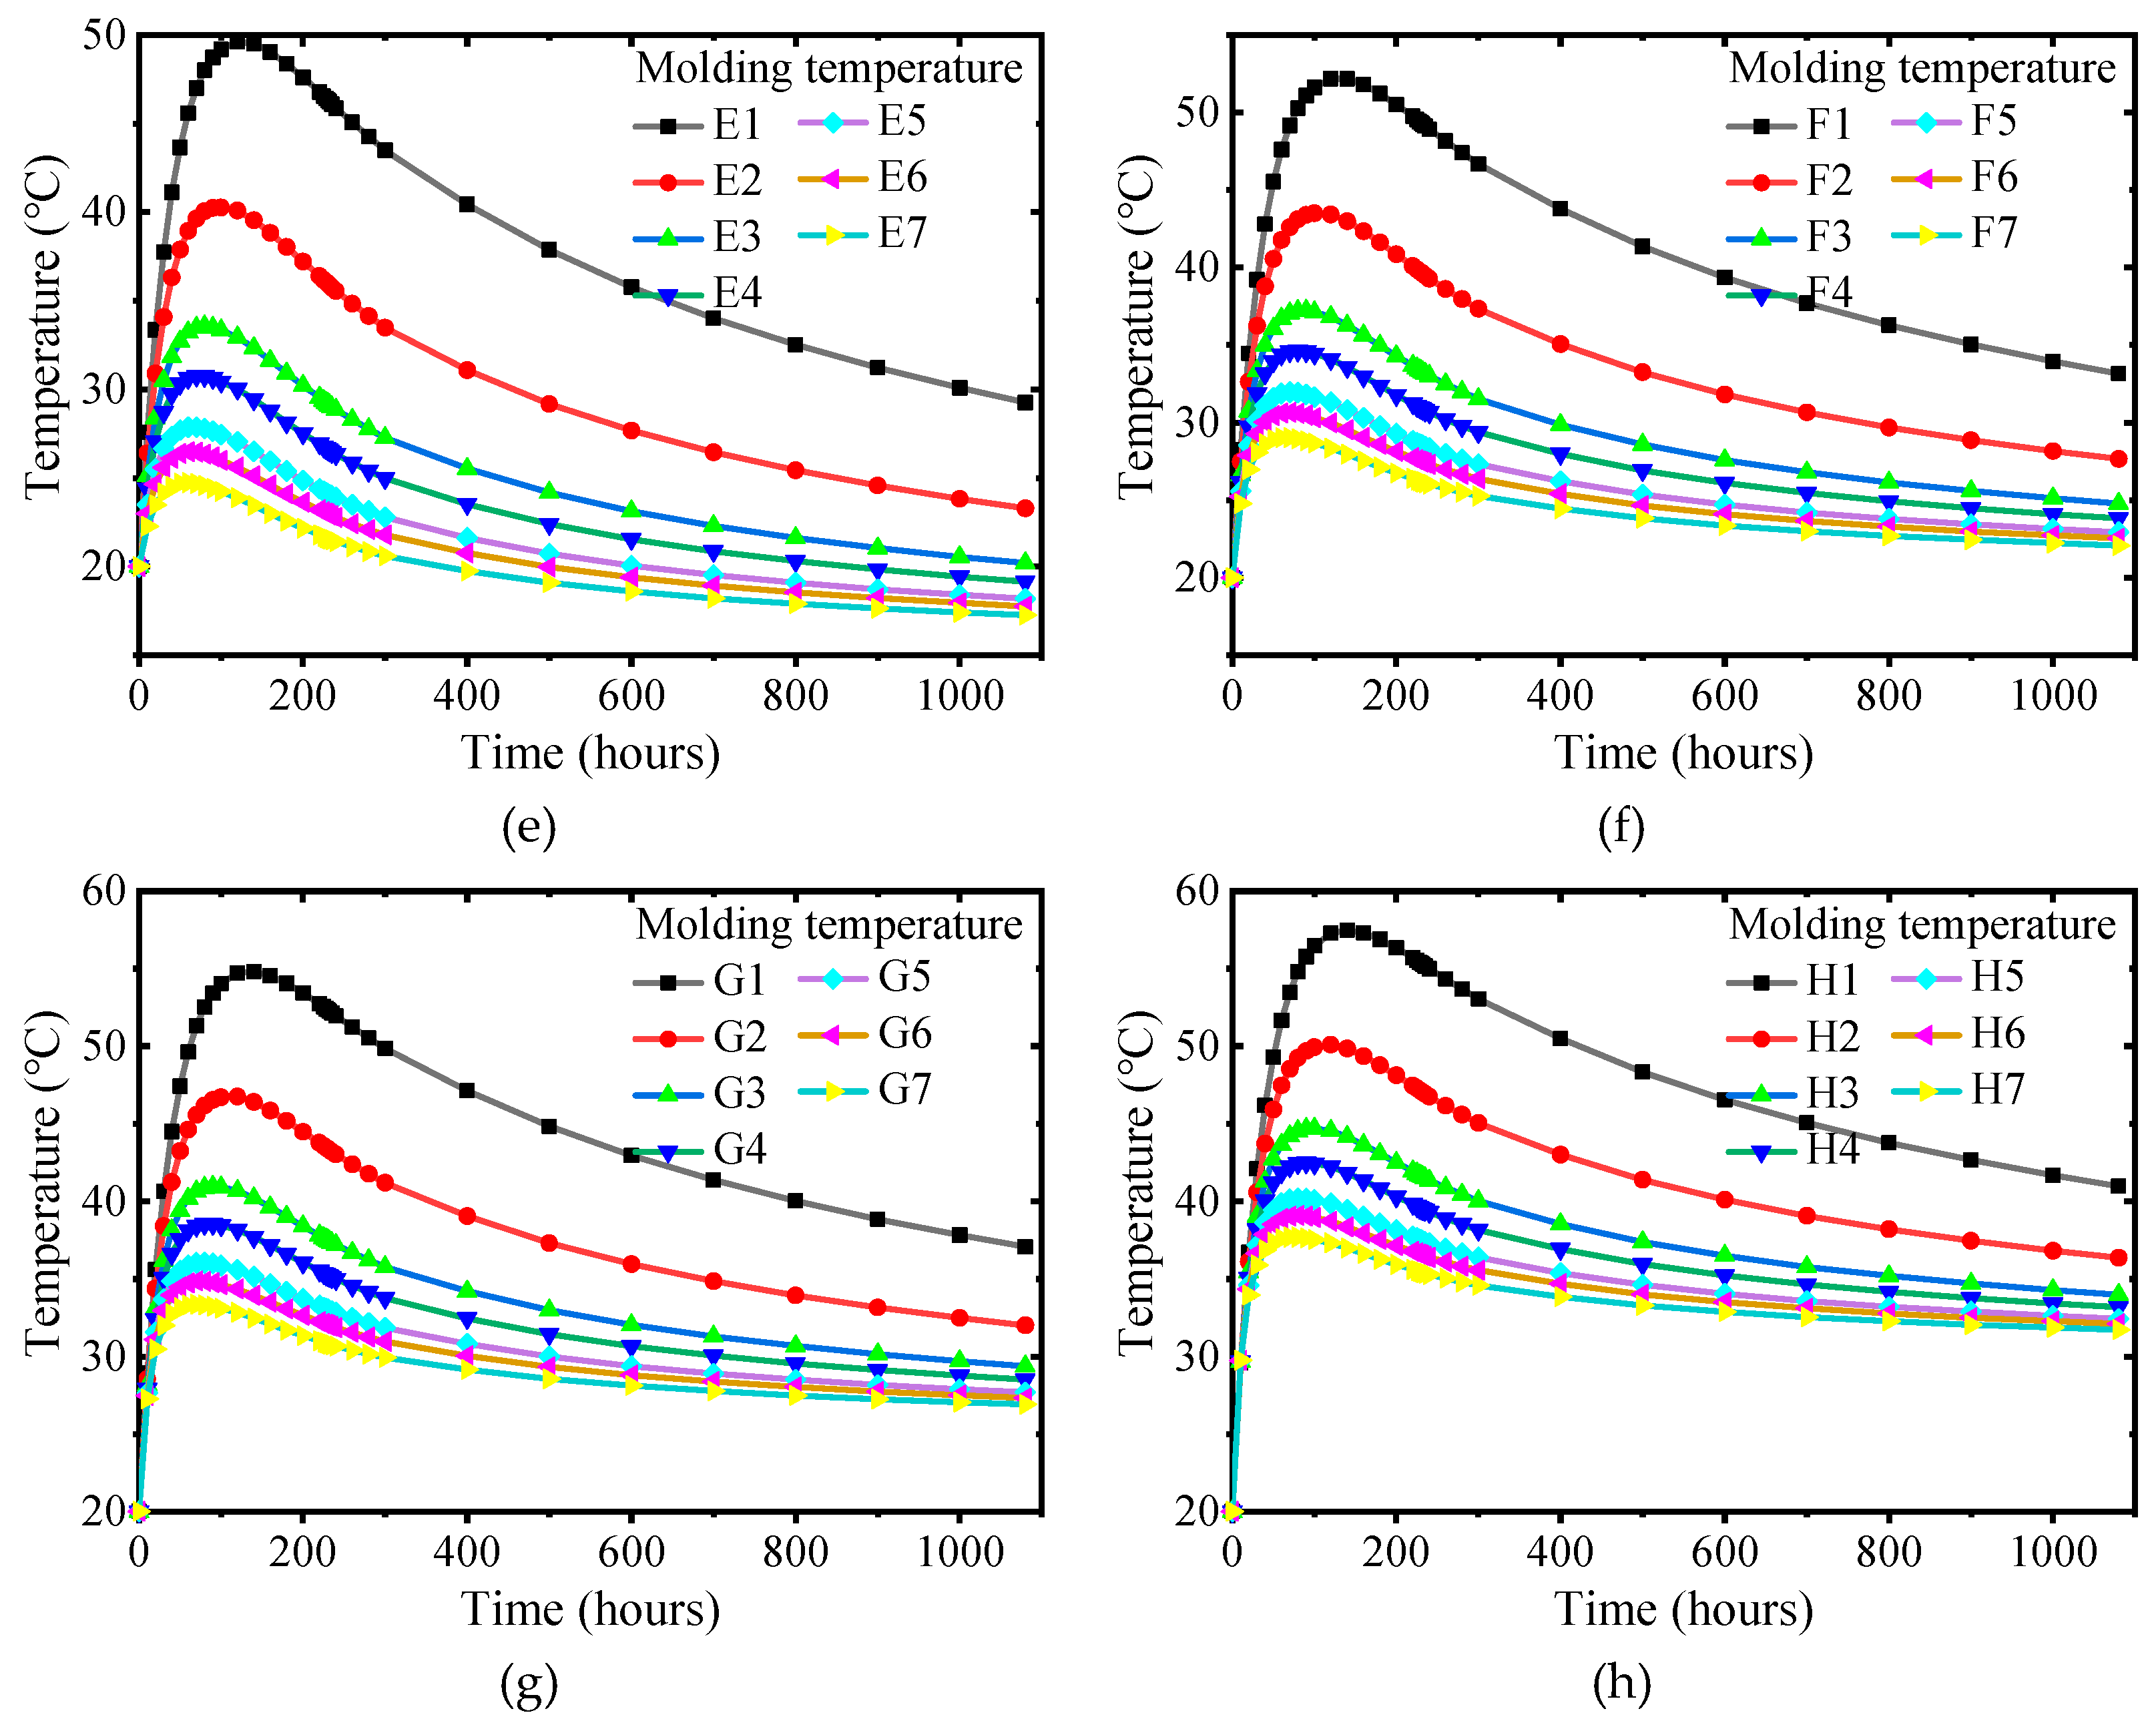
. The analysis scheme as shown in
Table 5. The temperature rise curves under different working conditions are shown in
Figure 8,
Figure 9 and
Figure 10.
In
Figure 8, the change of surface convection coefficient has little effect on the internal adiabatic temperature rise when the ambient temperature is constant. However, after the internal adiabatic temperature rise reaches the peak and enters the cooling stage, the more significant the surface convection coefficient, the greater the internal cooling rate. When the surface convection coefficient is constant, the ambient temperature change has little effect on the internal adiabatic temperature rise.
As shown in
Figure 9, the maximum surface temperature increases with the decrease of the surface convection coefficient when the ambient temperature is constant. However, the surface temperature decreases faster after the cap enters the cooling stage. When the ambient temperature is low, and the surface convection coefficient is significant, there is no obvious heating process for the surface temperature. When the surface convection coefficient is constant, the maximum value of the surface temperature increases with the increase of the ambient temperature. The greater the surface convection coefficient, the greater the influence of the construction environment temperature on the surface temperature.
When the ambient temperature is constant, the internal surface temperature difference decreases with the decrease of the surface convection coefficient. When the surface convection coefficient is constant, the internal surface temperature difference decreases with the increase in ambient temperature.
3.5. The Influence of Pipe Cooling System Parameters
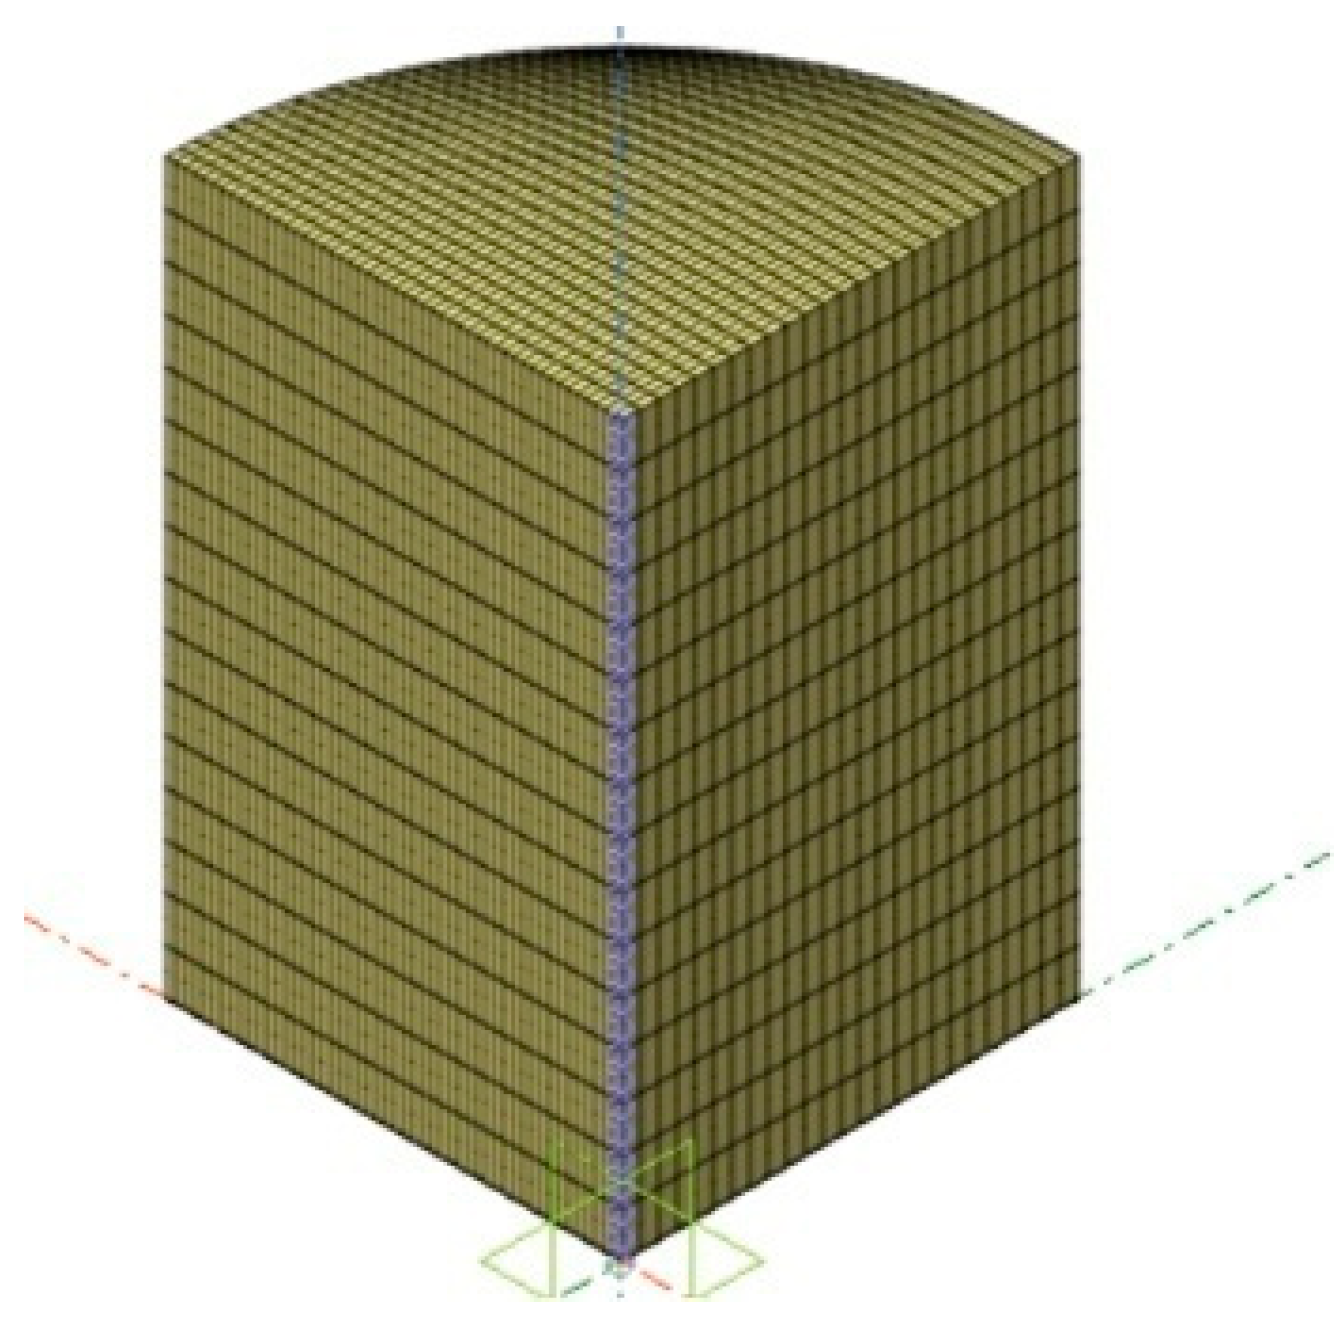
The pipe cooling system has strong controllability, and the temperature gradient of mass concrete can be regulated by pipe diameter, water temperature, water flow and other conditions, and the effect is noticeable. In order to study the effect of various parameters of the pipe cooling system on the temperature reduction of the concrete around the tube cooling system, the concrete model of a quarter of the cylinder was established by Midas FEA software. The diameter of the cylinder model is 5m, the height is 8m, the length of the X-axis unit is 10cm, the length of the Y-axis unit is 20cm, and the length of the Z-axis unit is 50cm. The Midas FEA analysis model is shown in
Figure 11.
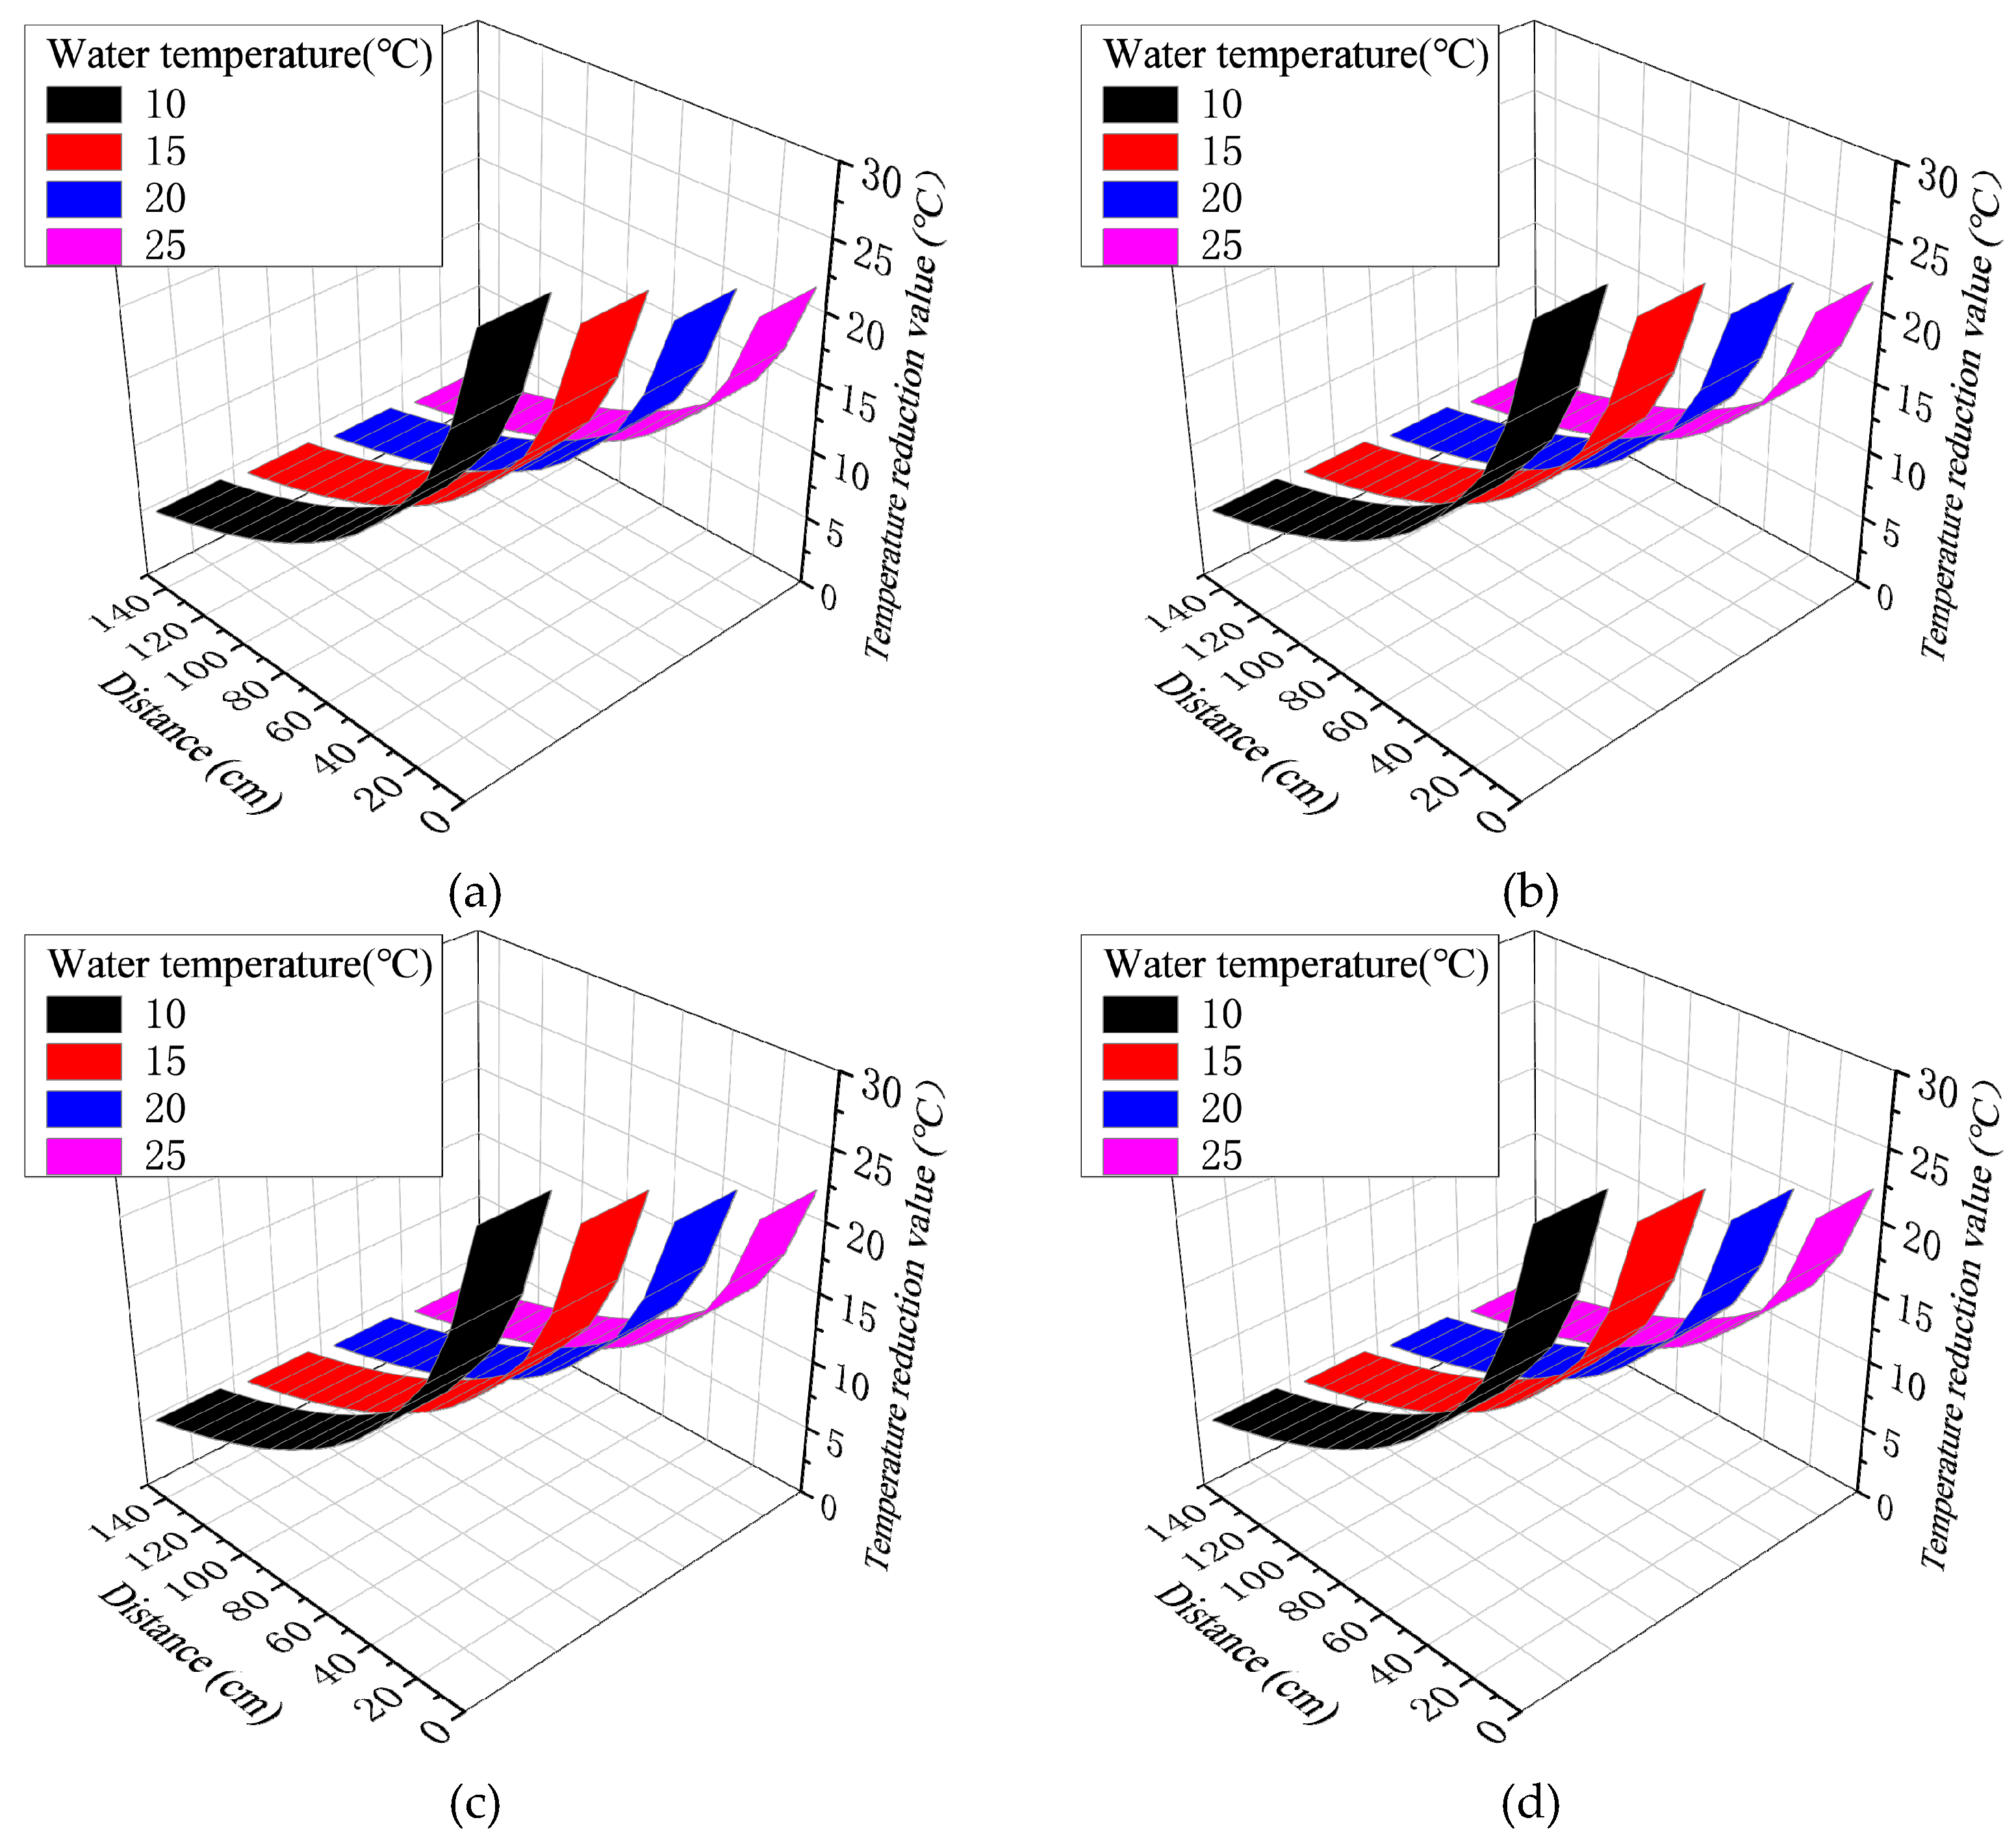
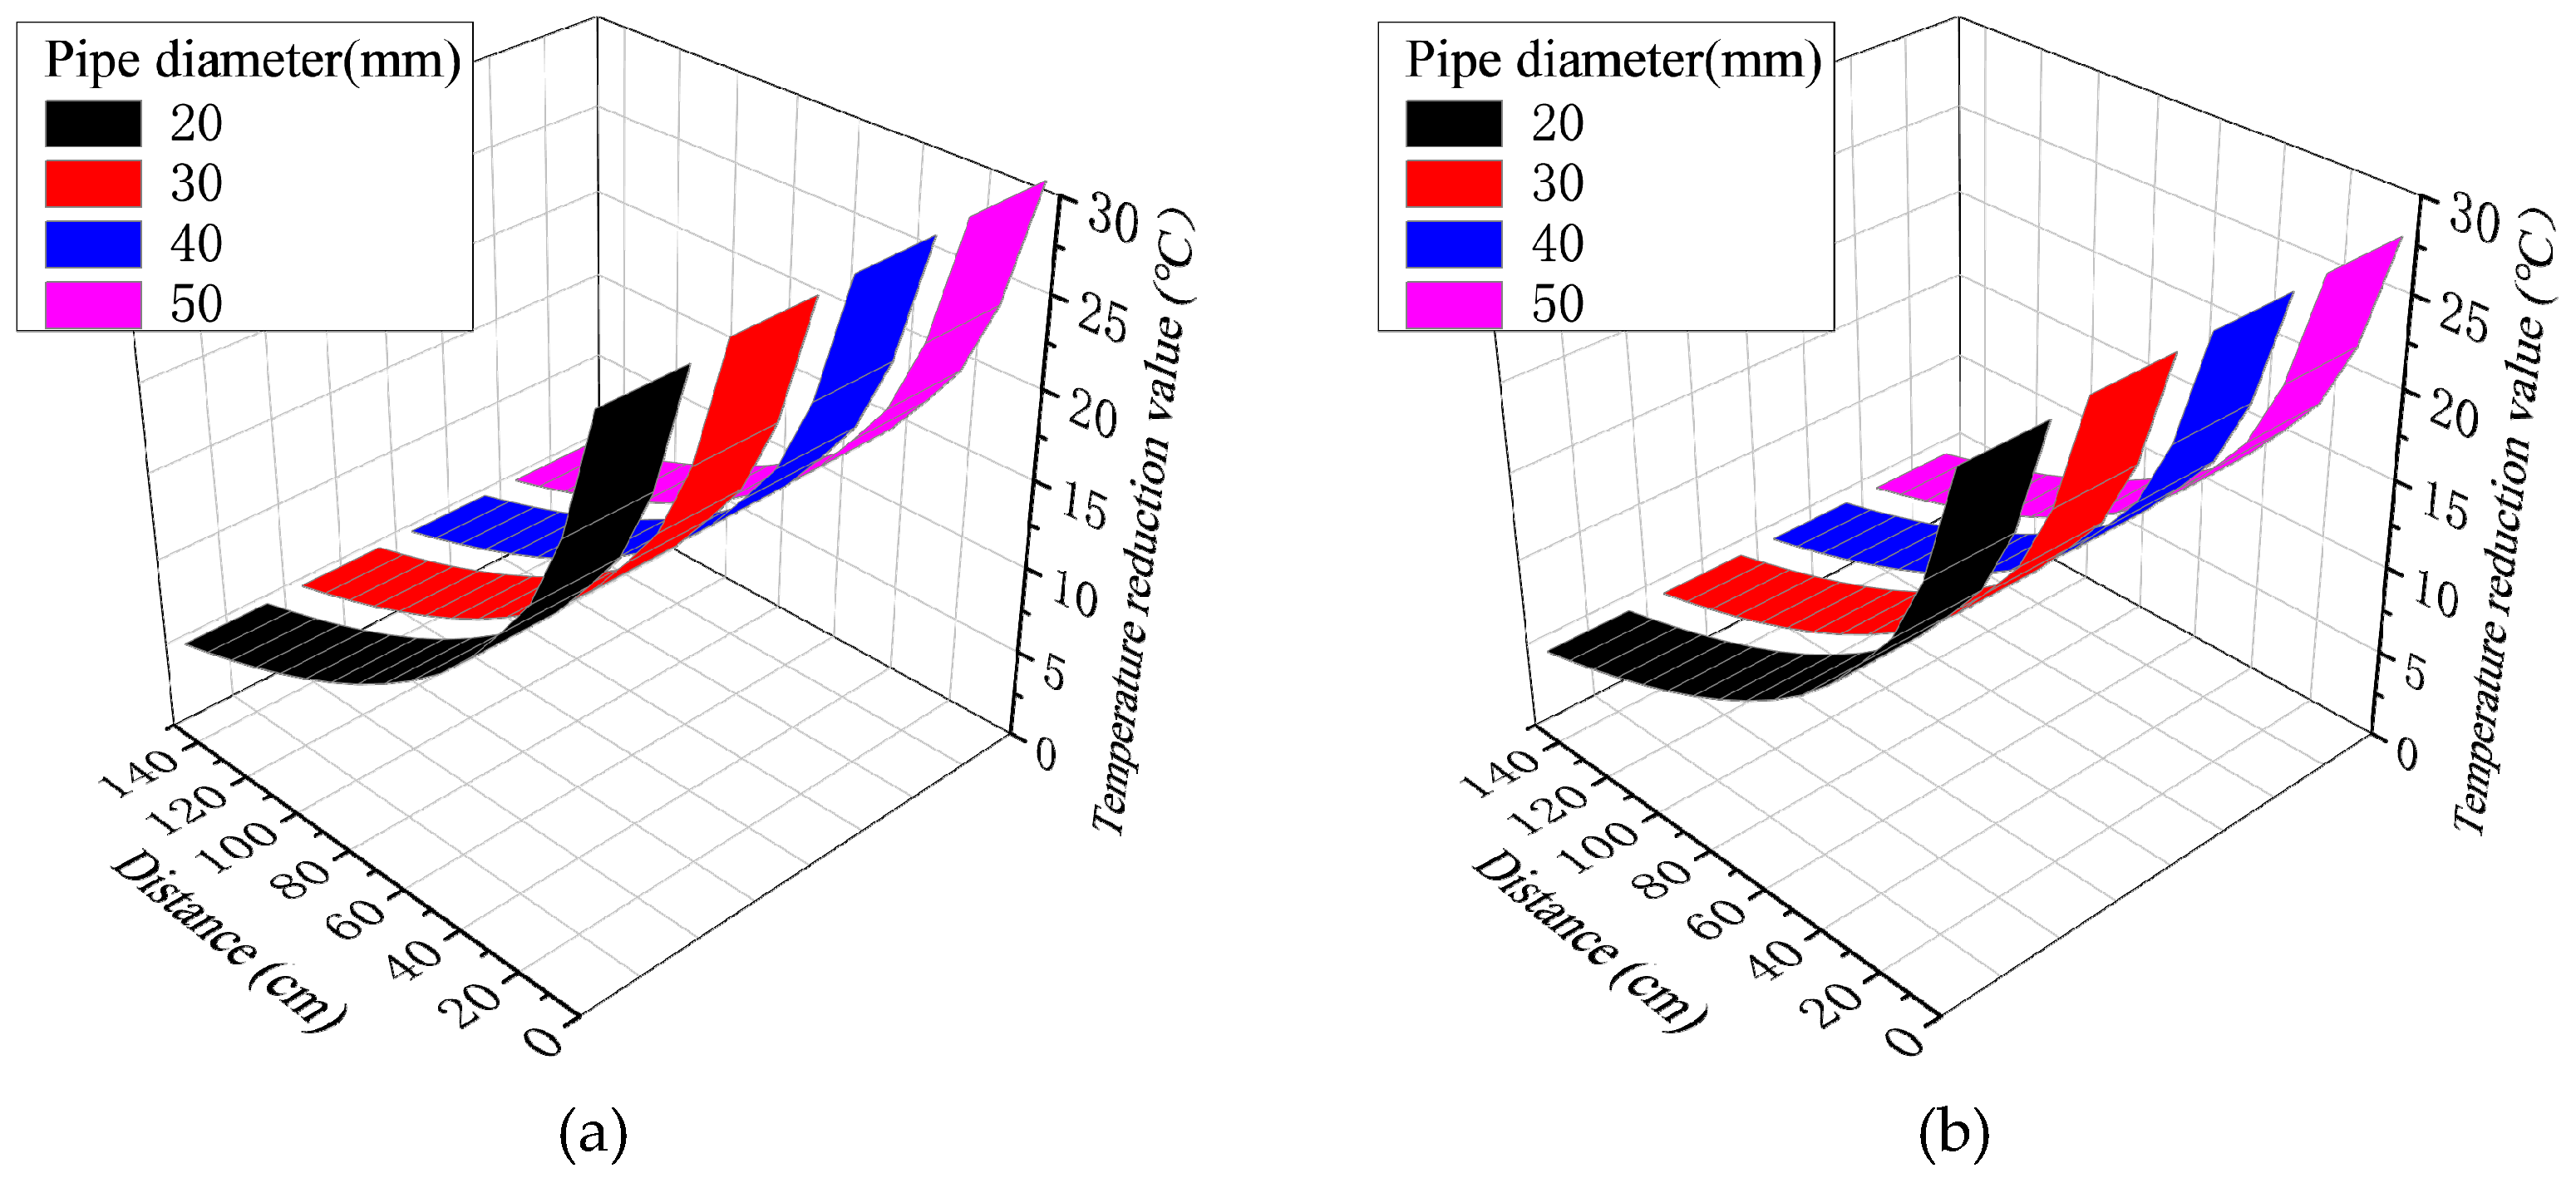
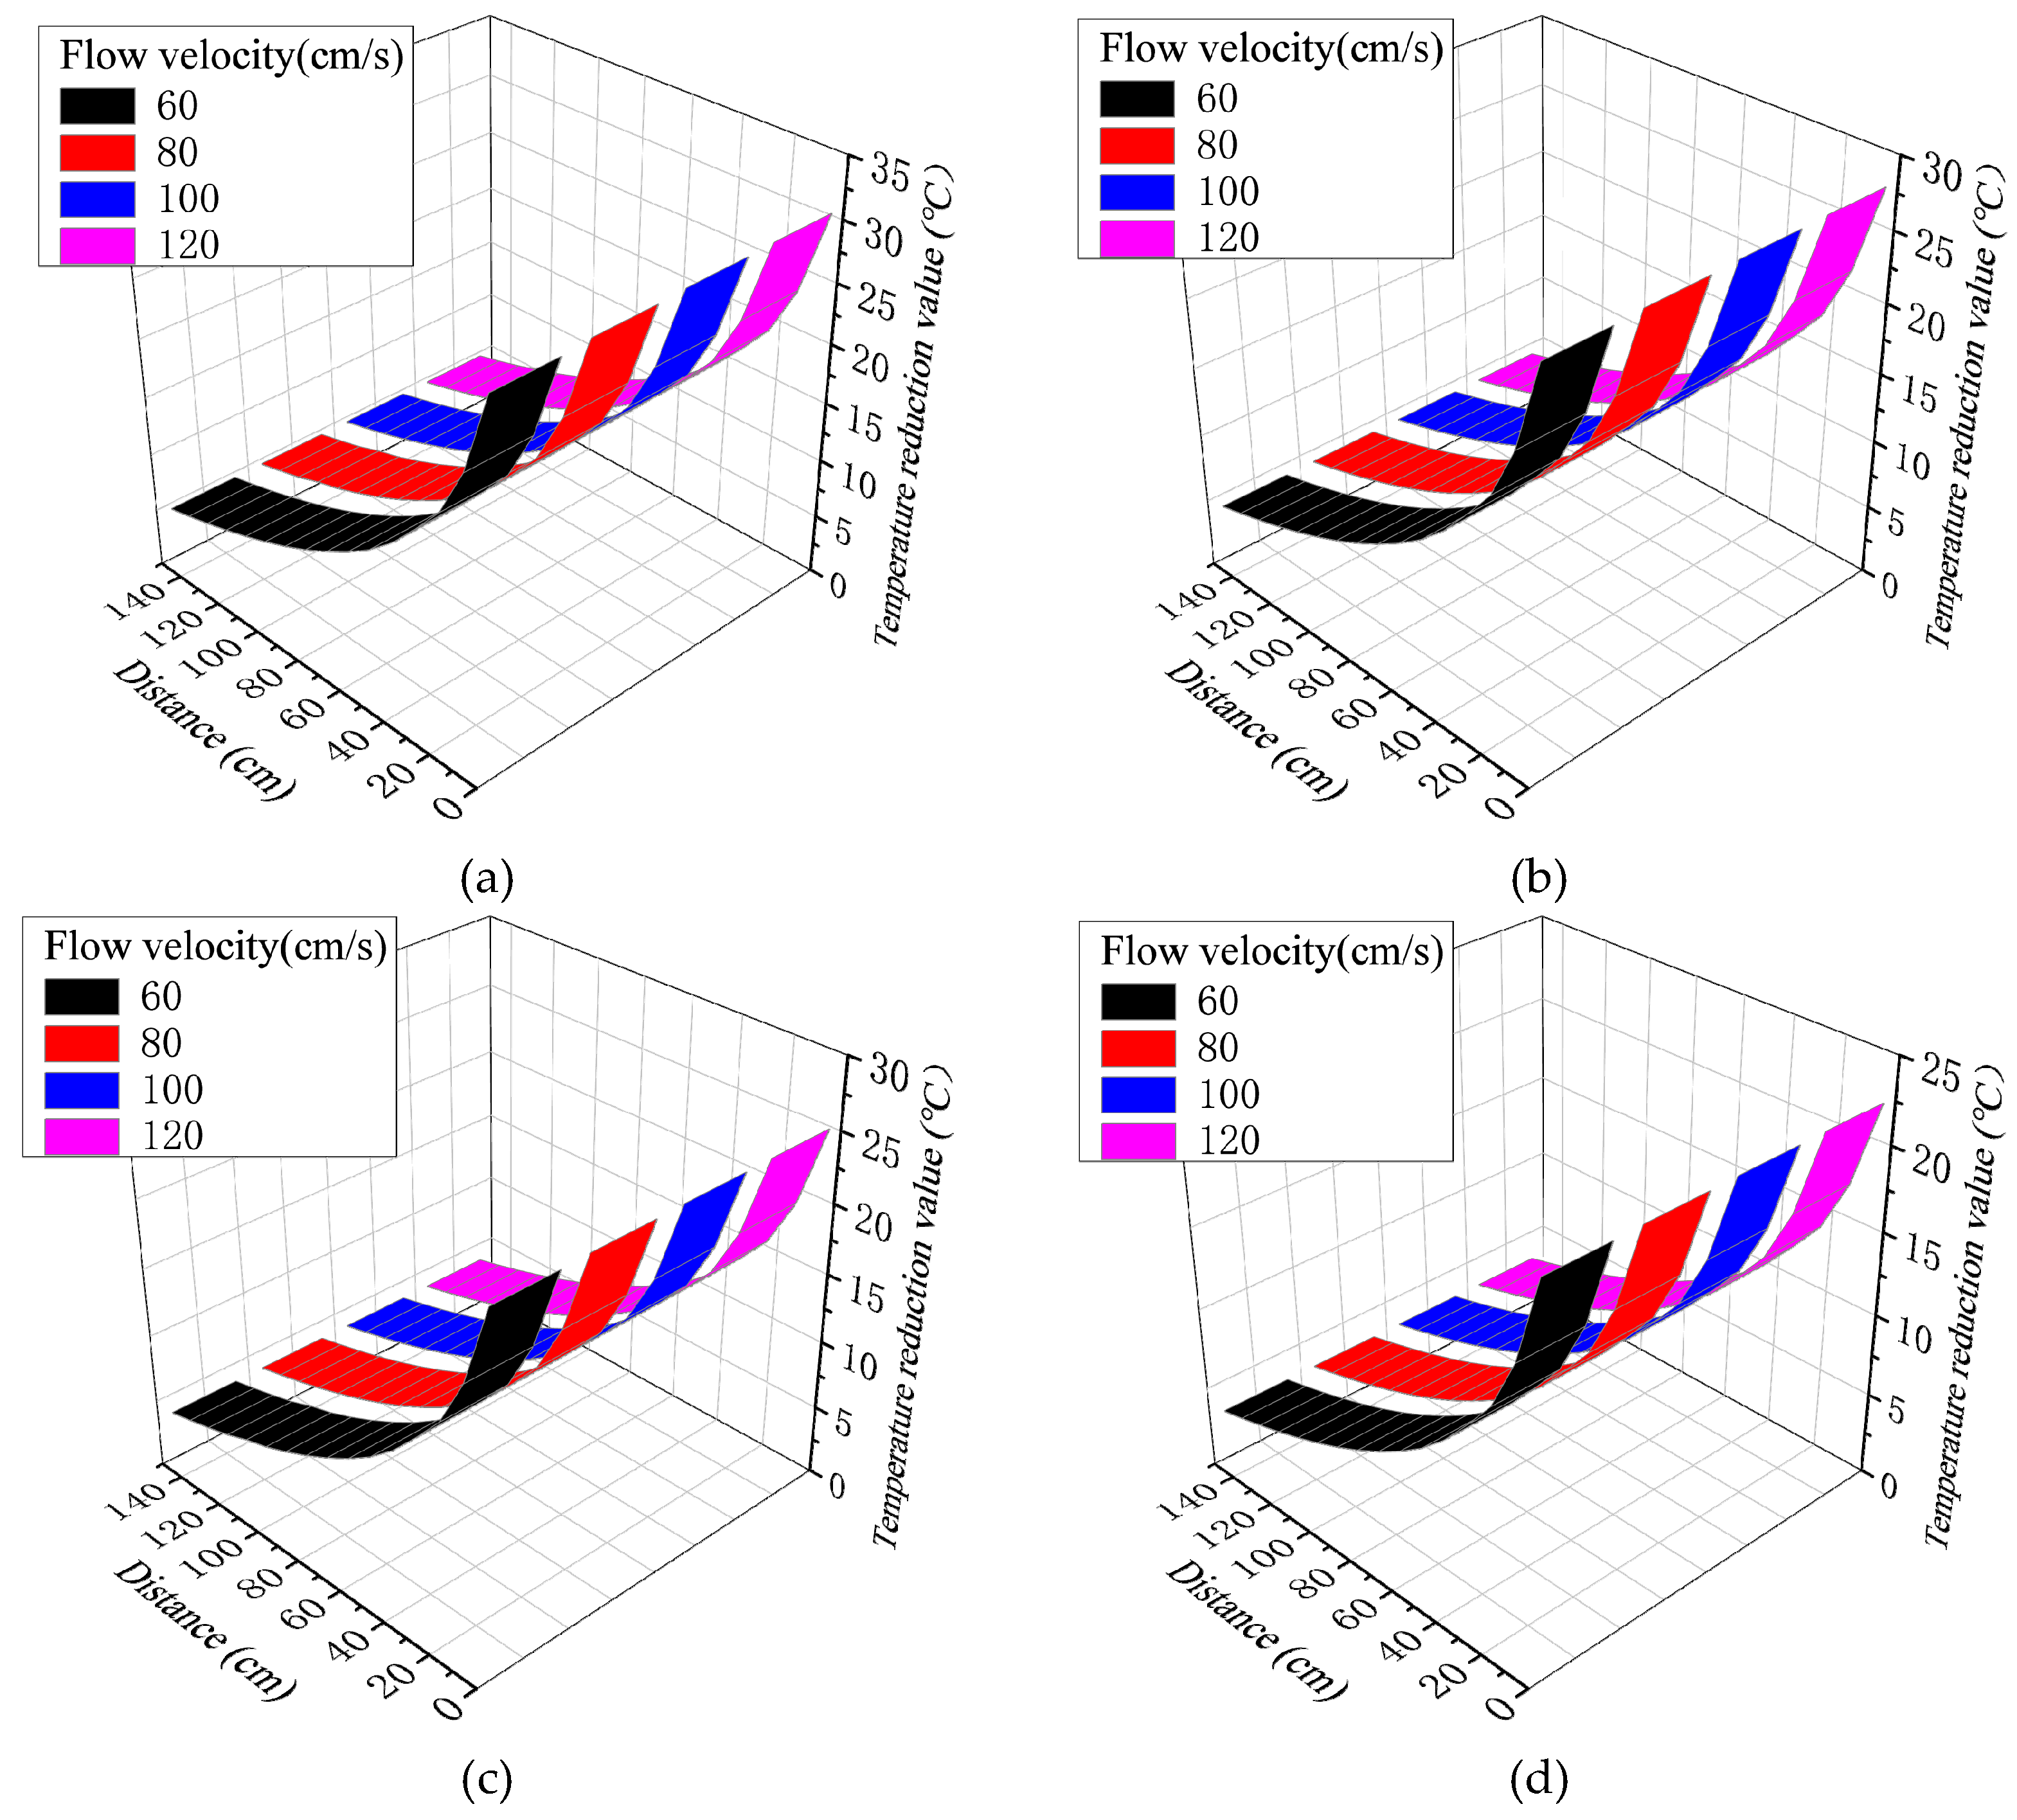
The pipe cooling system is arranged inside the mass concrete, and the low-temperature cold water is introduced to reduce the temperature rise caused by the hydration heat of the concrete through the heat exchange between the concrete and the low-temperature fluid. The concrete parameters are the same as above, the molding temperature is 20°C, and the ambient temperature is 20°C. Without considering the heat preservation measures of mass concrete structure, surface heat dissipation is considered natural. In the pipe cooling system, the effective diameter of the cooling pipe is set to be 20mm ~ 50mm (step length 10mm), the water flow rate in the pipe is set to be 60cm/s ~ 120cm/s (step length 20cm/s), and the water temperature in the pipe is set to be 10°C ~ 25°C (step length 5 °C). The above parameters are cross-analyzed for a total of 64 working conditions, and the concrete temperature reduction of 5 °C is defined as the effective influence range of the pipe cooling system. The influence range and influence temperature results of different conditions are shown in
Table 6, and some results are shown in
Figure 12,
Figure 13 and
Figure 14.
Figure 11.
The influence range and temperature change value: (a) Effective diameter (20mm) and water flow rate(60cm/s); (b) Effective diameter (30mm) and water flow rate(80cm/s); (c) Effective diameter (40mm) and water flow rate(100cm/s); (d) Effective diameter (50mm) and water flow rate(120cm/s).
Figure 11.
The influence range and temperature change value: (a) Effective diameter (20mm) and water flow rate(60cm/s); (b) Effective diameter (30mm) and water flow rate(80cm/s); (c) Effective diameter (40mm) and water flow rate(100cm/s); (d) Effective diameter (50mm) and water flow rate(120cm/s).
Table 6 and
Figure 11 show that the effective range of the tube cooling system and the decrease of the concrete temperature increase with the decrease of the water temperature. When the inlet water temperature is 10°C, 15°C, 20°C and 25°C, the effective ranges of different pipe diameters and flow rates are 150cm, 140cm, 120cm and 110cm concrete around the cooling water pipe, respectively. The maximum temperature reduction values are 30.5°C~31.3°C, 27.7°C ~28.4°C, 24.9°C ~25.6°C and 22.2°C~22.7°C, respectively.
Table 6 and
Figure 12 shows that when the water temperature and flow rate in the pipe cooling system are constant, increasing the diameter of the cooling water pipe has little effect on the effective range of reducing the concrete temperature. When the effective diameter is 20mm, 30mm, 40mm and 50mm, the maximum temperature reduction range in the model under different water temperatures and flow rates is 30.5°C~22.2°C, 30.8°C~22.4°C, 31.0°C~22.5°C and 31.1°C~22.6°C, respectively. The effective range is 150 ~ 110mm around the cooling water pipe.
Table 6 and
Figure 13 show that when the water temperature and effective diameter in the pipe cooling system are constant, the temperature reduction value increases slightly when the flow rate increases from 60cm/s to 100cm/s. However, when the water flow rate increases from 100cm/s to 120cm/s, it does not affect the temperature reduction value, and the increase of the cooling water pipe flow rate has little effect on the influence range. When the flow rate is 60cm/s, 80cm/s, 100cm/s and 120cm/s, the maximum temperature reduction range in the model under different water temperatures and flow rates is 30.5°C~22.2°C, 30.8°C~22.4°C, 31.0°C~22.5°C and 31.1°C~22.6°C, respectively. The effective range is 150 ~ 110mm around the cooling water pipe.
4. Conclusion
This paper uses field measurement and numerical methods to study the hydration heat effect of the mass concrete cap and water pipe cooling system. The source of the difference between the measured value and the numerical method result is discussed, and the controlling factors affecting the temperature field of mass concrete pile cap are found out. The influence of concrete parameters and pipe cooling system parameters on the temperature field of mass concrete is analyzed. The following conclusions can be drawn from the study.
The measured maximum adiabatic temperature rise inside the cap is basically consistent with the calculated value of the model, but there is a deviation in the occurrence time. The measured value of the surface temperature of the structure is greatly affected by the ambient temperature, and the temperature difference of the inner surface of the structure is also fluctuating.
When the surface of the concrete structure is naturally cooled, and the pipe cooling system is not arranged, the molding temperature is linearly related to the highest temperature inside the concrete, the highest temperature on the surface and the temperature difference between the inner and outer surfaces of the concrete. For every 1 °C increase in the mold temperature, the internal adiabatic temperature rise, the surface adiabatic temperature rise, and the maximum temperature difference between the inner and outer surfaces are approximately increased by 1 °C, 0.2 °C, and 0.94 °C, respectively.
The surface convection coefficient of the structure and the ambient temperature of the concrete have little effect on the internal adiabatic temperature rise, but have a significant influence on the surface temperature. After the structure enters the cooling stage, the larger the surface convection coefficient, the faster the internal temperature decreases. The smaller the convection coefficient and the larger the ambient temperature, the faster the surface temperature decreases after the structure enters the cooling stage.
The lower the water temperature in the tube cooling system, the more extensive the effective range of the cooling water pipe and the more significant the temperature drop. The cooling water pipe diameter and flow rate have little effect on the effective range and temperature reduction value. The effective range of the pipe cooling system ( concrete temperature reduction value exceeds 5°C ) under the system of pipe diameter ( 20mm~50mm ), flow rate ( 60cm/s~120cm/s ) and water temperature ( 10 °C ~25°C ) is about 1.2~1.5m.
5. Further Development
This paper mainly provides a hydration heat effect and pipe cooling system of mass concrete cap analysis through field measurement and numerical methods. However, the field test of the pipe cooling system needs to be further studied.
Author Contributions
Bo Wang: Conceptualization, Methodology, Formal analysis, Writing original draft. Yifan Song: Supervision, Funding acquisition, Investigation, Software, Writing review & editing.
Data Availability Statement
Some or all data, models, or code that support the findings of this study are available from the corresponding author upon reasonable request.
Conflicts of Interest
The authors declare no conflict of interest.
References
- ACI Committee 207. Mass Concrete for Dams and Other Massive Structures. Journal Proceedings, 1970, 67(4).
- G. De Schutter, L. Taerwe. Specific heat and thermal diffusivity of hardening concrete. Magazine of Concrete Research, 1995, 47(172). [CrossRef]
- Bingjing Liu. Concrete Technology. Beijing: People’s Transportation Publishing House, 1995: 123-125. (In Chinese).
- Code for construction of mass concrete GB5049-2018.China Building Industry Press.2018. (In Chinese).
- T. C. Nguyen, X. B. Luu. Reducing temperature difference in mass concrete by surface insulation. Magazine of Civil Engineering, 2019, 88(4): 70-79.
- F. L. Quivik. Cooling mass concrete: Owyhee, Hoover, and building large dams, Proc. ICE - Eng. History Heritage, 2013, 166(4): 236-247. [CrossRef]
- T. S. Seo, S. S. Kim, C. K. Lim. Experimental study on hydration heat control of mass concrete by vertical pipe cooling method. Journal of Asian Architecture and Building Engineering, 2015, 14(3): 657-662. [CrossRef]
- M. I. Alamayreh, A. Alahmer, M. B. Younes, et al. Pre-Cooling Concrete System in Massive Concrete Production: Energy Analysis and Refrigerant Replacement. Energies, 2022, 15(3): 1129. [CrossRef]
- Y. Qiu, G. Zhang. Stress and damage in concrete induced by pipe cooling at mesoscopic scale. Advances in Mechanical Engineering, 2017, 9(2): 1-17. [CrossRef]
- M. Zeng, C. Guo, Z. Kang, W. Guan, et al. Experimental Study on the Air-Cooling of Concrete Aggregate. Applied Mechanics and Materials. Trans Tech Publications, 2014, 580: 1932-1939. [CrossRef]
- S. Xue, Y. Geng, X. Li, J. et al. Song. Stress Development and Crack Monitoring of Massive Concrete Walls with Embedded Air-cooling Pipes. Journal of Advanced Concrete Technology, 2021, 19(9): 999-1015. [CrossRef]
- L.L.Deppo, C.Dates, V.Fiortto. Optimizing the Choice of Quarries for Large Dam Construction. Journal of Water Power and Dam Construction, 1985.
- Perry Adebar, Zongyu Zhou. Bearing Strength of Compressive Struts Confined by Plain Concrete. ACI structural Journal, 1993.
- Patanker, S.V, Ivanovic. Analysis of Turbulent Flow and Heat Transfer in Internally Finned Tubes and Annuli. ASME. HEAT Transfer, 1979.
- Nikolay Aniskin, Trong Chuc Nguyen, Anh Kiet Bui. The use of ice to cool the concrete mix in the construction of massive structures.E3S Web of Conferences, 2021,264. [CrossRef]
- T. C. Nguyen, X. B. Luu. Reducing temperature difference in mass concrete by surface insulation. Magazine of Civil Engineering, 2019, 88(4): 70-79 [20] T. C. Nguyen,.
- Trong Chuc Nguyen, Van Quang Nguyen, Nikolay Aniskin, et al. Building a nomogram to predict maximum temperature in mass concrete at an early age.E3S Web of Conferences,2021,263. [CrossRef]
- M. I. Alamayreh, A. Alahmer, M. B. Younes, et al. Pre-Cooling Concrete System in Massive Concrete Production: Energy Analysis and Refrigerant Replacement. Energies, 2022, 15(3): 1129. [CrossRef]
- T. P. Huynh, V. L. Tang. Prevention of crack formation in massive concrete at an early age by cooling pipe system. Asian Journal of Civil Engineering, 2019, 20(8): 1101-1107. [CrossRef]
- Yang Joo-Kyoung. Heat Transfer Coefficient in Floe Convention of Pipe-Cooling System in Massive Concrete. Journal of Advanced Concrete Technology, 2011, 9(1):103-114.
- Lawrence AM, Tia M, Fenaro CC, et al. Effect of early age strength on cracking in mass concrete containing different supplementary cementations materials: experimental and finite-element investigation. Journal of Materials in Civil Engineering, 2014, 24(4):362-372.
- Adek Tasri, Anita Susilawati. Effect of material of post-cooling pipes on temperature and thermal stress in mass concrete. Structures, 2019, 20. [CrossRef]
Figure 1.
Pipe cooling system layout: (a) Elevation diagram of tube cooling system; (b) First and third-floor plan of tube cooling system; (c) Second and fourth-floor plan of tube cooling system.
Figure 1.
Pipe cooling system layout: (a) Elevation diagram of tube cooling system; (b) First and third-floor plan of tube cooling system; (c) Second and fourth-floor plan of tube cooling system.
Figure 2.
Numerical model diagram: (a) Overall numerical model of pile cap; (b) The temperature field distribution with pipe cooling system; (c) The temperature field distribution without pipe cooling system.
Figure 2.
Numerical model diagram: (a) Overall numerical model of pile cap; (b) The temperature field distribution with pipe cooling system; (c) The temperature field distribution without pipe cooling system.
Figure 3.
Pile cap temperature measuring point layout diagram: (a) Facade layout; (b) Plane layout.
Figure 3.
Pile cap temperature measuring point layout diagram: (a) Facade layout; (b) Plane layout.
Figure 4.
Temperature rise curves of cap: (a) A# cap; (b) B# cap.
Figure 4.
Temperature rise curves of cap: (a) A# cap; (b) B# cap.
Figure 5.
Internal adiabatic temperature rise under different molding temperatures: (a) Internal adiabatic temperature rise; (b) Maximum internal adiabatic temperature rise.
Figure 5.
Internal adiabatic temperature rise under different molding temperatures: (a) Internal adiabatic temperature rise; (b) Maximum internal adiabatic temperature rise.
Figure 6.
Surface temperature under different molding temperatures: (a) Surface temperature; (b) Maximum Surface temperature.
Figure 6.
Surface temperature under different molding temperatures: (a) Surface temperature; (b) Maximum Surface temperature.
Figure 7.
The internal surface temperature difference at different molding temperatures: (a) The internal surface temperature difference; (b) Maximum internal surface temperature difference.
Figure 7.
The internal surface temperature difference at different molding temperatures: (a) The internal surface temperature difference; (b) Maximum internal surface temperature difference.
Figure 8.
Internal adiabatic temperature rise: (a) Ambient temperature -5 °C; (b) Ambient temperature 0°C; (c) Ambient temperature 5°C; (d) Ambient temperature 10°C; (e) Ambient temperature 15°C; (f) Ambient temperature 20°C; (g) Ambient temperature 25°C; (h) Ambient temperature 30°C.
Figure 8.
Internal adiabatic temperature rise: (a) Ambient temperature -5 °C; (b) Ambient temperature 0°C; (c) Ambient temperature 5°C; (d) Ambient temperature 10°C; (e) Ambient temperature 15°C; (f) Ambient temperature 20°C; (g) Ambient temperature 25°C; (h) Ambient temperature 30°C.
Figure 9.
Surface temperature: (a) Ambient temperature -5 °C; (b) Ambient temperature 0°C; (c) Ambient temperature 5°C; (d) Ambient temperature 10°C; (e) Ambient temperature 15°C; (f) Ambient temperature 20°C; (g) Ambient temperature 25°C; (h) Ambient temperature 30°C.
Figure 9.
Surface temperature: (a) Ambient temperature -5 °C; (b) Ambient temperature 0°C; (c) Ambient temperature 5°C; (d) Ambient temperature 10°C; (e) Ambient temperature 15°C; (f) Ambient temperature 20°C; (g) Ambient temperature 25°C; (h) Ambient temperature 30°C.
Figure 10.
The internal surface temperature difference: (a) Ambient temperature -5 °C; (b) Ambient temperature 0°C; (c) Ambient temperature 5°C; (d) Ambient temperature 10°C; (e) Ambient temperature 15°C; (f) Ambient temperature 20°C; (g) Ambient temperature 25°C; (h) Ambient temperature 30°C.
Figure 10.
The internal surface temperature difference: (a) Ambient temperature -5 °C; (b) Ambient temperature 0°C; (c) Ambient temperature 5°C; (d) Ambient temperature 10°C; (e) Ambient temperature 15°C; (f) Ambient temperature 20°C; (g) Ambient temperature 25°C; (h) Ambient temperature 30°C.
Figure 11.
The Midas FEA analysis model.
Figure 11.
The Midas FEA analysis model.
Figure 12.
The influence range and temperature change value: (a) Water temperature (10℃) and water flow rate(60cm/s); (b) Water temperature (15℃) and water flow rate(80cm/s); (c) Water temperature (20℃) and water flow rate(100cm/s); (d) Water temperature (25℃) and water flow rate(120cm/s).
Figure 12.
The influence range and temperature change value: (a) Water temperature (10℃) and water flow rate(60cm/s); (b) Water temperature (15℃) and water flow rate(80cm/s); (c) Water temperature (20℃) and water flow rate(100cm/s); (d) Water temperature (25℃) and water flow rate(120cm/s).
Figure 13.
The influence range and temperature change value: (a) Water temperature (10℃) and effective diameter (20mm); (b) Water temperature (15℃) and effective diameter (30mm); (c) Water temperature (20℃) and effective diameter (40mm); (d) Water temperature (25℃) and effective diameter (50mm).
Figure 13.
The influence range and temperature change value: (a) Water temperature (10℃) and effective diameter (20mm); (b) Water temperature (15℃) and effective diameter (30mm); (c) Water temperature (20℃) and effective diameter (40mm); (d) Water temperature (25℃) and effective diameter (50mm).
Table 1.
Concrete mix ratio (kg/m3).
Table 1.
Concrete mix ratio (kg/m3).
| Concrete grades |
Cement |
Fly ash |
Sand |
Gravel |
Water |
Water reducer |
| C40 |
240 |
160 |
779 |
1076 |
145 |
4 |
Table 2.
Thermal conductivity of concrete materials.
Table 2.
Thermal conductivity of concrete materials.
| Concrete materials |
Cement |
Sand |
Gravel |
Water |
Fly ash |
| Thermal conductivity () |
2.218 |
3.082 |
2.908 |
0.600 |
0.23 |
Table 3.
Specific heat capacity of concrete materials.
Table 3.
Specific heat capacity of concrete materials.
| Concrete materials |
Cement |
Sand |
Gravel |
Water |
Fly ash |
| Specific heat capacity () |
0.536 |
0.745 |
0.708 |
4.187 |
0.92 |
Table 4.
Hydration heat parameter adjustment coefficient.
Table 4.
Hydration heat parameter adjustment coefficient.
| Parameter |
0 |
10% |
20% |
30% |
40% |
| Fly ash |
1 |
0.96 |
0.95 |
0.93 |
0.82 |
| Slag powder |
1 |
1 |
0.93 |
0.92 |
0.84 |
Table 5.
Analysis scheme.
Table 5.
Analysis scheme.
| Ambient temperature |
-5℃ |
0℃ |
5℃ |
10℃ |
15℃ |
20℃ |
25℃ |
30℃ |
| Surface convection coefficient |
|---|
| 11.79 |
A1 |
B1 |
C1 |
D1 |
E1 |
F1 |
G1 |
H1 |
| 20 |
A2 |
B2 |
C2 |
D2 |
E2 |
F2 |
G2 |
H2 |
| 30 |
A3 |
B3 |
C3 |
D3 |
E3 |
F3 |
G3 |
H3 |
| 40 |
A4 |
B4 |
C4 |
D4 |
E4 |
F4 |
G4 |
H4 |
| 50 |
A5 |
B5 |
C5 |
D5 |
E5 |
F5 |
G5 |
H5 |
| 60 |
A6 |
B6 |
C6 |
D6 |
E6 |
F6 |
G6 |
H6 |
| 76.6 |
A7 |
B7 |
C7 |
D7 |
E7 |
F7 |
G7 |
H7 |
Table 6.
Analysis scheme of the influence of ambient temperature and surface convection coefficient.
Table 6.
Analysis scheme of the influence of ambient temperature and surface convection coefficient.
Effective influence range (cm)/
Temperature reduction value(℃) |
Water temperature(℃) |
| 10 |
15 |
20 |
25 |
| Effective diameter(mm)/ Water flow rate(cm/s) |
20/60 |
150 / 30.5-5.0 |
130 / 27.7-5.4 |
120 / 24.9-5.3 |
110 / 22.2-5.2 |
| 20/80 |
150 / 30.7-5.0 |
130 / 27.9-5.5 |
120 / 25.1-5.4 |
110 / 22.3-5.2 |
| 20/100 |
150 / 30.9-5.0 |
140 / 28.1-5.0 |
120 / 25.2-5.4 |
110 / 22.4-5.2 |
| 20/120 |
150 / 31.0-5.0 |
140 / 28.1-5.0 |
120 / 25.3-5.4 |
110 / 22.5-5.3 |
| 30/60 |
150 / 30.8-5.0 |
140 / 28.0-5.0 |
120 / 25.2-5.4 |
110 / 22.4-5.2 |
| 30/80 |
150 / 31.0-5.0 |
140 / 28.2-5.0 |
120 / 25.3-5.4 |
110 / 22.5-5.3 |
| 30/100 |
150 / 31.1-5.0 |
140 / 28.2-5.0 |
120 / 25.4-5.4 |
110 / 22.6-5.3 |
| 30/120 |
150 / 31.1-5.0 |
140 / 28.3-5.0 |
120 / 25.5-5.5 |
110 / 22.6-5.3 |
| 40/60 |
150 / 31.0-5.0 |
140 / 28.2-5.0 |
120 / 25.4-5.5 |
110 / 22.5-5.3 |
| 40/80 |
150 / 31.1-5.0 |
140 / 28.3-5.0 |
120 / 25.4-5.5 |
110 / 22.6-5.3 |
| 40/100 |
150 / 31.2-5.0 |
140 / 28.3-5.0 |
120 / 25.5-5.5 |
110 / 22.7-5.3 |
| 40/120 |
150 / 31.2-5.0 |
140 / 28.4-5.0 |
120 / 25.5-5.5 |
110 / 22.7-5.3 |
| 50/60 |
150 / 31.1-5.0 |
140 / 28.3-5.0 |
120 / 25.4-5.4 |
110 / 22.6-5.3 |
| 50/80 |
150 / 31.2-5.0 |
140 / 28.4-5.0 |
120 / 25.5-5.5 |
110 / 22.7-5.3 |
| 50/100 |
150 / 31.3-5.0 |
140 / 28.4-5.0 |
120 / 25.6-5.5 |
110 / 22.7-5.3 |
| 50/120 |
150 / 31.3-5.0 |
140 / 28.4-5.0 |
120 / 25.6-5.5 |
22.7-5.3 |
|
Disclaimer/Publisher’s Note: The statements, opinions and data contained in all publications are solely those of the individual author(s) and contributor(s) and not of MDPI and/or the editor(s). MDPI and/or the editor(s) disclaim responsibility for any injury to people or property resulting from any ideas, methods, instructions or products referred to in the content. |
© 2024 by the authors. Licensee MDPI, Basel, Switzerland. This article is an open access article distributed under the terms and conditions of the Creative Commons Attribution (CC BY) license (http://creativecommons.org/licenses/by/4.0/).
