Preprint
Article

Bioinformatic Identification of Differentially Expressed Genes for Chimeric Antigen Receptor T-cell Therapy in Uterine Leiomyosarcoma

Altmetrics

Downloads

263

Views

330

Comments

0

Submitted:

04 July 2024

Posted:

09 July 2024

You are already at the latest version

Alerts
Abstract
Uterine leiomyosarcoma (LMS) is a rare and aggressive form of uterine cancer, with a poor prognosis and high number of uterine cancer-related deaths. Chimeric Antigen Receptor (CAR) T-cell therapy is an immunotherapy approach to antigen specific of cancer cell, thereby enhancing the immune system's ability to target and destroy cancer cells. This study aims to investigate the potential of targeting differentially expressed genes (DEGs) as a novel therapeutic strategy using CAR T-cell technology in LMS. Genome datasets were obtained from NCBI-GEO database, Of the five datasets, genes that experienced significant overexpression in at least three datasets were categorized as DEGs, and DEGs were evaluated for protein localization, Gene Ontology, bioactivity, interaction, and overexpression. The results identified 25 DEGs, with ten of them expressed on the plasma membrane; four of them—HMMR, KIF20A, PRC1, and ZWINT—were part of the main protein network derived from the 25 DEGs. The dominant bioactivity of these PMGs involves influencing the cell cycle, particularly processes related to chromosome segregation. In conclusion, HMMR, KIF20A, PRC1, and ZWINT are high-potential DEGs as candidates for tumor-associated antigen CAR T-cell therapy. Further research, both in vitro and in vivo, is needed to enhance the validity of these findings.
Keywords: 
Subject: Medicine and Pharmacology  -   Obstetrics and Gynaecology

1. Introduction

Leiomyosarcoma (LMS) is an uncommon and highly malignant tumor originating from smooth muscle cells, predominantly affecting the uterus but also found in other anatomical locations such as the gastrointestinal tract, retroperitoneum, and vascular tissues [1]. LMS is characterized by its aggressive clinical behavior, high recurrence rate, and poor prognosis, largely due to its resistance to conventional therapies and its tendency to metastasize [2]. The current therapeutic approaches for LMS, including surgery, radiotherapy, and chemotherapy, often yield suboptimal outcomes, necessitating the exploration of novel and more effective treatment strategies. In the advanced stages, LMS could be potentially treated by novel chemotherapy combinations, targeting DNA damage, aberrant metabolism, and immunotherapeutic strategies [3,4,5,6].
In recent years, immunotherapy has emerged as a groundbreaking approach in cancer treatment, with Chimeric Antigen Receptor (CAR) T-cell therapy being at the forefront [7]. CAR T-cell therapy involves the genetic modification of T cells to express CARs, which are engineered receptors that enable T cells to specifically recognize and attack cancer cells [8]. This therapeutic modality has shown remarkable success in treating hematological malignancies, but its application in solid tumors, such as LMS, remains challenging due to the tumor microenvironment and the identification of suitable target antigens [9].
This study focuses on the identification of differentially expressed genes (DEGs) in LMS as potential targets for CAR T-cell therapy. Utilizing high-throughput genomic data from the NCBI-GEO database, we conducted a comprehensive analysis of gene expression profiles in LMS and normal uterine smooth muscle cells. Our aim was to identify DEGs that are significantly overexpressed in LMS and to evaluate their potential as target antigens for CAR T-cell therapy.

2. Results

2.1. Topology of the GSE Samples Used

Based on the exploration of the GEO database, five datasets that met the inclusion criteria were identified (Table 1). Five inclusion criteria were used in this study: the database had to be analyzable with the GEO2R platform, contain both cancer cell type samples and normal cell type samples within the same database, have at least three samples for each type of sample, and be a human gene array. Among the five databases, leiomyosarcoma was identified as the cancer cell type, with uterine smooth muscle cells used as the normal cell type. The platforms utilized included experiment type profiling by array on GPL6480, GPL571, GPL7363, and GPL80, and experiment type profiling by high throughput sequencing on GPL24676.
Furthermore, the number of significantly expressed genes in each dataset was as follows: GSE205596 had 4073 genes, GSE68295 had 204 genes, GSE64763 had 380 genes, GSE36610 had 74 genes, and GSE9511 had 22 genes. The number of significantly expressed genes was influenced by the platform used when the samples were submitted to the GEO database, with Illumina NovaSeq6000 being a more recent sequencing technology offering better detection capacity compared to the earlier-produced HuGeneFL array. Moreover, the NovaSeq6000 platform offered several advantages for various research applications. One key advantage was its high throughput capabilities, allowing for the sequencing of a large number of samples per run with deep coverage, making it a valuable tool for projects that demand scalability and cost-effectiveness [15]. This feature was particularly beneficial in studies requiring the analysis of vast amounts of genetic data, such as whole-exome sequencing. Whole-exome sequencing and targeted gene panels have facilitated the discovery of new disease-associated genes and potential therapeutic targets. Thus, this platform, with its high accuracy and sensitivity in detecting genetic variants, made it a valuable tool for uncovering new insights into the genetic basis of complex diseases [16,17,18].
We recognize that the use of different sequencing platforms may yield diverse results. However, in this study, we intended to explore this diversity due to the limited availability of data. By spanning sequencing data from 2008 to 2023, we aimed to uncover novel and potential gene markers that have emerged over time.
Next, the topology of each dataset is presented in Figure 1, which includes volcano plots and mean plots of significantly expressed genes, normalization plots, and UMAP plots for each sample in the datasets. Based on this figure, GSE205596 appeared to have many blue and red nodes in its volcano and mean plots, representing 4073 significantly expressed genes. GSE68295 and GSE64763 had fewer blue and red points compared to GSE205596 but still significantly more than the blue and red points in GSE36610 and GSE9511.
Based on the distribution of sample nodes in the UMAP plot, four datasets exhibited a polarized distribution between normal cell samples and cancer cell samples, except for GSE36610. In GSE36610, the nodes representing normal cell samples were located in the center and surrounded by cancer cell nodes, with no apparent gradient. In contrast, clear clustering was observed in the UMAP plot of GSE205596, where the nodes of normal cell samples and cancer cell samples formed distinct clusters that were widely separated. This indicated a significant difference between the two clusters. In the remaining three datasets, there was a gradient that formed a distinguishing boundary between normal cell samples and cancer cell samples (Figure 1).

2.2. Identification of DEGs and Their Discovery in Cancer Cases

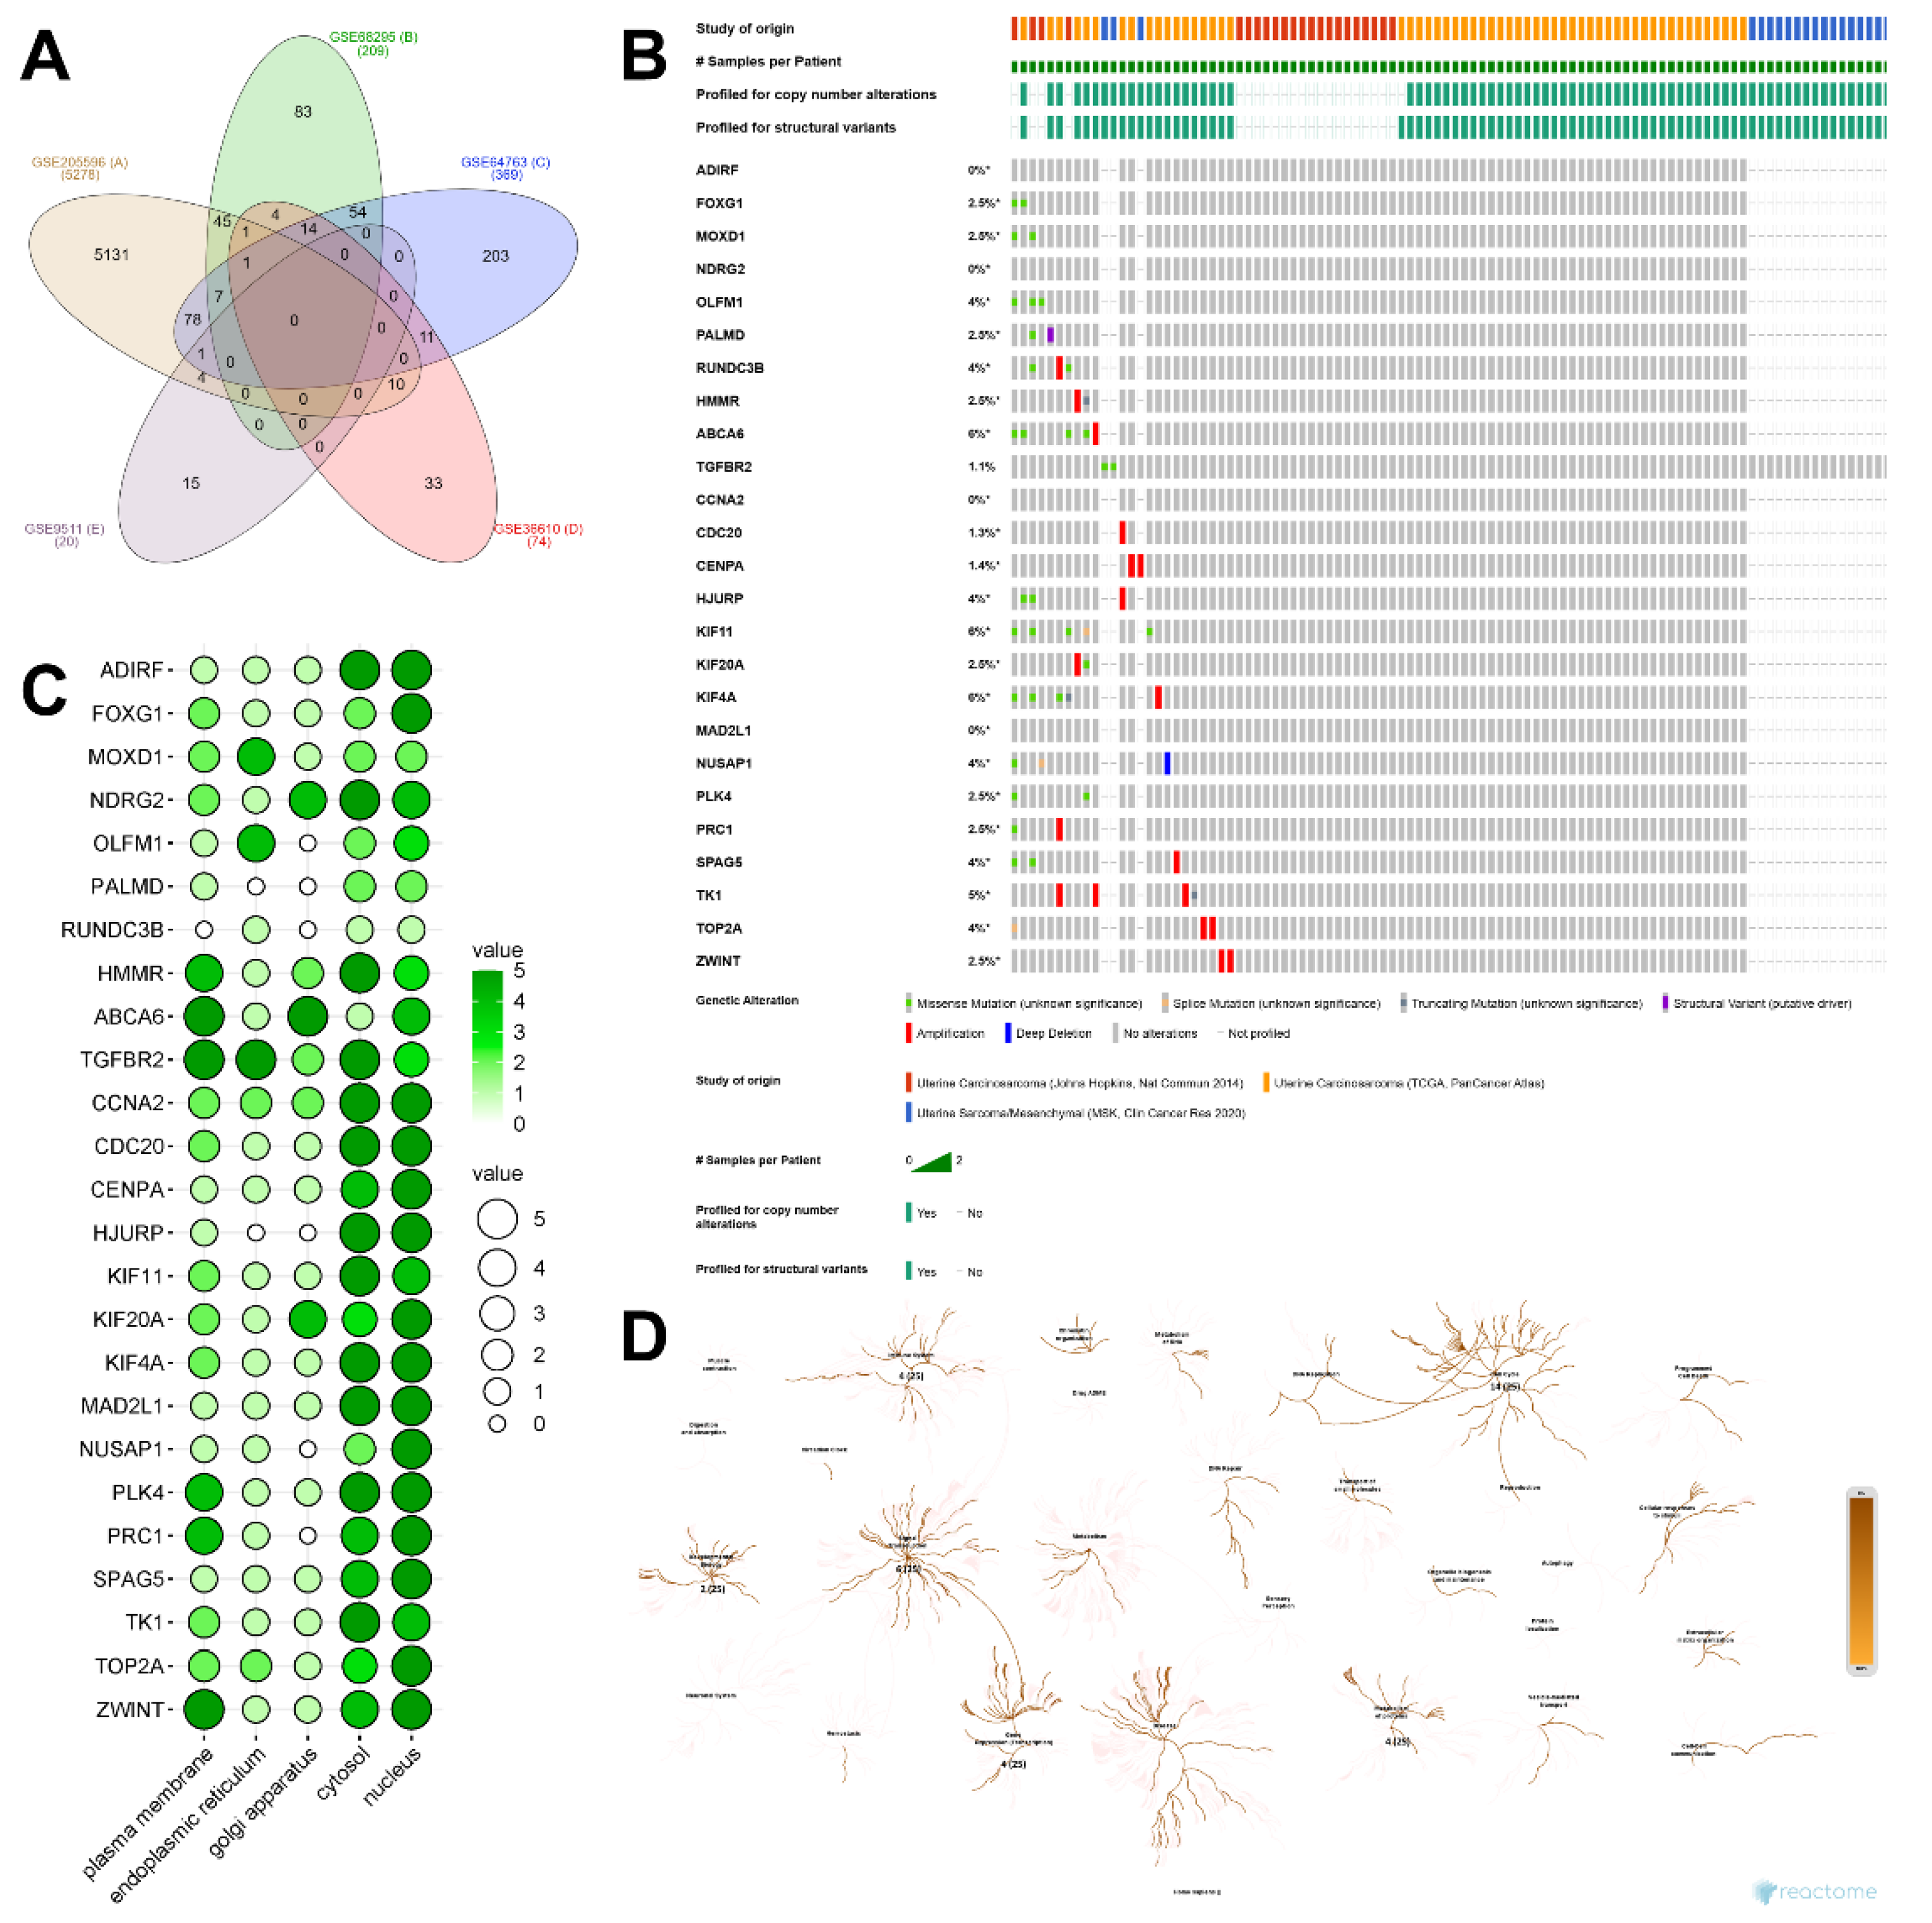
Based on the number of significant genes obtained from each dataset, unique genes from each dataset and significant overlapping genes from at least three datasets were evaluated. The significant overlapping genes in this study are referred to as DEGs. According to the constructed Venn diagram, there are 25 DEGs, namely ABCA6, ADIRF, CCNA2, CDC20, CENPA, FOXG1, HJURP, HMMR, KIF4A, KIF11, KIF20A, MAD2L1, MOXD1, NDRG2, NUSAP1, OLFM1, PALMD, PLK4, PRC1, RUNDC3B, SPAG5, TGFBR2, TK1, TOP2A, and ZWINT. (Figure 2A).
We evaluated the types of mutations and protein localization of DEGs in Figure 2B-C. It was found that missense mutations and amplifications were the most common types of mutations found in the sample dataset, occurring in 15 and 13 DEGs, respectively. The protein localization results indicated that most DEGs were located in the cytosol and nucleus, with some also found in the Golgi apparatus, reticulum endoplasmic (RE), and plasma membrane. Proteins located in the Golgi lumen and ER membrane have the potential to localize to the plasma membrane through various mechanisms, these proteins included MOXD1, NDRG2, OLFM1, KIF20A, HMMR, ABCA6, TGFBR2, PLK4, PRC1, and ZWINT. Therefore, in this study, they were grouped together with proteins localized in the plasma membrane. Proteins located in the plasma membrane can serve as ideal targets or markers for CAR-T cell therapy. Based on their biological processes, 14 DEGs were involved in the cell cycle, 6 DEGs were involved in signal transduction, and the remainder were part of various cellular mechanisms (Figure 2D).

2.3. GeneOntology of DEGs and their Related Biological Process

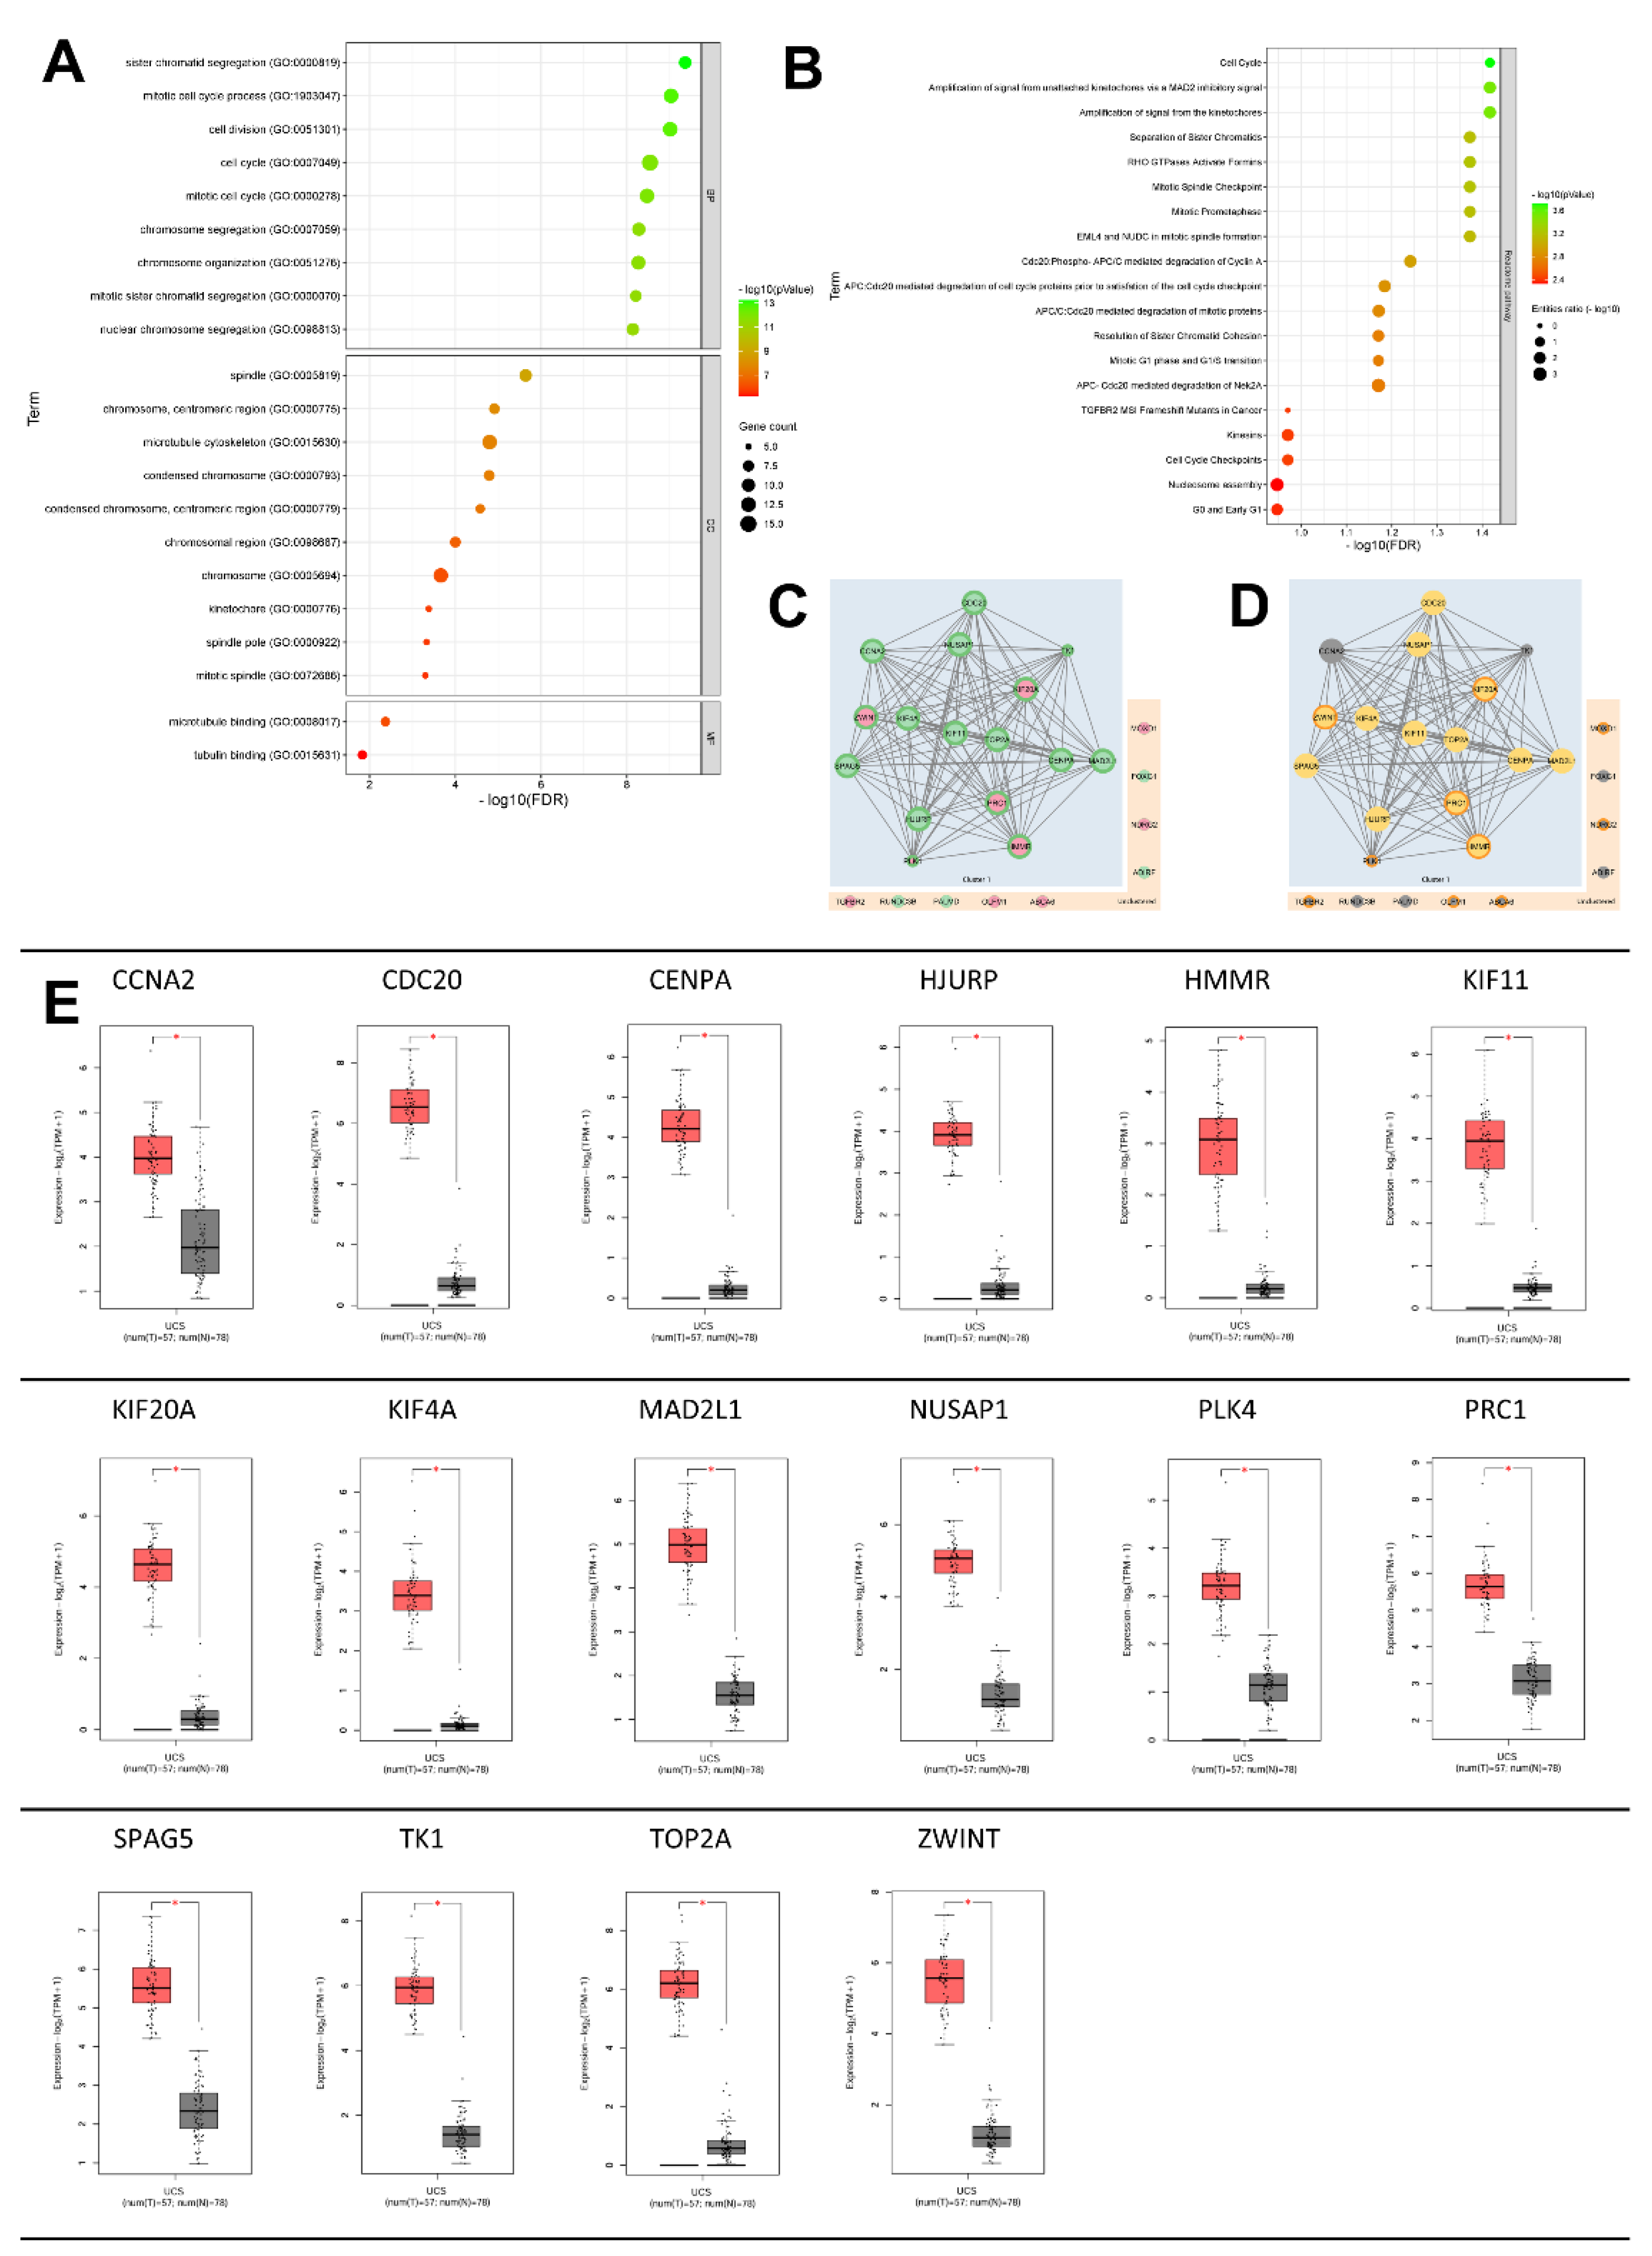
Based on the Gene Ontology enrichment results of the 25 DEGs, the top biological processes (BP) with an FDR value < 0.05 were related to cell cycle, cell division, and chromosome segregation. The Gene Ontology cellular component (CC) analysis also indicated that the cellular components influenced by the 25 DEGs were those involved in cell mitosis, including the spindle (GO:0005819); chromosome, centromeric region (GO:0000775); microtubule cytoskeleton (GO:0015630); condensed chromosome (GO:0000793); condensed chromosome, centromeric region (GO:0000779); chromosomal region (GO:0098687); chromosome (GO:0005694); kinetochore (GO:0000776); spindle pole (GO:0000922); and mitotic spindle (GO:0072686). According to the Gene Ontology molecular function (MF) analysis, there were only two bioprocesses, namely microtubule binding (GO:0008017) and tubulin binding (GO:0015631) (Figure 3A).
Next, as explained in Figure 2D, the top 25 pathways from the REACTOME database further supported the biological processes of the 25 DEGs identified through Gene Ontology. According to the REACTOME database, the highest-ranked biological pathways included cell cycle pathways and mechanisms related to the cell cycle (Figure 3B).
We constructed a protein network to evaluate the interactions among proteins in the DEGs. The results showed that 14 proteins had the highest betweenness centrality (BC) scores, while the other 11 proteins had a BC score of 0. Based on these results, a primary network consisting of the 14 proteins and two proteins with the lowest BC scores, TK1 and PLK4, was formed, creating one cluster (Figure 3C-D, Table 2). Focusing on ten proteins localized in the plasma membrane, referred to as plasma membrane-related genes (PMG), HMMR, KIF20A, PRC1, and ZWINT were present in the main network, while the remaining five did not form interactions.
We evaluated the primary network (Cluster 1) concerning key bioactivities, and the results indicated that 13 DEGs in the main network were involved in bioactivities related to the mitotic spindle checkpoint and mitotic sister chromatid segregation, with 12 of these DEGs also involved in amplification of signal from the kinetochores and the condensin complex. Based on these results, the four PMGs played roles in the two aforementioned bioactivities, with two PMGs, HMMR and PRC1, involved in all induced bioactivities within the main network, while ZWINT and KIF20A were involved in some of the bioactivities (Table 3).
Next, we further analyzed the expression of 25 DEGs in Leiomyosarcoma samples from the GEPIA database to determine whether there was significant overexpression or downregulation compared to normal uterine samples. The results showed that 16 DEGs were significantly overexpressed in UCS samples, one DEG was not significant, and 8 DEGs were significantly downregulated. This evaluation is crucial for determining which DEGs will be targeted for CAR T-cell therapy, as overexpression is an important condition that enhances the ease of targeting tumor cells. Among the PMGs, five (KIF20A, HMMR, PLK4, PRC1, and ZWINT) were significantly overexpressed, while four others were significantly downregulated. (Figure 3E)

2.4. Mechanisms of Several DEGs Related to Cell Cycle Based on the MetaCore Database

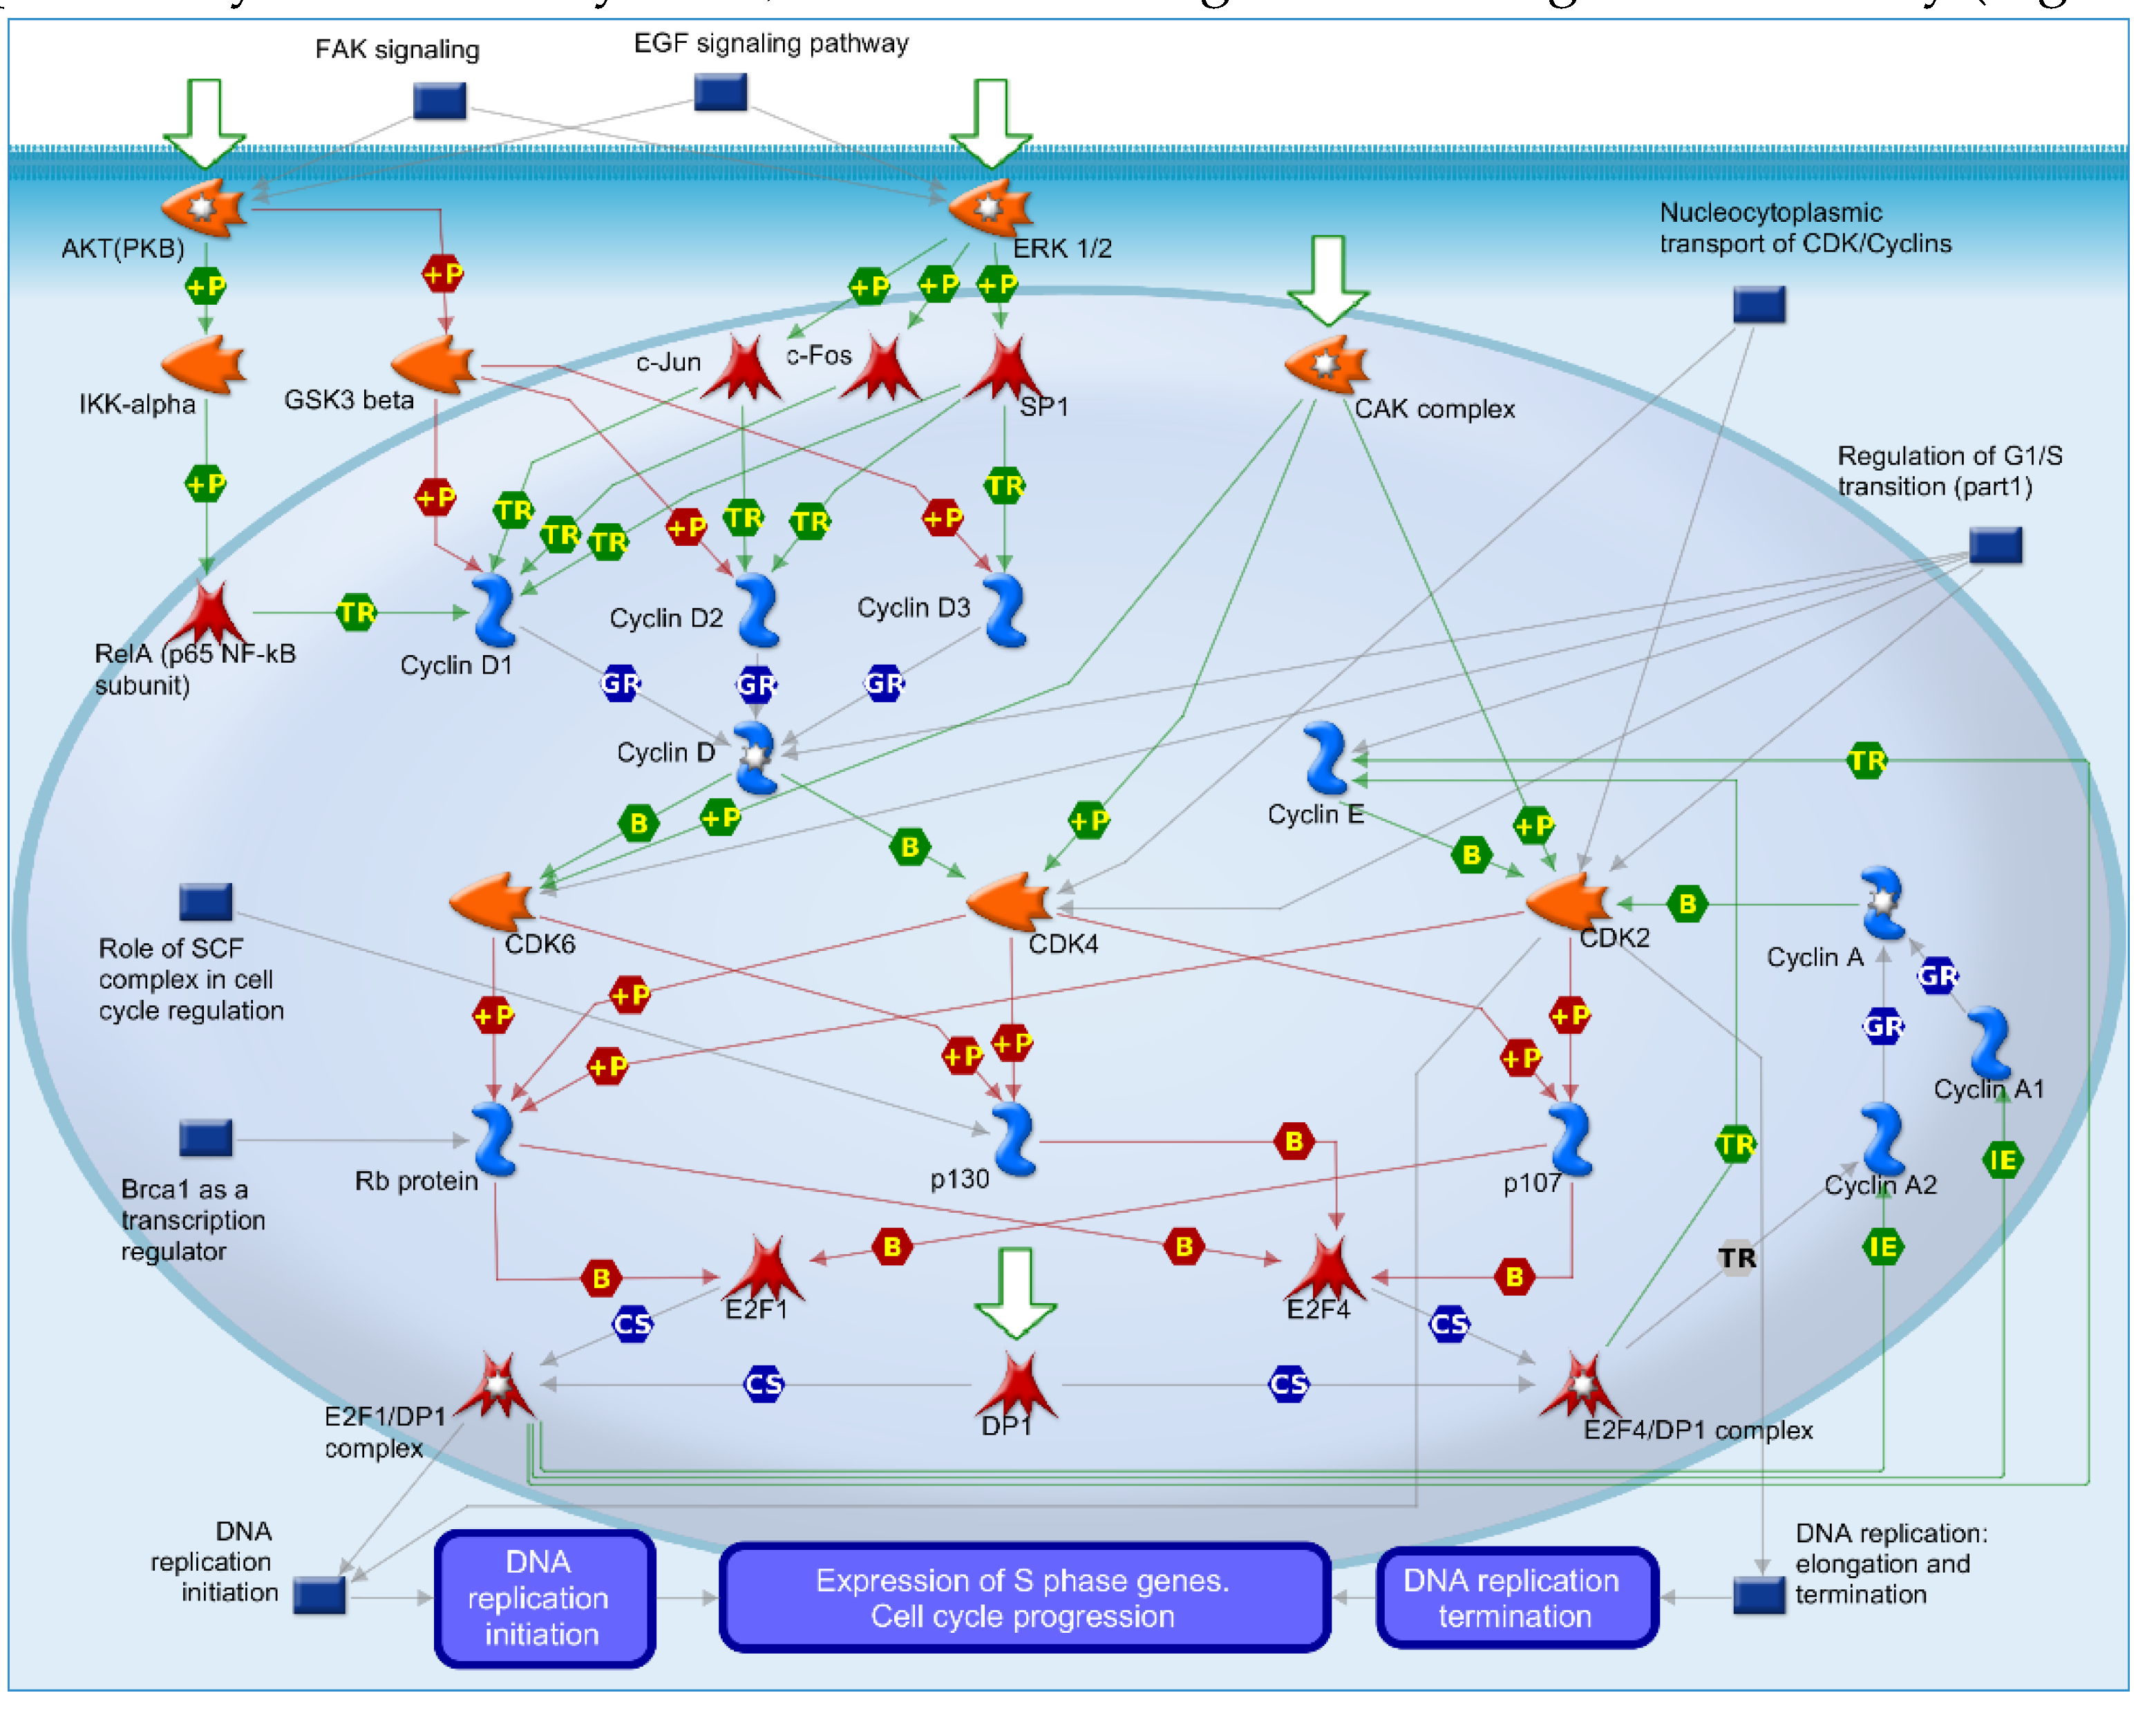
Next, we investigated the molecular mechanisms of several differentially expressed genes (DEGs) that were significantly overexpressed and available in the MetaCore database. These genes include CCNA2, CDC20, CENPA, MAD2L, ZWINT, KIF11, and TK1, and they play a role in the cell cycle. CCNA2 encodes the protein cyclin A2, which combines with cyclin A1 to form cyclin A. Cyclin A binds with CDK2, leading to the phosphorylation of Rb protein and p107, allowing them to bind with the transcription factor E2F1. E2F1 then forms the E2F1/DP1 protein complex, initiating DNA replication, S phase gene expression, and cell cycle progression. Additionally, Rb protein and p107 can bind with transcription factor E2F4 to form the E2F4/DP1 protein complex, which regulates the transcription of cyclin A2 and cyclin E, thus maintaining or enhancing CDK2 activity (Figure 4).
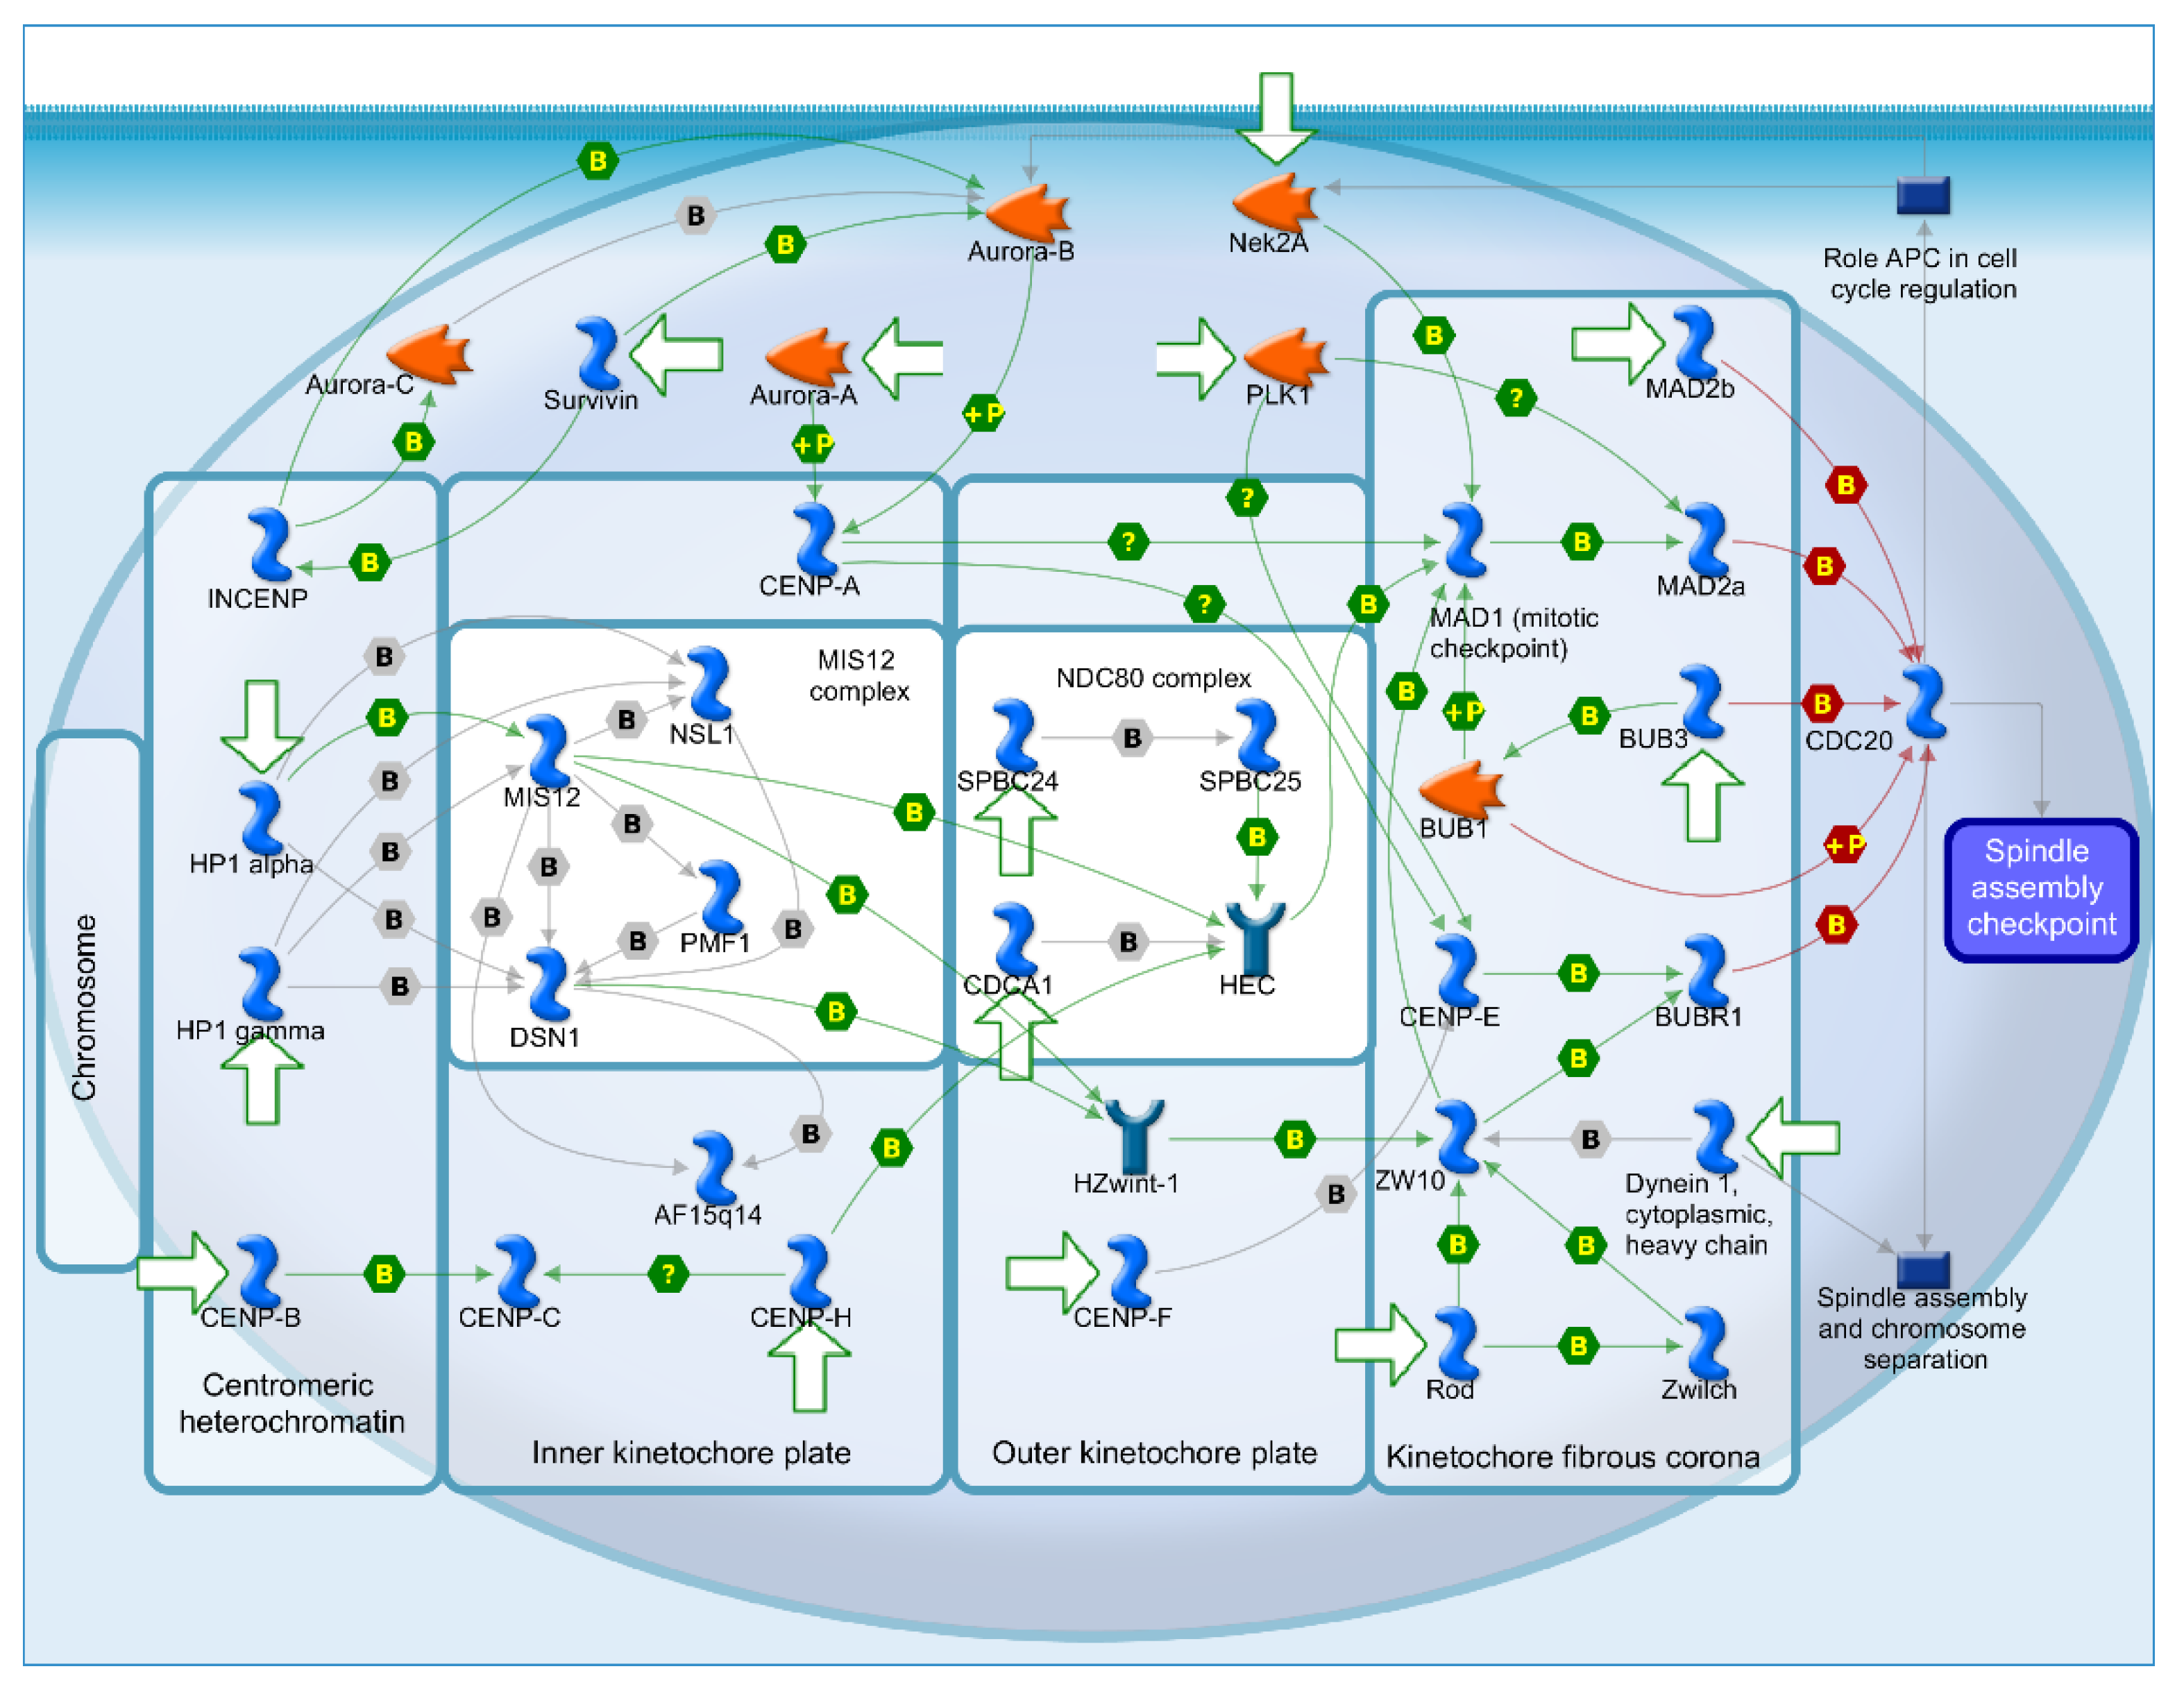
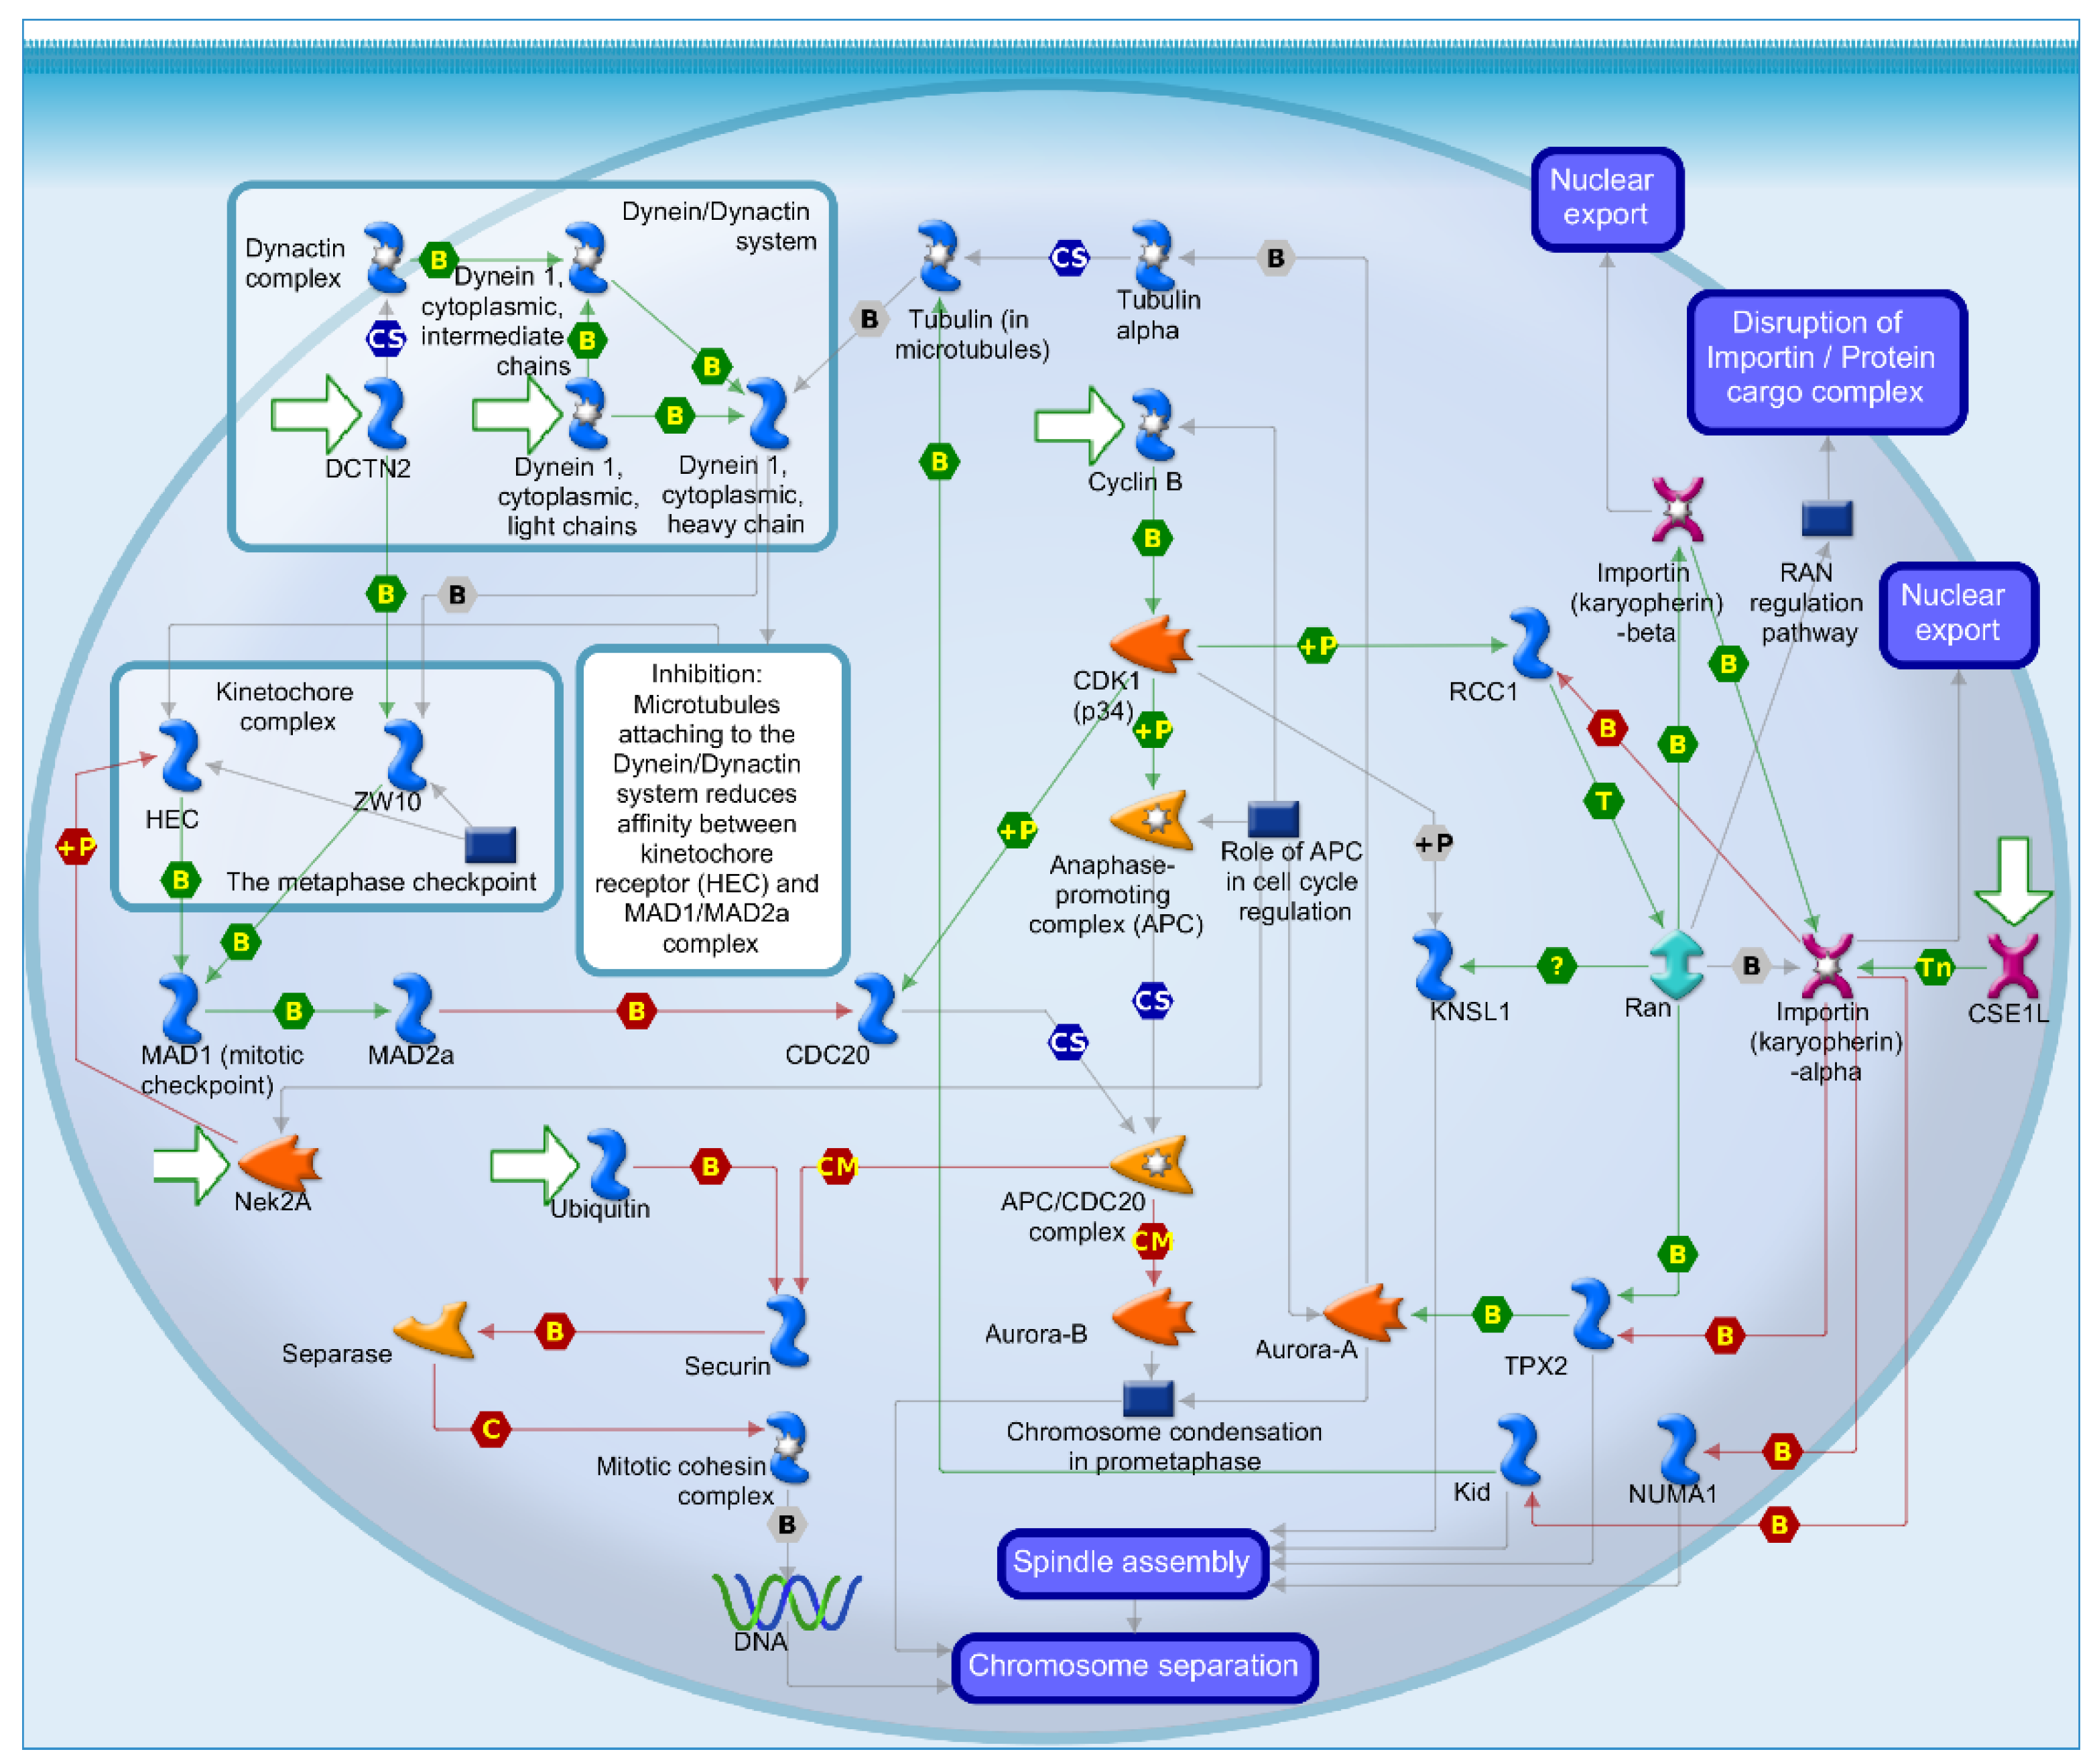
Furthermore, four DEGs—CDC20, CENPA, MAD2L, and ZWINT—are known to transcribe proteins involved in spindle assembly checkpoint bioactivity. These pathways often begin with centromere proteins (CENP) on chromosomes binding to form a complex at the inner and outer kinetochore plates. Specifically, centromere protein A (CENPA) is phosphorylated by Aurora-A and interacts with MAD1 or CENPE through an unknown mechanism. MAD1 then binds with MAD2a and CDC20. ZWINT (ZW10 interacting kinetochore protein) binds with BUBR1 or MAD1 after interacting with Rod, Zwilch, Dynein1, or the HZwint-1 receptor. The presence of these DEG-related proteins indicates their role in this bioactivity, despite the limited detailed molecular mechanism information for each protein (Figure 5). Additionally, KIF11 (Kinesin Family member 11) encodes the protein KNSL1, which also plays a role in spindle assembly bioactivity through an unknown mechanism. KNSL1 can be directly phosphorylated by CDK1 (p34) or induced by the small GTPase Ran, activated by RCC1 phosphorylated by CDK1 (Figure 6).
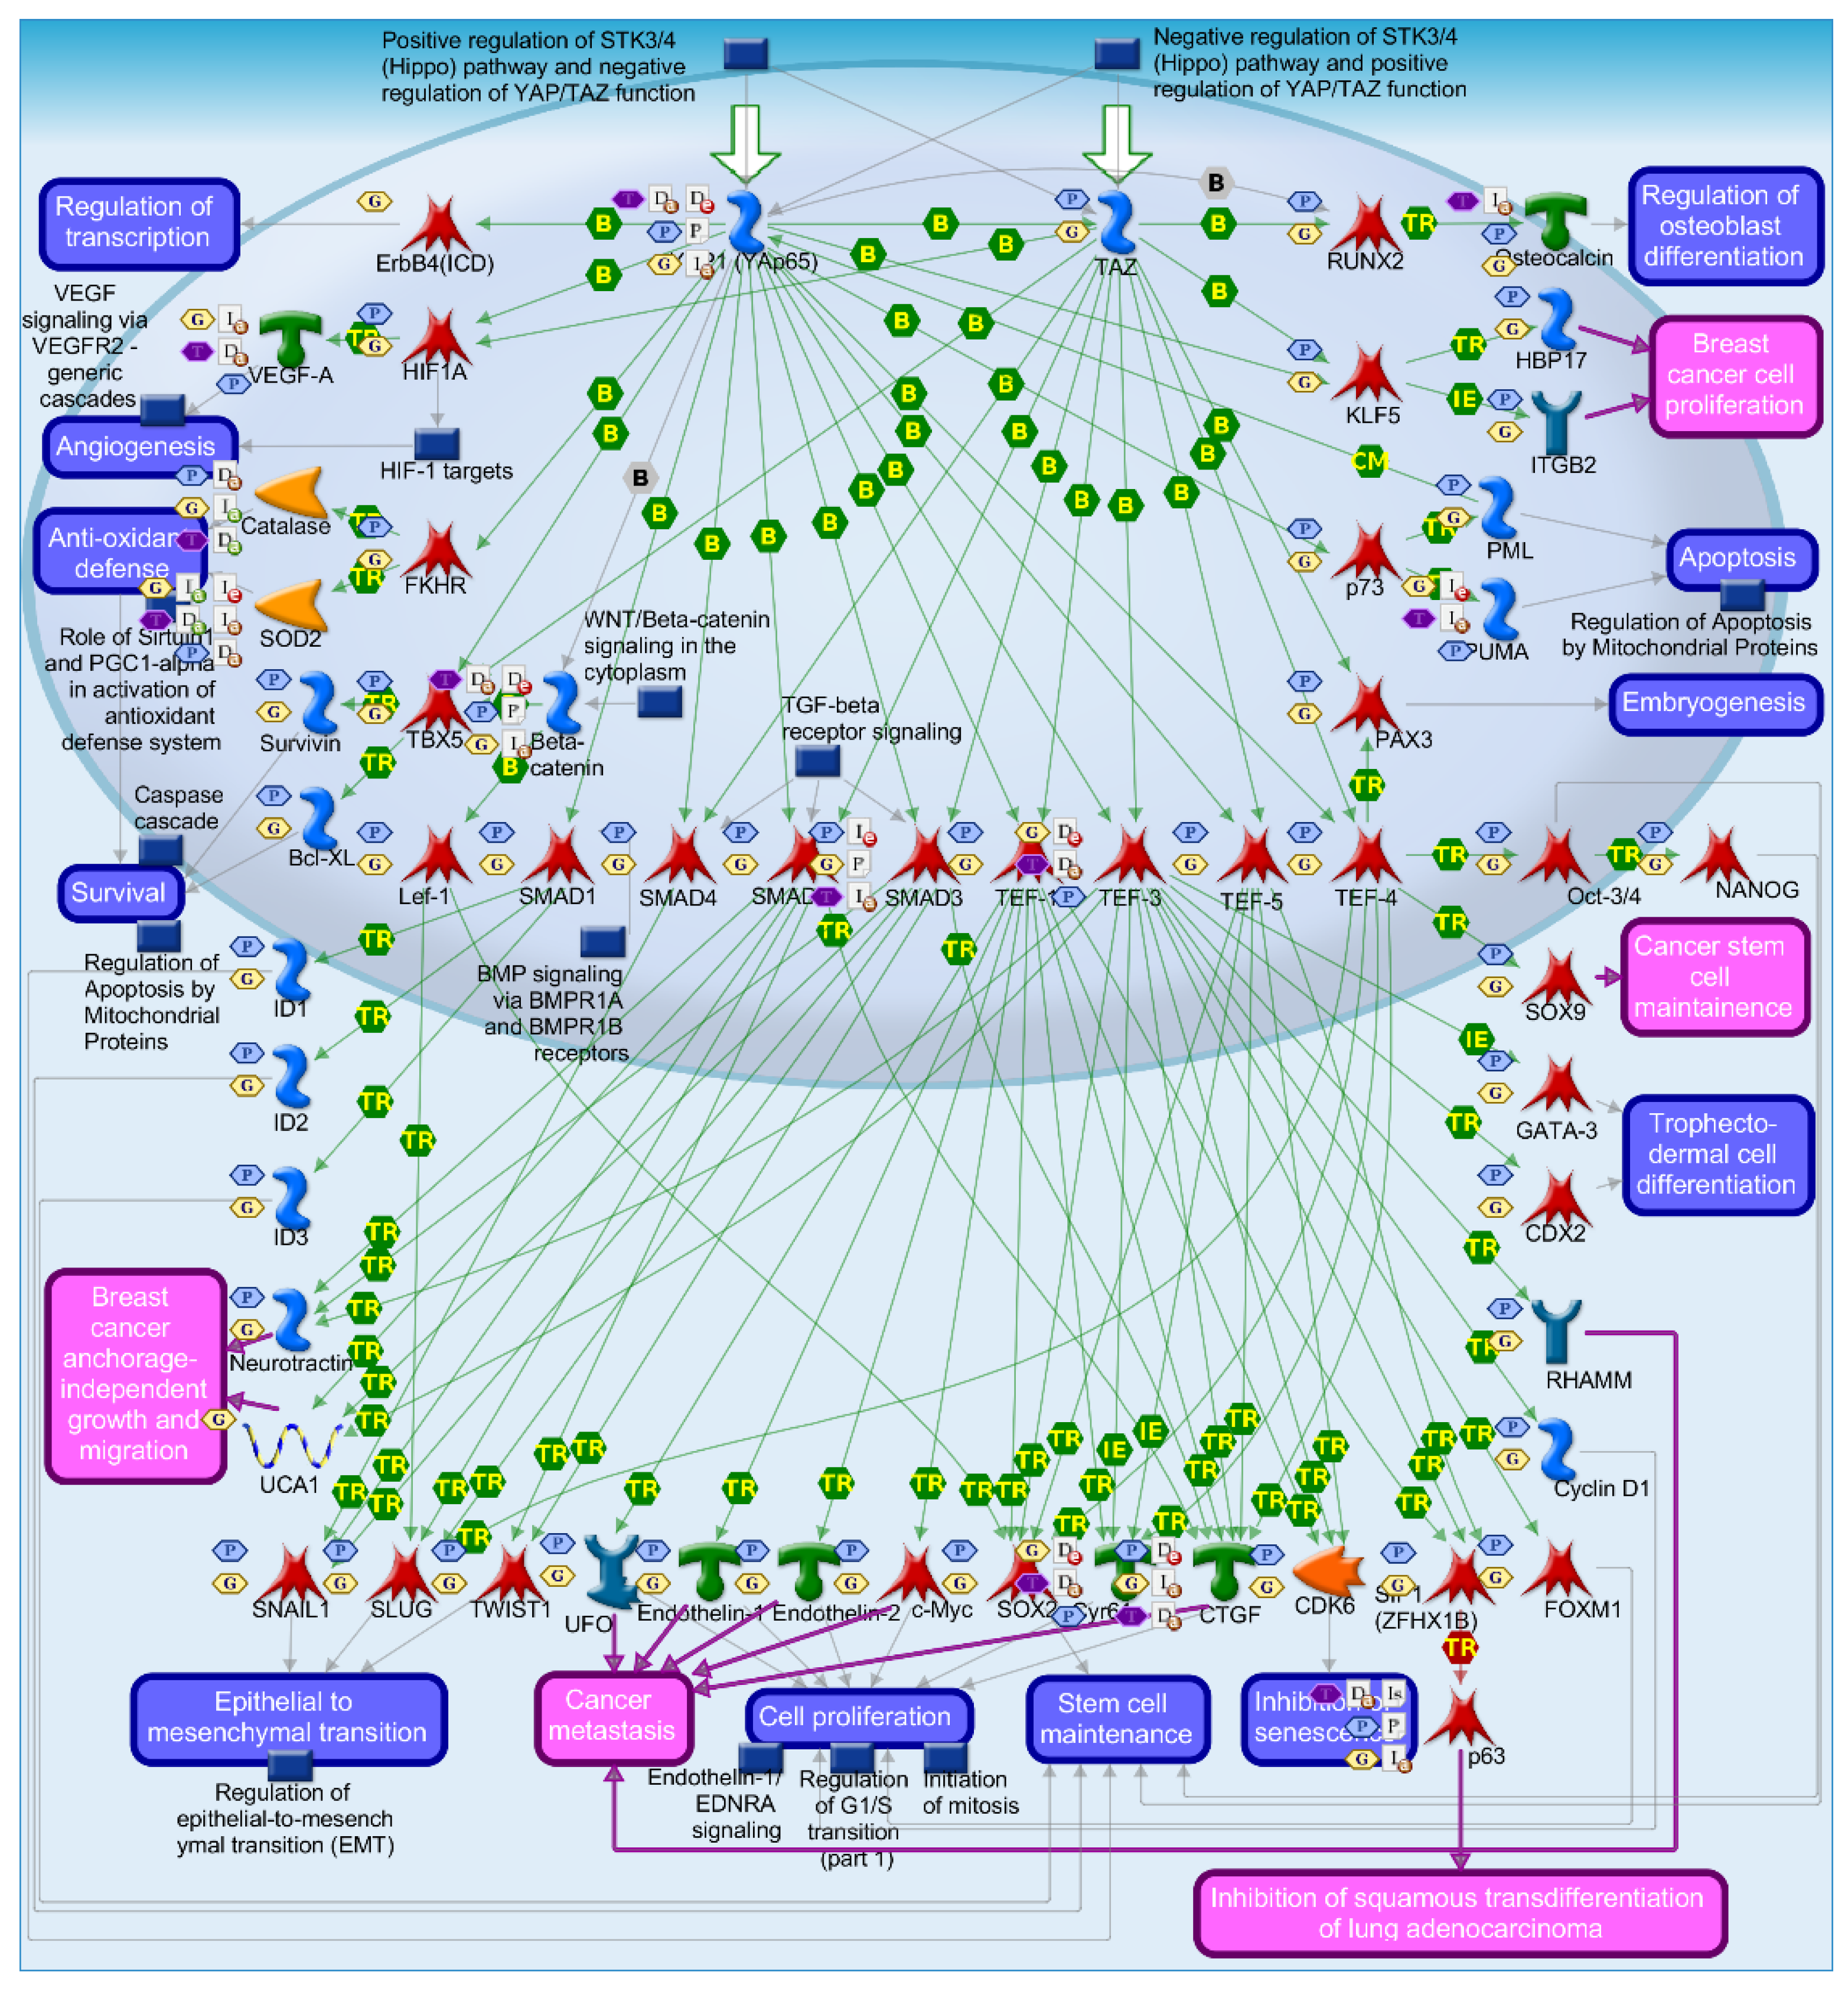
Several proteins encoded by DEGs are also known to play roles in apoptosis or cancer pathways. First, HMMR (Hyaluronan Mediated Motility Receptor) encodes the protein RHAMM (Receptor for Hyaluronan-Mediated Motility). RHAMM's transcriptional regulator is TEF3, with RHAMM bioactivity known to occur in metastatic cancers (Figure 7).
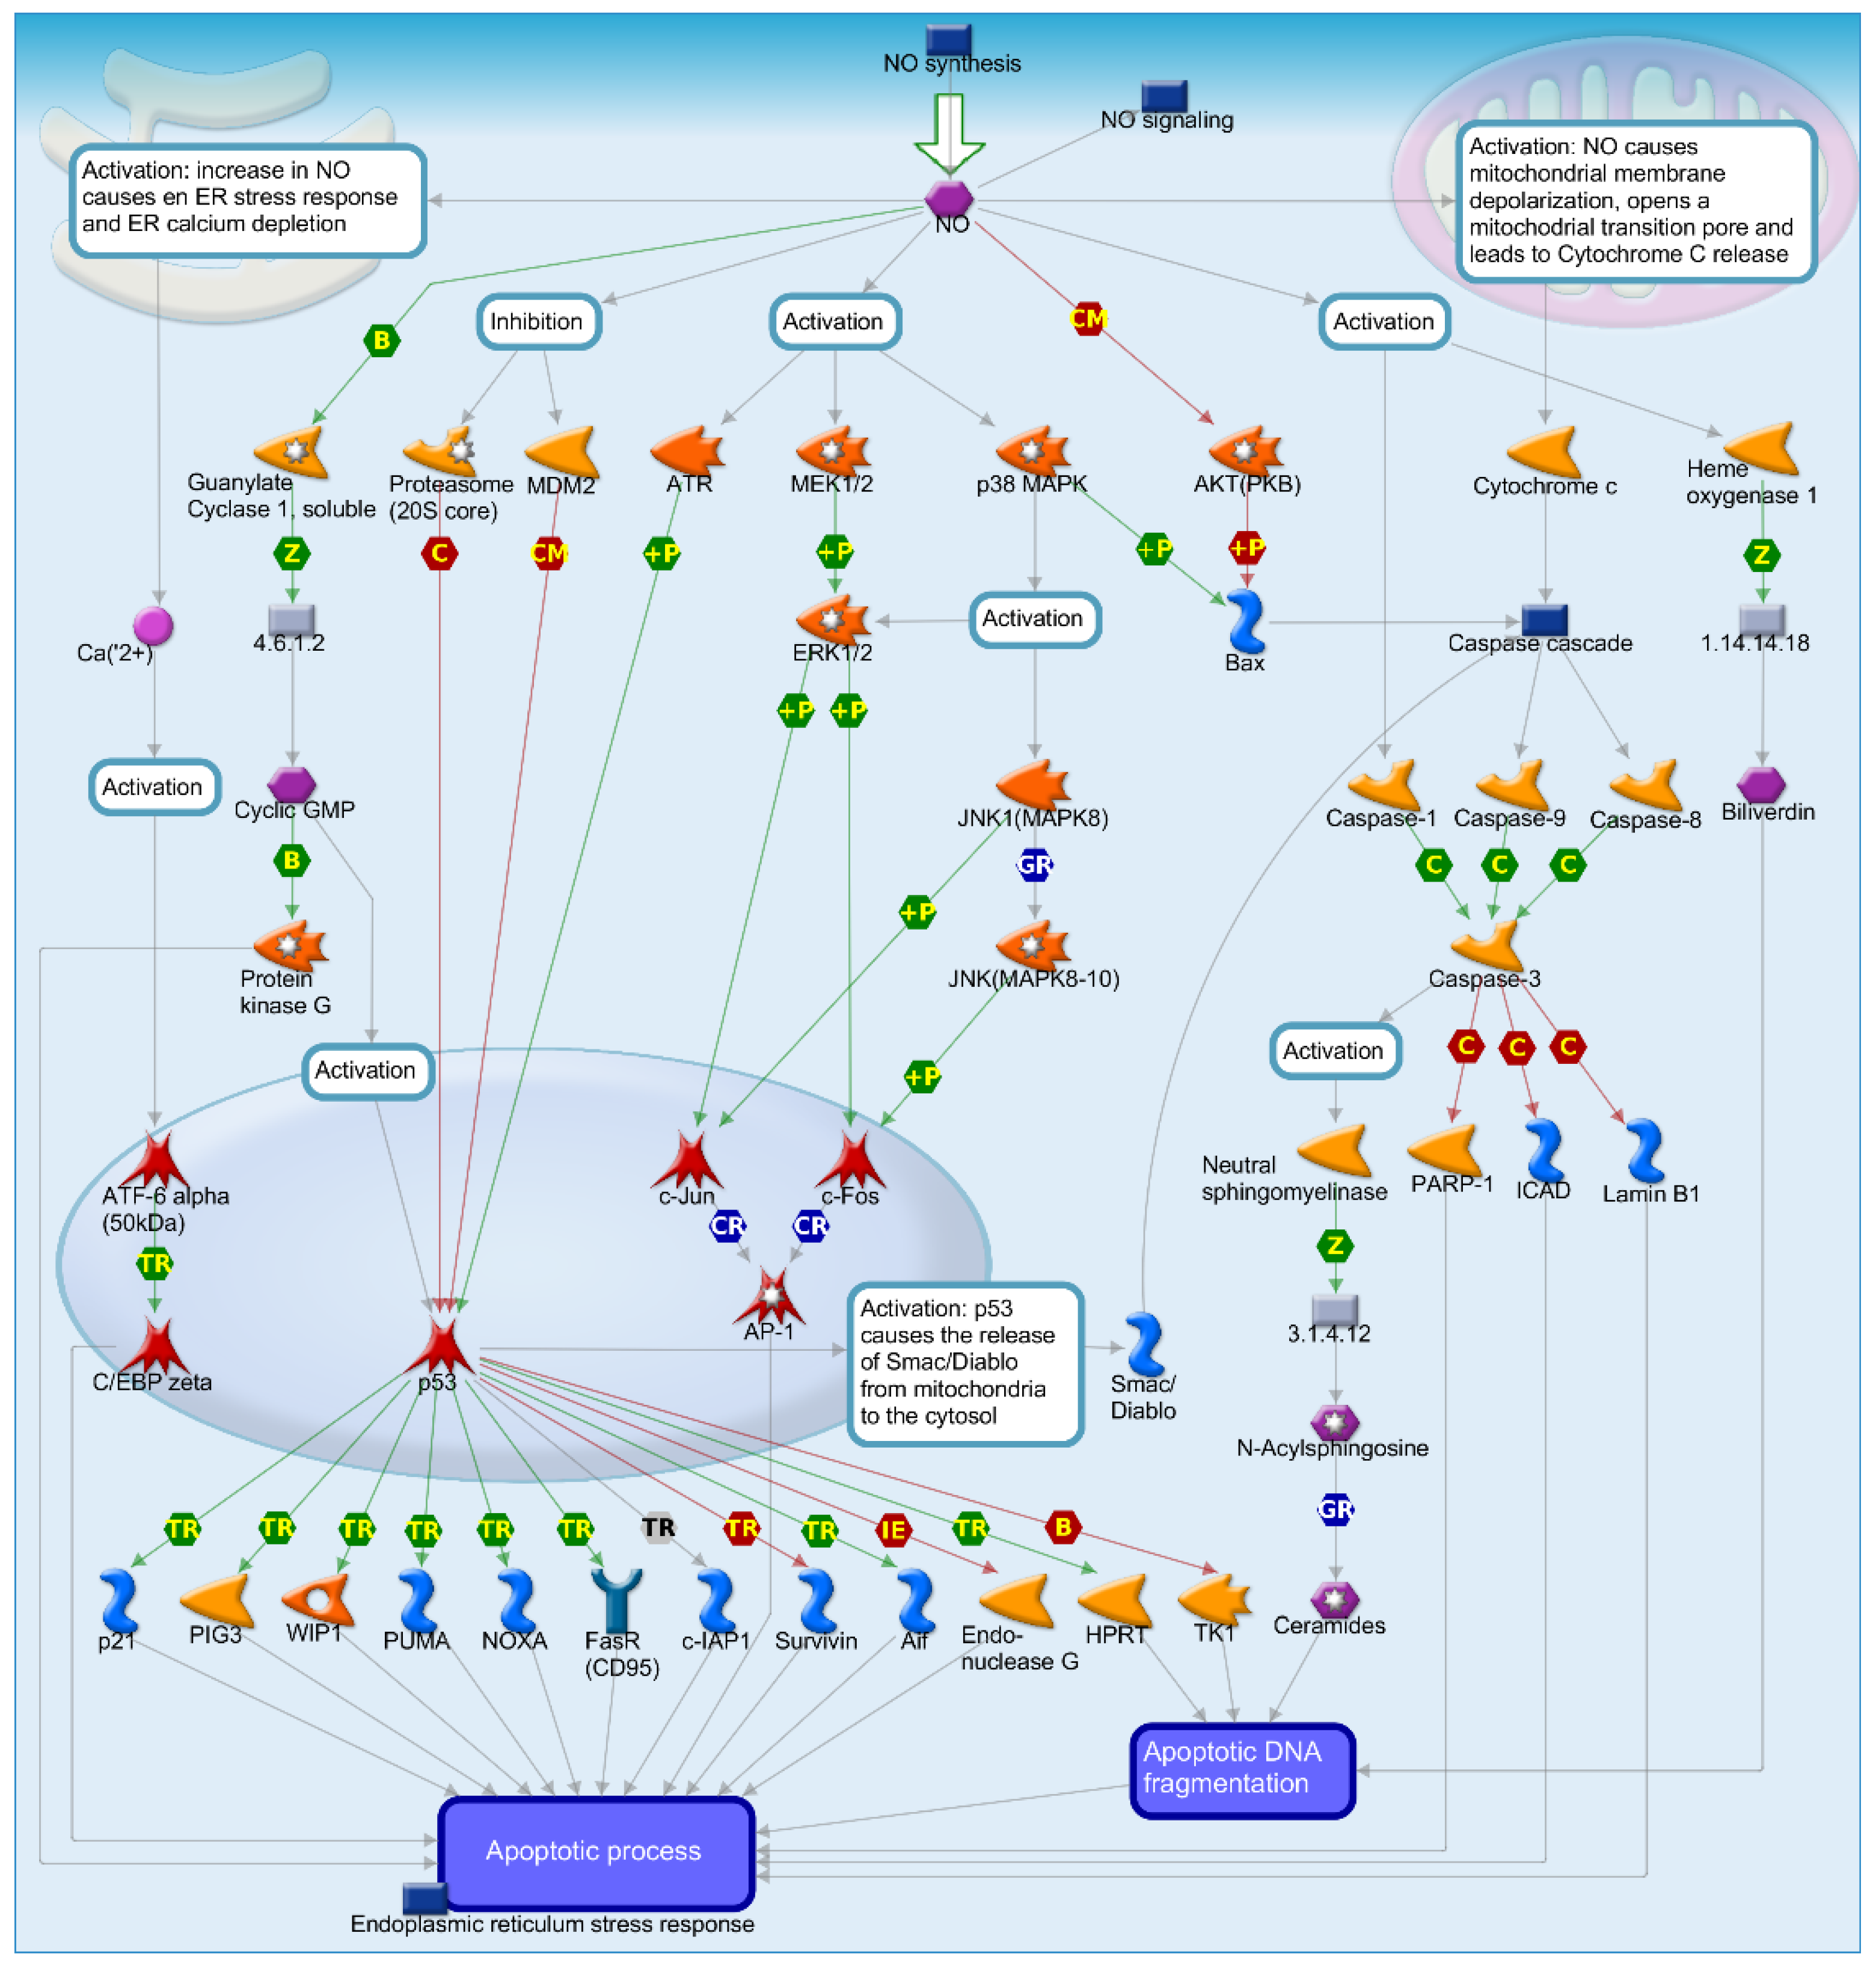
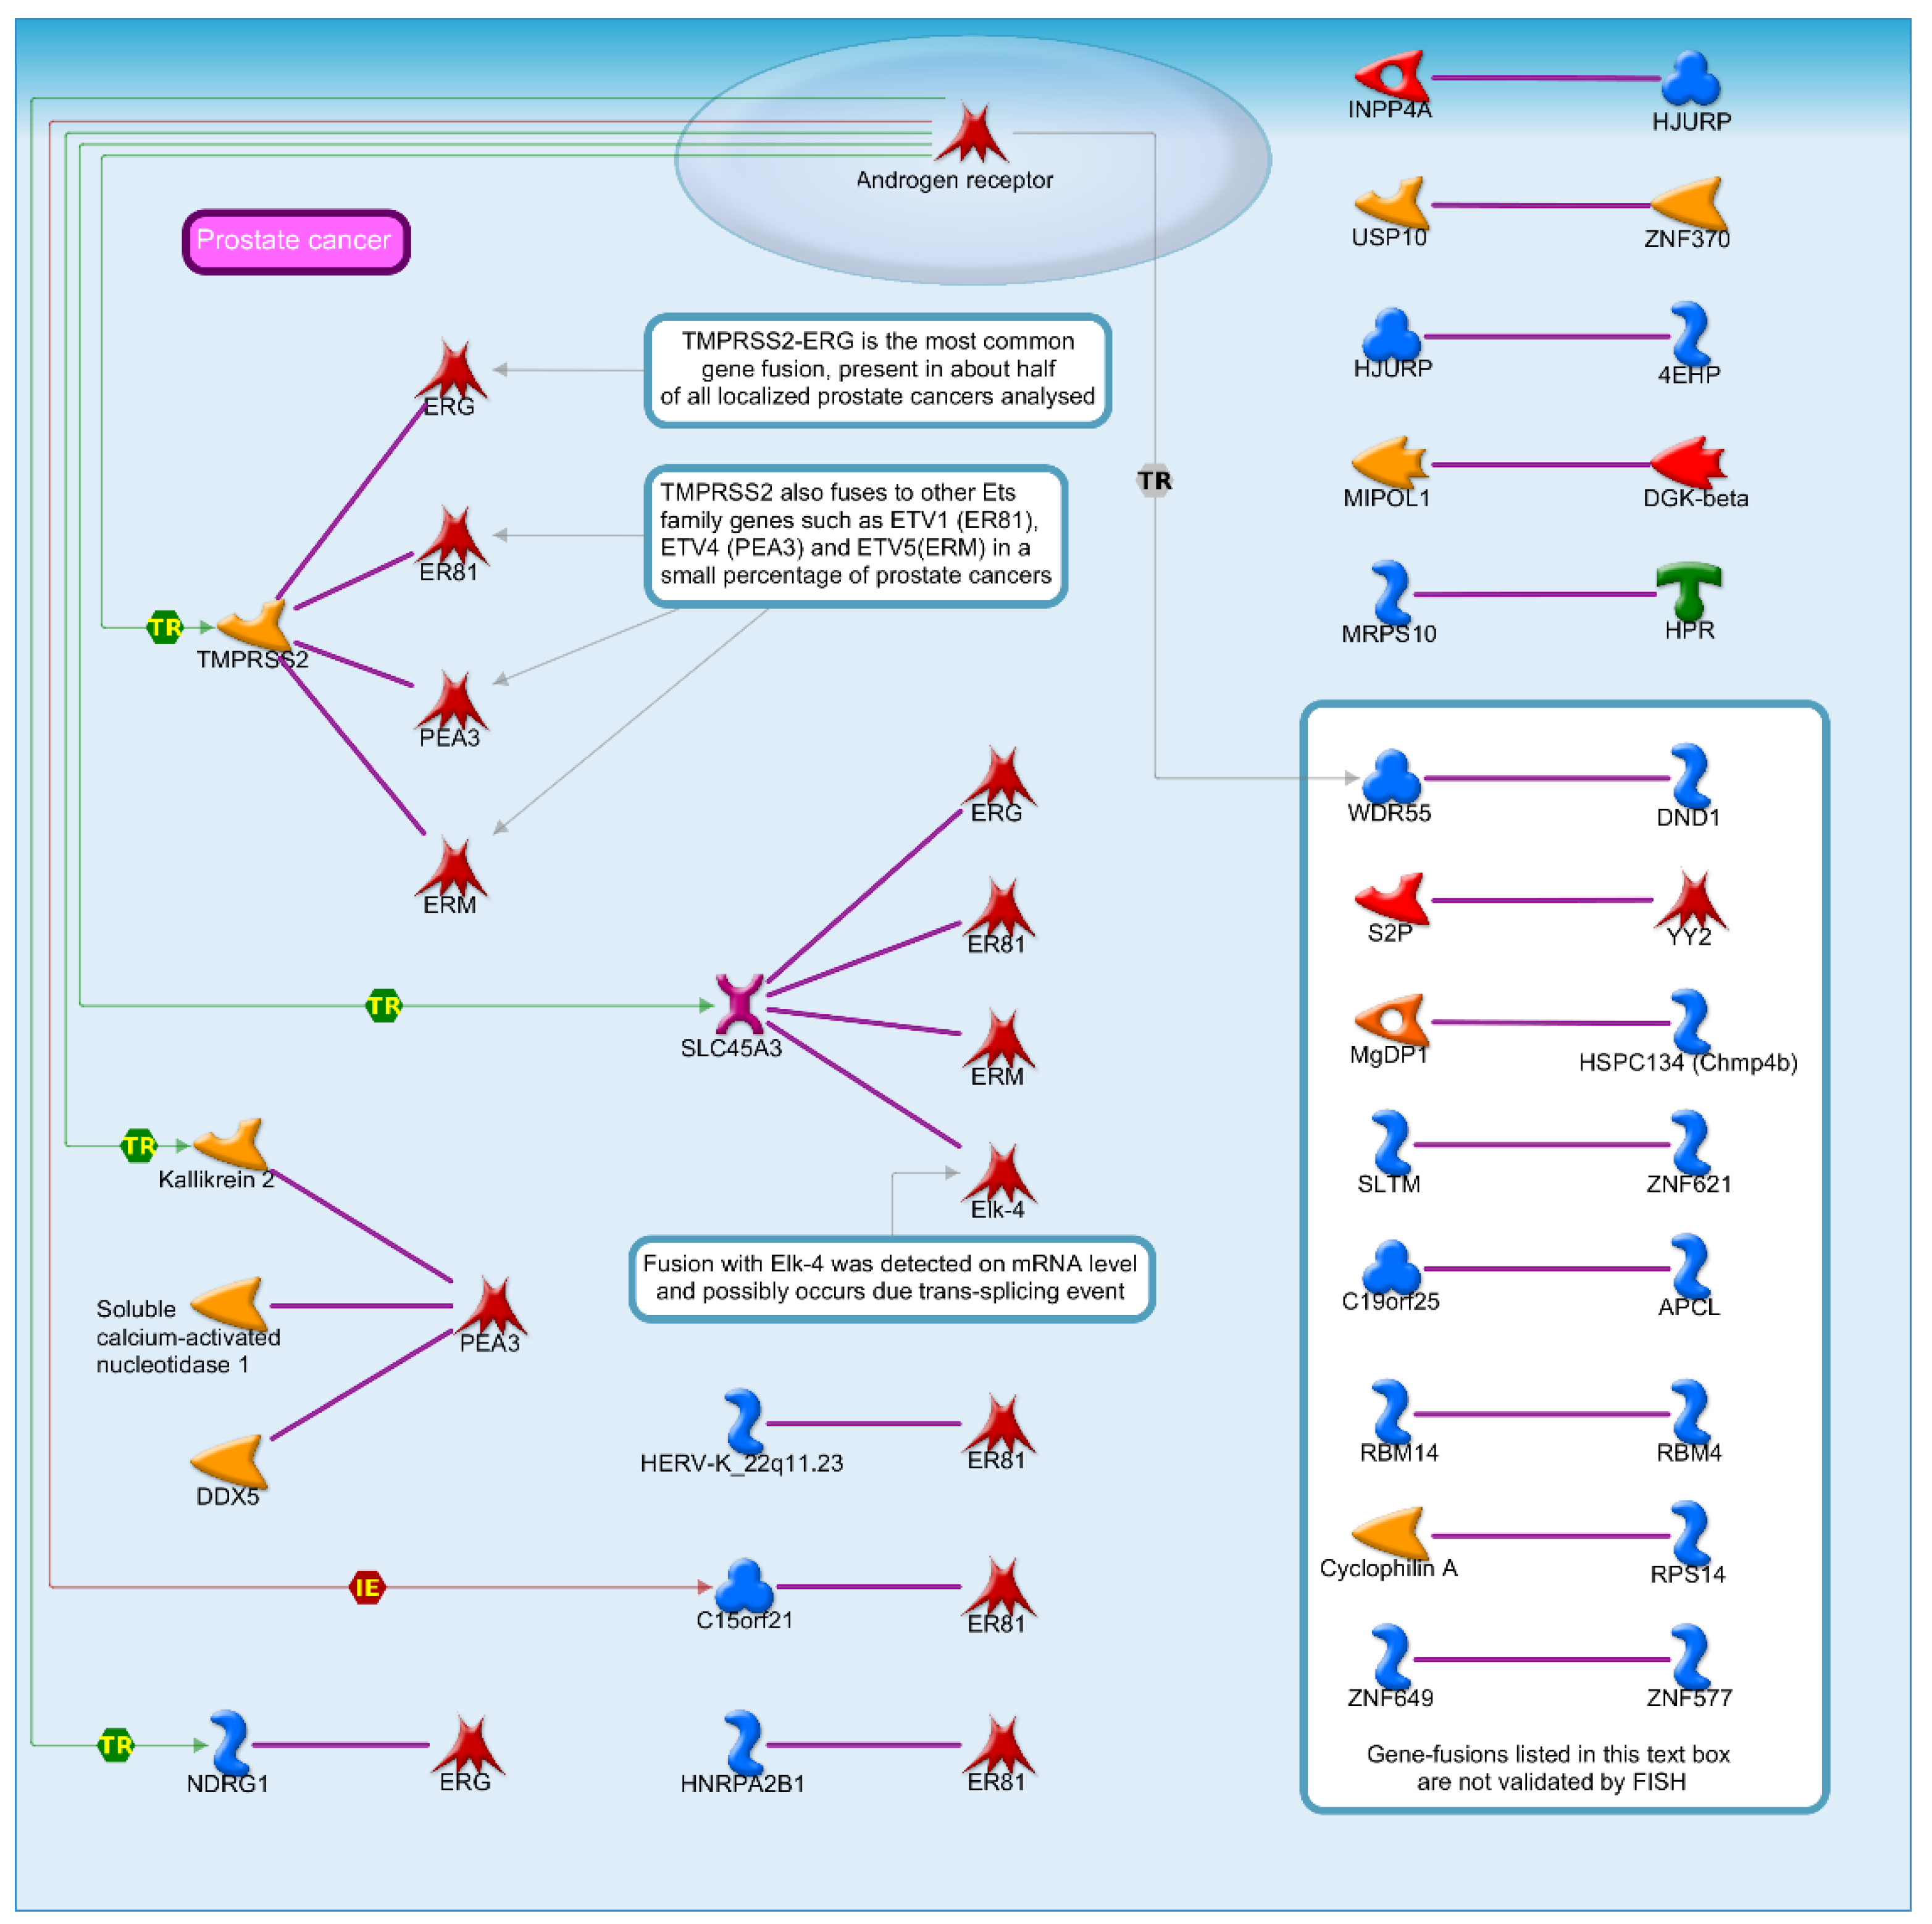
Next, TK1 (Thymidine kinase 1) encodes the enzyme TK1, whose inhibition is known to have an indirect effect on inducing apoptosis. P53 can bind with TK1, leading to DNA fragmentation and apoptosis induction through an unknown mechanism (Figure 8). Finally, in prostate cancer, HJURP (Holliday Junction Recognition Protein) is known to fuse with 4EHP or INPP4A, providing additional information on HJURP's potential as a marker in UCS (Figure 9).

3. Discussion

Leiomyosarcoma is an uncommon cancer originating from smooth muscle cells, capable of manifesting in various body regions such as the uterus, cervix, rectum, heart, and genitourinary system [19,20]. The incidence of uterine leiomyosarcoma, especially in relation to uterine fibroids, may be 1% in uterine cancer, but it has a poor prognosis and is a is a highly aggressive tumor [21]. According to leiomyosarcoma, our recent research has identified several genes that were significantly expressed, including CCNA, CDC20, CENPA, HJURP, HMMR, KIF11, NUSAP1, PLK4, PRC1, KIF20A, KIF4A, MAD2L1, SPAG5, TK1, TOP2A, and ZWINT. The identification of 25 differentially expressed genes (DEGs) from five datasets provides a significant insight into the molecular landscape of uterine leiomyosarcoma. Among these, PMGs—MOXD1, NDRG2, OLFM1, KIF20A, HMMR, ABCA6, TGFBR2, PLK4, PRC1, and ZWINT—were potentially localized at the plasma membrane of cancer cells. The localization of these DEGs at the plasma membrane is critically important for their potential as targets in chimeric antigen receptor (CAR) T-cell therapy [22].
The plasma membrane localization of differentially expressed genes (DEGs) in uterine leiomyosarcoma cells is of particular interest in the context of CAR T-cell therapy. DEGs localized at the plasma membrane, or plasma membrane genes (PMGs), are accessible to CAR T-cells, which are engineered to recognize and bind to specific antigens on the cell surface [23,24]. This accessibility is crucial because CAR T-cells can exert their cytotoxic effects directly upon binding to the target antigens. Targeting PMGs ensures that CAR T-cells can effectively identify and destroy cancer cells without affecting normal cells that do not express these specific antigens. Additionally, the overexpression of these PMGs in uterine leiomyosarcoma, as observed in the GEPIA database, further supports their candidacy as therapeutic targets [22]. The higher density of these antigens on the surface of cancer cells enhances the specificity and efficacy of CAR T-cell therapy, potentially leading to more effective and targeted cancer treatments.
Cell mitosis is a fundamental process for cell division and proliferation. In cancer, this process is often dysregulated, leading to uncontrolled cell growth and tumor development, which could potentially be targets of anticancer treatments. The mitotic spindle, a structure composed of microtubules, segregates chromosomes into daughter cells during cell division. Proper functioning of the spindle, chromosomes, kinetochore, and mitotic spindle is essential for accurate chromosome segregation. Dysregulation of these processes can result in genomic instability, a hallmark of cancer, contributing to tumor progression and resistance to therapy [25,26]. Understanding the molecular mechanisms underlying these dysregulated processes in uterine leiomyosarcoma is critical for developing targeted therapies that can effectively combat this aggressive cancer type.
In leiomyosarcoma, the dysregulation of genes involved in these processes can lead to genomic instability [25,26]. The DEGs identified, which play roles in cell mitosis, spindle assembly, chromosome segregation, and kinetochore function, are often overexpressed or mutated in cancer cells, contributing to the uncontrolled proliferation and survival of these cells. Specifically, genes such as HMMR, KIF20A, PRC1, and ZWINT, which have high betweenness centrality scores in protein networks, are crucial regulators of mitosis and spindle dynamics. Their overexpression may lead to aberrant cell division and tumor progression [22].
Hyaluronan Mediated Motility Receptor (HMMR) plays a critical role in cell-matrix interactions and migration, with its overexpression in cancer linked to invasion and metastasis [27]. Its localization on the plasma membrane makes it a viable target for CAR T-cells, offering a strategy to reduce metastatic potential in tumors [27]. Beyond its role as a hyaluronan receptor, HMMR regulates homeostasis, mitosis, and meiosis, highlighting its multifaceted functions [27].
Research indicates that HMMR influences chemoresistance in gastric cancer and is regulated by the AR-mTOR-SRF axis in prostate cancer, associating it with tumor progression and metastasis [28]. In uterine leiomyosarcoma, HMMR expression correlates with poor outcomes, suggesting its prognostic value [29]. High HMMR levels predict poor prognosis in renal cell carcinoma and adverse outcomes in lung adenocarcinoma, linking it to immune infiltrates [28,29]. The role of HMMR in colorectal cancer remains to be fully clarified, while in breast cancer, it promotes proliferation and metastasis, underscoring its oncogenic potential [30,31]. HMMR also enhances peritoneal implantation of gastric cancer by facilitating cell-cell interactions, contributing to cancer progression [32]. In summary, HMMR is integral to cancer biology, influencing tumor growth, metastasis, and treatment response. Understanding HMMR's molecular mechanisms can aid in developing targeted therapies and improving cancer patient outcomes.
KIF20A (Kinesin Family Member 20A) is a motor protein involved in mitosis and intracellular transport. Overexpression of KIF20A is frequently observed in various cancers and is associated with poor prognosis [33]. The localization of KIF20A on the plasma membrane offers a unique opportunity for CAR T-cells to recognize and target cancer cells exhibiting high KIF20A expression, thereby inhibiting cancer cell proliferation.
PRC1 (Protein Regulator of Cytokinesis 1) is essential for regulating cytokinesis during cell division and is implicated in various cancers, including uterine leiomyosarcoma, where its overexpression drives cancer cell proliferation [34]. The oncogenic properties of PRC1 have been studied in numerous tumors, highlighting its potential as a diagnostic and therapeutic biomarker in hepatocellular carcinoma and other malignancies [35].
PRC1, part of the microtubule-associated proteins (MAPs) family, plays a vital role in cytokinesis, aiding in the initiation and completion of this critical cellular process [34]. Research has demonstrated PRC1's essential role in maintaining spindle stability, ensuring proper chromosome segregation, and completing cytokinesis, all crucial for correct cell division [36]. PRC1's phosphorylation by CDKs, such as CDK16, has been linked to the progression and metastasis of triple-negative breast cancer, illustrating the complex regulatory mechanisms involving PRC1 in cancer development [37].
Dysregulation of PRC1 has been correlated with poor prognosis in ovarian cancer, underscoring its value as a prognostic marker and therapeutic target [38]. In hepatocellular carcinoma, targeting PRC1 to reduce its levels has been proposed as a potential strategy to inhibit tumor growth, demonstrating its oncogenic role [39]. PRC1 overexpression is associated with poor prognosis in colon cancer, suggesting its use as a prognostic indicator and therapeutic target [40]. In oral squamous cell carcinoma, PRC1 is crucial for regulating proliferation and cell cycle progression, emphasizing its importance in cancer biology [41].
Given these findings and PRC1's localization on the plasma membrane, it serves as an effective target for CAR T-cells, which can recognize and eliminate cells with high PRC1 expression. Because PRC1 is localized on the plasma membrane and involved in rapid tumor cell division, it presents an effective target for CAR T-cells, which can identify and eliminate cells with high PRC1 expression.
ZWINT (ZW10 Interacting Kinetochore Protein) is involved in kinetochore function and cell division. Overexpression of ZWINT is associated with uncontrolled cell division, a hallmark of cancer [42]. Targeting ZWINT on the plasma membrane, CAR T-cells can intervene in the uncontrolled cell division process, providing a direct antiproliferative effect on tumor cells.
The future prospects of this research extend beyond its application in CAR-T cell therapy, including the development of UCS target proteins as monoclonal antibody targets for antibody-drug conjugate (ADC) therapy [43]. ADCs are comprised of a monoclonal antibody, a cytotoxic drug (payload), and a linker that connects the antibody to the drug. The monoclonal antibody is specifically designed to target an antigen expressed on the surface of tumor cells [44]. Upon binding to the target antigen, the ADC is internalized, and the linker is cleaved within the cell, releasing the cytotoxic drug to exert its lethal effect. The choice of linker is crucial, requiring stability in the bloodstream to prevent premature drug release while ensuring efficient release within the target cells. This specific targeting enhances the effectiveness of chemotherapy formulations, minimizing systemic toxicity and improving therapeutic efficacy [45]. We hope that the results of this study inspire and guide future research and development of anti-cancer drugs, leveraging both CAR-T cell and ADC technologies.
In conclusion, through rigorous bioinformatics analysis, we identified HMMR, KIF20A, PRC1, and ZWINT as key candidates due to their involvement in critical cellular processes such as the cell cycle, chromosome segregation, and mitotic spindle assembly. These genes overexpression in LMS compared to normal tissues underscores their potential as tumor-associated antigens (TAAs) for CAR T-cell targeting.
The identification of these TAA and their corresponding protein products provides a valuable foundation for the development of CAR T-cell therapies tailored to LMS. By targeting these specific antigens, CAR T-cells can be designed to selectively eliminate LMS cells, potentially improving treatment efficacy and reducing off-target effects. This study not only enhances our understanding of the molecular underpinnings of LMS but also opens new avenues for therapeutic interventions in this challenging malignancy.
The relevance and novelty of this research are further supported by recent advancements and clinical trials in CAR T-cell therapy. For instance, the successful application of CAR T-cells targeting specific antigens in other solid tumors provides a promising outlook for similar strategies in LMS. As the field of cancer immunotherapy continues to evolve, the integration of genomic data and bioinformatics approaches will be crucial in identifying and validating new therapeutic targets, ultimately paving the way for personalized and precision medicine in oncology.

4. Material and Method

4.1. Data Sources

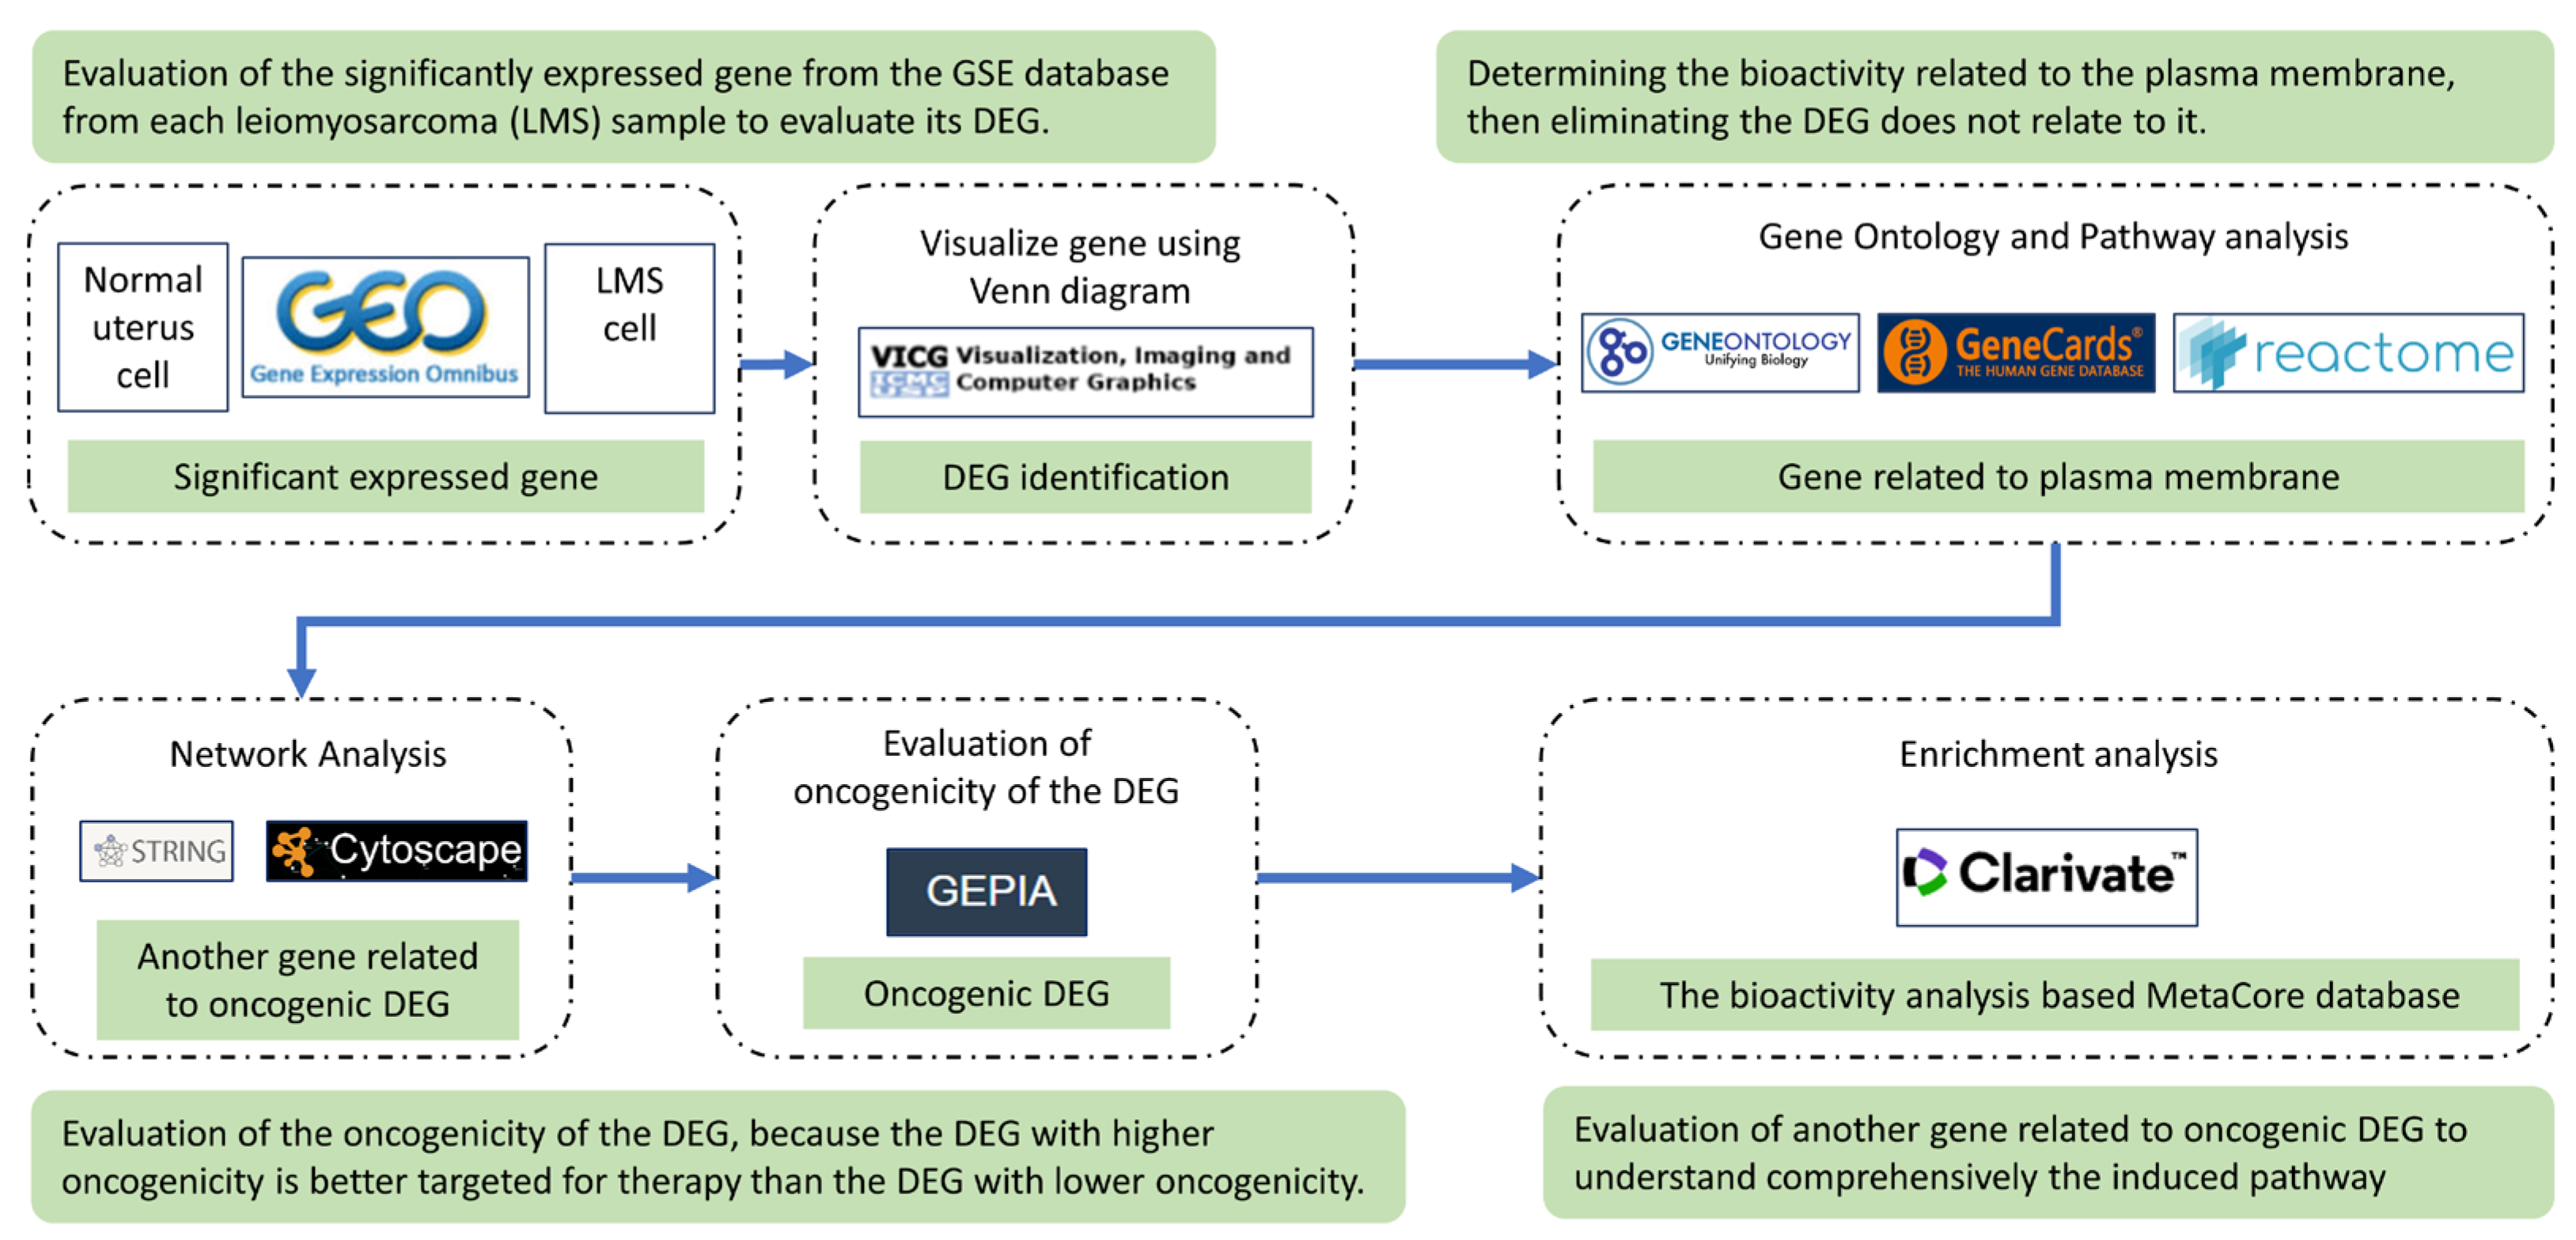
There was a determination of DEGs, followed by examination of protein localization and oncogenicity, and network and enrichment analyses of the recommendation of target genes. The microarray dataset was obtained from the NCBI-GEO database, which is a public gene profile database (https://www.ncbi.nlm.nih.gov/gds/). In this study, we used a balanced count of data samples between normal uterine and leiomyosarcoma samples from each GSE. Thus, the construction of the graphic was done using the SRPlot online tool (https://www.bioinformatics.com.cn/en). The study design is described in Figure 5.

4.2. Identification of Significant Expressed Genes and Their Protein Localization

Identification of the significant expressed gene was carried out using the GEO2R inter-active tool (http://www.ncbi.nlm.nih.gov/geo/geo2r) provided by NCBI to compare a number of sample datasets from the microarray dataset series [46]. The threshold used was log FC > 1.5 and a p value of < 0.05, which were considered to be of statistical significance [47,48]. Next, GEO2R results were analyzed using Microsoft Excel format to separate genes with the same ID, and online Venn software was used to determine gene inter-sections of the four datasets [49]. A highly expressed gene in leiomyosarcoma was designated as the differentially expressed gene (DEG).
Furthermore, the localization of proteins transcribed by DEGs was analyzed using the localization score from the GeneCard database (https://www.genecards.org/) [50]. Proteins with a high localization score (cutoff > 3) in the plasma membrane, endoplasmic reticulum, and Golgi apparatus were categorized as plasma membrane-related genes. This step plays a role in ensuring that the expressed protein is located in the plasma membrane, which could facilitate its function as a CAR antigen. Then, the gene ontology (https://www.geneontology.org/) [51] of the DEG protein was evaluated for its biological processes (BPs), cellular components (CCs), and molecular functions (MFs). The pathway formed by these proteins was also evaluated through the Reactome database (https://reactome.org/) [52,53]. Pathways with the highest false discovery rate (FDR) scores (cutoff < 0.005) were recorded to complement the Gene Ontology results.

4.3. Construction of Protein Network from the Significant Expressed Gene

The protein network was constructed using the Search Tool for the Retrieval of Interacting Genes and Proteins (STRING; https://string-db.org/) [54] and modified by Cytoscape ver. 3.10 [55]. The protein network of DEGs was built by STRING and then expanded (the minimum interaction confidence score is 0.4) until each node was connected. The network was transferred to, modified by, and analyzed with Cytoscape ver. 3.10. tools and plug-in. The network centrality was scored by NetworkAnalyzer, the protein clustering was clustered by an MCODE clustering algorithm using ClusterViz with a degree threshold of 2, a node score threshold of 0.2, a K-core threshold of 2, and a max depth of 100, and the bioactivity of cluster was analysed by STRING cluster bioactivity database with Cytoscape ver. 3.10 [55,56,57].

4.4. Oncogenicity Prediction Analysis

Oncogenicity predictions were carried out on PMGs using Gene Expression Profiling Interactive Analysis (GEPIA2; http://gepia2.cancer-pku.cn/#index). Gene expressions were compared in uterine sarcoma and normal samples. Parameters used were a Log2FC cutoff of 2, a p-value cutoff of 0.01, and matching of the Cancer Genome Atlas (TCGA) normal and GTEx data. GEPIA is a web-based tool that provides interactive features such as profile plotting, patient survival analysis, differential expression analysis, similar gene detection, and dimensionality reduction analysis [58].

4.6. Evaluation of the DEGs Pathway and Biological Process by Metacore
The obtained DEGs will be further explored using the MetaCore database. MetaCore, which utilizes a comprehensive commercial database, provides insights into the intricate network of protein-protein interactions and other biochemical signaling pathways. Also, the statistical tools and algorithms used in MetaCore, such as network analysis algorithms, enable the dissection and interpretation of complex data, providing a deeper understanding of biological systems and their response to various stimuli or disruptions [59].
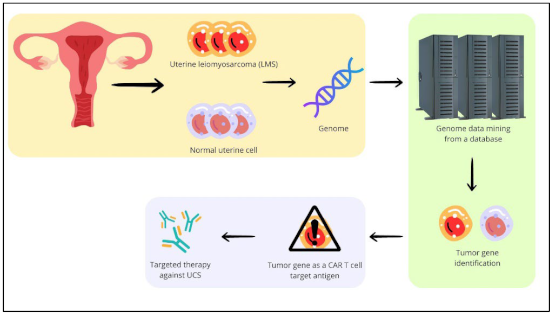
Graphical abstract: leiomyosarcoma tumor-associated antigen identification.
Preprints 111300 i001

Author Contributions

Conceptualization, DA and JTQ; methodology, DA and JTQ.; software, DA and JTQ; validation, DA, DWQ, and JTQ; formal analysis, DA.; investigation, DA, YHC, and JTQ ; resources, DA, DWQ, YHC and JTQ.; data curation, DA and DWQ; writing—original draft preparation, DA.; writing—review and editing, DA, DWQ, YHC, and JTQ.; visualization, DA.; supervision, YHC and JTQ.; project administration, JTQ.; funding acquisition, JTQ. All authors have read and agreed to the published version of the manuscript.

Funding

none.

Acknowledgments

Prof. Yuan-Chii Gladys Lee PhD of Professor, Graduate Institute of Biomedical Informatics, Taipei Medical University Taiwan and Prof. Dr.rer.nat. Arli Aditya Parikesit of Indonesia International Institute for Life Sciences (i3l) for discussion and critical reading. Ahmad Hafidul Ahkam of Padjadjaran University Indonesia for graphical abstract. Nur Rahmah Awaliah Universitas Muhammadiyah Makassar for editing and proofreading.

Conflicts of Interest

The authors declare no conflicts of interest.

References

  1. Byar, K.L.; Fredericks, T. Uterine Leiomyosarcoma. J Adv Pract Oncol 2022, 13, 70–76. [Google Scholar] [CrossRef] [PubMed]
  2. Delisle, M.; Alshamsan, B.; Nagaratnam, K.; Smith, D.; Wang, Y.; Srikanthan, A. Metastasectomy in Leiomyosarcoma: A Systematic Review and Pooled Survival Analysis. Cancers 2022, 14, 3055. [Google Scholar] [CrossRef] [PubMed]
  3. Lacuna, K.; Bose, S.; Ingham, M.; Schwartz, G. Therapeutic Advances in Leiomyosarcoma. Front. Oncol. 2023, 13. [Google Scholar] [CrossRef] [PubMed]
  4. Asano, H.; Isoe, T.; Ito, Y.M.; Nishimoto, N.; Watanabe, Y.; Yokoshiki, S.; Watari, H. Status of the Current Treatment Options and Potential Future Targets in Uterine Leiomyosarcoma: A Review. Cancers 2022, 14, 1180. [Google Scholar] [CrossRef] [PubMed]
  5. Kyriazoglou, A.; Liontos, M.; Ntanasis-Stathopoulos, I.; Gavriatopoulou, M. The Systemic Treatment of Uterine Leiomyosarcomas: A Systematic Review. No News Is Good News? Medicine 2021, 100, e25309. [Google Scholar] [CrossRef] [PubMed]
  6. Kostine, M.; Briaire-de Bruijn, I.H.; Cleven, A.H.G.; Vervat, C.; Corver, W.E.; Schilham, M.W.; Van Beelen, E.; van Boven, H.; Haas, R.L.; Italiano, A.; et al. Increased Infiltration of M2-Macrophages, T-Cells and PD-L1 Expression in High Grade Leiomyosarcomas Supports Immunotherapeutic Strategies. OncoImmunology 2018, 7, e1386828. [Google Scholar] [CrossRef] [PubMed]
  7. Feins, S.; Kong, W.; Williams, E.F.; Milone, M.C.; Fraietta, J.A. An Introduction to Chimeric Antigen Receptor (CAR) T-Cell Immunotherapy for Human Cancer. American Journal of Hematology 2019, 94, S3–S9. [Google Scholar] [CrossRef] [PubMed]
  8. Lemoine, J.; Ruella, M.; Houot, R. Overcoming Intrinsic Resistance of Cancer Cells to CAR T-Cell Killing. Clinical Cancer Research 2021, 27, 6298–6306. [Google Scholar] [CrossRef] [PubMed]
  9. Marofi, F.; Motavalli, R.; Safonov, V.A.; Thangavelu, L.; Yumashev, A.V.; Alexander, M.; Shomali, N.; Chartrand, M.S.; Pathak, Y.; Jarahian, M.; et al. CAR T Cells in Solid Tumors: Challenges and Opportunities. Stem Cell Research & Therapy 2021, 12, 81. [Google Scholar] [CrossRef]
  10. Iuliano, L.; Dalla, E.; Picco, R.; Mallarapu, S.; Brancolini, C. Proteotoxic Stress-Induced Apoptosis in Cancer Cells: Understanding the Susceptibility and Enhancing the Potency 2022.
  11. Miyata, T.; Nakabayashi, K. Genomic, Epigenomic, and Transcriptomic Profiling towards Identifying Omics-Features and Specific Biomarkers That Distinguish Uterine Leiomyosarcoma and Leiomyoma at Molecular Levels (Expression) 2017.
  12. Levine, D.; Boyd, J. Expression Data from Normal Myometrium, Leiomyomata, and Leiomyosarcomas 2015.
  13. Matthew, A.; Creighton, C.; Weiwei, S. Gene Expression Profiles of Uterine Leiomyosarcoma (ULMS) 2012.
  14. Quade, B.; Morton, C.; Hodge, J. Characterization of Plexiform Leiomyomata Provide Further Evidence for Genetic Heterogeneity Underlying Uterine Fibroids 2008.
  15. Genta, S.; Bruce, J.; Li, X.; Felicen, S.; Abdul Razak, A.R.; Saibil, S.; Butler, M.O.; Bedard, P.L.; Lam, B.; Tsao, M.S.; et al. Deciphering Primary and Acquired Immunotherapy Resistance with Whole Genome and Transcriptome Analysis (WGTA). JCO 2023, 41, 2602–2602. [Google Scholar] [CrossRef]
  16. Bruno, L.P.; Doddato, G.; Valentino, F.; Baldassarri, M.; Tita, R.; Fallerini, C.; Bruttini, M.; Lo Rizzo, C.; Mencarelli, M.A.; Mari, F.; et al. New Candidates for Autism/Intellectual Disability Identified by Whole-Exome Sequencing. International Journal of Molecular Sciences 2021, 22, 13439. [Google Scholar] [CrossRef]
  17. Khan, A.; Bruno, L.P.; Alomar, F.; Umair, M.; Pinto, A.M.; Khan, A.A.; Khan, A.; Saima; Fabbiani, A. ; Zguro, K.; et al. SPTBN5, Encoding the βV-Spectrin Protein, Leads to a Syndrome of Intellectual Disability, Developmental Delay, and Seizures. Front. Mol. Neurosci. 2022, 15. [Google Scholar] [CrossRef]
  18. Nogrady, B. How Cancer Genomics Is Transforming Diagnosis and Treatment. Nature 2020, 579, S10–S11. [Google Scholar] [CrossRef] [PubMed]
  19. Paudel, P.; Dhungana, B.; Shrestha, E.; Verma, D.; Paudel, P.; Dhungana, B.; Shrestha, E.; Verma, D. Leiomyosarcoma of the Uterus: A Rare Diagnosis. Cureus 2021, 13. [Google Scholar] [CrossRef]
  20. Juhasz-Böss, I.; Gabriel, L.; Bohle, R.M.; Horn, L.C.; Solomayer, E.-F.; Breitbach, G.-P. Uterine Leiomyosarcoma. Oncology Research and Treatment 2018, 41, 680–686. [Google Scholar] [CrossRef]
  21. Kanayama, S.; Oi, H.; Kawaguchi, R.; Furukawa, N.; Kobayashi, H. Immunohistochemical Analysis of P16 Expression in Uterine Smooth Muscle Tumors. Open Journal of Obstetrics and Gynecology 2015, 5, 688–697. [Google Scholar] [CrossRef]
  22. Sterner, R.C.; Sterner, R.M. CAR-T Cell Therapy: Current Limitations and Potential Strategies. Blood Cancer J. 2021, 11, 1–11. [Google Scholar] [CrossRef]
  23. Sadelain, M.; Brentjens, R.; Riviere, I. The Basic Principles of Chimeric Antigen Receptor (CAR) Design. Cancer Discov 2013, 3, 388–398. [Google Scholar] [CrossRef] [PubMed]
  24. Wei, J.; Han, X.; Bo, J.; Han, W. Target Selection for CAR-T Therapy. Journal of Hematology & Oncology 2019, 12, 62. [Google Scholar] [CrossRef]
  25. Hanahan, D. Hallmarks of Cancer: New Dimensions. Cancer Discovery 2022, 12, 31–46. [Google Scholar] [CrossRef]
  26. Ravi, S.; Alencar, A.M.; Arakelyan, J.; Xu, W.; Stauber, R.; Wang, C.-C.I.; Papyan, R.; Ghazaryan, N.; Pereira, R.M. An Update to Hallmarks of Cancer. Cureus 2022, 14, e24803. [Google Scholar] [CrossRef]
  27. He, Z.; Mei, L.; Connell, M.; Maxwell, C.A. Hyaluronan Mediated Motility Receptor (HMMR) Encodes an Evolutionarily Conserved Homeostasis, Mitosis, and Meiosis Regulator Rather than a Hyaluronan Receptor. Cells 2020, 9, 819. [Google Scholar] [CrossRef]
  28. Zhang, H.; Ren, L.; Ding, Y.; Li, F.; Chen, X.; Ouyang, Y.; Zhang, Y.; Zhang, D. Hyaluronan-Mediated Motility Receptor Confers Resistance to Chemotherapy via TGFβ/Smad2-Induced Epithelial-Mesenchymal Transition in Gastric Cancer. The FASEB Journal 2019, 33, 6365–6377. [Google Scholar] [CrossRef] [PubMed]
  29. Sun, Y.; Li, Z.; Song, K. AR-mTOR-SRF Axis Regulates HMMR Expression in Human Prostate Cancer Cells. Biomol Ther (Seoul) 2021, 29, 667–677. [Google Scholar] [CrossRef]
  30. Li, W.; Wang, R.; Wang, W. Exploring the Causality and Pathogenesis of Systemic Lupus Erythematosus in Breast Cancer Based on Mendelian Randomization and Transcriptome Data Analyses. Front. Immunol. 2023, 13. [Google Scholar] [CrossRef]
  31. Tang, Y.; Yin, Y.; Xie, M.; Liang, X.; Li, J.; Li, K.; Hu, B. Systematic Analysis of the Clinical Significance of Hyaluronan-Mediated Motility Receptor in Colorectal Cancer. Front. Mol. Biosci. 2021, 8. [Google Scholar] [CrossRef] [PubMed]
  32. Yang, M.; Chen, B.; Kong, L.; Chen, X.; Ouyang, Y.; Bai, J.; Yu, D.; Zhang, H.; Li, X.; Zhang, D. HMMR Promotes Peritoneal Implantation of Gastric Cancer by Increasing Cell–Cell Interactions. Discov Onc 2022, 13, 81. [Google Scholar] [CrossRef]
  33. Zhao, X.; Zhou, L.; Li, X.; Ni, J.; Chen, P.; Ma, R.; Wu, J.; Feng, J. Overexpression of KIF20A Confers Malignant Phenotype of Lung Adenocarcinoma by Promoting Cell Proliferation and Inhibiting Apoptosis. Cancer Medicine 2018, 7, 4678–4689. [Google Scholar] [CrossRef] [PubMed]
  34. Zhan, P.; Zhang, B.; Xi, G.; Wu, Y.; Liu, H.; Liu, Y.; Xu, W.; Zhu, Q.; Cai, F.; Zhou, Z.; et al. PRC1 Contributes to Tumorigenesis of Lung Adenocarcinoma in Association with the Wnt/β-Catenin Signaling Pathway. Molecular Cancer 2017, 16, 108. [Google Scholar] [CrossRef]
  35. Qiao, Y.; Pei, Y.; Luo, M.; Rajasekaran, M.; Hui, K.M.; Chen, J. Cytokinesis Regulators as Potential Diagnostic and Therapeutic Biomarkers for Human Hepatocellular Carcinoma. Exp Biol Med (Maywood) 2021, 246, 1343–1354. [Google Scholar] [CrossRef]
  36. Gluszek-Kustusz, A.; Craske, B.; Legal, T.; McHugh, T.; Welburn, J.P. Phosphorylation Controls Spatial and Temporal Activities of motor-PRC1 Complexes to Complete Mitosis. The EMBO Journal 2023, 42, e113647. [Google Scholar] [CrossRef] [PubMed]
  37. Li, X.; Li, J.; Xu, L.; Wei, W.; Cheng, A.; Zhang, L.; Zhang, M.; Wu, G.; Cai, C. CDK16 Promotes the Progression and Metastasis of Triple-Negative Breast Cancer by Phosphorylating PRC1. Journal of Experimental & Clinical Cancer Research 2022, 41, 149. [Google Scholar] [CrossRef]
  38. Bu, H.; Li, Y.; Jin, C.; Yu, H.; Wang, X.; Chen, J.; Wang, Y.; Ma, Y.; Zhang, Y.; Kong, B. Overexpression of PRC1 Indicates a Poor Prognosis in Ovarian Cancer. International Journal of Oncology 2020, 56, 685–696. [Google Scholar] [CrossRef] [PubMed]
  39. Liu, X.; Li, Y.; Meng, L.; Liu, X.-Y.; Peng, A.; Chen, Y.; Liu, C.; Chen, H.; Sun, S.; Miao, X.; et al. Reducing Protein Regulator of Cytokinesis 1 as a Prospective Therapy for Hepatocellular Carcinoma. Cell Death Dis 2018, 9, 1–12. [Google Scholar] [CrossRef]
  40. Xu, T.; Wang, X.; Jia, X.; Gao, W.; Li, J.; Gao, F.; Zhan, P.; Ji, W. Overexpression of Protein Regulator of Cytokinesis 1 Facilitates Tumor Growth and Indicates Unfavorable Prognosis of Patients with Colon Cancer. Cancer Cell International 2020, 20, 528. [Google Scholar] [CrossRef] [PubMed]
  41. Wu, F.; Shi, X.; Zhang, R.; Tian, Y.; Wang, X.; Wei, C.; Li, D.; Li, X.; Kong, X.; Liu, Y.; et al. Regulation of Proliferation and Cell Cycle by Protein Regulator of Cytokinesis 1 in Oral Squamous Cell Carcinoma. Cell Death Dis 2018, 9, 1–12. [Google Scholar] [CrossRef] [PubMed]
  42. Wu, M.; Liu, Z.; Zhang, A.; Li, N. Identification of Key Genes and Pathways in Hepatocellular Carcinoma: A Preliminary Bioinformatics Analysis. Medicine 2019, 98, e14287. [Google Scholar] [CrossRef] [PubMed]
  43. Chau, C.H.; Steeg, P.S.; Figg, W.D. Antibody-Drug Conjugates for Cancer. Lancet 2019, 394, 793–804. [Google Scholar] [CrossRef] [PubMed]
  44. Criscitiello, C.; Morganti, S.; Curigliano, G. Antibody–Drug Conjugates in Solid Tumors: A Look into Novel Targets. Journal of Hematology & Oncology 2021, 14, 20. [Google Scholar] [CrossRef]
  45. Tarantino, P.; Pestana, R.C.; Corti, C.; Modi, S.; Bardia, A.; Tolaney, S.M.; Cortes, J. Antibody–Drug Conjugates: Smart Chemotherapy Delivery across Tumor Histologies. CA CANCER J CLIN 2022, 72. [Google Scholar] [CrossRef]
  46. Barrett, T.; Wilhite, S.E.; Ledoux, P.; Evangelista, C.; Kim, I.F.; Tomashevsky, M.; Marshall, K.A.; Phillippy, K.H.; Sherman, P.M.; Holko, M.; et al. NCBI GEO: Archive for Functional Genomics Data Sets—Update. Nucleic Acids Research 2013, 41, D991–D995. [Google Scholar] [CrossRef] [PubMed]
  47. Huang, X.; Wang, X.; Huang, G.; Li, R.; Liu, X.; Cao, L.; Ye, J.; Zhang, P. Bioinformatic Identification of Differentially Expressed Genes Associated with Hepatocellular Carcinoma Prognosis. Medicine 2022, 101, e30678. [Google Scholar] [CrossRef] [PubMed]
  48. Zhang, H.; Zhou, D.; Zhu, F.; Chen, F.; Zhu, Y.; Yu, R.; Fan, L. Disordered APC/C-Mediated Cell Cycle Progression and IGF1/PI3K/AKT Signalling Are the Potential Basis of Sertoli Cell-Only Syndrome. Andrologia 2019, 51, e13288. [Google Scholar] [CrossRef] [PubMed]
  49. Chandrashekar, D.S.; Athar, M.; Manne, U.; Varambally, S. Comparative Transcriptome Analyses Reveal Genes Associated with SARS-CoV-2 Infection of Human Lung Epithelial Cells. Sci Rep 2021, 11, 16212. [Google Scholar] [CrossRef] [PubMed]
  50. Stelzer, G.; Rosen, N.; Plaschkes, I.; Zimmerman, S.; Twik, M.; Fishilevich, S.; Stein, T.I.; Nudel, R.; Lieder, I.; Mazor, Y.; et al. The GeneCards Suite: From Gene Data Mining to Disease Genome Sequence Analyses. Current Protocols in Bioinformatics 2016, 54, 1–30. [Google Scholar] [CrossRef]
  51. Thomas, P.D.; Ebert, D.; Muruganujan, A.; Mushayahama, T.; Albou, L.-P.; Mi, H. PANTHER: Making Genome-Scale Phylogenetics Accessible to All. Protein Sci 2022, 31, 8–22. [Google Scholar] [CrossRef]
  52. Gillespie, M.; Jassal, B.; Stephan, R.; Milacic, M.; Rothfels, K.; Senff-Ribeiro, A.; Griss, J.; Sevilla, C.; Matthews, L.; Gong, C.; et al. The Reactome Pathway Knowledgebase 2022. Nucleic Acids Research 2022, 50, D687–D692. [Google Scholar] [CrossRef]
  53. Fabregat, A.; Sidiropoulos, K.; Viteri, G.; Forner, O.; Marin-Garcia, P.; Arnau, V.; D’Eustachio, P.; Stein, L.; Hermjakob, H. Reactome Pathway Analysis: A High-Performance in-Memory Approach. BMC Bioinformatics 2017, 18, 142. [Google Scholar] [CrossRef]
  54. Szklarczyk, D.; Gable, A.L.; Lyon, D.; Junge, A.; Wyder, S.; Huerta-Cepas, J.; Simonovic, M.; Doncheva, N.T.; Morris, J.H.; Bork, P.; et al. STRING V11: Protein-Protein Association Networks with Increased Coverage, Supporting Functional Discovery in Genome-Wide Experimental Datasets. Nucleic Acids Res 2019, 47, D607–D613. [Google Scholar] [CrossRef]
  55. Shannon, P.; Markiel, A.; Ozier, O.; Baliga, N.S.; Wang, J.T.; Ramage, D.; Amin, N.; Schwikowski, B.; Ideker, T. Cytoscape: A Software Environment for Integrated Models of Biomolecular Interaction Networks. Genome Res 2003, 13, 2498–2504. [Google Scholar] [CrossRef]
  56. Assenov, Y.; Ramírez, F.; Schelhorn, S.-E.; Lengauer, T.; Albrecht, M. Computing Topological Parameters of Biological Networks. Bioinformatics 2008, 24, 282–284. [Google Scholar] [CrossRef] [PubMed]
  57. Wang, J.; Zhong, J.; Chen, G.; Li, M.; Wu, F.; Pan, Y. ClusterViz: A Cytoscape APP for Cluster Analysis of Biological Network. IEEE/ACM Transactions on Computational Biology and Bioinformatics 2015, 12, 815–822. [Google Scholar] [CrossRef] [PubMed]
  58. Tang, Z.; Li, C.; Kang, B.; Gao, G.; Li, C.; Zhang, Z. GEPIA: A Web Server for Cancer and Normal Gene Expression Profiling and Interactive Analyses. Nucleic Acids Research 2017, 45, W98–W102. [Google Scholar] [CrossRef]
  59. Cirillo, E.; Parnell, L.D.; Evelo, C.T. A Review of Pathway-Based Analysis Tools That Visualize Genetic Variants. Front Genet 2017, 8, 174. [Google Scholar] [CrossRef] [PubMed]
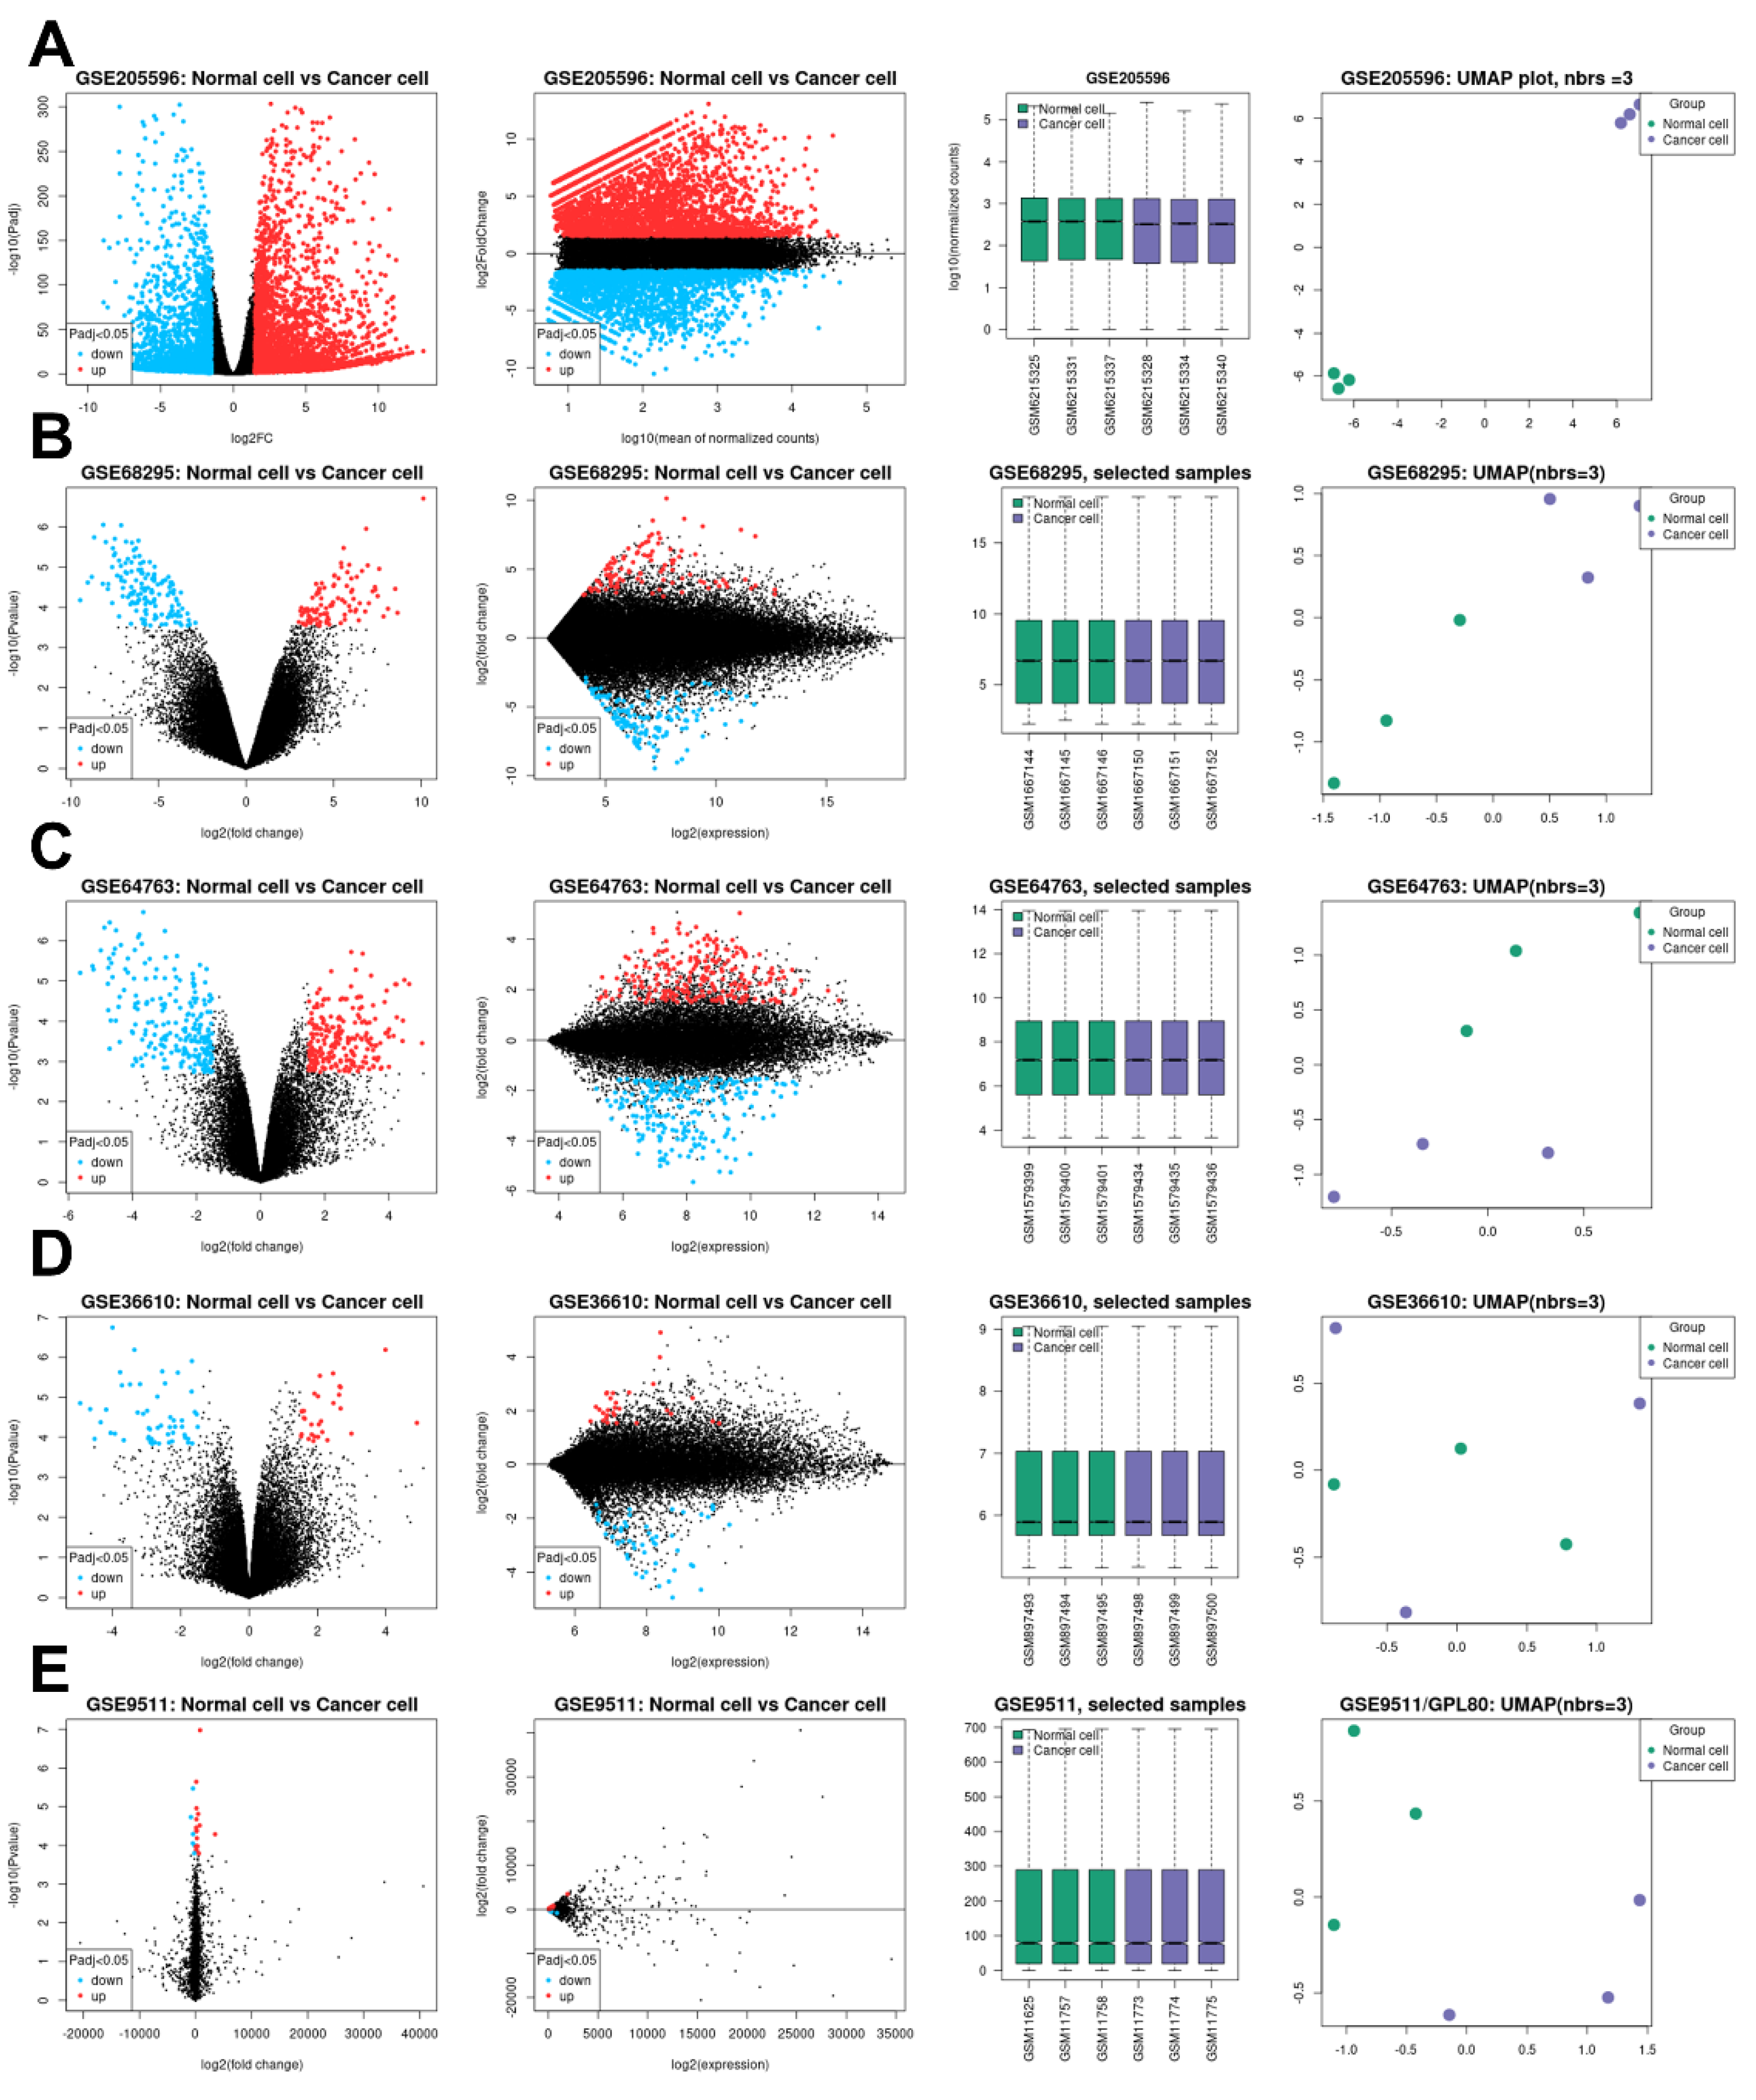
Figure 1. Topology of the GSE samples used. The volcano and mean plots represent significant genes, marked by red and blue dots. Each GSE used includes 3 samples of normal cells and cancer cells, represented by green and purple bar graphs. The UMAP plot represents the similarity of clusters based on the distance between nodes, with green nodes representing each normal cell sample and purple nodes representing each cancer cell sample. A) GSE205596, B) GSE68295, C) GSE64763, D) GSE36610, E) GSE9511.
Preprints 111300 g001
Figure 2. Identification of the DEGs and its related biological process. (A) Identification of DEGs between GSE. (B) Mutations that occur in DEGs based on CBIOPortal database. (C) Localization of DEGs based on GeneCard database. (D) Biological processes from DEGs based on the reactome pathway database.
Preprints 111300 g002
Figure 3. The bioactivity of DEGs and Network Proteins. A) Deg's gene ontology. B) top pathway from the REACTOME database. C) DEG's network. The red node is a protein that localized in the cell membrane. The border node represents the degree centrality score of the node; thicker are higher. The node size represents the score between centrality and the node; larger are higher. The background color shows the cluster, where Gene Cluster 1 has a purple background color and an unclustered background gene. D) Bioactivity of Cluster 1 Based on a STRING Database. The yellow node is a gene involved in mitotic and spindle regulation. The border node shows localized protein in the cell membrane. E) Significant DEGs are expressed in Leiomyosarcoma based on GEPIA database. The red bar shows the score of the UCS sample, and the black bar shows the score of the normal sample.
Preprints 111300 g003
Figure 4. Biological processes of CCNA2 in cell cycle progression related to the cell cycle, apoptosis, and cancer pathway. The analysis was performed through the Metacore database.
Preprints 111300 g004
Figure 5. Biological processes of CDC20, CENPA, MAD2L, and ZWINT involved in spindle assembly checkpoint bioactivity. The analysis was performed through the Metacore database.
Preprints 111300 g005
Figure 6. Biological processes of KIF11 by encoded KNSL1 in spindle assembly bioactivity through an unknown mechanism. The analysis was performed through the Metacore database.
Preprints 111300 g006
Figure 7. RHAMM as a part of cancer metastatic. The analysis was performed through the Metacore database.
Preprints 111300 g007
Figure 8. Biological processes of TK1 inhibition induce DNA fragmentation and apoptosis. The analysis was performed through the Metacore database.
Preprints 111300 g008
Figure 9. HJURP fusion is observed in prostate cancer. The analysis was performed through the Metacore database.
Preprints 111300 g009
Figure 5. The study designs. The study began by collecting GSE data and analyzing it in stages to obtain genes that could potentially be developed as targets for CAR T-cell therapy.
Preprints 111300 g010
Table 1. GEO profile of five dataset used.
GEO profile Year Cancer sample Normal sample Platform Annotation platform
GSE205596 [10] 2023 Leiomyosarcoma (9) Uterine smooth muscle (9) GPL24676 Illumina NovaSeq 6000 (Homo sapiens)
GSE68295 [11] 2017 Leiomyosarcoma (3) Uterine myometrium (3) GPL6480 Agilent-014850 Whole Human Genome Microarray 4x44K G4112F (Probe Name version)
GSE64763 [12] 2015 Leiomyosarcoma (25) Uterine myometrium (29) GPL571 [HG-U133A_2] Affymetrix Human Genome U133A 2.0 Array
GSE36610 [13] 2012 Leiomyosarcoma (12) Uterine myometrium (10) GPL7363 Illumina HumanWG-6_V2_0_R2
GSE9511 [14] 2008 Leiomyosarcoma (8) Uterine myometrium (4) GPL80 [Hu6800] Affymetrix Human Full Length HuGeneFL Array
Table 2. Topology of the DEGs protein network.
Protein name Betweenness Centrality Degree Cluster
ABCA6 0.00E+00 0 Unclustered
ADIRF 0.00E+00 0 Unclustered
CCNA2 6.80E-04 15 Cluster 1
CDC20 6.80E-04 15 Cluster 1
CENPA 6.80E-04 15 Cluster 1
FOXG1 0.00E+00 0 Unclustered
HJURP 6.80E-04 15 Cluster 1
HMMR 6.80E-04 15 Cluster 1
KIF11 6.80E-04 15 Cluster 1
KIF20A 6.80E-04 15 Cluster 1
KIF4A 6.80E-04 15 Cluster 1
MAD2L1 6.80E-04 15 Cluster 1
MOXD1 0.00E+00 0 Unclustered
NDRG2 0.00E+00 0 Unclustered
NUSAP1 6.80E-04 15 Cluster 1
OLFM1 0.00E+00 0 Unclustered
PALMD 0.00E+00 0 Unclustered
PLK4 0.00E+00 14 Cluster 1
PRC1 6.80E-04 15 Cluster 1
RUNDC3B 0.00E+00 0 Unclustered
SPAG5 6.80E-04 15 Cluster 1
TGFBR2 0.00E+00 0 Unclustered
TK1 0.00E+00 14 Cluster 1
TOP2A 6.80E-04 15 Cluster 1
ZWINT 6.80E-04 15 Cluster 1
Table 3. STRING cluster bioactivity of 16 DEGs in the main network.
Term name Description FDR value Genes ratio Gene input name
CL:6604 Mixed, incl. Amplification of signal from the kinetochores, and Condensin complex 6.08E-18 12/93 KIF11, SPAG5, CENPA, CDC20, ZWINT, KIF4A, HMMR, PRC1, KIF20A, TOP2A, HJURP, NUSAP1.
CL:6596 Mixed, incl. Mitotic Spindle Checkpoint, and Mitotic sister chromatid segregation 6.11E-18 13/151 KIF11, MAD2L1, SPAG5, CENPA, CDC20, ZWINT, KIF4A, HMMR, PRC1, KIF20A, TOP2A, HJURP, NUSAP1.
CL:6608 Mixed, incl. Regulation of mitotic sister chromatid segregation, and Kinesin motor domain, conserved site 1.79E-14 9/51 KIF11, SPAG5, CDC20, KIF4A, HMMR, PRC1, KIF20A, TOP2A, NUSAP1.
CL:6610 Mixed, incl. Spindle elongation, and Polo-like kinase mediated events 4.76E-13 8/41 KIF11, SPAG5, KIF4A, HMMR, PRC1, KIF20A, TOP2A, NUSAP1.
CL:6619 Mixed, incl. Spindle elongation, and Outer kinetochore 2.74E-12 7/24 KIF11, KIF4A, HMMR, PRC1, KIF20A, TOP2A, NUSAP1.
CL:6620 Mixed, incl. Spindle elongation, and Axon hillock 1.66E-11 6/12 KIF11, KIF4A, HMMR, PRC1, TOP2A, NUSAP1.
*The gene ratio is the comparison of the number of input genes with known bioactivity to the total number of genes in the STRING cluster database with the same bioactivity.
Disclaimer/Publisher’s Note: The statements, opinions and data contained in all publications are solely those of the individual author(s) and contributor(s) and not of MDPI and/or the editor(s). MDPI and/or the editor(s) disclaim responsibility for any injury to people or property resulting from any ideas, methods, instructions or products referred to in the content.
Copyright: This open access article is published under a Creative Commons CC BY 4.0 license, which permit the free download, distribution, and reuse, provided that the author and preprint are cited in any reuse.
Prerpints.org logo

Preprints.org is a free preprint server supported by MDPI in Basel, Switzerland.

Subscribe

© 2024 MDPI (Basel, Switzerland) unless otherwise stated