Submitted:
08 July 2024
Posted:
09 July 2024
You are already at the latest version
Abstract
Keywords:
1. Introduction
| Differential expression/ Mutation | Cancers | Information on analyzed samples | Consequences | PubMed code | |
|---|---|---|---|---|---|
| Up-regulation | Glioma | Tissue from 22 patients with newly diagnosed GBM | [30] | ||
| Up-regulation | Glioma | A total of 50 glioma samples, ranging in grades from II to IV, were collected from a cohort of 35 male and 15 female patients. | Cells exhibiting enhanced migration potential displayed notably high levels of AQP4 expression, indicating a potential association between AQP4 and glioma cell migration. | [31] | |
| Up-regulation | Brain tumors | The study involved analyzing 5 tumor samples from subependymomas located in the fourth ventricle, as well as subependymoma (SE) tumor samples found supratentorial with relation to the first to the third ventricle. | Increased AQP4 expression in malignant tumors, suggesting their involvement in edema formation, invasive growth and recurrent tumor formation but do not have a significant role in benign tumors. | [32] | |
| AQP4 | Up-regulation | GBM | The tumour samples from 14 patients with primary glioblastomas | Increased expression of AQP4, loss of polarity and alteration of the intra and extracellular matrix were found in the analysis of GBM samples and are more serious clinical signs of glioblastoma and the formation of cerebral edema. | [33] |
| Up-regulation | Brain tumors/ GBM | Tissue samples from brain tumors of 26 patients | The evident role of AQP4 in tumor malignancy suggests that targeted manipulation of this protein could potentially unlock a therapeutic avenue. | [34] | |
| Up-regulation (AQP4-tetramer and AQP4-OAP) | Brain tumors/ GBM | Tumor tissues obtained from a total of 22 patients diagnosed with astrocytoma of WHO grades II, III, and IV, and an additional patient diagnosed with glioblastoma multiforme (GBM), were included in the study. | Upregulation of AQP4-tetramers and upregulation of mRNA -AQP4-OAPs in all astrocytomas, but the AQP4-OAPs / AQP4-tetramers ratio differed from 1.14 to 1.5 in low-grade astrocytomas to 1.94 in glioblastomas. The possible impact on the development of new therapies. | [31] | |
| Up-regulation | Brain tumors/ GBM | Brain tumors and the corresponding adjacent tissues from 30 patients diagnosed with glioblastoma. | The overexpression of AQP4 was observed in both brain tumors and the adjacent tissues, and this heightened expression was found to be correlated with the extent of brain edema. | [35] | |
| down-regulation | Brain tumors/ GBM | A total of 16 tissue samples were collected from various regions within the tumoral core. | The presence of AQP4 alterations in GBMs appears to play a role in edema formation. Therefore, AQP4 could be viewed as a promising early biomarker for tracking GBM progression and also as a potential target for AQP4 modulation in therapeutic approaches. | [36] | |
| KATP | |||||
| Up-regulation of ABCC8 | Glioma | The information is based on the analysis of 1893 human glioma samples from four independent databases | Glioma chemosensitivity can be predicted by high ABCC8 mRNA expression, whereas low ABCC8 mRNA expression can serve as an indicator of glioma sensitivity to radiotherapy. | [37] | |
| Up-regulation of ABCC8 | Brain tumors | The information comes from the analysis of human tissue samples from 6 glioblastoma, 12 brain metastases, 11 medulloblastoma, 9 supratentorial ependymomas, and 8 posterior fossa ependymomas | SUR1 is a potential therapeutic target for reducing neuroinflammation in adult and pediatric brain tumors. Inhibition of SUR1 induces neuronal stabilization in glioblastoma, brain metastases and posterior fossa ependymoma, and edema reduction in medulloblastoma. | [38] | |
| Up-regulation of KCNJ8 and ABCC8 | Glioma | 20 human glioma biopsies | The Kir6.2 and SUR1 subunits of the KATP channel are involved in the proliferation of U87 and U251 glioma cells. The KATP channel inhibitors significantly reduced the growth curve. On the other hand, KATP channel agonists promoted the proliferation of U87 and U251 cells. | [39] | |
| BK | Up-regulation of KCNMA1 | Glioma | Biopsies from patients with malignant gliomas | The expression of BK channels has shown a positive correlation with tumor malignancy grades, indicating a significant role for the gBK channel in glioma biology. Utilizing BK channel agonists could potentially be advantageous for brain tumor patients, as they might enhance the delivery of anti-neoplastic agents to brain tumors. | [40] |
| Up-regulation of KCNMA1 | Brain tumors | Samples tissues from patients with malignant gliomas | [41] |
2. Materials and Methods
2.1. Cell Lines
2.2. Constructs and Transfection
2.3. Drugs and Solutions
2.4. Antibodies
2.5. Nuclear Staining
2.6. Immunofluorescence and Quantitative Analysis
2.7. Morphologic Analysis
2.8. Cell Viability Assay
2.9. Patch-Clamp Experiments
2.10. Polymerase Chain Reaction
2.11. Statistical Analysis
3. Results
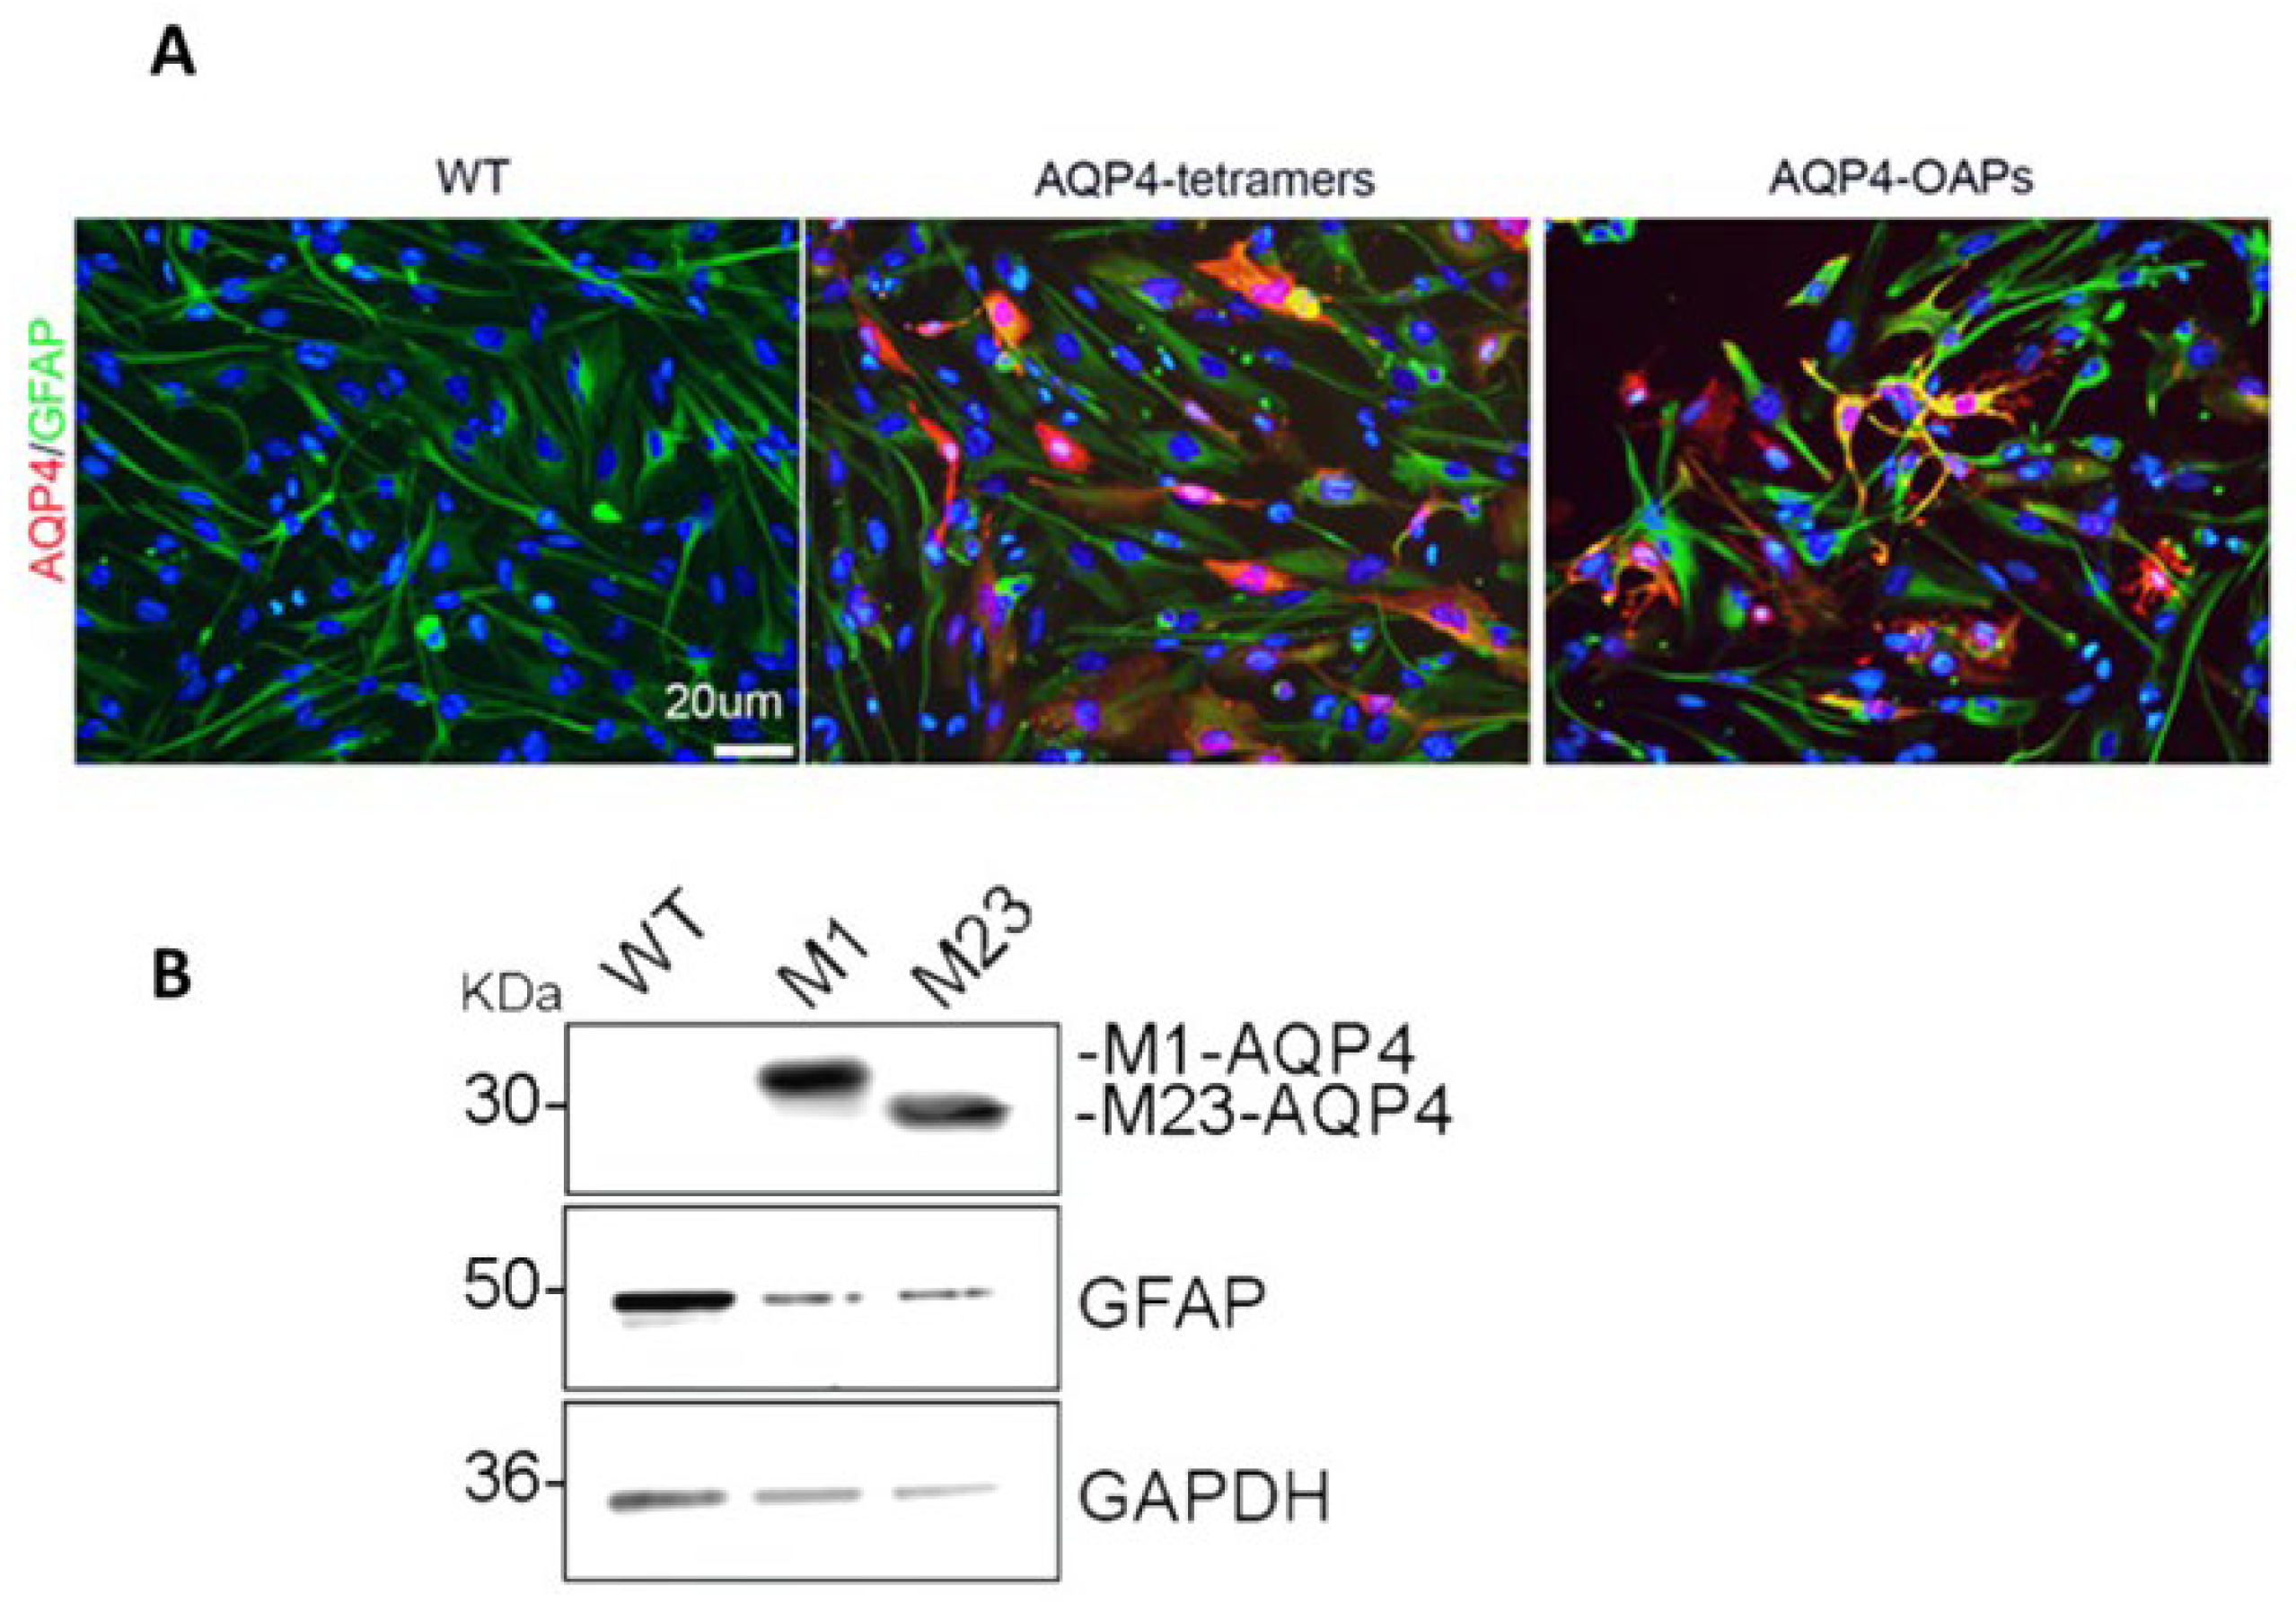
3.1. AQP4-OAP Expression in U87 Cells
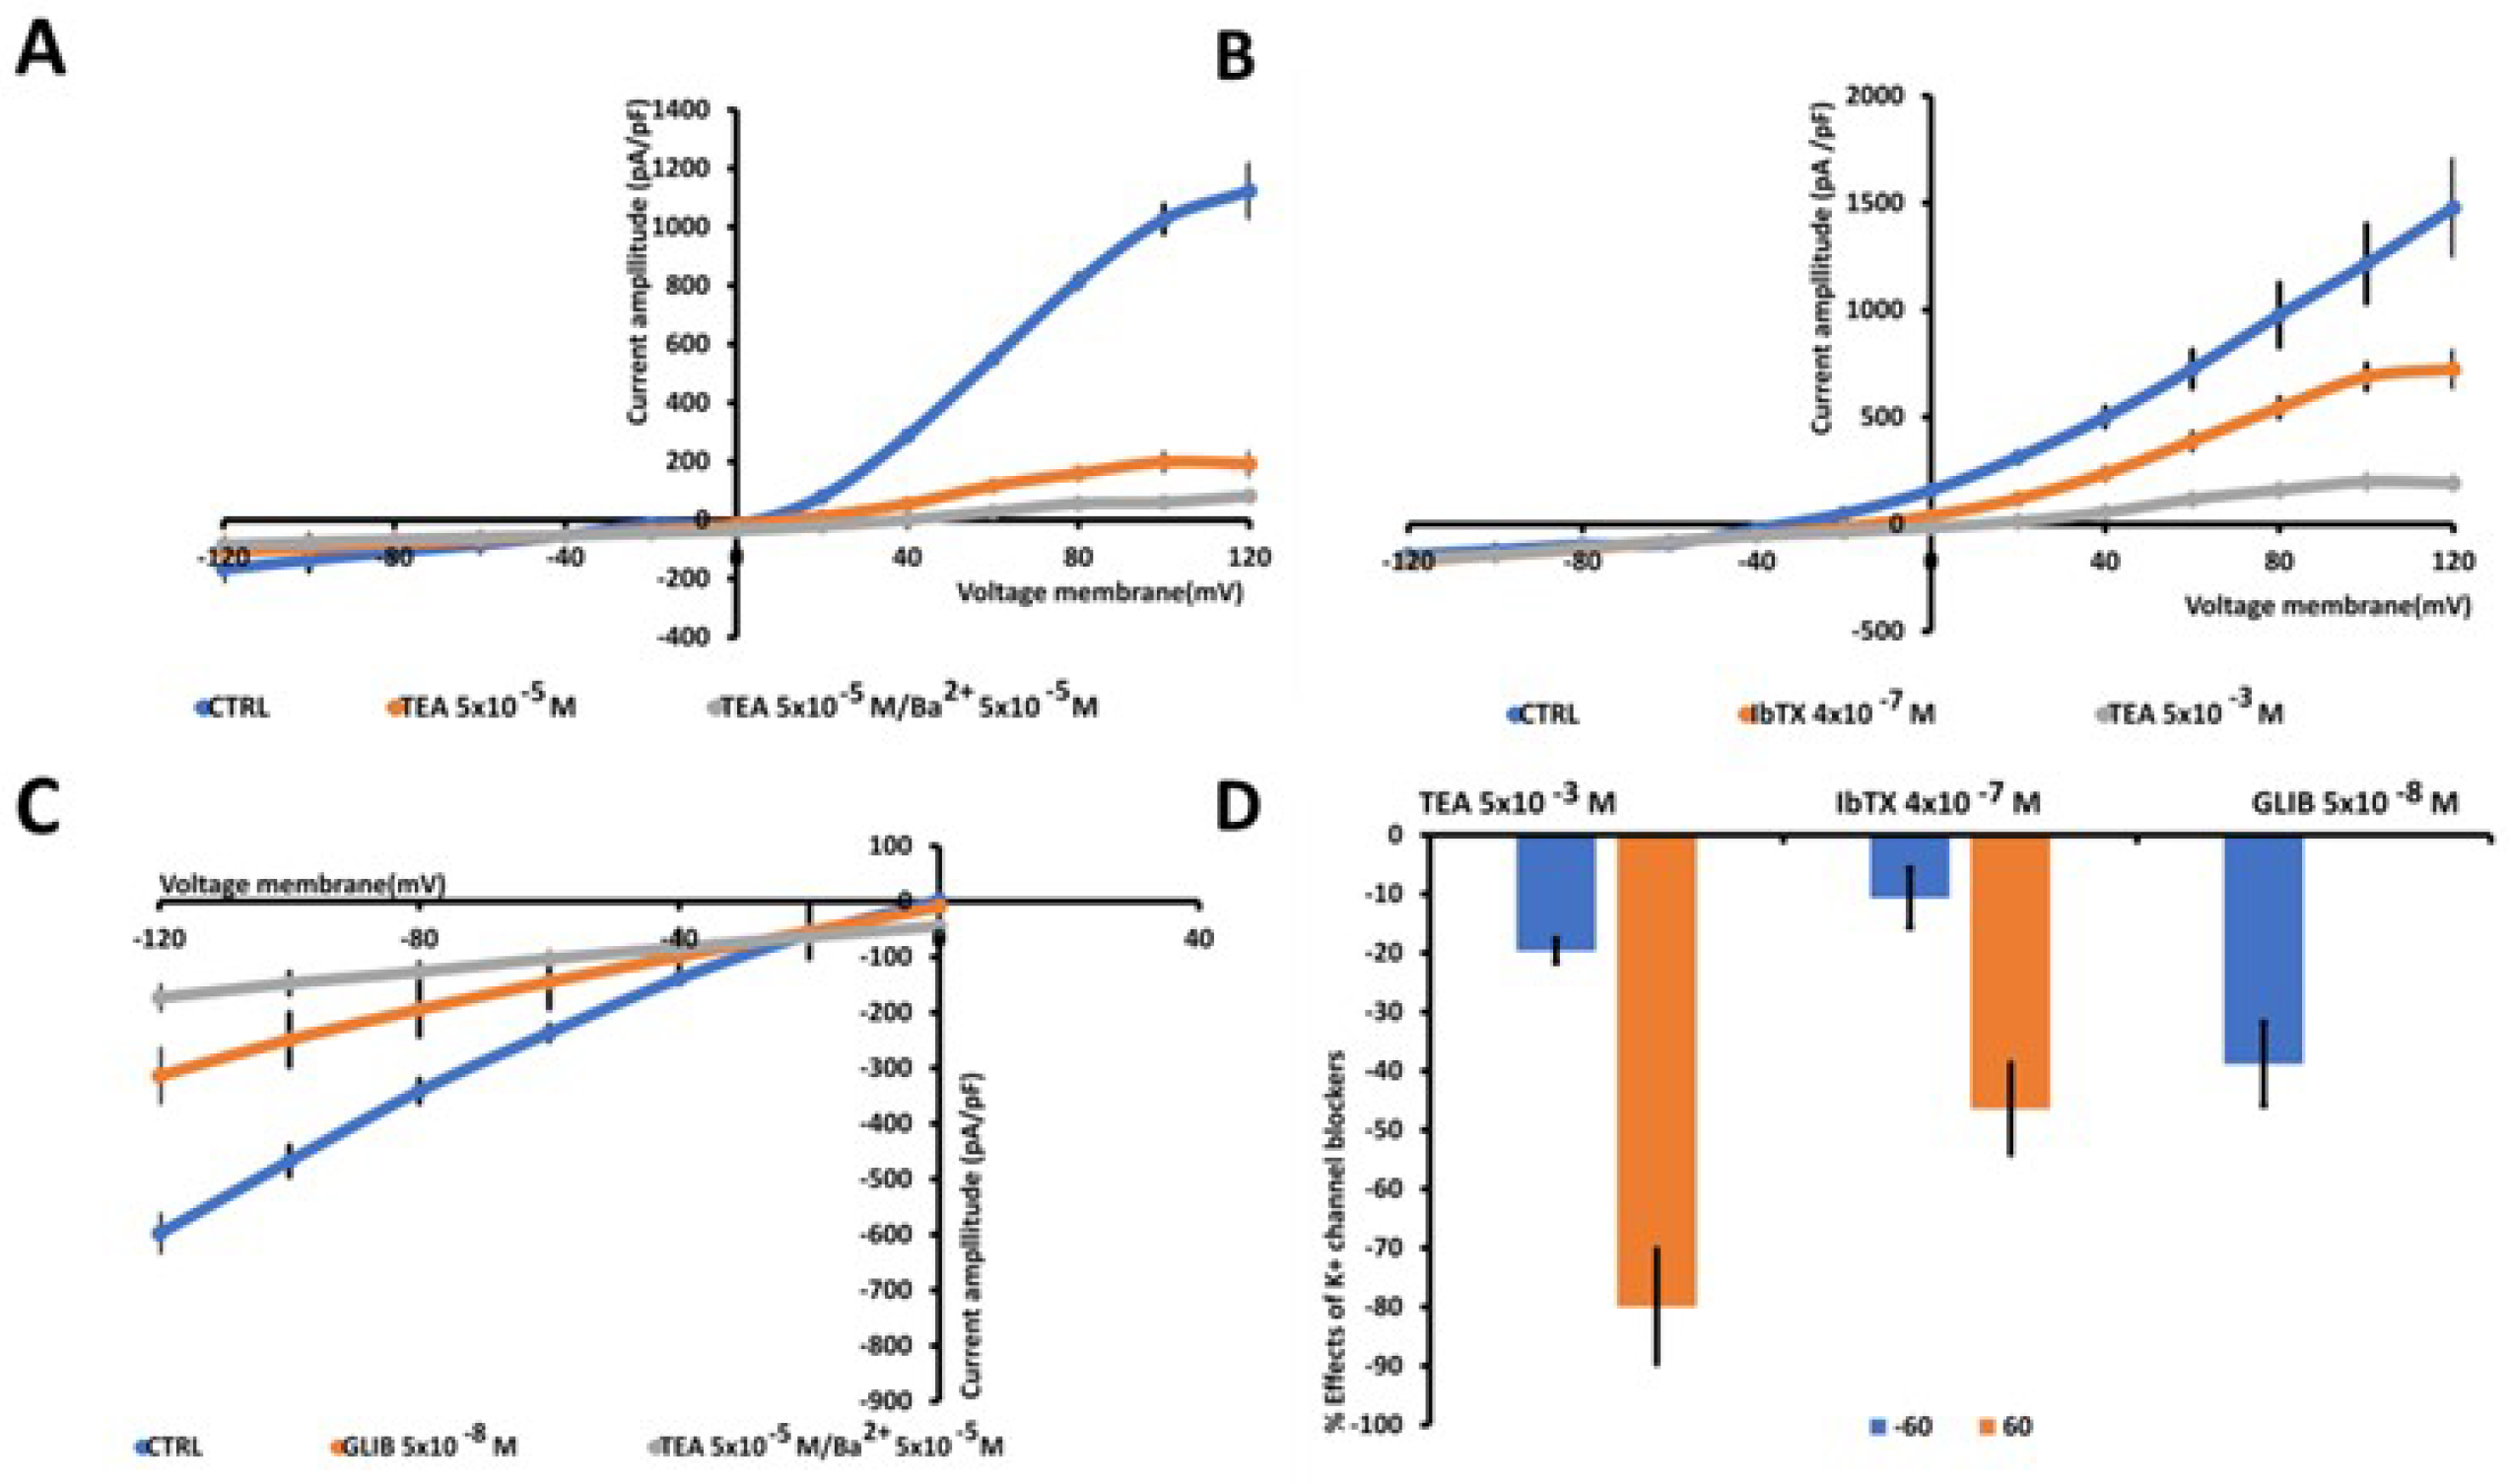
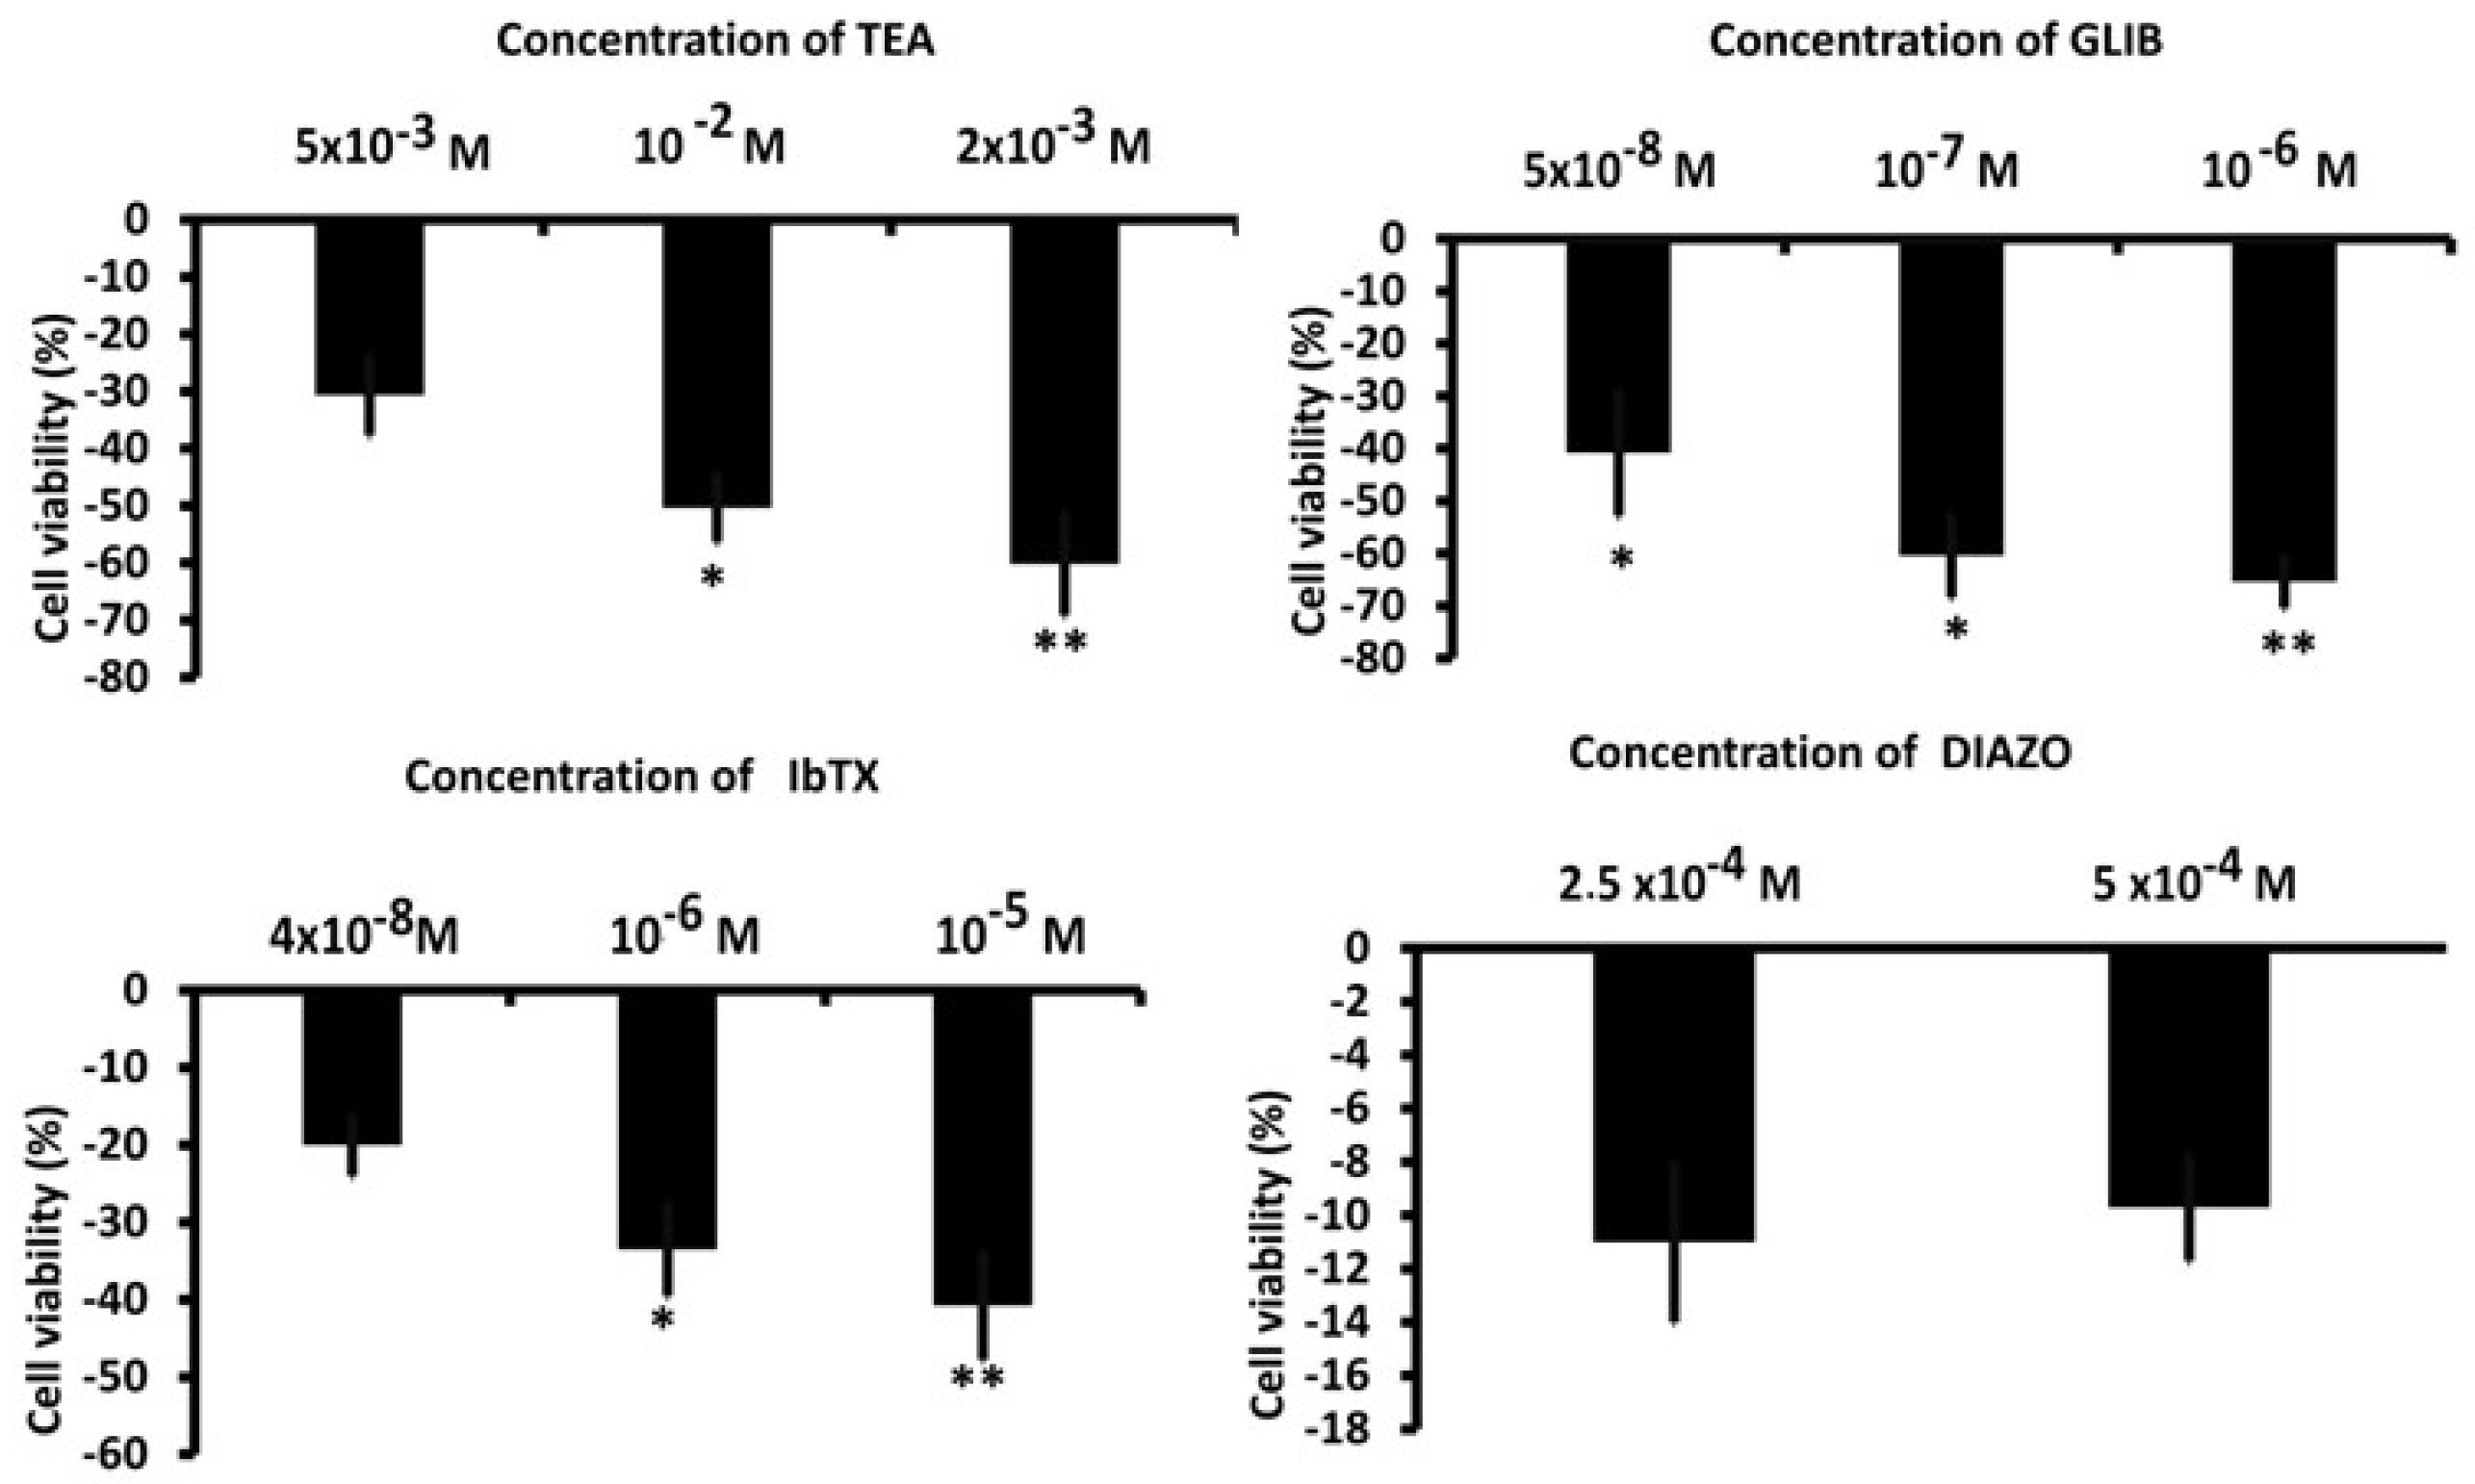
3.2. Whole-Cell Inward and Outward Macroscopic K+ Currents Recorded in U87WT Cells and Effects of the K+ Channel Modulators on Cell Proliferation
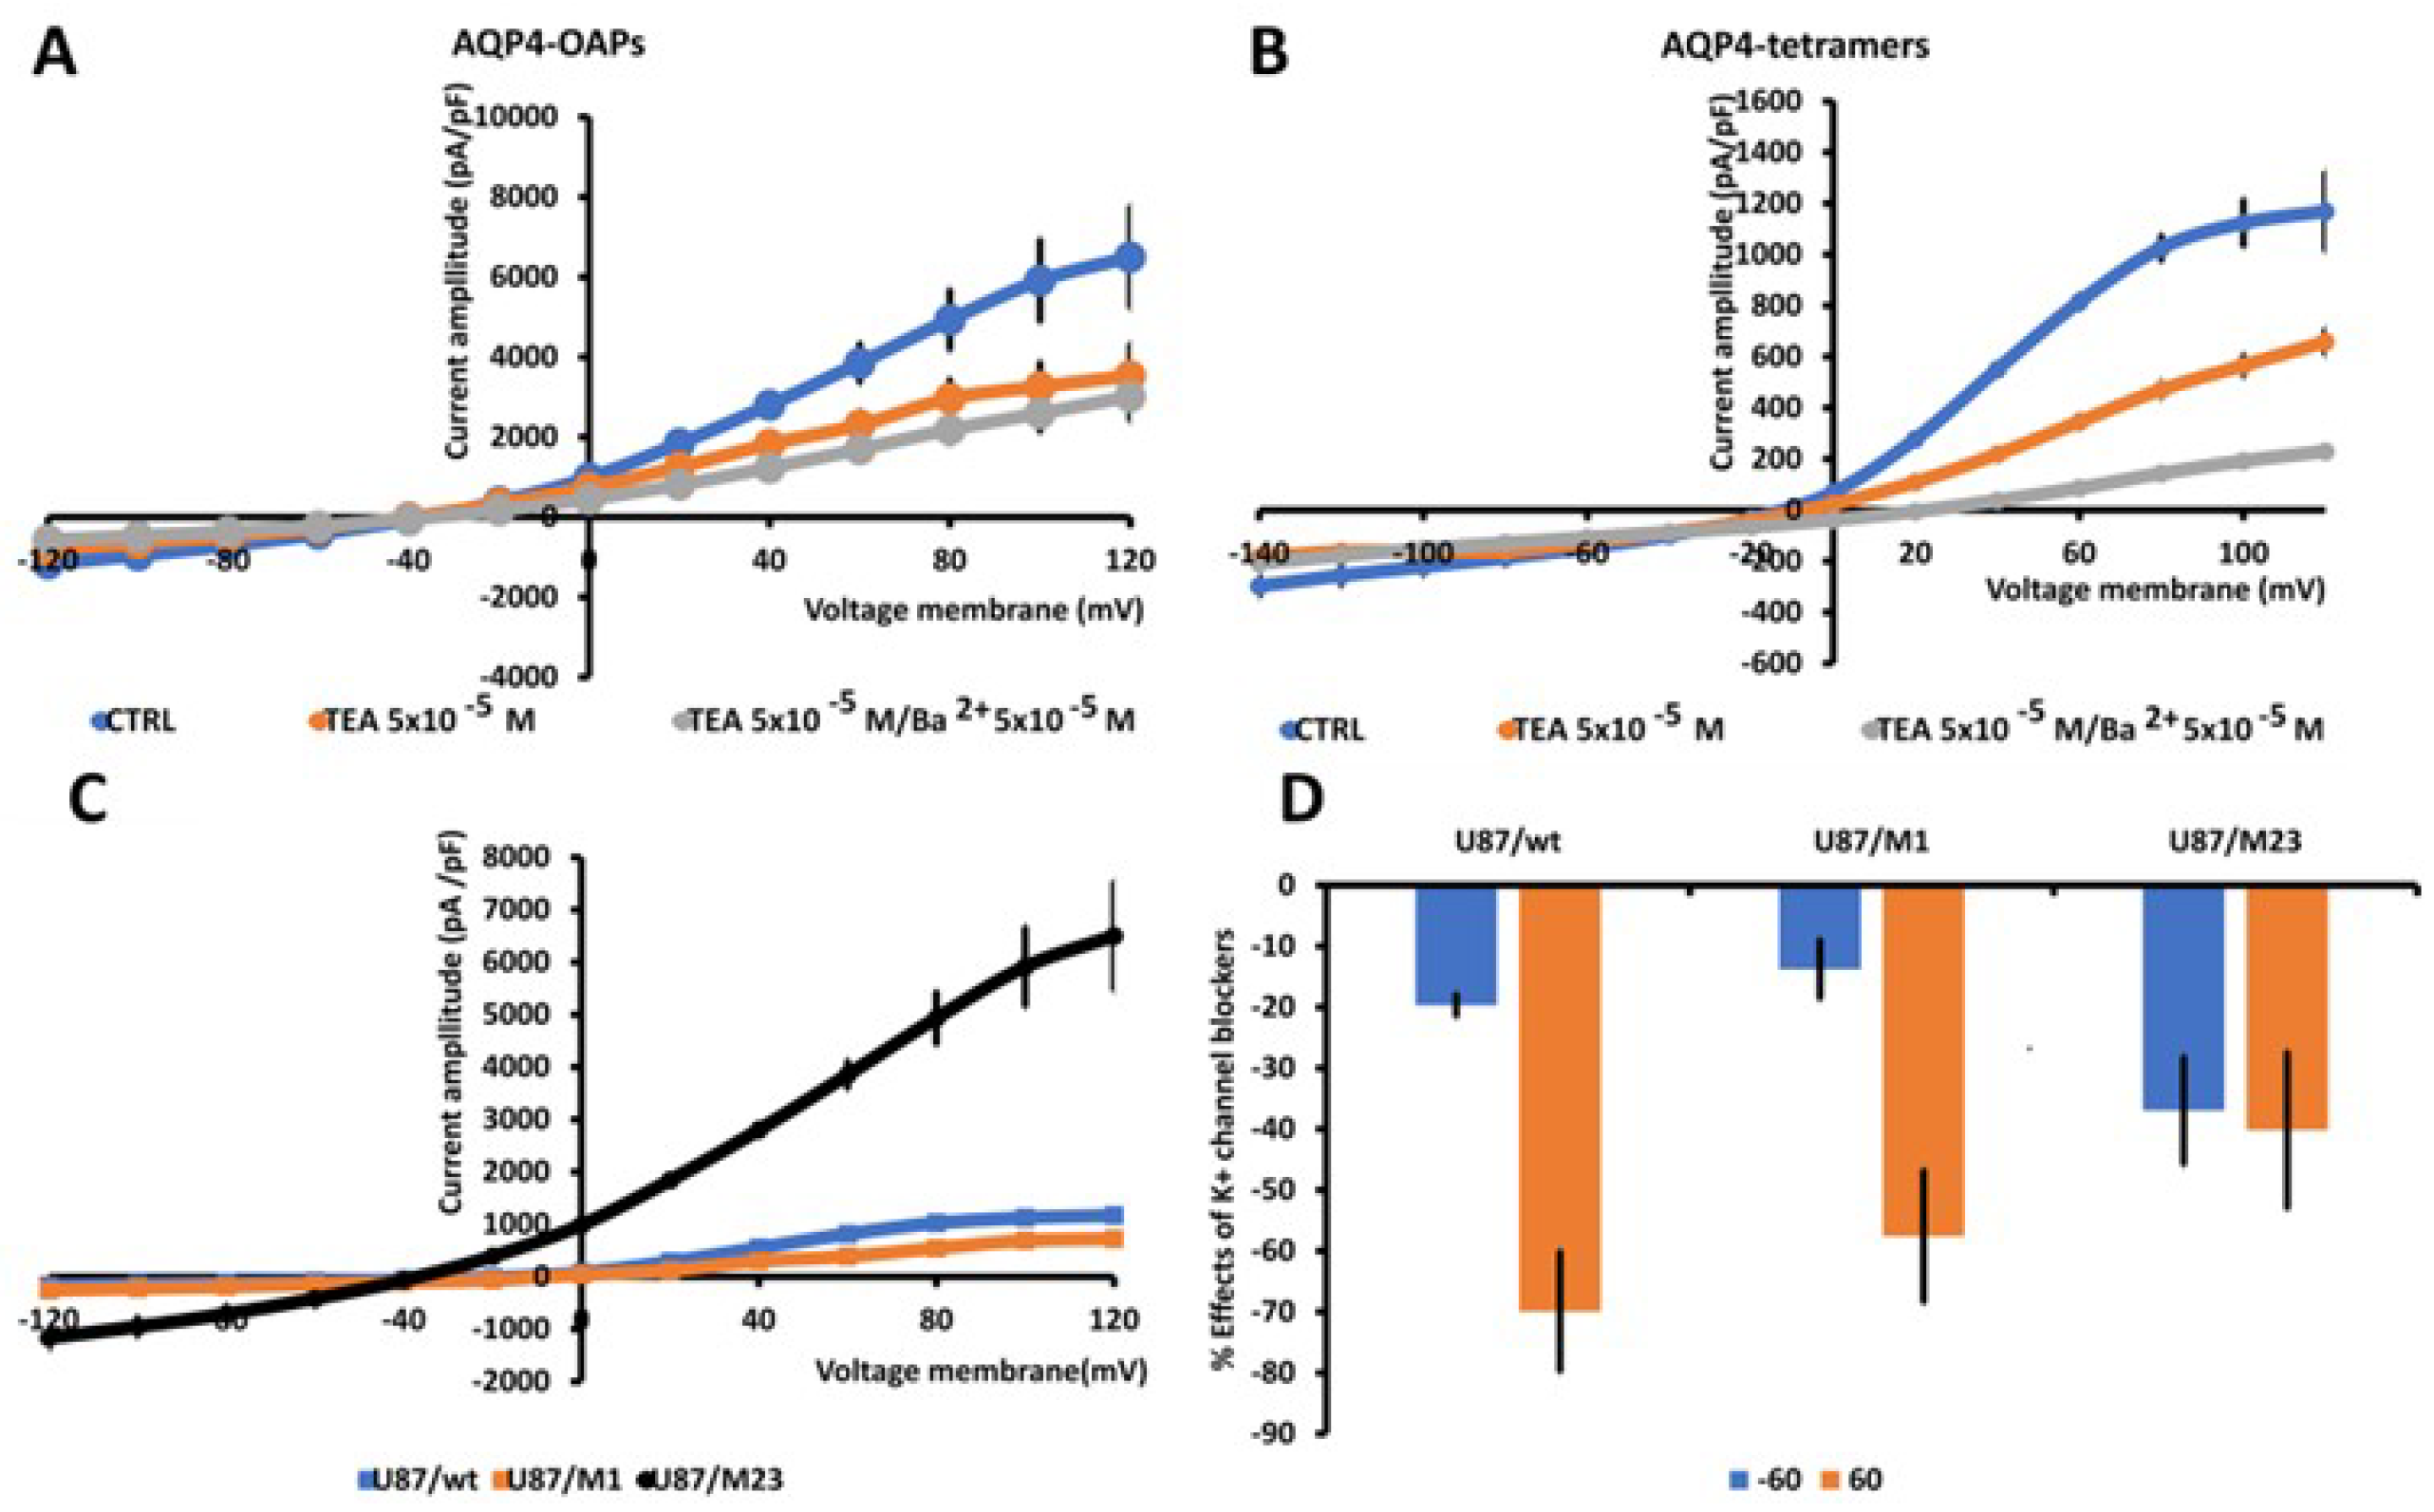
3.3. AQP4 Aggregation State Affects the TEA-K+ Sensitive Currents in U87 Glioma Cells
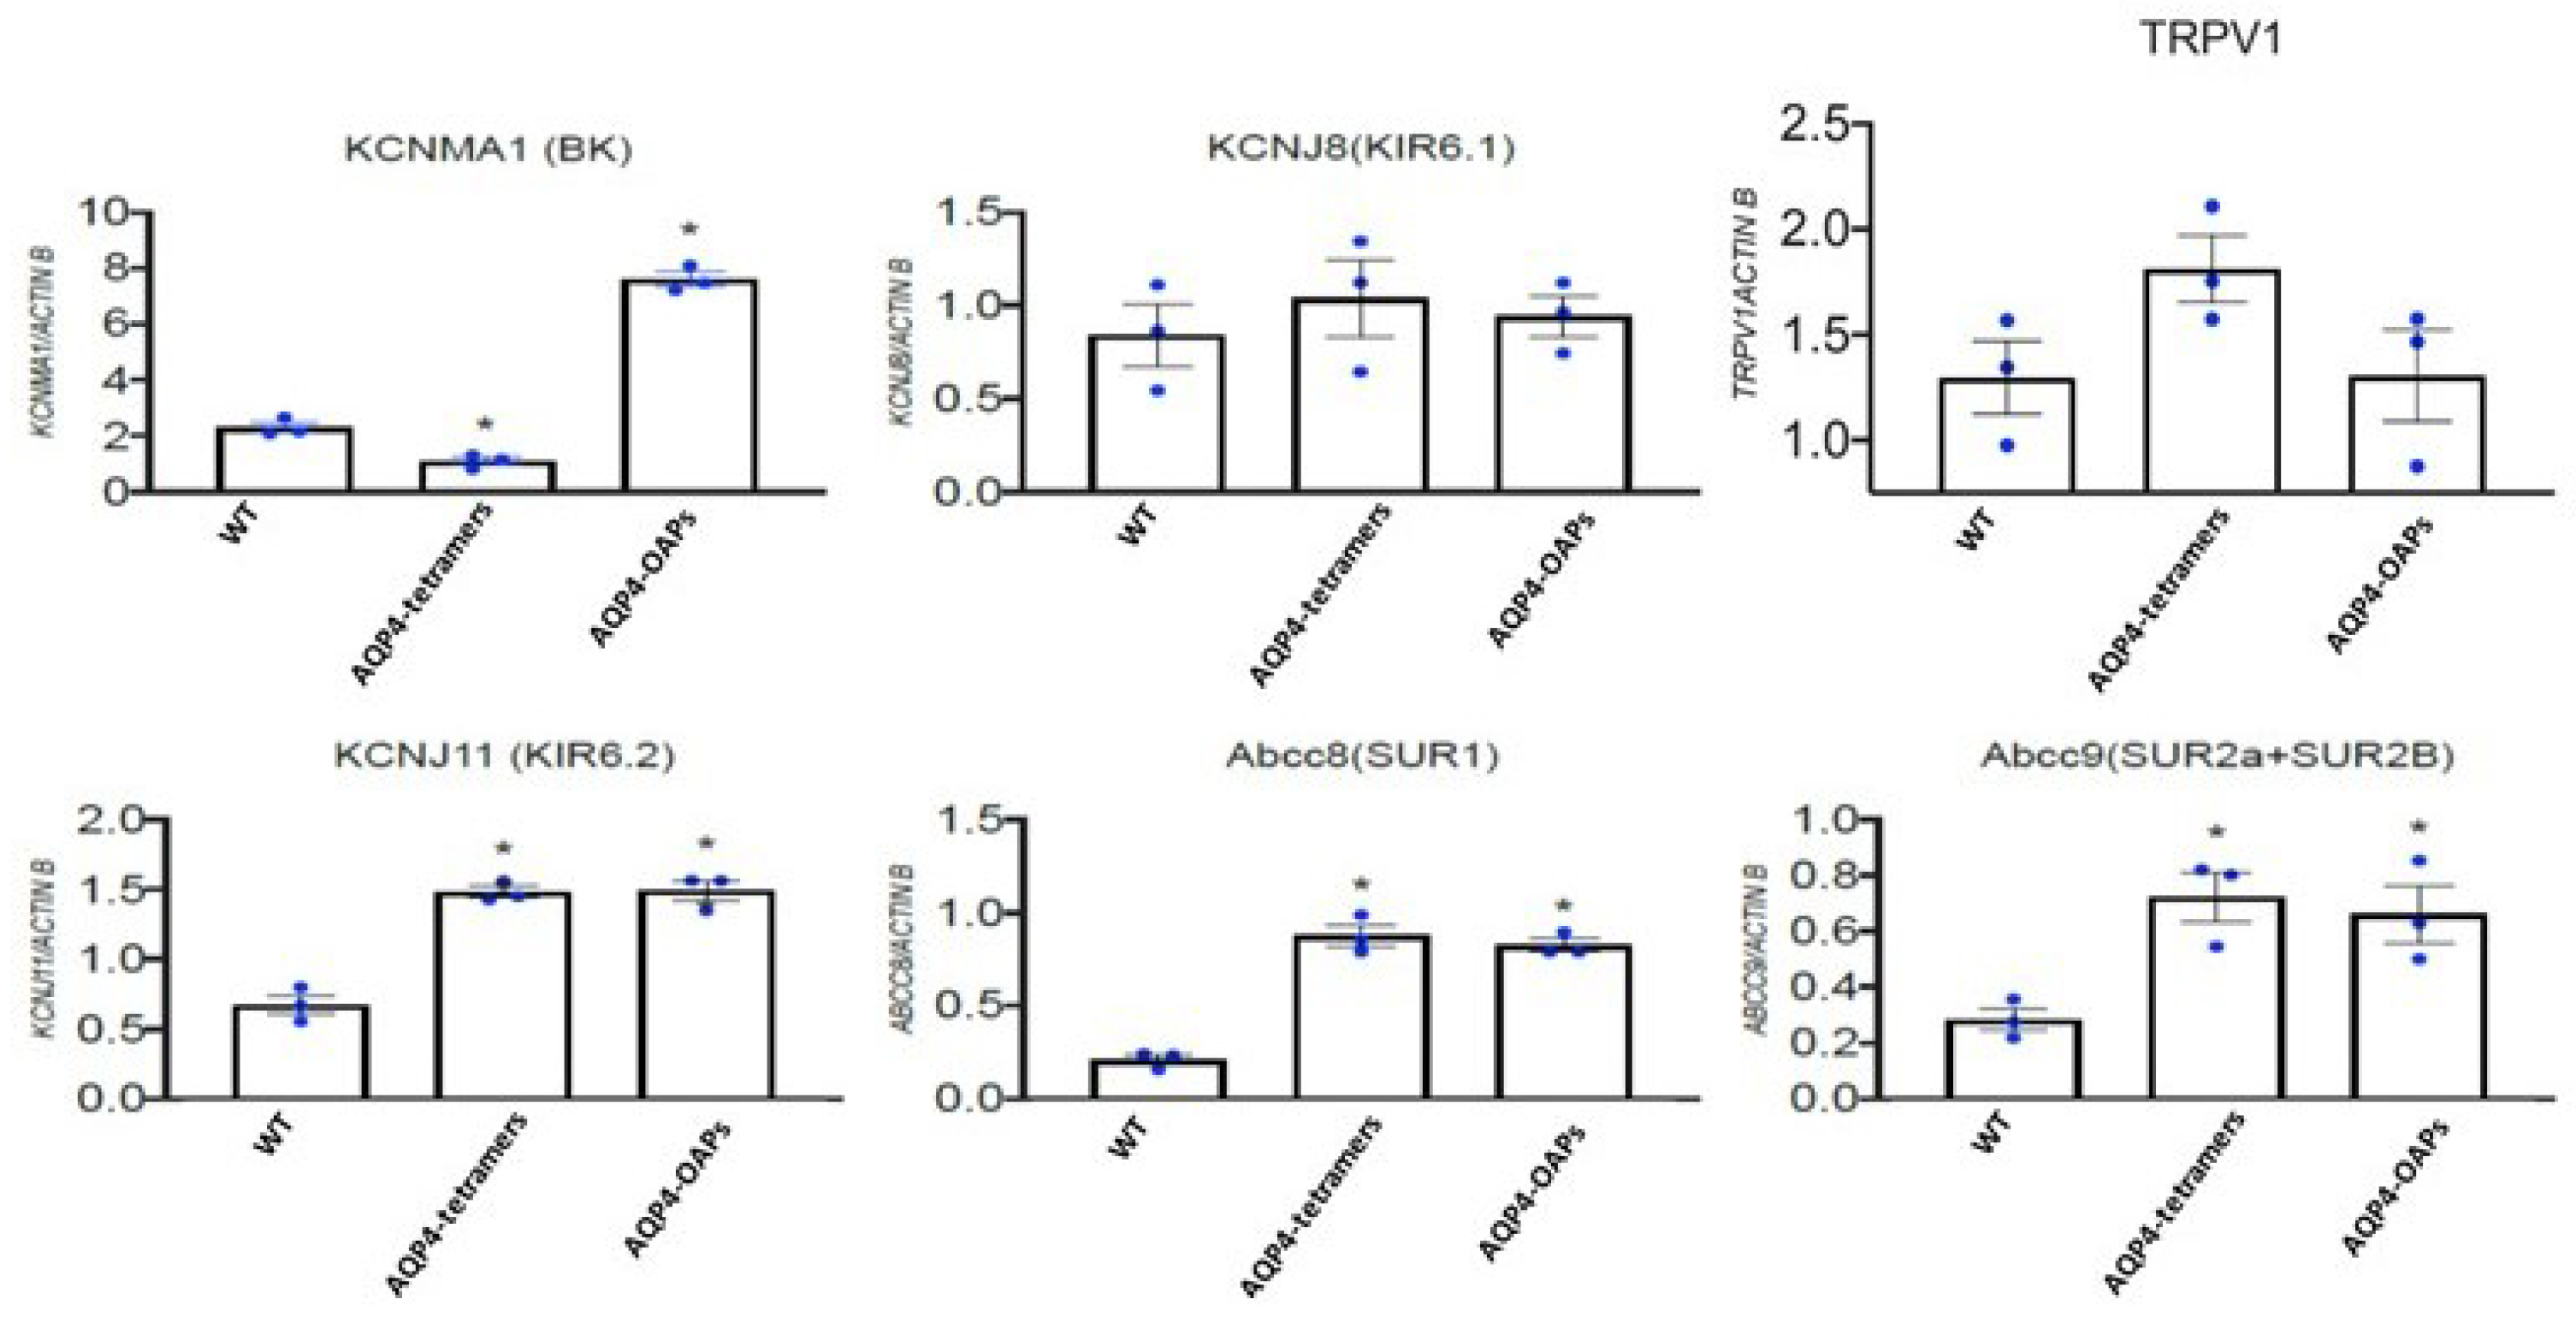
3.4. AQP4 Aggregation State Changes the Expression Profile of KCNMA1, KCNJ11, ABCC8 and ABCC9 Genes in U87 Glioma Cells
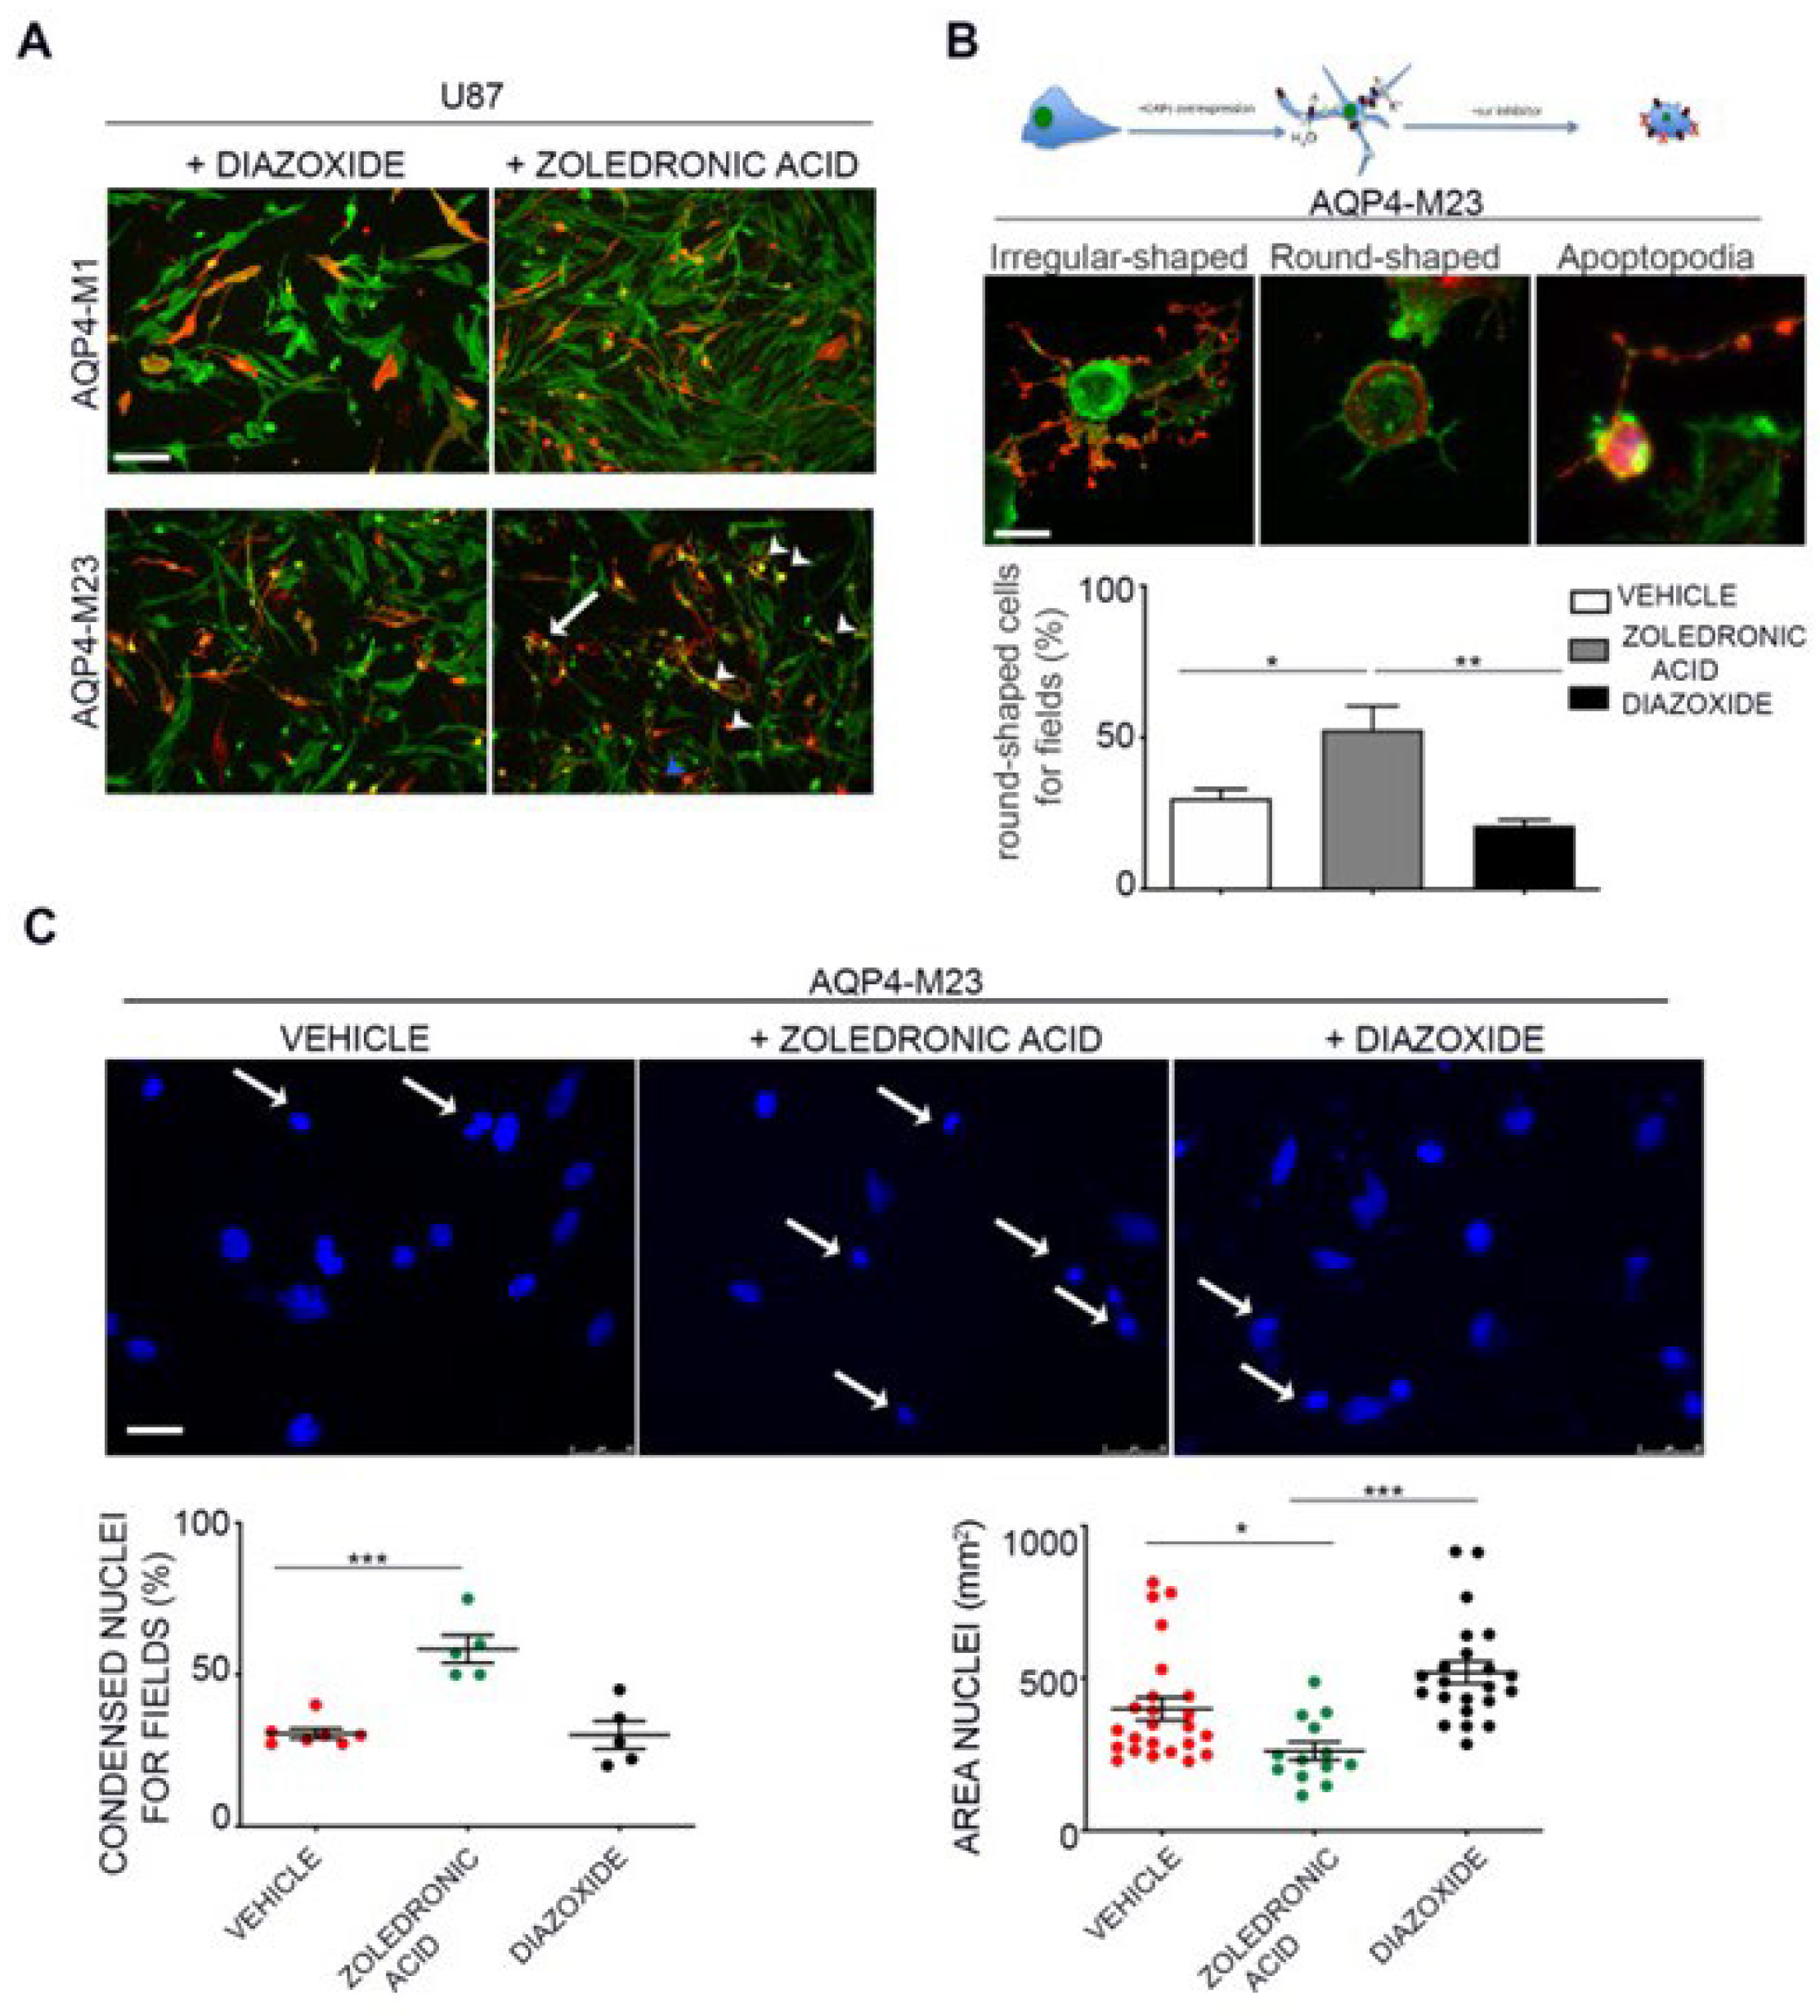
3.5. AQP4 and Kir6.2 are Involved in Glioma Apoptotic Fate
4. Discussion
5. Conclusions
6. Patents
Supplementary Materials
Author Contributions
Funding
Institutional Review Board Statement
Informed Consent Statement
Data Availability Statement
Acknowledgments
Conflicts of Interest
References
- A. Wawrzkiewicz-Jałowiecka, P. Trybek, B. Dworakowska, and Ł. Machura, “Multifractal Properties of BK Channel Currents in Human Glioblastoma Cells.,” J. Phys. Chem. B, vol. 124, no. 12, pp. 2382–2391, Mar. 2020. [CrossRef]
- K. Aldape et al., “Challenges to curing primary brain tumours.,” Nat. Rev. Clin. Oncol., vol. 16, no. 8, pp. 509–520, Aug. 2019. [CrossRef]
- L. Catacuzzeno, L. Sforna, V. Esposito, C. Limatola, and F. Franciolini, “Ion Channels in Glioma Malignancy BT - Transportome Malfunction in the Cancer Spectrum: Ion Transport in Tumor Biology,” C. Stock and L. A. Pardo, Eds. Cham: Springer International Publishing, 2021, pp. 223–267.
- A. Varricchio, S. A. Ramesh, and A. J. Yool, “Novel Ion Channel Targets and Drug Delivery Tools for Controlling Glioblastoma Cell Invasiveness,” International Journal of Molecular Sciences, vol. 22, no. 21. 2021. [CrossRef]
- M. C. Papadopoulos and S. Saadoun, “Key roles of aquaporins in tumor biology,” Biochim. Biophys. Acta - Biomembr., vol. 1848, no. 10, Part B, pp. 2576–2583, 2015. [CrossRef]
- J. Xia et al., “Ion channels or aquaporins as novel molecular targets in gastric cancer.,” Mol. Cancer, vol. 16, no. 1, p. 54, Mar. 2017. [CrossRef]
- S. F. Pedersen and C. Stock, “Ion channels and transporters in cancer: pathophysiology, regulation, and clinical potential.,” Cancer research, vol. 73, no. 6. United States, pp. 1658–1661, Mar. 2013. [CrossRef]
- K. L. Black et al., “Different effects of KCa and KATP agonists on brain tumor permeability between syngeneic and allogeneic rat models.,” Brain Res., vol. 1227, pp. 198–206, Aug. 2008. [CrossRef]
- N. S. Ningaraj, U. T. Sankpal, D. Khaitan, E. A. Meister, and T. Vats, “Activation of KATP channels increases anticancer drug delivery to brain tumors and survival.,” Eur. J. Pharmacol., vol. 602, no. 2–3, pp. 188–193, Jan. 2009. [CrossRef]
- R. E. Day et al., “Human aquaporins: regulators of transcellular water flow.,” Biochim. Biophys. Acta, vol. 1840, no. 5, pp. 1492–1506, May 2014. [CrossRef]
- F. Lang et al., “Functional significance of cell volume regulatory mechanisms.,” Physiol. Rev., vol. 78, no. 1, pp. 247–306, Jan. 1998. [CrossRef]
- E. A. Nagelhus, T. M. Mathiisen, and O. P. Ottersen, “Aquaporin-4 in the central nervous system: cellular and subcellular distribution and coexpression with KIR4.1.,” Neuroscience, vol. 129, no. 4, pp. 905–913, 2004. [CrossRef]
- L. Simone et al., “AQP4 Aggregation State Is a Determinant for Glioma Cell Fate,” Cancer Res., vol. 79, no. 9, pp. 2182–2194, May 2019. [CrossRef]
- M. Amiry-Moghaddam et al., “An alpha-syntrophin-dependent pool of AQP4 in astroglial end-feet confers bidirectional water flow between blood and brain.,” Proc. Natl. Acad. Sci. U. S. A., vol. 100, no. 4, pp. 2106–2111, Feb. 2003. [CrossRef]
- C. Palazzo et al., “AQP4ex is crucial for the anchoring of AQP4 at the astrocyte end-feet and for neuromyelitis optica antibody binding.,” Acta Neuropathol. Commun., vol. 7, no. 1, p. 51, Apr. 2019. [CrossRef]
- M. De Bellis et al., “Translational readthrough generates new astrocyte AQP4 isoforms that modulate supramolecular clustering, glial endfeet localization, and water transport.,” Glia, vol. 65, no. 5, pp. 790–803, May 2017. [CrossRef]
- H. Wolburg, S. Noell, P. Fallier-Becker, A. F. Mack, and K. Wolburg-Buchholz, “The disturbed blood-brain barrier in human glioblastoma.,” Mol. Aspects Med., vol. 33, no. 5–6, pp. 579–589, 2012. [CrossRef]
- F. Maqoud et al., “Cell Cycle Regulation by Ca (2+)-Activated K(+) (BK) Channels Modulators in SH-SY5Y Neuroblastoma Cells.,” Int. J. Mol. Sci., vol. 19, no. 8, Aug. 2018. [CrossRef]
- T. Ding et al., “Role of aquaporin-4 in the regulation of migration and invasion of human glioma cells.,” Int. J. Oncol., vol. 38, no. 6, pp. 1521–1531, Jun. 2011. [CrossRef]
- T. Ding et al., “Knockdown a water channel protein, aquaporin 4, induced glioblastoma cell apoptosis.,” PLoS One, vol. 8, no. 8, p. e66751, 2013. [CrossRef]
- P. Fallier-Becker, M. Nieser, U. Wenzel, R. Ritz, and S. Noell, “Is Upregulation of Aquaporin 4-M1 Isoform Responsible for the Loss of Typical Orthogonal Arrays of Particles in Astrocytomas?,” Int. J. Mol. Sci., vol. 17, no. 8, Jul. 2016. [CrossRef]
- L. Simone et al., “AQP4-dependent glioma cell features affect the phenotype of surrounding cells via extracellular vesicles,” Cell Biosci., vol. 12, no. 1, p. 150, 2022. [CrossRef]
- L. Zúñiga, A. Cayo, W. González, C. Vilos, and R. Zúñiga, “Potassium Channels as a Target for Cancer Therapy: Current Perspectives.,” OncoTargets and Therapy, vol. 15. pp. 783–797, 2022. [CrossRef]
- E. Bates, “Ion channels in development and cancer.,” Annu. Rev. Cell Dev. Biol., vol. 31, pp. 231–247, 2015. [CrossRef]
- F. Maqoud, R. Scala, M. Hoxha, B. Zappacosta, and D. Tricarico, “ATP-sensitive Potassium Channel Subunits in Neuroinflammation: Novel Drug Targets in Neurodegenerative Disorders.,” CNS Neurol. Disord. Drug Targets, vol. 21, no. 2, pp. 130–149, 2022. [CrossRef]
- J. S. Amberger and A. Hamosh, “Searching Online Mendelian Inheritance in Man (OMIM): A Knowledgebase of Human Genes and Genetic Phenotypes.,” Curr. Protoc. Bioinforma., vol. 58, pp. 1.2.1-1.2.12, Jun. 2017. [CrossRef]
- X. Huang and L. Y. Jan, “Targeting potassium channels in cancer.,” J. Cell Biol., vol. 206, no. 2, pp. 151–162, Jul. 2014. [CrossRef]
- H. Ouadid-Ahidouch and A. Ahidouch, “K+ channel expression in human breast cancer cells: involvement in cell cycle regulation and carcinogenesis.,” J. Membr. Biol., vol. 221, no. 1, pp. 1–6, Jan. 2008. [CrossRef]
- Z. Wang, “Roles of K+ channels in regulating tumour cell proliferation and apoptosis.,” Pflugers Arch., vol. 448, no. 3, pp. 274–286, Jun. 2004. [CrossRef]
- M. Levy et al., “Aquaporin-4 Expression Patterns in Glioblastoma Pre-Chemoradiation and at Time of Suspected Progression.,” Cancer Invest., vol. 37, no. 2, pp. 67–72, 2019. [CrossRef]
- W.-J. Zhao, W. Zhang, G.-L. Li, Y. Cui, Z.-F. Shi, and F. Yuan, “Differential expression of MMP-9 and AQP4 in human glioma samples.,” Folia Neuropathol., vol. 50, no. 2, pp. 176–186, 2012.
- S. Noell, P. Fallier-Becker, A. F. Mack, M. Hoffmeister, R. Beschorner, and R. Ritz, “Water Channels Aquaporin 4 and -1 Expression in Subependymoma Depends on the Localization of the Tumors.,” PLoS One, vol. 10, no. 6, p. e0131367, 2015. [CrossRef]
- S. Noell et al., “Dynamics of expression patterns of AQP4, dystroglycan, agrin and matrix metalloproteinases in human glioblastoma.,” Cell Tissue Res., vol. 347, no. 2, pp. 429–441, Feb. 2012. [CrossRef]
- E. J. Suero Molina et al., “Aquaporin-4 in glioma and metastatic tissues harboring 5-aminolevulinic acid-induced porphyrin fluorescence.,” Clin. Neurol. Neurosurg., vol. 115, no. 10, pp. 2075–2081, Oct. 2013. [CrossRef]
- K.-J. Mou et al., “[AQP4 expression in the brains of patients with glioblastoma and its association with brain edema].,” Sichuan da xue xue bao. Yi xue ban = J. Sichuan Univ. Med. Sci. Ed., vol. 40, no. 4, pp. 651–654, Jul. 2009.
- O. Valente et al., “Alteration of the translational readthrough isoform AQP4ex induces redistribution and downregulation of AQP4 in human glioblastoma.,” Cell. Mol. Life Sci., vol. 79, no. 3, p. 140, Feb. 2022. [CrossRef]
- K. Zhou et al., “ABCC8 mRNA expression is an independent prognostic factor for glioma and can predict chemosensitivity,” Sci. Rep., vol. 10, no. 1, p. 12682, 2020. [CrossRef]
- A. Trapani et al., “A novel injectable formulation of 6-fluoro-l-DOPA imaging agent for diagnosis of neuroendocrine tumors and Parkinson’s disease.,” Int. J. Pharm., vol. 519, no. 1–2, pp. 304–313, Mar. 2017. [CrossRef]
- L. Huang, B. Li, W. Li, H. Guo, and F. Zou, “ATP-sensitive potassium channels control glioma cells proliferation by regulating ERK activity,” Carcinogenesis, vol. 30, no. 5, pp. 737–744, May 2009. [CrossRef]
- X. Liu, Y. Chang, P. H. Reinhart, H. Sontheimer, and Y. Chang, “Cloning and characterization of glioma BK, a novel BK channel isoform highly expressed in human glioma cells.,” J. Neurosci. Off. J. Soc. Neurosci., vol. 22, no. 5, pp. 1840–1849, Mar. 2002. [CrossRef]
- N. S. Ningaraj, U. T. Sankpal, D. Khaitan, E. A. Meister, and T. S. Vats, “Modulation of KCa channels increases anticancer drug delivery to brain tumors and prolongs survival in xenograft model,” Cancer Biol. Ther., vol. 8, no. 20, pp. 1924–1933, 2009. [CrossRef]
- R. Zhang et al., “Different sulfonylureas induce the apoptosis of proximal tubular epithelial cell differently via closing K(ATP) channel.,” Mol. Med., vol. 24, no. 1, p. 47, Sep. 2018. [CrossRef]
- J. H. Han, O. S. Kwon, J. H. Chung, K. H. Cho, H. C. Eun, and K. H. Kim, “Effect of minoxidil on proliferation and apoptosis in dermal papilla cells of human hair follicle.,” J. Dermatol. Sci., vol. 34, no. 2, pp. 91–98, Apr. 2004. [CrossRef]
- R. Scala et al., “Zoledronic Acid Blocks Overactive Kir6.1/SUR2-Dependent K(ATP) Channels in Skeletal Muscle and Osteoblasts in a Murine Model of Cantú Syndrome.,” Cells, vol. 12, no. 6, Mar. 2023. [CrossRef]
- R. Scala et al., “Consequences of SUR2[A478V] Mutation in Skeletal Muscle of Murine Model of Cantu Syndrome.,” Cells, vol. 10, no. 7, Jul. 2021. [CrossRef]
- D. Tricarico, M. Barbieri, L. Antonio, P. Tortorella, F. Loiodice, and D. C. Camerino, “Dualistic actions of cromakalim and new potent 2H-1,4-benzoxazine derivatives on the native skeletal muscle K ATP channel.,” Br. J. Pharmacol., vol. 139, no. 2, pp. 255–262, May 2003. [CrossRef]
- F. Maqoud et al., “Zoledronic Acid as a Novel Dual Blocker of KIR6.1 / 2-SUR2 Subunits of ATP-Sensitive K + Channels: Role in the Adverse Drug Reactions,” pp. 1–17, 2021.
- Y.-G. Ma et al., “Activation of BKCa Channels in Zoledronic Acid-Induced Apoptosis of MDA-MB-231 Breast Cancer Cells,” PLoS One, vol. 7, no. 5, p. e37451, May 2012, [online]. Available: . [CrossRef]
- R. Scala et al., “Zoledronic Acid Modulation of TRPV1 Channel Currents in Osteoblast Cell Line and Native Rat and Mouse Bone Marrow-Derived Osteoblasts: Cell Proliferation and Mineralization Effect.,” Cancers (Basel)., vol. 11, no. 2, Feb. 2019. [CrossRef]
- T. J. Polascik and V. Mouraviev, “Zoledronic acid in the management of metastatic bone disease.,” Ther. Clin. Risk Manag., vol. 4, no. 1, pp. 261–268, Feb. 2008. [CrossRef]
- S. Pozzi and N. Raje, “The role of bisphosphonates in multiple myeloma: mechanisms, side effects, and the future.,” Oncologist, vol. 16, no. 5, pp. 651–662, 2011. [CrossRef]
- J. A. N. PONTÉN and E. H. MACINTYRE, “LONG TERM CULTURE OF NORMAL AND NEOPLASTIC HUMAN GLIA,” Acta Pathol. Microbiol. Scand., vol. 74, no. 4, pp. 465–486, Sep. 1968. [CrossRef]
- D. Tricarico et al., “Structural nucleotide analogs are potent activators/inhibitors of pancreatic beta cell KATP channels: an emerging mechanism supporting their use as antidiabetic drugs.,” J. Pharmacol. Exp. Ther., vol. 340, no. 2, pp. 266–276, Feb. 2012. [CrossRef]
- R. Scala et al., “Bisphosphonates Targeting Ion Channels and Musculoskeletal Effects.,” Front. Pharmacol., vol. 13, p. 837534, 2022. [CrossRef]
- R. Scala et al., “Pathophysiological Consequences of KATP Channel Overactivity and Pharmacological Response to Glibenclamide in Skeletal Muscle of a Murine Model of Cantù Syndrome,” Frontiers in Pharmacology , vol. 11. 2020, [Online]. Available: https://www.frontiersin.org/articles/10.3389/fphar.2020.604885.
- N. Zizzo et al., “Thymidine Phosphorylase Expression and Microvascular Density Correlation Analysis in Canine Mammary Tumor: Possible Prognostic Factor in Breast Cancer.,” Front. Vet. Sci., vol. 6, p. 368, 2019. [CrossRef]
- F. Maqoud et al., “Immunohistochemical, pharmacovigilance, and omics analyses reveal the involvement of ATP-sensitive K+ channel subunits in cancers: role in drug–disease interactions,” Frontiers in Pharmacology, vol. 14. 2023, [Online]. Available: https://www.frontiersin.org/articles/10.3389/fphar.2023.1115543.
- F. Maqoud, E. Vacca, and M. Tommaseo-Ponzetta, “From Morocco to Italy: How Women’s Bodies Reflect their Change of Residence.,” Coll. Antropol., vol. 40, no. 1, pp. 9–15, Apr. 2016.
- E. McCoy and H. Sontheimer, “Expression and function of water channels (aquaporins) in migrating malignant astrocytes.,” Glia, vol. 55, no. 10, pp. 1034–1043, Aug. 2007. [CrossRef]
- C. J. Lingle, P. L. Martinez-Espinosa, A. Yang-Hood, L. E. Boero, S. Payne, and D. Persic, et al.,"LRRC52 regulates BK channel function and localization in mouse cochlear inner hair cells", Proc Natl Acad Sci U S A., vol. 10, 116(37) pp. 18397-18403, Sept. 2019. Epub 2019 Aug 26. [CrossRef]
- S. R. Malwal et al., “Bisphosphonate-Generated ATP-Analogs Inhibit Cell Signaling Pathways,” J. Am. Chem. Soc., 2018. [CrossRef]
- L. Abdul Kadir, M. Stacey, and R. Barrett-Jolley, “Emerging Roles of the Membrane Potential: Action Beyond the Action Potential,” Frontiers in Physiology, vol. 9. 2018, [Online]. Available: https://www.frontiersin.org/articles/10.3389/fphys.2018.01661.
- R. Quadri et al., “Haspin regulates Ras localization to promote Cdc24-driven mitotic depolarization,” Cell Discov., vol. 6, no. 1, p. 42, 2020. [CrossRef]
- C. Baumgartner, “The world’s first digital cell twin in cancer electrophysiology: a digital revolution in cancer research” J. Exp. Clin. Cancer Res., vol. 41, no. 1, p. 298, 2022. [CrossRef]
- J. Ocampo-Garza, J. Griggs, and A. Tosti, “New drugs under investigation for the treatment of alopecias.,” Expert Opin. Investig. Drugs, vol. 28, no. 3, pp. 275–284, Mar. 2019. [CrossRef]
- D. Tricarico, L. Montanari, and D. Conte Camerino, “Involvement of 3Na+/2K+ ATP-ase and Pi-3 kinase in the response of skeletal muscle ATP-sensitive K+ channels to insulin.,” Neuromuscul. Disord., vol. 13, no. 9, pp. 712–719, Nov. 2003. [CrossRef]
- D. Tricarico, R. Mallamaci, M. Barbieri, and D. C. Camerino, “Modulation of ATP-Sensitive K+Channel by Insulin in Rat Skeletal Muscle Fibers,” Biochem. Biophys. Res. Commun., vol. 232, no. 2, pp. 536–539, 1997. [CrossRef]
- P. Marques et al., “Emergence of Pituitary Adenoma in a Child during Surveillance: Clinical Challenges and the Family Members’ View in an AIP Mutation-Positive Family,” Int. J. Endocrinol., vol. 2018, p. 8581626, 2018. [CrossRef]
- P. Marques et al., “Cantu syndrome with coexisting familial pituitary adenoma.,” Endocrine, vol. 59, no. 3, pp. 677–684, Mar. 2018. [CrossRef]
- D. Tricarico, D. Conte Camerino, S. Govoni, and S. H. Bryant, “Modulation of rat skeletal muscle chloride channels by activators and inhibitors of protein kinase C,” Pflügers Arch., vol. 418, no. 5, pp. 500–503, 1991. [CrossRef]
- A. Mele, G. M. Camerino, S. Calzolaro, M. Cannone, D. Conte, and D. Tricarico, “Dual response of the KATP channels to staurosporine: a novel role of SUR2B, SUR1 and Kir6.2 subunits in the regulation of the atrophy in different skeletal muscle phenotypes.,” Biochem. Pharmacol., vol. 91, no. 2, pp. 266–275, Sep. 2014. [CrossRef]
- D. Tricarico, M. Barbieri, and D. C. Camerino, “Taurine blocks ATP-sensitive potassium channels of rat skeletal muscle fibres interfering with the sulphonylurea receptor.,” Br. J. Pharmacol., vol. 130, no. 4, pp. 827–834, Jun. 2000. [CrossRef]
- D. Tricarico et al., “The biophysical and pharmacological characteristics of skeletal muscle ATP-sensitive K+ channels are modified in K+-depleted rat, an animal model of hypokalemic periodic paralysis.,” Mol. Pharmacol., vol. 54, no. 1, pp. 197–206, Jul. 1998. [CrossRef]
- A. Mele, M. Buttiglione, G. Cannone, F. Vitiello, D. C. Camerino, and D. Tricarico, “Opening/blocking actions of pyruvate kinase antibodies on neuronal and muscular KATP channels.,” Pharmacol. Res., vol. 66, no. 5, pp. 401–408, Nov. 2012. [CrossRef]
- K. Castillo et al., “The bisphosphonate zoledronic acid is a TRPV1 channel inhibitor,” Biophys. J., vol. 122, no. 3, p. 108a, Feb. 2023. [CrossRef]
- D. Tricarico, R. Capriulo, and D. C. Camerino, “Involvement of KCa2+ channels in the local abnormalities and hyperkalemia following the ischemia-reperfusion injury of rat skeletal muscle,” Neuromuscul. Disord., vol. 12, no. 3, pp. 258–265, 2002. [CrossRef]
- M. M. Dinardo, G. Camerino, A. Mele, R. Latorre, D. Conte Camerino, and D. Tricarico, “Splicing of the rSlo gene affects the molecular composition and drug response of Ca2+-activated K+ channels in skeletal muscle.,” PLoS One, vol. 7, no. 7, p. e40235, 2012. [CrossRef]
- D. Tricarico et al., “Acetazolamide prevents vacuolar myopathy in skeletal muscle of K (+) -depleted rats.,” Br. J. Pharmacol., vol. 154, no. 1, pp. 183–190, May 2008. [CrossRef]
- D. Tricarico et al., “Emerging role of calcium-activated potassium channel in the regulation of cell viability following potassium ions challenge in HEK293 cells and pharmacological modulation.,” PLoS One, vol. 8, no. 7, p. e69551, 2013. [CrossRef]
- A. Michelucci, L. Sforna, A. Di Battista, F. Franciolini, and L. Catacuzzeno, “Ca (2+) -activated K(+) channels regulate cell volume in human glioblastoma cells.,” J. Cell. Physiol., vol. 238, no. 9, pp. 2120–2134, Sep. 2023. [CrossRef]
- P. Rosa et al., “Overexpression of Large-Conductance Calcium-Activated Potassium Channels in Human Glioblastoma Stem-Like Cells and Their Role in Cell Migration.,” J. Cell. Physiol., vol. 232, no. 9, pp. 2478–2488, Sep. 2017. [CrossRef]

Disclaimer/Publisher’s Note: The statements, opinions and data contained in all publications are solely those of the individual author(s) and contributor(s) and not of MDPI and/or the editor(s). MDPI and/or the editor(s) disclaim responsibility for any injury to people or property resulting from any ideas, methods, instructions or products referred to in the content. |
© 2024 by the authors. Licensee MDPI, Basel, Switzerland. This article is an open access article distributed under the terms and conditions of the Creative Commons Attribution (CC BY) license (http://creativecommons.org/licenses/by/4.0/).


