Preprint
Article

Adsorption Technology For PFAS Removal In Water: Comparison Between Novel Carbonaceous Materials

Submitted:

05 July 2024

Posted:

09 July 2024

You are already at the latest version

A peer-reviewed article of this preprint also exists.

Abstract
PFAS are a variety of ecologically persistent compounds of anthropogenic origin loosely included in many industrial products, in which the carbon chain can be fully (perfluoroalkyl substances) or partially (polyfluoroalkyl substances) fluorinated. Their ubiquitous presence in many environmental compartments over the years, and highly long-lasting nature, arose concern because of the possible adverse effects of PFAS on ecosystem and human health. Between the remediation technologies, adsorption has been demonstrated to be a maneageble and cost-effective method for the removal of PFAS in aqueous media. This study tested two novel and eco-friendly adsorbents (pinewood and date seeds biochar) on 6 different PFAS (PFOS, GenX, PFHxA, PFOA, PFDA, PFTeDA). Batch sorption tests (24 hours) were carried out to evaluate the removal efficiency of each PFAS substance in relation to the two biochars. All samples of liquid phase were analysed by a developed and then well-established method: i) pre-treatment (centrifugation and filtration); ii) determination by high-performance liquid chromatography coupled with mass spectrometry (HPLC-MS/MS). Results evidenced a comparable adsorption capacity of both materials, but greater for the long-chain PFAS. Such findings may lead to a promising path for the use of waste origin materials in the PFAS remediation field.
Keywords: 
Subject: 
Environmental and Earth Sciences  -   Sustainable Science and Technology

1. Introduction

Per-fluoroalkyl and poly-fluoroalkyl substances (PFAS) are anthropogenic persistent organic molecules characterized by a hydrophobic tail of variable length in which hydrogen atoms are entirely or partially replaced by fluorine atoms and a polar head with differing functional groups. Because of the strong carbon-fluorine bond PFAS have an excellent thermal-chemical stability and resistance to degradation which makes them crucial in many industrial applications (e.g., food packaging, textiles, personal care products, fire-retardants, electronics, pesticides). PFAS can be divided in two main families in terms of chain length and functional group: perfluoroalkyl sulfonic acids (CnF2n+1SO3H PFSAs) and perfluoroalkyl carboxylic acids (CnF2n+1COOH PFCAs). Long-chain carboxylic and sulfonic acids (number of carbons: ≥ 6), such as PFOA and PFOS, have shown high bioaccumulation properties and have been classified as PBT (Persistent Bioaccumulative Toxic) substances according to the EU’s REACH (Registration Evaluation and Authorization of CHemicals) [1]. Several biomonitoring trials, carried out to evaluate PFAS health effects on human population, have highlighted their characteristics of endocrine disruptors and potential adverse effects such as: altered metabolism, reduced fertility along with fetal growth, obesity, carcinogenicity and reduced ability of the immune system to fight infections [2-8]. Therefore, many regulations and restrictions have been introduced in both USA and Europe resulting in the replacement of proven toxic compounds with some short-chain PFAS (e.g., PFOA to GenX) [9,10,11,12]. Despite this, due to their persistence and bioaccumulation characteristics, PFAS are significantly widespread in all environmental matrices. Surface water contamination is of particular concern, since it can easily reach groundwater, making drinking and process water the most impacting way of human exposure [13]. Thus, the US Environmental Protection Agency (EPA) has set 10–90 ng L-1 threshold values for drinking water and in Europe the most recent action plan has established a limit of 0.5 µg L-1 for all PFAS in drinking water [14, 15, 1]. In this context, the development of efficient and cost-effective water treatment methods is a primary challenge for scientific community. The most effective water treatments for PFAS removal include the use of advanced oxidation, reverse osmosis, ion-exchange resins and nanofiltration. Even though these technologies have shown promising results they present concerning drawbacks such as the formation of shorter chain PFAS as byproducts. Moreover, PFAS low concentration in water and high hydrophilicity make difficult to provide an overall efficient remediation [16,17,18]. Between the most effective treatment processes mentioned, adsorption is an established technology for removal of contaminates, both as stand-alone application and in combined water treatment plants. For example, activated carbon (AC) has been successfully used due to its high specific area and porosity [19, 20]. However, some disadvantages such as cost regeneration and the resulting reduced adsorption efficiency led the scientific community to test novel materials capable to overcome these limitations. Over the years the eco-friendlier biochar material has been taking hold as a cost-effective remediation treatment for organic compounds: its major advantage lies in being a carbon-rich waste material deriving from the slow pyrolysis of biomass without needing activation by solvents or gas. In addition, the 3D structure enables the material to easily interact with a variety of substances through its hydrophobic surface making biochar a potential suitable material also for PFAS [21-23]. Hence, the aim of present study has been to test two novel and eco-friendly biochars for the removal of PFAS in aqueous media. The two adsorbents were produced from date and pinewood pyrolysis. PFAS were selected to investigate as much as possible a wide spectrum of chemical structures by different chain length (6-14 carbons) and functional group (carboxyl and sulphonic).

2. Materials and Methods

2.1. Chemicals and Materials

Six PFAS standards of different chain length (i.e. C4–C14) and composition were investigated: perfluorohexanoic acid (PFHxA), ammonium perfluoro(2-methyl-3-oxahexanoate) (GenX), perluorooctanoic acid (PFOA), perfluoroctanesulfonic acid (PFOS), perfluorodecanoic acid (PFDA), perfluorotetradecanoic acid (PFTeDA) (Table S1); two mass-labeled internal standards (ISs) (i.e. 13C4-PFHxA, 13C4-PFOS) (LGC standard Ltd Milano Italia) were also used. The two selected biochars are produced from pinewood (PW) gasification in form of powder material (Burkhardt GmbH, Mühlhausen, Germany) [24] and high temperature pyrolysis of date seeds (DS) (Briska University, Algeri, Algeria), respectively.

2.2. Batch Adsorption Tests

The experiments were performed in two steps: i) adsorption kinetic tests to establish the equilibrium time; and ii) adsorption isotherms tests to investigate the removal capacity of both the selected biochars. In detail, for kinetics tests an aliquot of the solution spiked with a PFAS compound was sampled at the test beginning (time 0) to evaluate the starting PFAS concentration (C0) and at Ct after 1, 2, 3, 4, 5, 6, 7, 8, 24, 27, 30, 54, 57 h. Four additional samplings were also carried out after 24 h (Ct = 24 h) to confirm the achievement of equilibrium. A solid/liquid ratio of 2 g L−1 was chosen for the experiments: a fixed quantity of sorbent material (0.002 g) was placed in contact with contaminated solutions at different concentrations (0.5, 1, 2.5, 5, 6, 8, 10, 20, 30, 40 mg L-1). The equilibrium concentration (Ct) determined was used to calculate the sorption equilibrium amount (qt) at that time with the following equation (1):
q t = C 0 C t V m
where C0 (µg L-1) is the initial concentration of the single PFAS in the solution Ct (µg L-1) is the concentration of the PFAS in the solution at the time of collection t (h); V(L) is the volume of the solution and m (mg) is the weight of the DS and PW biochar. Batch isotherm experiments were set one compound at time for 24h in order to reach the equilibrium and carried out on an orbital shaker at 180 rpm: biochar of choice was added at different quantities (from 30 to 250 mg) to 50 ml of ultra-pure deionized water (MilliQ) spiked with a PFAS standard solution at a fixed concentration (10 mg L-1) in a 50 mL polypropylene tube (Falcon). Samples collected were then centrifugated at 4200 rpm for about 20 minutes and then 3 mL of each sample was filtered with a 0.22 µm cellulose acetate filter (Sartorius Stedim). Lastly, internal standard (IS) for each sample was added for the instrumental analysis (Figure 1). The equilibrium concentration (Ce) determined was used to calculate the sorption equilibrium amount (qe) with the following Equation (2):
q e = C 0 C e V m
where C0 is the starting PFAS concentration expressed in mg L-1, qe is the PFAS sorbed amount in mg g-1, Ce is the equilibrium PFAS concentration expressed in mg L-1, V is the volume of the solution in L and m is amount of sorbent in mg.

2.3. Equilibrium and Kinetic Modeling

The adsorption kinetic model was derived from the Lagergren pseudo-first order equation as reported in eq. (3):
d q t d t = k q e q t
where qt and qe are the amount adsorbed at time t and at equilibrium and k1 is the rate constant of the pseudo-first order sorption process. The integral equation after applying the initial conditions of qt = 0 at t = 0 is (4,5):
l n q e q t = l n q e k t  
or
q t = q e ( 1 e k t   )
Equilibrium tests were carried out to investigate both DS and PW sorption capacity and their affinity for the target PFAS compounds. Two isotherm models were attempted for the construction of the equilibrium curves: the Langmuir and the Freundlich models. The models were both applied to each experimental plot in deionized water. The Langmuir and Freundlich models are reported in Equations (6) and (7) respectively:
q e = q m a x K L C e 1 + K L C e    
q e = K F C e n      
where qmax (mg g−1) is the maximum adsorbable amount, KL is the Langmuir thermodynamic constant (L mg−1), KF is the Freundlich (L mg−1) and n is a dimensionless parameter greater than zero; n > 1 means upwards concavity, whereas n < 1 represents downward concavity.

2.4. HPLC/MS-MS

The analytical determination performed in this study was modified and adapted from a previous work [25] for PFAS water samples analysis (Table S2, S3). Briefly, every sample was analyzed using a coupled system consisting of a high-pressure liquid chromatography Agilent 1290 (HPLC) and an Agilent G6460 triple quadruple mass spectrometry (QqQ MS/MS) (Agilent Technologies, Toronto, CA) with electrospray ionization (ESI) operating in negative mode. The analytes were separated by a Waters Xbridge BEH (Ethylene Bridged Hybrid) C₁₈ (25 μm x 2.1 mm x 100 mm) (Milford Massachusetts Stati Uniti) column with a Ultra C₁₈ delay column (5 µm × 30 mm x 2.1 mm, Restek, USA) and the sample injection volume was 5 μL. The flow rate was controlled at 0.2 mL/min with a mobile phase of 15 mM ammonium acetate in ultra-pure deionized water (MilliQ) (A) and methanol (B). The overall performances of analysis have been confirmed from the work cited above [25].

2.5. Textural Characterization and Morphology

Surface area Brunauer–Emmett–Teller (BET) multipoint method [26] and textural analysis were obtained by N2 adsorption/desorption measurements at the liquid nitrogen temperature (-196 °C) using a Micromeritics 3Flex 3500 analyzer. The sample was pre-treated under vacuum at 350 °C for 2.5 hours. The pore distribution was determined by the Barret–Joyner–Halenda (BJH) method [27]. The analysis of micropore was performed by the t-test [28]; the total pore volume was determined by the rule of Gurvitsch [29]. Morphology was evaluated by a scanning Electron Microscope (SEM) analysis using a Zeiss Auriga FESEM without any pre-treatment of the material.

3. Results and Discussion

3.1. Adsorbent Characterization of Date Biochar

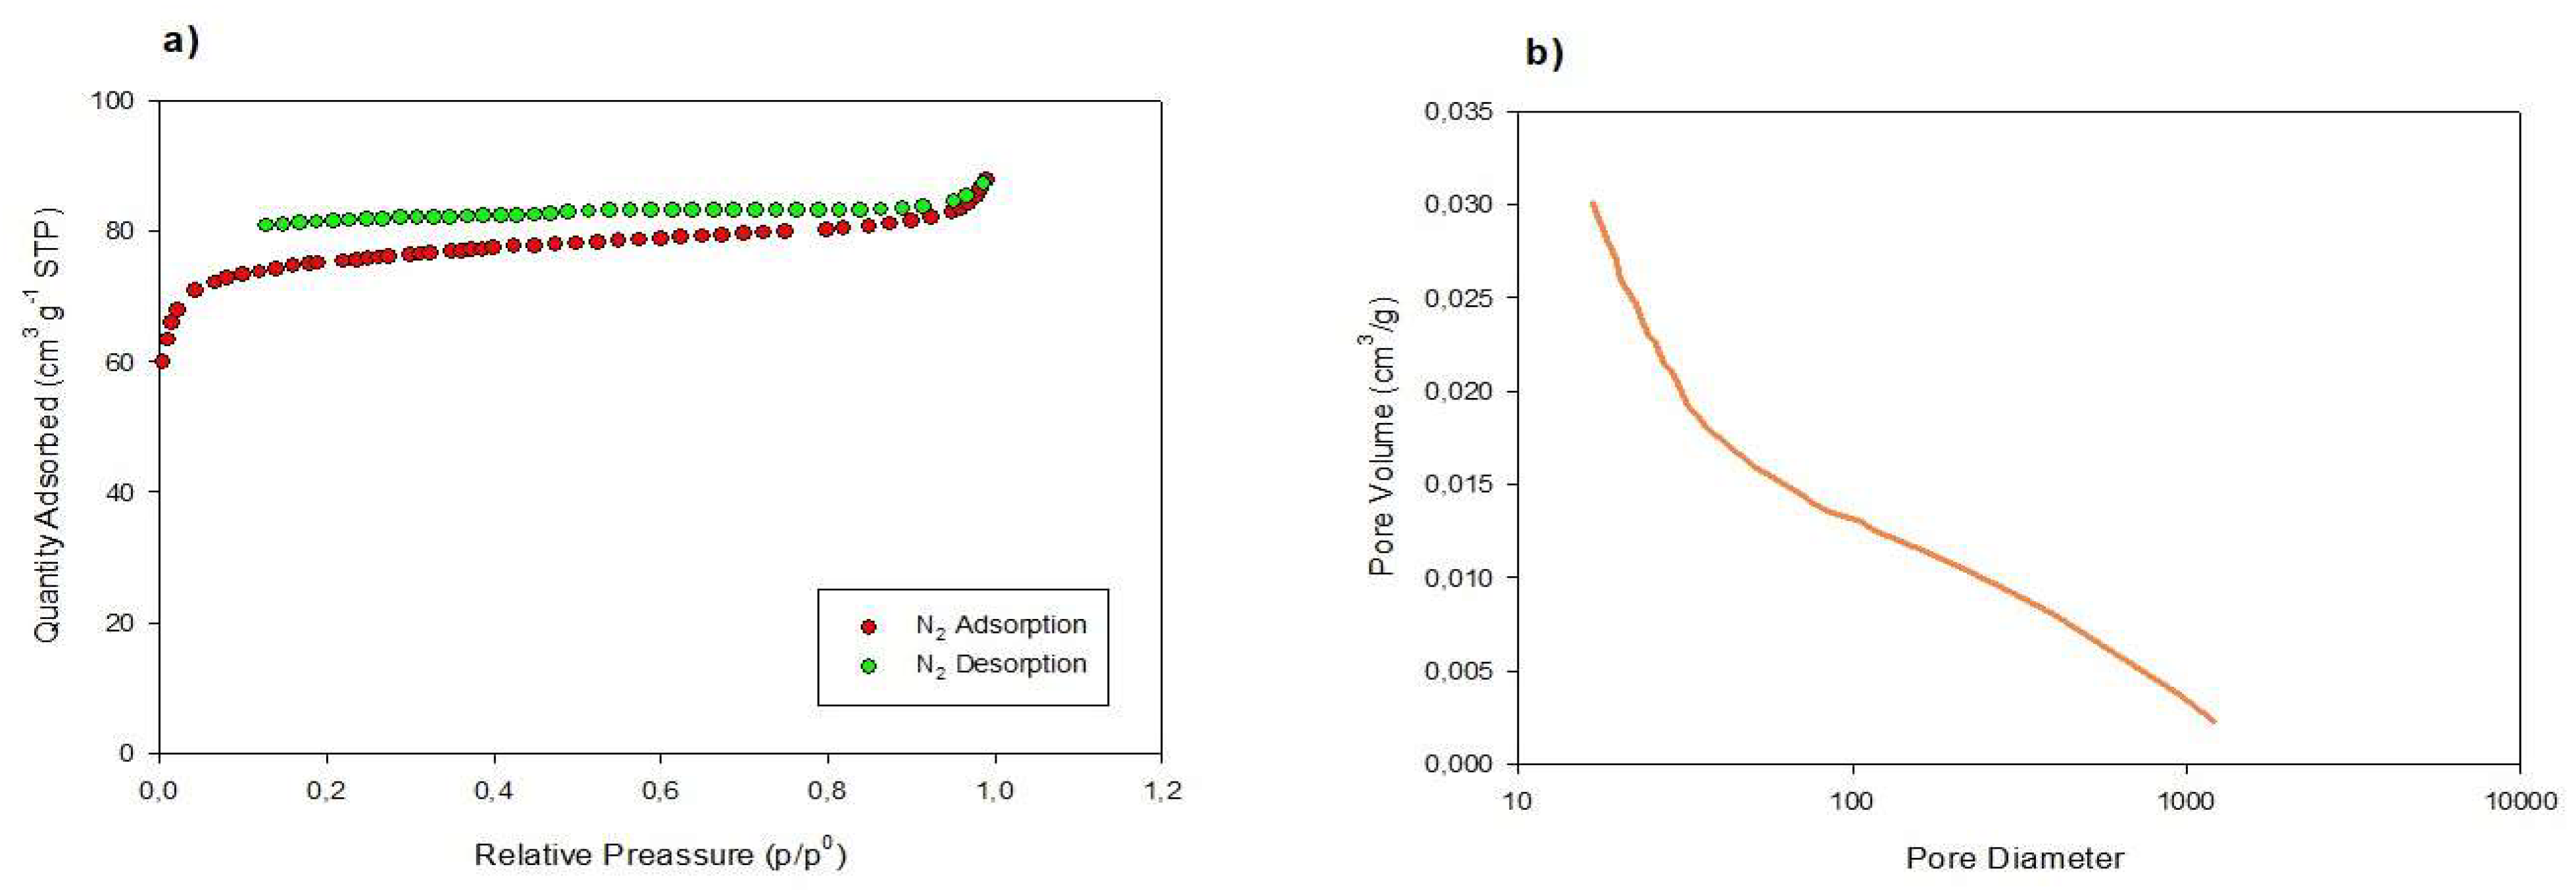
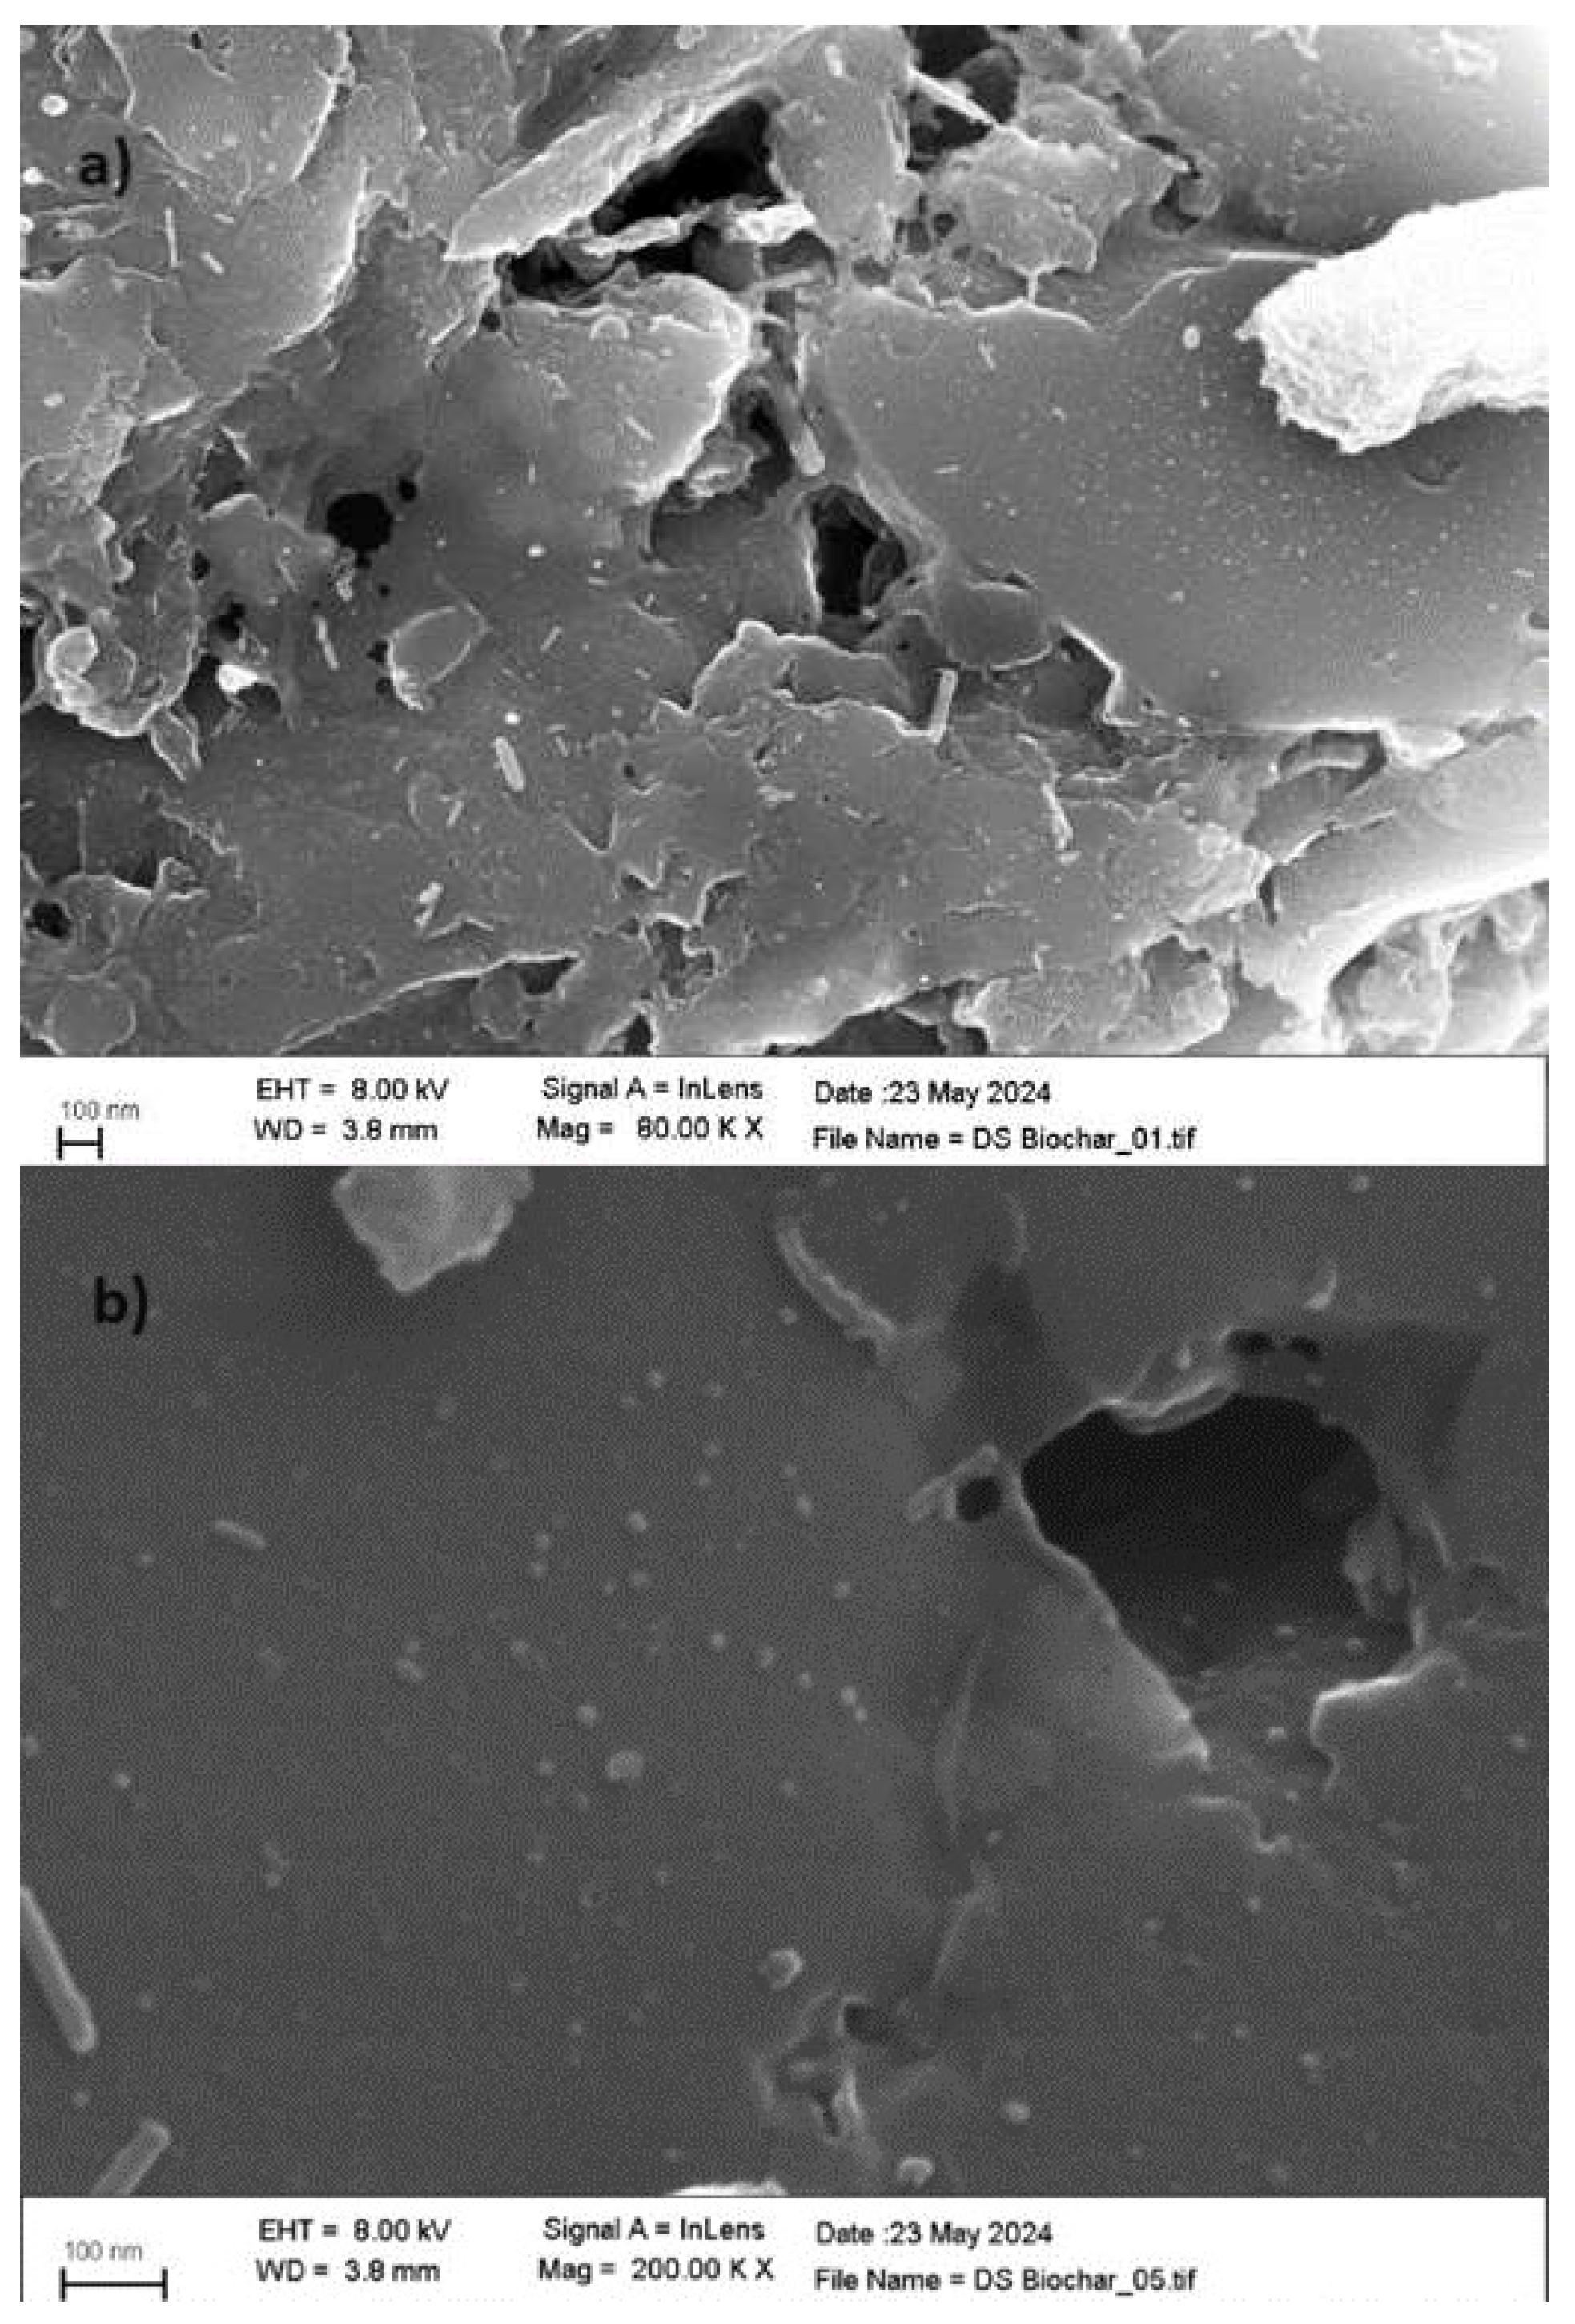
The PW biochar was characterized in a previous study [24], while textural characterization and morphology of DS biochar were performed in the present investigation. Specific surface area and total pore volume data are reported in Table 1 along with the N2 adsorption/desorption isotherms (Figure 2a), pore volume graph (Figure 2b) and SEM images (Figure 3). Figure 2a shows a deviation between sorption curves leading to their lack of meeting: this phenomenon is called in literature “open hysteresis” and is usually present in N2 isotherms of biochars deriving from pyrolysis [30]. This behavior has been wildly investigated and it is probably related to: 1) pore swelling during adsorption due to the adsorbate (N2) penetrating into the pores, causing a deformation and consequentially an expansion of the pore volume; 2) unreached desorption-pressure of the pore blocking the fluid from evaporating so that the adsorbate remains trapped in the cavities [31, 32]. The comparison between PW and DS biochar shows that in both DS and PW materials the high surface area values are mostly due to micropores and the great total volumes are principally related to mesopores but in the PW biochar the amount of mesopores is about six times higher than in the DS biochar. Regarding the pore size distribution, for both PW and DS biochar the meso- and macropores are continuously distributed in a 20–1000 Å range, mostly in the 20-200 Å range. In fact, both PW and DS biochar were prepared in similar temperature conditions (850 °C), respectively by direct pyrolysis and gasification, resulting in a heterogeneous texture and development of porosity also related to their organic waste origin. Regarding morphology, SEM analysis confirmed the adsorption/desorption test: many pores resulted around 100 Å (Figure 3a) and the presence of pores under 10 Å can be lightly evidenced on the surface of the material (Figure 3b), although in-depht information about the micropores distribution was limited by the SEM microscope.

3.2. Kinetic Tests

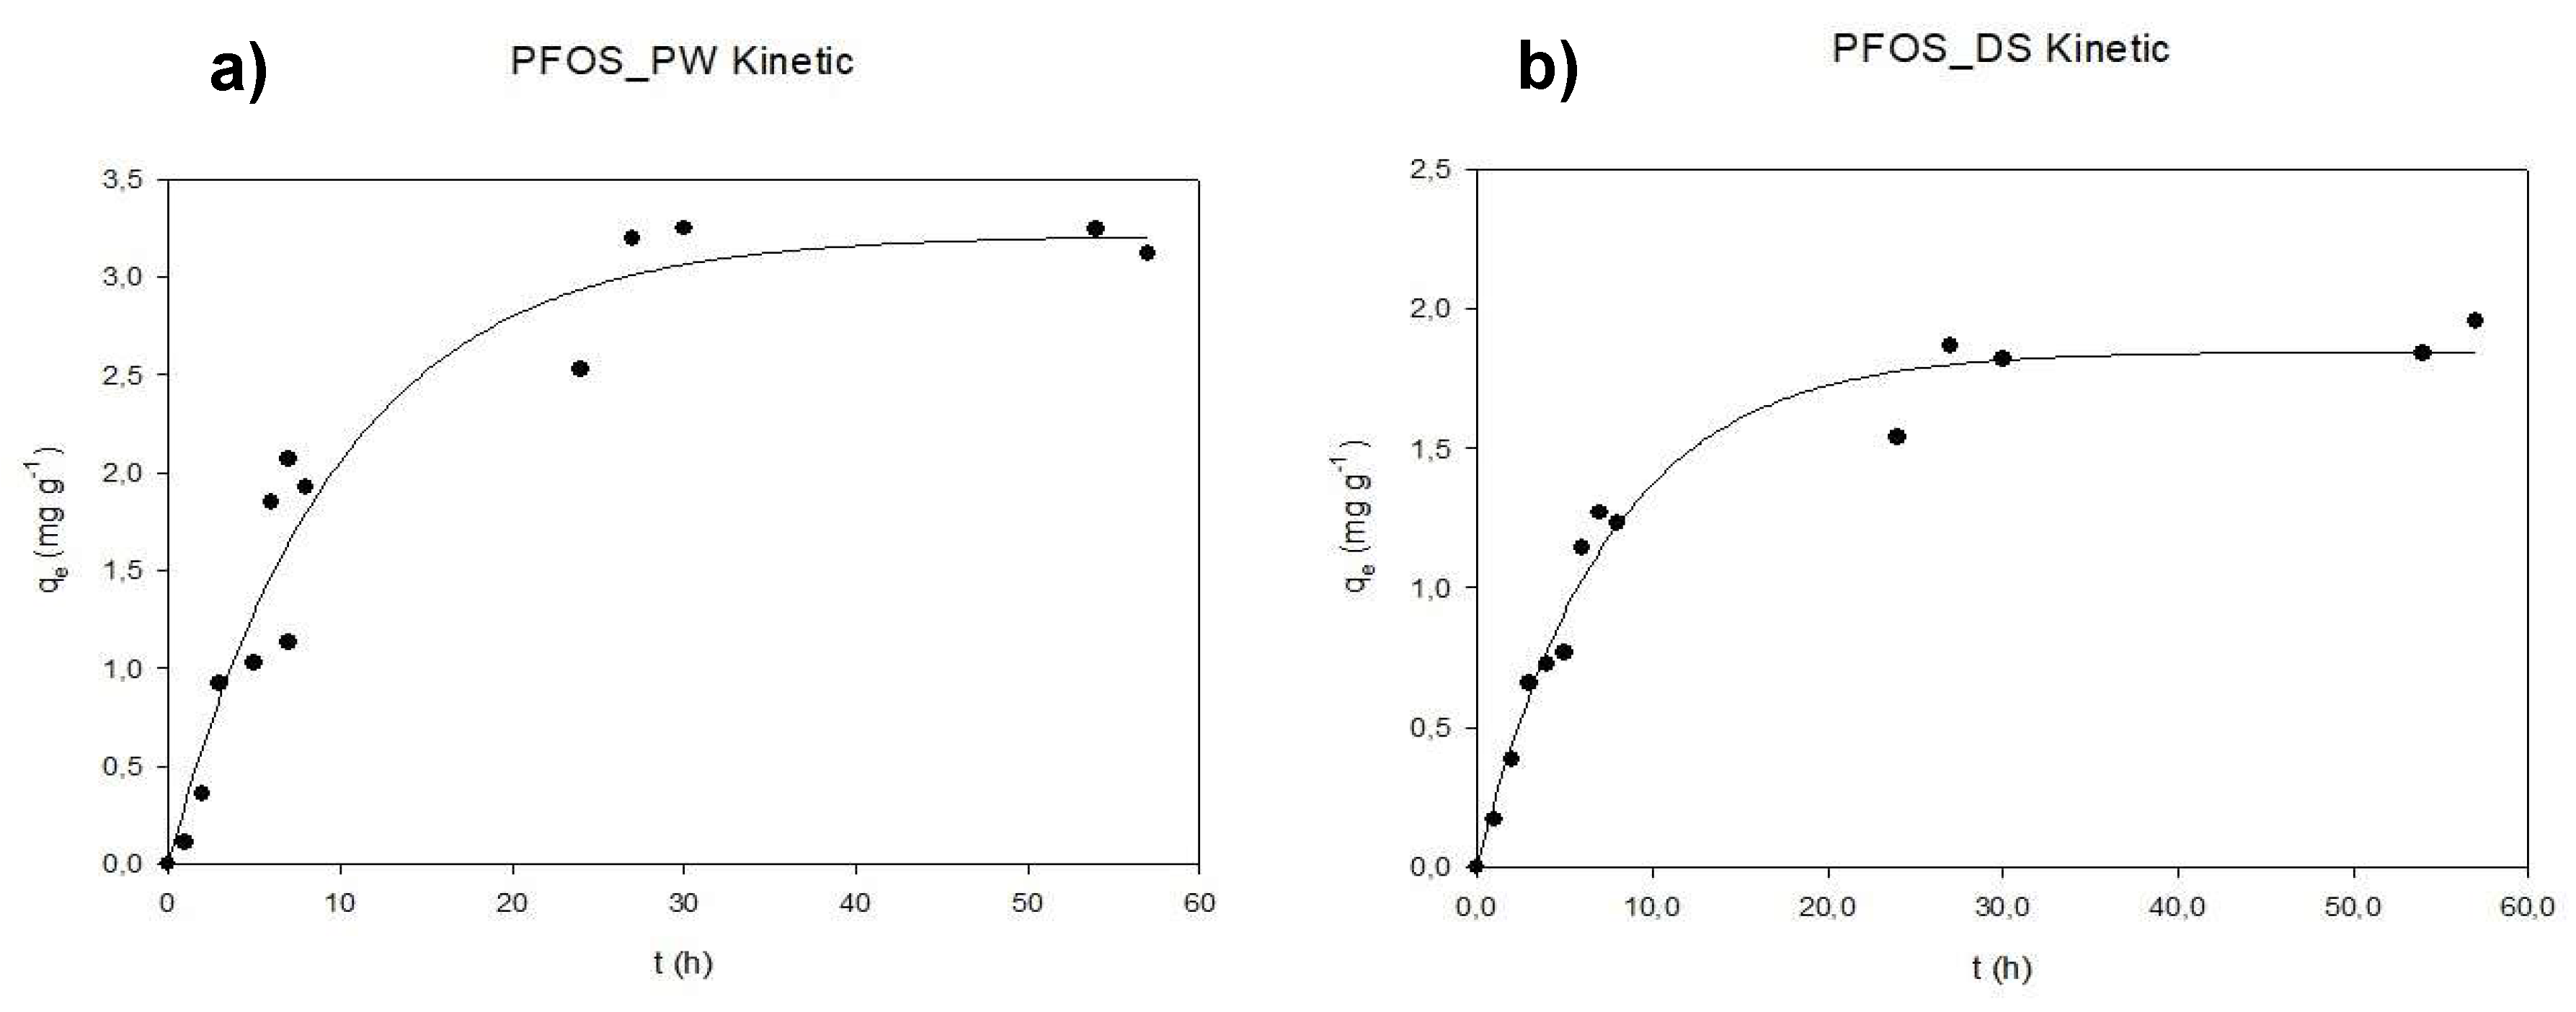
Between all the PFAS investigated, the sorption kinetics of PFOS at 1 mg L-1 are reported as an example of the behavior adsorbate-adsorbent studied for the two biochars selected (Figure 4). As expected, because of its long chain log Kow value and sulphonic group, PFOS interact effectively with the surface area of both the two organic materials [33]: the graphs show how the adsorption rate decreases with time until it gradually approaches the equilibrium state. The overall equilibrium state already reached at 24h and the slow adsorption that followed suggests the diffusion of PFOS molecules into the pores of the adsorbents [34].tests

3.3. Isotherm Curves: Pinewood vs Date

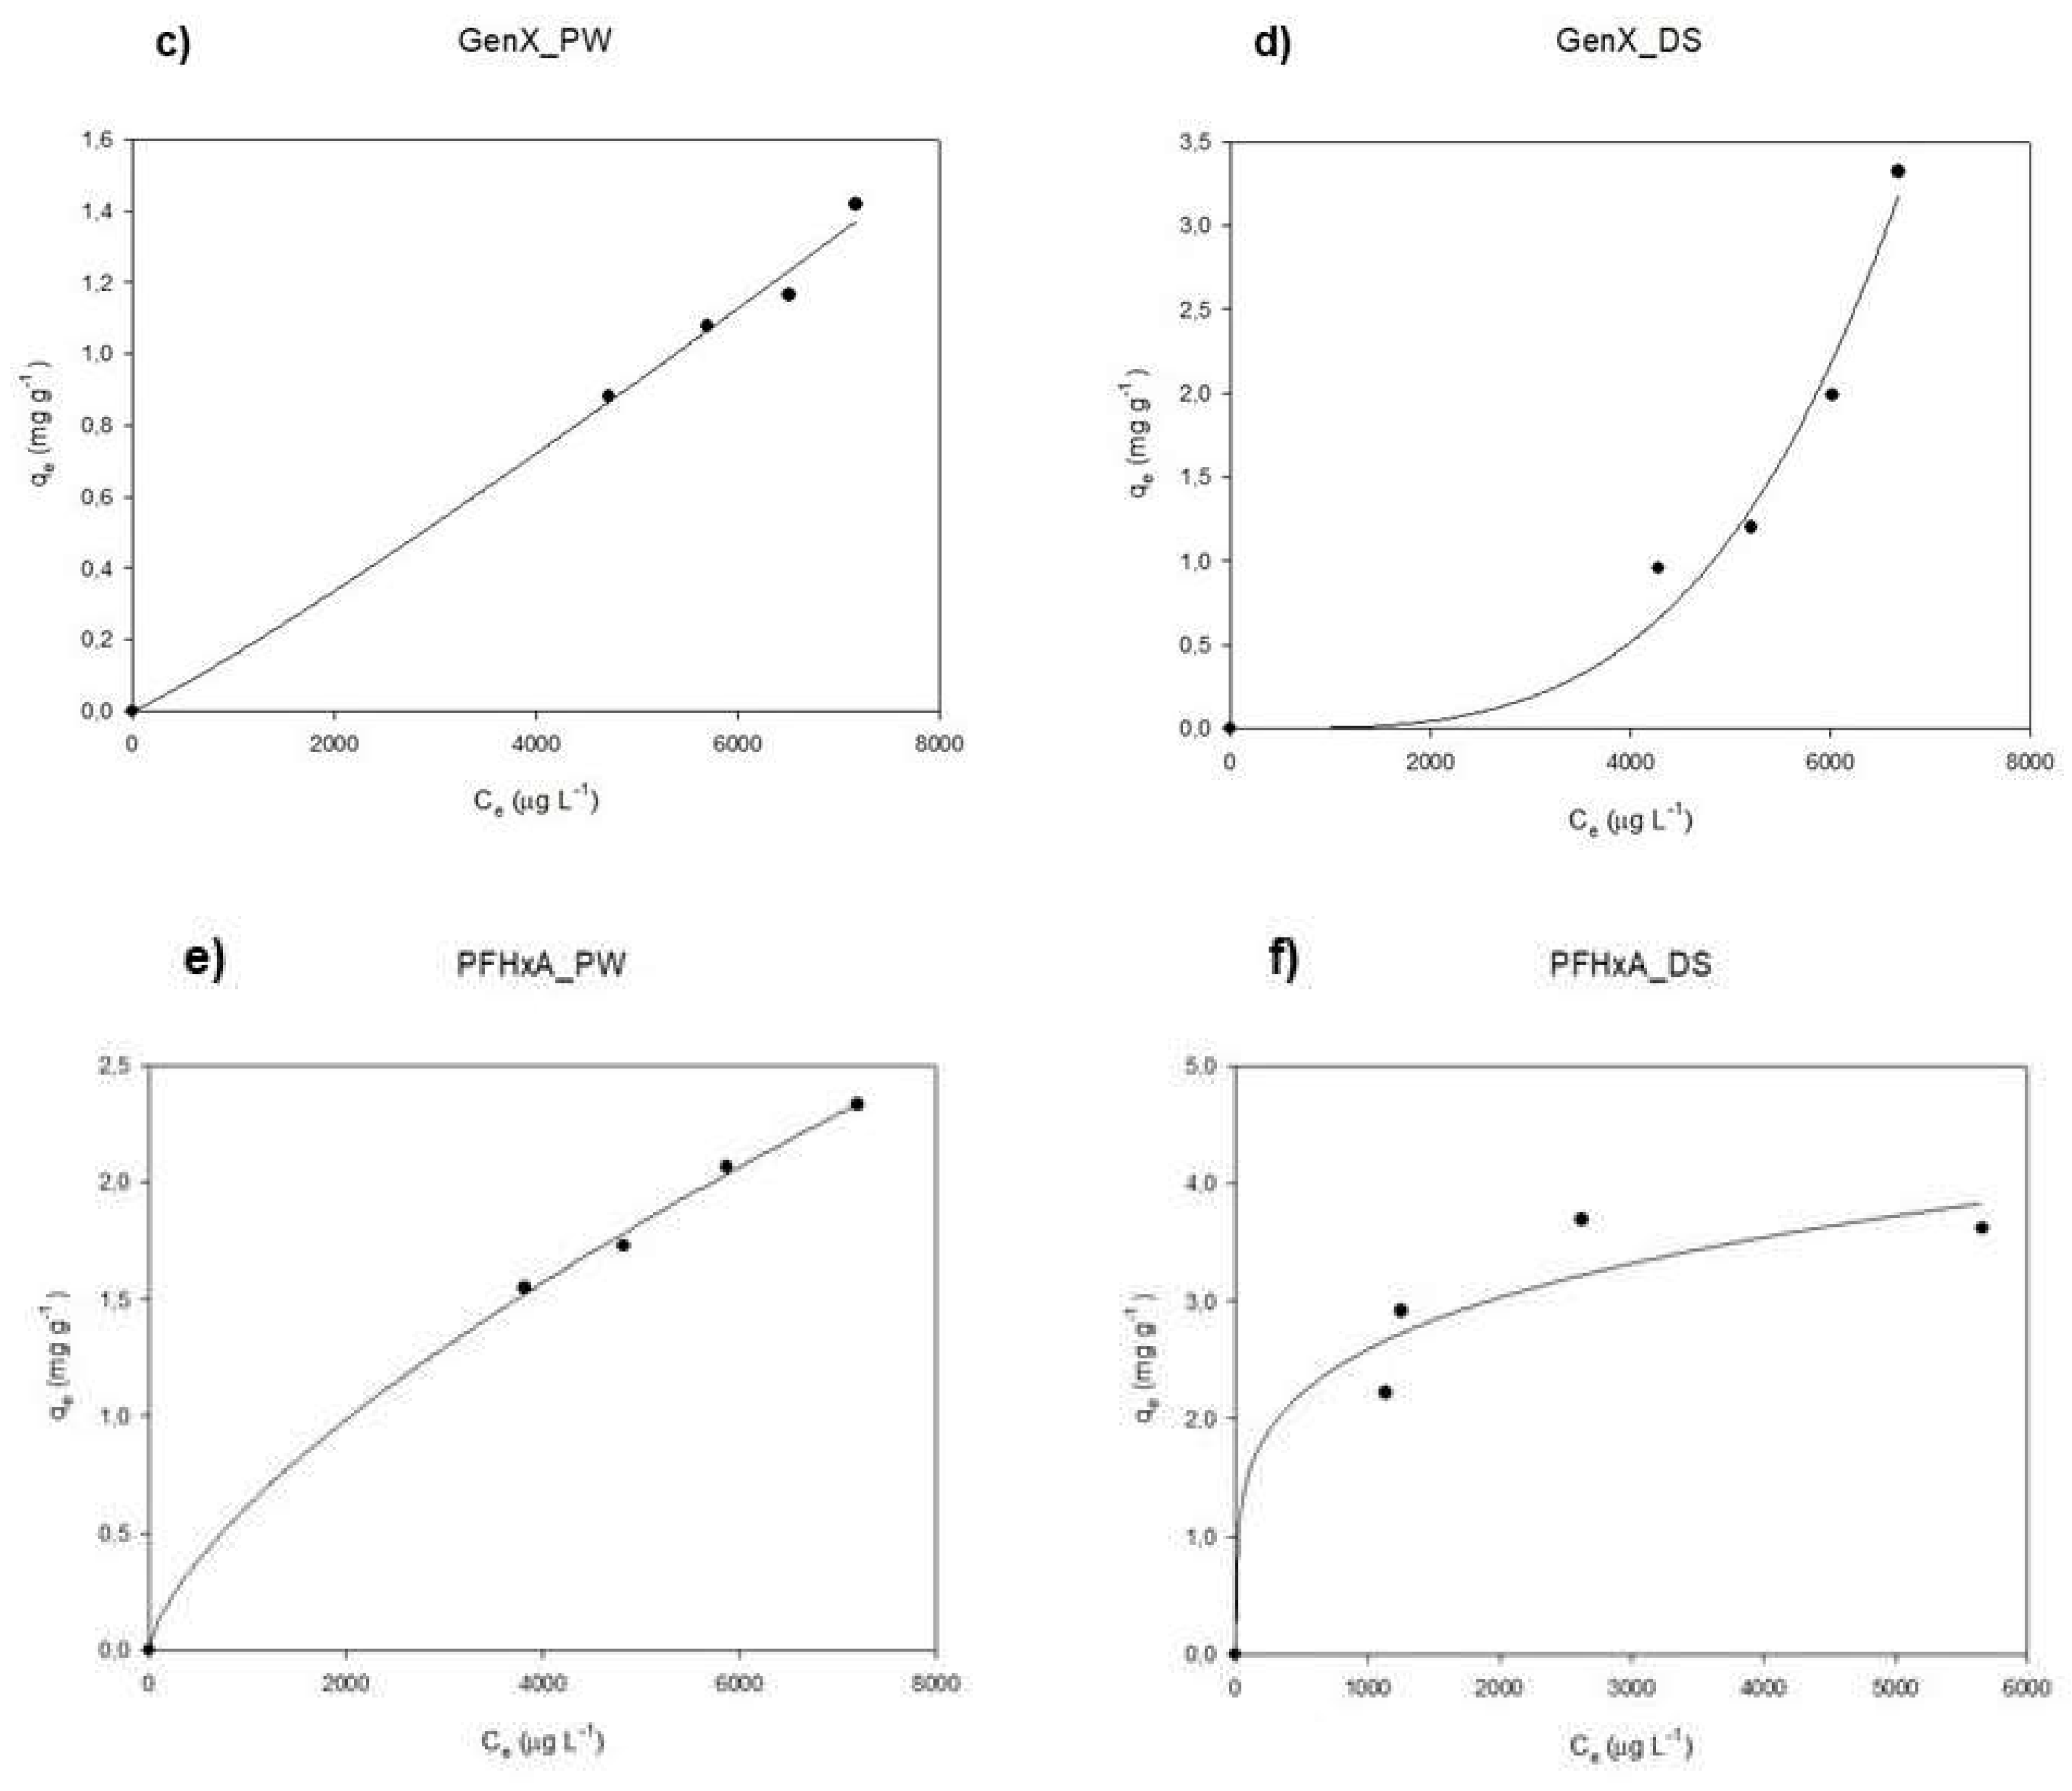
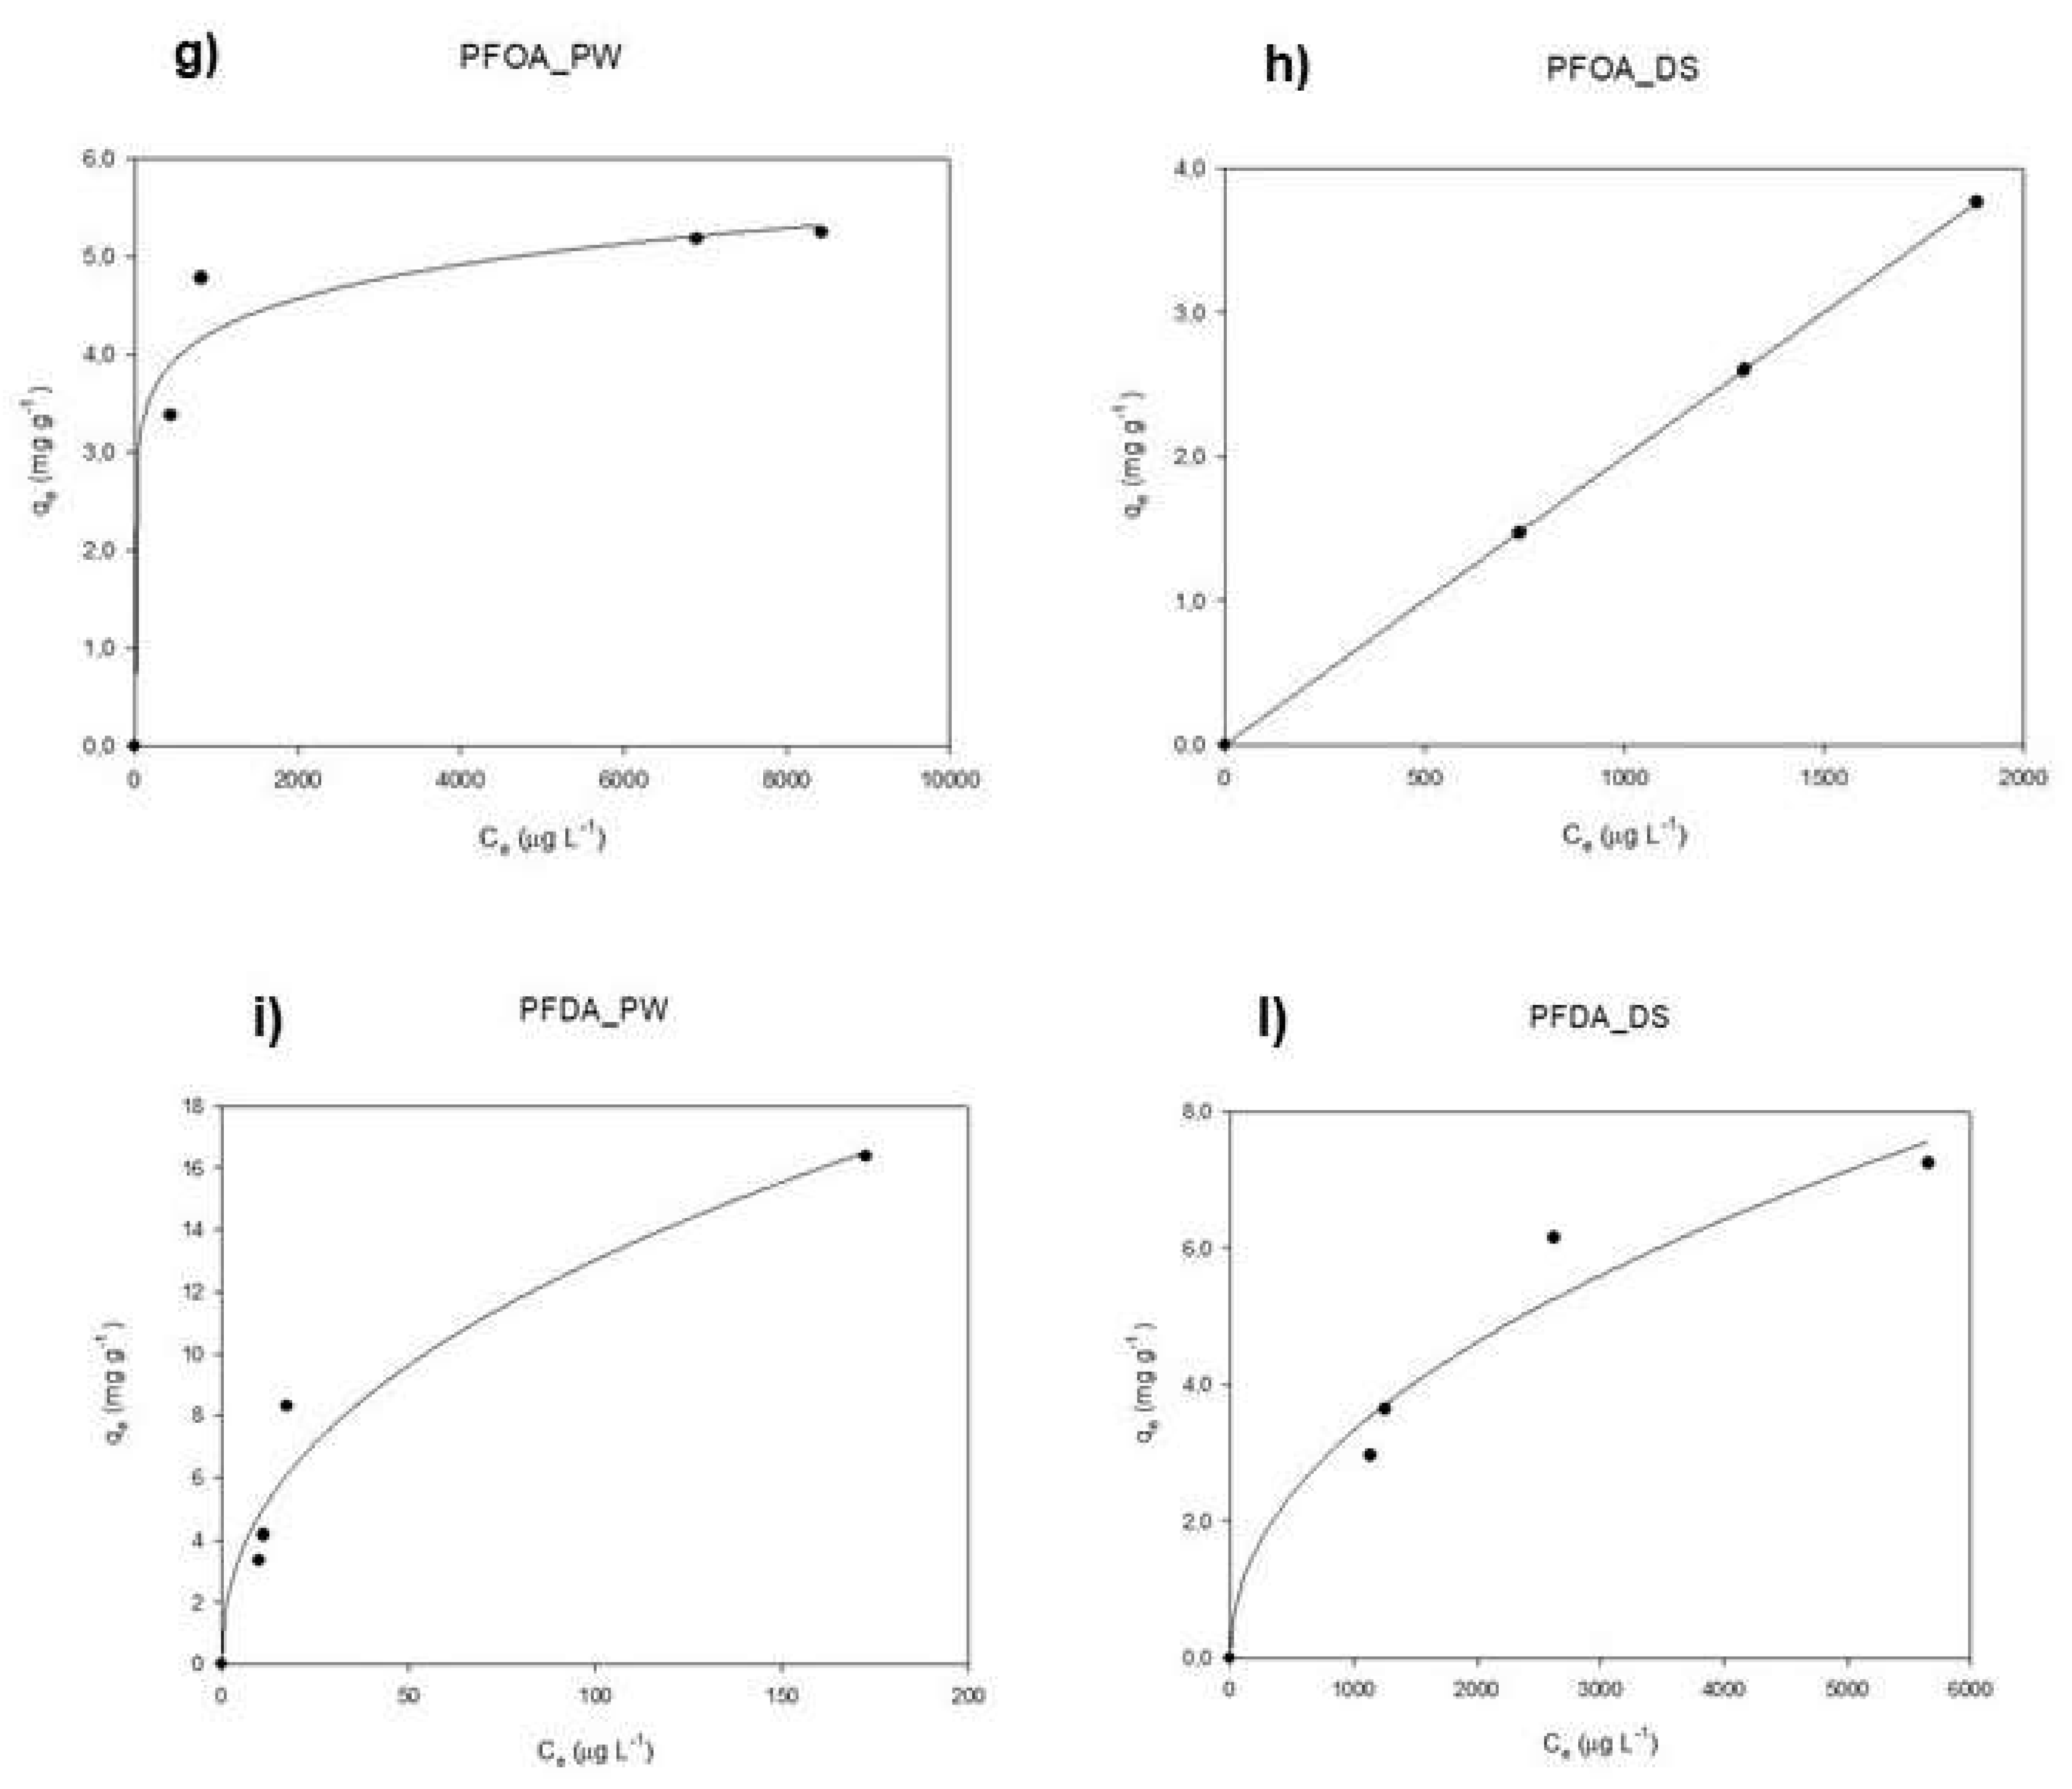
Sorption isotherms of GenX PFHxA PFOA PFOS PFDA and PFTeDA both on PW and DS are reported in Figure 5. Freundlich model has been prefered to Langmuir’s to represent results because it fits better the complexity of the adsorption phenomenon investigated with this two biochars; constants and the regression coefficients R2 of Freundlich model are provided in Supplementary materials (Table S4). PFAS compounds investigated differ in terms of chain lenght (from 6 to 14 carbon atoms) and functional group (carboxylic and sulphonate). From the isotherm curves three ranges of Ce (0-1000, 2000-4000, 5000-9000 µg L-1) can be evidenced: the highest values are related for the most part to DS while the intermediate and lowest ones to PW. In particular, the maiority of low-intermediate Ce values belonging to long-chains PFAS (PFDA, PFTeDA) implies a major affinity as opposed to the high Ce ones for these short-chain compounds (PFHxA, GenX). PFTeDA, PFOA and GenX present a linear trend in case of DS isotherms curves suggesting that the adsorption process occurs in a single layer probably due to the active sites number where the adsorbate can adhere [35]. PFDA is the only one to show the same behavior both with PW and DS: this could be ascribed to its highly hydrophobic nature for which multilayer sorption is considered favorable especially at higher equilibrium concentrations [36]. PFOS reported the highest qe values demonstrating its great affinity with the two carbonaceous materials probably thanks to the combination of chain length and sulphonate group [37-40]. In fact, PFAS with longer chains are more hydrophobic and the interaction with the carbonaceus adsorbents seems to be stronger and more effective. On the other hand, PFAS with shorter C-F chains show a recalcitrant behavior towards both biochars favouring electrostatic interactions between ions eventually present on the surface of the material [38-39]. Similar results have been reported for AC for which the number of CF2 units and functional group has shown to influence its removal efficiency despite its high surface area [41, 42]. Moreover, if qe values of PFDA and PFOS differ significantly between the two adsorbents, PFTeDA showed a recurring behavior: both qe and Ce values are comparable, but the isotherms show a different trend. Results obtained suggest how the surface area of the two materials investigated, also in terms of pores and chemistry composition, affects the overall adsorption of these compounds. In fact, data show a possible correlation between pore size and adsorption capacity, resulting in higher qe values for PW in case of long chain PFAS (PFOS, PFDA, PFTeDA), in accord with the mesoporous abundance found by textural characterization analysis (Table 1). This behavior has also been studied in literature evidencing how the rates of PFAS sorption onto porous sorbents is closely related to the particle diameter and pore size of sorbents [34, 36, 42].

5. Conclusions

Sorption tests were carried out to investigate the removal efficiency of 6 PFAS (PFHxA, GenX, PFOA, PFOS PFDA, PFTeDA) from aqueous solution by two biochars, deriving from organic waste (pinewood and date seeds). Isotherm curves of DS and PW showed similar trends in relation to PFAS compounds with higher adsorption capacity for the long-chain ones (PFOA, PFOS, PFDA, PFTeDA). However, peculiar behaviors have also been evidenced (PFOS, PFTeDA), probably related to the porous structure and elemental composition of the two materials. Correlation between pore size and adsorption capacity has also been evidenced, showing higher performances for PW. These results highlighted an encouraging prospective for the replacement of well-known manufactured adsorbents as AC in the remediation field. In fact, using alternative biosorbents has less environmental and cost-effective impact in the long term. Following this point of view, in order to reach and possibly exceed AC performances, further investigation has to be explored by: i) column tests (both for single PFAS compound and mixtures); and ii) studying functionalization procedures to enhance adsorption capacity for both DS and PW.

Supplementary Materials

The following supporting information can be downloaded at: Preprints.org, Table S1: PFAS compounds investigated, relative molecular formulas, weights and octanol-water partition coefficients (Log Kow); Table S2: Electronic parameters and retention time (RT) of each PFAS compound investigated; Table S3: Eluition gradient in column for PFAS analysis; Table S4: Isotherm parameters, with corresponding regression coefficients (R2).

Author Contributions

Conceptualization, M.S. and G.S.; methodology, G.S. and M.S.; software, M.S., and I.P.; validation, C.R., G.S. and M.S.; formal analysis, M.S. and I.P.; investigation, M.S. and R.C.; resources, M.P.P. and R.R.; data curation, C.R.; writing—original draft preparation, M.S.; writing—review and editing, G.S., C.R., R.R..; visualization, R.R.; supervision, M.P.P.; project administration, M.P.P.; funding acquisition, C.R. All authors have read and agreed to the published version of the manuscript.

Funding

This research was funded by INAIL, grant number PAR2022-2024 OB.1.

Acknowledgments

The authors wish to acknowledge Dr. Gianluca Zanellato and Centro di Ricerca per le Nanotecnologie Applicate all’Ingegneria–CNIS of Università degli Studi di Roma “La Sapienza”.

Conflicts of Interest

The authors declare no conflicts of interest.

References

  1. European Chemical Agency (ECHA). Available online: https://echa.europa.eu/hot-topics/perfluoroalkyl-chemicals-pfas (Accessed on: 1 July 2024).
  2. Ng, C.A.; Hungerbühler, K. Bioconcentration of perfluorinated alkyl acids: how important is specific binding? Environmental Science & Technology 2013, 47, 7214–7223. [Google Scholar] [CrossRef]
  3. National Institute of Environmental Health Sciences NIEHS. Available at: https://www.niehs.nih.gov/health/topics/agents/pfc/index.cfm#footnote.
  4. Fenton, S.E.; Ducatman, A.; Boobis, A.; DeWitt, J.C.; Lau, C.; Ng, C. Smith, J.S.; Roberts, S.M. Per- and Polyfluoroalkyl Substance Toxicity and Human Health Review: Current State of Knowledge and Strategies for Informing Future Research. Environmental Toxicology And Chemistry 2021, 40, 606–630. [Google Scholar] [CrossRef]
  5. Rickard, B.P.; Rizvi, I.; Fenton, S.E. Per- and poly-fluoroalkyl substances (PFAS) and female reproductive outcomes: PFAS elimination endocrine-mediated effects and disease. Toxicology 2021, 465. [Google Scholar] [CrossRef] [PubMed]
  6. Lewis, R.C.; Johns, L.E.; Meeker, J.D. Serum Biomarkers of Exposure to Perfluoroalkyl Substances in Relation to Serum Testosterone and Measures of Thyroid Function among Adults and Adolescents from NHANES 2011–2012. International Journal of Environmental Research and Public Health 2015, 12, 6098–6114. [Google Scholar] [CrossRef] [PubMed]
  7. Liu, G.; Dhana, K.; Furtado, J.D.; Rood, J.; Zong, G.; Liang, L.; Qi, L.; Bray, G.A.; DeJong, L.; Coull, B.; Grandjean, P.; Sun, Q. Perfluoroalkyl substances and changes in body weight and resting metabolic rate in response to weight-loss diets: a prospective study. PLoS Medicine 2018, 15, e1002502. [Google Scholar] [CrossRef]
  8. Bach, C.C.; Vested, A.; Jorgensen, K.; Bonde, J.P.; Henriksen, T.B.; Toft, G. Perfluoroalkyl and polyfluoroalkyl substances and measures of human fertility: a systematic review. Critical Reviews in Toxicology 2016, 46, 735–755. [Google Scholar] [CrossRef]
  9. Yan, N.; Ji, Y.; Zhang, B.; Zheng, X.; Brusseau, M.L. Transport of GenX in Saturated and Unsaturated Porous Media. Environmental Science & Technology 2020, 54, 11876–11885. [Google Scholar] [CrossRef]
  10. Pan, Y.; Zhang, H.; Cui, Q.; Sheng, N.; Yeung, L. W. Y.; Sun, Y.; Guo, Y.; Dai, J. Worldwide distribution of novel perfluoroether carboxylic and sulfonic acids in surface water. Environmental Science & Technology 2018, 52, 7621–7629. [Google Scholar] [CrossRef]
  11. Brandsma, S.H.; Koekkoek, J.C.; van Velzen, M. J. M.; de Boer, J. The PFOA substitute GenX detected in the environment near a fluoropolymer manufacturing plant in the Netherlands. Chemosphere 2019, 220, 493–500. [Google Scholar] [CrossRef]
  12. Environmental Protection Agency (EPA). Fact sheet: Draft toxicity assessments for GenX chemicals and PFBS. U.S. Washington DC. Available online: https://www.epa.gov/chemical-research/human-health-toxicity-assessments-genx-chemicals (Accessed on: 1 July 2024).
  13. Ahrens, L. Polyfluoroalkyl compounds in the aquatic environment: a review of their occurrence and fate. Environmental Monitoring and Assessment 2011, 13, 20. [Google Scholar] [CrossRef]
  14. Environmental Protection Agency (EPA). Drinking Water. Standards and Health Advisories. EPA 822-F-18-001. Washington DC. Available online: https://www.epa.gov/sdwa/drinking-water-health-advisories-has (Accessed on: 1 July 2024).
  15. Environmental Protection Agency. (EPA). Fact sheet: PFAS National Primary Drinking Water Regulation. Available online: https://dep.nj.gov/pfas/epa-pfas-rule/ (Accessed on: 1 July 2024).
  16. Ross, I.; McDonough, J.; Miles, J.; Storch, P.; Kochunarayanan, P.T.; Kalve, E.; Hurst, J.; Dasgupta, S.S.; Burdick, J. A review of emerging technologies for remediation of PFASs. Remediation 2018, 28, 101–126. [Google Scholar] [CrossRef]
  17. Meegoda, J.N.; Kewalramani, J.A.; Li, B.; Marsh, R.W. A Review of the Applications Environmental Release and Remediation Technologies of Per- and Polyfluoroalkyl Substances. International Journal of Environmental Research and Public Health 2020, 17, 8117. [Google Scholar] [CrossRef] [PubMed]
  18. Rahman, F.M.; Peldszus, S.; Anderson, W.B. Behaviour and fate of perfluoroalkyl and polyfluoroalkyl substances (PFASs) in drinking water treatment: A review. Water Research 2014, 50, 318–340. [Google Scholar] [CrossRef] [PubMed]
  19. McCleaf, P.; Englund, S.; Ostlund, A.; Lindegren, K.; Wiberg, K.; Ahrens, L. Removal efficiency of multiple poly- and perfluoroalkyl substances (PFASs) in drinking water using granular activated carbon (GAC) and anion exchange (AE). Water Research 2017, 120, 77–87. [Google Scholar] [CrossRef]
  20. Liu, C.J.; David, W.; Bellona, C. Removal of per- and polyfluoroalkyl substances (PFASs) from contaminated groundwater using granular activated carbon: a pilot-scale study with breakthrough modeling. Environmental Science: Water Research & Technology 2019, 5, 1844–853. [Google Scholar] [CrossRef]
  21. Najm, I.; Gallagher, B.; Vishwanath, N.; Blute, N.; Gorzalski, A.; Feffer, A.; Richardson, S. Per- and polyfluoroalkyl substances removal with granular activated carbon and a specialty adsorbent: A case study. AWWA Water Science 2021, 3, e1245. [Google Scholar] [CrossRef]
  22. Zhang, D.; He, Q.; Wang, M.; Zhang, W.; Liang, Y. Sorption of perfluoroalkylated substances (PFASs) onto granular activated carbon and biochar. Environmental Technology, 2019; 42, 1798–1809. [Google Scholar] [CrossRef]
  23. Aboughaly, M.; Fattah, I. Production of Biochar from Biomass Pyrolysis for Removal of PFAS from Wastewater and Biosolids: A Critical Review. Preprints 2023, 2023040309. [Google Scholar] [CrossRef]
  24. Silvani, L.; Vrchotova, B.; Kastanek, P.; Demnerova, K.; Pettiti, I.; Petrangeli, Papini, M. Characterizing Biochar as Alternative Sorbent for Oil Spill Remediation. Scientific Reports 2017, 7, 43912. [Google Scholar] [CrossRef] [PubMed]
  25. Sonego, E.; Simonetti, G.; Di Filippo, P.; Riccardi, C.; Buiarelli, F.; Fresta, A.; Olivastri, M.; Pomata, D. Characterization of organophosphate esters (OPEs) and polyfluoralkyl substances (PFASs) in settled dust in specific workplaces. Environmental Science and Pollution Research 2022, 29, 52302–52316. [Google Scholar] [CrossRef]
  26. Brunauer, S.; Emmett, P. H.; Teller, E. Adsorption of Gases in Multimolecular Layers. Journal of the American Chemical Society 1938, 60, 309–319. [Google Scholar] [CrossRef]
  27. Barrett, E.P.; Joyner, L.G.; Halenda, P.P. The Determination of Pore Volume and Area Distributions in Porous Substances. I. Computations from Nitrogen Isotherms. Journal of the American Chemical Society 1951, 73, 373–380. [Google Scholar] [CrossRef]
  28. Lippens, B.C.; de Boer, J.H. Studies on pore systems in catalysts: V. The t method Journal of Catalysis 1965, 4, 319–323. [Google Scholar] [CrossRef]
  29. Gurvitsch, L. Physicochemical attractive force. Russian Journal of Physical Chemistry 1915, 47, 805–827. [Google Scholar]
  30. Maziarka, P.; Sommersacher, P.; Wang, X.; Kienzl, N.; Retschitzegger, S.; Prins, W.; Hedin, N.; Ronsse, F. Tailoring of the pore structures of wood pyrolysis chars for potential use in energy storage applications. Applied Energy 2021, 286, 116431. [Google Scholar] [CrossRef]
  31. Libby, B.; Monson, P.A. Adsorption/desorption hysteresis in inkbottle pores: a density functional theory and Monte Carlo simulation study. Langmuir, 2004; 20, 4289-94. [Google Scholar] [CrossRef]
  32. Fan, C.; Do, D. D.; Nicholson, D. On the Cavitation and Pore Blocking in Slit-Shaped Ink-Bottle Pores. Langmuir 2011, 27, 3511–3526. [Google Scholar] [CrossRef]
  33. Lei, X.; Lian, Q.; Zhang, X.; Karsili, T.K.; Holmes, W.; Chen, Y.; Zappi, M.E.; Gang, D.D. A review of PFAS adsorption from aqueous solutions: Current approaches engineering applications challenges and opportunities. Environmental Pollution 2023, 321, 121138. [Google Scholar] [CrossRef] [PubMed]
  34. Zhang, D.; He, Q.; Wang, M.; Zhang, W.; Liang, Y. Sorption of perfluoroalkylated substances (PFASs) onto granular activated carbon and biochar. Environmental Technology 2019, 42, 1798–1809. [Google Scholar] [CrossRef] [PubMed]
  35. Ziwen, D.; Shubo, D.; Yue, B.; Qian, H.; Bin, W.; Jun, H.; Gang, Y. Adsorption behavior and mechanism of perfluorinated compounds on various adsorbents—A review. Journal of Hazardous Materials 2014, 274, 443–454. [Google Scholar] [CrossRef]
  36. Luft, C.M.; Schutt, T.C.; Shukla, M.K. Properties and Mechanisms for PFAS Adsorption to Aqueous Clay and Humic Soil Components. Environmental Science & Technology 2022, 56, 10053–10061. [Google Scholar] [CrossRef]
  37. Yu, Q.; Zhang, R.; Deng, S.; Huang, J.; Yu, G. Sorption of perfluorooctane sulfonate and perfluorooctanoate on activated carbons and resin: Kinetic and isotherm study. Water Research 2009, 43, 1150–8. [Google Scholar] [CrossRef]
  38. Zhang, D.; Luo, Q.; Gao, B.; Chiang, S.Y.; Woodward, D.; Huang, Q. Sorption of perfluorooctanoic acid; perfluorooctane sulfonate and perfluoroheptanoic acid on granular activated carbon. Chemosphere 2015, 144, 2336–42. [Google Scholar] [CrossRef] [PubMed]
  39. Lawrance, G.A. Coordinated trifluoromethanesulfonate and fluorosulfate. Chemical Reviews 1986, 86, 17e33. [Google Scholar] [CrossRef]
  40. Ochoa-Herrera, V.; Sierra-Alvarez, R. Removal of perfluorinated surfactants by sorption onto granular activated carbon zeolite and sludge. Chemosphere 2008, 72, 1588–1593. [Google Scholar] [CrossRef] [PubMed]
  41. Hansen, M.C.; Børresen, M.H.; Schlabach, M.; Cornelissen, G. Sorption of perfluorinated compounds from contaminated water to activated carbon. Journal of Soil and Sediments 2010, 10, 179–185. [Google Scholar] [CrossRef]
  42. Inyang, M.; Dickenson, E.R.V. The use of carbon adsorbents for the removal of perfluoroalkyl acids from potable reuse systems. Chemosphere 2017, 184, 168–175. [Google Scholar] [CrossRef]
Disclaimer/Publisher’s Note: The statements; opinions and data contained in all publications are solely those of the individual author(s) and contributor(s) and not of MDPI and/or the editor(s). MDPI and/or the editor(s) disclaim responsibility for any injury to people or property resulting from any ideas; methods; instructions or products referred to in the content.
Figure 1. Laboratory procedure from batch test to analytical determination.
Preprints 111380 g001
Figure 2. (a) N2 adsorption/desorption isotherms; (b) total pore volume of DS biochar.
Preprints 111380 g002
Figure 3. SEM images of DS (a,b), provided by the CNIS institute.
Preprints 111380 g003
Figure 4. Sorption kinetics of PFOS on PW (a) and DS (b) at 2 g L-1.
Preprints 111380 g004
Figure 5. Sorption isotherms of PFOS (a, b), GenX (c, d), PFHxA (e, f), PFOA (g, h), PFDA (i, l), PFTeDA (m, n) on PW and DS biochar at 10 µg L-1.
Preprints 111380 g005aPreprints 111380 g005b
Table 1. Specific surface area and pore volume of DS and PW biochar.
Pinewood
Surface area (m2 g-1) Volume pore (m3 g-1)
Total 343±2 0.383
Micropores 224 0.136
Mesopores 119 0.247
Date seeds
Surface area (m2 g-1) Volume pore (m3 g-1)
Total 290±4 0.136
Micropores 270 0.110
Mesopores 20 0.026
Disclaimer/Publisher’s Note: The statements, opinions and data contained in all publications are solely those of the individual author(s) and contributor(s) and not of MDPI and/or the editor(s). MDPI and/or the editor(s) disclaim responsibility for any injury to people or property resulting from any ideas, methods, instructions or products referred to in the content.
Copyright: This open access article is published under a Creative Commons CC BY 4.0 license, which permit the free download, distribution, and reuse, provided that the author and preprint are cited in any reuse.
Alerts
Prerpints.org logo

Preprints.org is a free preprint server supported by MDPI in Basel, Switzerland.

Subscribe

© 2025 MDPI (Basel, Switzerland) unless otherwise stated