Submitted:
08 July 2024
Posted:
09 July 2024
You are already at the latest version
Abstract
Keywords:
1. Introduction
2. Materials and Methods
2.1. Experimental Site
| Depth (cm) | Particle Size Distribution (%) | Texture | ||
| Sand | Silt | Clay | ||
| 0-20 | 24.0±0.6 | 23.0±0.5 | 53.0±0.4 | clay |
| 20-40 | 32.3±0.9 | 16.2±0.7 | 51.5±0.6 | clay |
| 40-60 | 17.8±0.9 | 20.4±0.9 | 61.8±0.3 | clay |
| 60-80 | 30.3±1.3 | 40.1±1.0 | 29.6±1.4 | clay loam |
| 80-100 | 58.4±2.0 | 23.7±1.5 | 17.9±1.4 | sandy loam |
| Depth (cm) | BD | Ks | FC | WP |
| 0-15 | 1.34±0.16 | 0.066±0.17 | 0.38±0.05 | 0.21±0.04 |
| 15-30 | 1.35±0.16 | 0.066±0.17 | 0.38±0.05 | 0.21±0.05 |
| 30-50 | 1.39±0.15 | 0.001±0.00 | 0.39±0.04 | 0.23±0.00 |
| 50-80 | 1.29±0.16 | 0.255±0.33 | 0.34±0.10 | 0.17±0.11 |
2.2. Measurements and Data Collection
2.2.1. Soil Physical Properties
| Properties | Unit | Soil | Irrigation water | ||||
| 0-20 cm | 20-40 cm | 40-60 cm | 60-80 cm | 80-100 cm | |||
| pH | 8.13±0.03 | 8.13±0.09 | 7.93±0.09 | 8.03±0.03 | 8.20±0.26 | 7.73±0.40 | |
| Electrical conductivity | dS/m | 1.67±0.32 | 1.84±0.54 | 3.46±0.23 | 2.74±0.92 | 1.84±0.70 | 1.01±0.11 |
| Sodium | ppm | 518.3±127.6 | 719.7±200.9 | 1071.7±354.8 | 940.0±41 | 454.7±120.6 | 96.3±15.4 |
| Chloride | ppm | 121.9±13.5 | 108.4±33.1 | 142.6±61.2 | 190.3±76.6 | 111.6±57.8 | 93.5±2.40 |
| Calcium | ppm | 5581.0±32.5 | 5482.0±52.2 | 6952.7±511.0 | 5685.7±905.0 | 3865.0±1468.8 | 95.8±21.3 |
| Magnesium | ppm | 578.3±10.1 | 639.7±23.0 | 795.7±60.6 | 567.7±134.2 | 360.0±128.5 | 18.5±2.02 |
| Potassium | ppm | 430.0±38.2 | 407.3±23.7 | 381.3±44.5 | 198.7±42.0 | 171.0±80.6 | 6.25±0.25 |
| Nitrate | ppm | 31.4±9.7 | 10.83±2.04 | 7.63±2.40 | 4.47±1.73 | 4.33±1.87 | 34.1±18.5 |
| Sulfur | ppm | 219.6±61.7 | 236.0±76.5 | 1156.4±240.6 | 1347.1±601.7 | 630.7±279.4 | 70.8±3.38 |
2.2.2. Soil Water Content
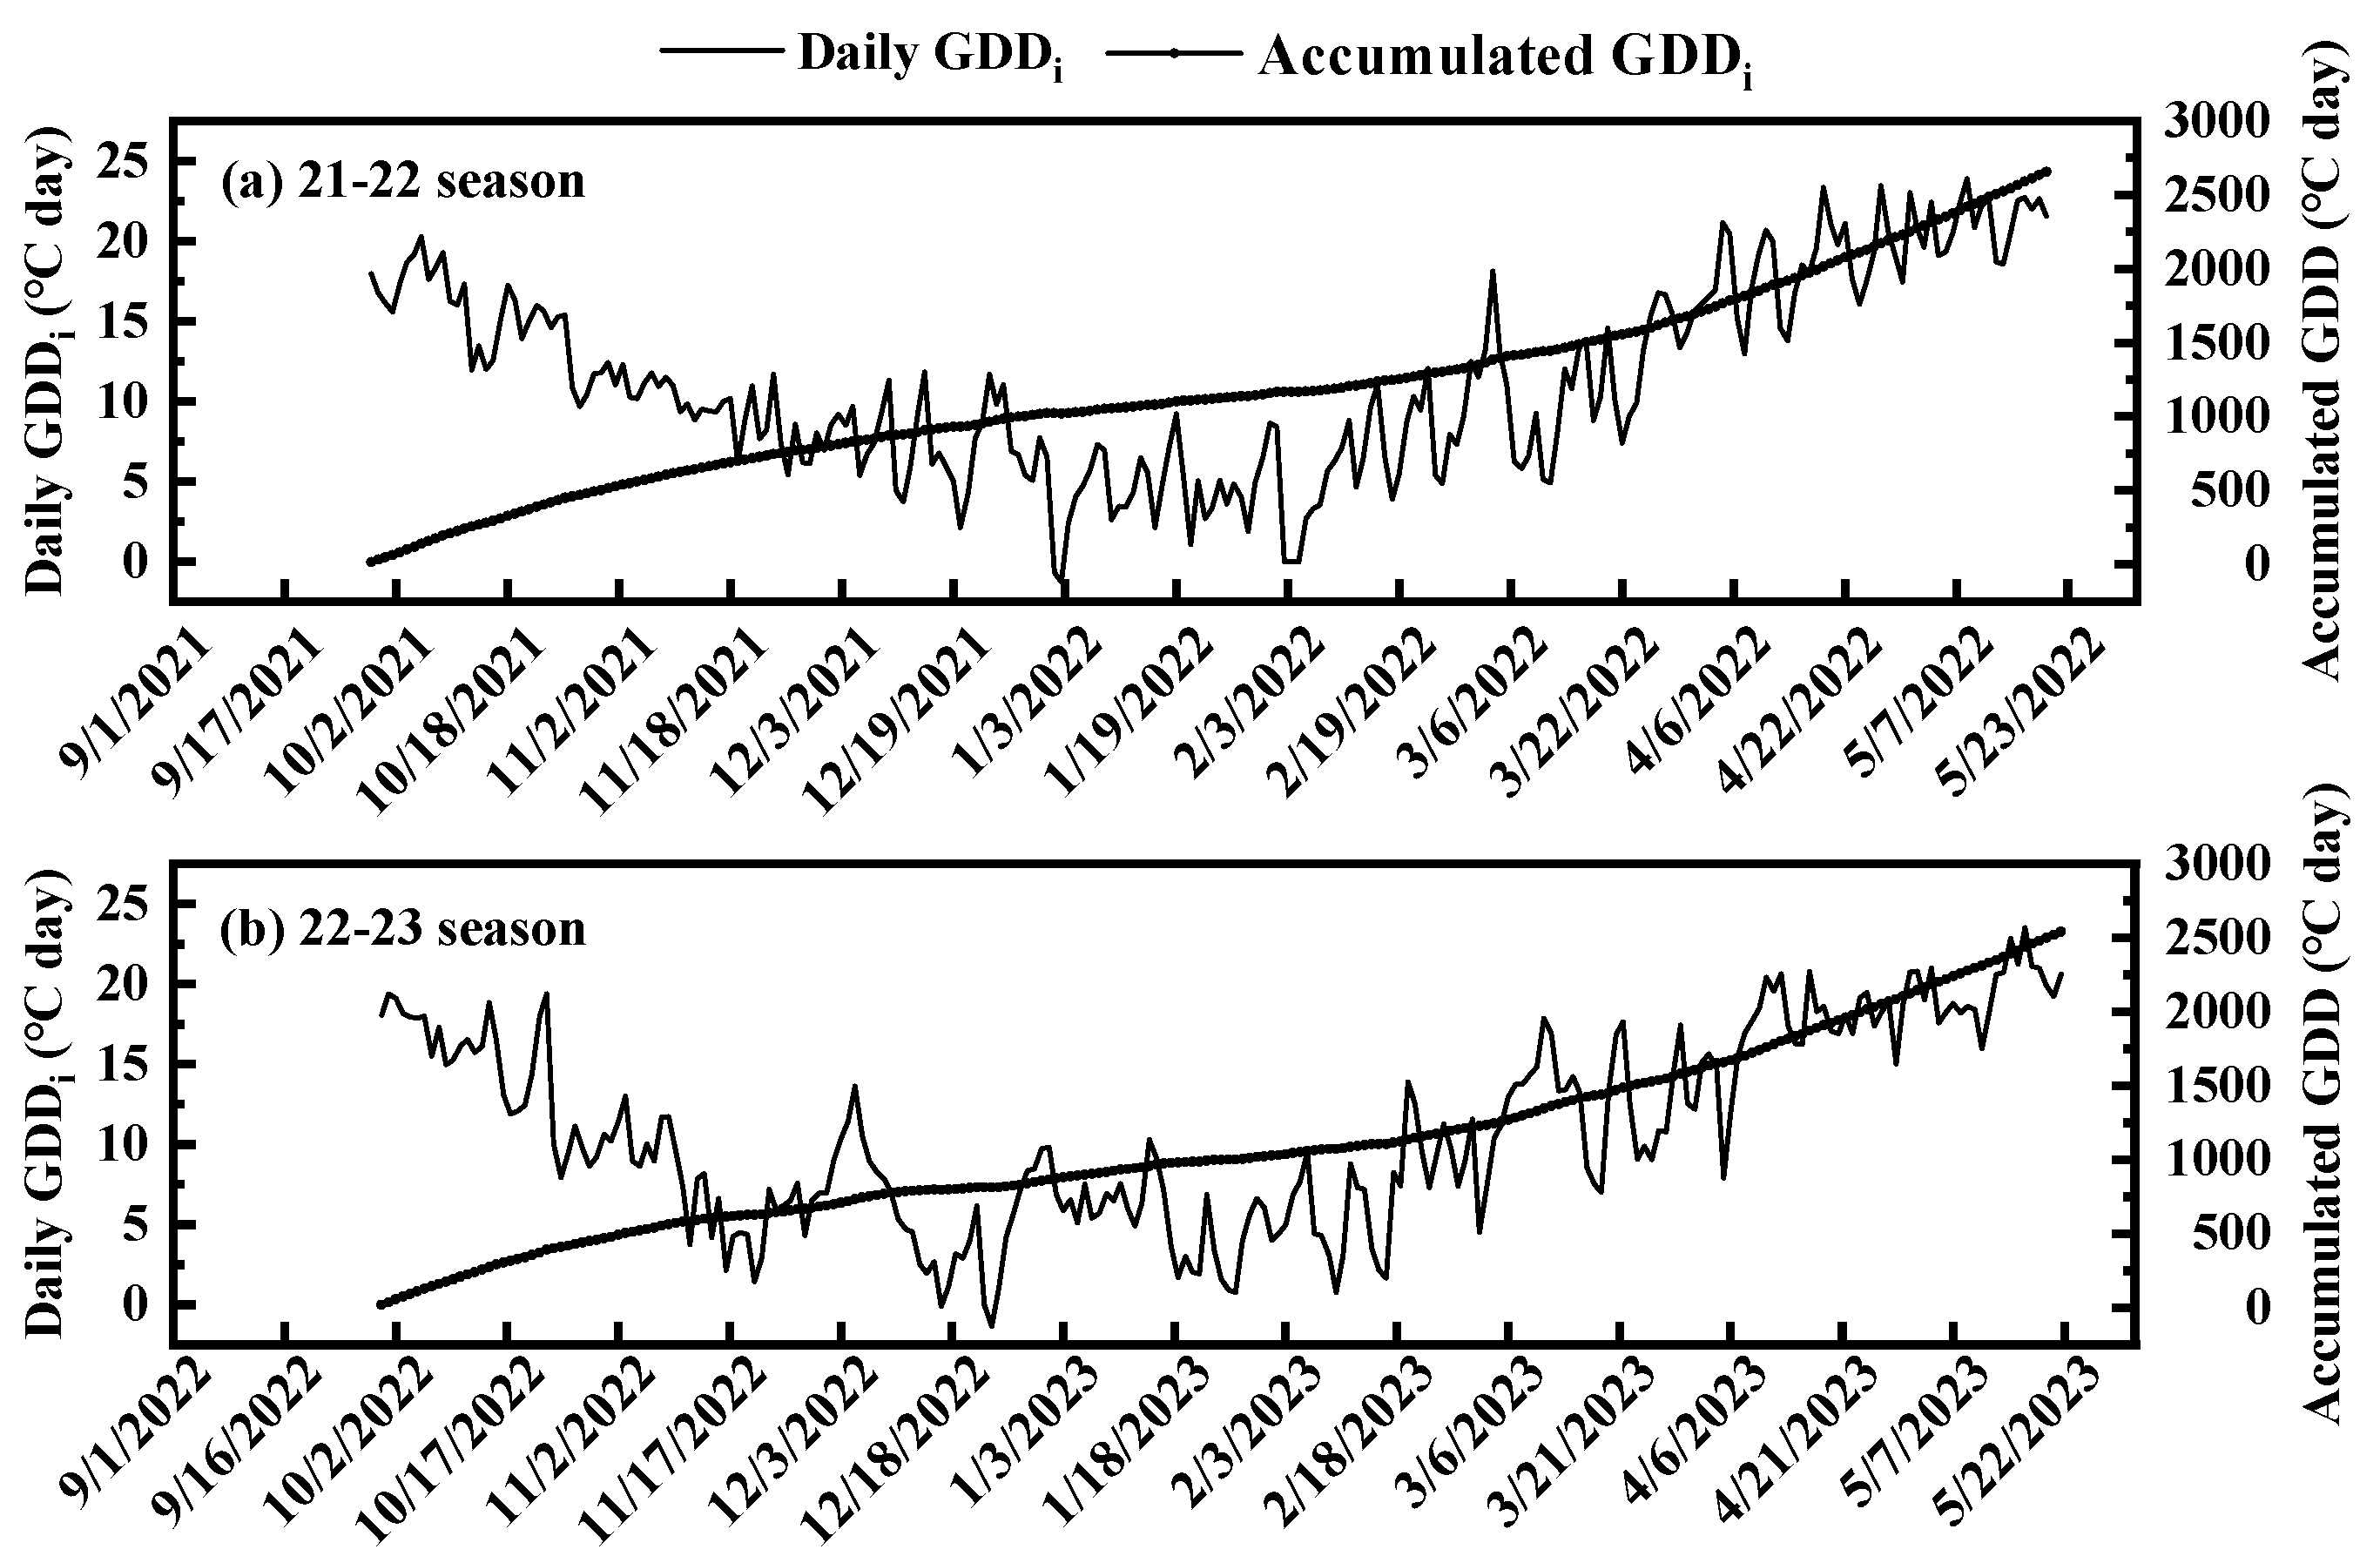
2.2.3. Meteorology
2.3. Crop Coefficients Approach
Methods of reference evapotranspiration estimation
Statistical Indicators
2.4. Global Sensitive Analysis
3. Results
3.1. Temporal Variation in Soil Water Content (SWC) and Deep Percolation (DP)
3.2. Reference Evapotranspiration Using the Three Contrasting Methods
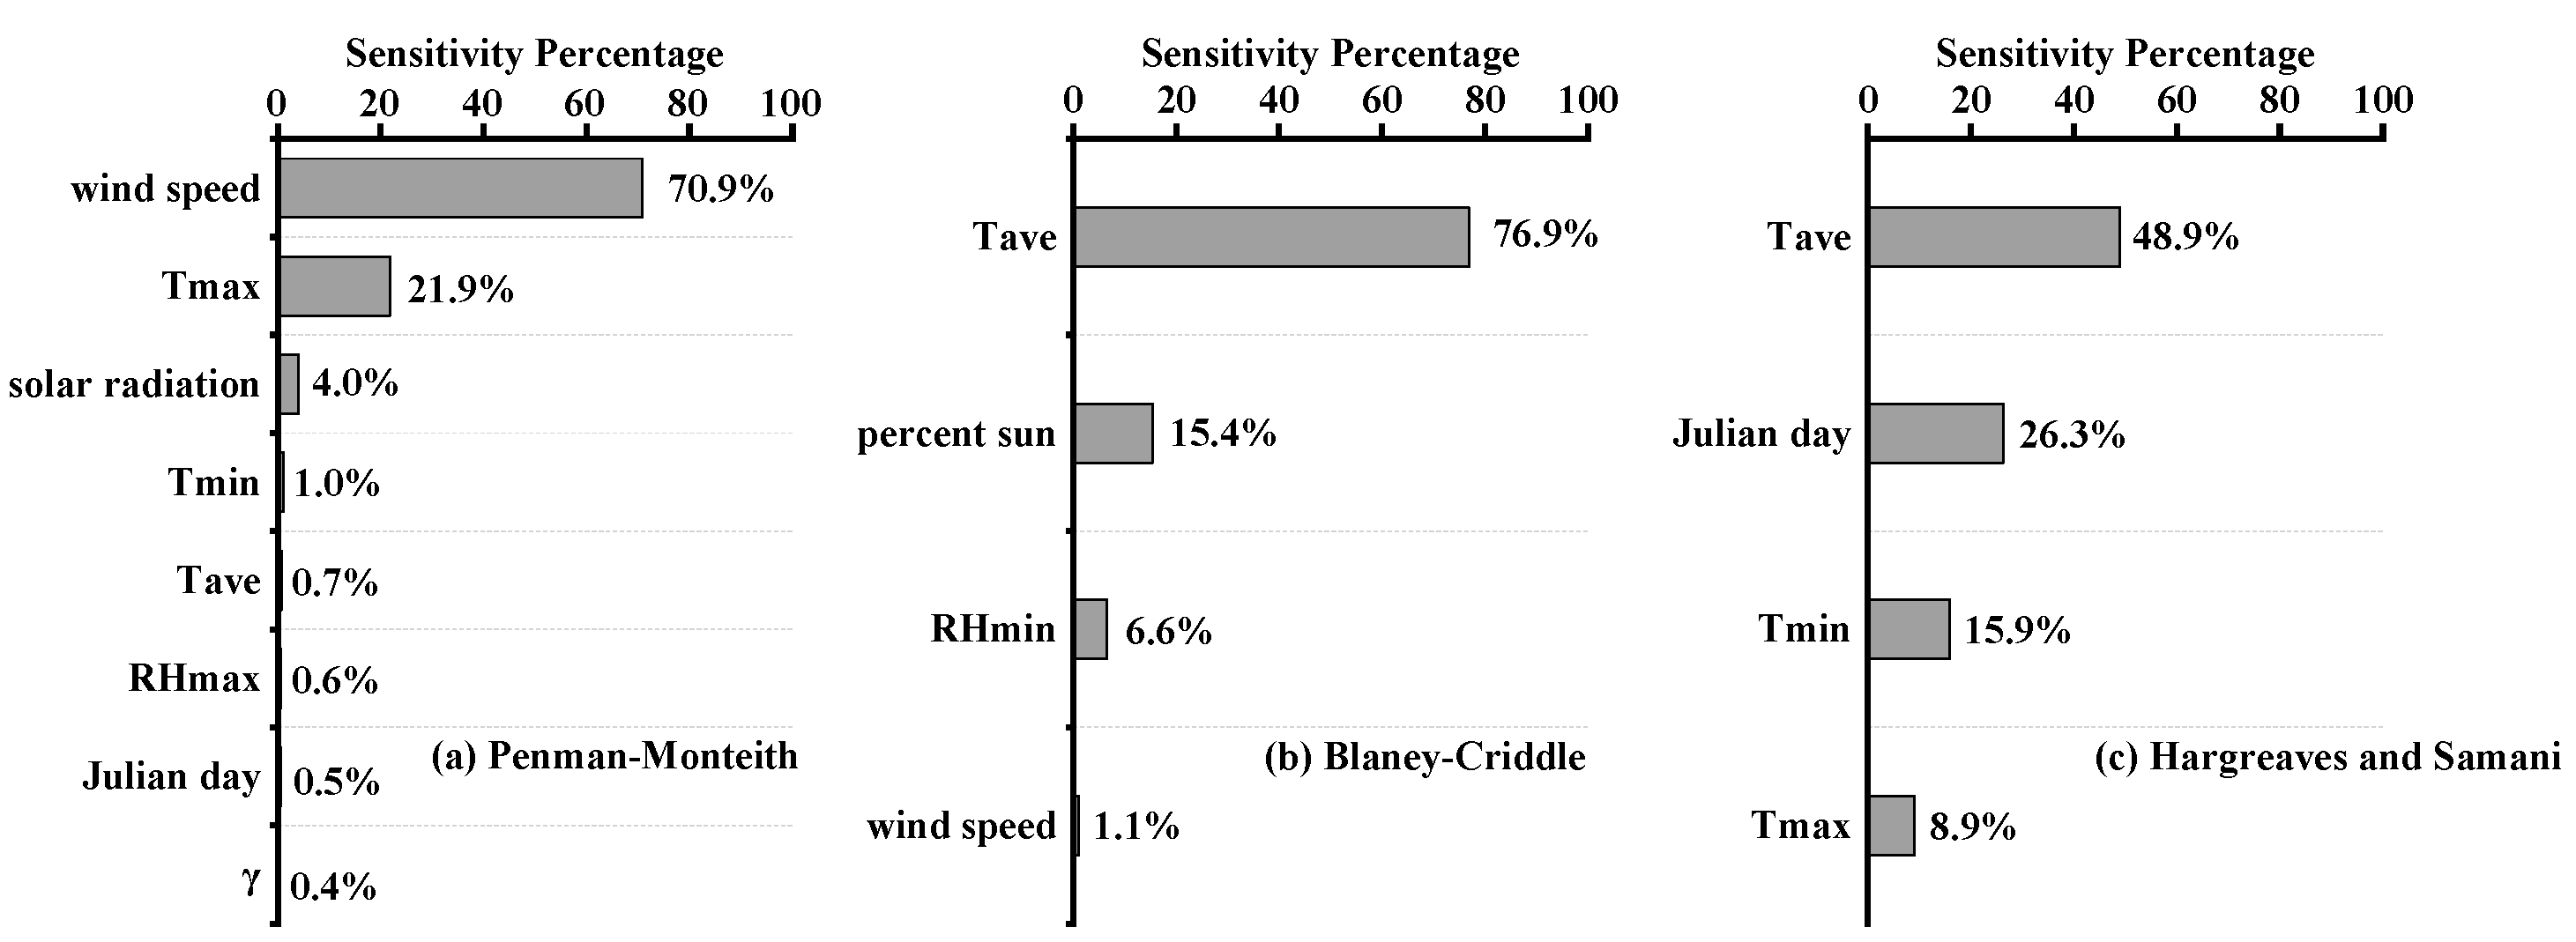
3.3. Input Parameters’ Assessment for the Three ETo Estimation Methods
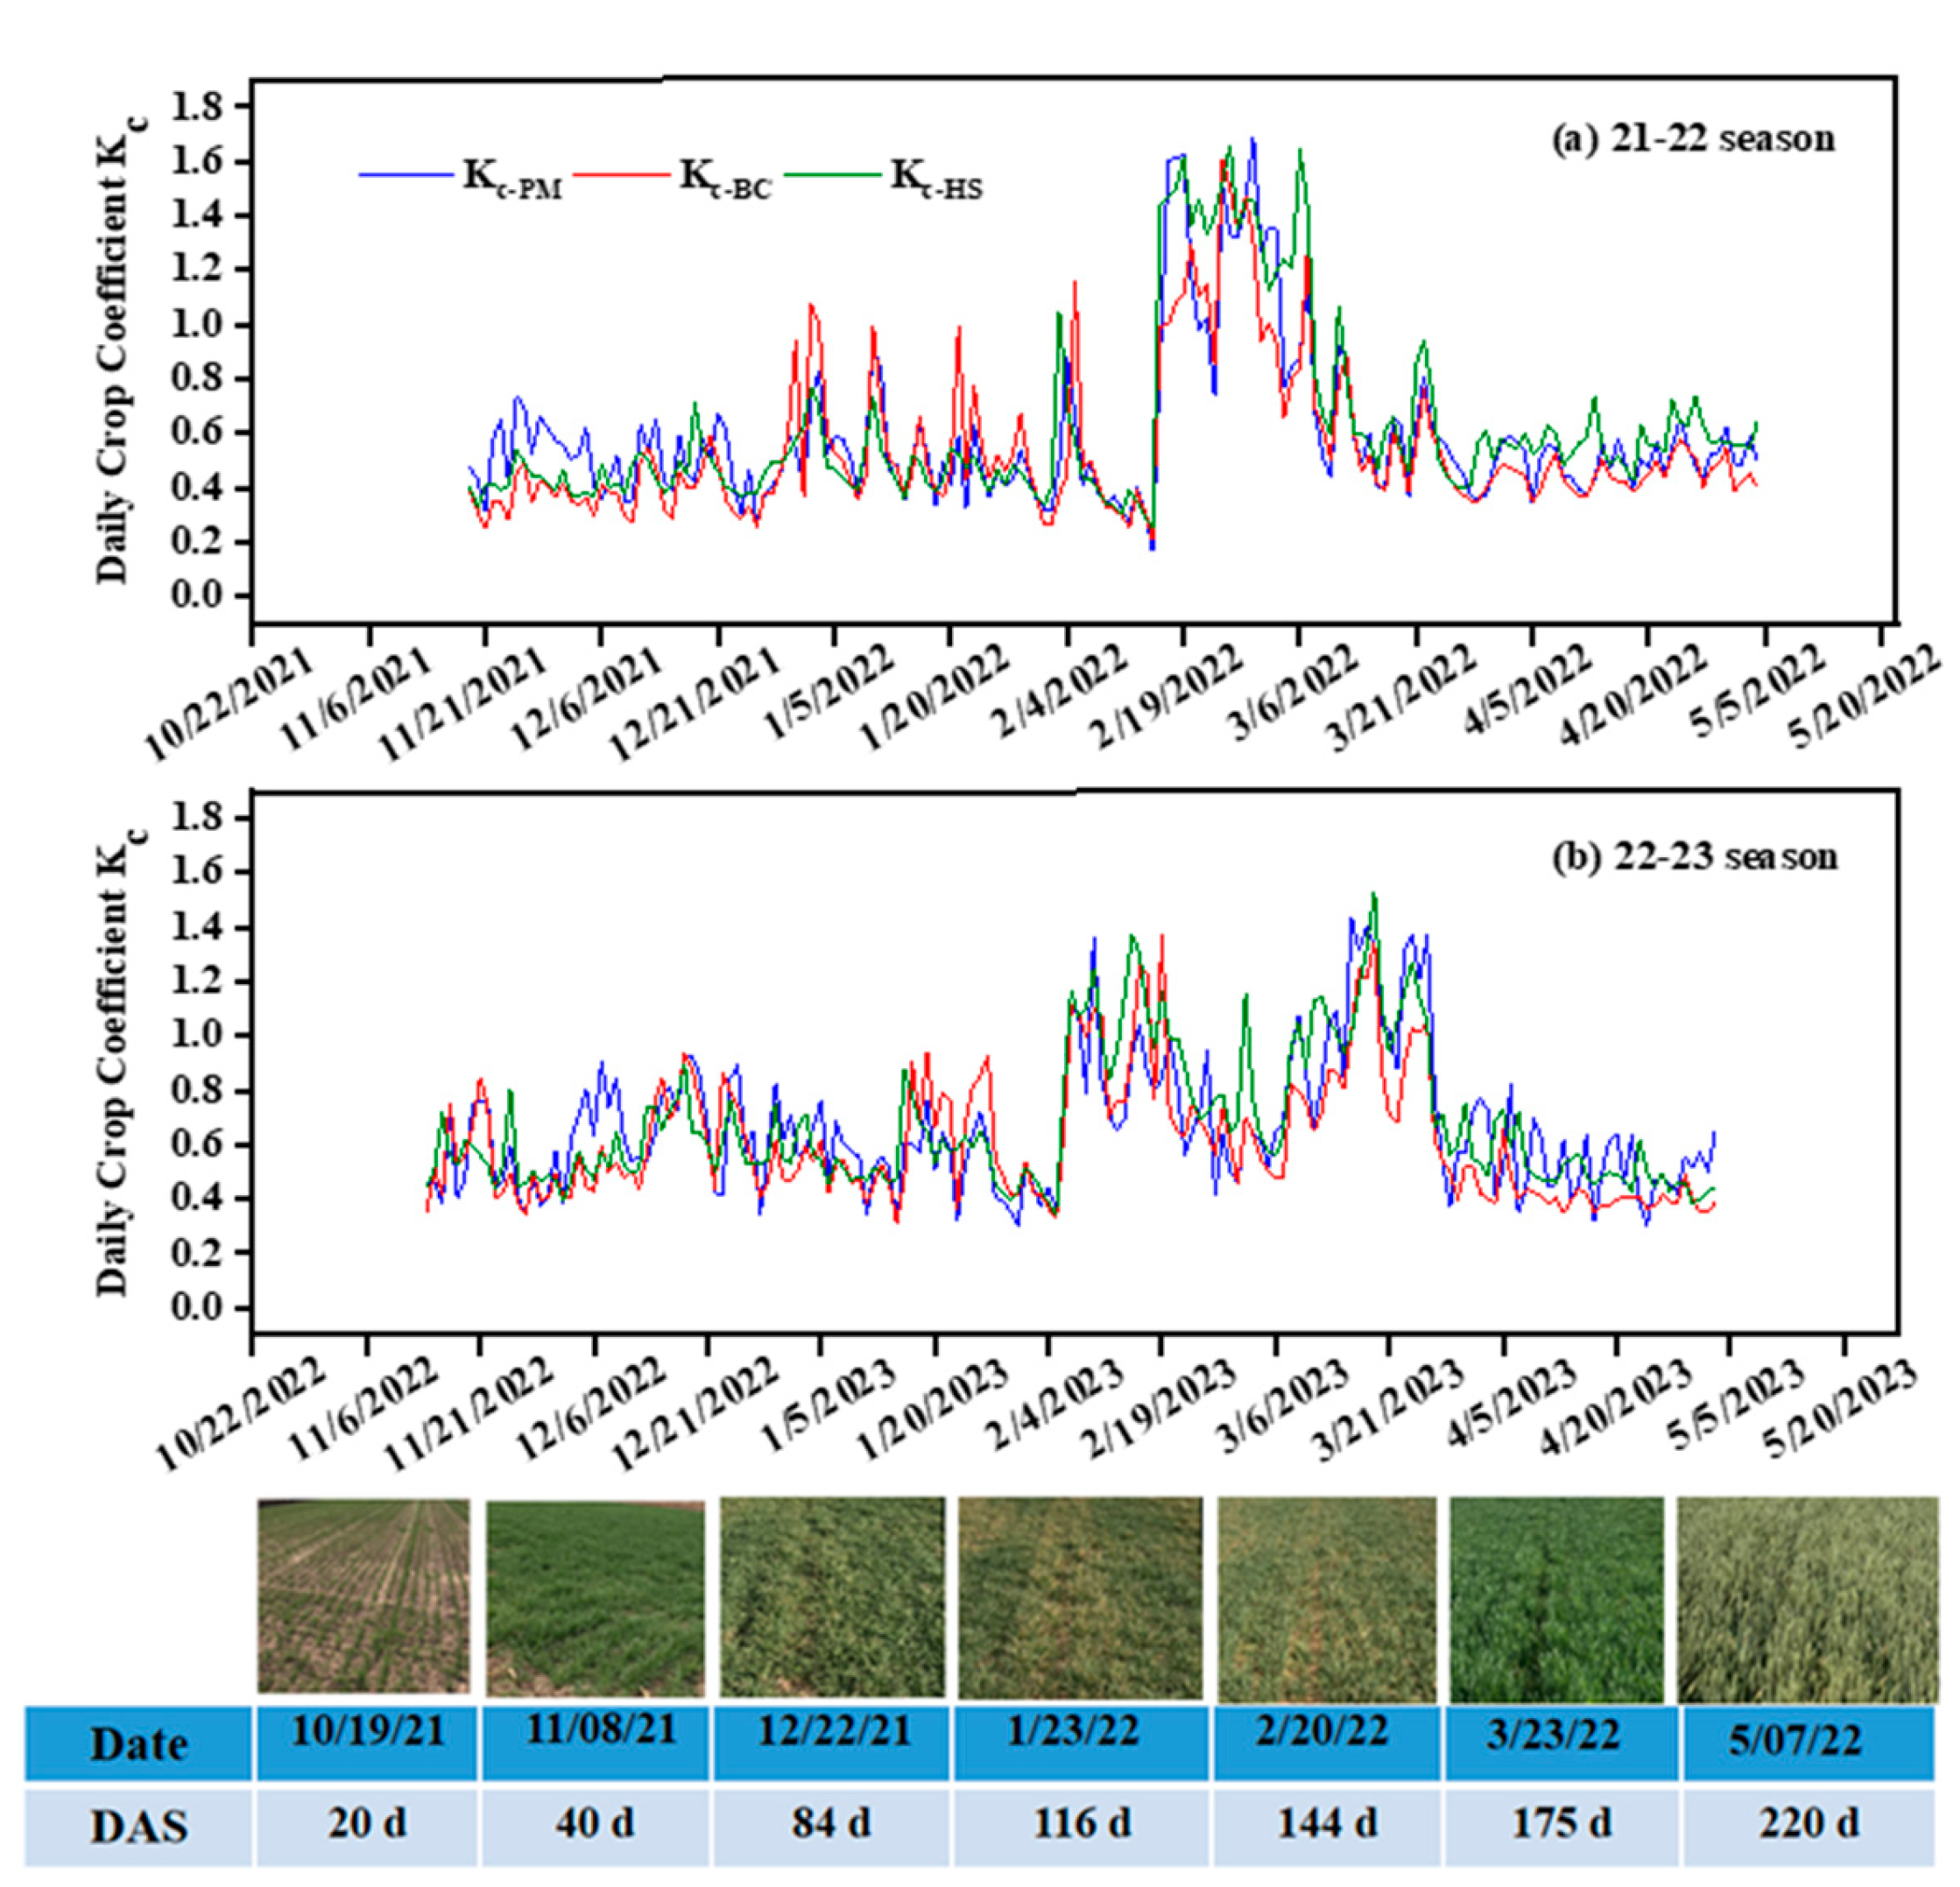
3.4. Crop Coefficients
4. Discussion
5. Conclusions
Author Contributions
Funding
Data Availability Statement
Acknowledgments
Conflicts of Interest
References
- Franch, B.; Vermote, E.F.; Becker-Reshef, I.; Claverie, M.; Huang, J.; Zhang, J.; Justice, C.; Sobrino, J.A. Improving the timeliness of winter wheat production forecast in the United States of America, Ukraine and China using MODIS data and NCRA growing degree day information. Remote Sens. of Environ. 2015, 161, 131–148. [Google Scholar] [CrossRef]
- Wu, X.C.; Xiao, X.M.; Steiner, J.; Yang, Z.W.; Qin, Y.W.; Wang, J. Spatiotemporal changes of winter wheat planted and harvested areas, photosynthesis and grain production in the contiguous United States from 2008-2018. Remote Sens. 2021, 13, 1735. [Google Scholar] [CrossRef]
- Maulana, F.; Kim, K.S.; Anderson, J.D.; Sorrells, M.E.; Butler, T.J.; Liu, S.Y.; Baenziger, P.S.; Byrne, P.F.; Ma, X.F. Genomic selection of forage quality traits in winter wheat. Crop Sci. 2019, 59, 2473–2483. [Google Scholar] [CrossRef]
- United States Department of Agriculture, National Agricultural Statistics Service. News Release, January 12, 2021, New Mexico Field Office. https://www.nass.usda.gov/ Statistics_by_State/New_Mexico/Publications/News_Releases/2021/NM-Crop-Production-01122021.pdf. 12 January.
- United States Department of Agriculture, National Agricultural Statistics Service. New Mexico crop progress, May 31, 2022, New Mexico Field Office. https://www.nass.usda.gov/Statistics_by_State/New_Mexico/Publications/Crop_Progress_%26_Condition/2022/NM-Crop-Progress-05222022.pdf. 31 May.
- Tapley, M.; Ortiz, B.V.; Santen, E.V.; Balkcom, K.S.; Mask, P.; Weaver, D.B. Location, seeding date, and variety interactions on winter wheat yield in Southeastern United States. Agron. J. 2013, 105, 509–518. [Google Scholar] [CrossRef]
- Vitale, J.; Adam, B.; Vitale, P. Economics of wheat breeding strategies: focusing on Oklahoma Hard Red winter wheat. Agron. 2020, 10, 238. [Google Scholar] [CrossRef]
- Deb, S.K.; Shukla, M.K.; Sharma, P.; Mexal, J.G. Soil water depletion in irrigated mature peacans under contrasting soil textures for arid Southern New Mexico. Irrig. Sci. 2013, 31, 69–85. [Google Scholar] [CrossRef]
- Office of the State Engineer, State of New Mexico. Lower Rio Grande Regional Water Plan, 2017; https://www.ose.state.nm.us/Planning/documents/Reg11_LowerRioGrande RegionalWaterPlan2017pdf.
- López-Urrea, R.; Sánchez, J.M.; de la Cruz, F.; González-Piqueras, J.; Chávez, J.L. Evapotranspiration and crop coefficients from lysimeter measurements for sprinkler irrigated canola. Agric. Water Manag. 2020, 239, 106260. [Google Scholar] [CrossRef]
- Er-Raki, S.; Ezzahar, J.; Merlin, O.; Amazirh, A.; Hssaine, B.A.; Kharrou, M.H.; Khabba, S.; Chehbouni, A. Performance of the HYDRUS-1D model for water balance components assessment of irrigated winter wheat under different water managements in semi-arid region of Morocco. Agric. Water Manag. 2021, 244, 106546. [Google Scholar] [CrossRef]
- Rashid Niaghi, A.; Jia, X. New approach to improve the soil water balance method for evapotranspiration estimation. Water. 2019, 11, 2478. [Google Scholar] [CrossRef]
- Pereira, L.S.; Paredes, P.; Jovanovic, N. Soil water balance models for determining crop water and irrigation requirements and irrigation scheduling focusing on the FAO56 method and the dual Kc approach. Agric. Water Manag. 2020, 241, 106357. [Google Scholar] [CrossRef]
- Rafi, Z.; Merlin, O.; Le Dantec, V.; Khabba, S.; Mordelet, P.; Er-Raki, S.; Ferrer, F. Partitioning evapotranspiration of a drip-irrigated wheat crop: Inter-comparing eddy covariance-, sap flow-, lysimeter- and FAO-based methods. Agric. For. Meteorol. 2019, 265, 310–326. [Google Scholar] [CrossRef]
- Chen, X.; Su, Z.; Ma, Y.; Middleton, E.M. Optimization of a remote sensing energy balance method over different canopy applied at global scale. Agric. For. Meteorol. 2019, 279, 107633. [Google Scholar] [CrossRef]
- Allen, R.G.; Pereira, L.S.; Howell, T.A.; Jensen, M.E. Evapotranspiration information reporting: I. Factors governing measurement accuracy. Agric. Water Manag. 2011, 98, 899–920. [Google Scholar] [CrossRef]
- Pereira, L.S.; Paredes, P.; López-Urrea, R.; Hunsaker, D.J.; Mota, M.; Mohammadi Shad, Z. Standard single and basal crop coefficients for vegetable crops, an update of FAO56 crop water requirements approach. Agric. Water Manag. 2021, 243, 106196. [Google Scholar] [CrossRef]
- Mokhtari, A.; Noory, H.; Vazifedoust, M.; Bahrami, M. Estimating net irrigation requirement of winter wheat using model- and satellite-based single and basal crop coefficients. Agric. Water Manag. 2018, 208, 95–106. [Google Scholar] [CrossRef]
- Tegos, A.; Malamos, N.; Koutsoyiannis, D. A parsimonious regional parametric evapotranspiration model based on a simplification of the Penman-Monteith formula. J. Hydrol. 2015, 524, 708–717. [Google Scholar] [CrossRef]
- Allen, R.G.; Pereira, L.S.; Raes, D.; Smith, M. Crop evapotranspiration-Guidelines for computing crop water requirements-FAO Irrigation and drainage paper 56, FAO, Rome, vol. 300, 1998, p. D05109.
- Ko, J.H.; Piccinni, G.; Marek, T.; Howell, T. Determination of growth-stage-specific crop coefficients (Kc) of cotton and wheat. Agric. Water Manag. 2009, 96, 1691–1697. [Google Scholar] [CrossRef]
- Ghamarnia, H.; Mousabeygi, F.; Amiri, S.; Amirkhani, D. Evaluation of a few evapotranspiration models using lysimeteric measurements in a semi-arid climate region. Int. J. Plant &Soil Sci. 2015, 5, 100–109. [Google Scholar] [CrossRef]
- Tahashildar, M.; Bora, P.K.; Ray, L.I.P.; Thakuria, D. Comparison of different reference evapotranspiration (ETo) models and determination of crop-coefficients of french bean (Phesiolus vulgaris) in mid hill region of Meghalaya. J. Agrometeorol. 2017, 19, 233–237. [Google Scholar] [CrossRef]
- Djaman, K.; O'Neill, M.; Diop, l.; Bodian, A.; Allen, S.; Koudahe, K.; Lombard, K. Evaluation of the Penman-Monteith and other 34 reference evapotranspiration equations under limited data in a semiarid dry climate. Theor. Appl. Climatol. 2019, 137, 729–743. [Google Scholar] [CrossRef]
- Droogers, P.; Allen, R.G. Estimating reference evapotranspiration under inaccurate data conditions. Irrig. Drain. Sys. 2002, 16, 33–45. [Google Scholar] [CrossRef]
- Jabloun, M.D.; Sahli, A. Evaluation of FAO-56 methodology for estimating reference evapotranspiration using limited climatic data: application to Tunisia. Agric. Water Manag. 2008, 95, 707–715. [Google Scholar] [CrossRef]
- Almorox, J.; Quej, V.H.; Martí, P. Global performance ranking of temperature-based approaches for evapotranspiration estimation considering Köppen climate classes. J. Hydrol. 2015, 528, 514–522. [Google Scholar] [CrossRef]
- Samani, Z. Estimating solar radiation and evapotranspiration using minimum climatological data. J. Irrig. Drain. Eng. 2000, 126, 265–267. [Google Scholar] [CrossRef]
- Hargreaves, G.H.; Samani, Z.A. Reference crop evapotranspiration from temperature. Appl. Eng. Agric. 1985, 1, 96–99. [Google Scholar] [CrossRef]
- Doorenbos, J. ; W.O. Pruitt. Guidelines for predicting crop water requirements. Irrigation And Drainage. Paper No. 24, 2nd edition, Food and Agricultural Organization of the United Nations, Rome, Italy, 1977, 156 pp.
- Blaney, H.F.; Morin, K.V. Evaporation and consumptive water use of water, empirical formulae. Pt. 1. Am. Geophys. Union Trans. 1942, 76–83. [Google Scholar]
- Blaney, H.F.; Ewing, P.A.; Morin, K.V; Criddle, W.D. Consumptive waster use and requirements. The Pecos river joint investigation, reports of the participating agencies. National Resources Planning Board. 1942, 170–230.
- Shahidian, S.; Serralheiro, R.P.; Serrano, J.; Teixeira, J.L. Parametric calibration of the Hargreaves-Samani equation for use at new locations. Hydrol. Process. 2013, 27, 605–616. [Google Scholar] [CrossRef]
- Awal, R.; Habibi, H.; Fares, A.; Deb, S. Estimating reference crop evapotranspiration under limited climate data in West Texas. J. Hydrol. Reg. Stud. 2020, 28, 100677. [Google Scholar] [CrossRef]
- Thongkao, S.; Ditthafit, P.; Pinthong, S.; Salaeh, N.; Elkhrachy, I.; Linh, N.T.T.; Pham, Q.B. Estimating FAO Blaney-Criddle b-factor using soft computing models. Atm. 2022, 13, 1536. [Google Scholar] [CrossRef]
- Hafeez, M.; Ahmad Chatha, Z.; Akhtar Khan, A.; Bakhsh, A.; Basit, A.; Tahira, F. Estimating reference evapotranspiration by Hargreaves and Blaney-Criddle methods in humid subtropical conditions. Curr. Res. Agric. Sci. 2020, 7, 15–22. [Google Scholar] [CrossRef]
- Gee, G.W.; Bauder, J.W. Particle-size Analysis, in: Klute, A. (Ed.), SSSA Book Series. Soil Science Society of America, American Society of Agronomy, Madison, WI, USA, 2018, pp. 383–411. [CrossRef]
- Blake, G.R.; Hartge, K.H. Bulk density. Methods Soil Anal. 1986, 363–375. [Google Scholar]
- Klute, A.; Dirkson, C. Hydraulic conductivity and diffusivity: Laboratory Methods. In A. Klute (Ed.) “Methods of soil analysis, Part I.” ASA Monograph No.9. Madison, WI, 1986, pp. 687–734.
- Klute, A. Water retention: laboratory methods. In A. Klute (Ed.) “Methods of soil analysis. Part 1.” 2nd ed. Agron. Monogr.9. ASA. Madison, WI, 1986, pp. 635–661.
- Kargas, G.; Soulis, K.X. Performance evaluation of a recently developed soil water content, dielectric permittivity, and bulk electrical conductivity electromagnetic sensor. Agric. Water Manag. 2019, 213, 568–579. [Google Scholar] [CrossRef]
- Evett, S.R.; Tolk, J.A.; Howell, T.A. Soil profile water content determination: sensor accuracy, axial response, calibration, temperature dependence, and precision. Vadose Zone J. 2006, 5, 894–907. [Google Scholar] [CrossRef]
- Kang, S.Z.; Gu, B.J.; Du, T.S.; Zhang, J.H. Crop coefficient and ratio of transpiration to evapotranspiration of winter wheat and maize in a semi-humid region. Agric. Water Manag. 2003, 59, 239–254. [Google Scholar] [CrossRef]
- Gao, X.Y.; Tang, P.C.; Wang, Z.W.; Yao, Y.T.; Qu, Z.Y.; Yang, W.; Du, B. Crop coefficient of Sunflowers under drip irrigation with plastic film in different hydrological years in the Hetao irrigation district. Water. 2024, 16, 235. [Google Scholar] [CrossRef]
- Silva Junior, A.C.d.; Souza, P.J.d.O.P.d.; Sousa, D.d.P.; Martorano, L.G.; Silva, C.M.d.; Silva, C.M.d.; Nunes, H.G.G.C.; Lima, M.J.A.d.; Sousa, A.M.L.d.; Pinto, J.V.d.N.; Ruivo, M.d.L.P.; Alves, J.D.N. Energy balance, water demand, and crop coefficient of acid lime in the Oriental Amazon. Water. 2023, 15, 1239. [Google Scholar] [CrossRef]
- Jensen, M.E.; Burman, R.D.; Allen, R.G. Evapotranspiration and irrigation water requirements. ASCE Manuals and Reports on Engineering Practice. 1990, No. 70, p. 332.
- Allen, R.G.; Smith, M.; Pereira, L.S. An update for the definition of reference evapotranspiration. ICID Bull, 1994, 43, 1–34. [Google Scholar]
- United States Department of Agriculture, Soil Conservation Service. Irrigation water requirement. Part 623 National Engineering Handbook. Chapter 2. 1993, pp. 56–60.
- Deb, S.K.; Shukla, M.K.; Mexal, J.G. Simulating deep percolation in flood-irrigated mature pecan orchards with RZWQM2. Trans. ASABE. 2012, 55, 2089–2100. [Google Scholar] [CrossRef]
- Howell, T.A.; Steiner, J.L.; Schneider, A.D.; Evett, S.R. Evapotranspiration of irrigated winter wheat southern high plains. Trans. ASABE. 1995, 38, 745–759. [Google Scholar] [CrossRef]
- Zhang, X.Y.; Trame, M.; Lesko, L.; Schmidt, S. Sobol sensitivity analysis: a tool to guide the development and evaluation of systems pharmacology models. CPT: Pharmacomet. Syst. Pharmacol. 2015, 4, 69–79. [Google Scholar] [CrossRef] [PubMed]
- Bhat, A.; Kumar, A. Application of the Crystal Ball software for uncertainty and sensitivity analyses for predicted concentration and risk levels. Environ. Prog. 2008, 27, 289–294. [Google Scholar] [CrossRef]
- Yuan, Y.S.; Wang, L.X.; Wang, H.L.; Lin, W.Q.; Jiao, W.Z.; Du, T.S. A modified isotope-based method for potential high-frequency evapotranspiration partitioning. Adv. Water Resour. 2022, 160, 104103. [Google Scholar] [CrossRef]
- López-Urrea, R.; Martín de Santa Olalla, F.; Fabeiro, C.; Moratalla, A. Testing evapotranspiration equations using lysimeter observations in a semiarid climate. Agric. Water Manag. 2006, 85, 15–26. [Google Scholar] [CrossRef]
- Martel, M.; Glenn, A.; Wilson, H.; Kröbel, R. Simulation of actual evapotranspiration from agricultural landscapes in the Canadian Prairies. J. Hydrol. Reg. Stud. 2018, 15, 105–118. [Google Scholar] [CrossRef]
- Sammis, T.W.; Wang, J.M.; Miller, D.R. The transition of the Blaney-Criddle formula to the Penman-Monteith equation in the western United States. J. Serv. Climatol. 2011, 5, 1–11. [Google Scholar] [CrossRef]
- Shahrokhnia, M.H.; Sepaskhah, A.R. Single and dual crop coefficients and crop evapotranspiration for wheat and maize in a semi-arid region. Theor. Appl. Climatol. 2013, 114, 495–510. [Google Scholar] [CrossRef]
- Xu, C.Y.; Singh, V.P. Cross comparison of empirical equations for calculating potential evapotranspiration with data from Switzerland. Water Resour. Manag. 2002, 16, 197–219. [Google Scholar] [CrossRef]
- Valipour, M. Temperature analysis of reference evapotranspiration models. Meteorol. Appl. 2015, 22, 385–394. [Google Scholar] [CrossRef]
- Zhang, B.Z.; Liu, Y.; Xu, D.; Zhao, N.N.; Lei, B.; Rosa, R.D.; Paredes, P.; Paҫo, T.A.; Pereira, L.S. The dual crop coefficient approach to estimate and partitioning evapotranspiration of the winter wheat-summer maize crop sequence in North China Plain. Irrig. Sci. 2013, 31, 1303–1316. [Google Scholar] [CrossRef]
- Gao, Y.; Duan, A.W.; Sun, J.S.; Li, F.S.; Liu, Z.G.; Liu, H.; Liu, Z.D. Crop coefficient and water-use efficiency of winter wheat/spring maize strip intercropping. Field Crops Res. 2009, 111, 65–73. [Google Scholar] [CrossRef]
- Gao, Y.; Yang, L.L.; Shen, X.J.; Li, X.Q.; Sun, J.S.; Duan, A.W.; Wu, L.S. Winter wheat with subsurface drip irrigation (SDI): Crop coefficients, water-use estimates, and effects of SDI on grain yield and water use efficiency. Agric. Water Manag. 2014, 146, 1–10. [Google Scholar] [CrossRef]
- Wang, J.D.; Zhang, Y.Q.; Gong, S.H.; Xu, D.; Juan, S.; Zhao, Y.F. Evapotranspiration, crop coefficient and yield for drip-irrigated winter wheat with straw mulching in North China Plain. Field Crops Res. 2018, 217, 218–228. [Google Scholar] [CrossRef]
- Drerup, P.; Brueck, H.; Scherer, H.W. Evapotranspiration of winter wheat estimated with the FAO 56 approach and NDVI measurements in a temperature-humid climate of NW Europe. Agric. Water Manag. 2017, 192, 180–188. [Google Scholar] [CrossRef]
- Dingre, S.K.; Gorantiwar, S.D. Determination of the water requirement and crop coefficient values of sugarcane by field water balance method in semiarid region. Agric. Water Manag. 2020, 232, 106042. [Google Scholar] [CrossRef]
- Abioye, E.A.; Abidin, M.S.Z.; Mahmud, M.S.A.; Buyamin, S.; Ishak, M.H.I.; Rahman, M.K.I.A.; Otuoze, A.O.; Onotu, P.; Ramli, M.S.A. A review on monitoring and advanced control strategies for precision irrigation. Comput. Electron. Agric. 2020, 173, 105441. [Google Scholar] [CrossRef]
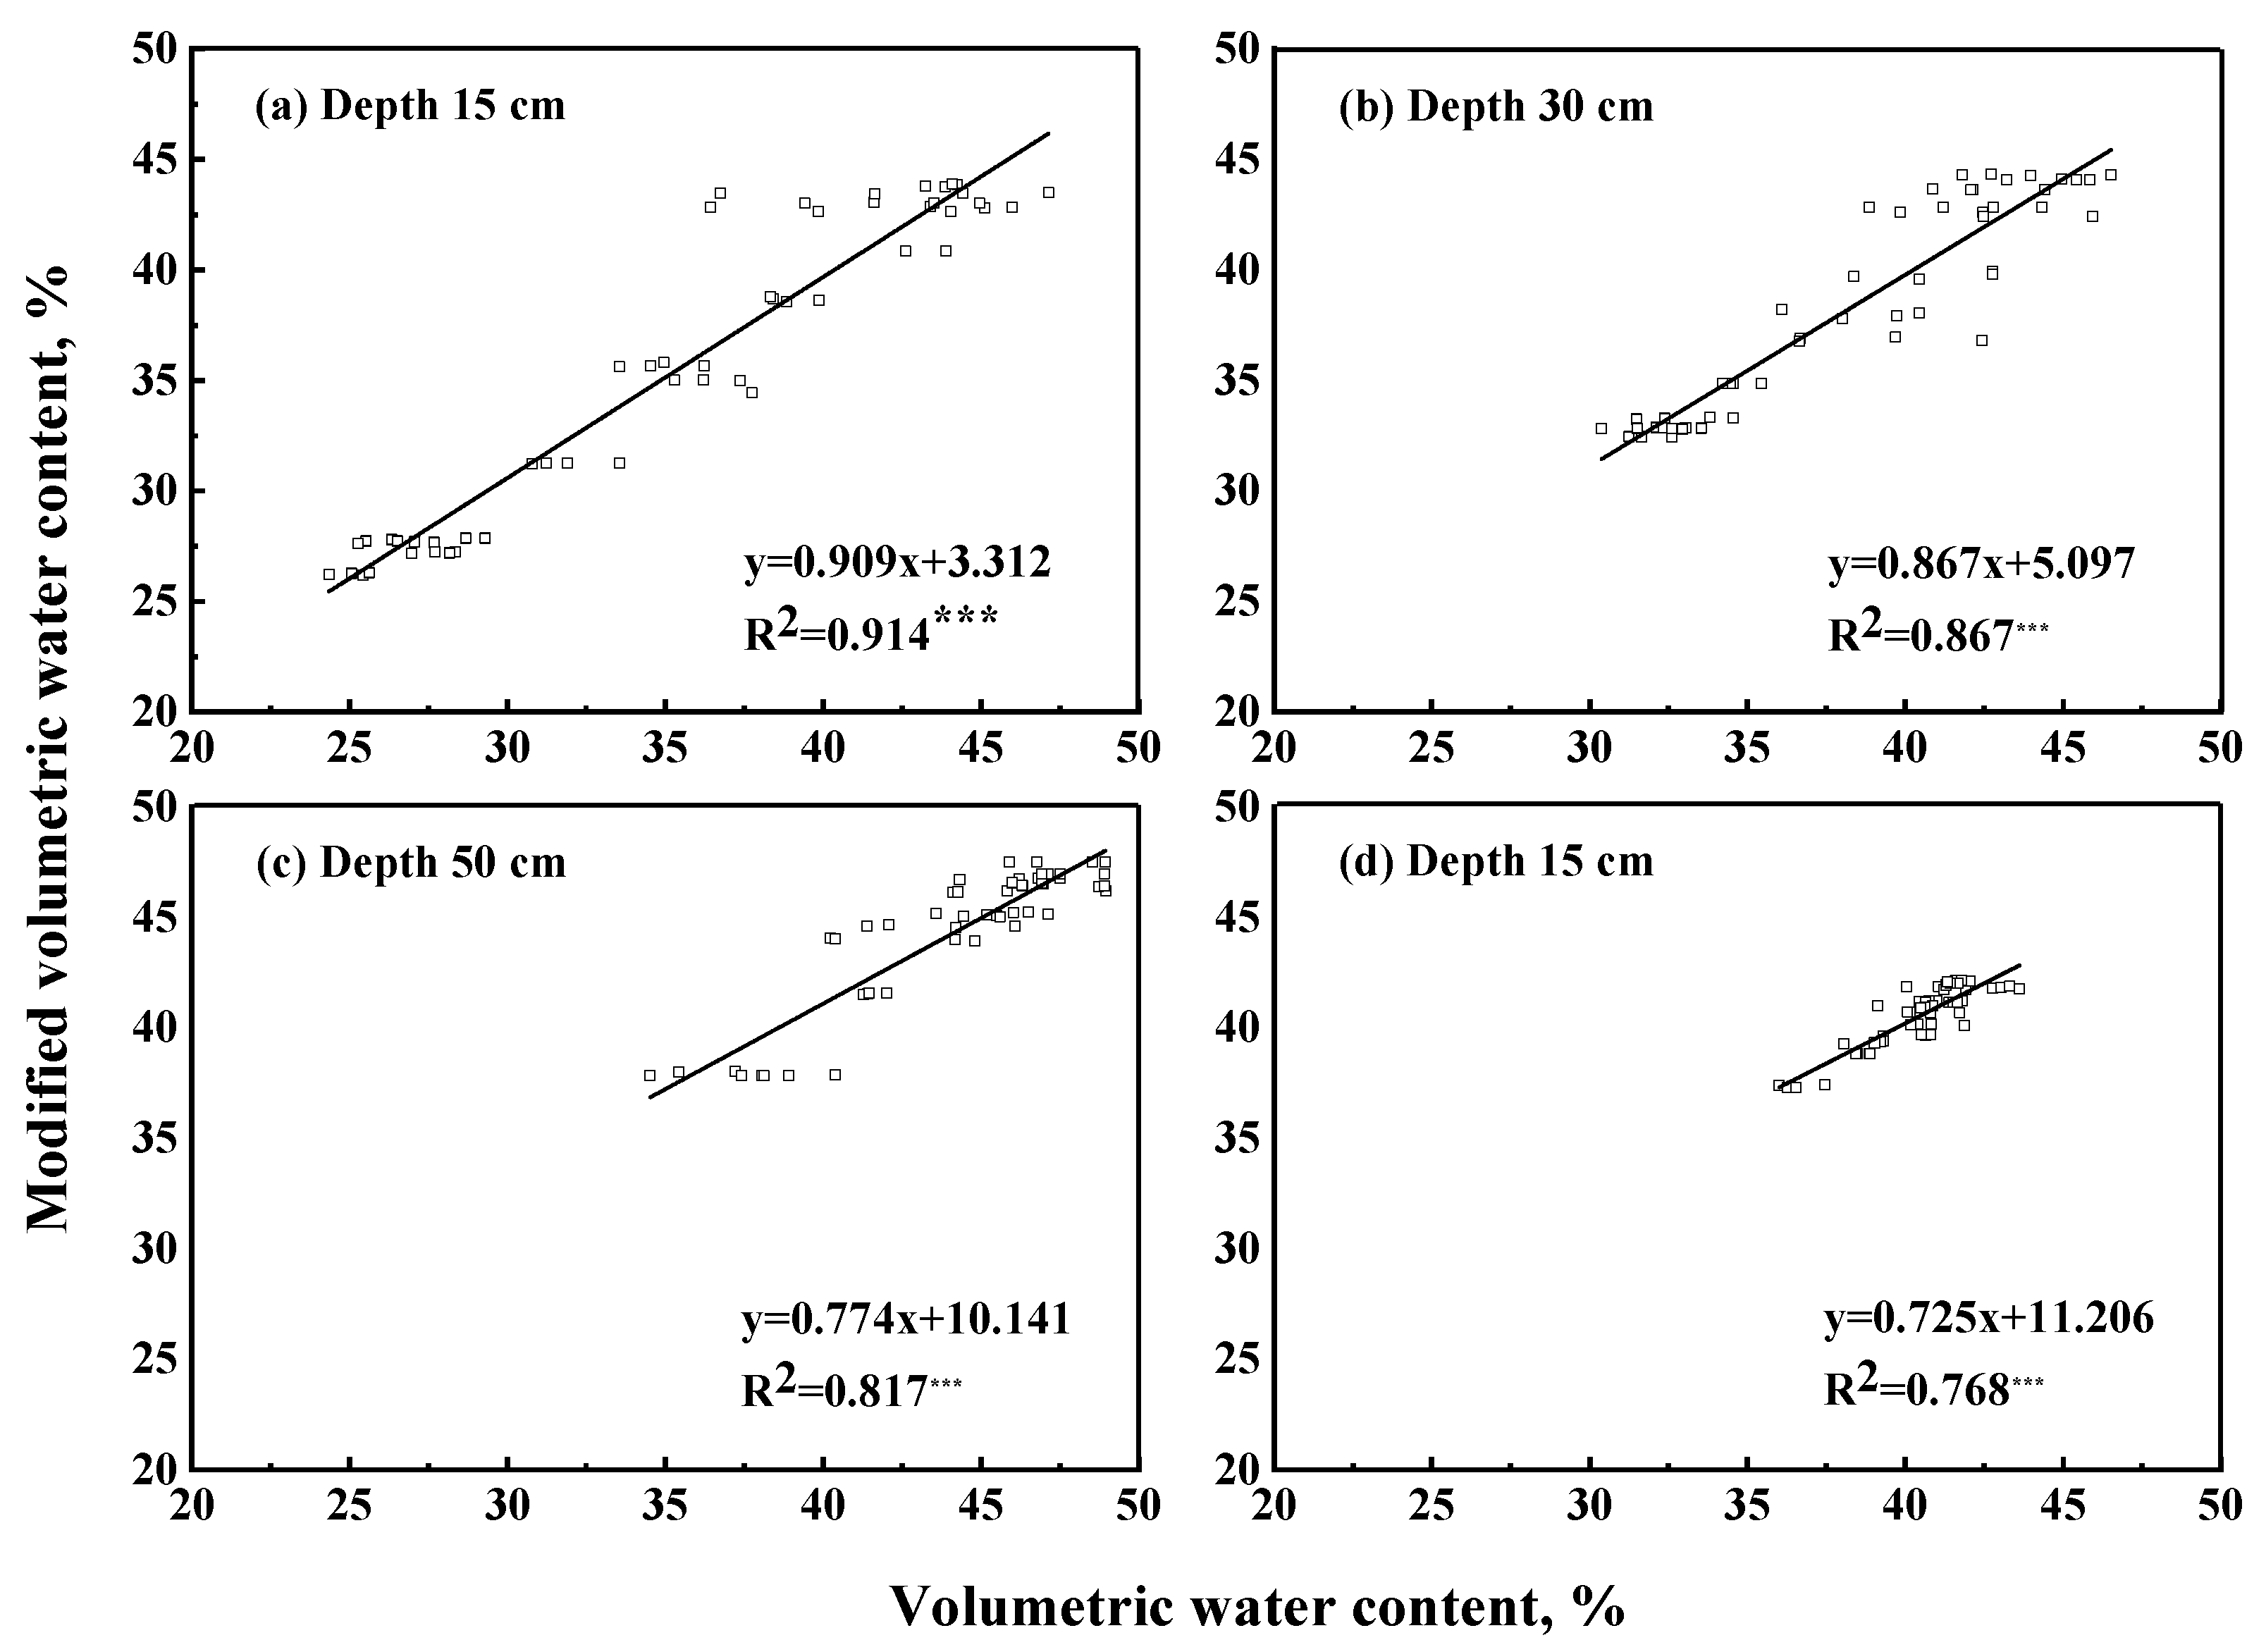
| Sensor depths (cm) | New coefficients for calibration Eq. 1 | R2* | |
| C0 | C1 | ||
| 15 | 3.771×10⁻⁴ | -0.6677 | 0.916 |
| 30 | 3.558×10⁻⁴ | -0.6065 | 0.867 |
| 50 | 3.503×10⁻⁴ | -0.5929 | 0.817 |
| 80 | 3.700×10⁻⁴ | -0.6551 | 0.769 |
| Growing season | Method | CE (%) | MBE (mm) | MAE (mm) | RMSE (mm) |
| 2021-2022 | Blaney-Criddle | 79.8 | 0.59 | 0.73 | 0.92 |
| Hargreaves | 80.2 | -0.07 | 0.67 | 0.91 | |
| 2022-2023 | Blaney-Criddle | 54.9 | 0.61 | 0.85 | 1.13 |
| Hargreaves | 67.9 | 0.03 | 0.70 | 0.96 |
Disclaimer/Publisher’s Note: The statements, opinions and data contained in all publications are solely those of the individual author(s) and contributor(s) and not of MDPI and/or the editor(s). MDPI and/or the editor(s) disclaim responsibility for any injury to people or property resulting from any ideas, methods, instructions or products referred to in the content. |
© 2024 by the authors. Licensee MDPI, Basel, Switzerland. This article is an open access article distributed under the terms and conditions of the Creative Commons Attribution (CC BY) license (https://creativecommons.org/licenses/by/4.0/).


