Submitted:
08 July 2024
Posted:
09 July 2024
You are already at the latest version
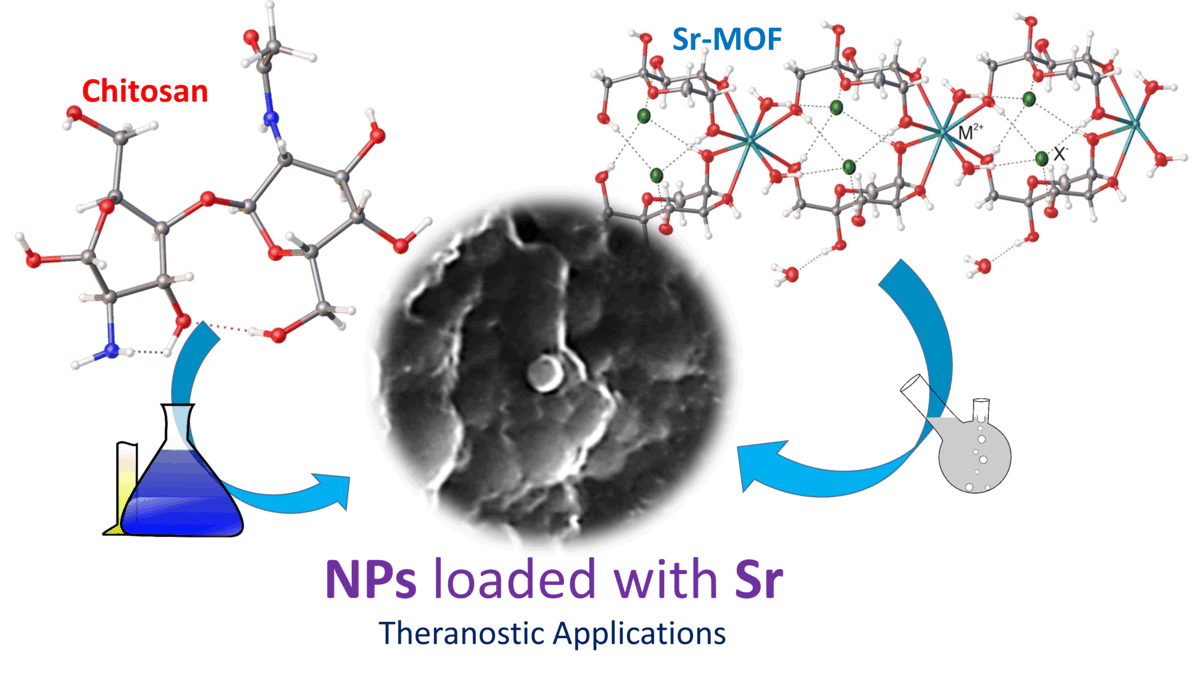
Abstract
Keywords:
1. Introduction
2. Results and Discussion
2.1. Synthesis of Chitosan-Based NPs Loaded with Sr (Sr-NPs)
2.2. Characterization of Chitosan-Based NPs Loaded with Sr (Sr-NPs)
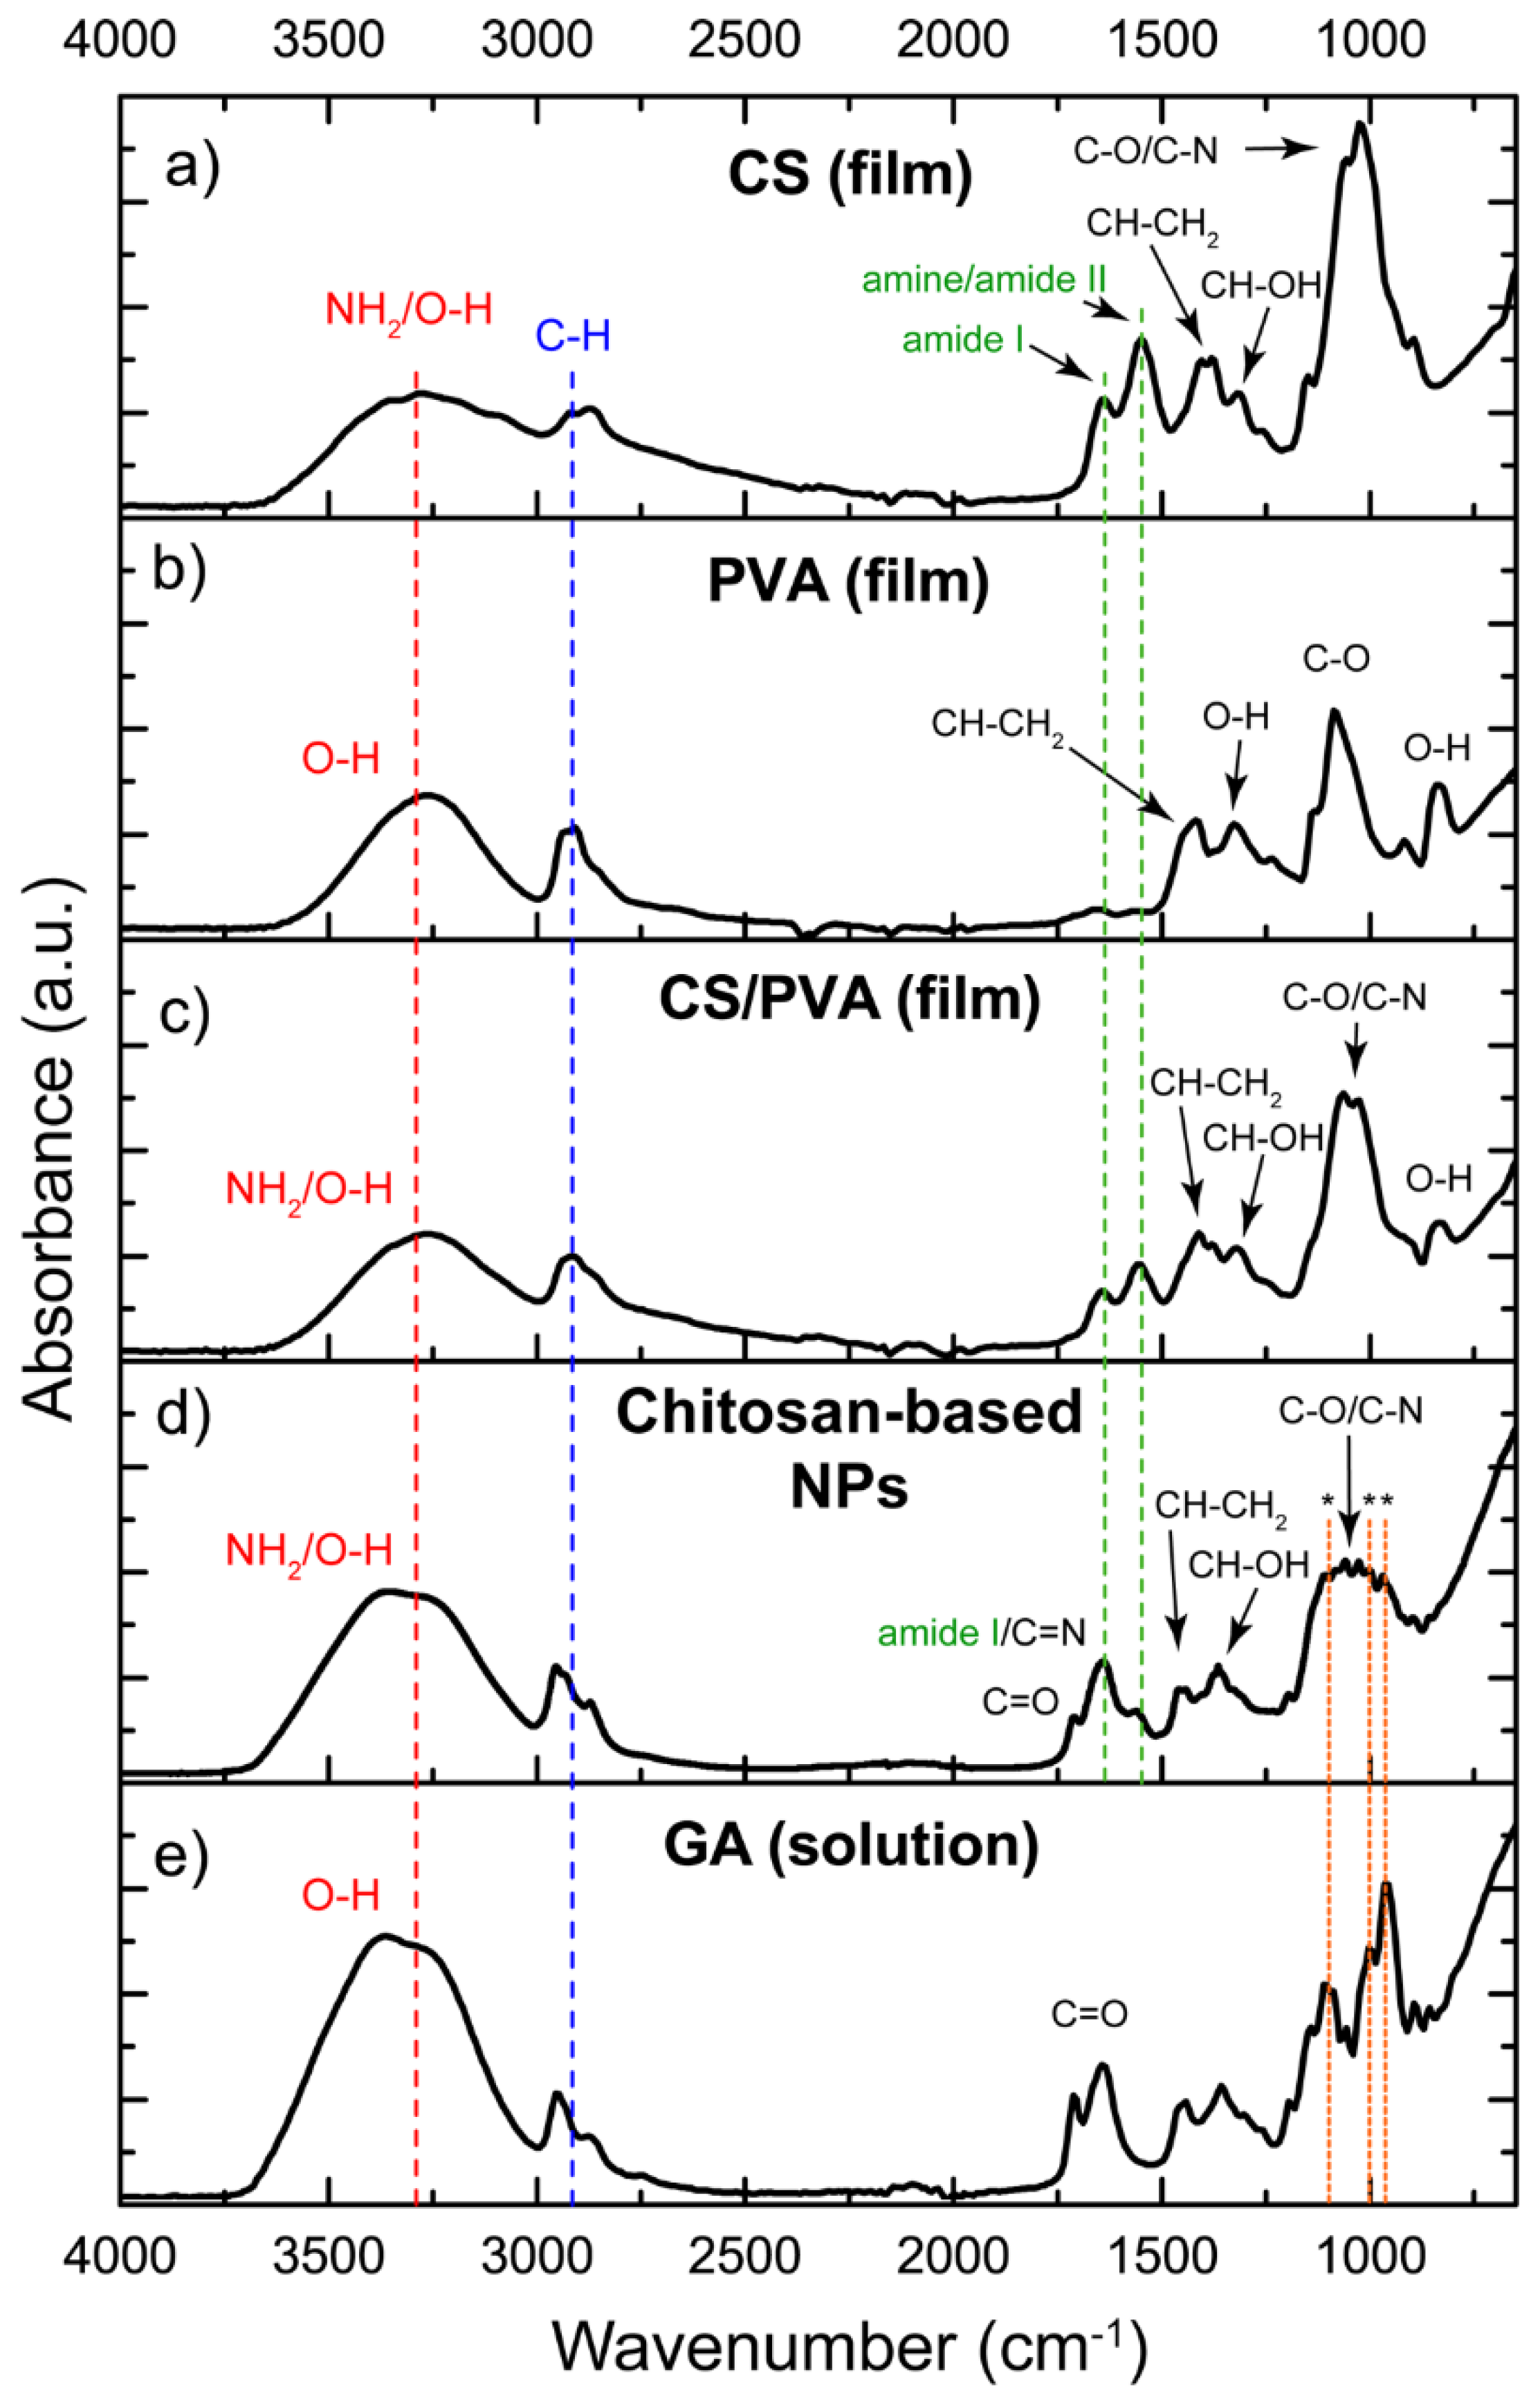
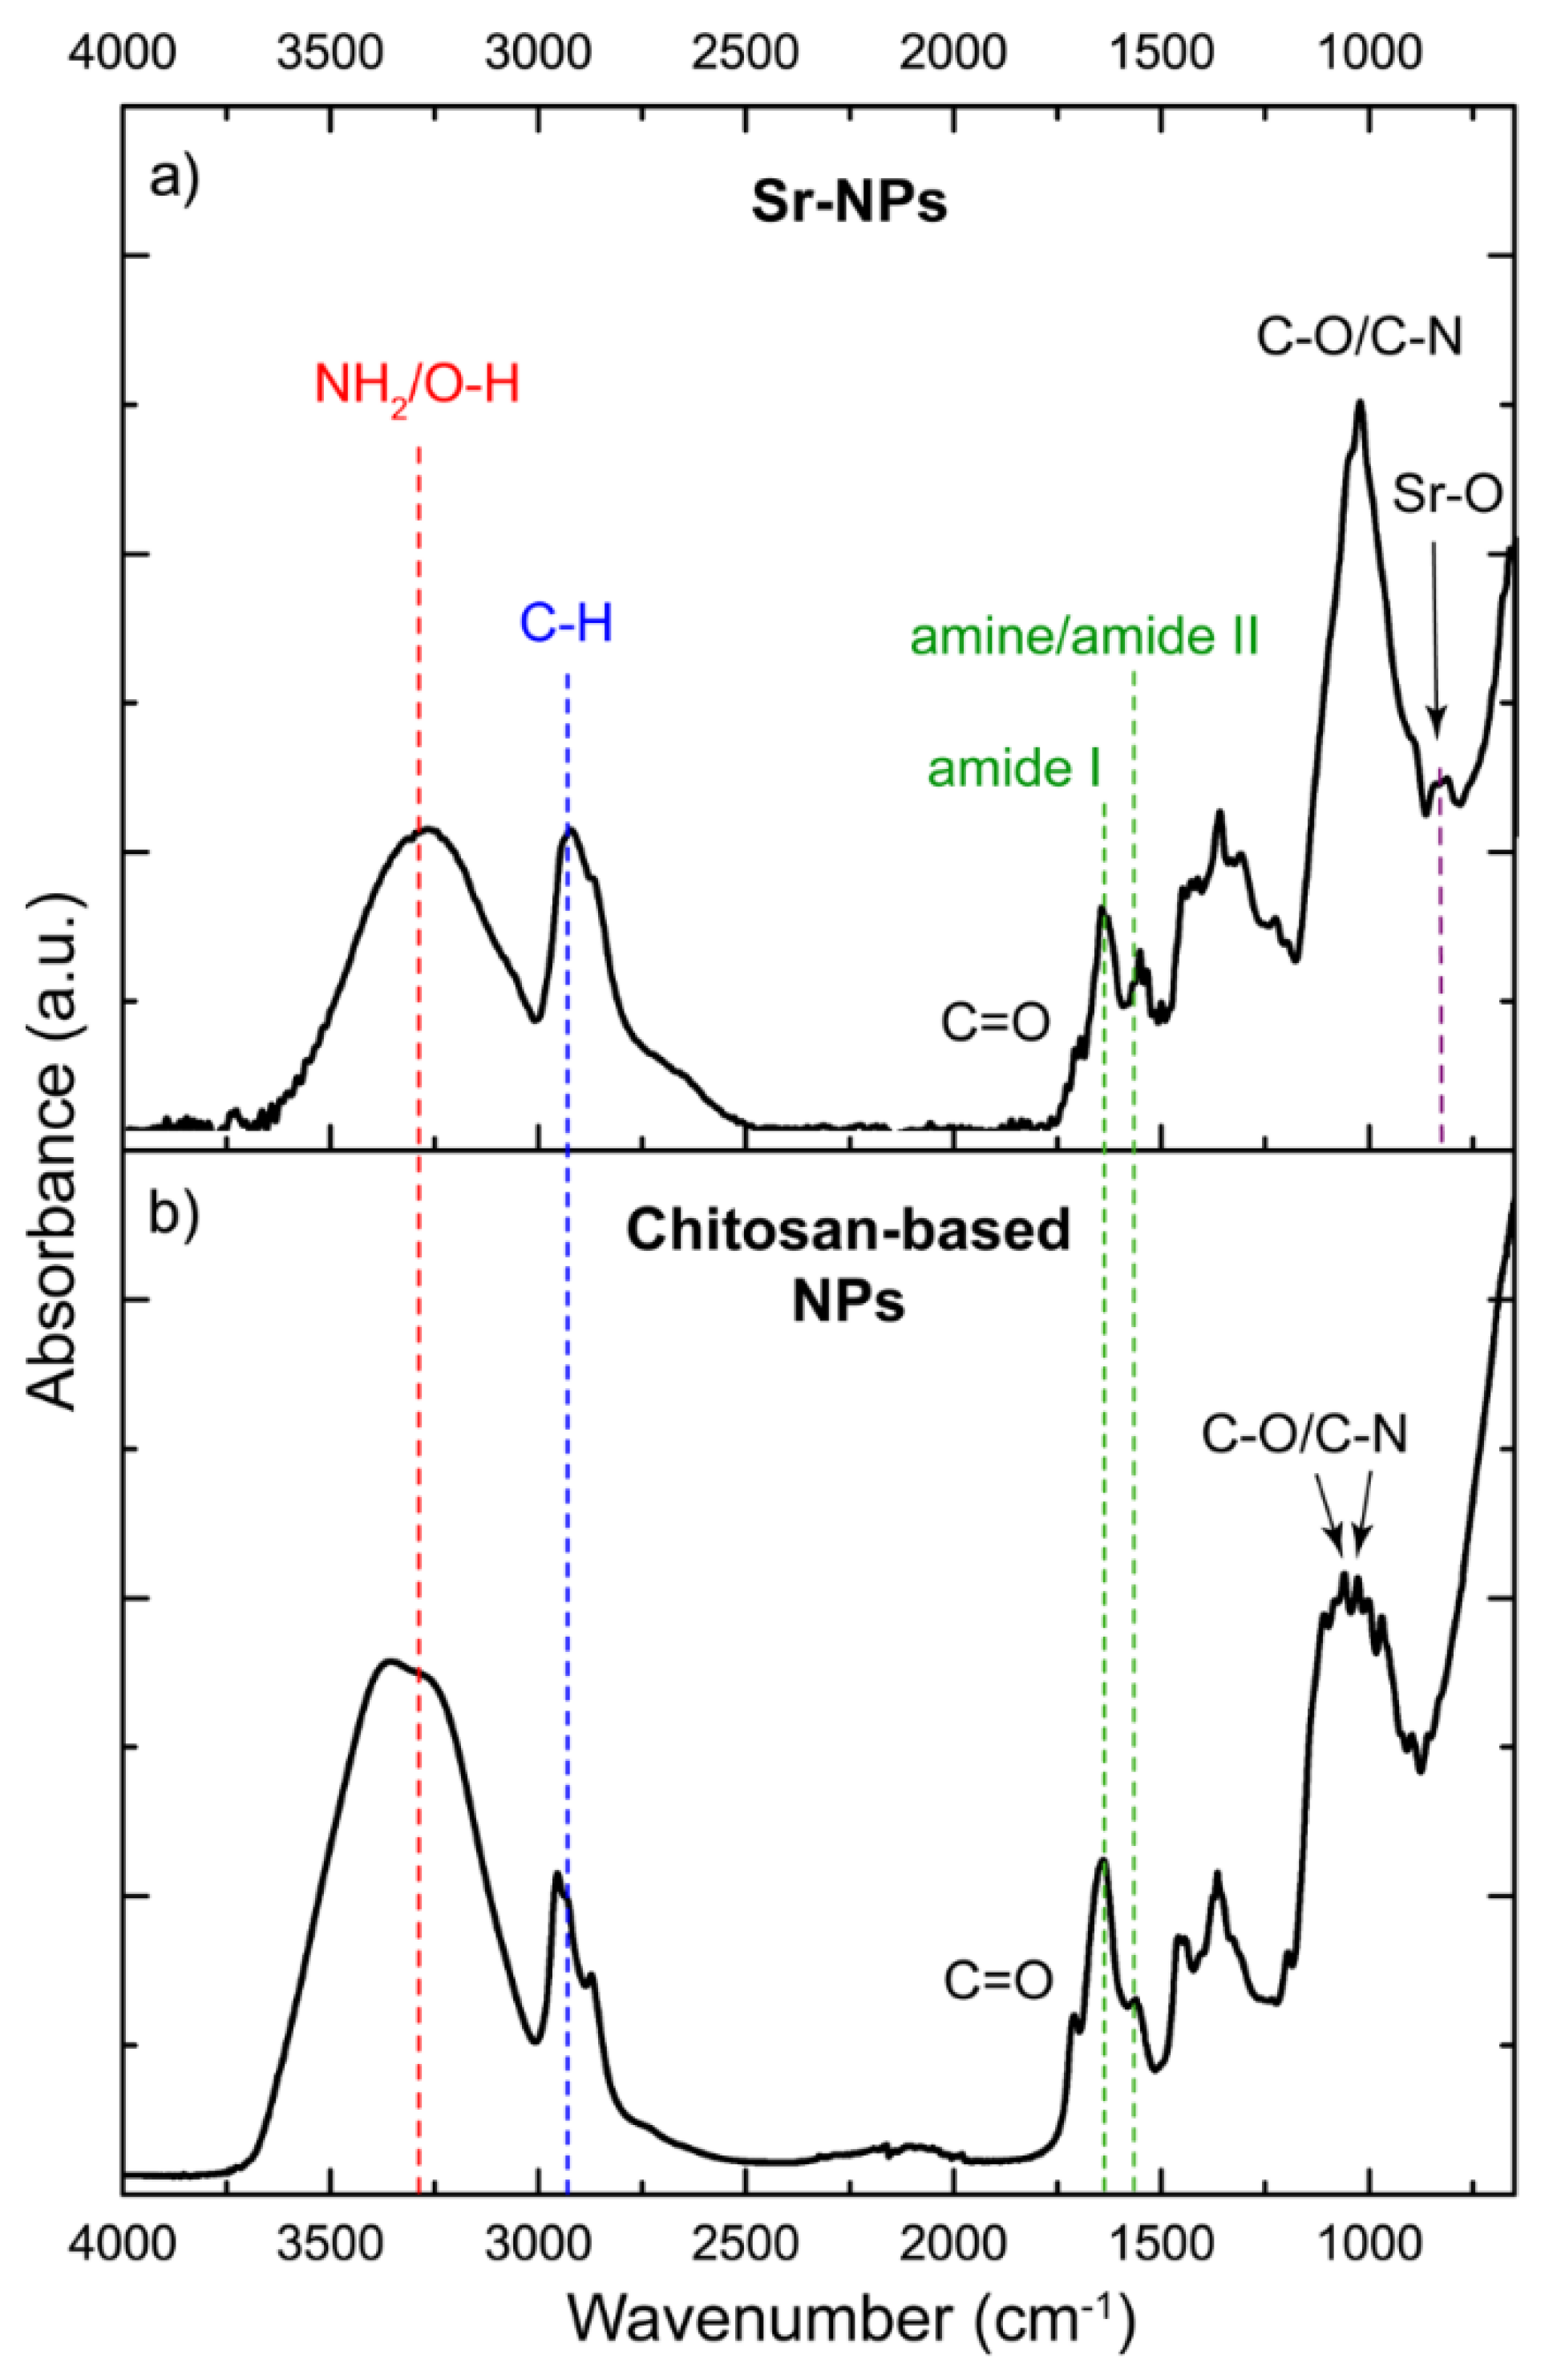
2.2.1. FTIR Spectroscopy
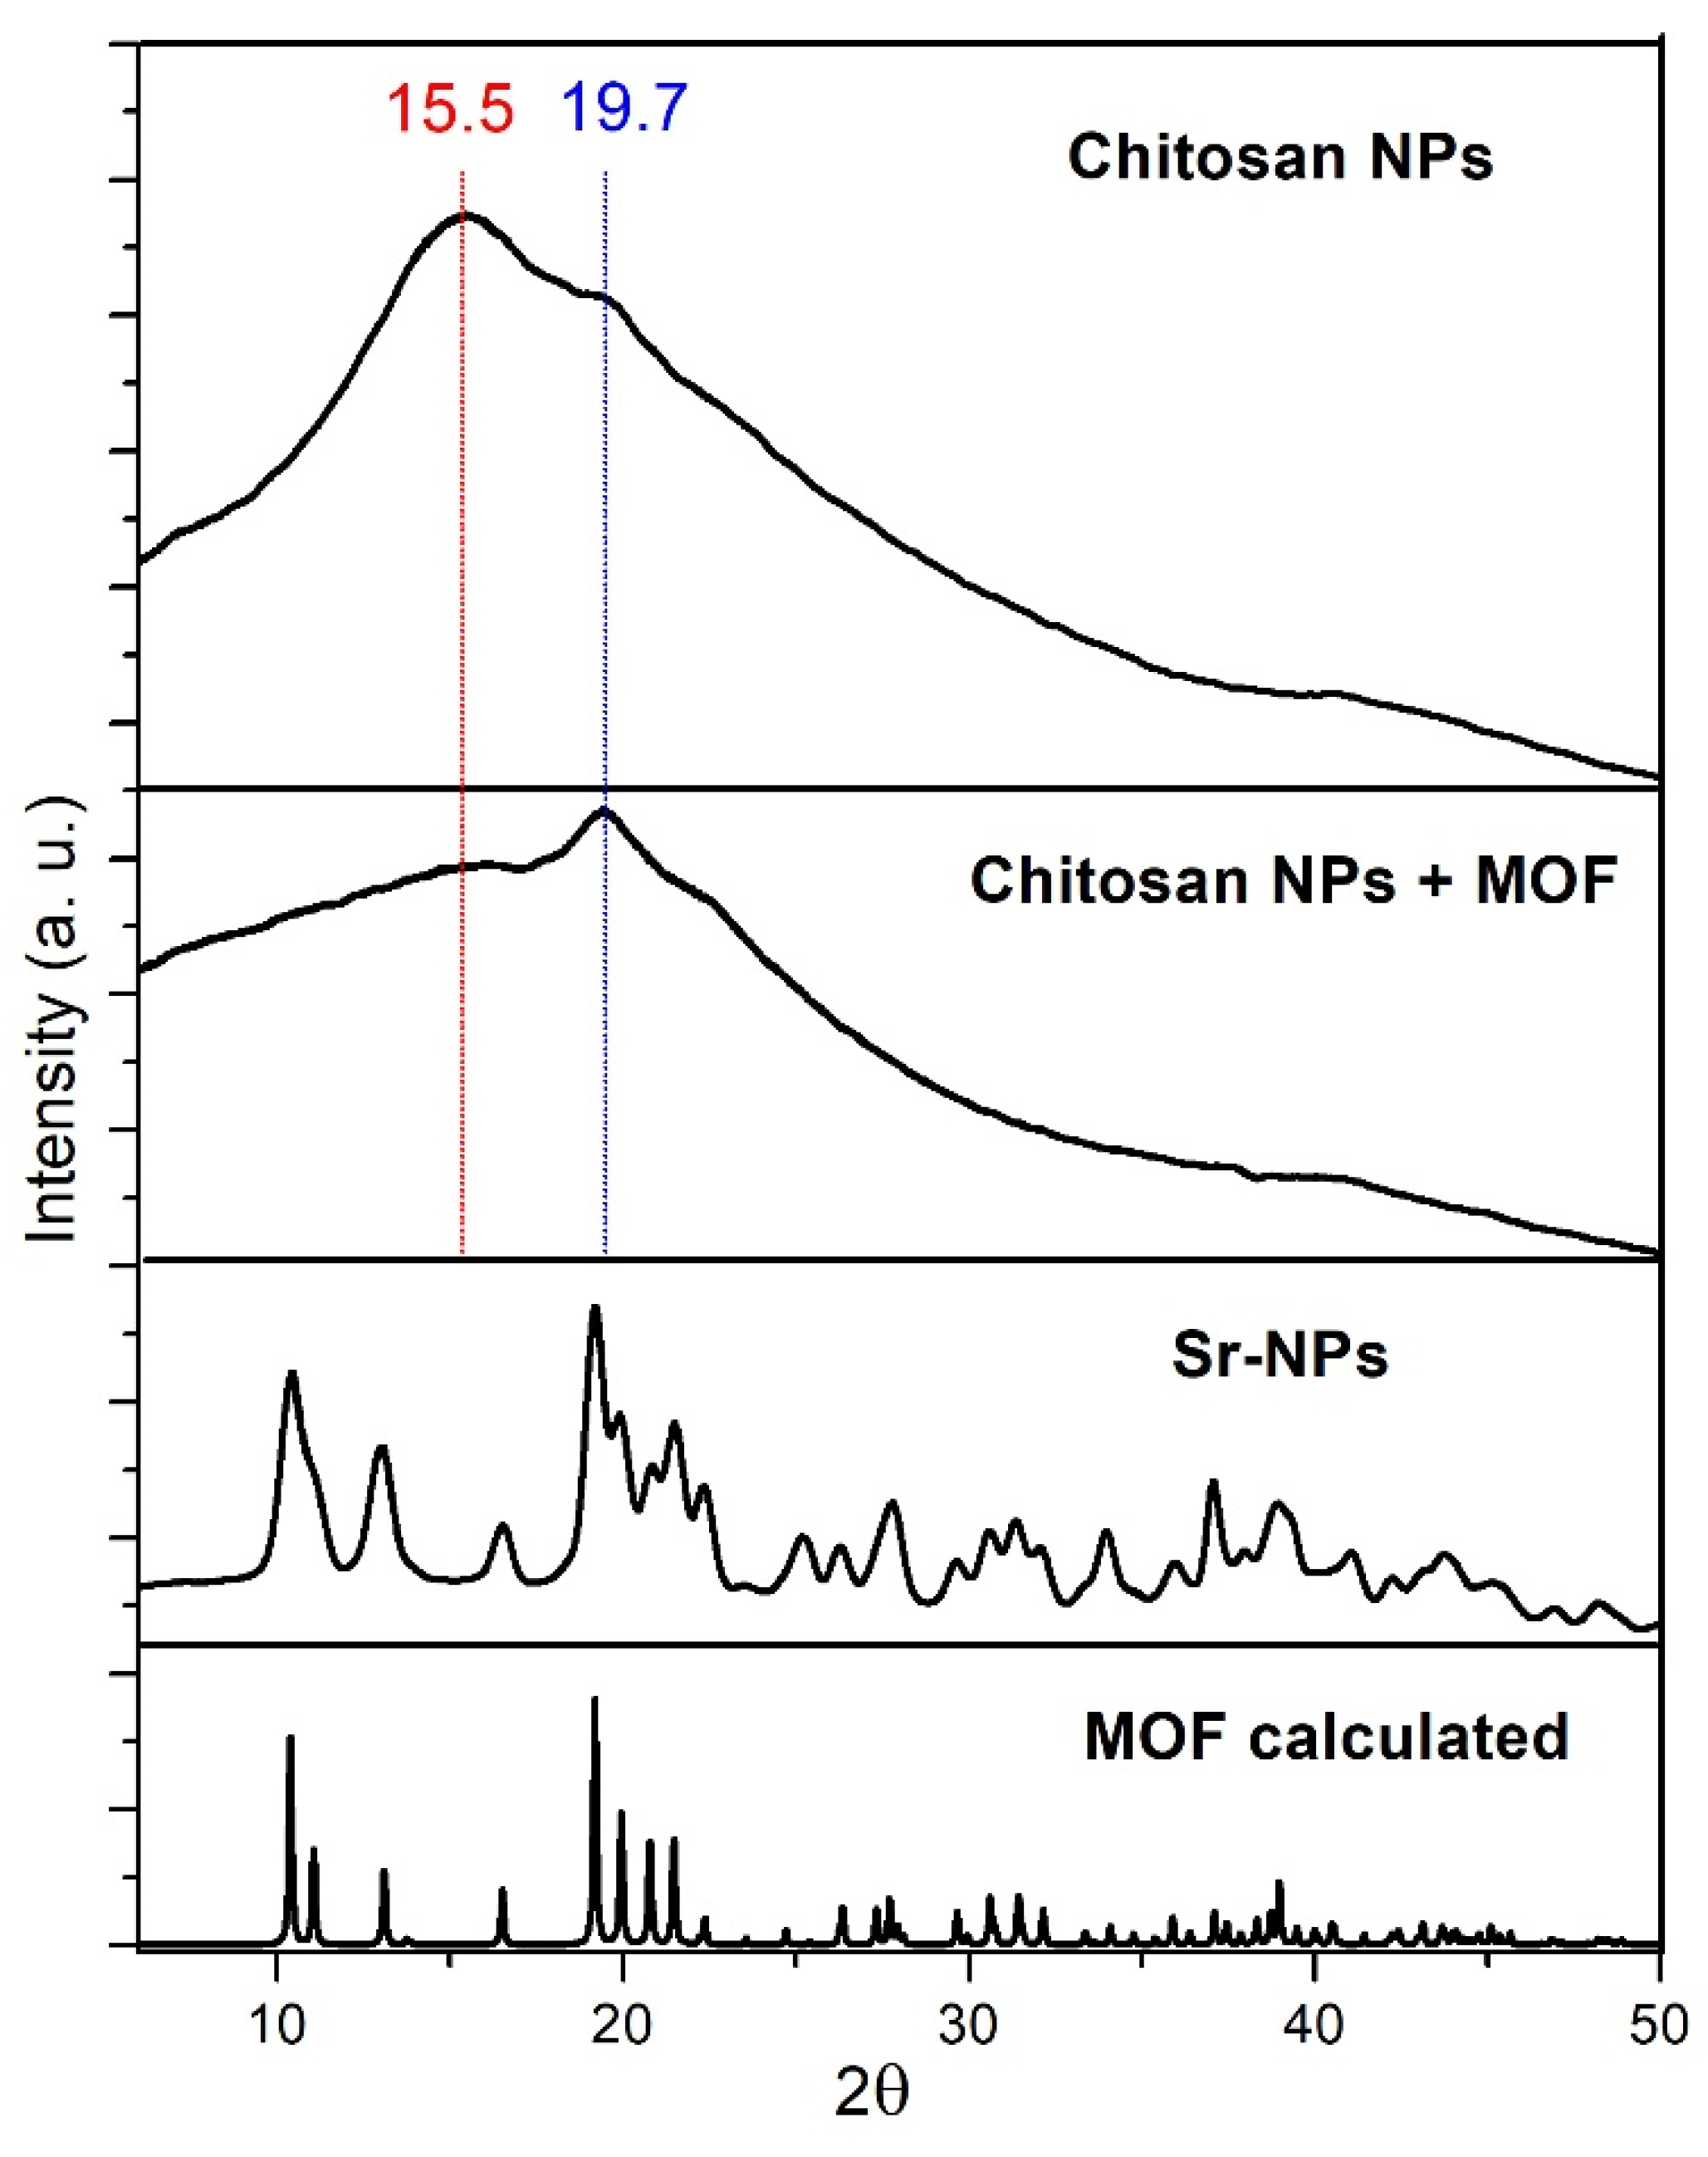
2.2.2. XRPD Characterization
2.2.3. SEM Characterization
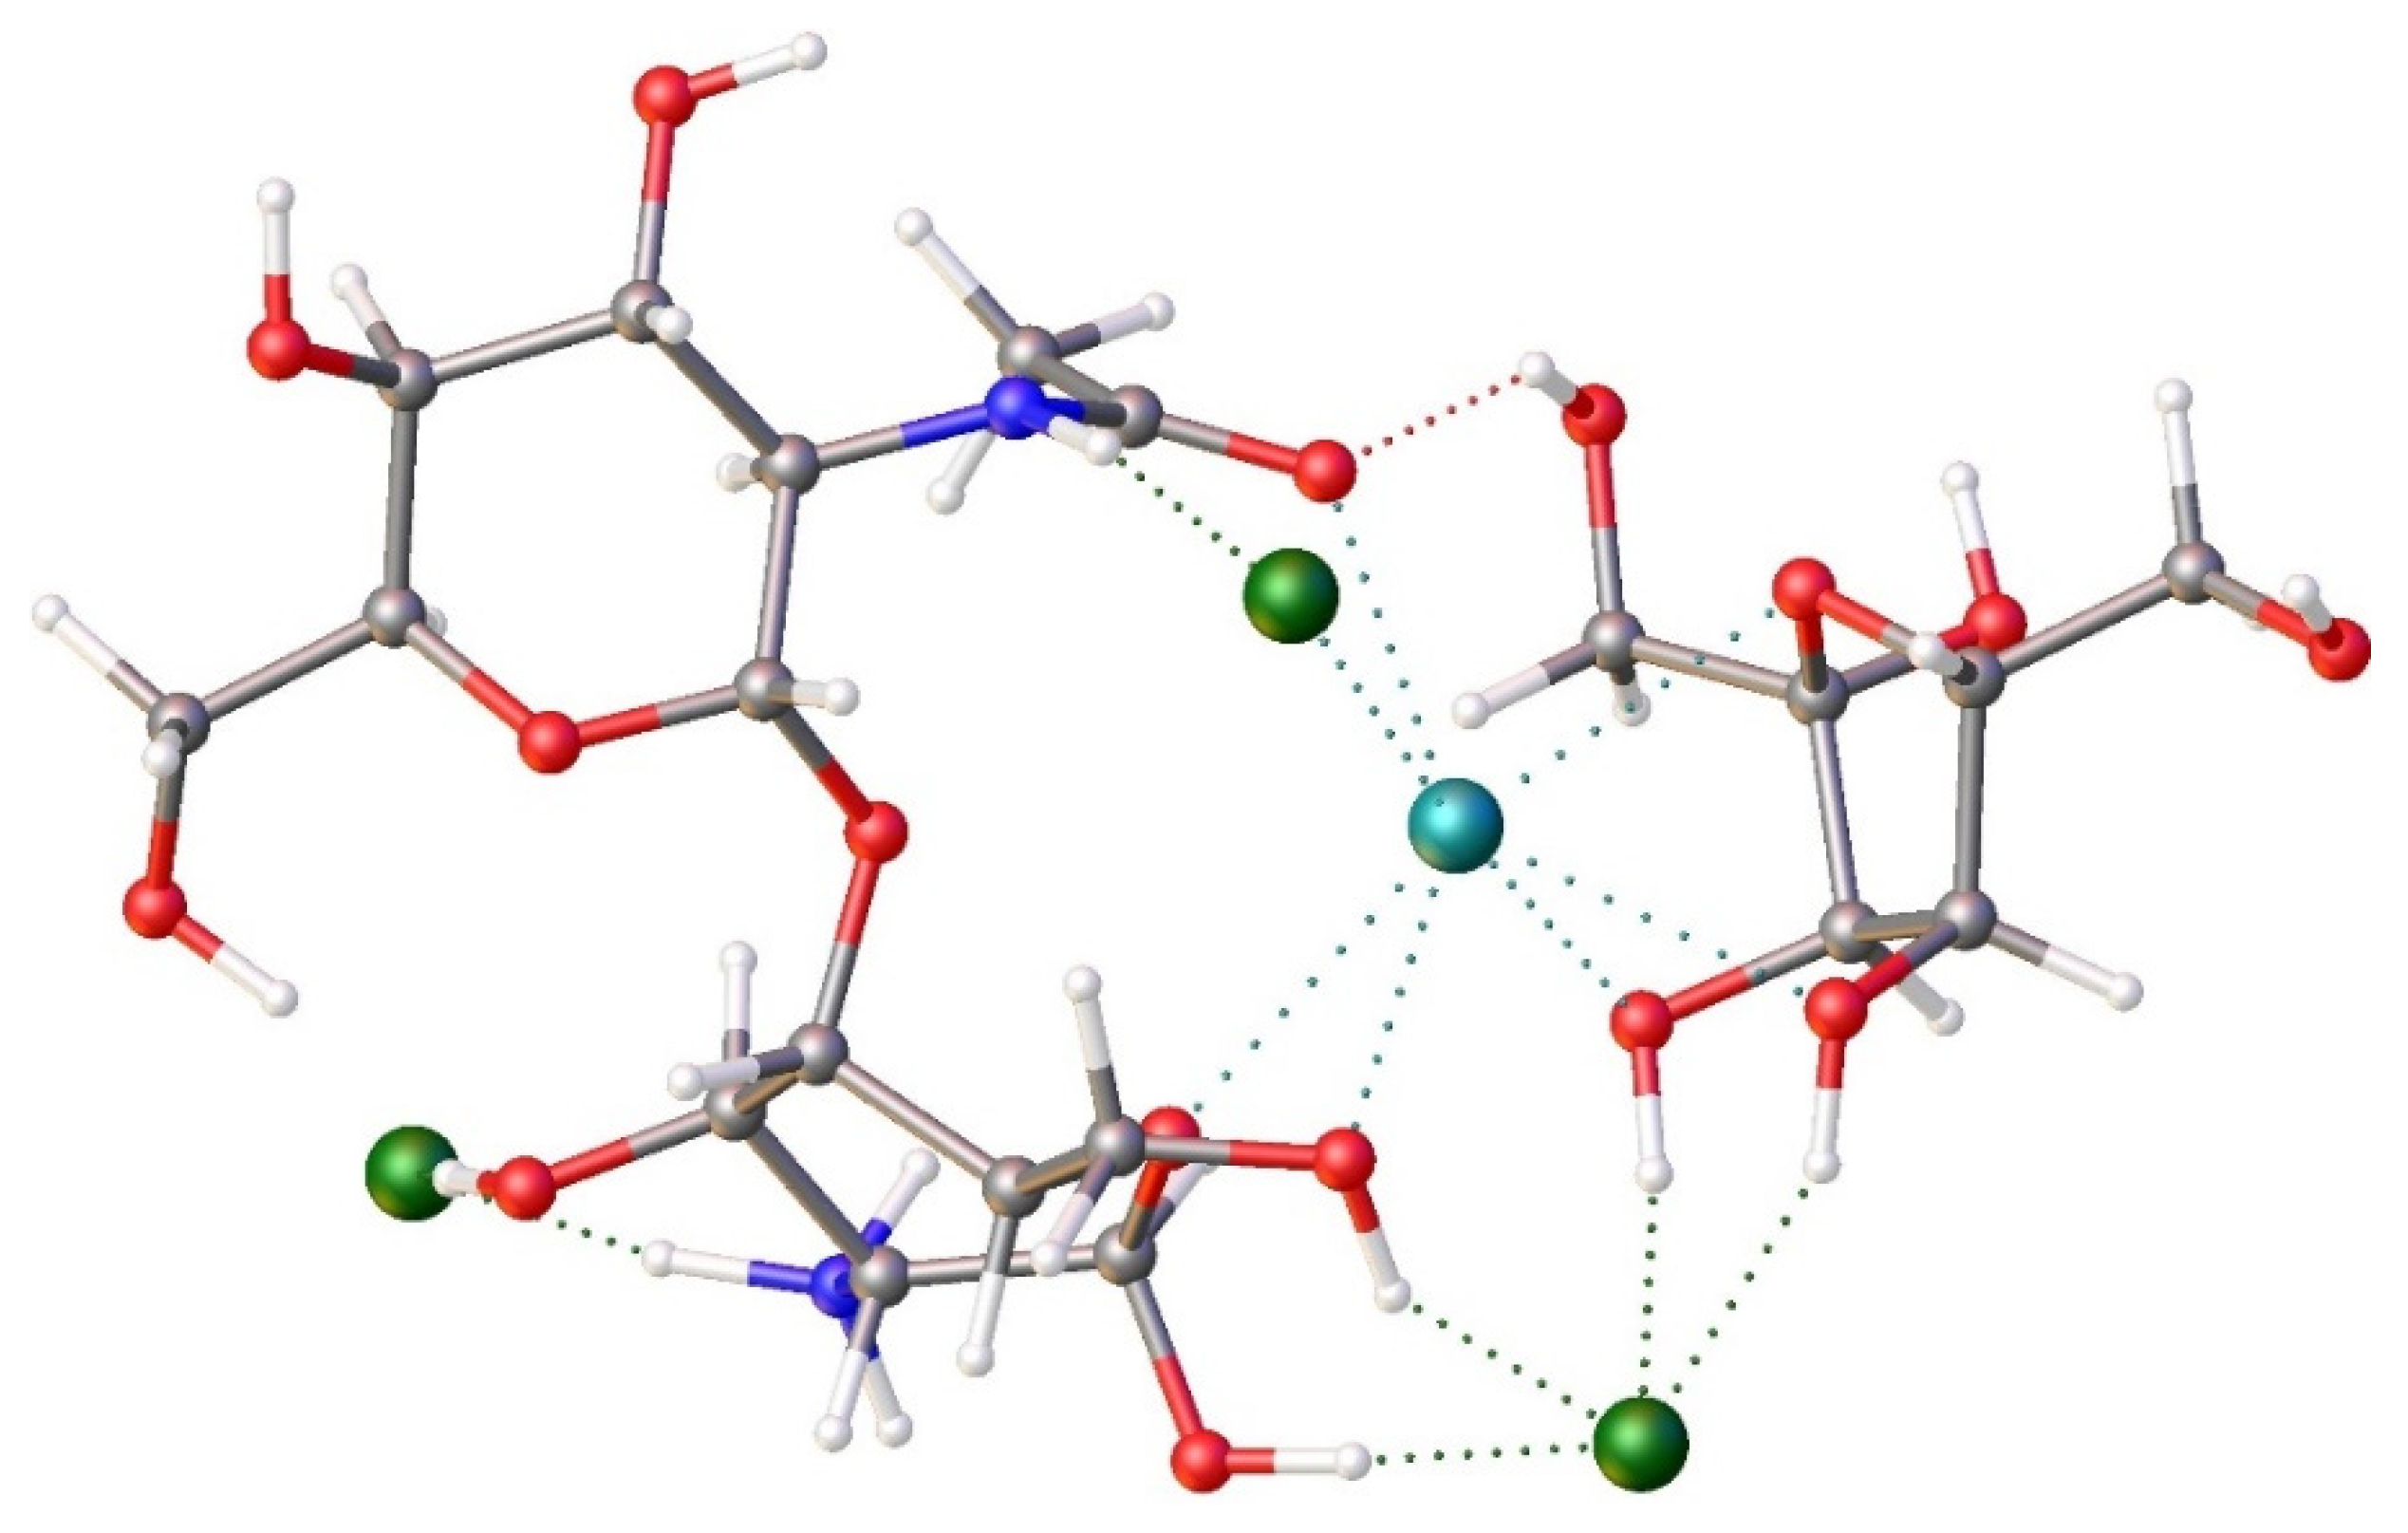
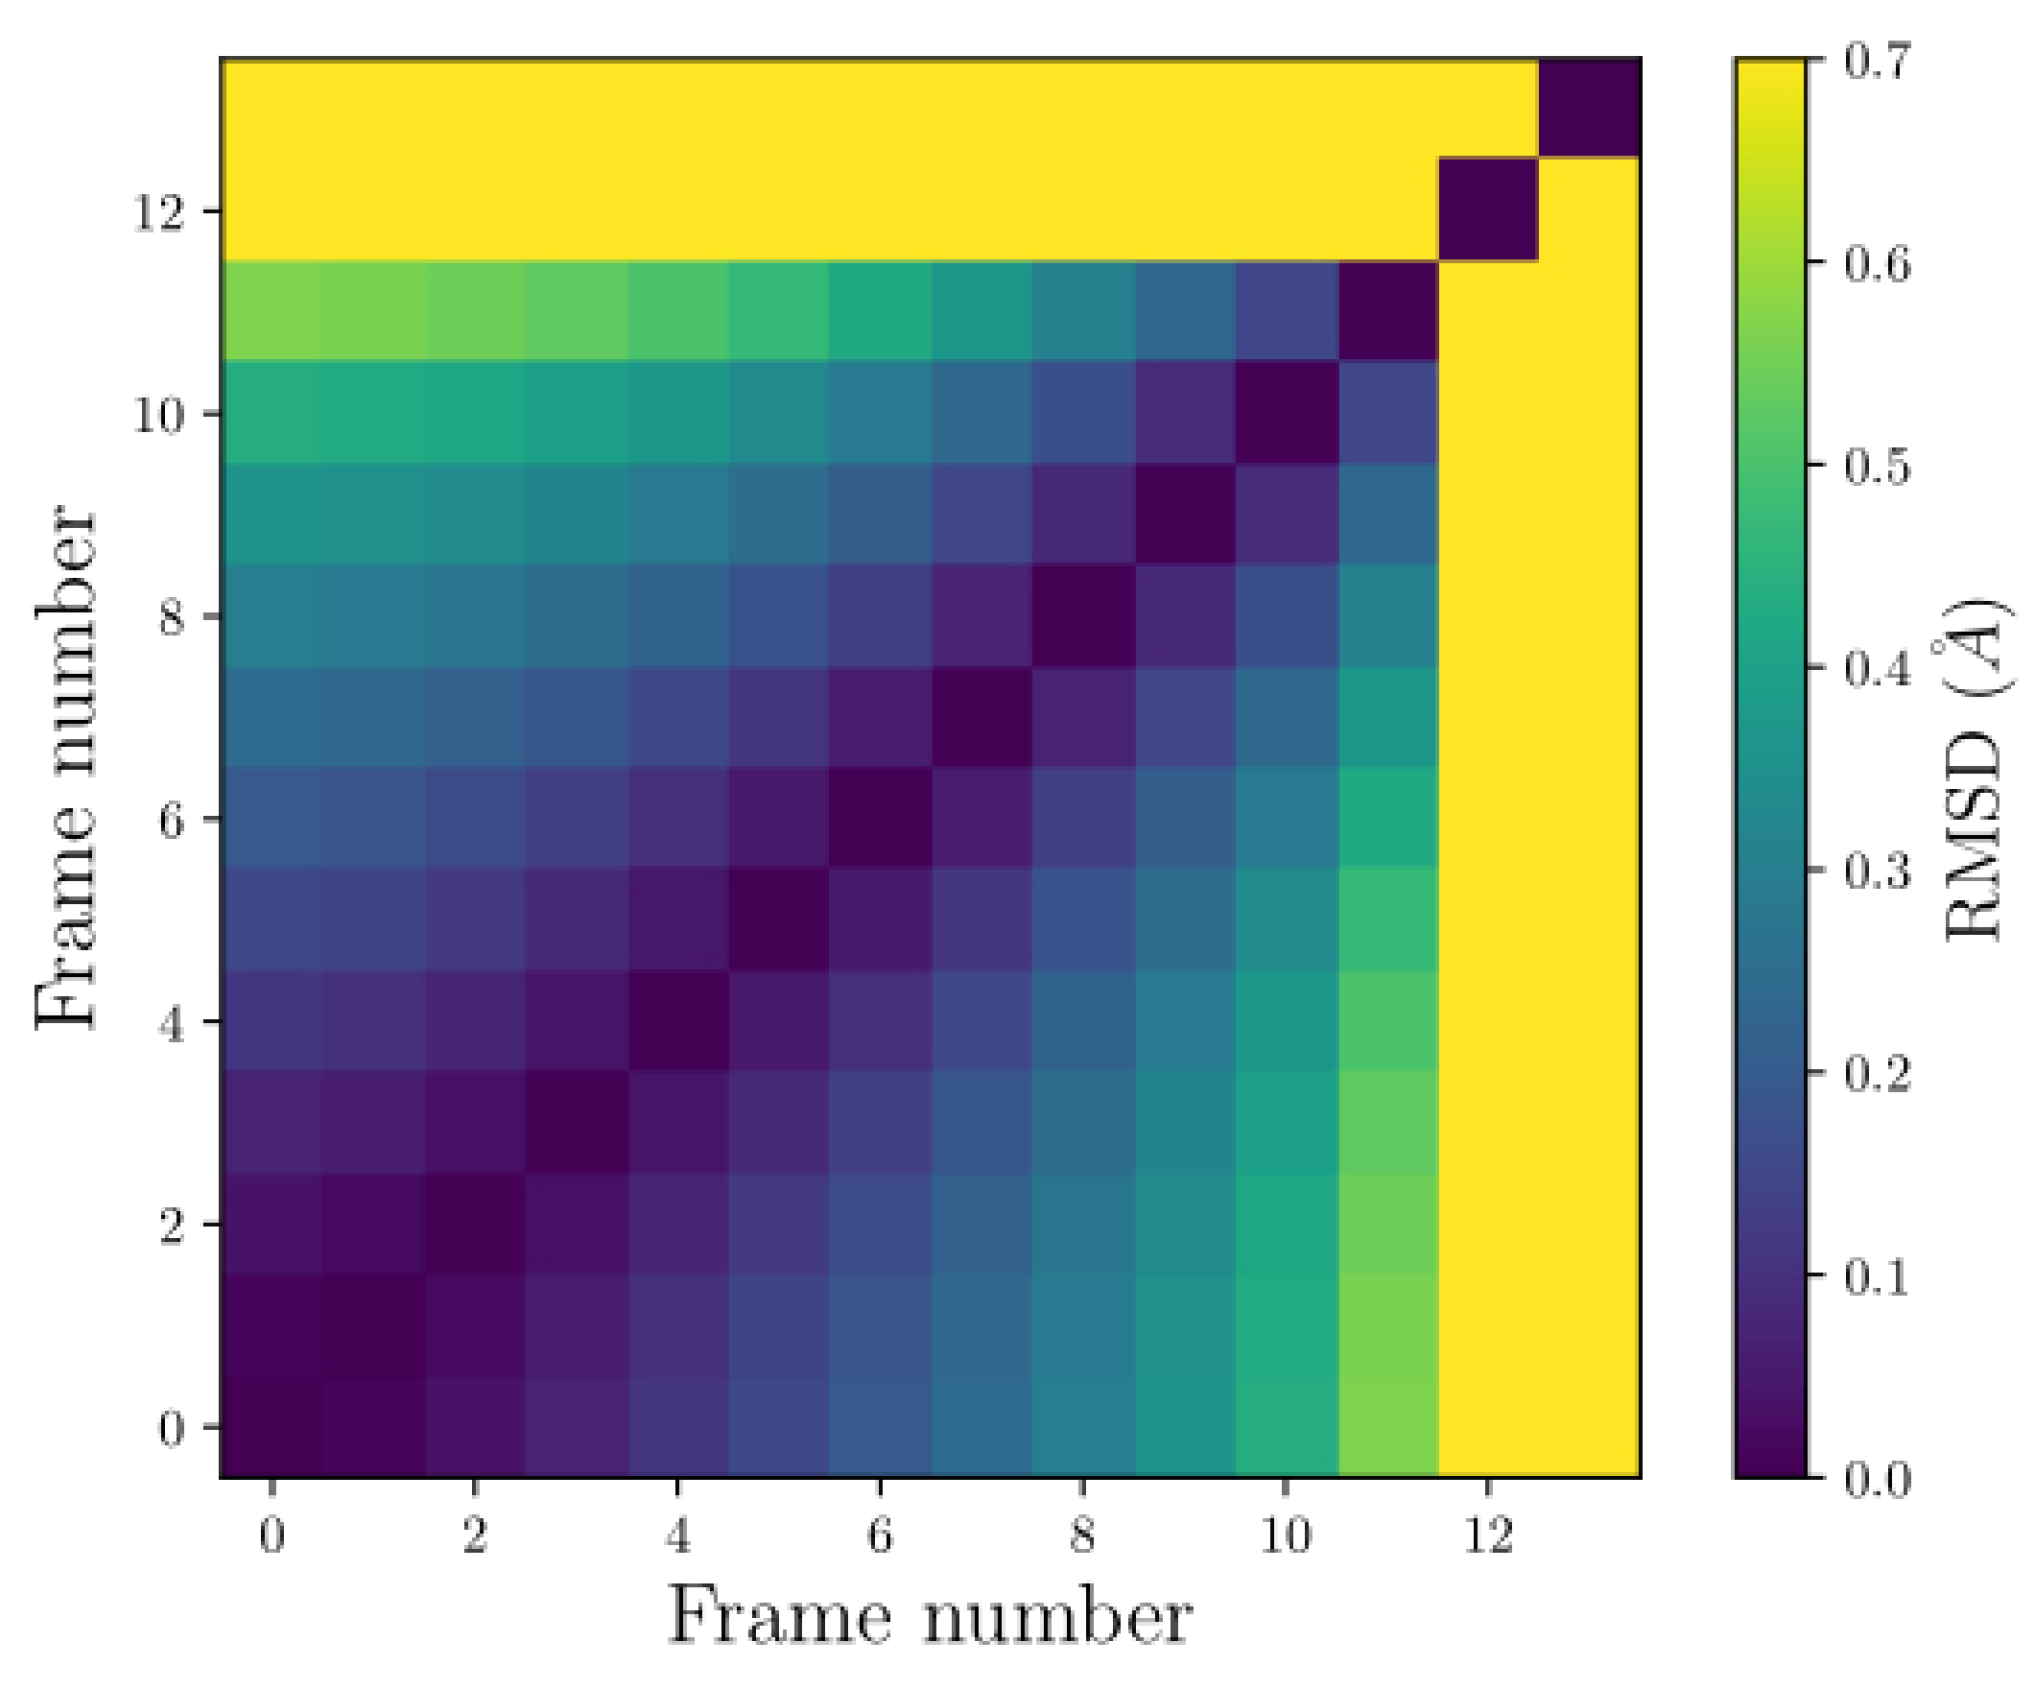
2.3. Geometry Optimization and Born-Oppenheimer Molecular Dynamics (BOMD)
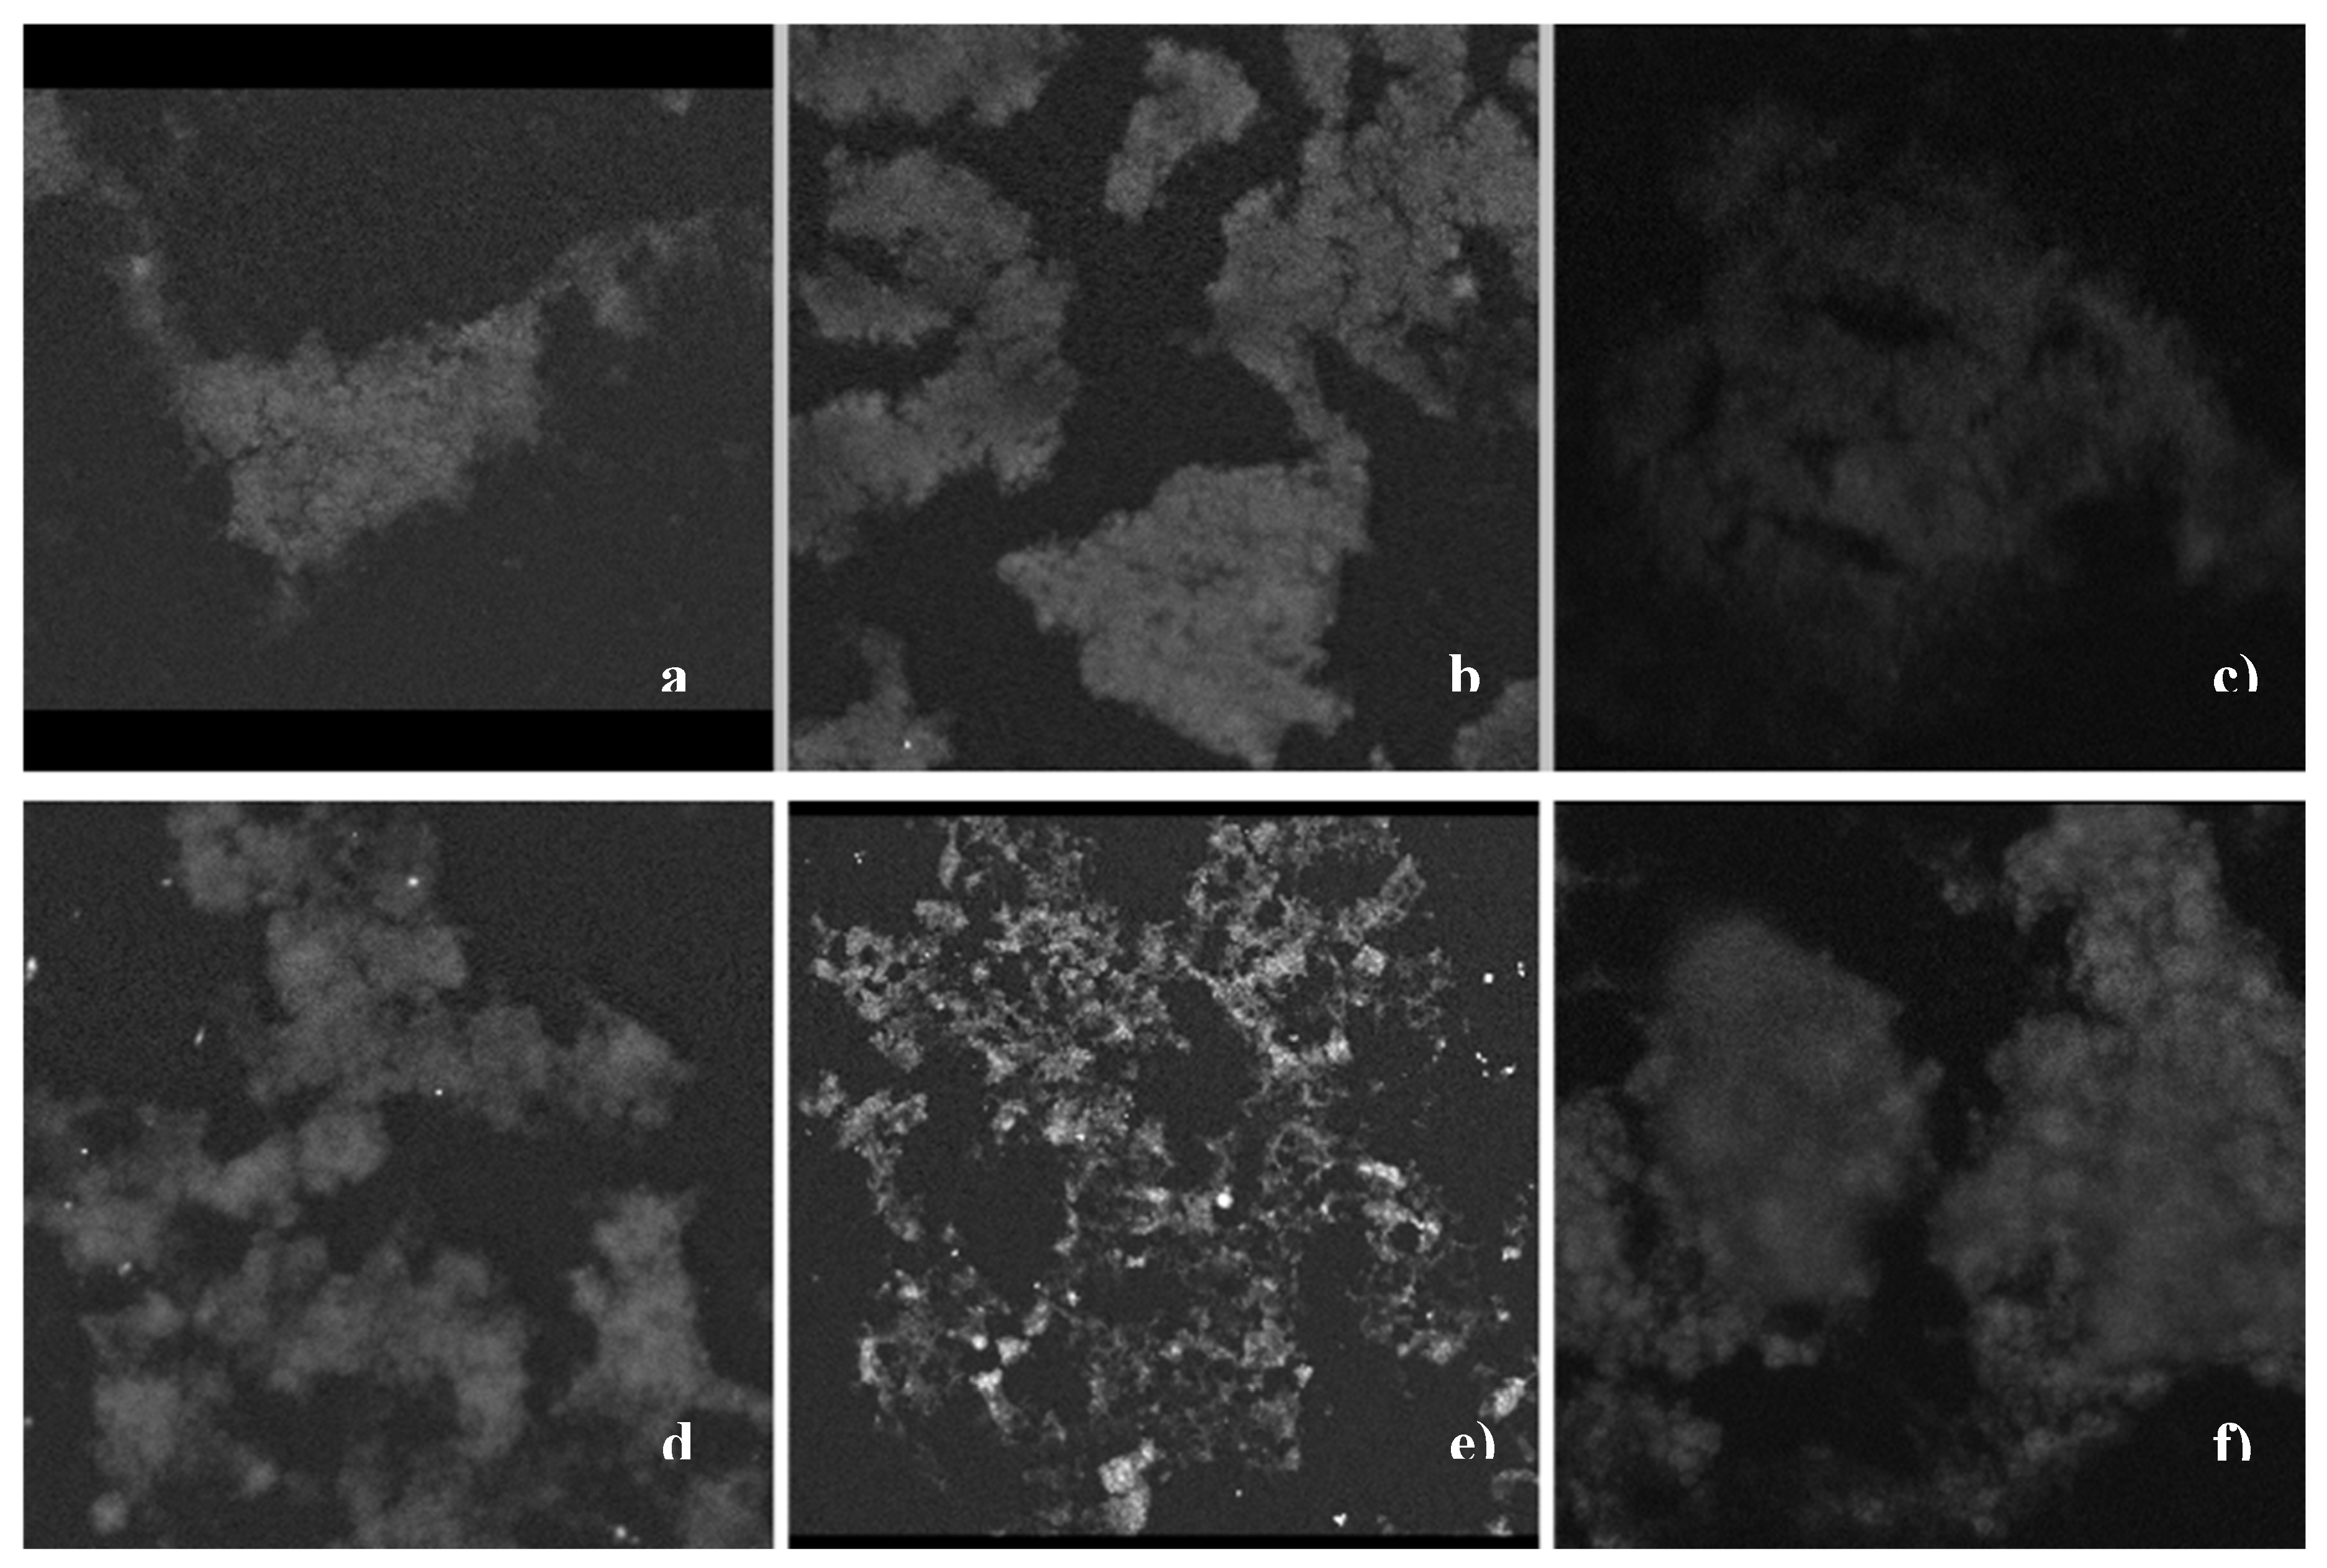
2.4. SHG Measurements
3. Materials and Methods
3.1. Synthesis of Chitosan/Poly(Vinyl Alcohol)/Glutaraldehyde Nanospheres Loaded with Sr (Sr- NPs)
3.1.1. Preparation of CS/PVA Hydrogel Blend
3.1.2. Preparation of CS/PVA/GA Nanospheres
3.1.3. Synthesis of the SrFRUCl MOF
3.2. Nanosphere Characterization
3.2.1. Fourier Transform Infrared (FTIR) Spectroscopy
3.2.2. X-ray Powder Diffraction (XRPD) Characterization
3.2.3. Scanning Electron Microscopy (SEM)/Energy Dispersive Spectroscopy (EDS)
3.3. Theoretical Simulations
3.3.1. Born-Oppenheimer Molecular Dynamics (BOMD)
3.4. Second Harmonic Generation (SHG) Measurements
4. Conclusions
Supplementary Materials
Funding
Data Availability Statement
Conflicts of Interest
References
- Ravi Kumar, M.N.V. A review of chitin and chitosan applications. React. Funct. Polym. 2000, 46, 1–27. [Google Scholar] [CrossRef]
- Wong, T.W.; Chan, L.W.; Kho, S.B.; Sia Heng, P.W. Design of controlled-release solid dosage forms of alginate and chitosan using microwave. J. Control. Release 2002, 84, 99–114. [Google Scholar] [CrossRef]
- Abdeen, R.; Salahuddin, N. Modified chitosan-clay nanocomposite as a drug delivery system intercalation and in vitro release of ibuprofen. J. Chem. 2013, 9, 576370–576379. [Google Scholar]
- Wong, T.W.; Chan, V.S.; Kho, B.; Sia Heng, P.W. Design of controlled-release solid dosage forms of alginate and chitosan using microwave. J. Control. Release 2002, 84, 99–114. [Google Scholar] [CrossRef]
- Nanda, R.; Sasmal, A.; Nayak, P.L. Preparation and characterization of chitosan–polylactide composites blended with Cloisite 30B for control release of the anticancer drug paclitaxel. Carbohydr. Polym. 2011, 83, 988–994. [Google Scholar] [CrossRef]
- Chandy, T.; Sharma, C.P. Chitosan as a biomaterial. Biomater. Artif. Cell. 1990, 18, 1–24. [Google Scholar] [CrossRef]
- Pathania, D.; Gupta, D.; Agarwal, S.; Asif, M.; Gupta, V.K. Fabrication of chitosan-g-poly (acrylamide)/CuS nanocomposite for controlled drug delivery and antibacterial activity. Materials Science and Engineering C 2016, 64, 428–435. [Google Scholar] [CrossRef]
- Kato, Y.; Onishi, H.; Machida, Y. Application of chitin and chitosan derivatives in the pharmaceutical field. Curr. Pharm. Biotechnol. 2003, 4, 303–309. [Google Scholar] [CrossRef] [PubMed]
- Singla, A.K.; Chawla, M. Chitosan: Some pharmaceutical and biological aspects—an update. J. Pharm. Pharmacol. 2001, 53, 1047–1067. [Google Scholar] [CrossRef] [PubMed]
- Mohammed, M.A.; Syeda, J.T.M.; Wasan, K.M.; Wasan, E. K. An Overview of Chitosan Nanoparticles and Its Application in Non-Parenteral Drug Delivery. Pharmaceutics 2017, 9, 53–79. [Google Scholar] [CrossRef]
- Yanat, M.; Schroën, K. Preparation methods and applications of chitosan nanoparticles; with an outlook toward reinforcement of biodegradable packaging. React. Funct. Polym. 2021, 161, 104849–104861. [Google Scholar] [CrossRef]
- Ji, J.; Hao, S.; Wu, D.; Huang, R.; Xu, Y. Preparation, characterization and in vitro release of chitosan nanoparticles loaded with gentamicin and salicylic acid. Carbohydr. Polym. 2011, 85, 803–808. [Google Scholar] [CrossRef]
- Ghadi, A.; Mahjoub, S.; Tabandeh, F.; Talebnia, F. Synthesis and optimization of chitosan nanoparticles: Potential applications in nanomedicine and biomedical engineering. Caspian J Intern Med. 2014, 5, 156–161. [Google Scholar] [PubMed]
- Praveen, E.; Muruganb, S.; Jayakumar, K. Investigations on the existence of piezoelectric property of a bio-polymer – chitosan and its application in vibration sensors. RSC Adv. 2017, 7, 35490–35495. [Google Scholar] [CrossRef]
- Aghigh, A. , Bancelin, S.; Rivard, M., Pinsard, M., Ibrahim, H., Légaré, F. Second harmonic generation microscopy: a powerful tool for bio-imaging. Biophys. Rev. 2023, 15, 43–70. [Google Scholar] [CrossRef]
- Tran, R.J.; Sly, K.L.; Conboy, J.C. Applications of Surface Second Harmonic Generation in Biological Sensing. Annu. Rev. Anal. Chem. 2017, 10, 387–414. [Google Scholar] [CrossRef]
- Salih, S.; Alkatheeri, A.; Alomaim, W.; Elliyanti, A. Radiopharmaceutical Treatments for Cancer Therapy, Radionuclide Characteristic, Applications, and Challenges. Molecules 2022, 27, 5231–5246. [Google Scholar] [CrossRef] [PubMed]
- Asadian, S.; Mirzaei, H.; Kalantari, B.A.; Davarpanah, M.R.; Mohamadi, M.; Shpichka, A.; Nasehi, L.; Es, H.A.; Timashev, P.; Najimi, M.; Gheibi, N.; Hassan, M.; Vosough, M. β-radiating radionuclides in cancer treatment, novel insight into promising approach. Pharmacol. Res. 2020, 160, 105070–105081. [Google Scholar] [CrossRef]
- Widel, M.; Przybyszewski, W.M.; Cieslar-Pobpuda, A.; Saenko, Y.V.; Rzeszowska-Wolny, J. ; Bystander normal human fibroblasts reduce damage response in radiation targeted cancer cells through intercellular ROS level modulation. Muta. Res. 2012, 731, 117–124. [Google Scholar] [CrossRef]
- Yaneva, M.P.; Semerdjieva, M.; Radev, L.R.; Ivanova, E.K.; Geiman, M.; Vlaikova, M.I.; Mihova, L.S. Radionuclide therapy of cancer patients with bone metastases. Folia Med. (Plovdiv) 2005, 47, 63–69. [Google Scholar]
- Nightengale, B.; Brune, M.; Blizzard, S.P. , Ashley-Johnson, M.; Slan, S. Am. J. Health Syst. Pharm. 1995, 52, 2189–2195. [Google Scholar] [CrossRef] [PubMed]
- Dafermou, A.; Colamussi, P.; Giganti, M.; Cittanti, C.; Bestagno, M.; Piffanelliet, A. A multicentre observational study of radionuclide therapy in patients with painful bone metastases of prostate cancer. Eur. J. Nucl. Med. 2001, 28, 788–798. [Google Scholar] [CrossRef] [PubMed]
- Nightengale, B.; Brune, M.; Blizzard, S.P.; Ashley-Johnson, M.; Slan, S. Strontium chloride Sr 89 for treating pain from metastatic bone disease. Am. J. Health-Syst. Ph. 1995, 52, 2189–2195. [Google Scholar] [CrossRef]
- Adhikari, H.S.; Yadav, P.N. Anticancer Activity of Chitosan, Chitosan Derivatives, and Their Mechanism of Action. Int. J. Biomater. 2018, 2952085–2952114. [Google Scholar] [CrossRef] [PubMed]
- Zhang, H.; Wu, F.; Li, Y.; Yang, X.; Huang, J.; Lv, T.; Zhang, Y.; Chen, J.; Chen, H.; Gao, Y.; Liu, G.; Jia, L. Chitosan-based nanoparticles for improved anticancer efficacy and bioavailability of mifepristone. Beilstein J. Nanotechnol. 2016, 7, 1861–1870. [Google Scholar] [CrossRef] [PubMed]
- Gavhane, Y.N.; Gurav, A.S.; Yadav, A.V. Chitosan and Its Applications: A Review of Literature. Int. J. Res. Pharm. Biomed. Sci. 2013, 4, 312–331. [Google Scholar]
- Thanou, M.; Verhoef, J.C.; Junginger, H.E. Chitosan and its derivatives as intestinal absorption enhancers. Adv. Drug Delivery Rev. 2001, 50, S91–S101. [Google Scholar] [CrossRef]
- Praveen, E.; Murugan, S.; Jayakumar, K. Investigations on the existence of piezoelectric property of a bio-polymer – chitosan and its application in vibration sensors. RSC Adv. 2017, 7, 35490–35495. [Google Scholar] [CrossRef]
- Marabello, D.; Antoniotti, P.; Benzi, P.; Canepa, C.; Mortati, L.; Sassi, M.P. Synthesis, structure and non-linear optical properties of new isostructural b-D-fructopyranose alkaline halide metal–organic frameworks: a theoretical and an experimental study. Acta Cryst. 2017, B73, 737–743. [Google Scholar] [CrossRef]
- Barnett, R.N.; Landman, U. Born-Oppenheimer molecular-dynamics simulations of finite systems: Structure and dynamics of (H2O)2. Physical Review B 1993, 48, 2081–2097. [Google Scholar] [CrossRef]
- Vásquez-Pérez, J.M.; Martínez, G.U.G.; Köster, A.M.; Calaminici, P. The discovery of unexpected isomers in sodium heptamers by Born–Oppenheimer molecular dynamics. J. Chem. Phys. 2009, 131, 124126–124136. [Google Scholar] [CrossRef] [PubMed]
- Naveen Kumar, H.M.P.; Prabhakar, M.N.; Venkata Prasad, C.; Madhusudhan Rao, K.; Ashok Kumar Reddy, T.V.; Chowdoji Rao, K.; Subha, M.C.S. Compatibility studies of chitosan/PVA blend in 2% aqueous acetic acid solution at 30°C. Carbohyd. Polym. 2010, 82, 251–255. [Google Scholar] [CrossRef]
- Zhuang, P.-Y.; Li, Y.-L.; Fan, L.; Lin, J.; Qiao-Ling, H. Modification of chitosan membrane with poly(vinyl alcohol) and biocompatibility evaluation. Int. J. Biol. Macromol. 2012, 50, 658–663. [Google Scholar] [CrossRef] [PubMed]
- Figueroa-Pizano, M.D.; Vélaz, I.; Penas, F.J.; Zavala-Rivera, P.; Rosas-Durazo, A.J.; Maldonado-Arce, A.D.; Martínez-Barbosa, M.E. Effect of freeze-thawing conditions for preparation of chitosanpoly(vinyl alcohol) hydrogels and drug release studies. Carbohyd. Polym. 2018, 195, 476–485. [Google Scholar] [CrossRef] [PubMed]
- Brunel, F.; Véron, L.; David, L.; Domard, A.; Delair, T. A Novel Synthesis of Chitosan Nanoparticles in Reverse Emulsion. Langmuir 2008, 24, 11370–11377. [Google Scholar] [CrossRef] [PubMed]
- Sinha, V.R.; Singla, A.K.; Wadhawan, S.; Kaushik, R.; Kumria, R.; Bansal, K.; Dhawan, S. Chitosan microspheres as a potential carrier for drugs. Int. J. Pharm. 2004, 274, 1–33. [Google Scholar] [CrossRef] [PubMed]
- Costa-Júnior, E.S.; Barbosa-Stancioli, E.F.; Mansur, A.A.P.; Vasconcelos, W.L.; Mansur, H.S. Preparation and characterization of chitosan/poly(vinyl alcohol) chemically crosslinked blends for biomedical applications. Carbohyd. Polym. 2009, 76, 472–481. [Google Scholar] [CrossRef]
- He, Q.; Gong, K.; Ao, Q.; Ma, T.; Yan, Y.; Gong, Y.; Zhang, X. Positive charge of chitosan retards blood coagulation on chitosan films. J. Biomater. Appl. 2013, 27, 1032–1045. [Google Scholar] [CrossRef] [PubMed]
- Gonenc, I.; Us, F. Effect of glutaraldehyde crosslinking on degree of substitution, thermal, structural, and physicochemical properties of corn starch. Starch-Stärke 2019, 71, 1800046–1800056. [Google Scholar] [CrossRef]
- Mansur, H.S.; Sadahira, C.M.; Souza, A.N.; Mansur, A.A. FTIR spectroscopy characterization of poly (vinyl alcohol) hydrogel with different hydrolysis degree and chemically crosslinked with glutaraldehyde. Mat. Sci. Eng. C 2008, 28, 539–548. [Google Scholar] [CrossRef]
- Ceylan, S.; Alatepeli, B. Evaluation of PVA/Chitosan Cryogels as Potential Tissue Engineering Scaffolds; Synthesis, cytotoxicity and genotoxicity investigations. JOTCSA 2021, 8, 69–78. [Google Scholar] [CrossRef]
- Alimuddin, A.; Rafeeq, M. Synthesis and Characterization of Strontium Oxide Nano Particle by Sol-Gel Method. Orient. J. Chem. 2021, 37, 177–180. [Google Scholar] [CrossRef]
- Khalil, K.D.; Riyadh, S.M.; Alkayal, N.S.; Bashal, A.H.; Alharbi, K.H.; Alharbi, W. Chitosan-Strontium Oxide Nanocomposite: Preparation, Characterization, and Catalytic Potency in Thiadiazoles Synthesis. Polymers 2022, 14, 2827. [Google Scholar] [CrossRef] [PubMed]
- Apsana, G.; George, P.P.; Devanna, N.; Yuvasravana, R. Biomimetic Synthesis and Antibacterial Properties of Strontium Oxide Nanoparticles Using Ocimum Sanctum Leaf Extract. Asian J. Pharm. Clin. Res. 2018, 11, 384–389. [Google Scholar]
- Garnica-Palafox, I.M.; Sánchez-Arévalo, F.M. Influence of natural and synthetic crosslinking reagents on the structural and mechanical properties of chitosan-based hybrid hydrogels. Carbohyd. Polym. 2016, 151, 1073–1081. [Google Scholar] [CrossRef] [PubMed]
- Collins, T.J. ImageJ for microscopy. Biotechniques 2007, 43, S25–S30. [Google Scholar] [CrossRef] [PubMed]
- Frisch, M.J.; Trucks, G.W.; Schlegel, H.B.; Scuseria, G.E.; Robb, M.A. ; Cheeseman, J.R.; Scalmani, G.; Barone, V.; Petersson, G.A.; Nakatsuji, H.; Li, X.; Caricato, M.; Marenich, A.V.; Bloino, J.; Janesko, B.G.; Gomperts, R.; Mennucci, B.; Hratchian, H.P.; Ortiz, J.V.; Izmaylov, A.F.; Sonnenberg, V.; Williams-Young, D.; Ding, F.; Lipparini, F.; Egidi, F.; Goings, J.; Peng, B.; Petrone, A.; Henderson, T.; Ranasinghe, D.; Zakrzewski, V.G.; Gao, J.; Rega, N.; Zheng, G.; Liang, W.; Hada, M.; Ehara, M.; Toyota, K.; Fukuda, R.; Hasegawa, J.; Ishida, M.; Nakajima, T.; Honda, Y.; Kitao, O.; Nakai, H.; Vreven, T.; Throssell, K.; Montgomery Jr., J.A.; Peralta, J.E.; Ogliaro, F.; Bearpark, M.J.; Heyd, J.J.; Brothers, E.N.; Kudin, K.N.; Staroverov, V.N.; Keith, T.A.; Kobayashi, R.; Normand, J.; Raghavachari, K.; Rendell, A.P.; Burant, J.C.; Iyengar, S.S.; Tomasi, J.; Cossi, M.; Millam, J.M.; Klene, M.; Adamo, C.; Cammi, R.; Ochterski, J.W.; Martin, R.L.; Morokuma, K.; Farkas, O.; Foresman, J.B.; Fox, D.J., Gaussian 16, Revision C.01, Inc., Wallingford CT, 2016.
- Schlegel, H.B.; Daudel, C. Computational Theoretical Organic Chemistry. Reidel, Dordrecht, 1981, 129, ed. I. G. Csizsmadia and R. Daudel.
- Schlegel, H.B. An efficient algorithm for calculating ab initio energy gradients using s, p Cartesian Gaussians. J. Chem. Phys. 1982, 77, 3676–3681. [Google Scholar] [CrossRef]
- Schlegel, H.B. Optimization of equilibrium geometries and transition structures. J. Comput. Chem. 1982, 3, 214–218. [Google Scholar] [CrossRef]
- Becke, A.D. Density-functional exchange-energy approximation with correct asymptotic behavior. Phys. Rev. A, 1988, 38, 3098–3100. [Google Scholar] [CrossRef] [PubMed]
- Becke, A.D. Density-functional thermochemistry. III. The role of exact exchange. J. Chem. Phys. 1993, 98, 5648–5652. [Google Scholar] [CrossRef]
- Hehre, W.J.; Radom, L.; Vr Schleyer, P.; Pople, J.A. Ab Initio Molecular Orbital Theory. Wiley, New York, 1986.
- Wadt, W.R.; Hay, P.J. Ab initio effective core potentials for molecular calculations. Potentials for the transition metal atoms Sc to Hg. J. Chem. Phys. 1985, 82, 270–283. [Google Scholar] [CrossRef]
- Aprà, E.; Bylaska, E.J.; de Jong, W.A.; Govind, N.; Kowalski, K.; Straatsma, T.P.; Valiev, M.; Van Dam, H.J.J.; Alexeev, Y.; Anchell, J.; Anisimov, V.; Aquino, F.W.; Atta-Fynn, R.; Autschbach, J.; Bauman, N.P.; Becca, J.C.; Bernholdt, D.E.; Bhaskaran-Nair, K.; Bogatko, S.; Borowski, P.; Boschen, J.; Brabec, J.; Bruner, A.; Cauët, E.; Chen, Y.; Chuev, G.N.; Cramer, C.J.; Daily, J.; Deegan, M.J.O.; Dunning Jr., T.H.; Dupuis, M.; Dyall, K.G.; Fann, G.I.; Fischer, S.A.; Fonari, A.; Früchtl, H.; Gagliardi, L.; Garza, J.; Gawande, N.; Ghosh, S.; Glaesemann, K.; Götz, A.W.; Hammond, J.; Helms, V.; Hermes, E.D.; Hirao, K.; Hirata, S.; Jacquelin, M.; Jensen, L.; Johnson, B.G.; Jónsson, H.; Kendall, R.A.; Klemm, M.; Kobayashi, R.; Konkov, V.; Krishnamoorthy, S.; Krishnan, M.; Lin, Z.; Lins, R.D.; Littlefield, R.J.; Logsdail, A.J.; Lopata, K.; Ma, W.; Marenich, A.V.; Martin del Campo, J.; Mejia-Rodriguez, D.; E. Moore, J.; Mullin, J.M.; Nakajima, T.; Nascimento, D.R.; Nichols, J.A.; Nichols, P.J.; Nieplocha, J.; Otero-de-la-Roza, A.; Palmer, B.; Panyala, A.; Pirojsirikul, T.; Peng, B.; Peverati, R.; Pittner, J.; Pollack, L.; Richard, R.M.; Sadayappan, P.; Schatz,G. C.; Shelton, W.A.; Silverstein, D.W.; Smith, D.M.A.; Soares, T.A.; Song, D.; Swart, M.; Taylor, H.L.; Thomas, G.S.; Tipparaju, V.; Truhlar, D.G.; Tsemekhman, K.; Van Voorhis, T.; Vázquez-Mayagoitia, Á.; Verma, P.; Villa, O.; Vishnu, A.; Vogiatzis, K.D.; Wang, D.; Weare, J.H.; Williamson, M.J.; Windus, T.L.; Woliński, K.; Wong, A.T.; Wu, Q.; Yang, C.; Yu, Q.; Zacharias, M.; Zhang, Z.; Zhao, Y.; Harrison, R.J. NWChem: Past, present, and future. J. Chem. Phys. 2020, 152, 184102–184128.
- Xu, X.; Truhlar, D.G. Performance of Effective Core Potentials for Density Functional Calculations on 3d Transition Metals. J. Chem. Theory Comput. 2012, 8, 80–90. [Google Scholar] [CrossRef]
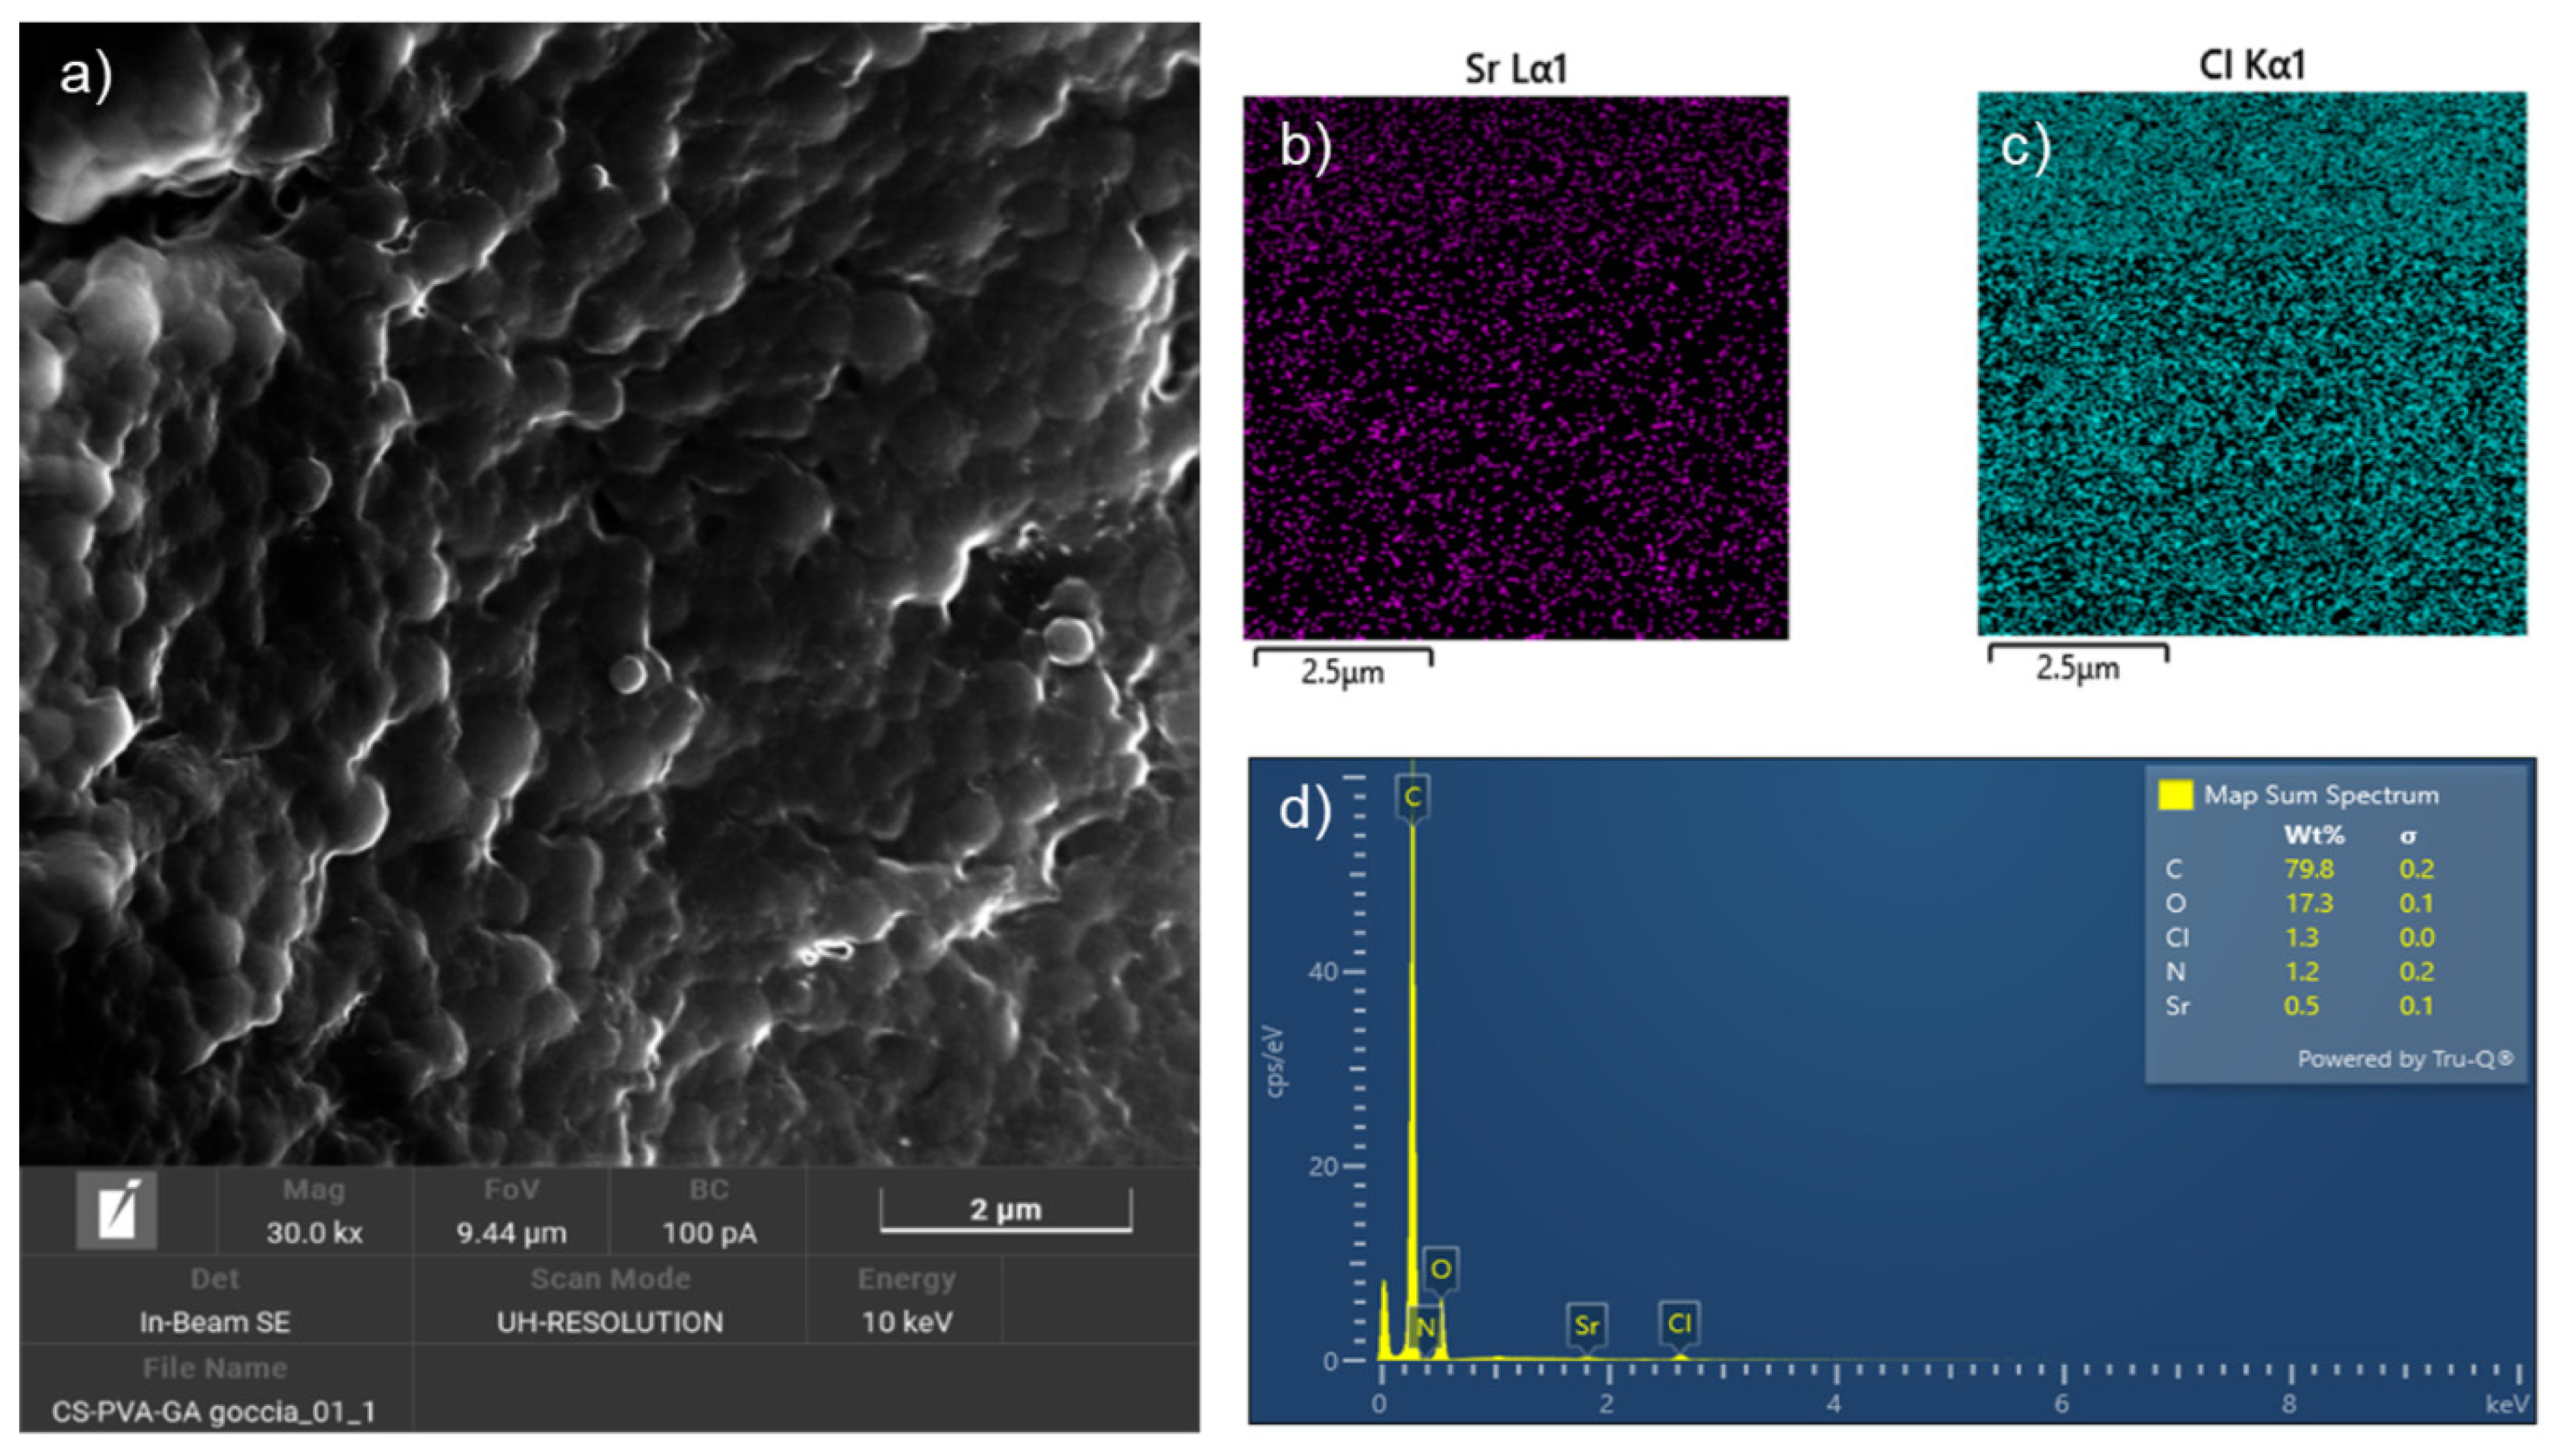



| Sr-NPs | ||
| Element | Weight% | Standard deviation |
| Cl | 2.9 | 0.1 |
| Sr | 0.6 | 0.1 |
| Chitosan-based NPs + SrCl2 | ||
| Cl | 1.9 | 0.1 |
| Sr | Not present | Not present |
| Chitosan-based NPs + SrCl2 + Fructose | ||
| Cl | 1.5 | 0.1 |
| Sr | Not present | Not present |
| XRD | FRAG1 | XRD | FRAG1 | ||
|---|---|---|---|---|---|
| C1-C2 | 1.46(4) | 1.55 | C4-O11 | 1.45(4) | 1.43 |
| C1-O1 | 1.47(3) | 1.41 | C5-C6 | 1.48(5) | 1.52 |
| C1-O5 | 1.32(4) | 1.40 | C5-O5 | 1.47(3) | 1.42 |
| C2-C3 | 1.51(2) | 1.54 | C6-O6 | 1.42(5) | 1.41 |
| C2-N1 | 1.43(4) | 1.45 | C7-C8 | 1.49(2) | 1.52 |
| C3-C4 | 1.50(2) | 1.53 | C7-N1 | 1.38(4) | 1.38 |
| C3-O3 | 1.40(3) | 1.42 | C7-O7 | 1.31(4) | 1.22 |
| C4-C5 | 1.51(4) | 1.54 | O1-C42 | 1.45(4) | 1.41 |
| XRD | FRAG2 | XRD | FRAG2 | ||
|---|---|---|---|---|---|
| C1-C2 | 1.46(4) | 1.54 | C4-O11 | 1.45(4) | 1.42 |
| C1-O1 | 1.47(3) | 1.43 | C5-C6 | 1.48(5) | 1.53 |
| C1-O5 | 1.32(4) | 1.40 | C5-O5 | 1.47(3) | 1.44 |
| C2-C3 | 1.51(2) | 1.53 | C6-O6 | 1.42(5) | 1.41 |
| C2-N1 | 1.43(4) | 1.46 | C7-C8 | 1.49(2) | 1.52 |
| C3-C4 | 1.50(2) | 1.55 | C7-N1 | 1.38(4) | 1.35 |
| C3-O3 | 1.40(3) | 1.42 | C7-O7 | 1.31(4) | 1.25 |
| C4-C5 | 1.51(4) | 1.54 | O1-C42 | 1.45(4) | 1.42 |
| XRD | FRAG4 | XRD | FRAG4 | ||
|---|---|---|---|---|---|
| C1-C2 | 1.46(4) | 1.55 | C4-O11 | 1.45(4) | 1.42 |
| C1-O1 | 1.47(3) | 1.41 | C5-C6 | 1.48(5) | 1.53 |
| C1-O5 | 1.32(4) | 1.40 | C5-O5 | 1.47(3) | 1.44 |
| C2-C3 | 1.51(2) | 1.54 | C6-O6 | 1.42(5) | 1.42 |
| C2-N1 | 1.43(4) | 1.45 | C7-C8 | 1.49(2) | 1.52 |
| C3-C4 | 1.50(2) | 1.53 | C7-N1 | 1.38(4) | 1.38 |
| C3-O3 | 1.40(3) | 1.42 | C7-O7 | 1.31(4) | 1.22 |
| C4-C5 | 1.51(4) | 1.54 | O1-C42 | 1.45(4) | 1.43 |
Disclaimer/Publisher’s Note: The statements, opinions and data contained in all publications are solely those of the individual author(s) and contributor(s) and not of MDPI and/or the editor(s). MDPI and/or the editor(s) disclaim responsibility for any injury to people or property resulting from any ideas, methods, instructions or products referred to in the content. |
© 2024 by the authors. Licensee MDPI, Basel, Switzerland. This article is an open access article distributed under the terms and conditions of the Creative Commons Attribution (CC BY) license (http://creativecommons.org/licenses/by/4.0/).


