1. Introduction
The debate surrounding forward head posture revolves around the question of whether it should be considered a normal variant or an abnormal condition that requires correction [
1]. Forward head posture (FHP), where the head protrudes forward relative to the shoulders [
2], is a common phenomenon, especially in today's digital age with increased screen time and sedentary lifestyles [
3].
While pain can be a significant indicator of postural disorders [
4], solely relying on pain to pathologize the FHP can be misleading. Not everyone with FHP experiences immediate pain or discomfort, some individuals may develop compensatory mechanisms to cope with their posture [
5], which can temporarily mask pain but exacerbate problems in the long run. The situation of a lack of current pain might lead individuals to overlook the importance of diligently working to attain a more correct posture. It is essential to recognize that a comprehensive approach that goes beyond pain assessment ensures a more nuanced understanding of FHP and helps to uncover the underlying causes and potential risk factors associated with FHP.
In regards to asymptomatic individuals with FHP, in our previous research, we conducted a comprehensive analysis of specific physiological parameters related to the presence of FHP [
6,
7,
8,
9,
10,
11,
12]. We focused on investigating the correlation between FHP in asymptomatic individuals and its impact on cervical spine nerve root evoked potentials [
6], autonomic nervous system activity and sensorimotor control [
7], central sensory processing and sensorimotor integration [
8,
9,
10], athletic performance [
10,
11], and cardiopulmonary function [
12]. Building upon this intriguing groundwork, our current emphasis is on the captivating exploration of the relationship between posture displacement (termed subluxation or altered alignment [
1]) and cognitive function. This topic has emerged as a compelling avenue for further research and understanding with only sparse information available on how FHP might alter brain activity [
13].
Although it has long been thought that cognitive function is associated with musculoskeletal disease [
14,
15], whether cognitive function and posture have a direct impact on each other or to what extent they affect each other is largely unknown. Recently, the relationship between posture subluxation and cognitive function has emerged as an intriguing area of research, and evidence suggests that these two factors may be interconnected [
13]. Posture subluxation, which refers to the misalignment of vertebrae in the spine relative to either a defined ideal posture or a referenced range of normal values [
16], can lead to altered sensory input and proprioception [
7], affecting the body's postural control. This disruption in postural stability has been found to influence cognitive function [
13,
17]. Studies have shown that individuals with posture subluxations may experience deficits in attention, processing speed, and memory, this is especially true in older aged individuals [
18]. Moreover, aberrant proprioceptive signals resulting from subluxations can impact the brain's ability to integrate sensory information effectively [
19], where sagittal imbalance (altered posture) has been found to correlate to cognitive decline in older persons [
20]. Thus, posture subluxations in the sagittal plane may not only be linked to musculoskeletal health [
3,
4] but could also hold potential benefits for cognitive function and overall brain health [
13,
15,
20].
Neurophysiologically, it has been found that vertebral subluxation has a close link with altered somatosensory processing particularly in the prefrontal cortex (PFC) [
21]. The prefrontal cortex is known to be a key structure responsible for the performance of what is known as “executive functions” [
22]. The neuroanatomical connectivity of the PFC to most parts of the cortical and subcortical brain makes it well suited for participating in a number of neural networks and carrying out cognitive control operations in different functional domains [
23]. Cognitive control is a term usually associated with the healthy functioning of the PFC and related regions such as the cingulate cortex [
23].
In this context, dual-task gait, a method of assessment that evaluates gait performance while simultaneously performing a simplistic cognitive task, has emerged as a promising tool for predicting cognitive decline and assessing overall cognitive function [
24]. As individuals age or experience cognitive impairments, the ability to perform dual tasks becomes more challenging due to increased cognitive demands [
25]. Research has shown that gait performance during dual-task conditions can serve as a predictive indicator of cognitive decline and may help identify individuals at risk for developing cognitive impairments [
26]. Furthermore, dual-task gait assessments can detect subtle changes in cognition that might not be evident during single-task gait evaluations [
27]. The integration of cognitive and motor tasks in the dual-task paradigm provides a more ecologically valid measure of real-world functioning, making it a valuable tool for assessing cognitive function in various populations, including older adults and those with neurological conditions [
28].
Despite the high prevalence of FHP, few studies have evaluated the effect it has on gait parameters during a dual task, where only one previous investigation was identified [
29]. In this previous investigation, Moustafa and colleagues identified that whiplash injured populations had a greater dual-task cognitive cost during walking compared to a matched population of chronic neck pain and asymptomatic controls; this increase cognitive cost was correlated to FHP magnitude and altered sensori-motor integration as measured with the N-30 potential’s amplitude [
29]. Due to the scarcity of available data on this topic, the current study was undertaken to investigate the changes in gait parameters in university students and staff with FHP when a cognitive dual task is introduced during walking. The core of our hypothesis is that individuals with forward head posture and those without will demonstrate different responses when undergoing dual-task assessment.
2. Materials and Methods
2.1. Study Design, Participants and Setting
The comparative design was used to evaluate the effect of cognitive dual task on gait parameters in participants with forward head posture compared to a group of strictly matched control participants without FHP. The study was carried out in the laboratories of the University of Sharjah and involved participants who are students and staff members of the same institution. Recruitment efforts were conducted through social media platforms. Ethical approval was received from the University of Sharjah (College of Health Sciences, University of Sharjah, UAE) (Ethical approval number: REC-21-03-11-03-S) and ensured that all participants provided informed consent in accordance with appropriate guidelines and regulations before data collection.
2.2. Inclusion and Exclustion Criteria
To classify an individual with FHP, the craniovertebral angle (CVA) measurement was utilized, and established cutoff values from previous publications were adhered to. Following the data provided by Yip et al. [
30], FHP was defined as having a CVA of less than 50°. Therefore, participants were categorized as having FHP if their CVA measured less than 50°. On the other hand, the control group was defined as individuals with normal or no FHP, characterized by a CVA measurement greater than 55° for each participant. Exclusion criteria for the current investigation were as follows: (i) recent fractures; (ii) BMI > 30; (iii) a history of significant injury or primary musculo-skeletal surgical interventions; (iv) deformity of the spine or extremities; and (v) pregnancy or malignancy.
2.3. Study Tools and Outcome Measures
2.3.1. Craniovertebral Angle (CVA)
The CVA is reliable and valid for assessment of FHP [
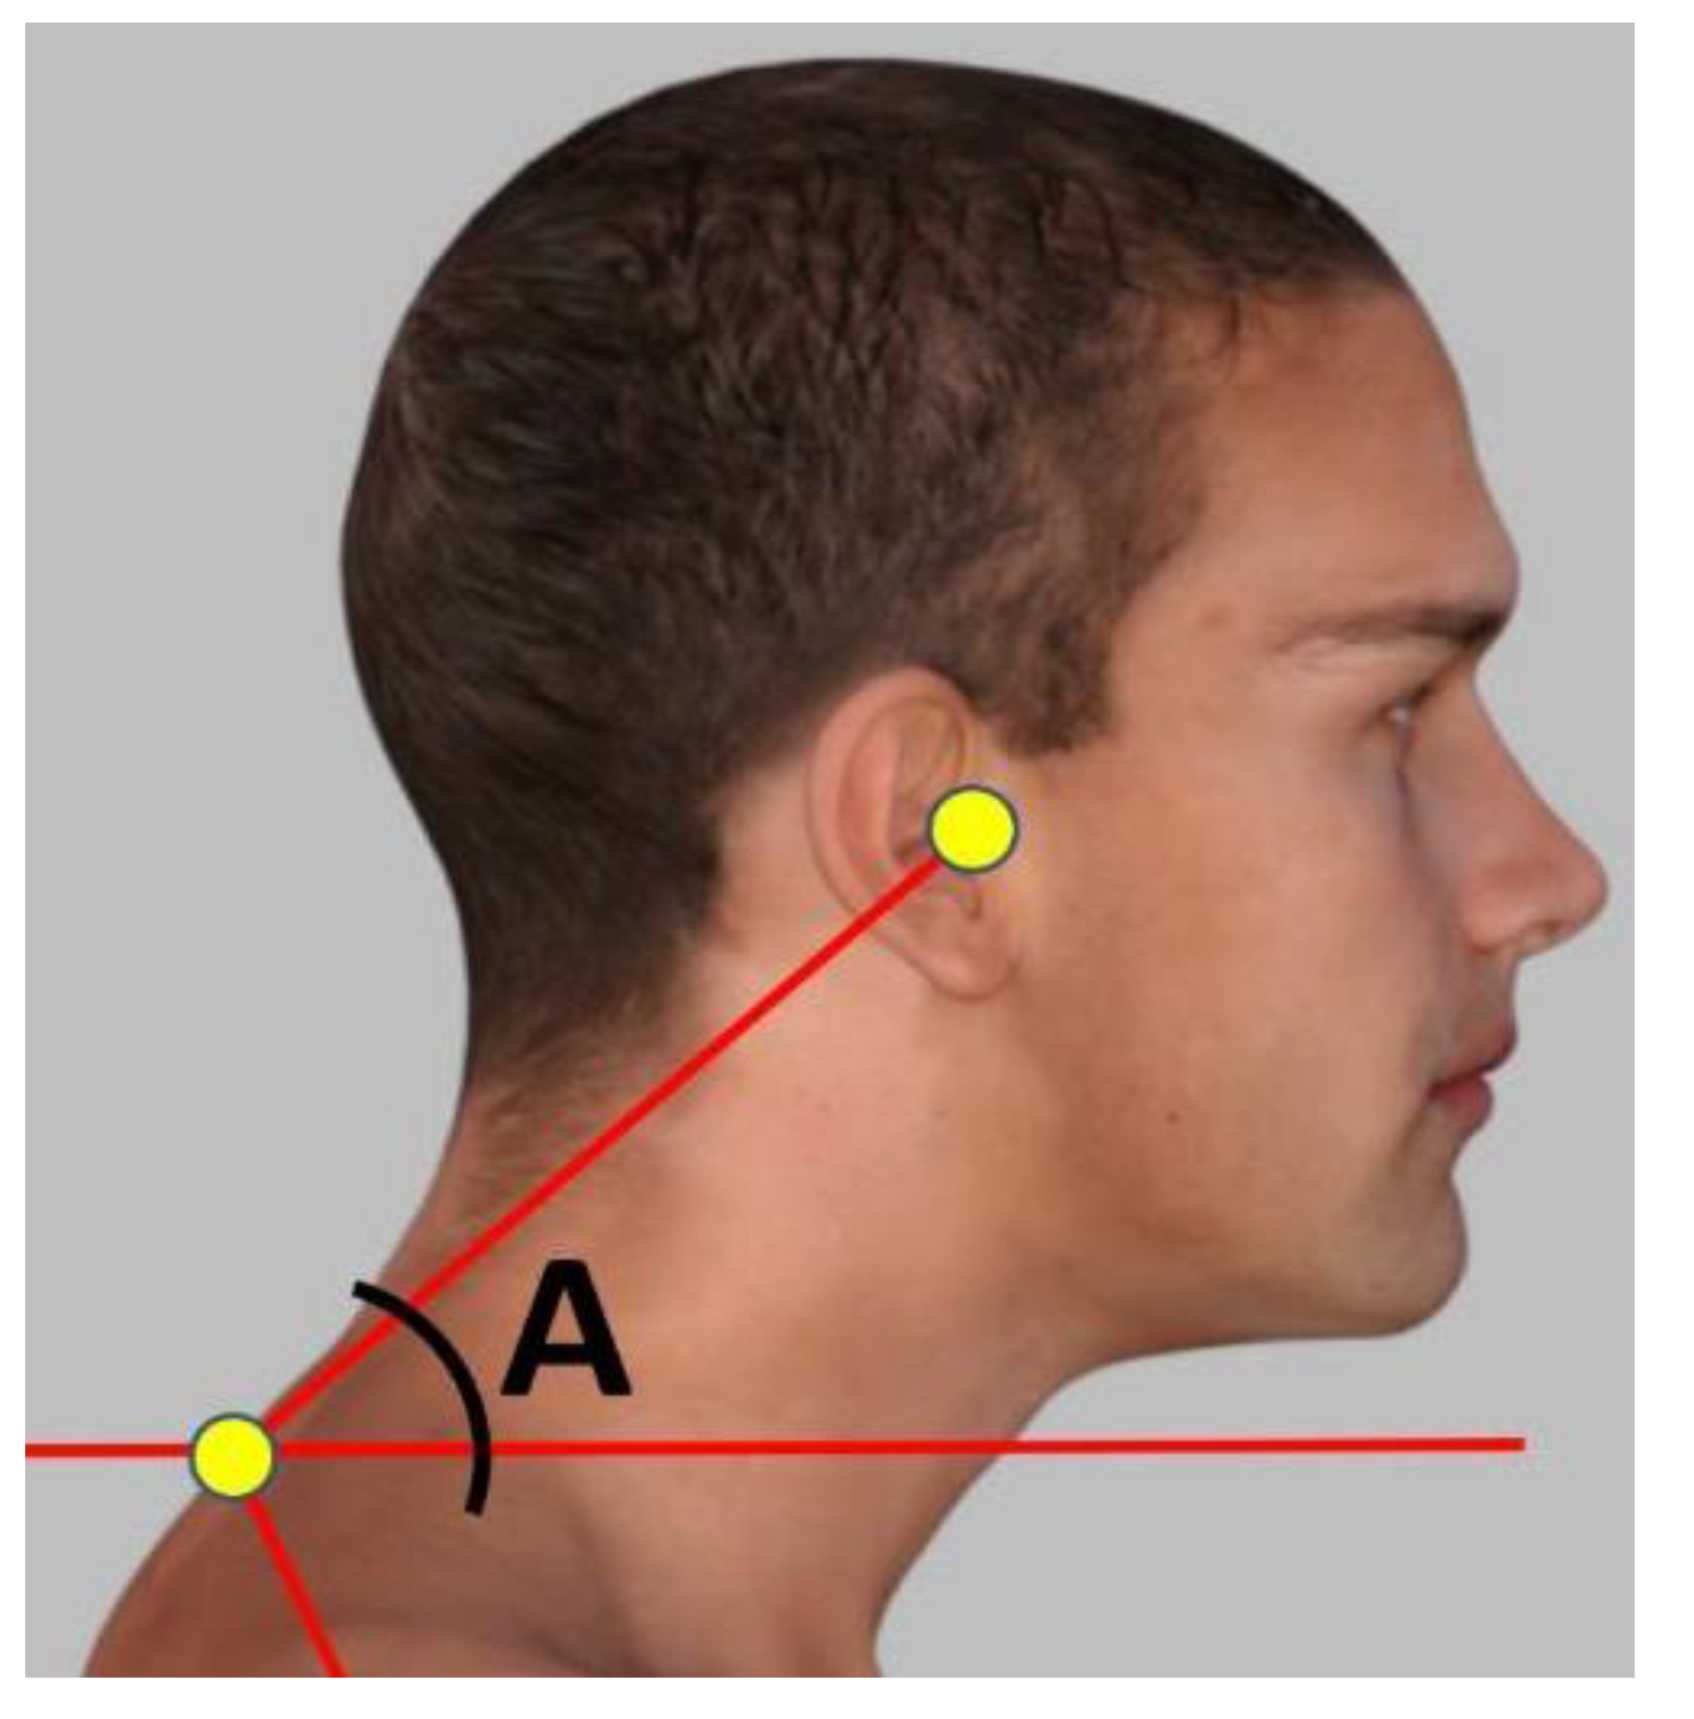
31]. To accurately measure the FHP degree, a photogrammetry method was followed measuring the CVA angle in the sagittal plane. The craniovertebral angle was measured in a standing position by using an imaginary horizontal line passing through the C7 spinous process, as well as another line from the C7 spinous process to the tragus of the ear as shown in
Figure 1. The standing posture position was used to measure the CVA as recent evidence indicates a significant difference in sitting vs. standing postures where sitting overestimates the amount of FHP (reduces the CVA) [
32] and our study focused on upright gait kinematics such that the standing CVA seemed more appropriate for our analysis. The angle was determined at the point where these two lines intersected. A larger CVA value indicates a more desirable alignment of the head and neck, while a smaller angle indicates a more severe degree of FHP. Participants with an angle of less than 50° were included in the study group, while a control group was selected with a craniovertebral angle greater than 55°, matched to the study group.
2.3.2. BTS GAITLAB System
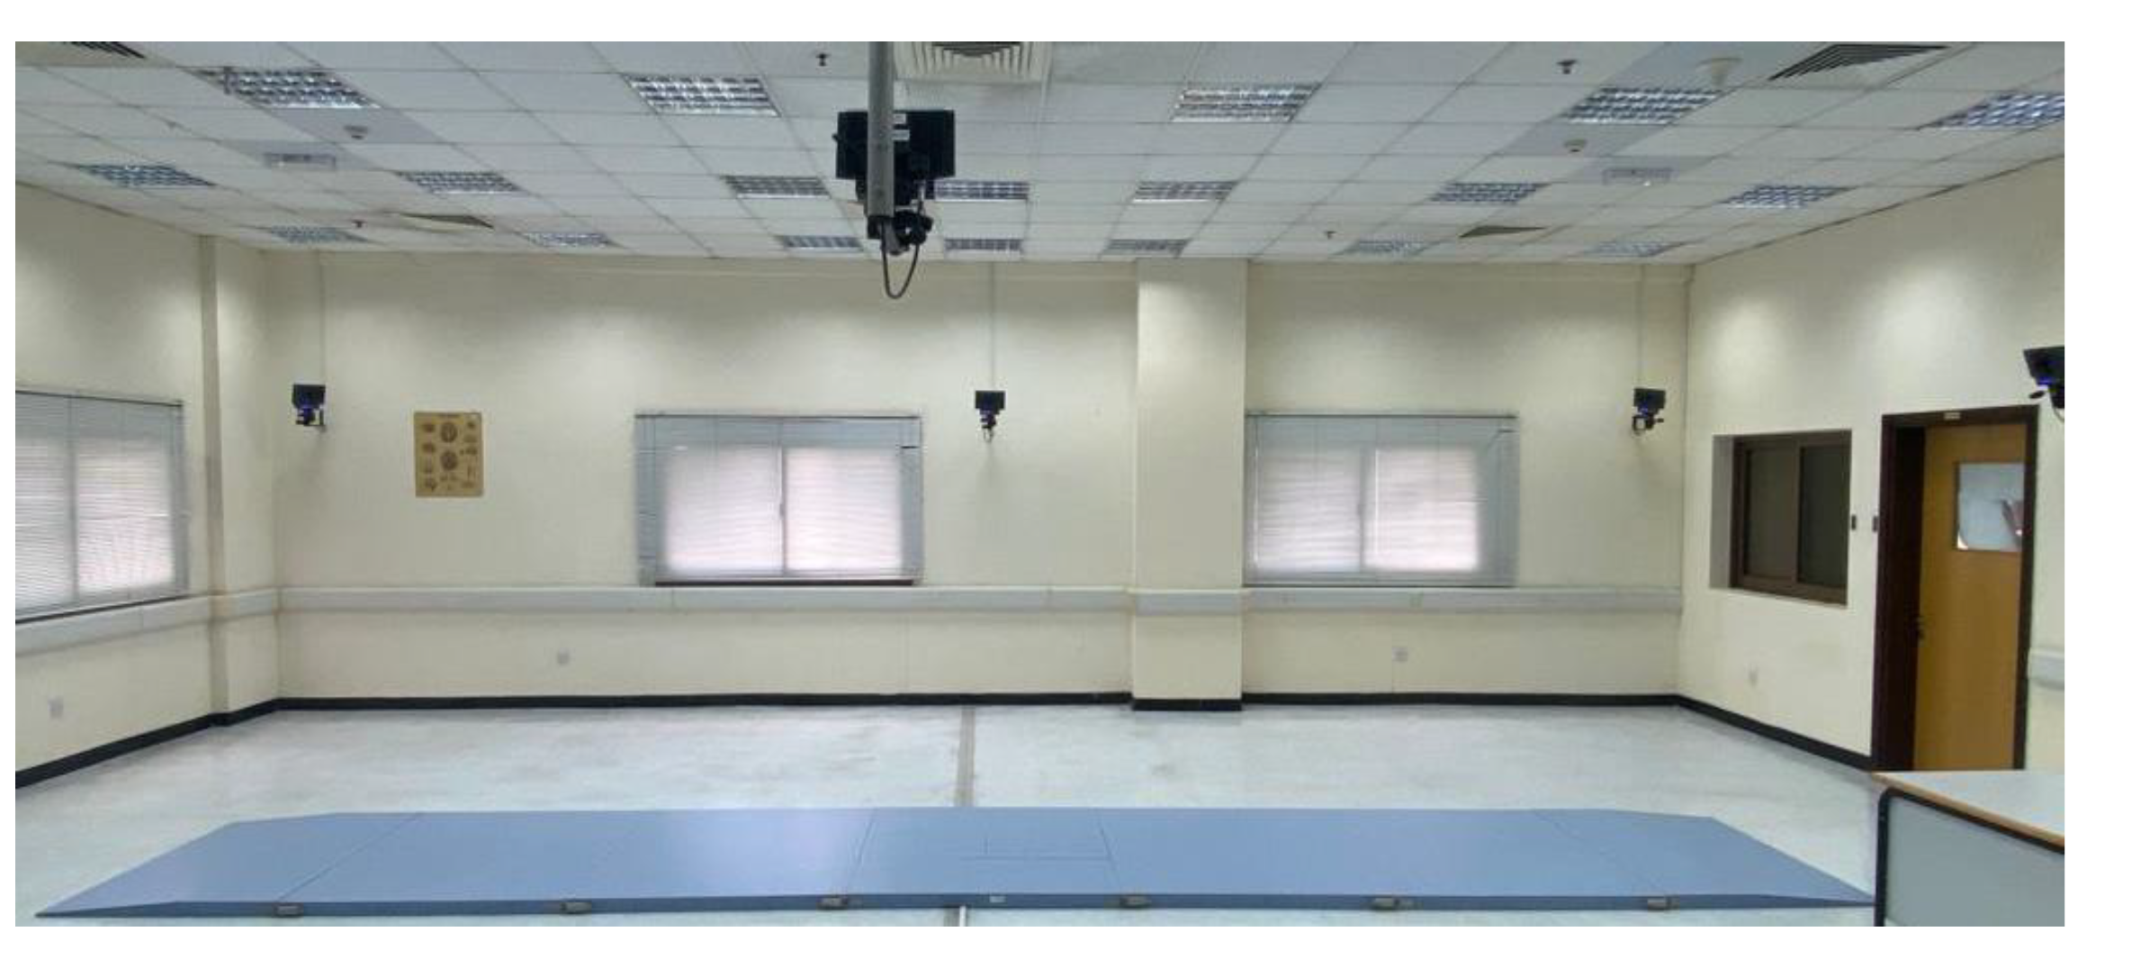
The spatiotemporal and kinematic parameters of gait were evaluated using an optical motion-capture system consisting of 8 infrared cameras (Smart-D, BTS Bioengineering, Milan, Italy) operating at a frequency of 120 Hz (
Figure 2).
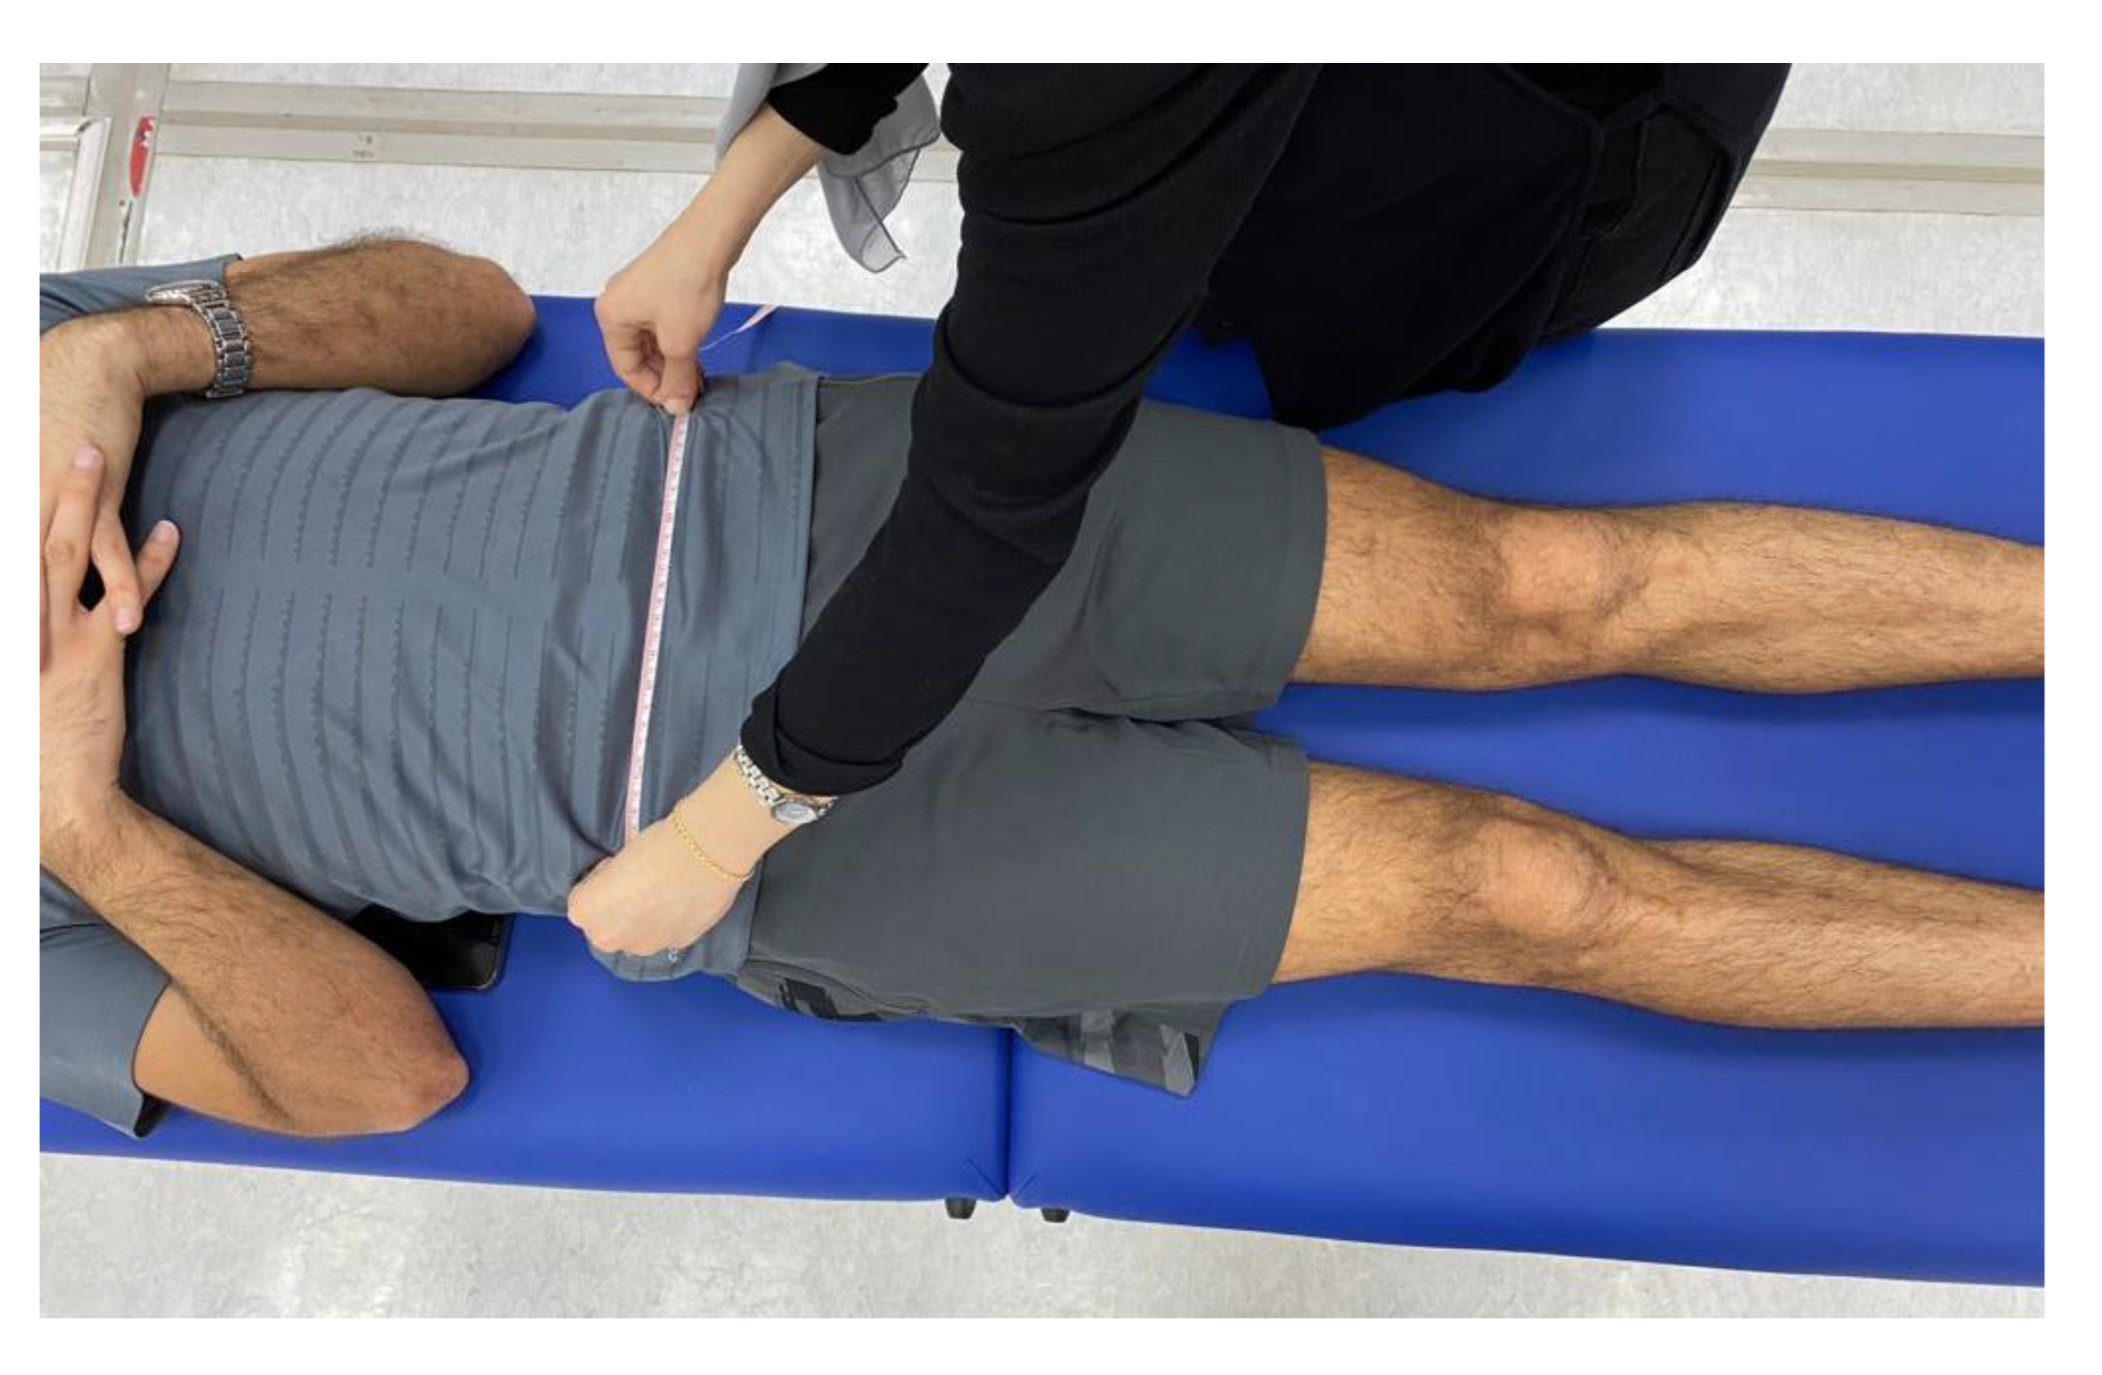
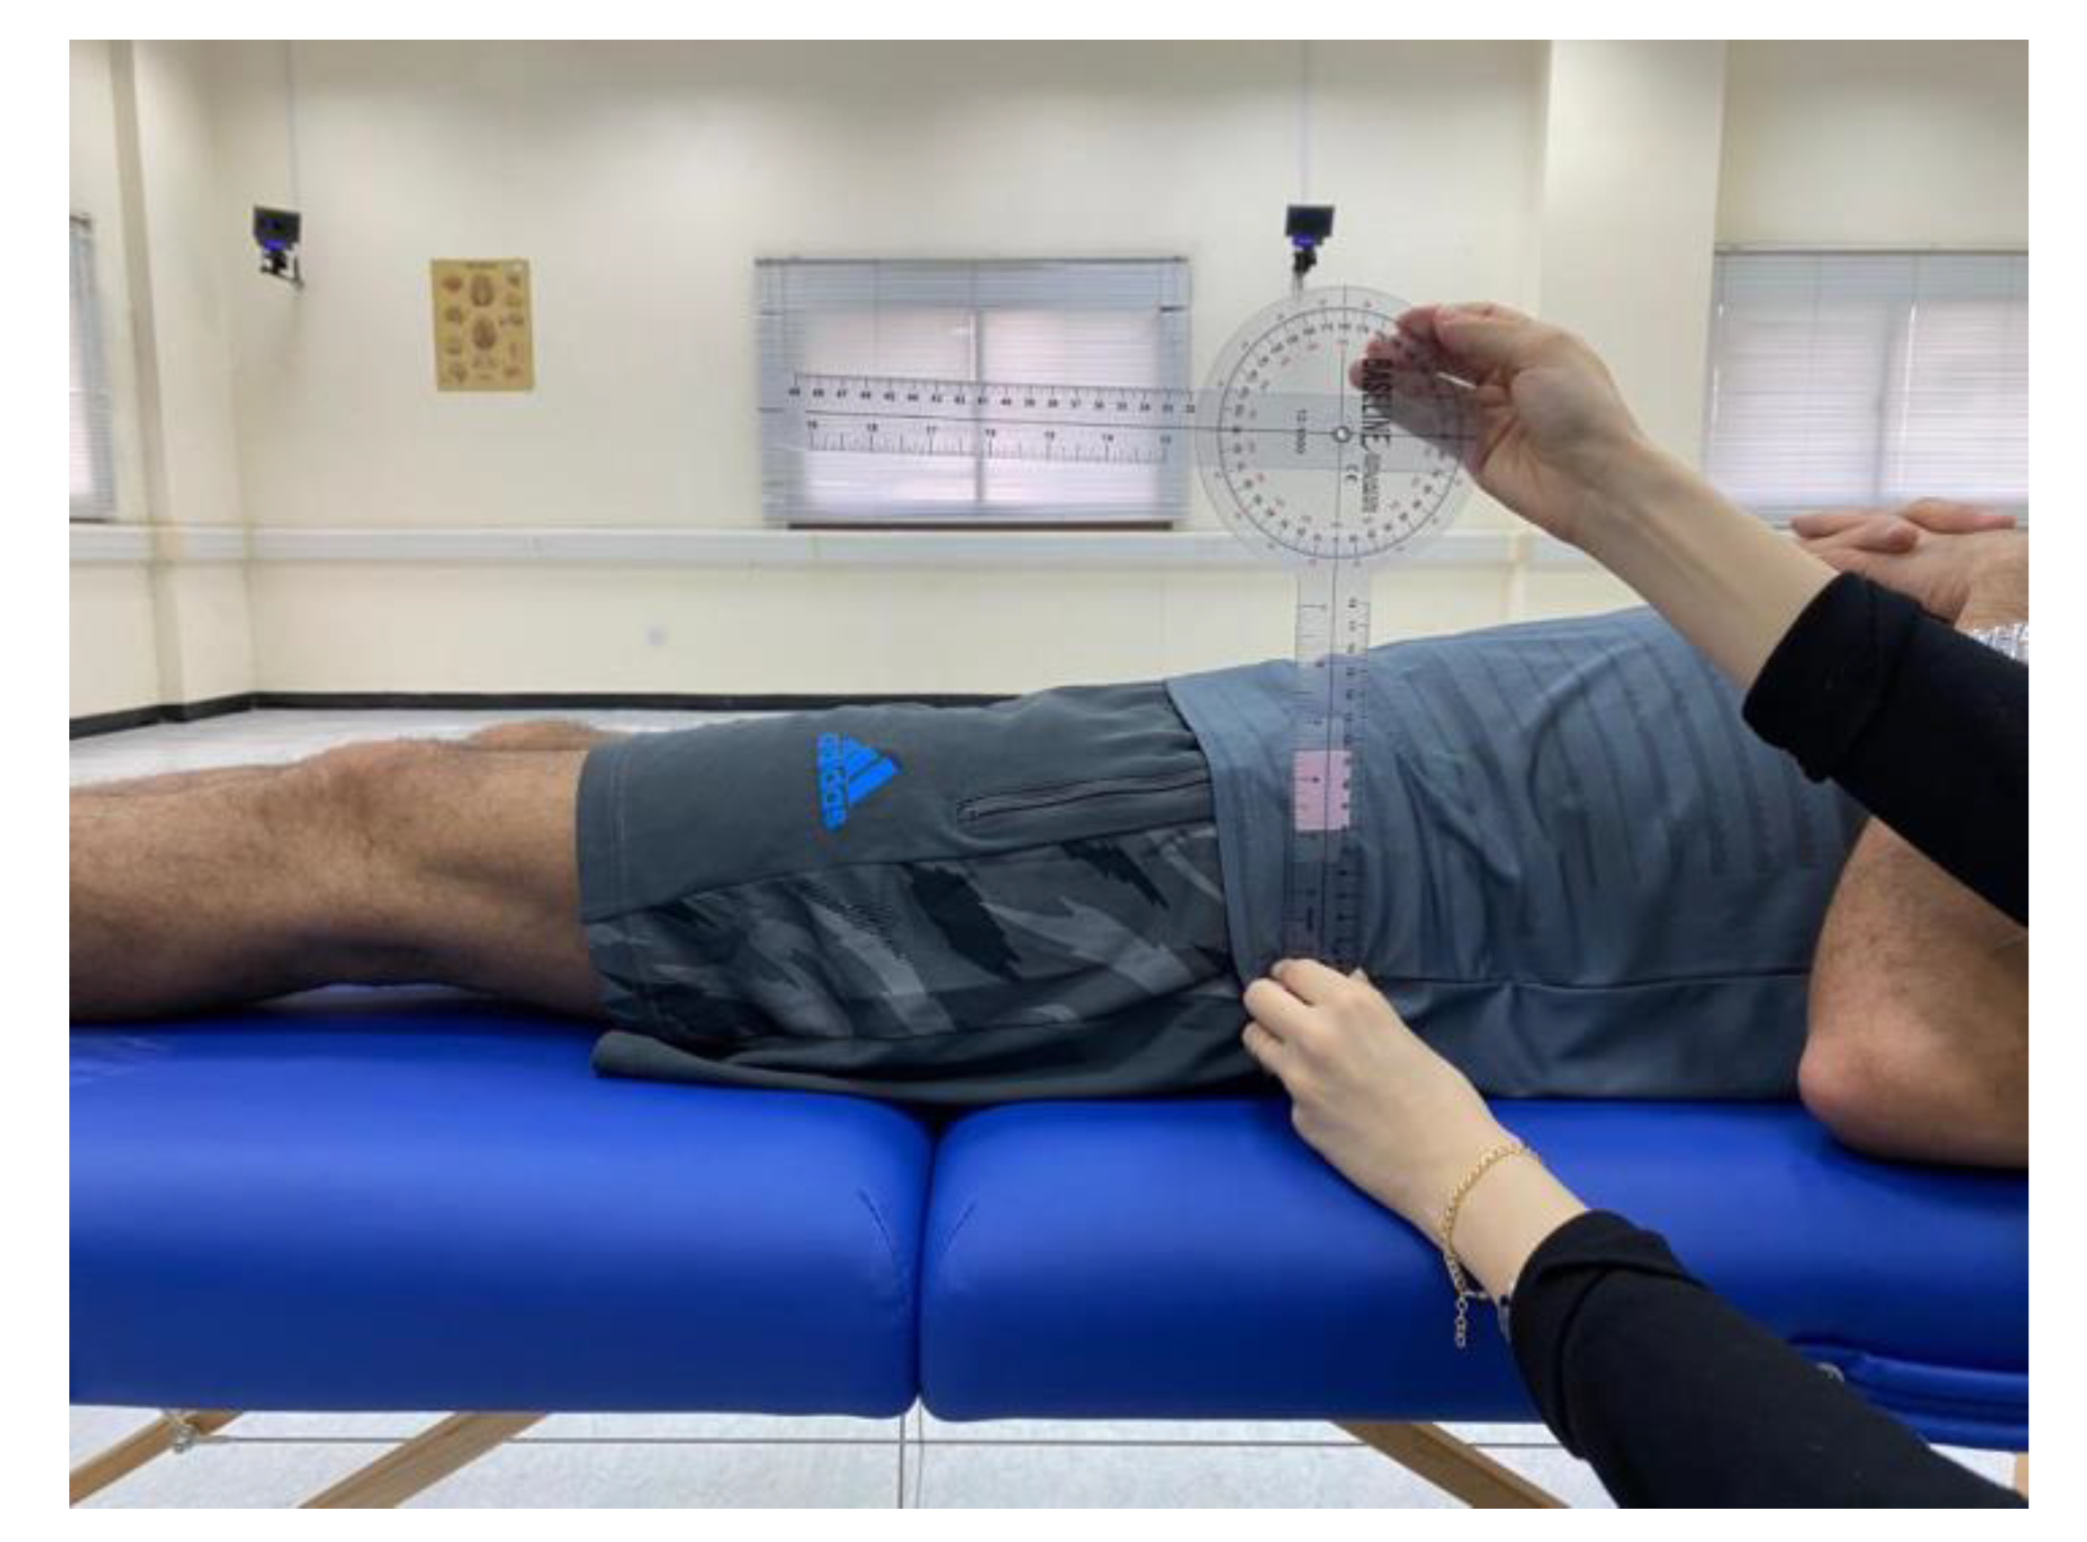
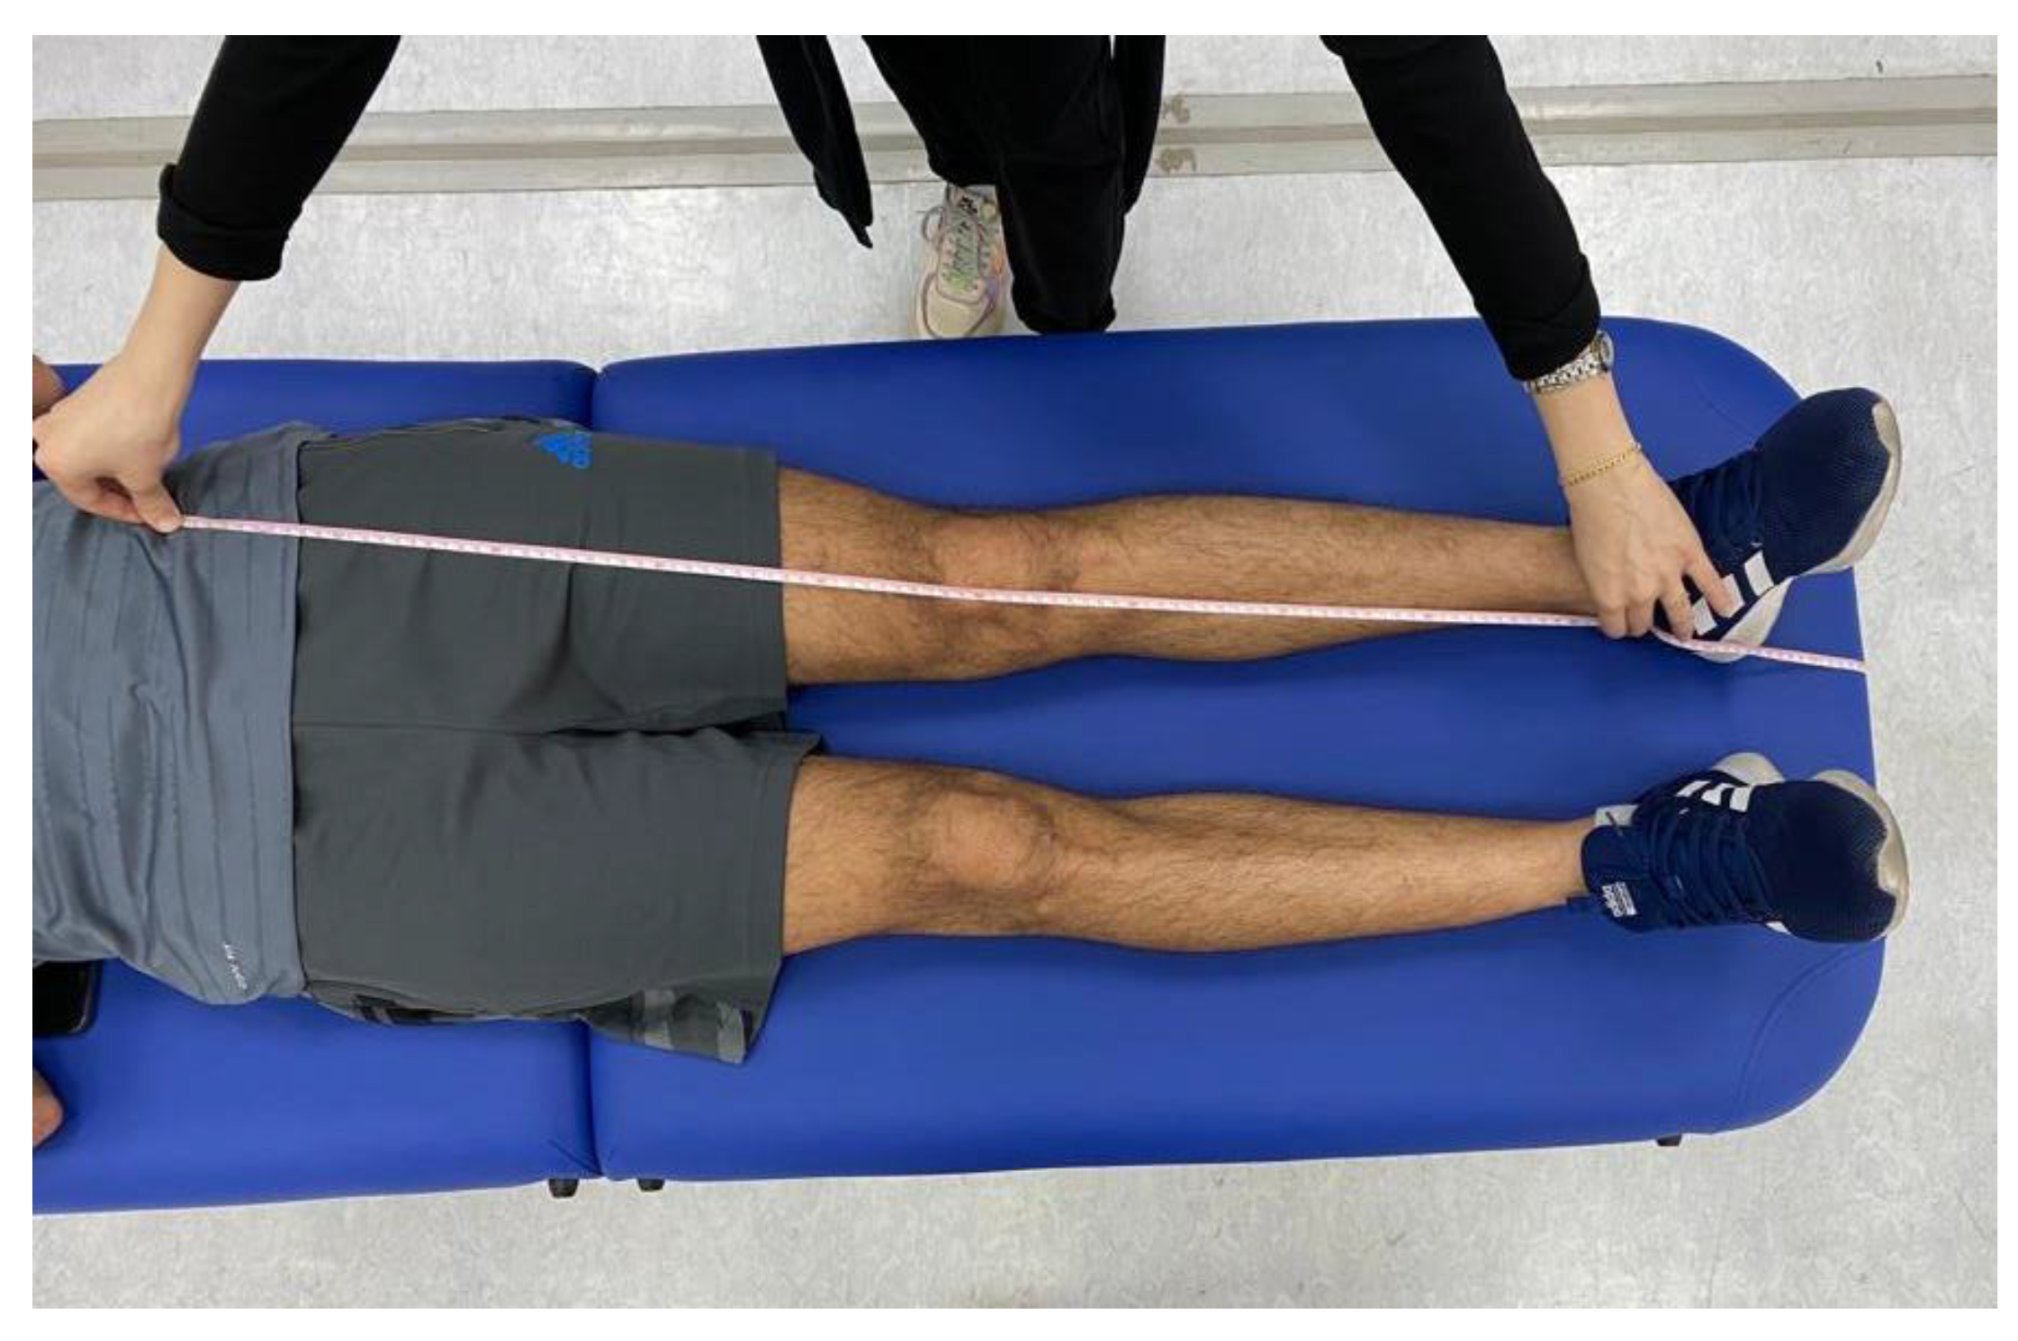
Prior to conducting the experimental tests, anthropometric measurements such as height, weight, the distance between the anterior superior iliac spines, pelvis thickness, knee and ankle width, and leg length were obtained as (
Figure 3,
Figure 4 and
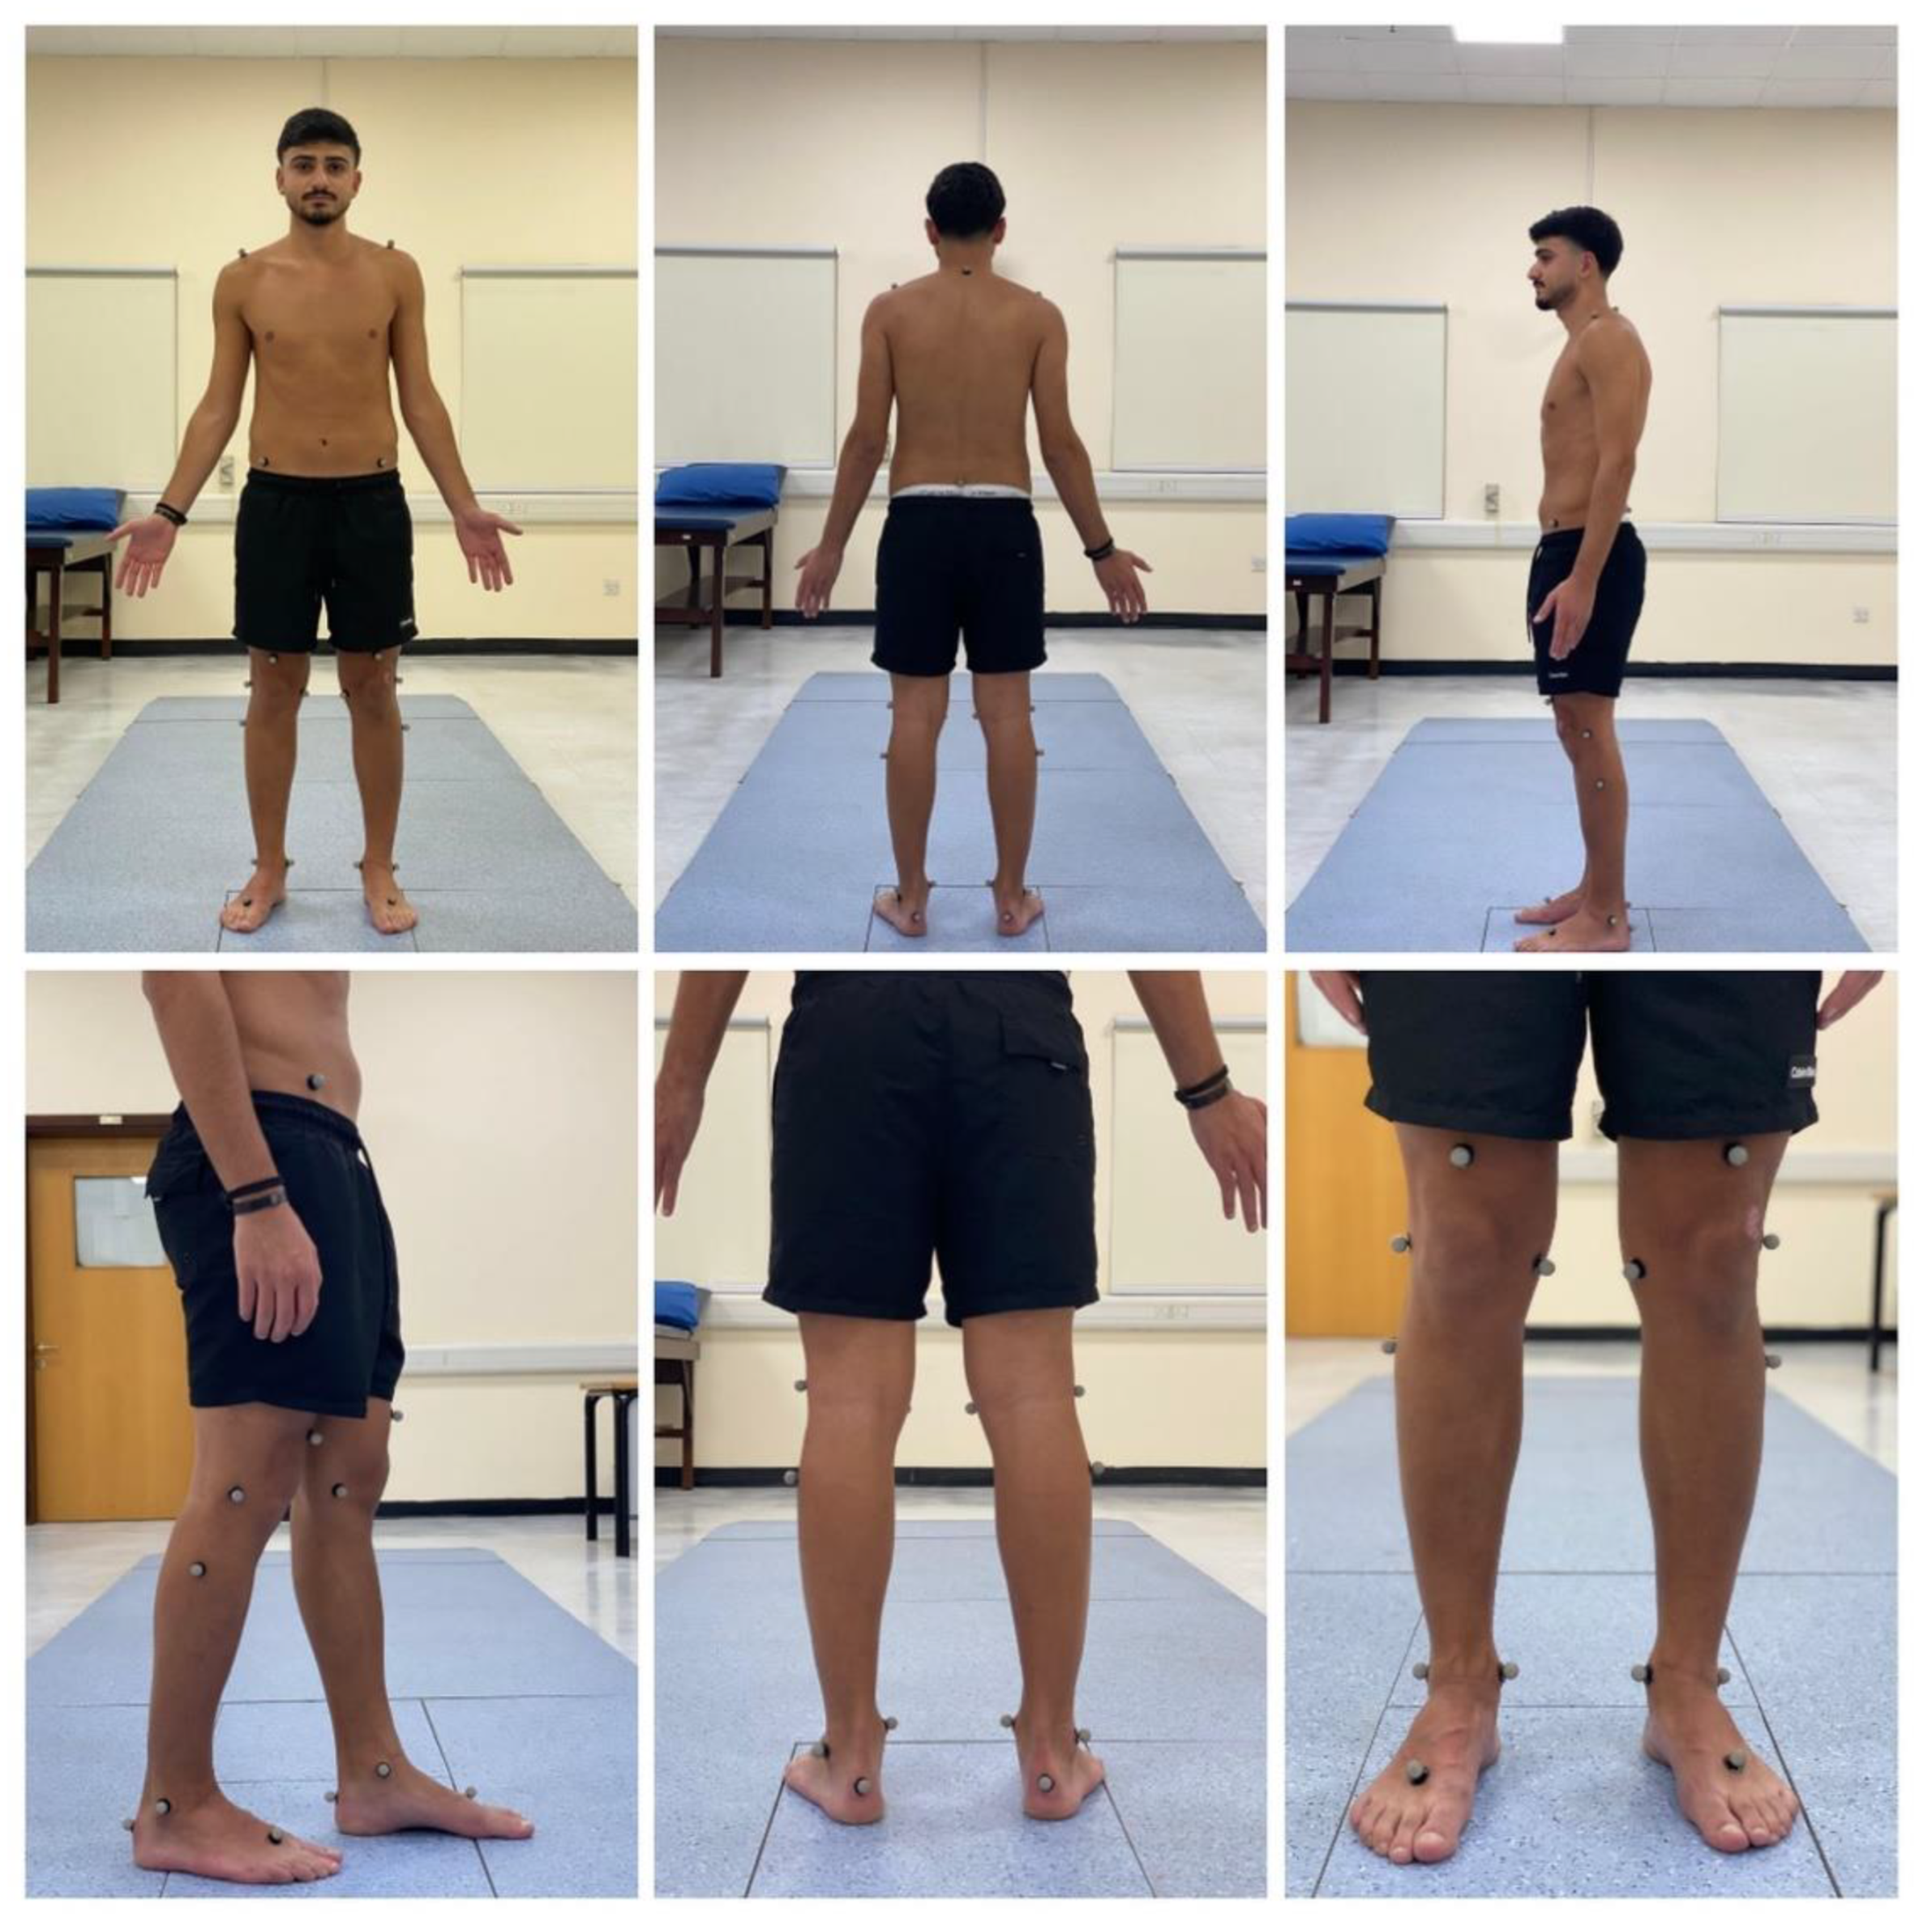
Figure 5). As illustrated in
Figure 6, 22 spherical reflective passive markers were placed on the participant's skin following the protocol outlined by Davis et al. [
33].
2.3.3. Dual Task Cost (DTC) Percentage
The average performance across the three dual-task trials was used for analysis to provide a robust measure of the cognitive load’s impact on gait. The dual task cost (DTC) percentage was calculated by determining the difference between single and dual-task performance scores, dividing the result by the single-task performance score, and then multiplying by 100. For example, if the average single task walking speed was 1.2 m/s and the average dual-task walking speed was 1.0 m/s, the DTC percentage would be calculated as .
Higher DTC percentages indicate a greater impact of the cognitive task on gait performance, highlighting the extent to which cognitive load affects the ability to maintain a normal walking pattern [
34]. This method allowed for a comprehensive evaluation of the interplay between cognitive demands and gait performance in individuals with and without FHP.
2.3.4. Spatiotemporal Parameters and Cognitive Performance
Participants' spatiotemporal parameters such as step length, speed, and cadence were assessed under both single-task and dual-task conditions using the BTS gait lab system. The comprehensive gait analysis included the following 13 variables and left and right sides were averaged for analysis unless there was only a specific sided difference which is then reported as side specific in the results:
Stride time in seconds (s);
Stance time (s);
Swing time (s);
Stance phase (%);
Swing phase (%);
Single support phase (%);
Double support phase (%);
Mean velocity (meters (m)/s);
Mean velocity (%height/s);
Cadence (steps/minute (min);
Stride length (%height);
Step length (m);
Step width (m).
Cognitive performance during dual-task trials was evaluated based on the accuracy and consistency of responses to cognitive tasks, providing insights into the impact of cognitive load on gait performance. The designed pathway was equipped with the BTS gait lab system to capture gait parameters in both conditions. During the dual-task trials, participants were monitored to ensure they performed both tasks simultaneously, with gentle reminders provided if necessary to maintain dual-task engagement.
2.4. Study Procedure
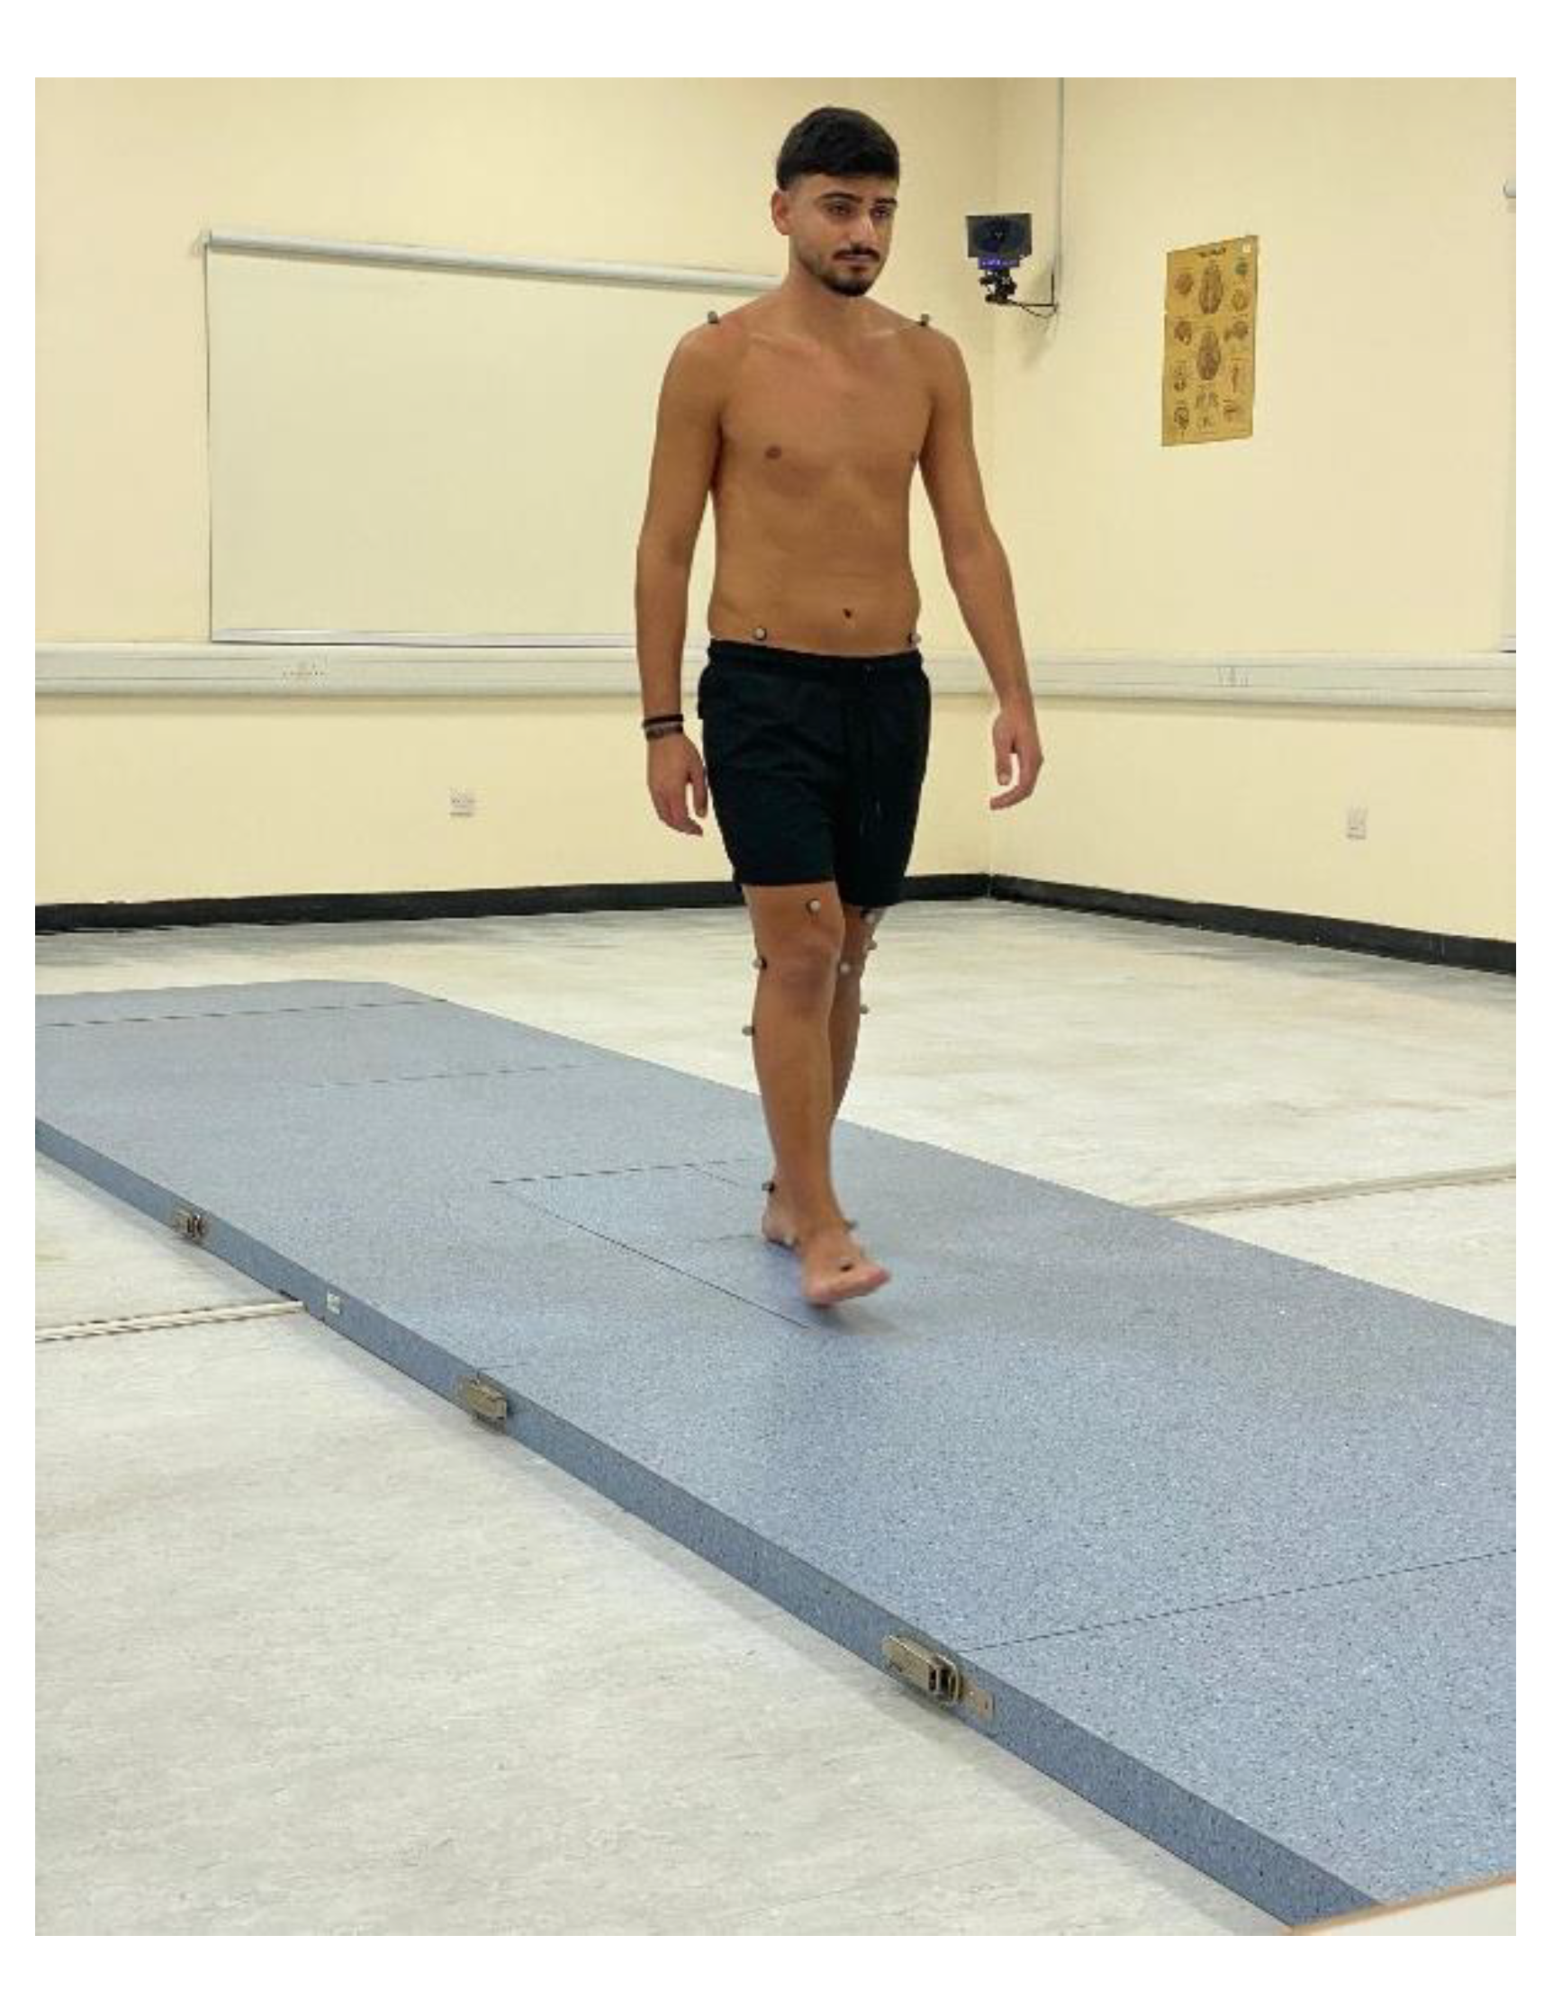
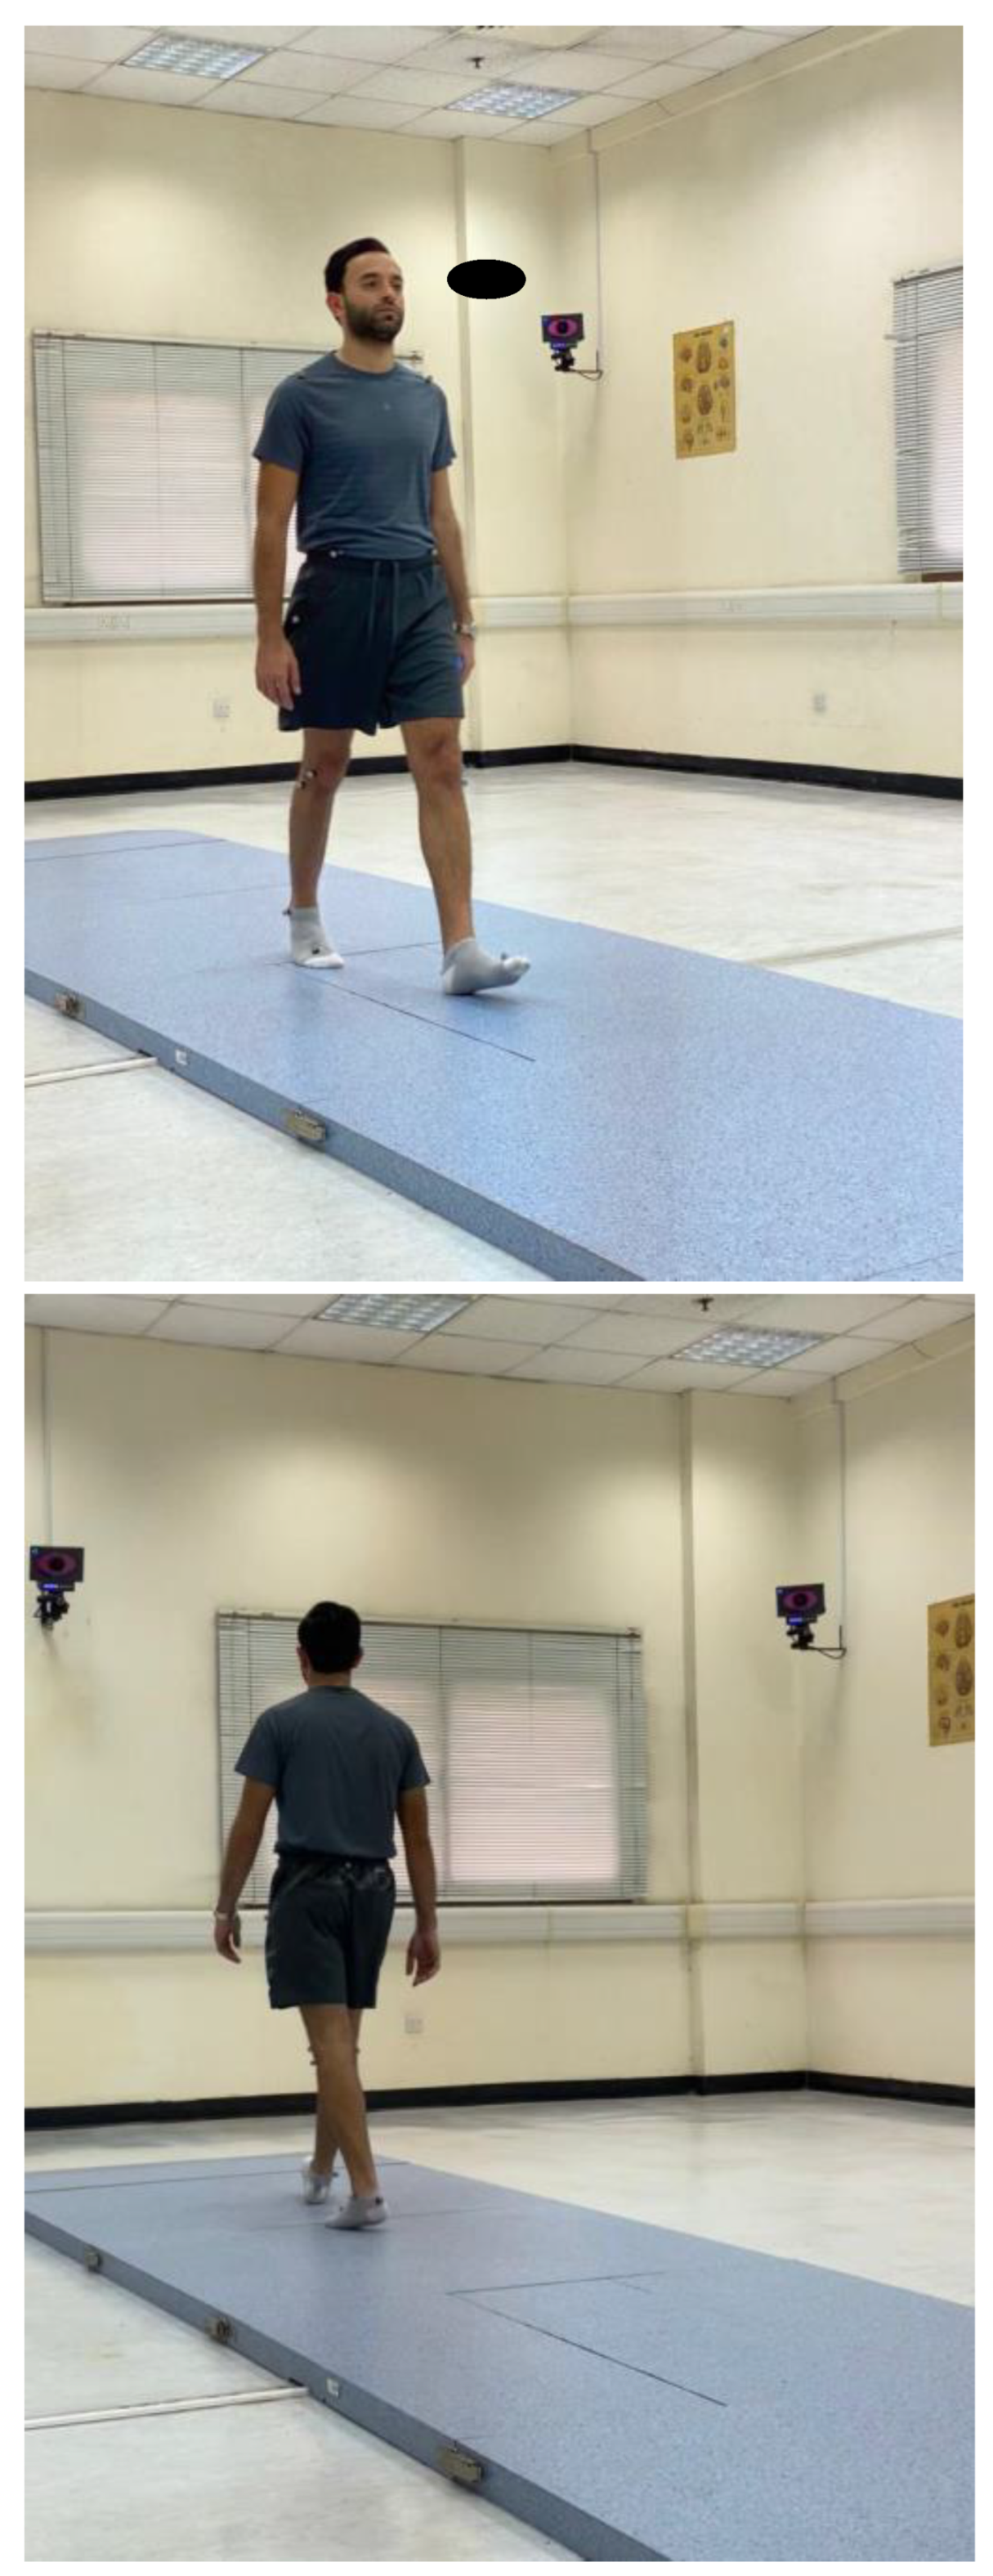
Participants were instructed to walk at their self-selected pace along a 10 m walkway while the 3D trajectories of the markers were captured by the cameras under two conditions: single-task and dual-task (
Figure 7). In the single-task condition, participants walked at their preferred speed without performing any additional tasks, completing at least three trials to establish baseline gait parameters. The average performance across these trails was used for subsequent analysis [
35]. For the dual-task condition, participants were instructed to walk at their preferred speed while simultaneously performing various cognitive tasks, with no emphasis on prioritizing either the gait or cognitive task. These tasks included three conditions:
- (1)
Answering yes or no questions;
- (2)
Counting forward or backward from a 3-digit number;
- (3)
Or performing simple mathematical calculations.
Each participant completed at least three trials for the dual-task condition, with different instructions provided for each trial. This approach ensured a comprehensive assessment of cognitive load effects [
27]. A trial set was considered valid if at least 6 trials were accurately recorded, ensuring a sufficient number of gait cycles for further analysis. Rest periods between consecutive trials were allowed upon request. After completing the tests, the raw data were processed using specialized software (Smart Analyzer, BTS Bioengineering, Milan, Italy) to calculate the desired parameters.
2.5. Sample Size Determination
The required sample size was calculated based on the following parameters: an effect size of 0.5, representing a moderate effect size as per Cohen's criteria; a two-tailed significance level (α) of 0.05; and a power (1-β) of 0.80 to reduce the risk of type II errors. Using these parameters, the sample size was computed using G*Power 3.1 software. The calculations indicated that a minimum of 40 participants per group (FHP and NHP) would be needed to detect a significant difference with 80% power and a 5% level of significance. To account for potential dropouts, we added 5 participants per group, resulting in a total of 45 participants per group. Therefore, the final sample size was set at 45 participants per group, totaling 90 participants for the entire study.
2.6. Statistical Analysis
The distribution of all descriptive baseline variables was determined through the Kolmogorov-Smirnov test to ensure normalcy. Continuous data were presented as means accompanied by standard deviations (SD) in both the text and tables. To evaluate equality of variances, Levene’s test was employed at a 95% confidence level, where a p-value < 0.05 was considered significant. Descriptive statistics (means ± SD unless otherwise indicated) were reported at each time point.
To ensure group equivalence for proper case-control analysis with each demographic and clinical variable, chi-squared tests were applied for categorical variables and Student’s t-tests for continuous variables. The Student’s t-test was used to compare means of continuous variables between groups, with significance set at a p-value < 0.05. Effect size, measured using Cohen's d, indicated clinical importance with values of d ≈ 0.2, d ≈ 0.5, and d ≈ 0.8 representing negligible, moderate, and high clinical importance respectively.
Lastly, Pearson’s correlations (r) were used to examine relationships between head posture (CVA) and variables associated with spatiotemporal gait parameters during single and dual tasks, as well as between head posture and cognitive cost. Data analysis was performed using SPSS version 20.0 (SPSS Inc., Chicago, IL, USA), ensuring normality and equal variance assumptions were met prior to analysis.
Figure 1.
The craniovertebral angle (CVA) measured in a standing, neutral, upright posture position. The CVA (angle A) is measured by a line connecting the tragus of the ear to the C7 vertebral prominence and then measuring the intersection of this line to a horizontal line passing through C7 prominence, where the acute angle side is measured.
Figure 2.
The optical motion-capture system consisting of 8 infrared cameras was used to assess gait kinematics while participants walked along the 10 meter platform. .
Figure 2.
The optical motion-capture system consisting of 8 infrared cameras was used to assess gait kinematics while participants walked along the 10 meter platform. .
Figure 3.
Anthropometric measurement of the distance between the anterior superior iliac spines.
Figure 3.
Anthropometric measurement of the distance between the anterior superior iliac spines.
Figure 4.
Anthropometric measurement of the pelvis thickness.
Figure 4.
Anthropometric measurement of the pelvis thickness.
Figure 5.
Anthropometric measurement of leg lengths were obtained bilaterally from the anterior superior iliac spine to the medial maleolus.
Figure 5.
Anthropometric measurement of leg lengths were obtained bilaterally from the anterior superior iliac spine to the medial maleolus.
Figure 6.
The location of the 22 spherical reflective passive markers were placed on each participant's skin following the protocol outlined by Davis et al. [
33].
Figure 6.
The location of the 22 spherical reflective passive markers were placed on each participant's skin following the protocol outlined by Davis et al. [
33].
Figure 7.
Participants were instructed to walk at their self-selected pace along a 10 m walkway while the 3D trajectories of the markers were captured by the cameras under two conditions: single-task and dual-task.
Figure 7.
Participants were instructed to walk at their self-selected pace along a 10 m walkway while the 3D trajectories of the markers were captured by the cameras under two conditions: single-task and dual-task.
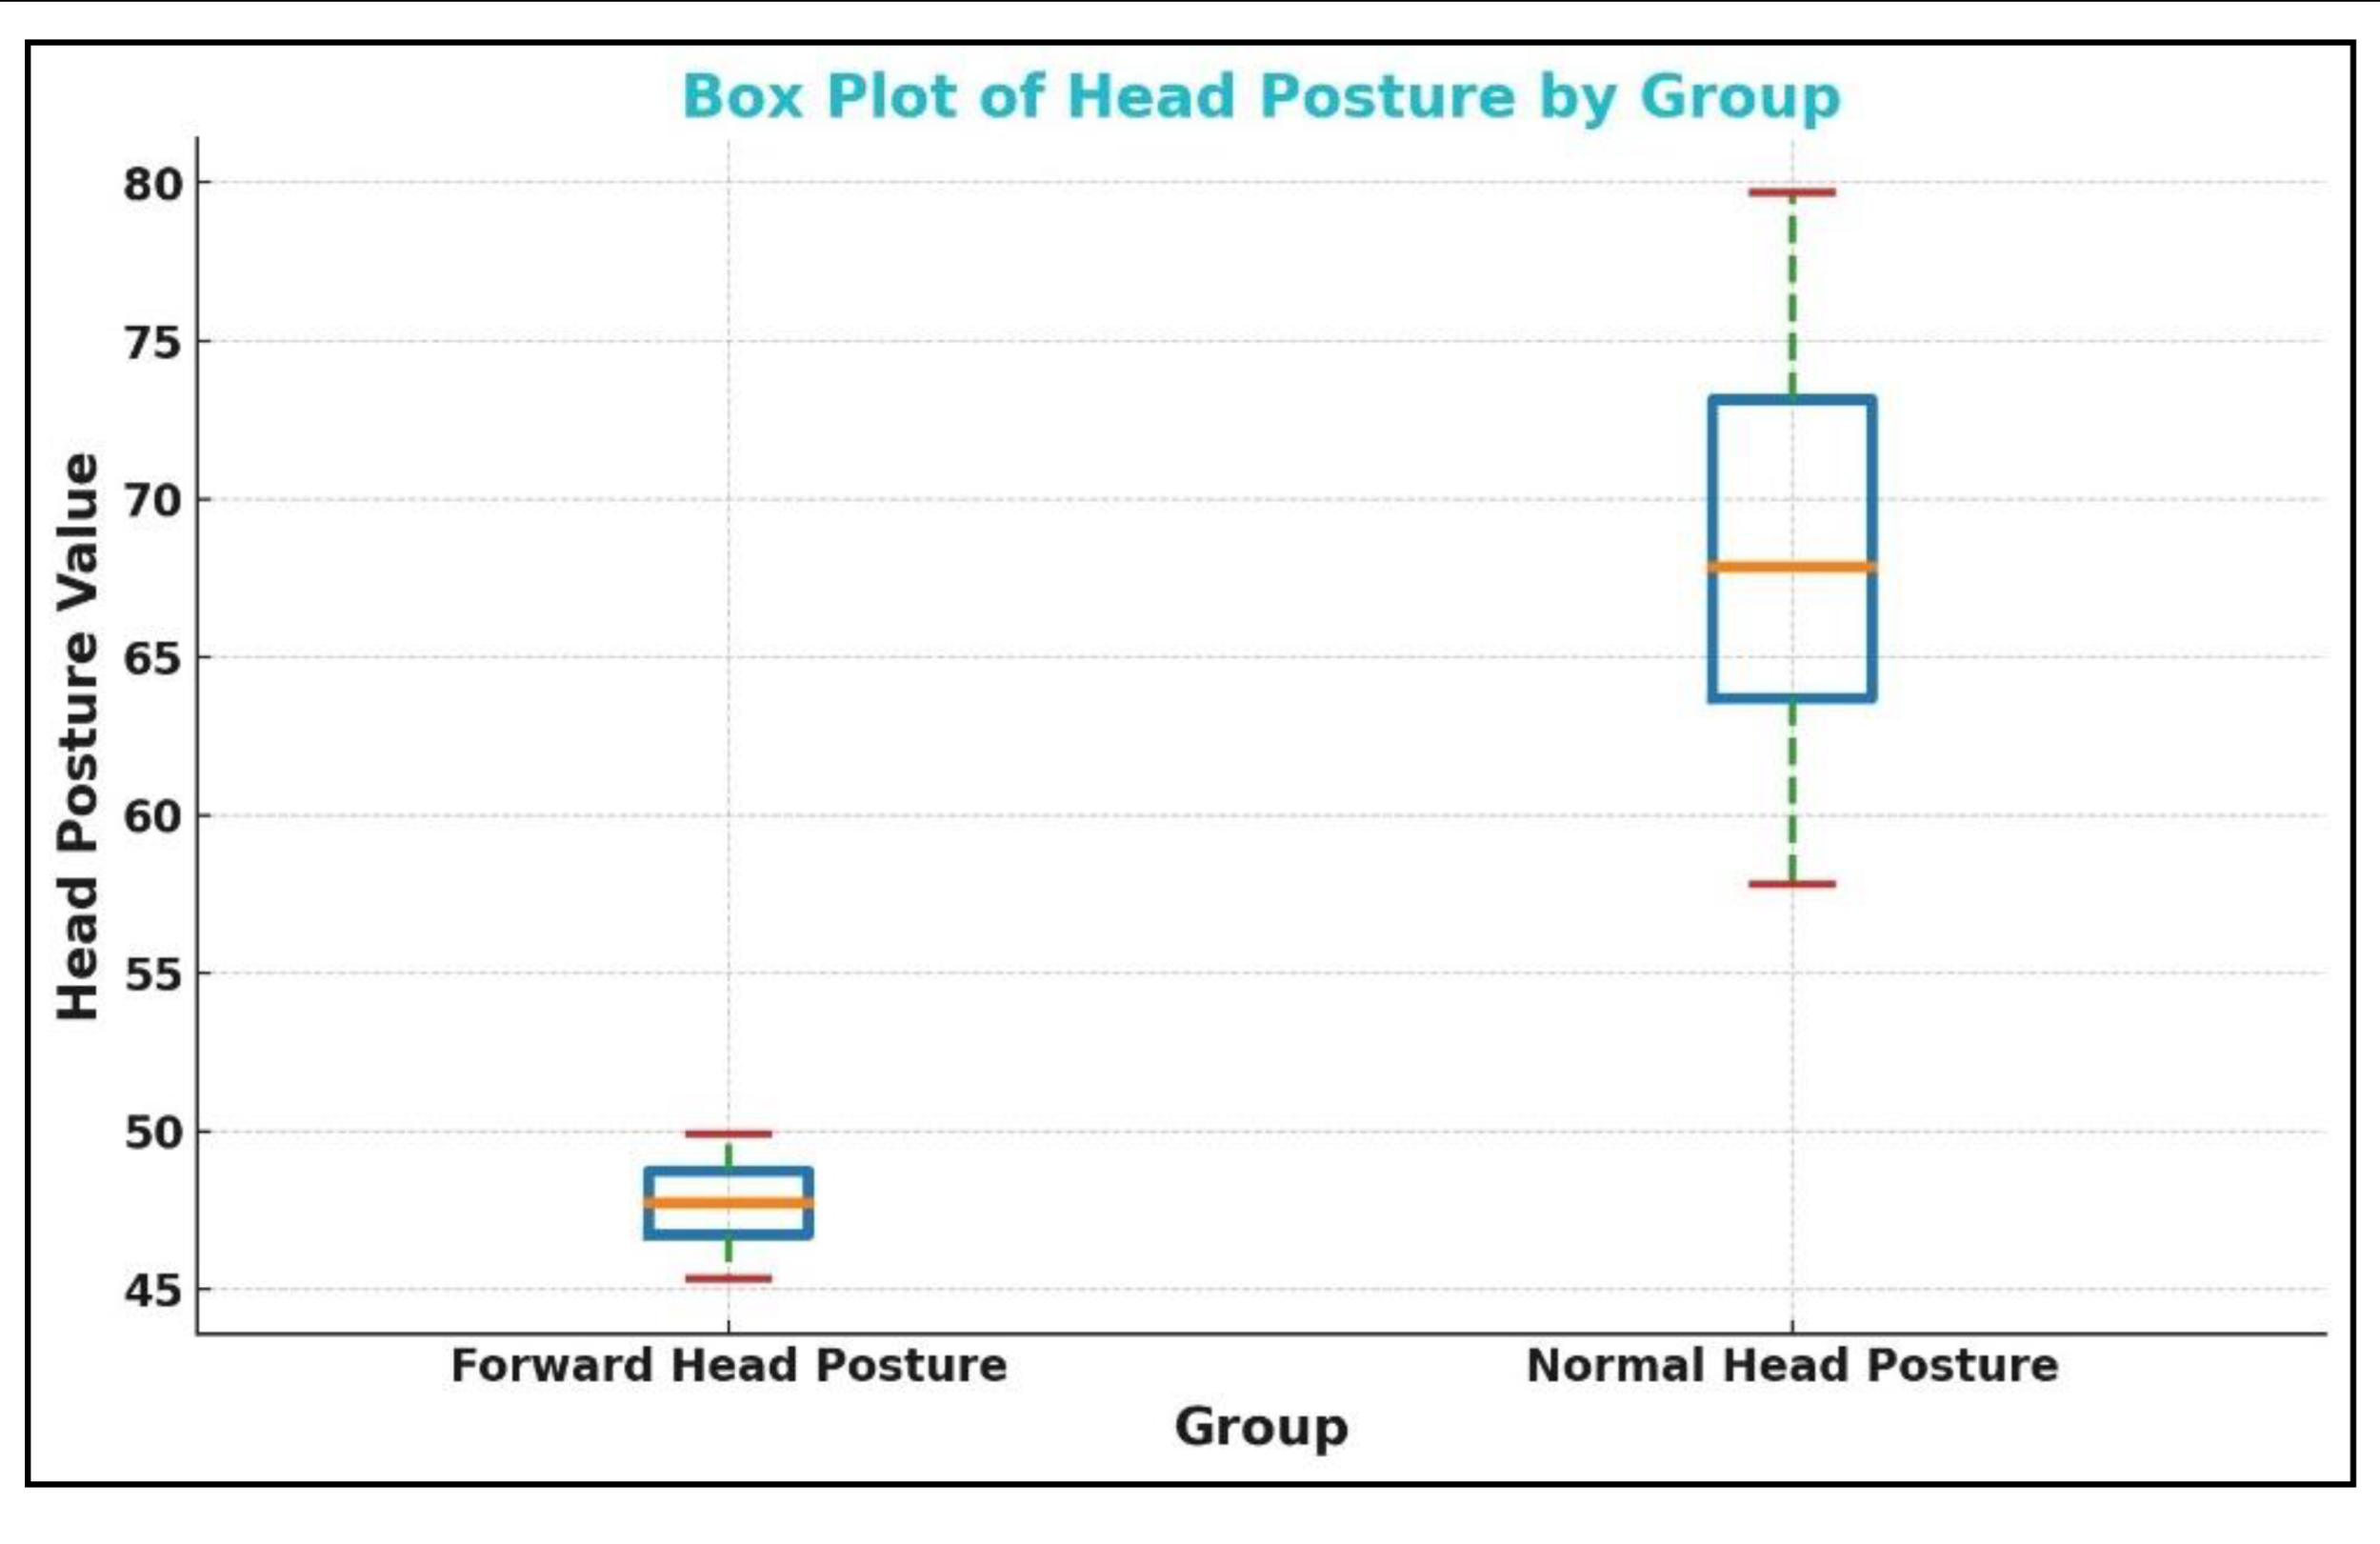
Figure 8.
The box plot for the craniovertebral angle (CVA) in the forward head posture (FHP) and control or normal head posture (NHP) group. The CVA is on the vertical axis shown as ‘head posture value’ (degrees) while the two groups are on the horizontal axis.
Figure 8.
The box plot for the craniovertebral angle (CVA) in the forward head posture (FHP) and control or normal head posture (NHP) group. The CVA is on the vertical axis shown as ‘head posture value’ (degrees) while the two groups are on the horizontal axis.
Table 1.
Baseline demographic characteristics and clinical variables. FHP: forward head posture group; NHP: normal head posture group; BMI: body mass index; CVA: craniovertebral angle.
Table 1.
Baseline demographic characteristics and clinical variables. FHP: forward head posture group; NHP: normal head posture group; BMI: body mass index; CVA: craniovertebral angle.
| Variable |
FHP (n=45) |
NHP (n=45) |
| Age (years) |
20.5 ± 2 |
20 ± 3 |
| BMI (kg/m2) |
21.5 ± 1.7 |
21.4 ± 1.8 |
| Gender (%) |
| Male |
25 (55.5%) |
25 (55.5%) |
| Female |
20 (44.5%) |
20 (44.5%) |
| CVA (°) |
46.64 ± 3.23 |
67.9 5 ± 7.89 |
Table 2.
Mean differences between spatiotemporal parameters in forward head posture (FHP) and neutral head posture (NHP) groups during single task walking are shown.
Table 2.
Mean differences between spatiotemporal parameters in forward head posture (FHP) and neutral head posture (NHP) groups during single task walking are shown.
| Variable |
Group |
Mean ± SD |
95% CI |
Effect Size (d) |
p-value |
Stride time
|
FHP |
1.12 ± 0.08 |
[-0.061 , 0.041]
|
-0.11 |
0.60 |
| NHP |
1.13 ± 0.12 |
Stance time
|
FHP |
0.67 ± 0.07 |
[-0.074 , 0.014] |
-0.29 |
0.30 |
| NHP |
0.70 ± 0.11 |
Swing time
|
FHP |
0.43 ± 0.05 |
[-0.025 , 0.025] |
0.06 |
0.30 |
| NHP |
0.43 ± 0.05 |
Stance phase
|
FHP |
60.19 ± 3.99 |
[-2.59 , 1.69] |
-0.11 |
0.20 |
| NHP |
60.64 ± 4.12 |
Double support phase
|
FHP |
10.81 ± 2.19 |
[-1.60 , 0.54]
|
-0.25 |
0.20 |
| NHP |
11.34 ± 2.07 |
Mean velocity
|
FHP |
1.16 ± 0.13 |
[-0.11 , 0.054] |
-0.21 |
0.15 |
| NHP |
1.19 ± 0.17 |
Mean velocity height
|
FHP |
70.62 ± 8.29 |
[-5.90 , 3.24] |
-0.13 |
0.26 |
| NHP |
71.95 ± 10.91 |
Cadence
|
FHP |
108.12 ± 7.91 |
[-4.25 , 5.79] |
0.08 |
0.60 |
| NHP |
107.35 ± 9.93 |
Stride length
|
FHP |
78.46 ± 7.50 |
[-5.27 , 2.31] |
-0.19 |
0.40 |
| NHP |
79.94 ± 7.51 |
Step length
|
FHP |
0.64 ± 0.06 |
[-0.036 , 0.036]
|
0.13 |
0.80 |
| NHP |
0.64 ± 0.08 |
Step width average
|
FHP |
0.08 ± 0.03 |
[-0.047 , 0.027] |
-0.24 |
0.90 |
| NHP |
0.09 ± 0.06 |
| Swing Phase (%) |
FHP |
38.91 ± 2.83 |
[-1.51 , 0.39] |
0.20 |
0.40 |
| NHP |
38.35 ± 2.74 |
| Single Support Phase (%) |
FHP |
39.45 ± 2.52 |
[-0.62 , 1.075] |
-0.08 |
0.72 |
| NHP |
39.67 ± 2.77 |
Table 3.
Mean differences between spatiotemporal parameters in forward head posture (FHP) and neutral head posture (NHP) groups during dual task.
Table 3.
Mean differences between spatiotemporal parameters in forward head posture (FHP) and neutral head posture (NHP) groups during dual task.
| Variable |
Group |
Mean ± SD |
95% CI |
Effect Size (d) |
p-value |
Stride time
|
FHP |
1.40 ± 0.32 |
[0.118 , 0.322] |
0.88 |
< .001 |
| NHP |
1.18 ± 0.14 |
Stance time
|
FHP |
0.72 ± 0.06 |
[0.051 , 0.109] |
1.14 |
< .001 |
| NHP |
0.64 ± 0.08 |
Swing time
|
FHP |
0.44 ± 0.04 |
[-0.074 , -0.026] |
-0.95 |
< .001 |
| NHP |
0.49 ± 0.06 |
Stance phase
|
FHP |
65.01 ± 5.97 |
[2.044 , 5.656] |
0.83 |
0.01 |
| NHP |
61.16 ± 2.33 |
Double support phase
|
FHP |
12.29 ± 1.41 |
[1.232 , 1.628] |
0.94 |
< .001 |
| NHP |
10.86 ± 1.61 |
Mean velocity
|
FHP |
1.08 ± 0.12 |
[-0.304 , -0.116] |
-0.96 |
< .001 |
| NHP |
1.29 ± 0.30 |
Mean velocity height
|
FHP |
60.86 ± 7.92 |
[-14.45 , -7.25] |
-1.25 |
< .001 |
| NHP |
71.71 ± 9.46 |
Cadence
|
FHP |
103.18 ± 10.13 |
[-5.29 , 2.99] |
-0.18 |
0.30 |
| NHP |
104.83 ± 7.56 |
Stride length
|
FHP |
73.08 ± 7.37 |
[-11.03 , -4.57] |
-1.00 |
< .001 |
| NHP |
80.88 ± 8.19 |
Step length
|
FHP |
0.58 ± 0.06 |
[-0.105 , -0.035] |
-1.10 |
< .001 |
| NHP |
0.65 ± 0.08 |
Step width average
|
FHP |
0.15 ± 0.23 |
[0.013 , 0.147] |
0.48 |
< .001 |
| NHP |
0.07 ± 0.02 |
| Swing Phase (%) |
FHP |
38.36 ± 1.83 |
[0.88 , 3.37] |
-0.90 |
0.0008 |
| NHP |
40.69 ± 3.17 |
| Single Support Phase (%) |
FHP |
39.37 ± 2.16 |
[0.68 , 4.35 ] |
-0.65 |
0.01 |
| NHP |
41.96 ± 5.18 |
Table 4.
The mean difference in cognitive cost (CC) between forward head posture (FHP) and normal head posture (NHP). CC is calculated as the difference in parameter values from single to dual task divided by the single task value, multiplied by 100%.
Table 4.
The mean difference in cognitive cost (CC) between forward head posture (FHP) and normal head posture (NHP). CC is calculated as the difference in parameter values from single to dual task divided by the single task value, multiplied by 100%.
| Variable |
Group |
Mean ± SD |
95% CI |
Effect size (d) |
p-value |
CC Stride time
|
FHP |
25.79 ± 29.76 |
[10.90 , 30.30]
|
0.87 |
< .001 |
| NHP |
5.19 ± 14.72 |
CC Stance time
|
FHP |
8.43 ± 19.25 |
[8.20 , 22.16] |
0.89 |
< .001 |
| NHP |
-6.75 ± 14.09 |
CC Swing time
|
FHP |
2.78 ± 10.64 |
[-19.34 , -5.16} |
-0.72 |
< .001 |
| NHP |
15.03 ± 21.86 |
CC Stance phase
|
FHP |
8.49 ± 12.79 |
[2.56 , 11.62] |
0.64 |
0.01 |
| NHP |
1.40 ± 8.74 |
CC Double support phase
|
FHP |
19.87 ± 37.99 |
[5.85 , 31.67]
|
0.66 |
0.01 |
| NHP |
1.11 ± 22.62 |
CC Mean velocity
|
FHP |
12.36 ± 34.86
|
[-5.20 , 16.22]
|
-0.75 |
0.02 |
| NHP |
6.85 ± 11.41 |
CC Mean velocity height
|
FHP |
13.34 ± 13.09 |
[1.60 , 18.72] |
-0.80 |
< .001 |
| NHP |
3.18 ± 26.27 |
CC Cadence
|
FHP |
4.49 ± 8.01 |
[-1.16 , 7.22]
|
-0.30 |
< .001 |
| NHP |
1.46 ± 11.93 |
CC Stride length
|
FHP |
6.84 ± 8.54 |
[-0.35 , 9.21] |
-0.81 |
0.01 |
| NHP |
2.41 ± 14.00 |
CC Step length
|
FHP |
9.98 ± 10.65 |
[0.33 , 10.85]
|
-1.13 |
0.01 |
| NHP |
4.39 ± 14.51 |
CC Step width average
|
FHP |
12.43 ± 340.60 |
[0.31 , 4.73]
|
0.49 |
0.01 |
| NHP |
9.91 ± 40.58 |
| Swing Phase (%) |
FHP |
15.79 ± 3.7 |
[6.51 , 10.87] |
2.03 |
< .001 |
| NHP |
7.1 ± 4.8 |
| Single Support Phase (%) |
FHP |
17.36 ± 1.86 |
[6.22 , 10.90] |
1.51 |
< .001 |
| NHP |
8.8 ± 7.8 |
Table 5.
Correlation between the craniovertebral angle (CVA) and gait parameters during single task conditions. s: seconds; m: meters.
Table 5.
Correlation between the craniovertebral angle (CVA) and gait parameters during single task conditions. s: seconds; m: meters.
| Parameter |
Pearson’s r |
p-value |
| Stride time (s) |
0.02 |
0.86 |
| Stance Time (s) |
0.08 |
0.52 |
| Swing Time (s) |
0.1
|
0.98 |
| Stance Phase (%) |
0.04 |
0.77 |
| Swing Phase (%) |
-0.03
|
0.98 |
| Single Support Phase (%) |
0.06 |
0.61 |
| Double Support Phase (%) |
0.12 |
0.29 |
| Mean Velocity (m/s) |
0.08 |
0.49 |
| Mean Velocity (%height/s) |
0.05 |
0.67 |
| Cadence (steps/min) |
-0.02
|
0.90 |
| Stride Length (%height) |
0.05 |
0.60 |
| Step Length (m) |
-0.03 |
0.70 |
| Step Width (m) |
0.03 |
0.80 |
Table 6.
Correlation between the craniovertebral angle (CVA) and gait parameters during dual task. s: seconds; m: meters.
Table 6.
Correlation between the craniovertebral angle (CVA) and gait parameters during dual task. s: seconds; m: meters.
| Parameter |
Pearson’s r |
p-value |
| Stride time (s) |
-0.68 |
< .001 |
| Stance Time (s) |
-0.56 |
< .001 |
| Swing Time (s) |
0.31 |
< .001 |
| Stance Phase (%) |
-0.56 |
< .001 |
| Swing Phase (%) |
0.53 |
< .001 |
| Single Support Phase (%) |
0.40 |
< .001 |
| Double Support Phase (%) |
-0.55 |
< .001 |
| Mean Velocity (m/s) |
0.28 |
< .001 |
| Mean Velocity (%height/s) |
0.49 |
< .001 |
| Cadence (steps/min) |
0.20 |
< .001 |
| Stride Length (%height) |
0.39 |
< .001 |
| Step Length (m) |
0.60 |
< .001 |
| Step Width (m) |
-0.40 |
< .001 |
Table 7.
Correlation between the craniovertebral angle (CVA) and cognitive cost (CC) per each parameter. s: seconds; m: meters.
Table 7.
Correlation between the craniovertebral angle (CVA) and cognitive cost (CC) per each parameter. s: seconds; m: meters.
| Parameter |
Pearson’s r |
p-value |
| CC Stride time (s) |
-0.61 |
< .001 |
| CC Stance Time (s) |
-0.41 |
< .001 |
| CC Swing Time (s) |
-0.35 |
< .001 |
| CC Stance Phase (%) |
-0.35 |
< .001 |
| CC Swing Phase (%) |
-0.45 |
< .001 |
| CC Single Support Phase (%) |
-0.23 |
0.04 |
| CC Double Support Phase (%) |
-0.21 |
0.04 |
| CC Mean Velocity (m/s) |
-0.37 |
0.01 |
| CC Mean Velocity (%height/s) |
-0.30 |
0.01 |
| CC Cadence (steps/min) |
-0.22 |
0.01 |
| CC Stride Length (%height) |
-0.32 |
0.01 |
| CC Step Length (m) |
-0.55 |
< .001 |
| CC Step Width (m) |
-0.50 |
< .001 |
