Introduction
Computer vision has developed rapidly in recent years, coming to penetrate all aspects of life and play a pivotal role in various fields. Meanwhile, there have also been rapid developments in very high-resolution remote sensing technology, and increasing numbers of very high-resolution satellite images are being used and analyzed. Therefore, semantic segmentation—as a rapid analysis method of the acquired satellite images—has become a crucial research target.
With the development of deep learning, many efficient deep convolutional neural networks (DCNNs; Krizhevsky et al., 2017) such as SegNet (Badrinarayanan et al., 2017), U-net (Ronneberger et al., 2015), Pyramid scene parsing network (PSPNet; Zhao et al., 2017), and other networks based on fully convolutional networks (FCNs; Long et al., 2015) have been shown to facilitate semantic segmentation.
Channel attention mechanisms are proven to improve the performance of DCNNs. Efficient Channel Attention Module (ECA) (Wang et al., 2020) was proposed as a local cross-channel interaction strategy that avoids the effect of dimensionality reduction on the learning effect of channel attention.
The present work proposed a Water-Land Boundary Attention Network (WLBANet) aiming to achieve a more precise segmentation of water and land zones. Another method that addresses the boundary problem is the addition of a new branch (Marmanis et al., 2018) to detect the border supervised by an additional loss that is specifically for boundaries. WLBANet contains an ECA module to reduce the complexity of the model while maintaining high performance with appropriate cross-channel interactions.
In prior studies, many high-resolution images have been collected and built up as datasets, such as the Aerial Image Segmentation Datasets (Kaiser et al., 2017), ISPRS 2D Semantic Labeling datasets – Vaihingen & Postdam, Gaofen Image Dataset (GID; Tong et al., 2020), and other datasets related to buildings and other land objects; nevertheless, datasets dedicated to water-land area segmentation are currently scarce. Therefore, this study also proposed a dataset, the Water Land Dataset (WLD), which focused more on water – land segmentation and which was used to test and prove the effectiveness of WLBANet.
2. Materials and Methods
Datasets
Although there are remote sensing semantic segmentation datasets that are publicly available, the mainstream interests are focused on architecture in city areas and the surface features of land; therefore, to achieve the purpose of this experiment, GID—a dataset contains a large number of water and land pixels—is selected. This study also proposes a dataset, Water Land Dataset (WLD), which consists mainly of pixels of water and land pixels.
Gaofen Image Dataset (GID)
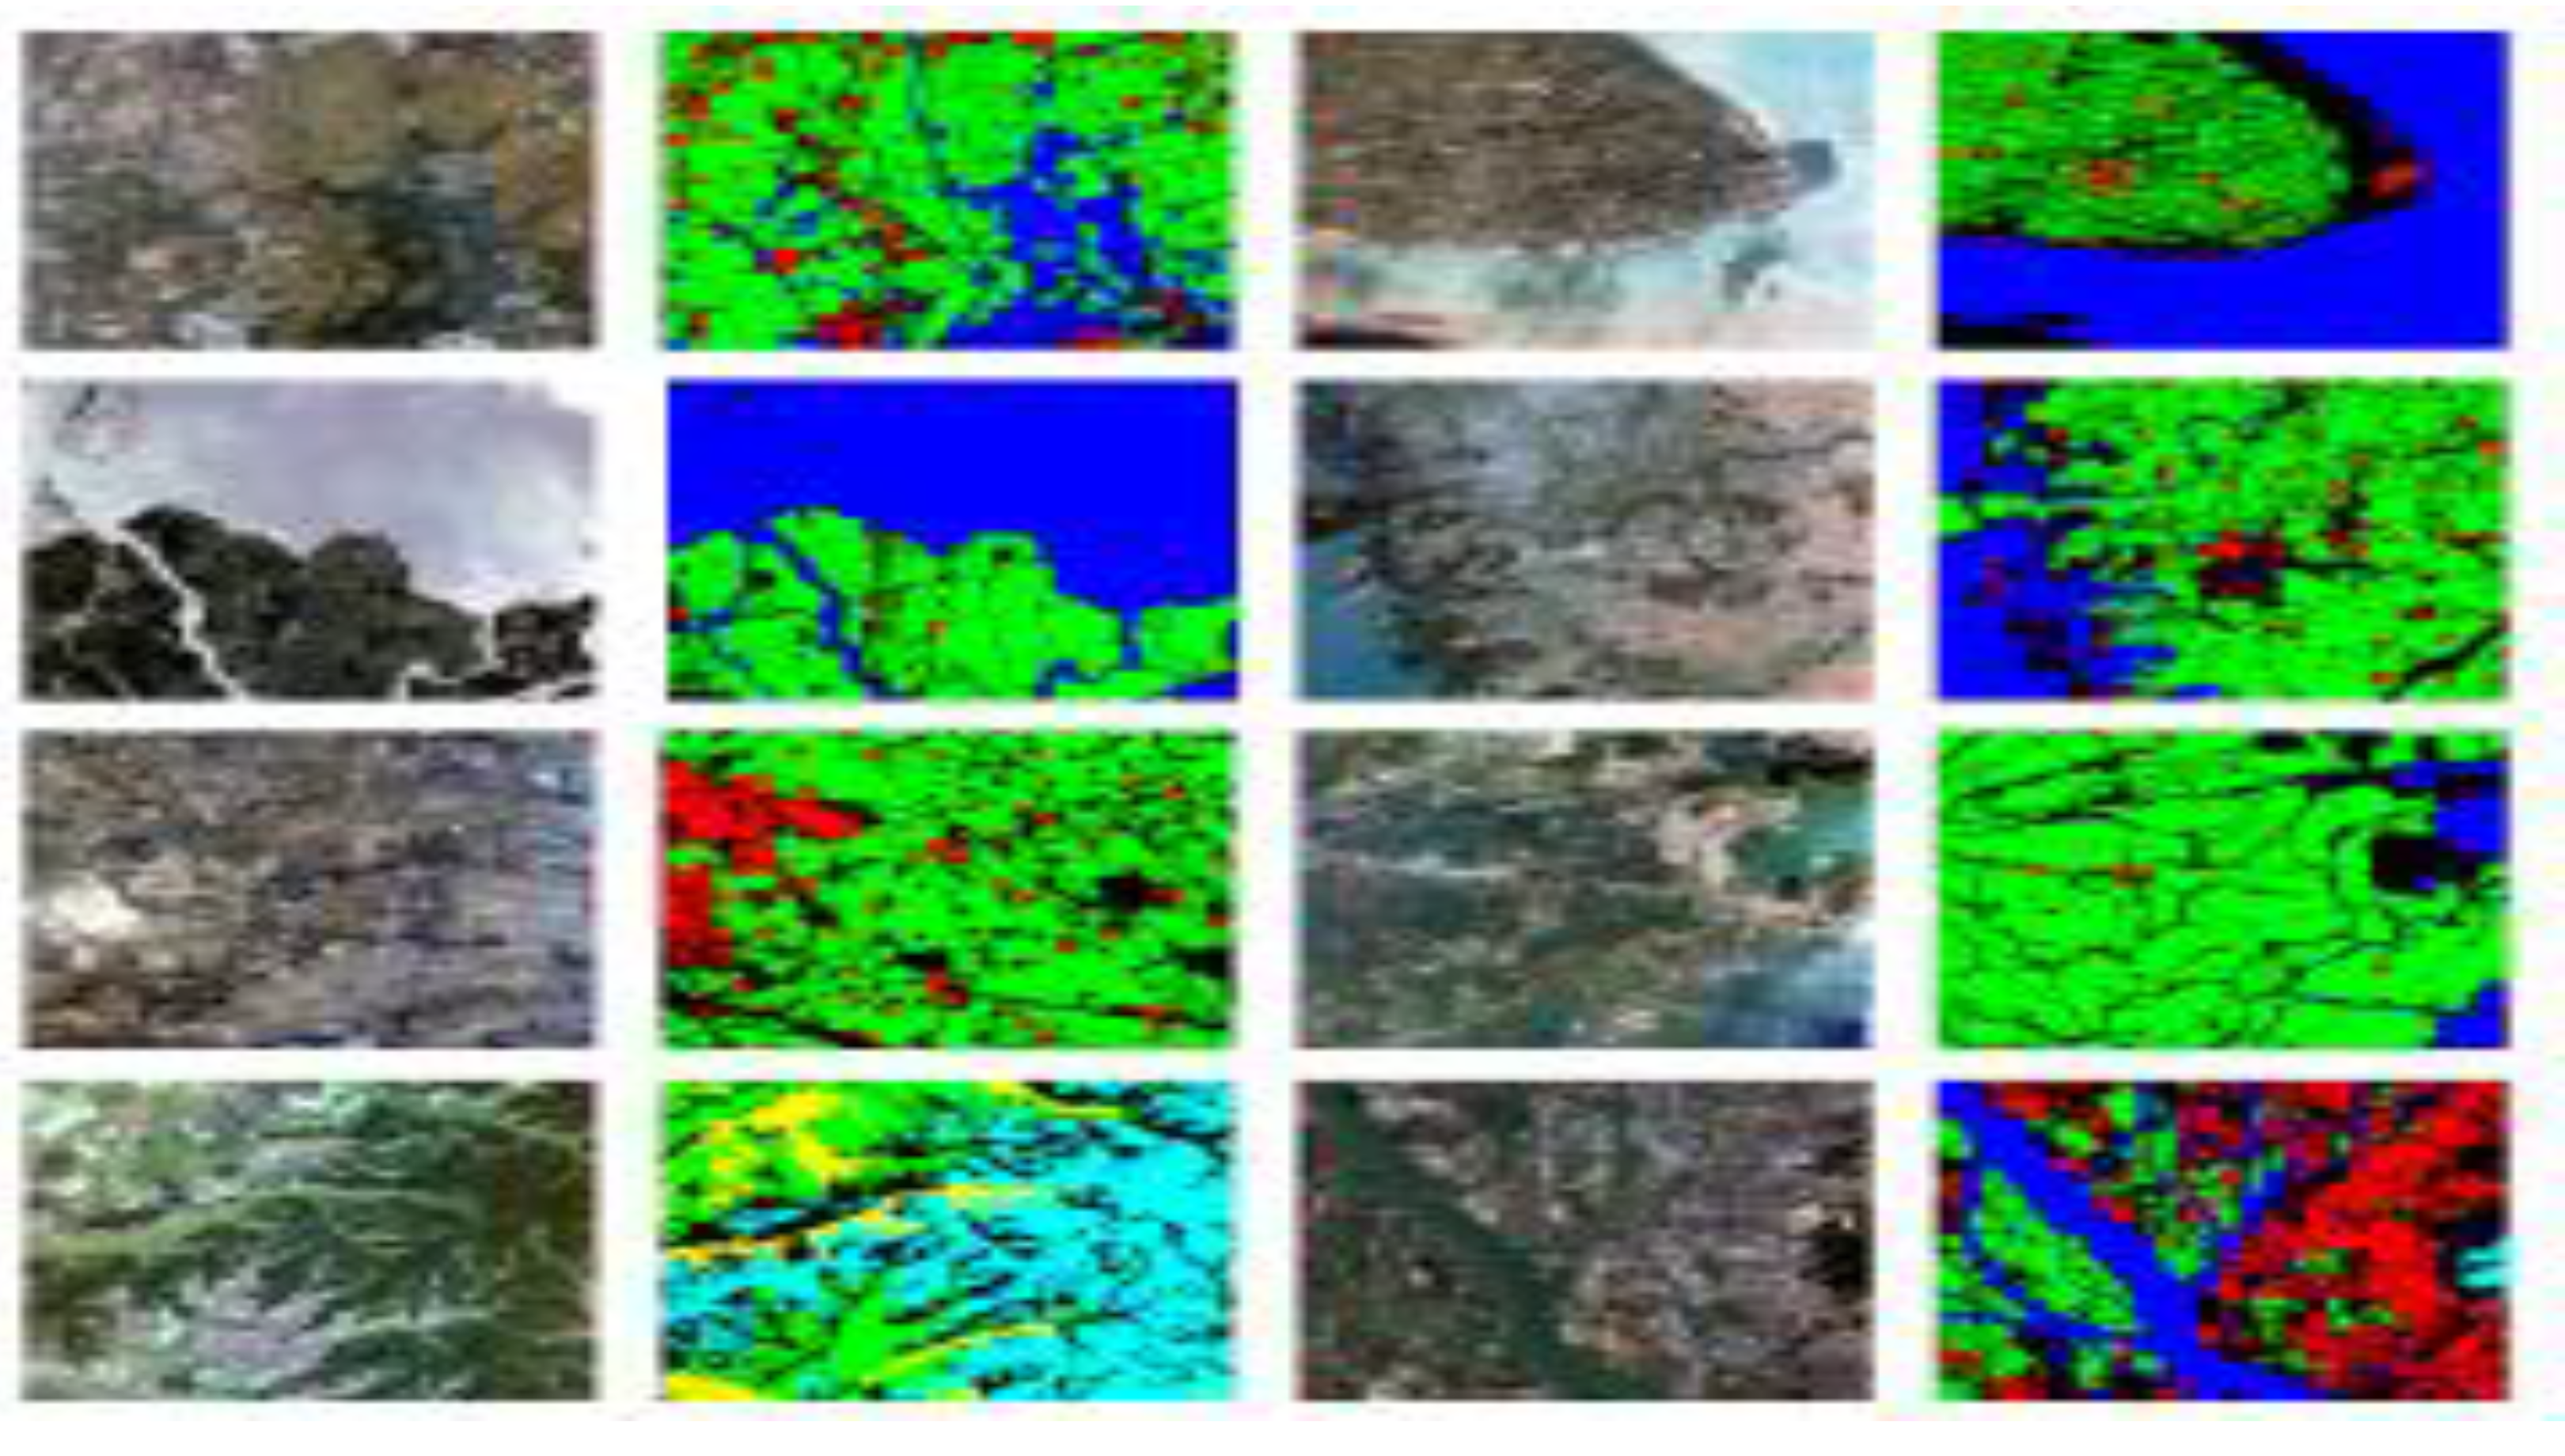
GID is a large-scale land-cover dataset made up of 150 Gaofen-2 satellite images, each of the size 6800*7200 (GID; Tong et al., 2020). As shown in
Figure 1, the pixels of the images in GID can be classified into five categories: built-up, farmland, forest, meadow, and water.
In this study, as shown in
Figure 1, 18 images covering large areas of water are selected and divided into 3,276 images of 500*500 pixels each. The detailed pixel information of the reshaped dataset is presented in
Table 1
Water Land Dataset (WLD)
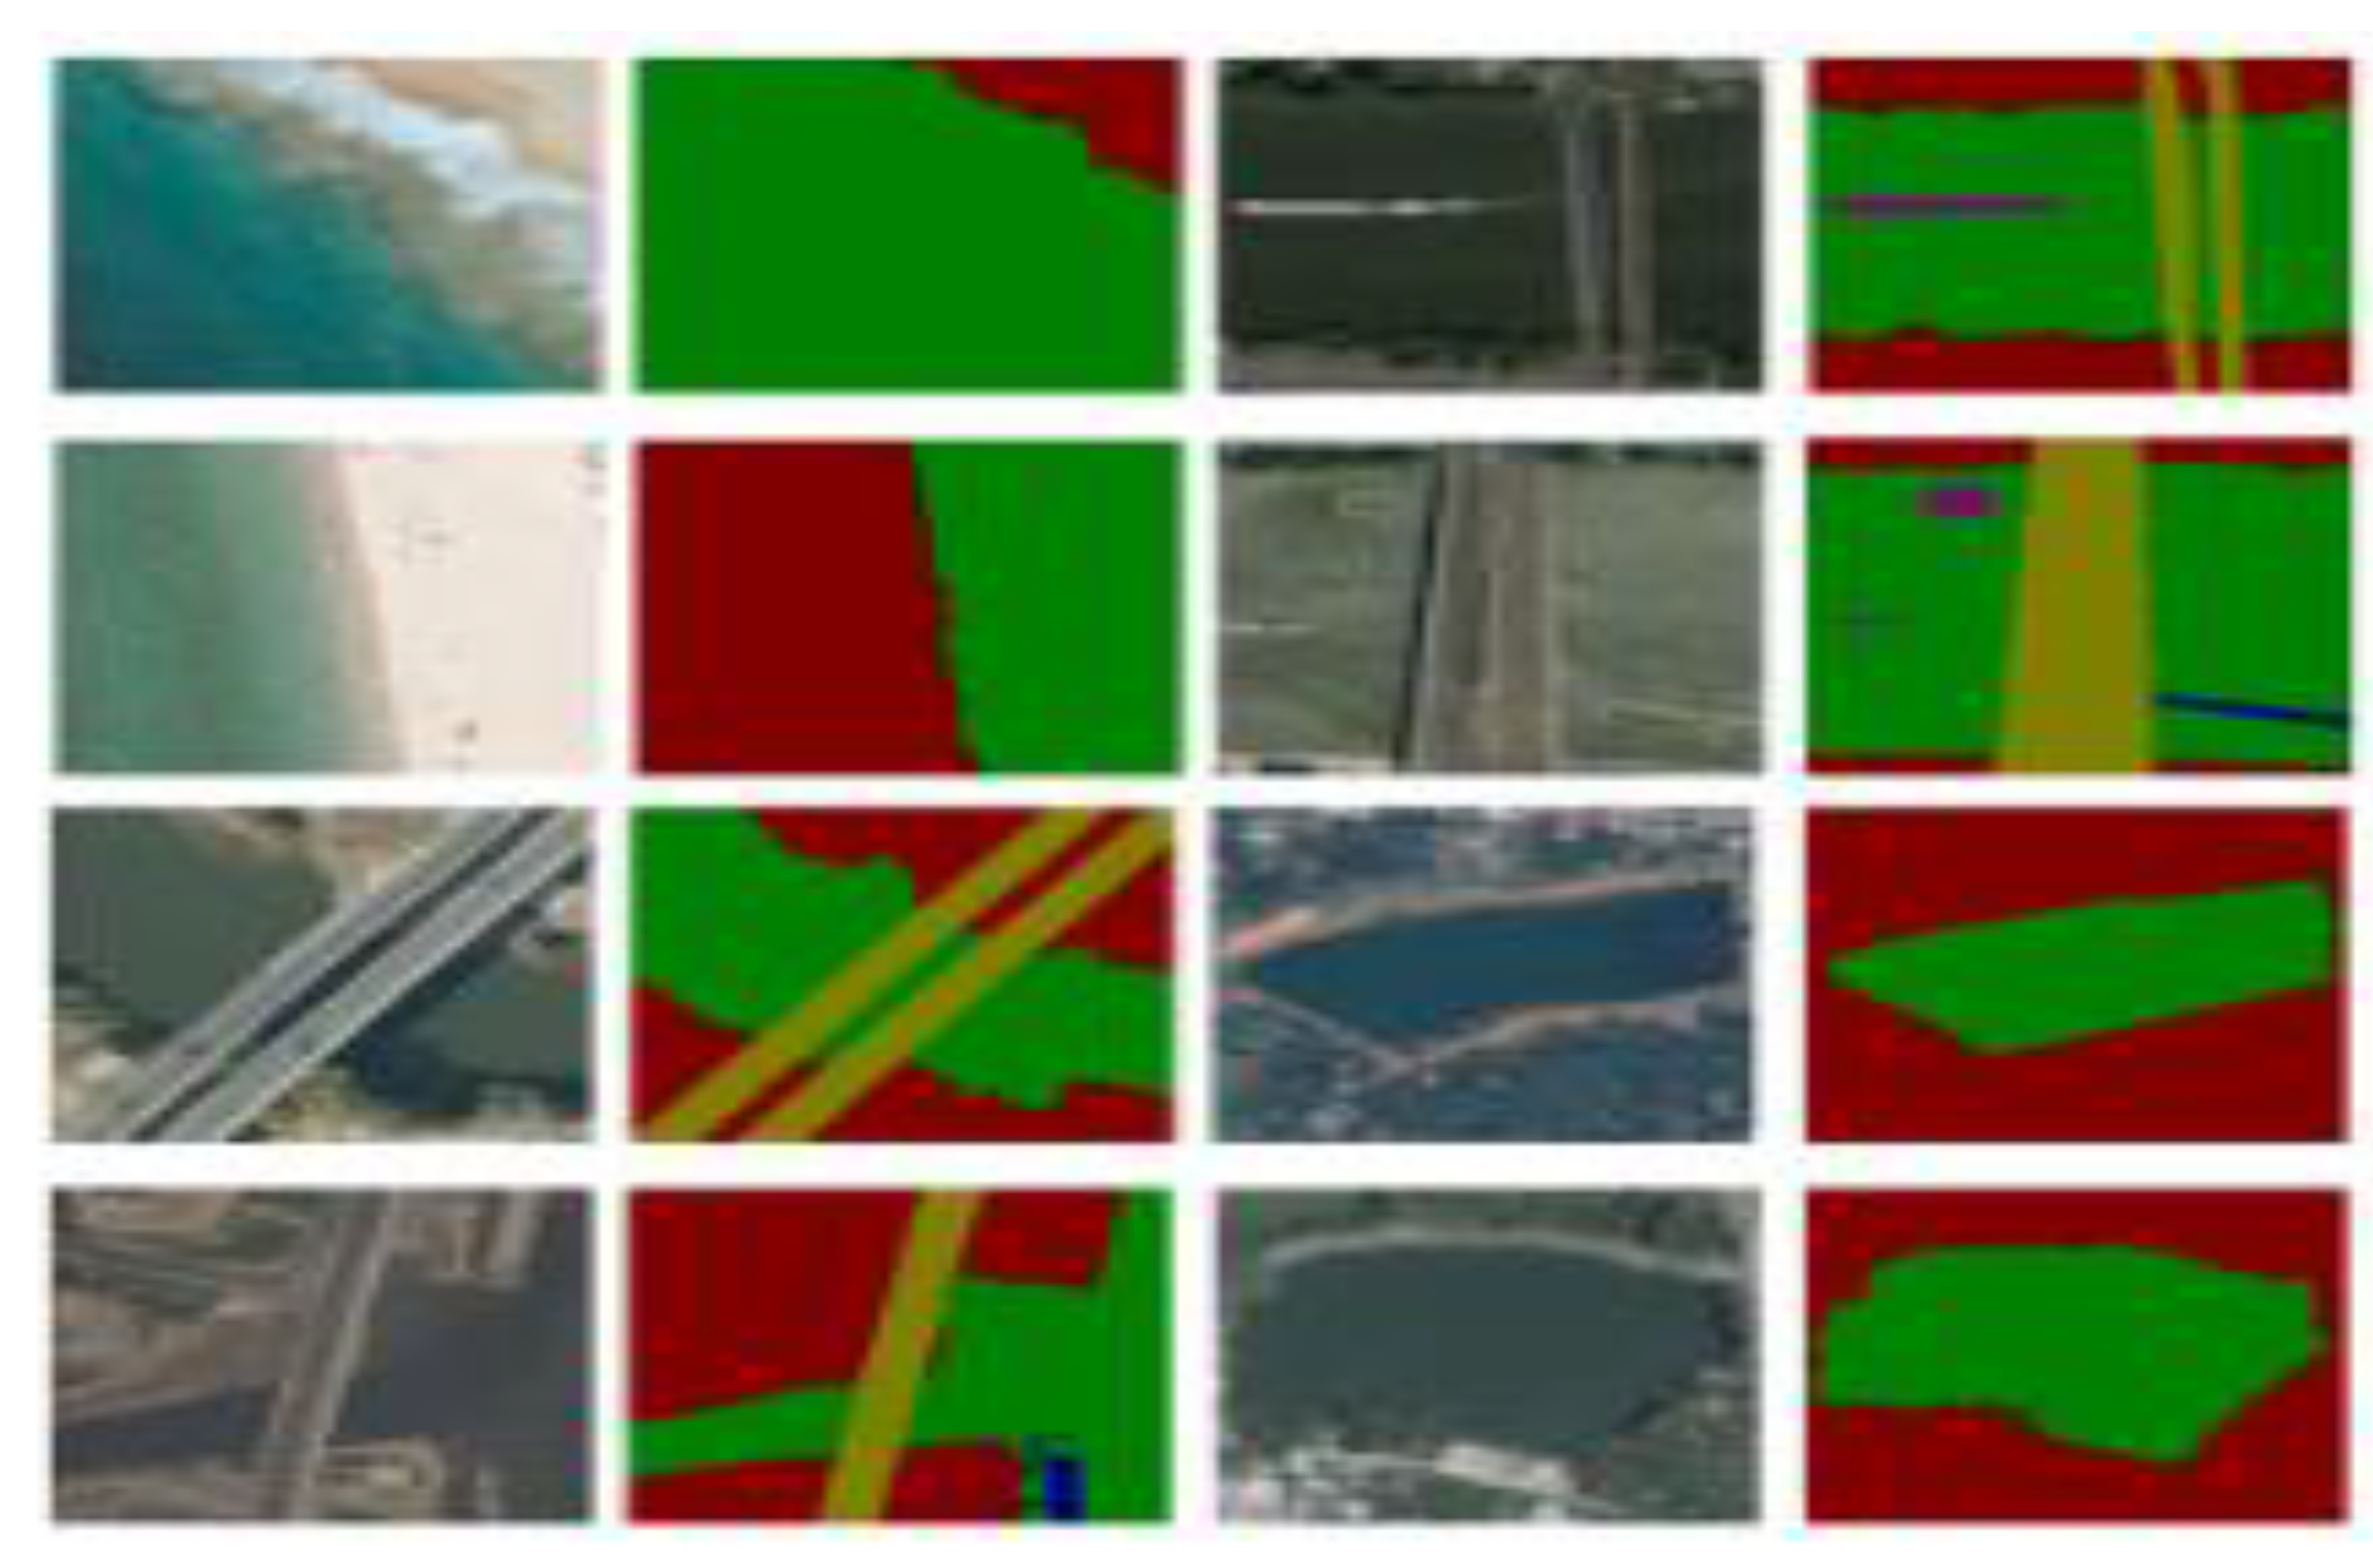
WLD is a dataset that has been constructed for this study by collecting images from Google Earth. This dataset consists of 800 images related to water and land within five classes of higher label precision. The pixel resolution changes from about 8 m to about 1 m, and the size of each image is 600*600 pixels. As shown in
Figure 2, the pixels in WLD are labeled into 5 categories: land, water, bridge, harbor and others. The pixel information is presented in
Table 2.
Water-Land Boundary Attention Network (WLBANet)
This study proposed a Water-Land Boundary Attention Network (WLBANet), which is intended to improve the accuracy of pixels at boundaries between water and land. The architecture of the proposed WLBANet is shown in
Figure 3. The downsampling model mainly is derived from resnet50 (He et al., 2016); similarly, residual blocks are inserted; and Efficient Channel Attention Modules (ECA) (Wang et al., 2020) are added. When learning channel attention information, the ECA module uses 1D convolution with a 1*1 kernel size to capture information between different channels to avoid channel dimensionality reduction, and it also has a reduced number of parameters. During convolution, the size of the kernel affects the receptive fields; therefore, to settle the different feature maps, ECA uses a dynamic convolution kernel to do 1*1 convolution. The purpose of inserting Sobel operator (Sobel, 2014) is to make the network more sensitive to boundaries.
Loss Function
Dice Loss L
D combined Cross Entropy Loss L
CE is used as loss function. Dice Loss is a regionally correlated loss, which means that the loss and gradient of a pixel is not only correlated with the label or prediction of that pixel, but also with the labels and prediction of other points, so dice loss focuses more on positive samples. By contrast, Cross Entropy Loss focuses on each sample, and when there are more negative samples, loss is mainly contributed to by negative samples.
where L
CE and L
D
where
is ground true,
is the predict mask, smooth = 1 is added to prevent the denominator from being 0;
means ground true,
means the predict mask, and n is the number of classes.
Implementation Details
The configuration of the experiment is presented in
Table 3. The experiments are performed using TensorFlow/Keras on RTX 2080.
The parameter settings are listed in
Table 4. When the loss cannot be reduced further, the loss is reduced by decreasing the learning rate, which is reduced three times, with each reduction going down to 0.3 of the learning rates.
The input images are resized to 480*480.
3. Results
Mean intersection over union (mIoU) is used to evaluate the performance of the network.
Results on GID
The accuracy and loss in each epoch are visualized in
Figure 4.
The images of the GID were not labeled precisely enough, so the accuracy of the network could not reach as high a level as desired. In some images, the predict images were even more accurate than the labels. The predicted images are shown in
Figure 5. The evaluation indicators mIoU and OA are presented in
Table 5.
Overall, the experiment performed as expected on the GID dataset, and network exhibited good performance on boundaries.
Results on WLD
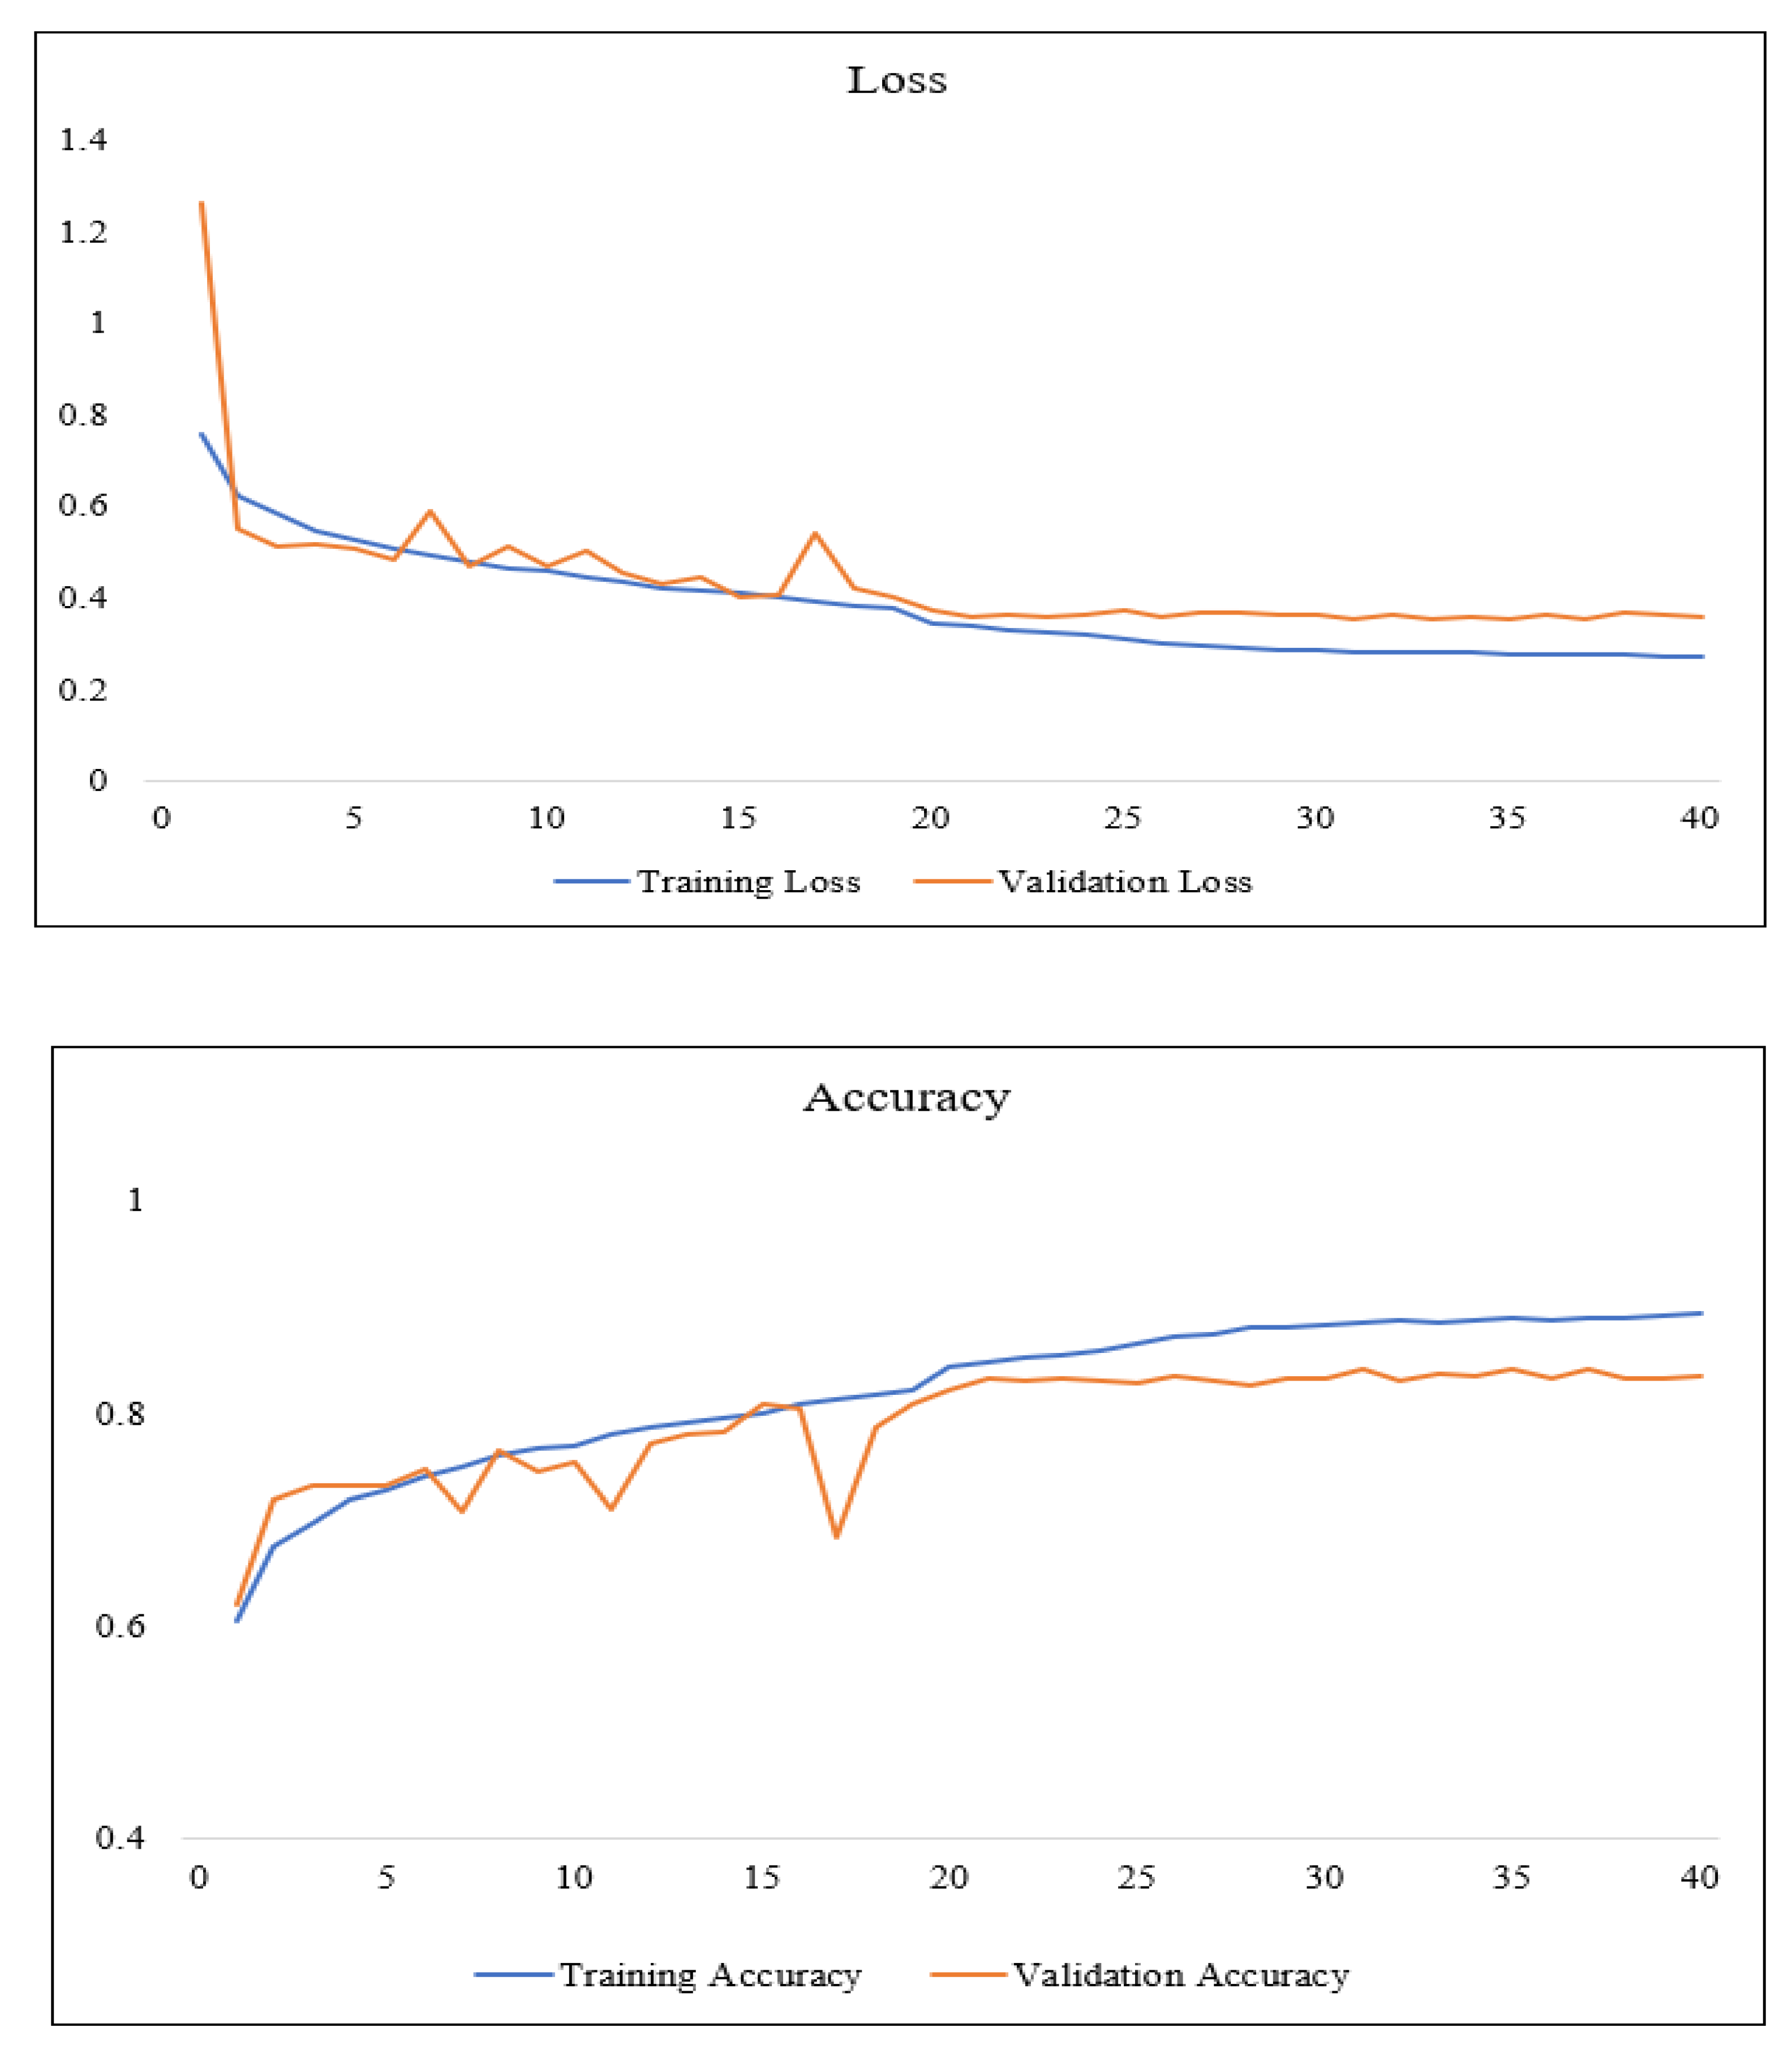
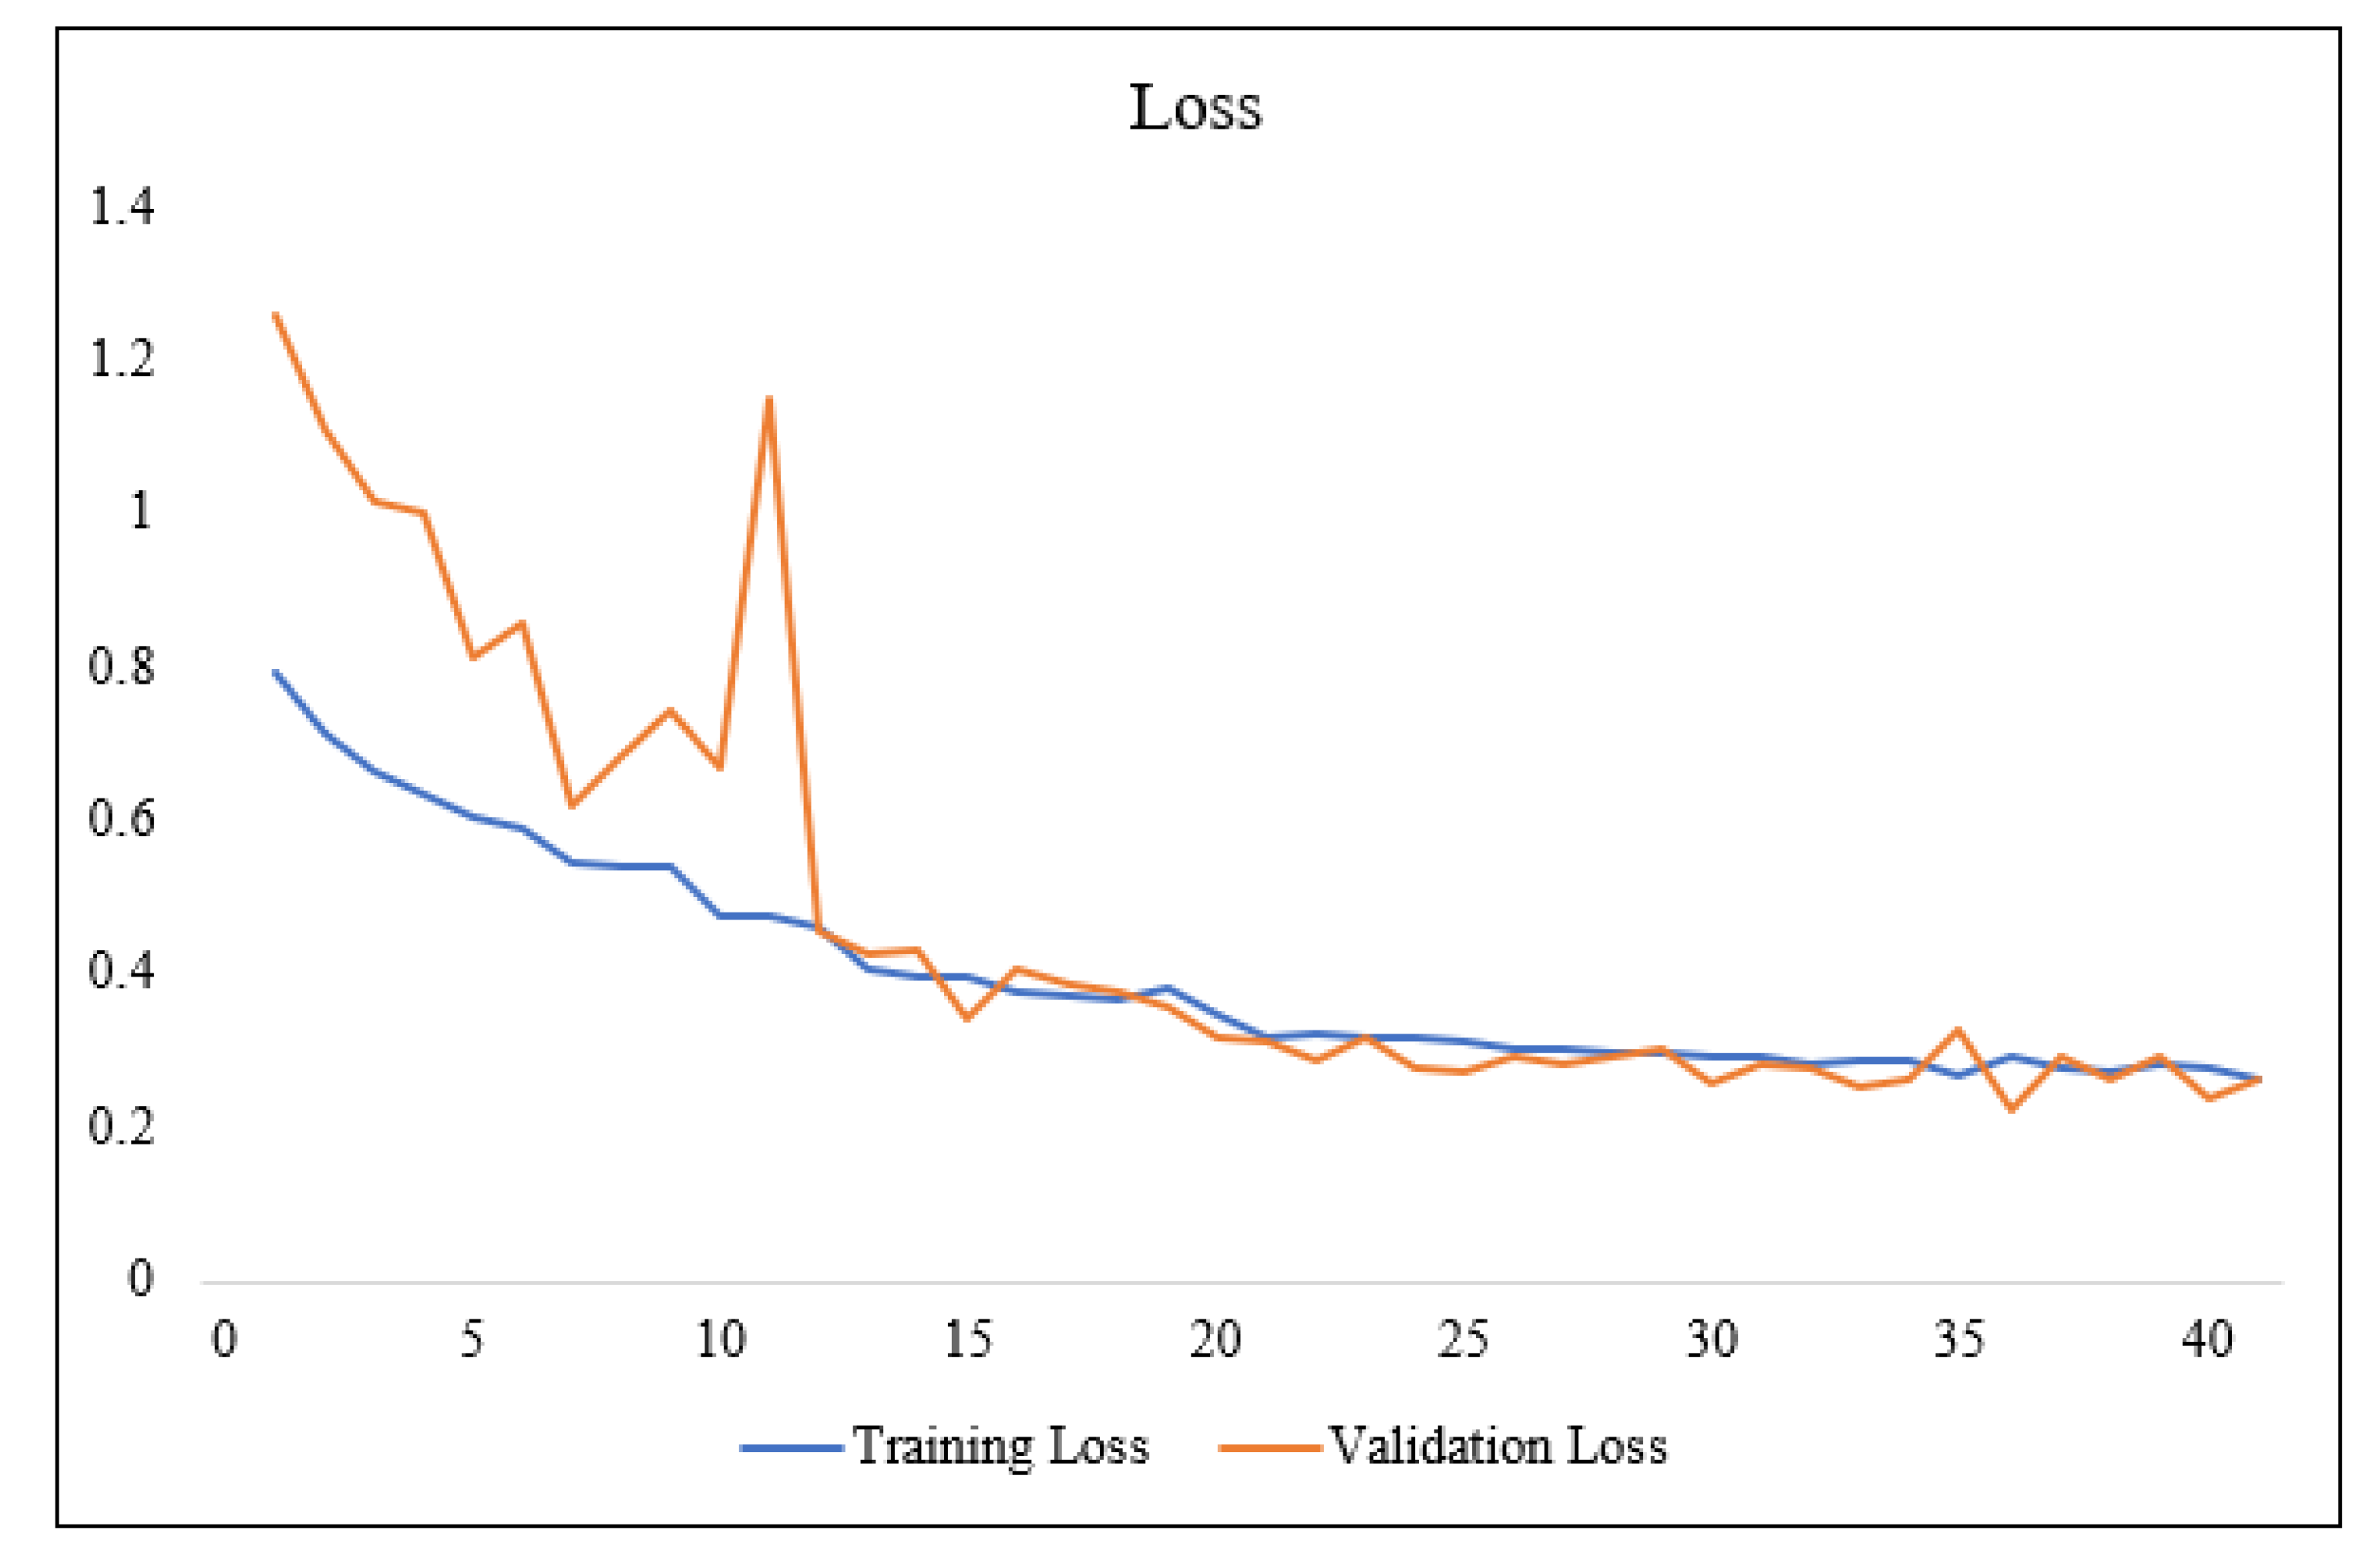
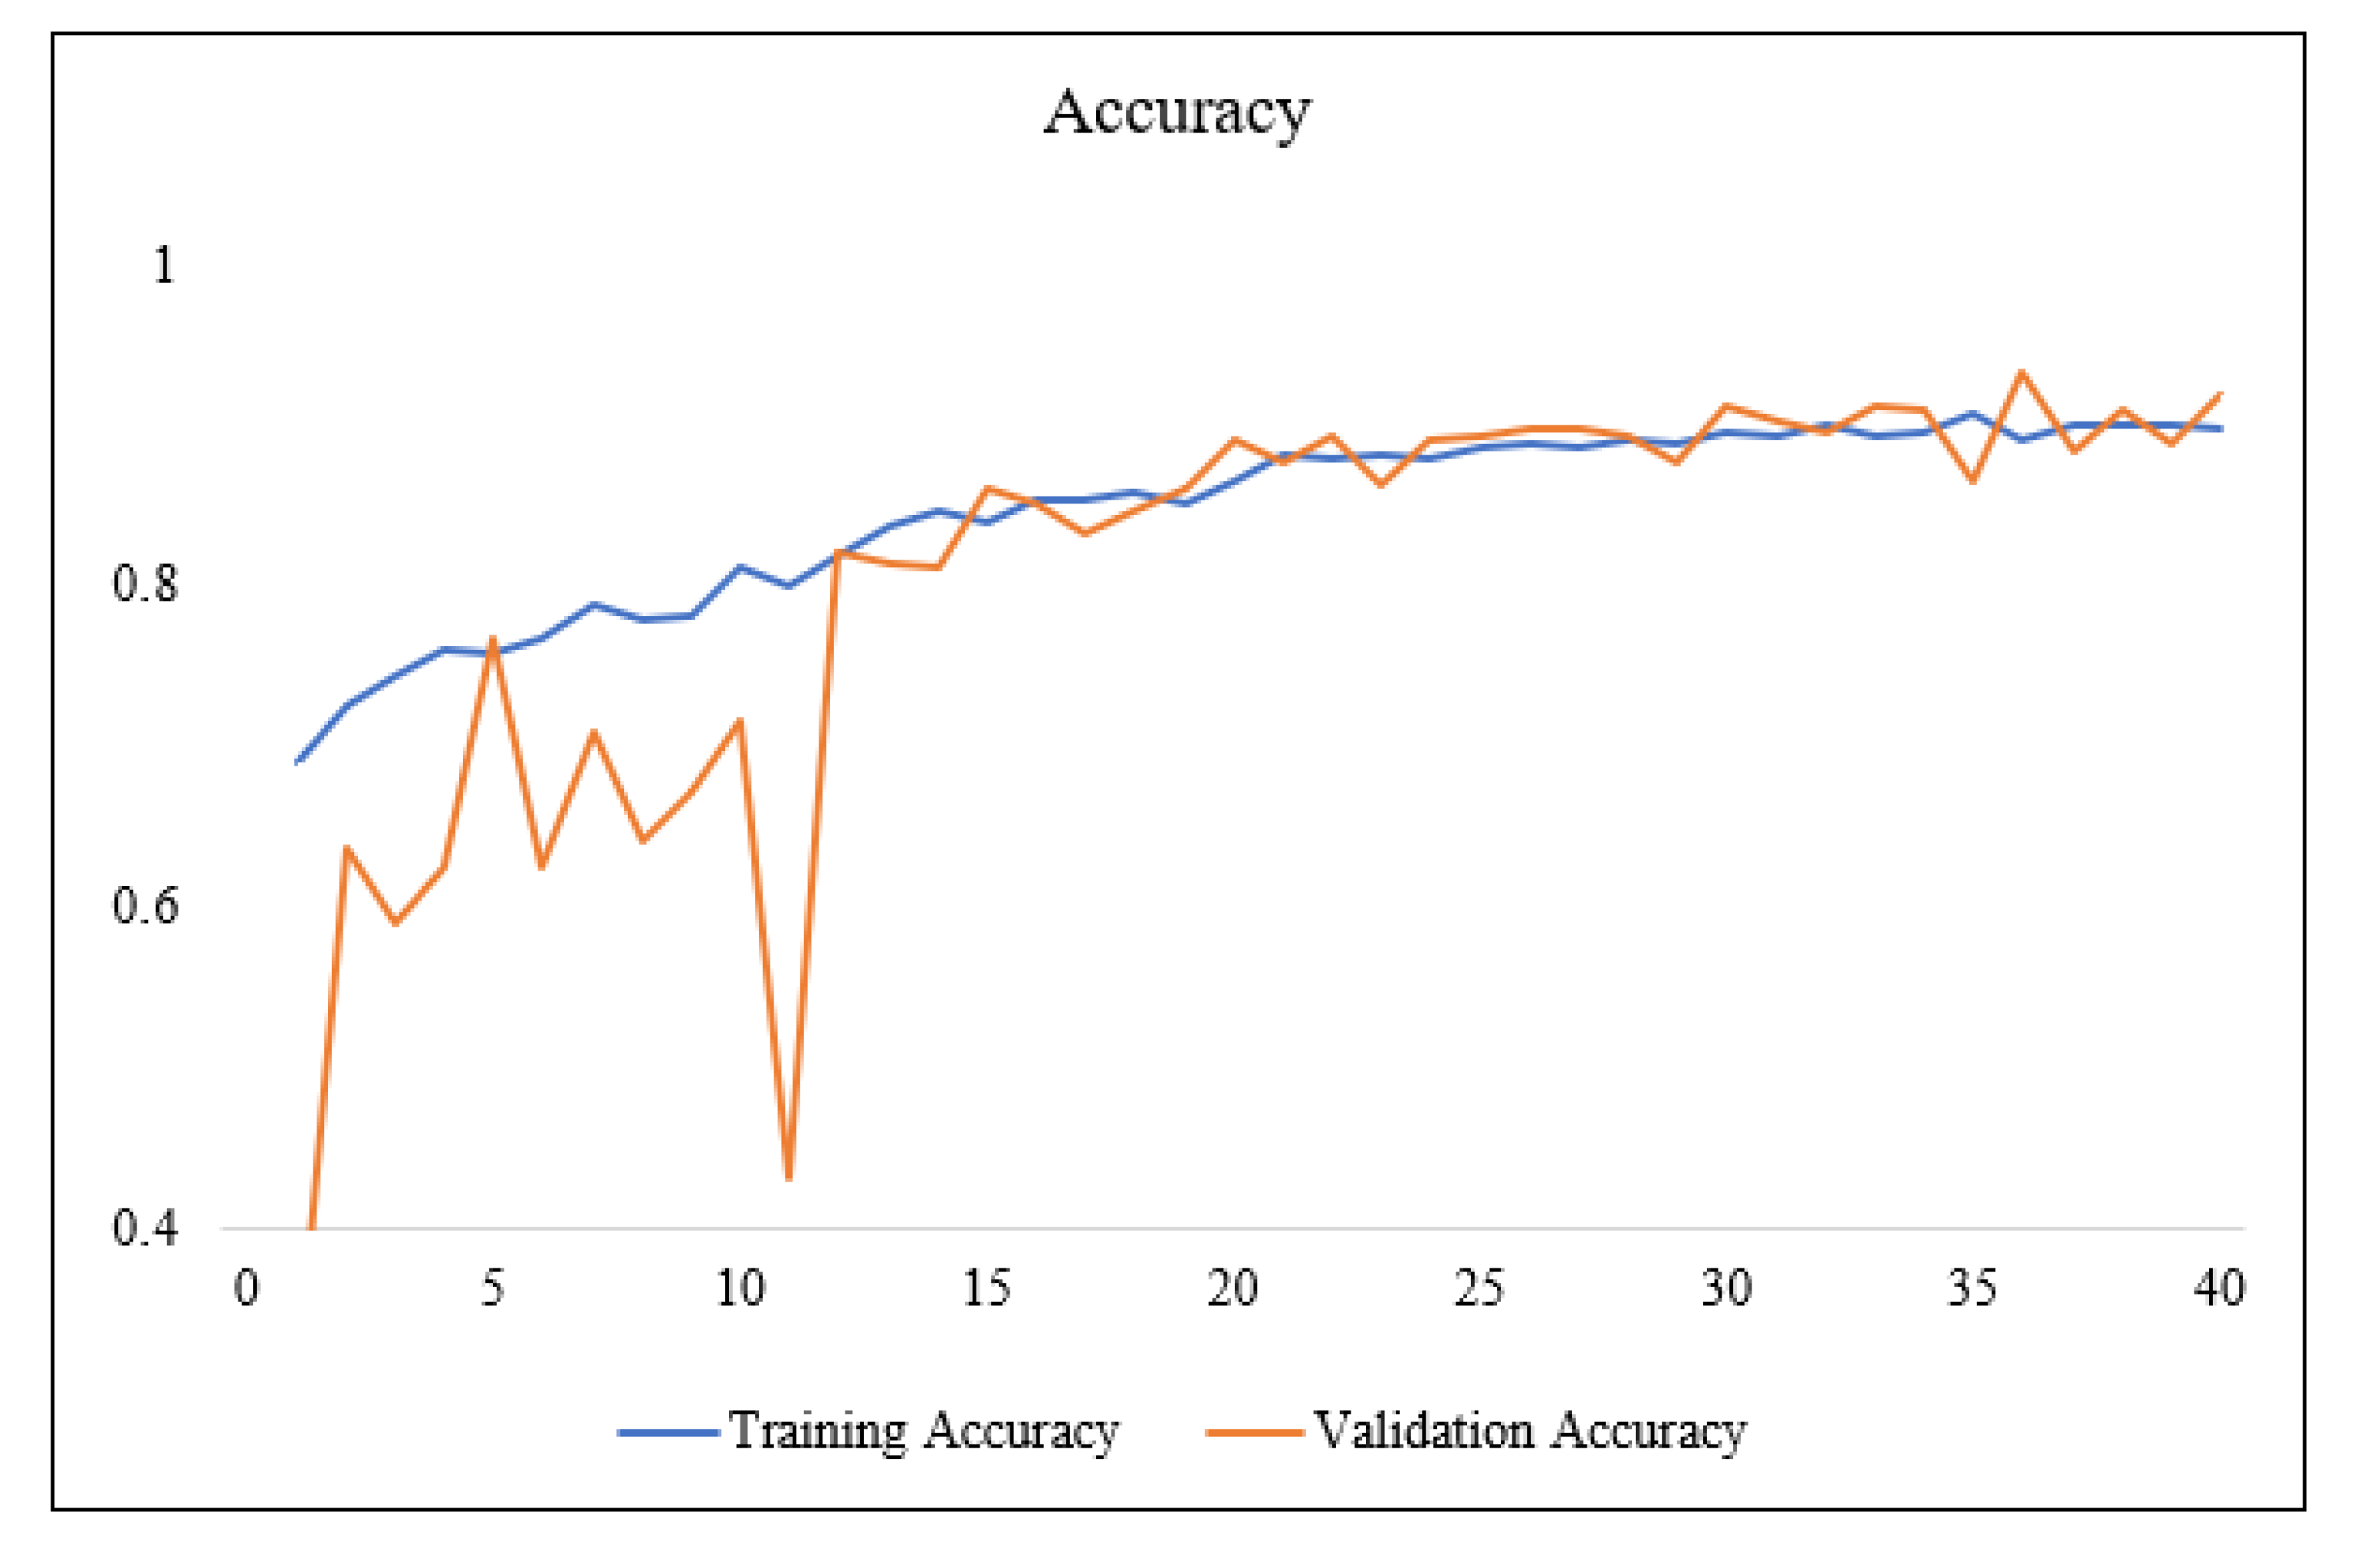
The accuracy and loss in each training epoch are shown in
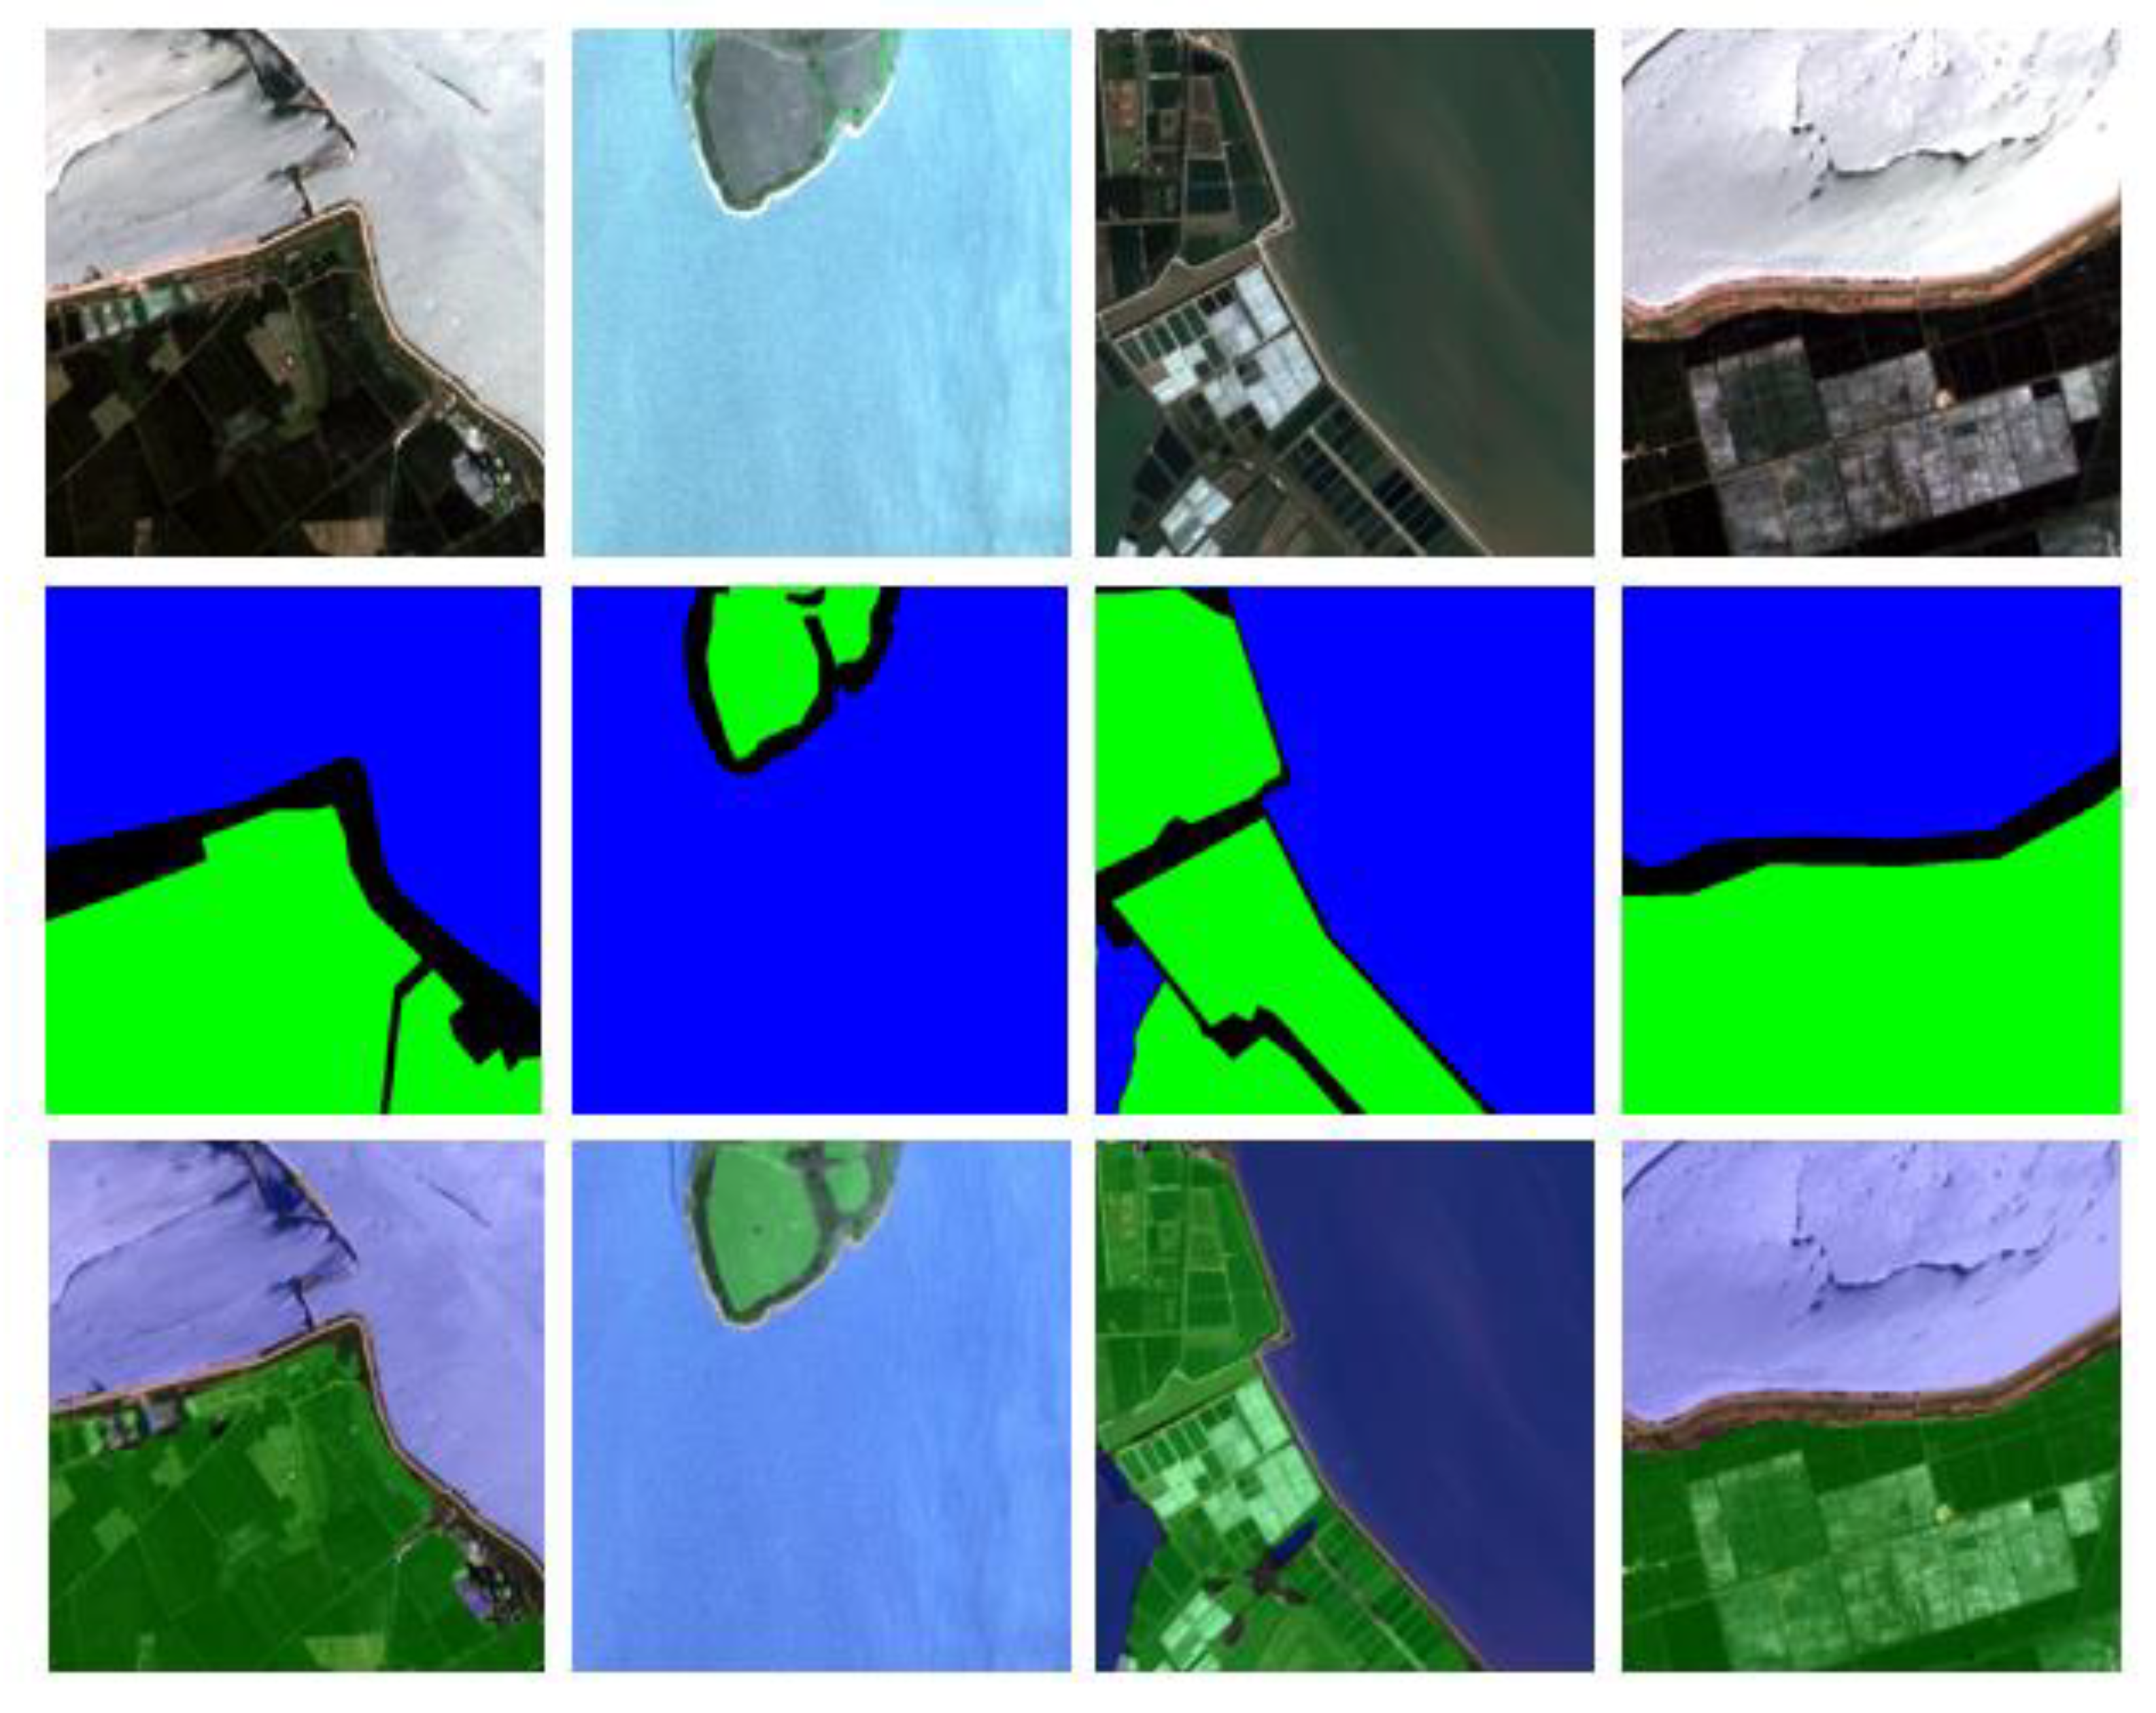
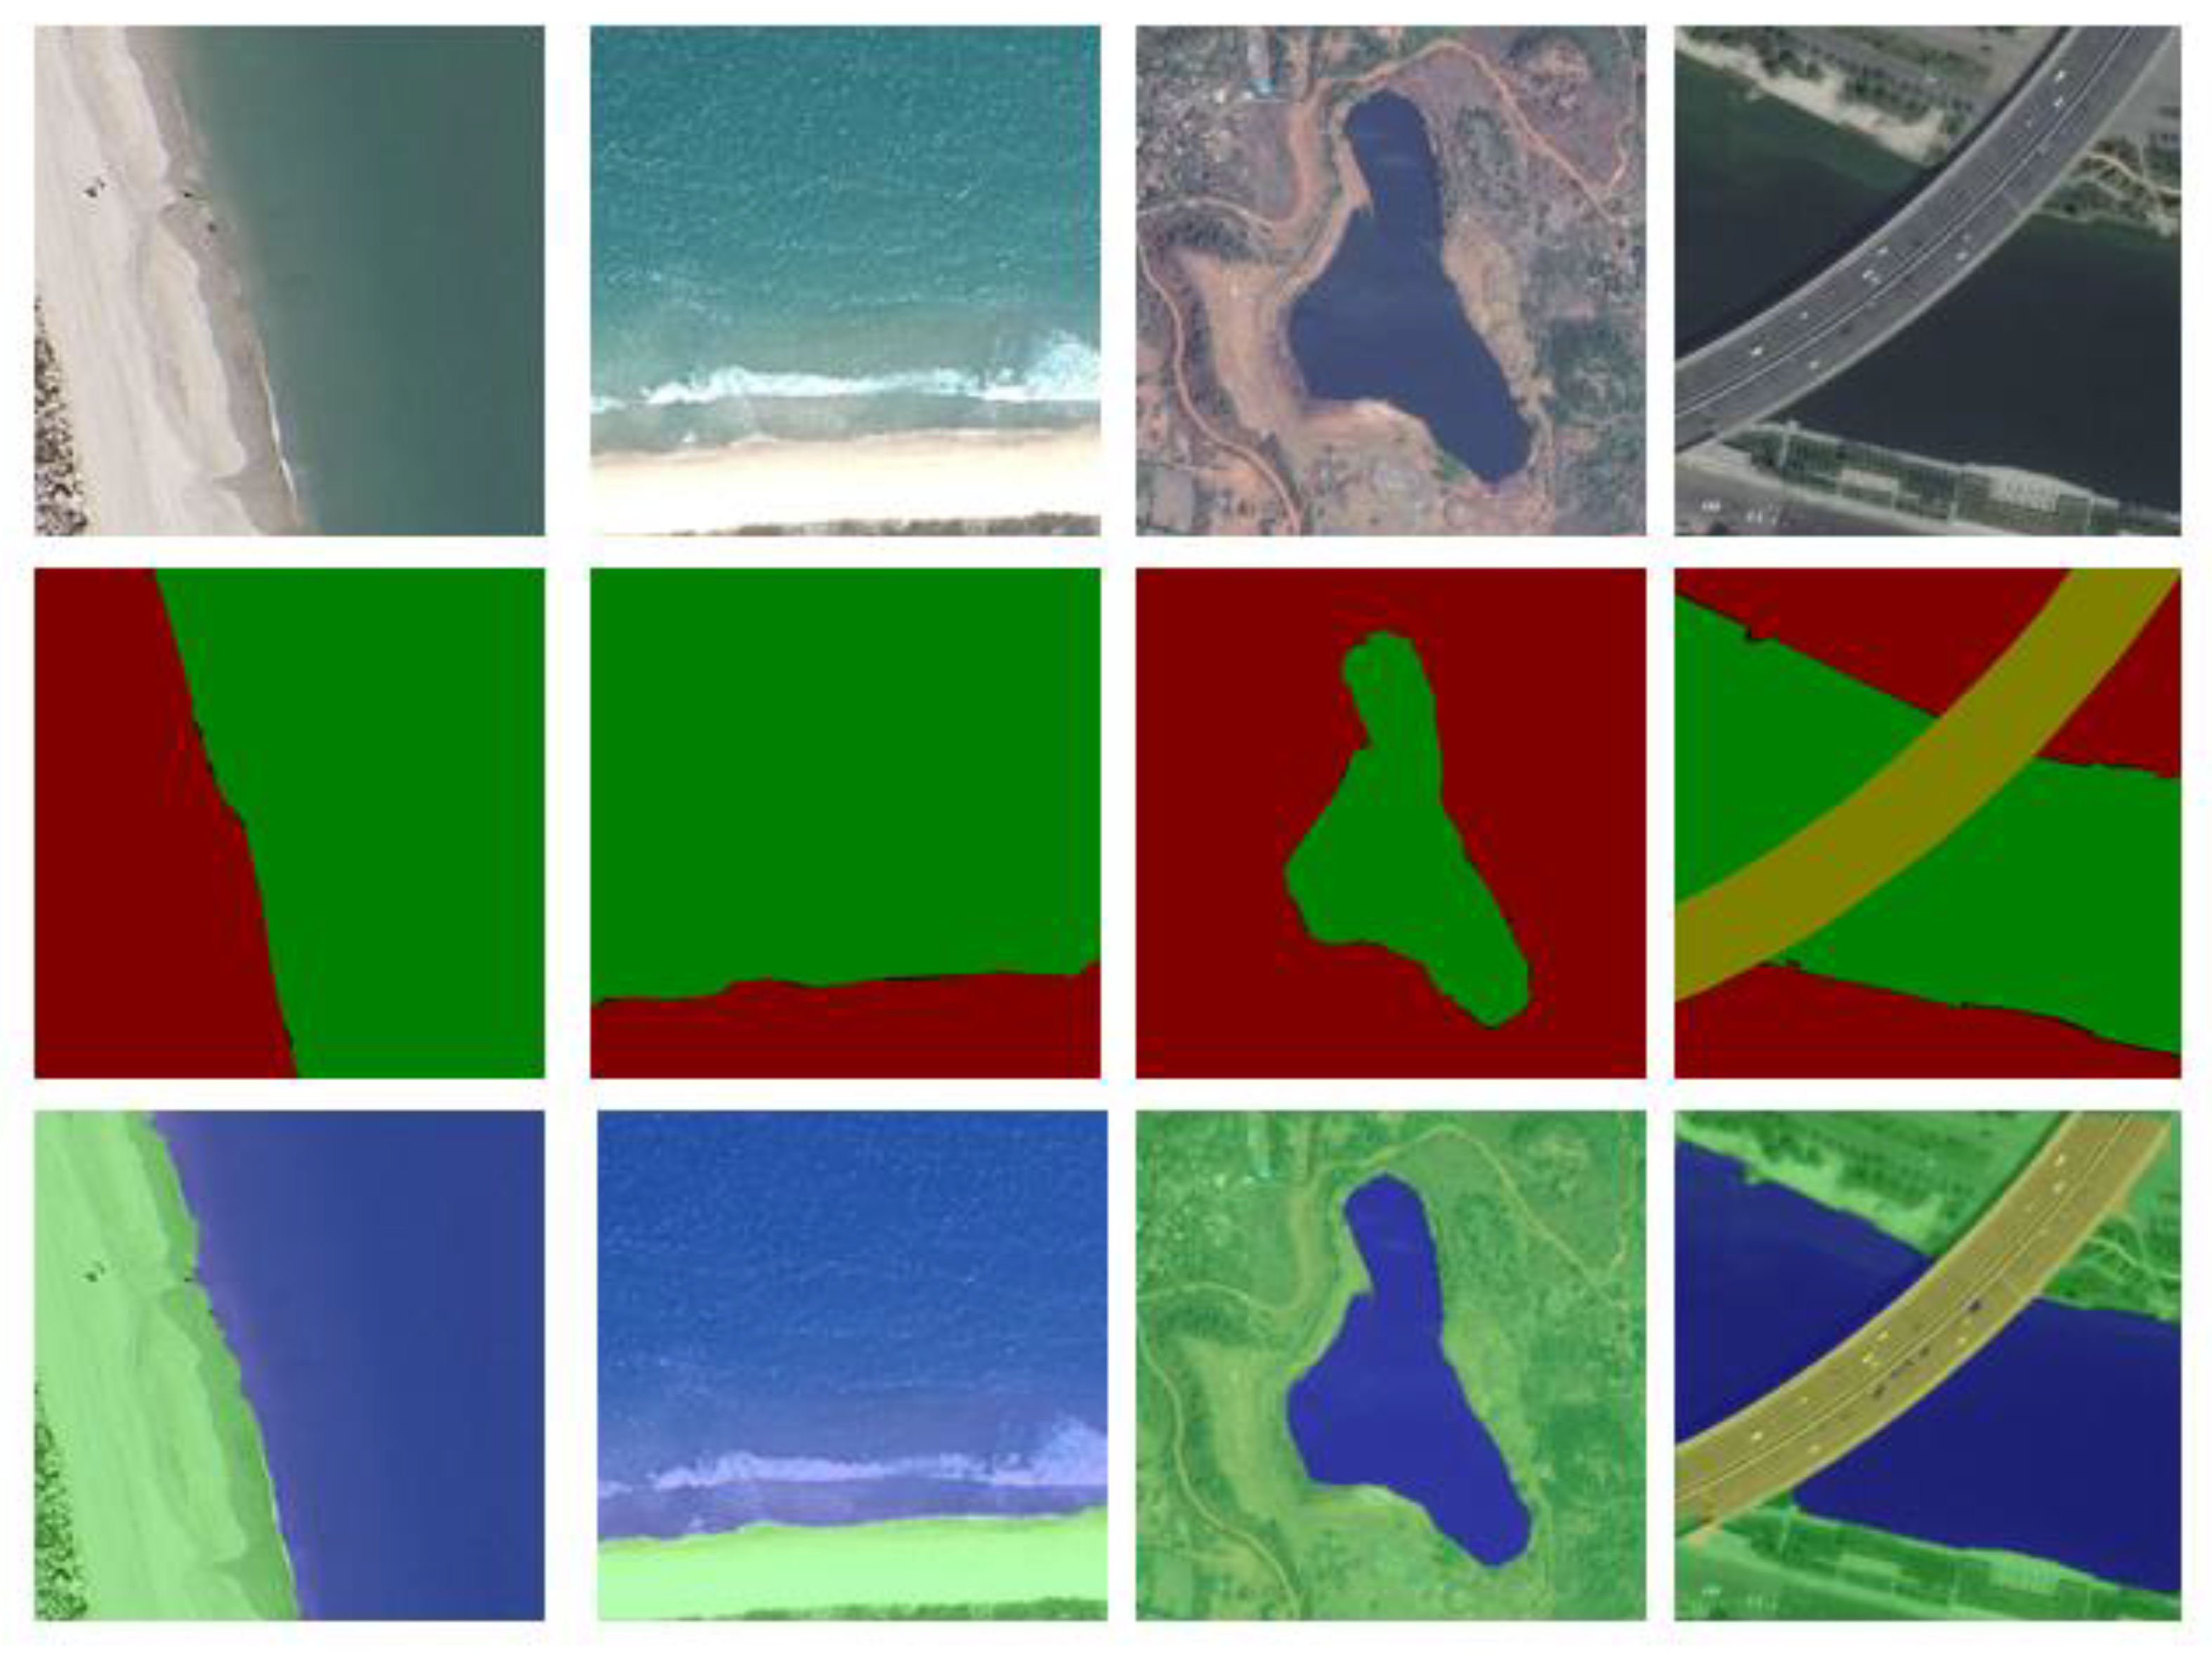
Figure 6. The WLD dataset proposed in this study is found to have better label precision, which leads to a smoother training process, a better rate of increase in the accuracy of training, and a better result. The loss also converged better. The predicted images of the WLD datasets are shown in the
Figure 7. The evaluation indicators of mIoU and OA, on the WLD datasets are listed in
Table 6.
Based on the predicted images, the network achieves better performance on the WLD dataset and better segmentation effect on boundaries. Based on the predicted images, the network achieveshas the better performance on the WLD dataset and better segmentation effect on boundaries.
The proposed network has achieved the expected performance on both the GID and WLD datasets. It can therefore be concluded that the network increases the segmentation accuracy at the object boundaries by paying closer attention to information pertaining to object boundaries.
4. Discussion
Based on the images of the results shown in this experiment and evaluation indicators, the network proposed in this study has been found to have favorable adaptability to boundaries, and it achieves the expected results.
This experiment also has some limitations. Due to the lack of semantic segmentation remote sensing datasets related to water and land, the network proposed in our study could not be tested on other similar datasets. The number of images used for training is also low, so although the performance met expectations, a better result could be achieved by using a larger dataset.
Since the labels in the GLD dataset are slightly different from the labels required for this experiment, the performance on the GLD dataset is inferior to the performance on the WLD dataset, which has been proposed for this network in this study; nonetheless, the results demonstrate that the network can focus more on the pixels of boundaries and perform well on various datasets. The GID dataset is primarily focused on objects on the land, so several areas of the boundary between water and land are not classified into any categories, which limited the performance of the network.
The dataset introduced in this paper also suffers from a data imbalance, but since the present experiment focuses on the segmentation of water and land, this has likely had little impact.
5. Conclusions
This study proposed the Water-Land Boundary Attention Network (WLBANet), which is more sensitive to land and water boundaries and has better segmentation capabilities. This paper also introduced the Water Land Dataset (WLD), which contains more water and land areas with more precise label, to validate the performance of the network.
The network exhibited improved performance for pixels at the boundary by adding attention modules and an edge detector. The ECA module avoids reducing the dimension and achieves higher accuracy with fewer parameters. A Sobel detector is integrated to increase the sensitivity to boundaries.
To prove the validity of the network, the experiment was performed on both the GID dataset and the WLD dataset. Due to the effect of precision and the different focuses of labels, the performance is better in the WLD dataset, but both demonstrate that the network is efficient and has a higher sensitivity to boundaries, along with better segmentation ability. This network and this dataset are expected to help perceive the boundaries between water and land to facilitate the detection of natural disasters, such as droughts, floods tsunamis, and others.
References
- Long, J.; Shelhamer, E. Long, J.; Shelhamer, E., and Darrell, T., 2015. Fully convolutional networks for semantic segmentation. Proceedings of the IEEE Conference on Computer Vision and Pattern Recognition, pp. 3431-3440.
- 2. Badrinarayanan, V., Kendall, A., & Cipolla, R., 2017. Segnet: A deep convolutional encoder-decoder architecture for image segmentation. IEEE transactions on pattern analysis and machine intelligence, 39(12), 2481-2495.
- Basit, A., Siddique, M. A., Bashir, S., Naseer, E., & Sarfraz, M. S. 2024. Deep Learning-Based Detection of Oil Spills in Pakistan’s Exclusive Economic Zone from January 2017 to December 2023. Remote Sensing, 16(13), 2432.
- Ronneberger, O., Fischer, P., & Brox, T., 2015. U-net: Convolutional networks for biomedical image segmentation. Medical Image Computing and Computer-Assisted Intervention–MICCAI 2015: 18th International Conference, Munich, Germany, October 5-9, 2015, Proceedings, Part III 18, pp. 234-241. Springer International Publishing.
- 5. Zhao, H., Shi, J., Qi, X., Wang, X., & Jia, J., 2017. Pyramid scene parsing network. Proceedings of the IEEE conference on computer vision and pattern recognition, pp. 2881-2890.
- Wang, Q., Wu, B., Zhu, P., Li, P., Zuo, W., & Hu, Q., 2020. ECA-Net: Efficient channel attention for deep convolutional neural networks. Proceedings of the IEEE/CVF conference on computer vision and pattern recognition, 11534-11542.
- Kaiser, P., Wegner, J. D., Lucchi, A., Jaggi, M., Hofmann, T., & Schindler, K., 2017. Learning aerial image segmentation from online maps. IEEE Transactions on Geoscience and Remote Sensing, 55(11), 6054-6068.
- Tong, X. Y., Xia, G. S., Lu, Q., Shen, H., Li, S., You, S., & Zhang, L., 2020. Land-cover classification with high-resolution remote sensing images using transferable deep models. Remote Sensing of Environment, 237, 111322.
- He, K., Zhang, X., Ren, S., & Sun, J., 2016. Deep residual learning for image recognition. Proceedings of the IEEE conference on computer vision and pattern recognition, pp. 770-778.
- Hoffman, J. P., Rahmes, T. F., Wimmers, A. J., & Feltz, W. F.,2023. The application of a convolutional neural network for the detection of contrails in satellite imagery. Remote Sensing, 15(11), 2854.
- Sobel, Irwin.,2014. An Isotropic 3x3 Image Gradient Operator. Presentation at Stanford A.I. Project 1968.
- Kingma, D. P., & Ba, J., 2014. Adam: A method for stochastic optimization. arXiv preprint, arXiv:1412.6980.
- Dice, L. R., 1945. Measures of the amount of ecologic association between species. Ecology, 26(3), 297-302.
- Li, X., Sun, X., Meng, Y., Liang, J., Wu, F., & Li, J., 2019. Dice loss for data-imbalanced NLP tasks. arXiv preprint arXiv:1911.02855.
- Marmanis, D., Schindler, K., Wegner, J. D., Galliani, S., Datcu, M., & Stilla, U.,2018. Classification with an edge: Improving semantic image segmentation with boundary detection. ISPRS Journal of Photogrammetry and Remote Sensing, 135, 158-172.
- Tasar, O., Tarabalka, Y., & Alliez, P.,2019. Incremental learning for semantic segmentation of large-scale remote sensing data. IEEE Journal of Selected Topics in Applied Earth Observations and Remote Sensing, 12(9), 3524-3537.
- Krizhevsky, A., Sutskever, I., & Hinton, G. E., 2017. Imagenet classification with deep convolutional neural networks. Communications of the ACM, 60(6), 84-90.
|
Disclaimer/Publisher’s Note: The statements, opinions and data contained in all publications are solely those of the individual author(s) and contributor(s) and not of MDPI and/or the editor(s). MDPI and/or the editor(s) disclaim responsibility for any injury to people or property resulting from any ideas, methods, instructions or products referred to in the content. |
© 2024 by the authors. Licensee MDPI, Basel, Switzerland. This article is an open access article distributed under the terms and conditions of the Creative Commons Attribution (CC BY) license (http://creativecommons.org/licenses/by/4.0/).
