Preprint
Article

Leaf-soil C:N:P Stoichiometry and Homeostasis Characteristics of Plantations in the Yellow River Floodplain in Western Shandong, China

Altmetrics

Downloads

72

Views

17

Comments

0

A peer-reviewed article of this preprint also exists.

This version is not peer-reviewed

Submitted:

05 July 2024

Posted:

09 July 2024

You are already at the latest version

Alerts
Abstract
The concentrations and ratios of plant C, N, and P serve as important indicators of ecological processes. However, how plant and soil C:N:P relationships and ratios change with forest stand types remain unclear. Here, we analyzed the ecological stoichiometric characteristics by measuring leaf and soil organic C, total N and P contents in four stand types in Liaocheng, including Populus tomentosa pure forest, Populus tomentosa-Robinia pseudoacacia mixture forests, Platanus orientalis pure forest, and Salix matsudana pure forests. We find that: (1) The N and P leaf contents varied significantly across the four forest stands, with Populus tomentosa-Robinia pseudoacacia mixture forests having higher P levels. Platanus orientalis pure forests had lower C and N but higher P levels compared to others. (2) Uncoupled cycling of P in leaf-soil systems due to environmental influences, but C and N elements showed coupled cycles in some forest stands. (3) All forest stand types were limited by N and P elements. Overall, environmental factors, in addition to species variations, influence the C, N, P, and C:N:P ratios in leaves and soils of different forest stand types. Enhancing conservation and efficient use of N and P elements is crucial for sustainable plantation forest management to promote optimal growth in the region.
Keywords: 
Subject: Biology and Life Sciences  -   Forestry

1. Introduction

Ecological stoichiometry is an important method to study the balance of major elements and material cycling of ecosystem components, which can reflect the dynamic balance between energy and chemical elements [1,2,3]. Ecological stoichiometry focuses on the dynamic equilibrium between C, N and P and their interactions, and the demand for nutrients (mainly C, N and P) by plants [1,4]. C, N and P are the key biogenic elements for the survival and development of terrestrial organisms. C is known as the structural basis of plants and is relatively stable in plant organisms, accounting for about 50% of dry plant biomass [5,6], N and P are two essential macronutrients in the life history of plants, and their contents are closely related to the composition and productivity level of plant communities, while their biogeochemical processes affect nutrient cycling, ecosystem processes and functions [7,8]. At present, ecological stoichiometry has achieved many theoretical results, especially in determining limiting nutrient elements, such as the "limiting element stability hypothesis" [1,9]. Plants and soil are intricately linked and engage in a reciprocal relationship. On the one hand, the direct source of plant nutrients is the soil, as plants utilize their root systems to establish extensive contact surfaces for the exchange of substances between the plant and soil. On the other hand, soil serves as a vital ecological factor for plants, with its physicochemical characteristics significantly influencing plant growth [10].
The ability of organisms to maintain a relatively stable chemical composition in order to adapt to changes in the external environment during long-term evolution is called ecological stoichiometry homeostasis, which can reflect the physiological and biochemical adaptations of plants to environmental changes [2,11]. Leaves are important organs for plants to carry out photosynthesis, with higher and more stable contents of C, N, and P compared to other organs [12]. Studies have shown that it is the N:P values that most accurately characterize the homeostasis of the plant itself, rather than all elements [13]. Therefore, investigating the N and P content and N:P ratio of leaves helps to further understand the ecological adaptability mechanisms of plants. Researchers have carried out many studies on the ecological stoichiometric and homeostasis characteristics in soil and leaves in ecosystems. For example, researchers found that the different salt tolerance patterns led to different homeostasis characteristics in the species by studying the ecological stoichiometry homeostasis characteristics of different halophytes in the Yellow River Delta [14]. In addition to this, in the karst region, the researchers used loquat as an object to study its homeostasis, it was found that loquat could regulate its internal physiological well metabolism to adapt to the arid and barren environment of the karst desert area in the karst region [15].
In the past two decades, scientists have done a lot of research on ecological stoichiometry and stoichiometry homeostasis characteristics. However, these studies have mainly focused on the desertification and highland area [16,17], with a lack of exploration of the ecological stoichiometry and stoichiometry homeostasis characteristics of plants in the plains. In addition, previous studies on ecological stoichiometry and stoichiometry homeostasis characteristics have mainly focused on natural forest stands and grasslands [18], with a lack of studies on planted forests. Most of these studies have been carried out at the community level, with a lack of analyses of ecological stoichiometry and stoichiometry homeostasis characteristics in different forest stands [18].
The Yellow River floodplain, located between the Haihe Plain and the Huaibei Plain, is a key ecological safety barrier in China, with high primary productivity and biodiversity. However, in recent years, under the combined influence of climatic factors and human activities, soil erosion and vegetation degradation have occurred in the Yellow River floodplain, and productivity levels and stability have declined [19]. This study was conducted in Liaocheng City in the western part of Shandong Province, where many typical plantation species and plays a crucial role in maintaining regional biodiversity and ecosystem stability. Therefore, this study was carried out on the ecological stoichiometry and stoichiometry homeostasis characteristics in a mainly four forest stand types (Populus tomentosa pure forest, Platanus orientalis pure forest, Populus tomentosa-Robinia pseudoacacia mixture forests, and Salix matsudana pure forests) of Liaocheng city as the research object. The main problems we are answering were: (1) What are the stoichiometric characteristics of leaves and soil in different forest stand types? (2) Is there a leaf-soil coupling of nutrient elements in different stand types? (3) What are the limiting nutrients in the four forest stands?

2. Materials and Methods

2.1. Study Area

The study area is located in Gaotang Jiucheng Forest Farm, Guangping Forest Farm and Donge Yellow River National Park of Liaocheng City, Shandong Province, China (35°47–37°02′N, 115°16′–116°32′E) (Figure 1). The study area is the Yellow River floodplain of western Shandong, the terrain is flat, belongs to the temperate monsoon climate. The average annual temperature is about13.1℃, the frost-free period is 193-201 days, the average annual precipitation is 578.4 mm, and the annual average wind speed is 3.4 m/s. The forest stand types in the study area mainly plantation forests, and the representative tree species including Populus tomentosa, Salix matsudana, Robinia pseudoacacia, Platanus orientalis, Fraxinus chinensis and Sophora japonica.

2.2. Sample Plot Setting

In July and August 2022, the investigation in the study area showed that the main forest stand types were Populus tomentosa pure forests, Populus tomentosa-Robinia pseudoacacia mixture forests, Platanus orientalis pure forests and Salix matsudana pure forests. These four forest stand types were chosen as research objects. Firstly, 20m × 20m sample plots were established with distances and boundaries exceeding 10m. These sample plots were then numbered, including 20 Populus tomentosa pure forests, 18 Populus tomentosa-Robinia pseudoacacia mixture forests, 12 Platanus orientalis pure forests, and 18 Salix matsudana pure forests. Secondly, all plants with a diameter at breast height (DBH) above 1 cm in the sample plots were marked and labeled. Finally, the height and DBH of the marked plants were recorded (Table 1).

2.3. Samples Collection and Determination

Leaf samples were collected from six randomly selected healthy plants in each plot of pure forest stands, and from three healthy plants (spaced >10 m apart) of each of the two species in mixed forest stands, using high pruning shears. Five to ten mature and healthy leaves were collected from the upper and middle parts of each plant in four directions. The leaves were placed in a plastic bag and brought to the laboratory for drying and pulverizing. Subsequently, they were sieved through a 12mm sieve and stored in a sealed bag for temporary preservation.
Soil samples were collected using a five-point sampling method, from the four corners and center of the 1m × 1m small sample squares in each plot. We removed the surface layer of the apoptosis and collected 0 ~ 10 cm soil samples with shovels. The soil samples were mixed evenly in a sealed bag and brought to the laboratory for impurity removal, drying, crushing, and temporary preservation in a sealed bag after 2mm sieving.
The organic C content of leaves and soil was determined by oxidizing organic matter with a certain concentration of K2Cr2O7-H2SO4 solution under external heating conditions. Leaf and soil samples were treated by adding H2SO4 and then the N content was measured using a Kjeldahl analyzer (KDY-9820). The total P concentration in plants was digested with H2SO4-H2O2, while the soil was fused with NaOH and colored with molybdenum-antimony reagent, and then determined using an ultraviolet spectrophotometer (UV-5900, SHANGHAI METASH INSTRUMENTS CO., LTD.) [20].

2.4. Data Analysis

The homeostasis index (H) is determined through the following calculation method, the homeostasis model equation:
y   =   c x 1 / H
For easy understanding and calculation, equation (1) can be log-transformed to linear form:
lg y   =   lg c   +   1 H lg x
In equation (2), where y is the content of leaf N and P or N:P ratio, x is the corresponding N and P content or N:P ratio of the soil, C is a constant; and H is the homeostasis index. When H < 0, H = -H. The magnitude of the H value is positively correlated with the plant′s homeostasis, a larger H value indicates a higher level of stability in the plant. If the regression relationship between lgy and lgx is not significant (P>0.1), then the plant is considered to be "absolutely stable". If the regression relationship is significant, the data sets with H > 0 were defined as follows: H < 0.75 were sensitive, 0.75 < H < 2 were weakly sensitive, 2 < H < 4 were weakly homeostatic, and H > 4 were homeostatic [19].
Leaf C, N, P and C:N:P ratios of the four forest stands were analyzed using one-way ANOVA (one-way analysis of variance); while C, N, P and C:N:P ratios of the soil were analyzed using descriptive statistics. The correlations between leaf-soil C, N, P and C:N:P ratios in four forest stand types were analyzed using Pearson correlation analysis. The homeostasis of the forest stand was analyzed by one-way linear regression. By utilizing soil C, N, P content as the dependent variable, a multiple stepwise regression analysis will be performed with environmental factors as independent variables to identify the primary environmental factors impacting soil C, N, P content. All statistical analyses were conducted in R 4.2.2.

3. Results

3.1. C, N, P and C:N:P Ratios in Leaves

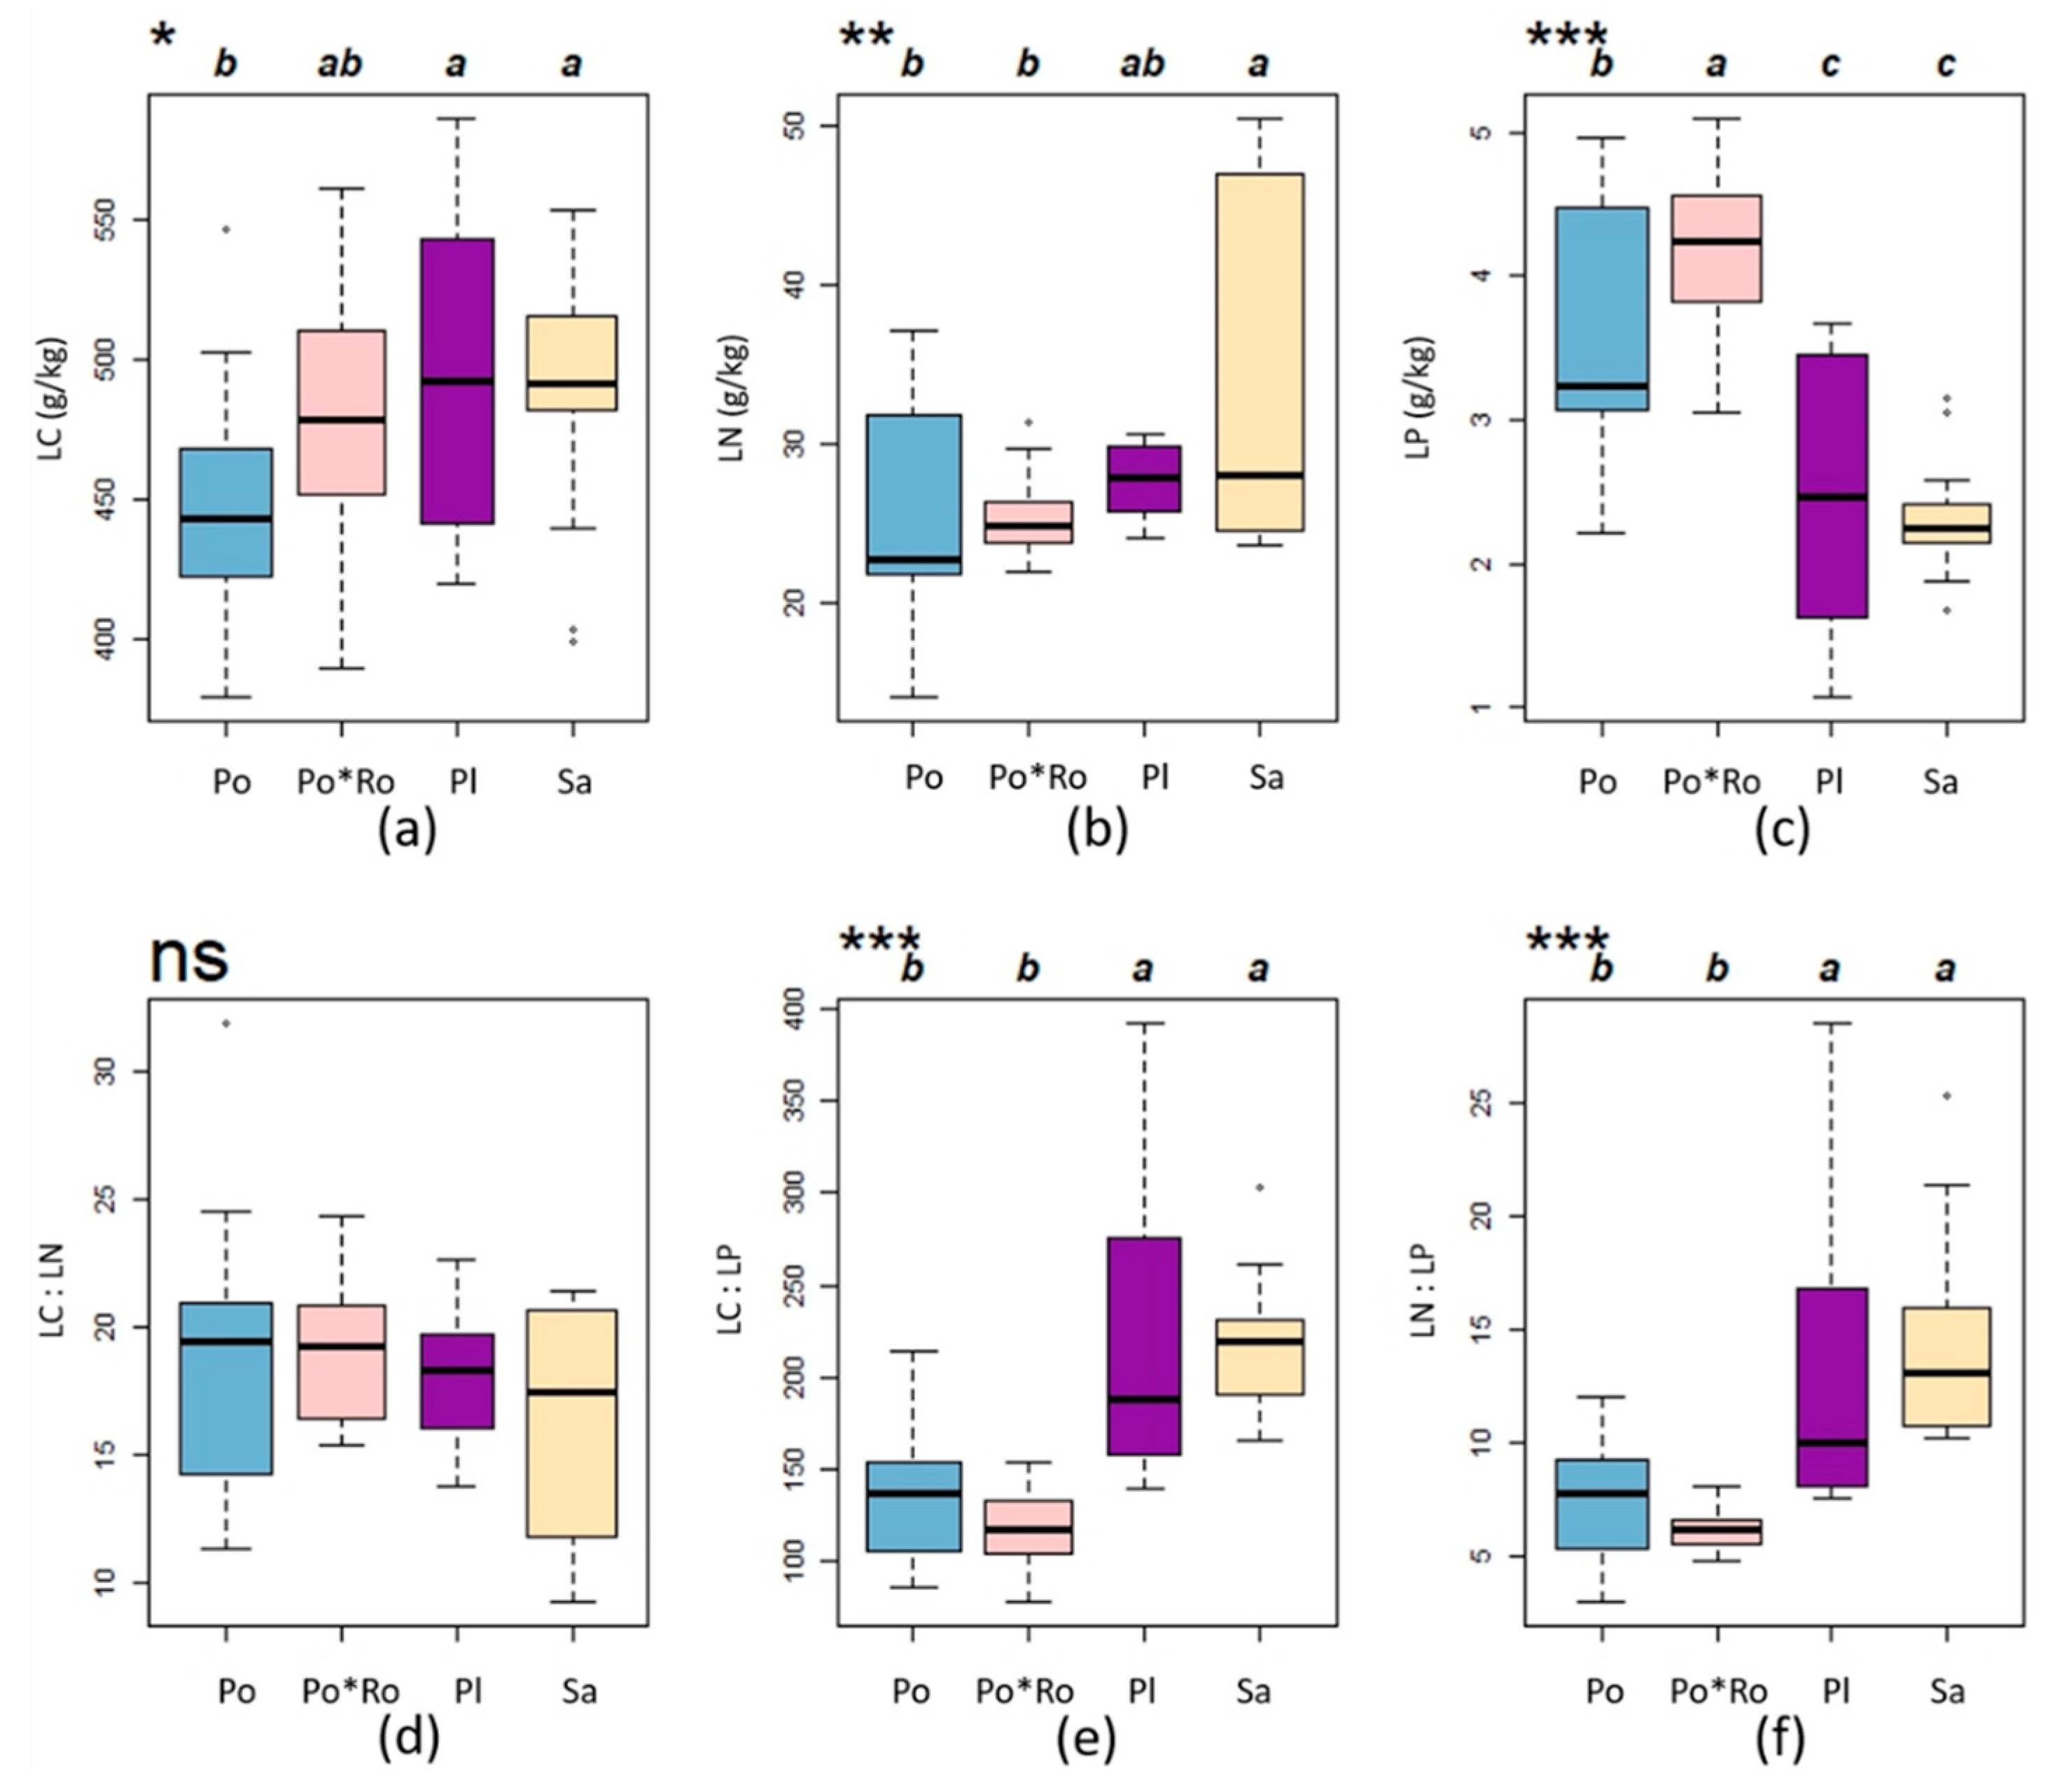
The C content varied significantly among different forest stand types (P < 0.05), with the C contents of leaves ranked in the following order: Pl > Sa > Po*Ro > Po (Figure 2a). There is a very significant difference in the N content of the leaves among the four forest stand types (P < 0.01), with the N contents of leaves ranked in the following order: Sa > Pl > Po*Ro > Po (Figure 2b). Furthermore, there is an extremely significant difference in the P content among the four forest stand types (P < 0.001), with the P contents of leaves ranked in the order: Po*Ro > Po > Pl > Sa (Figure 2c). Additionally, a comparison reveals that the Populus tomentosa-Robinia pseudoacacia mixture forests has slightly higher C, N, and P content than the Populus tomentosa pure forests (Figure 2).
There is no significant difference in the C:N ratios in the leaves among the four forest stand types (P>0.1) (Figure 2d). There is an extremely significant difference in the C:P ratios and N:P ratios among the four forest stand types (P < 0.001). Another key point to remember is that the C:P ratios and N:P ratios of Platanus orientalis pure forests and Salix matsudana pure forests in leaves were significantly higher than those in leaves of the other forest stand types (Figure 2e,f).

3.2. C, N, P and C:N:P Ratios in Soil

The C, N and P contents of the soil exhibited highly significant variations across the four forest stand types. Specifically, in the Platanus orientalis pure forests, the mean values of soil C and N contents were significantly lower than in the other forest stand types, for 1.78 ± 0.78 g/kg and 0.58 ± 0.08 g/kg, respectively. The N contents of the soil showed very significant variations across the four forest stand types, while the C and N contents of soil ranked in the following order: Sa > Po*Ro > Po > Pl. The P contents in the soil of the Populus tomentosa pure forests were similar to that of the Populus tomentosa-Robinia pseudoacacia mixture forests, yet both were lower compared to the other two forest stand types (Table 2).
The C:N ratio showed very significant differences among the four forest stand types, while the C:P and N:P of the soils of the four forest stand types showed extremely significant differences. Additionally, the ranking of C:P and N:P ratios for the four types of forest stands is Po*Ro > Po > Sa > Pl, and the ranking of C:N:P ratios for the four types of forest stands is Sa > Po*Ro > Po > Pl (Table 2).

3.3. Stoichiometric Relationships within the Leaf–Soil Continuum

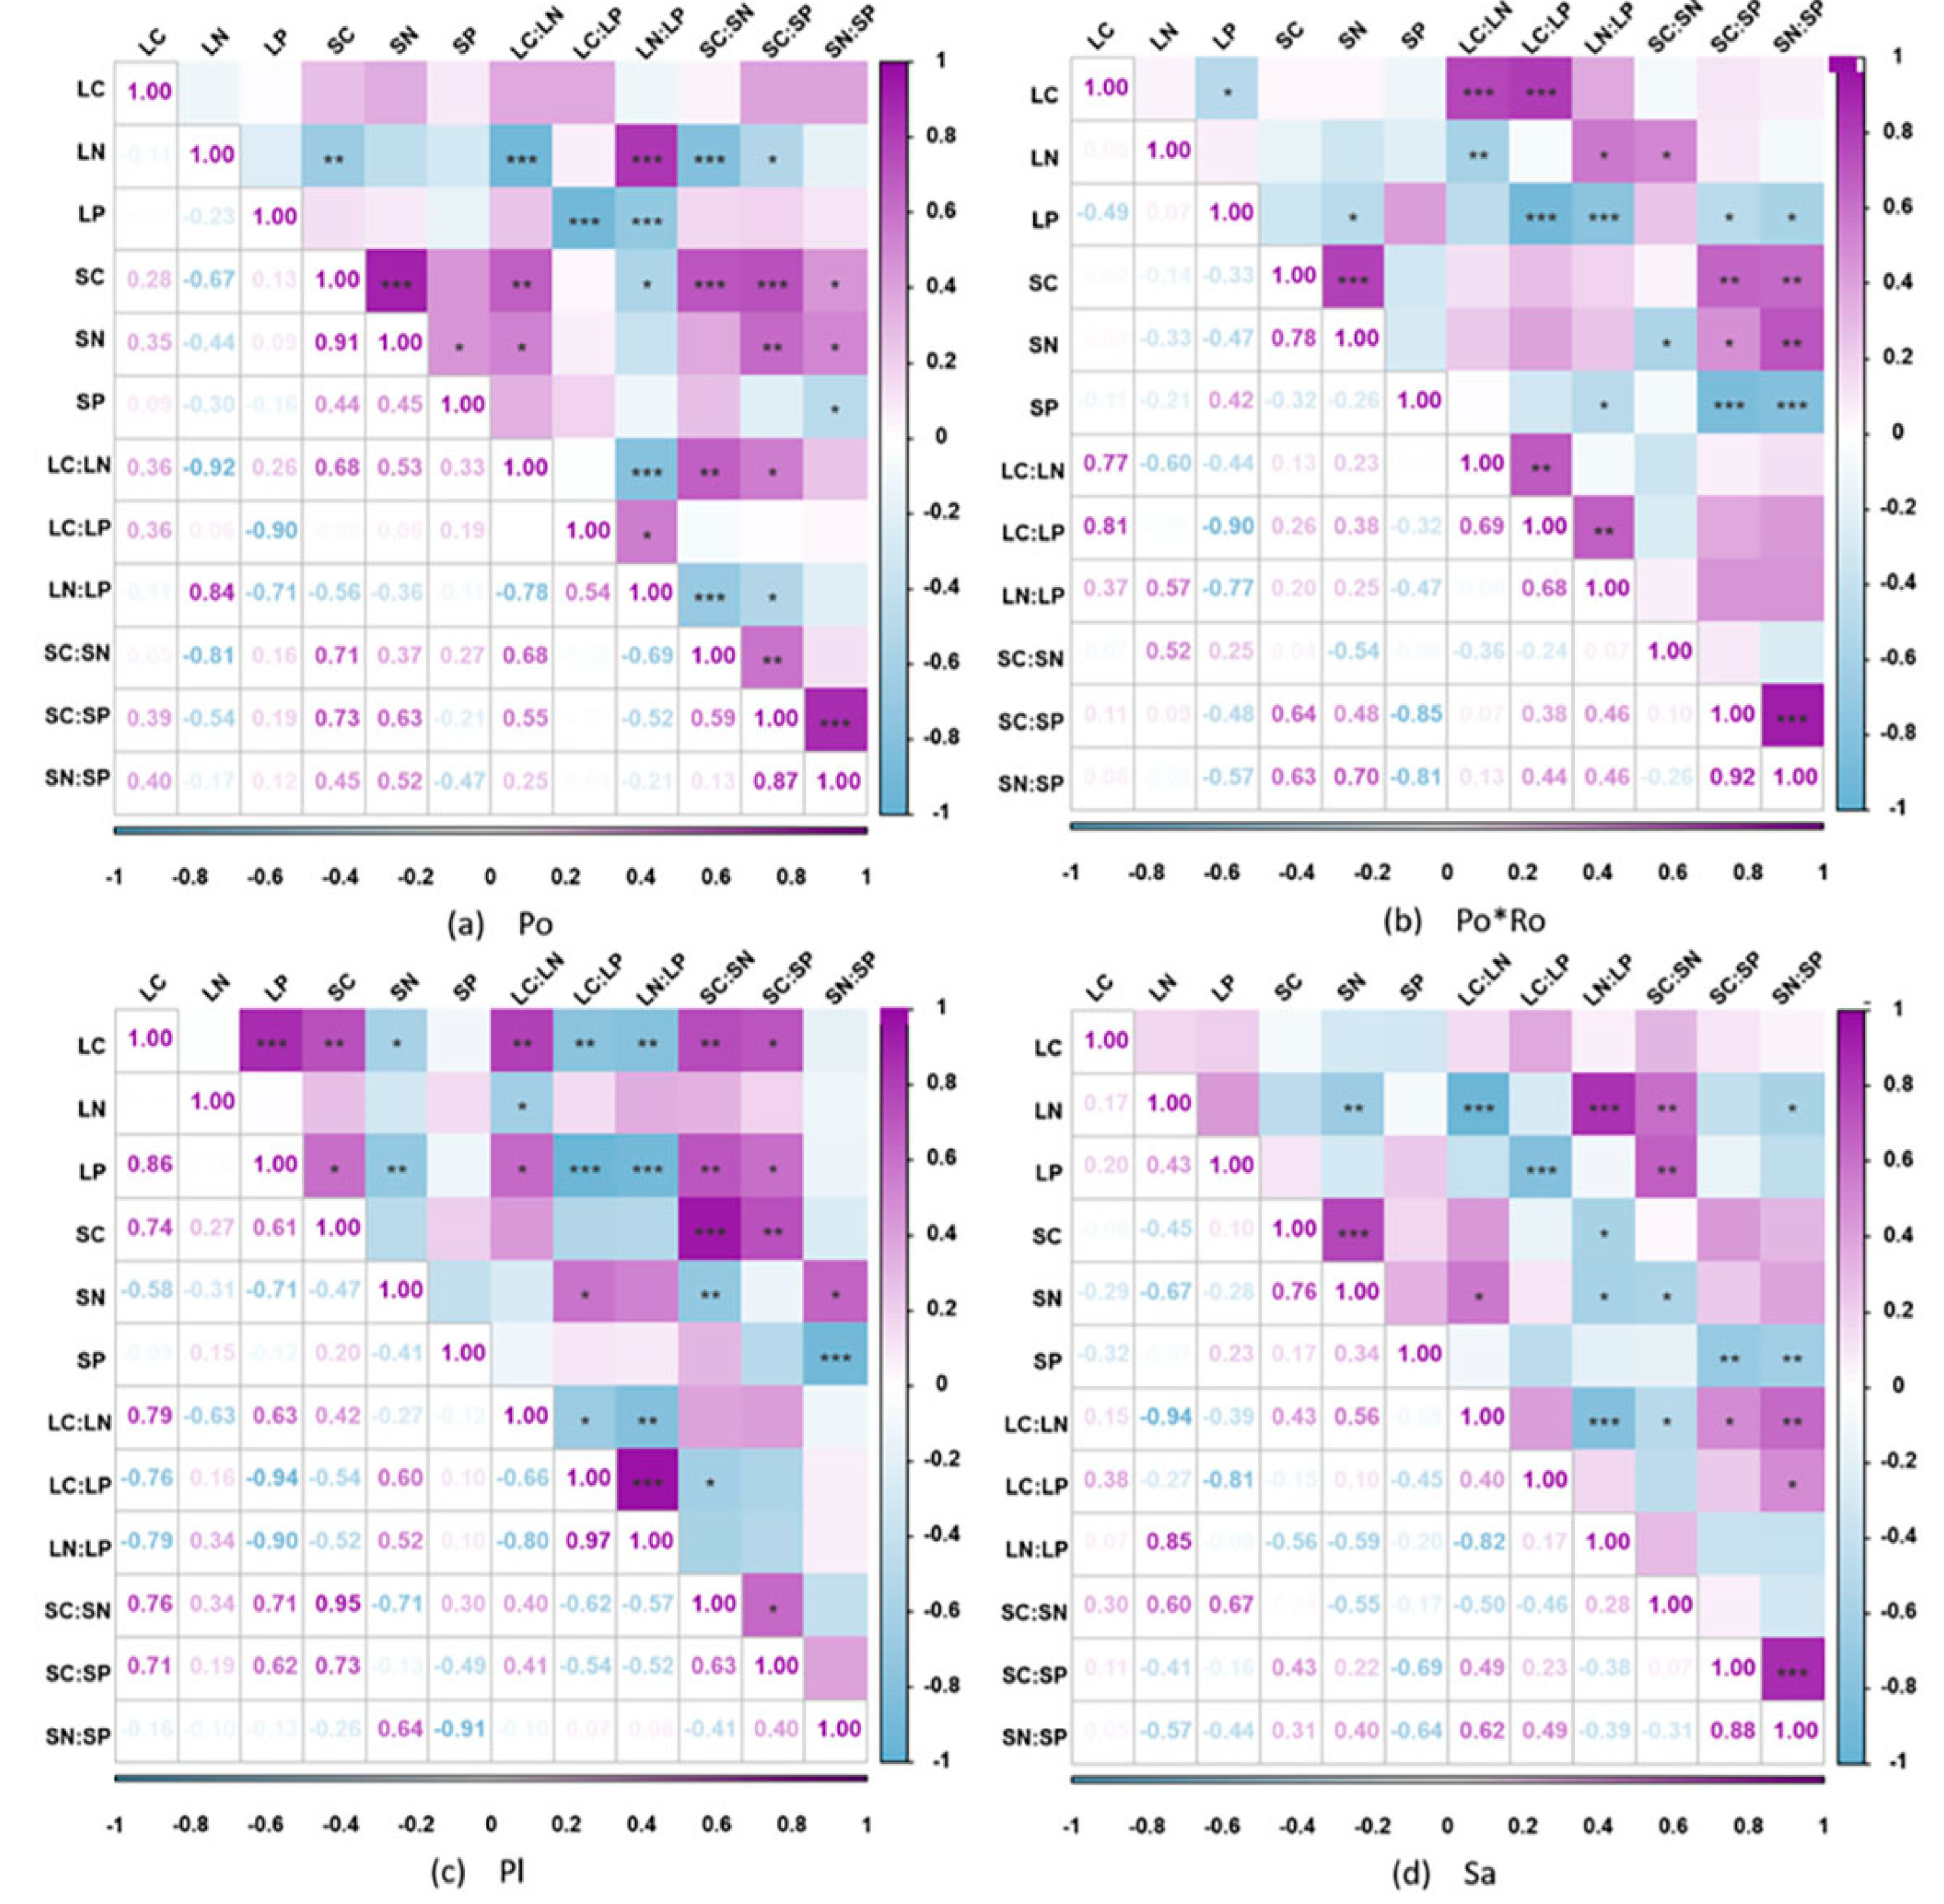
In general, apart from the Platanus orientalis pure forests, the other three forest stand types exhibited a strong positive correlation between soil C to soil P ratio (SC:SP) and soil N to soil P ratio (SN:SP). Additionally, there was an extremely significant positive correlation between soil C (SC) and soil N (SN), while leaf N (LN) showed a significantly strong negative correlation with leaf C to leaf N ratio (LC:LN), as well as with leaf P (LP) and leaf C to leaf P ratio (LC:LP). Examining each forest stand type individually based on the correlation analysis results, it was evident that in the Populus tomentosa pure forests, there was a highly significant negative correlation between leaf N (LN) and soil C to soil N ratio (SC:SN), and a positive correlation between leaf C to leaf N ratio (LC:LN) and soil C to soil N ratio (SC:SN). There is a negative correlation of LP with SC:SP and SN:SP in Populus tomentosa-Robinia pseudoacacia mixture forest. In the Platanus orientalis pure stand, LC showed highly significant positive correlations with SC and SC:SN, and positive correlations with SC:SP. In the Salix matsudana pure forests, there is an extremely significant negative correlation between LN and SN, but a highly significant positive correlation between LN and SC:SN (Figure 3).

3.4. Homeostasis Analysis of Leaf N, P and N:P Ratios

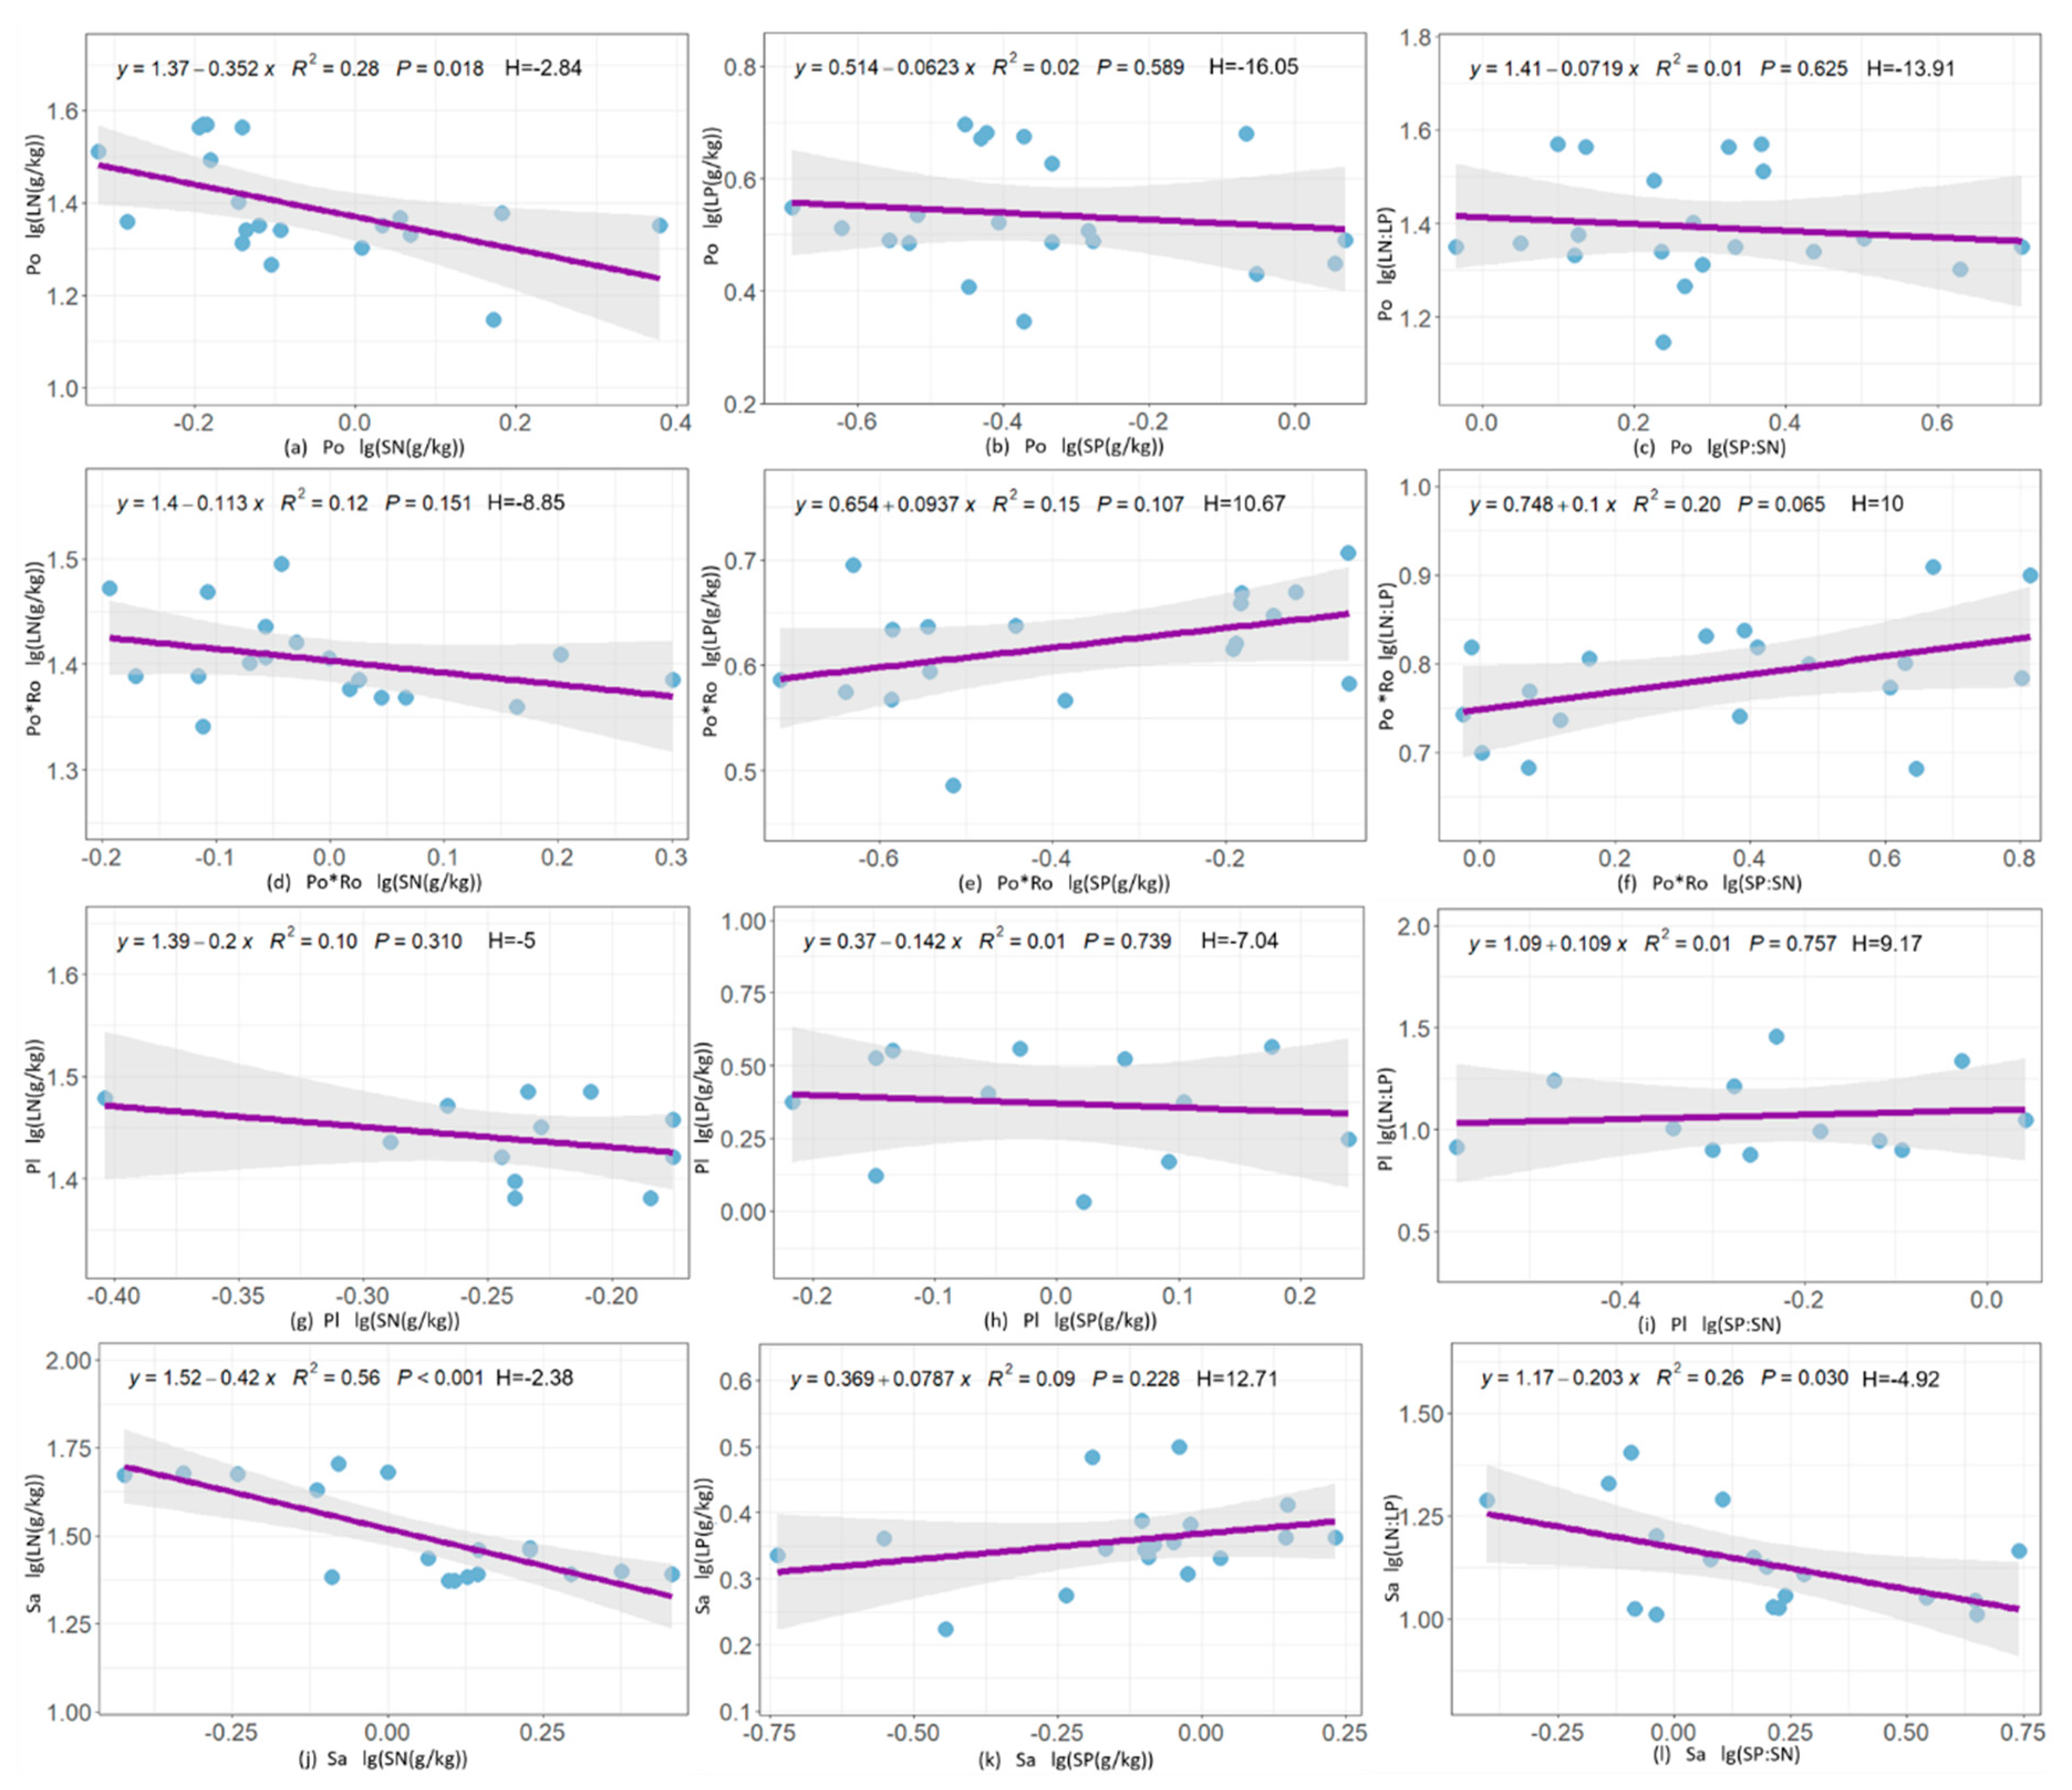
The homeostasis characteristics were different in leaf N, P and N:P of different forest stands. The N of Populus tomentosa pure forests and Salix matsudana pure forests had weak homeostasis with H values of -2.84 and -2.38, respectively (Figure 4a,j). The N:P of Populus tomentosa-Robinia pseudoacacia mixture forests and Salix matsudana pure forests belonged to the homeostasis with H values of 10 and -4.92, respectively (Figure 4f,i). Except for the ones mentioned above, the rest are not significant (P > 0.1) in stoichiometry and belong to belong to the absolute steady state (Figure 4).

4. Discussion

4.1. C, N, P and C:N:P Ratios of Leaf and Soil among Different Forest Stand Types

Except for Populus tomentosa pure forests (455.63 g/kg), the leaf C content of other forest stand types is higher than that of 492 species of terrestrial plants worldwide (464 g/kg) [21]. The leaf N and P contents of the four forest stand types are higher than the global scale N and P contents (20. 60 and 1. 99 g/kg), the national scale N and P contents (18. 6 and 1. 21 g/kg) [3]. However, through comparison, it was found that the N content in Platanus orientalis pure forests and Salix matsudana pure forests leaves is significantly higher than in other forest stand types. This may be due to the higher precipitation in this region compared to other area, and Li [22] found that there is a positive correlation between leaf N content and precipitation through research. The large surface area of Platanus orientalis requires more N synthase for photosynthesis, which may also be a contributing factor to the high N content of Platanus orientalis pure stands′ leaves. In contrast to N, the concentration of P in leaves exhibited a decline as precipitation levels increased [22]. Consequently, the Platanus orientalis pure forests and Salix matsudana pure forests displayed lower P content in their leaves compared to the other two forest stands. Additionally, by comparing Populus tomentosa pure forests with Populus tomentosa-Robinia pseudoacacia mixture forests, it was found that the C, N, and P contents of the leaves in the Populus tomentosa-Robinia pseudoacacia mixture forests are higher than those in the Populus tomentosa pure forests. This phenomenon may be because forest stands composed of multiple species are more effective at utilizing environmental resources than forest stands composed of a single species.
Leaf C:N and C:P ratios represent the nutrient use efficiency and C assimilation capacity of plants. Research shows that the C:N and C:P ratios of leaves are inversely proportional to the efficiency of plants in utilizing N and P [23]. The N:P ratio serves as a metric for evaluating the extent to which a forest stand may be constrained by the availability of N and P elements (N:P < 14 indicates that the plant is limited by N supply, while N:P > 16 indicates a limitation in P supply. When 14 < N:P <16, it signifies that plants are restricted by both N and P availability) [9]. Among the four forest stand types in this study, Populus tomentosa pure forests, Populus tomentosa-Robinia pseudoacacia mixture forests and Platanus orientalis pure forests mainly exist N limitation, and Salix matsudana pure forests are limited by both N and P elements. After comprehensive consideration, it is believed that the different tree species and environmental are the primary driving factors causing this difference [17]. This answers the characterization and differences of C, N, P and C:N:P ratios in the leaves of different stand types, as well as the limiting elements of different stands.
This study indicates that the average soil C, N and P contents of the four vegetation groups were 4.58 g/kg, 0.96 g/kg and 0.68g/kg, respectively. This corresponds with the results reported by Zhao Fang in the Loess Plateau [24]. Interestingly, the soil C and N content of the Platanus orientalis pure forests was particularly low, at 1.78 g/kg and 0.58 g/kg, respectively. This large difference can be ascribed to the varied soil properties and herbaceous cover [25] (Table 1), smaller herbaceous cover of Platanus orientalis pure forests in the study area resulting in low soil C content in the forest stand. Although the C and N contents in Platanus orientalis pure forests are low, the P content is notably high, reaching 1.04 g/kg. Litter and rock weathering are the main sources of soil P [26]. During the sample collection, we observed a thick layer of litter accumulating on the ground surface in the Platanus orientalis pure forests. Thus, a large litter accumulation could be responsible for higher P content in this region. Although the total phosphorus content in the soil was not deficient, the alkaline nature of the soil in the Platanus orientalis pure forests (pH ≈ 7.9) created limitations on phosphorus availability. The alkaline conditions make phosphorus highly prone to soil fixation, resulting in reduced phosphorus activity and effective phosphorus content that can be utilized by trees for growth and development [15].
Soil C:N ratio usually reflects the mineralization ability and quality level of soil C and N, which is inversely proportional to the decomposition rate of organic matter and soil mineralization [27], there was a significant difference in the soil C:N ratios among different forest stand types (P < 0.01). C:P ratio can reflect the effectiveness of P element and also measure the potential of microorganisms to release and fix P elements [28]. The average soil C:N ratio, C:P ratio, and N:P ratio were calculated as 4.68, 9.16, and 1.63, respectively, all lower than the national levels [29]. This demonstrates the high rate of soil organic matter decomposition and the high potential for retaining P in the study field soil, and this phenomenon is more obvious in the Platanus orientalis forest stands. The primary factor contributing to this occurrence is the comparatively lower levels of soil carbon and nitrogen in relation to national averages, while soil p levels are higher than national levels. This answers the stoichiometric characteristics of leaf and soil in different forest stand types.

4.2. Correlation Analysis of C, N, P and C:N:P Ratios in Leaf–Soil of Four Forest Stand Types

The processes of C, N and P cycling between plants and soils are fundamental components of ecosystems, and their correlation greatly impacts vegetation succession [27]. Numerous research investigations have demonstrated a strong correlation between the C, N, and P in both soil compositions and in plants [28,30]. In the four forest stands we examined, there was no correlation between soil P and leaf P, which is in agreement with previous studies [31]. This phenomenon could be attributed to the diminished presence of P generated through microbial decomposition in the soil, and hindering its reabsorption by plants. Consequently, a lack of association between leaf P levels and soil P content is observed [32]. In Populus tomentosa pure forests, there was a positive correlation between LC:LN and SC:SN, which indicated that soil C and N mainly originated from leaves, thus leading to a better correlation between leaves and soil. There was a notable positive relationship between SC and LC in Platanus orientalis pure forests, this suggests that the C in the soil significantly impacts the absorption of nutrients by plants, and the processes of C cycling within the leaf-soil system mutually affect each other. There was a negative correlation between LN and SN, SN:SP in Salix matsudana pure stands, the main reason for this phenomenon is that before the leaves fall, they fail to transfer nutrients to living organisms or less transfer, resulting in a large amount of N being retained in the litter. However, due to the close proximity of the Salix matsudana pure stands to the Yellow River, the soil moisture content (SWC ≈ 0.214%) is higher than the other three forest stands (SWC ≈ 0.123%), leading to the N in the litter being rapidly decomposed and returned to the soil. Various environmental factors play a crucial role in influencing the conversion and transformation of nutrients between plants and soil [33]. Hence, it is probable that environmental factors play a role in influencing nutrient elements that do not exhibit significant correlations in the leaf-soil cycling mechanisms across the four forest stands. This answers the second question we raised.

4.3. Evaluation of Plant Homeostasis

Plants are able to keep a consistent balance of nutrients by regulating their internal stability, which helps them maintain ideal growth levels and adjust to variations in external conditions like soil nutrients [19,34]. It was found that plants with higher homeostasis tend to use nutrients in a more conservative way, allowing them to maintain slow growth even in poor environments, while plants with lower homeostasis exhibit stronger adaptability to the environment [19].The analysis of homeostasis shows that the P of the four forest stands were in an absolutely stable state, and in general, the N, P and N:P ratios of the four forest stands were in a stable state. According to the stability hypothesis of limiting nutrient elements [35], limiting elements have higher homeostasis in plants. Although plant growth in our study area is limited by N and P, it is more strongly limited by P elements. This consistent with the nutrient content characteristics of plants in the Yellow Flood Plain. In addition, among the four forest stands, the N, P and N:P ratios of Platanus orientalis pure forests were in an absolutely stable state, indicating that Platanus orientalis pure forests have higher stability and dominance [13]. On the other hand, the N of Populus tomentosa pure forests and Salix matsudana pure forests are more adaptable to environmental changes. This identifies the limiting nutrients of the four forest stands.

5. Conclusion

Our results reveal significant differences in leaf N and P contents and soil C, N and P contents in different forest stands in this region. We revealed that P is a limiting factor for all four forest types through an examination of the N:P ratio and the homeostasis of the forest stands, despite the relatively high P contents in the soils of the four forest types. In addition to P, four forest stands are also limited by N. Therefore, in future plantation management, appropriate P fertilizer or and N fertilizer should be considered to improve the situation of P and N limitation for plant growth. Furthermore, our results demonstrate that LP and SP did not show significant correlation in any of the four forest stands, LC:LN was positively correlated with SC:SN in the Populus tomentosa pure forests, LC was positively correlated with SC in the Platanus orientalis pure forests, and LN was significantly negatively correlated with SN and SN:SP in the Salix matsudana pure forests. Due to this study only covering leaf-soil stoichiometric characteristics of the forest stands, further research on the stoichiometry characteristics of litter is lacking. Further studies should add stoichiometry characteristics of litter in the future to reveal the plantations C, N and P, and its stoichiometric relationships in the leaf–soil–litter system, in order to provide theoretical guidance for the vegetation restoration of the degraded ecosystems in the in the Yellow River floodplain of western Shandong.

Author Contributions

Xinghui Lu conceived the idea and planned the research and designed the experiments. Material preparation, data collection and analysis were performed by Huiran Liu. The first draft of the manuscript was written by Huiran Liu. All authors read and approved the final manuscript.

Funding

This work was supported by grants from the Key Research and Development Program of Liaocheng city (No. 2021GY01), the National Natural Science Foundation of China (No. 31901210), The Open Project of Liaocheng Universtiy Landscape Architecture Discipline (No. 31946221214), and the Doctoral Startup Fund of Liaocheng University (No. 318051822).

Acknowledgments

We would like to thank Xijun Guo, Guimin Zhang, and Haixiang Shi for assistance with selecting sample plot.

Conflicts of Interest

The authors have no relevant financial or non-financial interests to disclose.

References

  1. Elser, J.; Hamilton, A. Stoichiometry and the New Biology: The Future Is Now. Plos Biol 2007, 5, 181-183, https://doi.org/10.1371/journal.pbio.0050181. [CrossRef]
  2. Robert W Sterner; James J Elser. Ecological Stoichiometry: The Biology of Elements from Molecules to the Biosphere. Princeton: Princeton University Press 2003, https://doi.org/10.1515/9781400885695. [CrossRef]
  3. Wenxuan Han; Jingyun Fang; Dali Guo; Zhang, Y. Leaf nitrogen and phosphorus stoichiometry across 753 terrestrial plant species in China. New Phytol 2005, 168, 377-385, https://doi.org/10.1111/j.1469-8137.2005.01530.x. [CrossRef]
  4. J Sardans; Ivan A Janssens; Philippe Ciais; Michael Obersteiner; J Peñuelas. Recent advances and future research in ecological stoichiometry. Perspect Plant Ecol 2021, 50, 125611, https://doi.org/10.1016/j.ppees.2021.125611. [CrossRef]
  5. John D. Schade; Marcia Kyle; S. E. Hobbie; W. F. Fagan; J. J. Elser. Stoichiometric tracking of soil nutrients by a desert insect herbivore. Ecol Lett 2003, 6, 96-101, https://doi.org/10.1046/j.1461-0248.2003.00409.x. [CrossRef]
  6. Zhang, C.; Zeng, F.; Zeng, Z.; Du, H.; Zhang, L.; Su, L.; Lu, M.; Zhang, H. Carbon, Nitrogen and Phosphorus Stoichiometry and Its Influencing Factors in Karst Primary Forest. Forests 2022, 13, 1990, 10.3390/f13121990. [CrossRef]
  7. Peter B Reich; Mark G. Tjoelker; Jose-Luis Machado; Jacek Oleksyn. Universal scaling of respiratory metabolism, size and nitrogen in plants. Nature 2006, 439, 457-461, https://doi.org/10.1038/nature04282. [CrossRef]
  8. Peter B. Reich. Global biogeography of plant chemistry: filling in the blanks. New Phytol 2005, 168, 263-266, https://doi.org/10.1111/j.1469-8137.2005.01562.x. [CrossRef]
  9. Jack T. Tessier; Dudley J. Raynal. Use of Nitrogen to Phosphorus Ratios in Plant Tissue as an Indicator of Nutrient Limitation and Nitrogen Saturation. J. Appl Ecol 2003, 40, 523-534, https://doi.org/10.1046/j.1365-2664.2003.00820.x. [CrossRef]
  10. L. A. Schreeg; L. S. Santiago; S. J. Wright; B. L. Turner. Stem, root, and older leaf N:P ratios are more responsive indicators of soil nutrient availability than new foliage. Ecology 2014, 95, 2062-2068, https://doi.org/10.1890/13-1671.1. [CrossRef]
  11. Hessen, D. O.; Gren, G. R. I.; Anderson, T. R.; Elser, J. J.; De Ruiter, P. C. CARBON SEQUESTRATION IN ECOSYSTEMS: THE ROLE OF STOICHIOMETRY. Ecology 2004, 85, 1179-1192, https://doi.org/10.1890/02-0251. [CrossRef]
  12. V. Minden; M. Kleyer. Internal and external regulation of plant organ stoichiometry. Plant Biology (Stuttgart, Germany) 2014, 16, 897-907, https://doi.org/10.1111/plb.12155. [CrossRef]
  13. Tingting Zhang; Wenyao Liu; Junbiao Huang; Tao Hu; Dandan, T.; Quan, C. Characteristics of plant ecological stoichiometry homeostasis. Guihaia 2019, 39, 701-712, https://doi.org/10.11931/guihaia.gxzw201805050. [CrossRef]
  14. Yinghan Zhao; Tian Li; Jingkuan Sun; Junhan Liu; Zhanyong Fu. Study on ecological stoichiometry homeostasis characteristics of different halophytes in the Yellow River Delta. Land Degrad Dev 2024, 35, 784-797, https://doi.org/10.1002/ldr.4952. [CrossRef]
  15. Tinghui Hu; Kangning Xiong; Yanghua Yu; Jun Wang; Yawei Wu. Ecological stoichiometry and homeostasis characteristics of plant-litter-soil system with vegetation restoration of the karst desertification control. Front. Plant Sci. 2023, 14, https://doi.org/10.3389/fpls.2023.1224691. [CrossRef]
  16. Ifigenia Urbina; Oriol Grau; Jordi Sardans; Josep M. Ninot; Josep Peñuelas. Encroachment of shrubs into subalpine grasslands in the Pyrenees changes the plant-soil stoichiometry spectrum. Plant Soil 2020, 448, 37-53, https://doi.org/10.1007/s11104-019-04420-3. [CrossRef]
  17. Jianguo Liu; Xiaohua Gou; Fang Wang; Jie Liu; Fen Zhang. Seasonal patterns in the leaf C:N:P stoichiometry of four conifers on the northeastern Tibetan Plateau. Glob. Ecol. Conserv. 2023, 47, e2632, https://doi.org/10.1016/j.gecco.2023.e02632. [CrossRef]
  18. Lei Wang; Muhammad Arif; Jie Zheng; Changxiao Li. Patterns and drivers of plant carbon, nitrogen, and phosphorus stoichiometry in a novel riparian ecosystem. Front. Plant Sci. 2024, 15, https://doi.org/10.3389/fpls.2024.1354222. [CrossRef]
  19. Jonas Persson; Patrick Fink; Akira Goto; James M. Hood; Jayne Jonas; Satoshi Kato. To be or not to be what you eat: regulation of stoichiometric homeostasis among autotrophs and heterotrophs. Oikos 2010, 119, 741-751, https://doi.org/10.1111/j.1600-0706.2009.18545.x. [CrossRef]
  20. Yanli Zhang; Miao Liu; Li Han; Jinhu Yang; Xinyao Zhao; Jiahui Qu; Lijun Li; Yunlong Bai; Dong Yan; Guannan Hou. Spatial Distribution Characteristics of Soil C:N:P:K Eco-Stoichiometry of Farmland and Grassland in the Agro-Pastoral Ecotone in Inner Mongolia, China. Agronomy 2024, 14, 346, https://doi.org/10.20944/preprints202312.2080.v1. [CrossRef]
  21. James J. Elser; William F. Fagan; Robert F. Denno; Dean R. Dobberfuhl; Ayoola Folarin; Andrea Huberty; Sebastian Interlandi; Susan S. Kilham; Edward Mccauley; Kimberly L Schulz; Evan H. Siemann; ROobert W. Sterner. Nutritional constraints in terrestrial and freshwater food webs. Nature 2000, 408, 578-580, https://doi.org/10.1038/35046058. [CrossRef]
  22. Jiaxiang Li; Wenting Xu; Gaoming Xiong; Yang Wang; Changming Zhao. Leaf nitrogen and phosphorus concentration and the empirical regulations in dominant woody plants of shrublands across southern China. Chin J Plant Ecol 2017, 41, 31-42, https://doi.org/10.17521/cjpe.2016.0251. [CrossRef]
  23. Yuzhuo Hao; Lei Zhou; Hui Wu; Shuli Wang. Comparison of ecological stoichiometric characteristics of leaf-litter-soil in four types of Fraxinus mandshurica plantations. J. Nanjing Forestry Uni. 2019, 43, 101-108, https://doi.org/10.3969/j.issn.1000-2006.201806021. [CrossRef]
  24. Fang Zhao; Dongdong Li; Feng Jiao; Jing Yao; Haotian Du. The Latitudinal Patterns of Leaf and Soil C:N:P Stoichiometry in the Loess Plateau of China. Front. Plant Sci. 2019, 10, 10.3389/fpls.2019.00085. [CrossRef]
  25. Xiaolin Feng; Yuyang Yan; Xinran Zhang; Chutian Zhang; Zengchao Geng; Feinan Hu; Chenyang Xu. Temporal and Spatial Variations of Soil Organic Carbon and the Influencing Factors in Shanxi Province in Recent 30 Years. Environ Sci 2024, https://doi.org/10.13227/j.hjkx.202311169. [CrossRef]
  26. Javier De La Casa; Jordi Sardans; Marta Galindo; Josep Peñuelas. Stoichiometry of litter decomposition under the effects of climate change and nutrient enrichment: A meta-analysis. Plant Soil 2024, https://doi.org/10.1007/s11104-024-06718-3. [CrossRef]
  27. Luca Bragazza; Mario Fontana; Thomas Guillaume; Kate M. Scow; Sokrat Sinaj. Nutrient stoichiometry of a plant-microbe-soil system in response to cover crop species and soil type. Plant Soil 2021, 461, 517-531, https://doi.org/10.1007/s11104-021-04853-9. [CrossRef]
  28. J. Sardans; A. Rivas-Ubach; J. Peñuelas. The C:N:P stoichiometry of organisms and ecosystems in a changing world: A review and perspectives. Perspect Plant Ecol 2012, 14, 33-47, https://doi.org/10.1016/j.ppees.2011.08.002. [CrossRef]
  29. Hanqin Tian; Guangsheng Chen; Chi Zhang; Jerry M Melillo; Charles A S Hall. Pattern and variation of C:N:P ratios in China′s soils: a synthesis of observational data. Biogeochemistry 2010, 98, 139-151, https://doi.org/10.1007/s10533-009-9382-0. [CrossRef]
  30. Ford Ballantyne IV; Duncan NL Menge; Annette Ostling; Parviez Hosseini. Nutrient recycling affects autotroph and ecosystem stoichiometry. The American Naturalist 2008, 171, 511-523, https://doi.org/10.1086/528967. [CrossRef]
  31. Qijuan Hu; Maoyin Sheng; Yixin Bai; Yin Jie; Hailong Xiao. Response of C, N, and P stoichiometry characteristics of Broussonetia papyrifera to altitude gradients and soil nutrients in the karst rocky ecosystem, SW China. Plant Soil 2022, 475, 123-136, https://doi.org/10.1007/s11104-020-04742-7. [CrossRef]
  32. Shaojie Zheng; Xiaofei Cha; Lijuan Sun; Huanxian Guo; Qize Zhao; Xinglan Wei; Yuanyou Wang; Qiong Dong. Study on the Characteristics of Soil Ecological Stoichiometry and Non-Structural Carbon in Different Forest Ages of Fraxinus malacophylla. J. Nucl. Agric. Sci. 2024, 38, 364-373, https://doi.org/10.11869/j.issn.1000-8551.2024.02.0364. [CrossRef]
  33. Lei JING; Yan ZHOU; Cai LV; Junru ZHAO; Guangchun LEI. Characterization of the soil and leaf C, N, and P stoichiometry of poplar plantations of three different stand ages in Dongting Lake wetland, China. Perspect Plant Ecol 2018, 38, 6530-6538, 10.5846/stxb201803300691. [CrossRef]
  34. Marie Spohn. Element cycling as driven by stoichiometric homeostasis of soil microorganisms. Basic Appl Ecol 2016, 17, 471-478, https://doi.org/10.1016/j.baae.2016.05.003. [CrossRef]
  35. W X Han; J Y Fang; P B Reich; F Ian Woodward; Z H Wang. Biogeography and variability of eleven mineral elements in plant leaves across gradients of climate, soil and plant functional type in China. Ecol Lett 2011, 14, 788-796, https://doi.org/10.1111/j.1461-0248.2011.01641.x. [CrossRef]
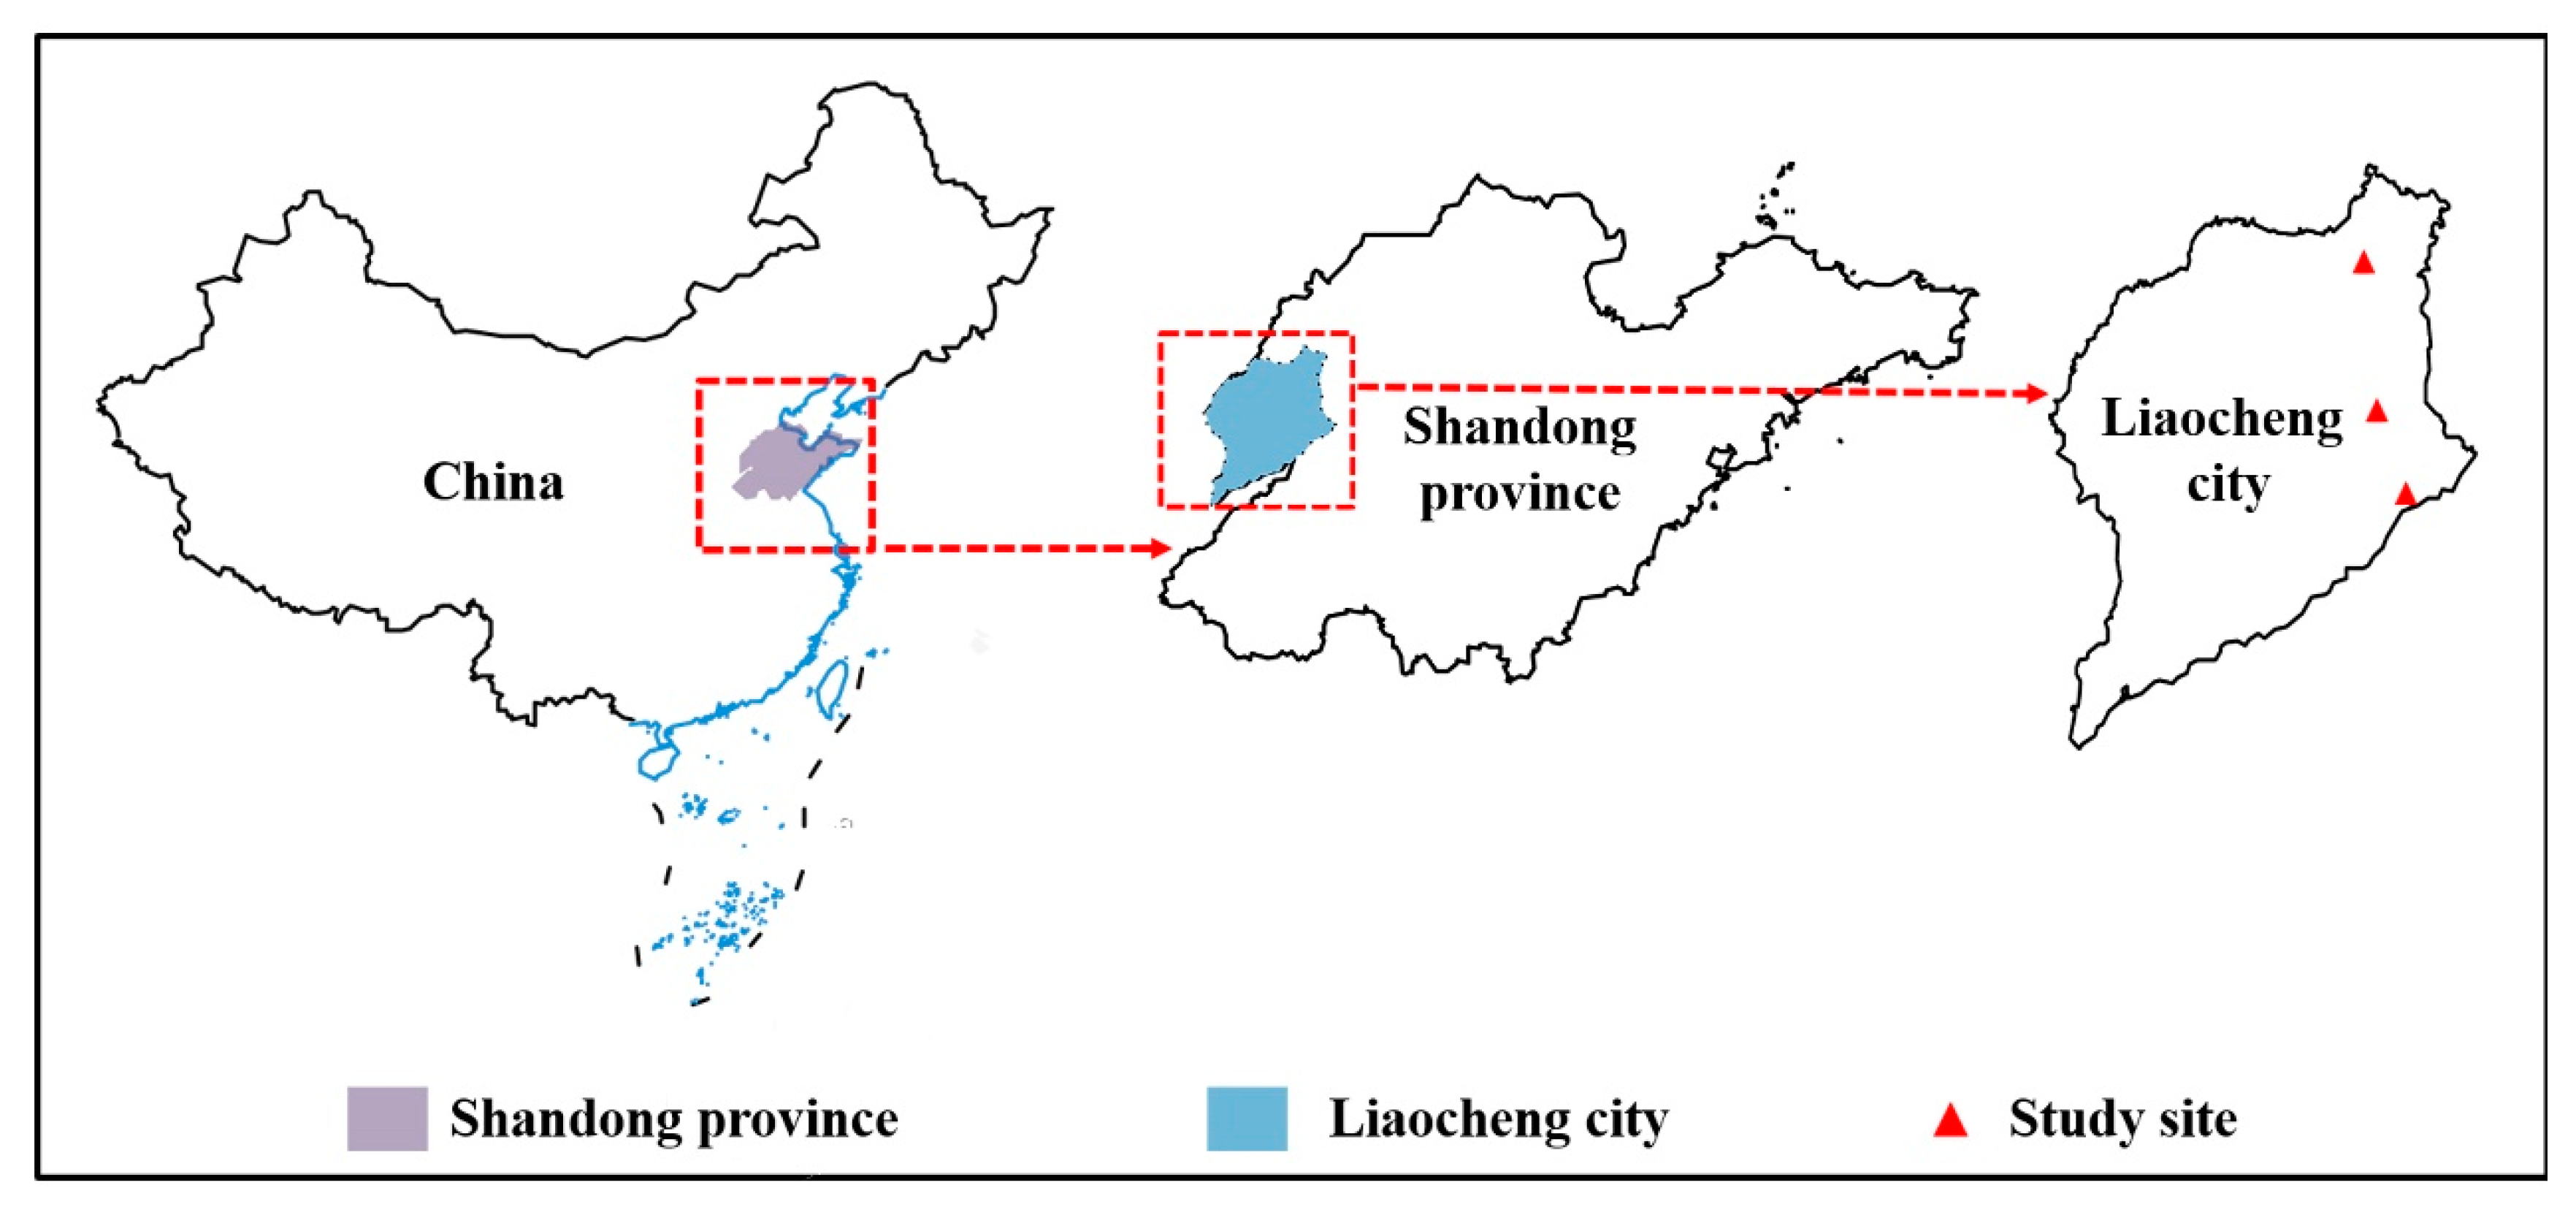
Figure 1. Location of the study area.
Preprints 111348 g001
Figure 2. The characteristics of the ecological stoichiometry in leaves among different forest stand types. Different lowercase letters indicate significant differences. LC represent leave C; LN represent leaves N; LP represent leaves P; ns, no significance; * P <0.05; ** P <0.01; *** P <0.001, the same is true below.
Preprints 111348 g002
Figure 3. Correlation analysis of leaf-soil C, N, P and C:N:P ratios in four forest stand types.
Preprints 111348 g003
Figure 4. Homeostasis analysis of leaf N, P and N:P ratios in four forest stand types.
Preprints 111348 g004
Table 1. Overview of sample plots.
Forest community
type
Latitude
and
longitude
Average
tree
height (m)
Average
DBH (cm)
Herb
Coverage (%)
MAP
(mm)
Po 36°47′ N;116°3′~116°4′E 20.85 ± 7.54 23.71 ± 11.22 57.8 ± 19.77 602.92 ± 0.62
Po*Ro 36°47′N;116°4′E 20.37 ± 10.18 24.48 ± 13.62 61.44 ± 27.72 602.94 ± 0.31
Pl 36°24′~36°47′N;116°16′~116°4′E 15.8 ± 10.18 15.78 ± 1.42 17.08 ± 15.77 618.51 ± 16.08
Sa 36°13′~36°24′N;116°15′~11628′E 18.22 ± 3.24 19.22 ± 30.6 72.78 ± 26.63 637.05 ± 0.16
Po represent Populus tomentosa pure forests; Po*Ro represent Populus tomentosa-Robinia pseudoacacia mixture forests; Pl represent Platanus orientalis pure forests; Sa represent Salix matsudana pure forests, the same is true below.
Table 2. The characteristics of the C, N, P and C:N:P ratios in soil among different forest stand types (mean ± SD).
forest stand types SC (g/kg) SN (g/kg) SP (g/kg) SC:SN SC:SP SN:SP
Po 4.68 ± 3.50 a 0.93 ± 0.45 ab 0.50 ± 0.28 b 4.67 ± 2.15 ab 10.17 ± 7.52 a 2.12 ±1.05 a
Po*Ro 5.28 ± 1.33 a 1.03 ± 0.35 ab 0.48 ± 0.24 b 5.29 ± 0.87 a 14.61 ± 0.87 a 2.84 ±1.82 a
Pl 1.78 ± 0.78 b 0.58 ± 0.08 b 1.04 ± 0.35 a 3.21 ± 1.59 b 1.86 ± 0.97 b 0.62 ± 0.24 b
Sa 6.58 ± 2.70 a 1.29 ± 0.65 a 0.85 ± 0.39 a 5.56 ± 1.76 a 10.00 ± 7.39 a 1.94 ± 1.49 a
Disclaimer/Publisher’s Note: The statements, opinions and data contained in all publications are solely those of the individual author(s) and contributor(s) and not of MDPI and/or the editor(s). MDPI and/or the editor(s) disclaim responsibility for any injury to people or property resulting from any ideas, methods, instructions or products referred to in the content.
Copyright: This open access article is published under a Creative Commons CC BY 4.0 license, which permit the free download, distribution, and reuse, provided that the author and preprint are cited in any reuse.
Prerpints.org logo

Preprints.org is a free preprint server supported by MDPI in Basel, Switzerland.

Subscribe

© 2024 MDPI (Basel, Switzerland) unless otherwise stated