1. Introduction
In this study, we will focus on the investigation of experiments carried out on elastic pipes. We examine the constant flow of water within an elastic pipe subjected to hydrostatic pressure [
1]. Elastic tubes are cylindrical objects capable of deforming and recovering their original shape under the action of external forces. The study of pressure waves of a viscous liquid contained in an elastic tube dates back to the work of
Witzig in (1914) [
2]. The pioneer of the quantitative study of the flow of blood through tubes was
Poissuille, who was both physicist and physician. He modelled the flow of blood through the circulation by investigating the flow of water through rigid cylindrical tubes [
3]. The interaction between a fluid and an elastic tube is relevant in a wide range of applications in engineering and biology, and how the study of this phenomenon can contribute to the development of more efficient and safe medical technologies and treatments [
4].
In his work with elastic pipes in bioengineering is [
5], they mathematically describes the Pulse Wave Velocity (PWV) in the arteries, they performed three-dimensional simulations of flow pulses in straight elastic pipes.
Quantitative data were obtained on the behavior of the elastic tubes when different types of forces were applied to them and their response was determined. Furthermore, it is intended to identify the main characteristics of elastic tubes that influence their deformation capacity and resistance. The analysis of these data will allow conclusions to be drawn about the properties of elastic tubes and their possible application in different fields of science and technology.
The corresponding mathematical approach is represented by the phenomenon of fluid-structure interaction, this being coupling two media with different physical characteristics. These problems are of great interest to physicomathematicians, due to their connection with hemodynamics models [
6,
7,
8] and works that also consider viscous flows in elastic tubes [
9,
10,
11]. These mathematical models can also be applied to viscous fluids in industrial facilities, for their study in thin tube structures [
12].
This may involve measuring the velocity and flow profile of a fluid in an elastic tube, as well as investigating how factors such as the elasticity of the tube material affect fluid transport.
The division of this work is as follows: in the next section we describe the Physical Model a elastic pipe, in section 3 experimental set up will be discussed. After, section 4 the main results of the experiments performed will be presented. In finally, in
Section 5, the main conclusions will be given and future works.
2. Physical Model
Figure 1 shows the diagram of a fragment of an elastic tube as an initially straight cylinder with internal radius r, wall thickness h and axial length L. A base case was defined as a reference, for which r = 4 mm, e = 0.25 mm, L = 280 mm, E = 4.07 MPa. The rest of the properties of the fluid and the solid were kept constant with the following values:
and
.
The volumetric flow inside the elastic tube is Q = 0.003122
. Since the flow rate is the product of the surface area of a section of the conduit and the speed with which the fluid flows, we have to [
13,
14]:
where:
S is the surface of the cross sections and
v is the velocity of the fluid. In our case we consider
and
and we know that D = 0.8 mm,
, so we have to
, with (
1) we got the velocity how;
For lower Reynolds number values greater than 2000, using the equation for
Reynols number values greater tha 4000, if we know that
, where,
is the density of the fluid,
v es la velocidad, D is the characteristic length, in this case it is 2R and
u is the dynamic viscosity, we obtain
The flow inside the elastic pipe is turbulent.
2.1. Considerations of Pulsatile Flow in an Elastic Pipe
In an elastic tube, pressure changes promote local movements of the fluid and the wall of the conduit, which which propagates in a wave form:
The velocity now also depends on x and the radial velocity is non-zero.
Here the velocities u and v are functions of x.
The entrance pressure gradient in the tube is a function of t.
But inside the tube the pressure gradient and the two velocities are functions of x and t.
The speed with which the wave propagates in the tube depends on the elasticity
In an elastic tube with pulsatile flow, a change in pressure will produce a wave movement and the speed of this wave is known as the wave speed factor.
The Moens-Korteweg equation calculates this factor for an elastic pipe.
If the thickness of the wall of the tube is small with respect to the radius of the tube
If the effects of viscosity can be neglected the wave speed is approximated with
with
E the Young’s modulus of the conduit wall,
h the thickness of the tube wall,
a the radius of the tube and
the constant density of the fluid. The latter is important since, if the density
is not constant, then changes in pressure lead to compressions and expansions of the fluid inside the pipe [
15,
16,
17].
2.2. Considerations of Pulsatile Flow in a Rigid Pipe
The main difference between an incompressible flow in an elastic tube and a rigid one is that in the rigid tube any change in pressure is perceived "immediately" along the tube.
In an elastic tube, if there is a change in pressure it will be absorbed by the elastic wall.
This characteristic produces a delay in the flow properties in an elastic tube.
In an elastic tube with pulsatile flow, a change in pressure will produce a wave movement and the speed of this wave is known as the wave speed factor.
The Moens-Korteweg equation calculates this factor for an elastic, thin-walled tube
, with
D being the diameter of the tube [
18,
19].
3. Experimental Setup
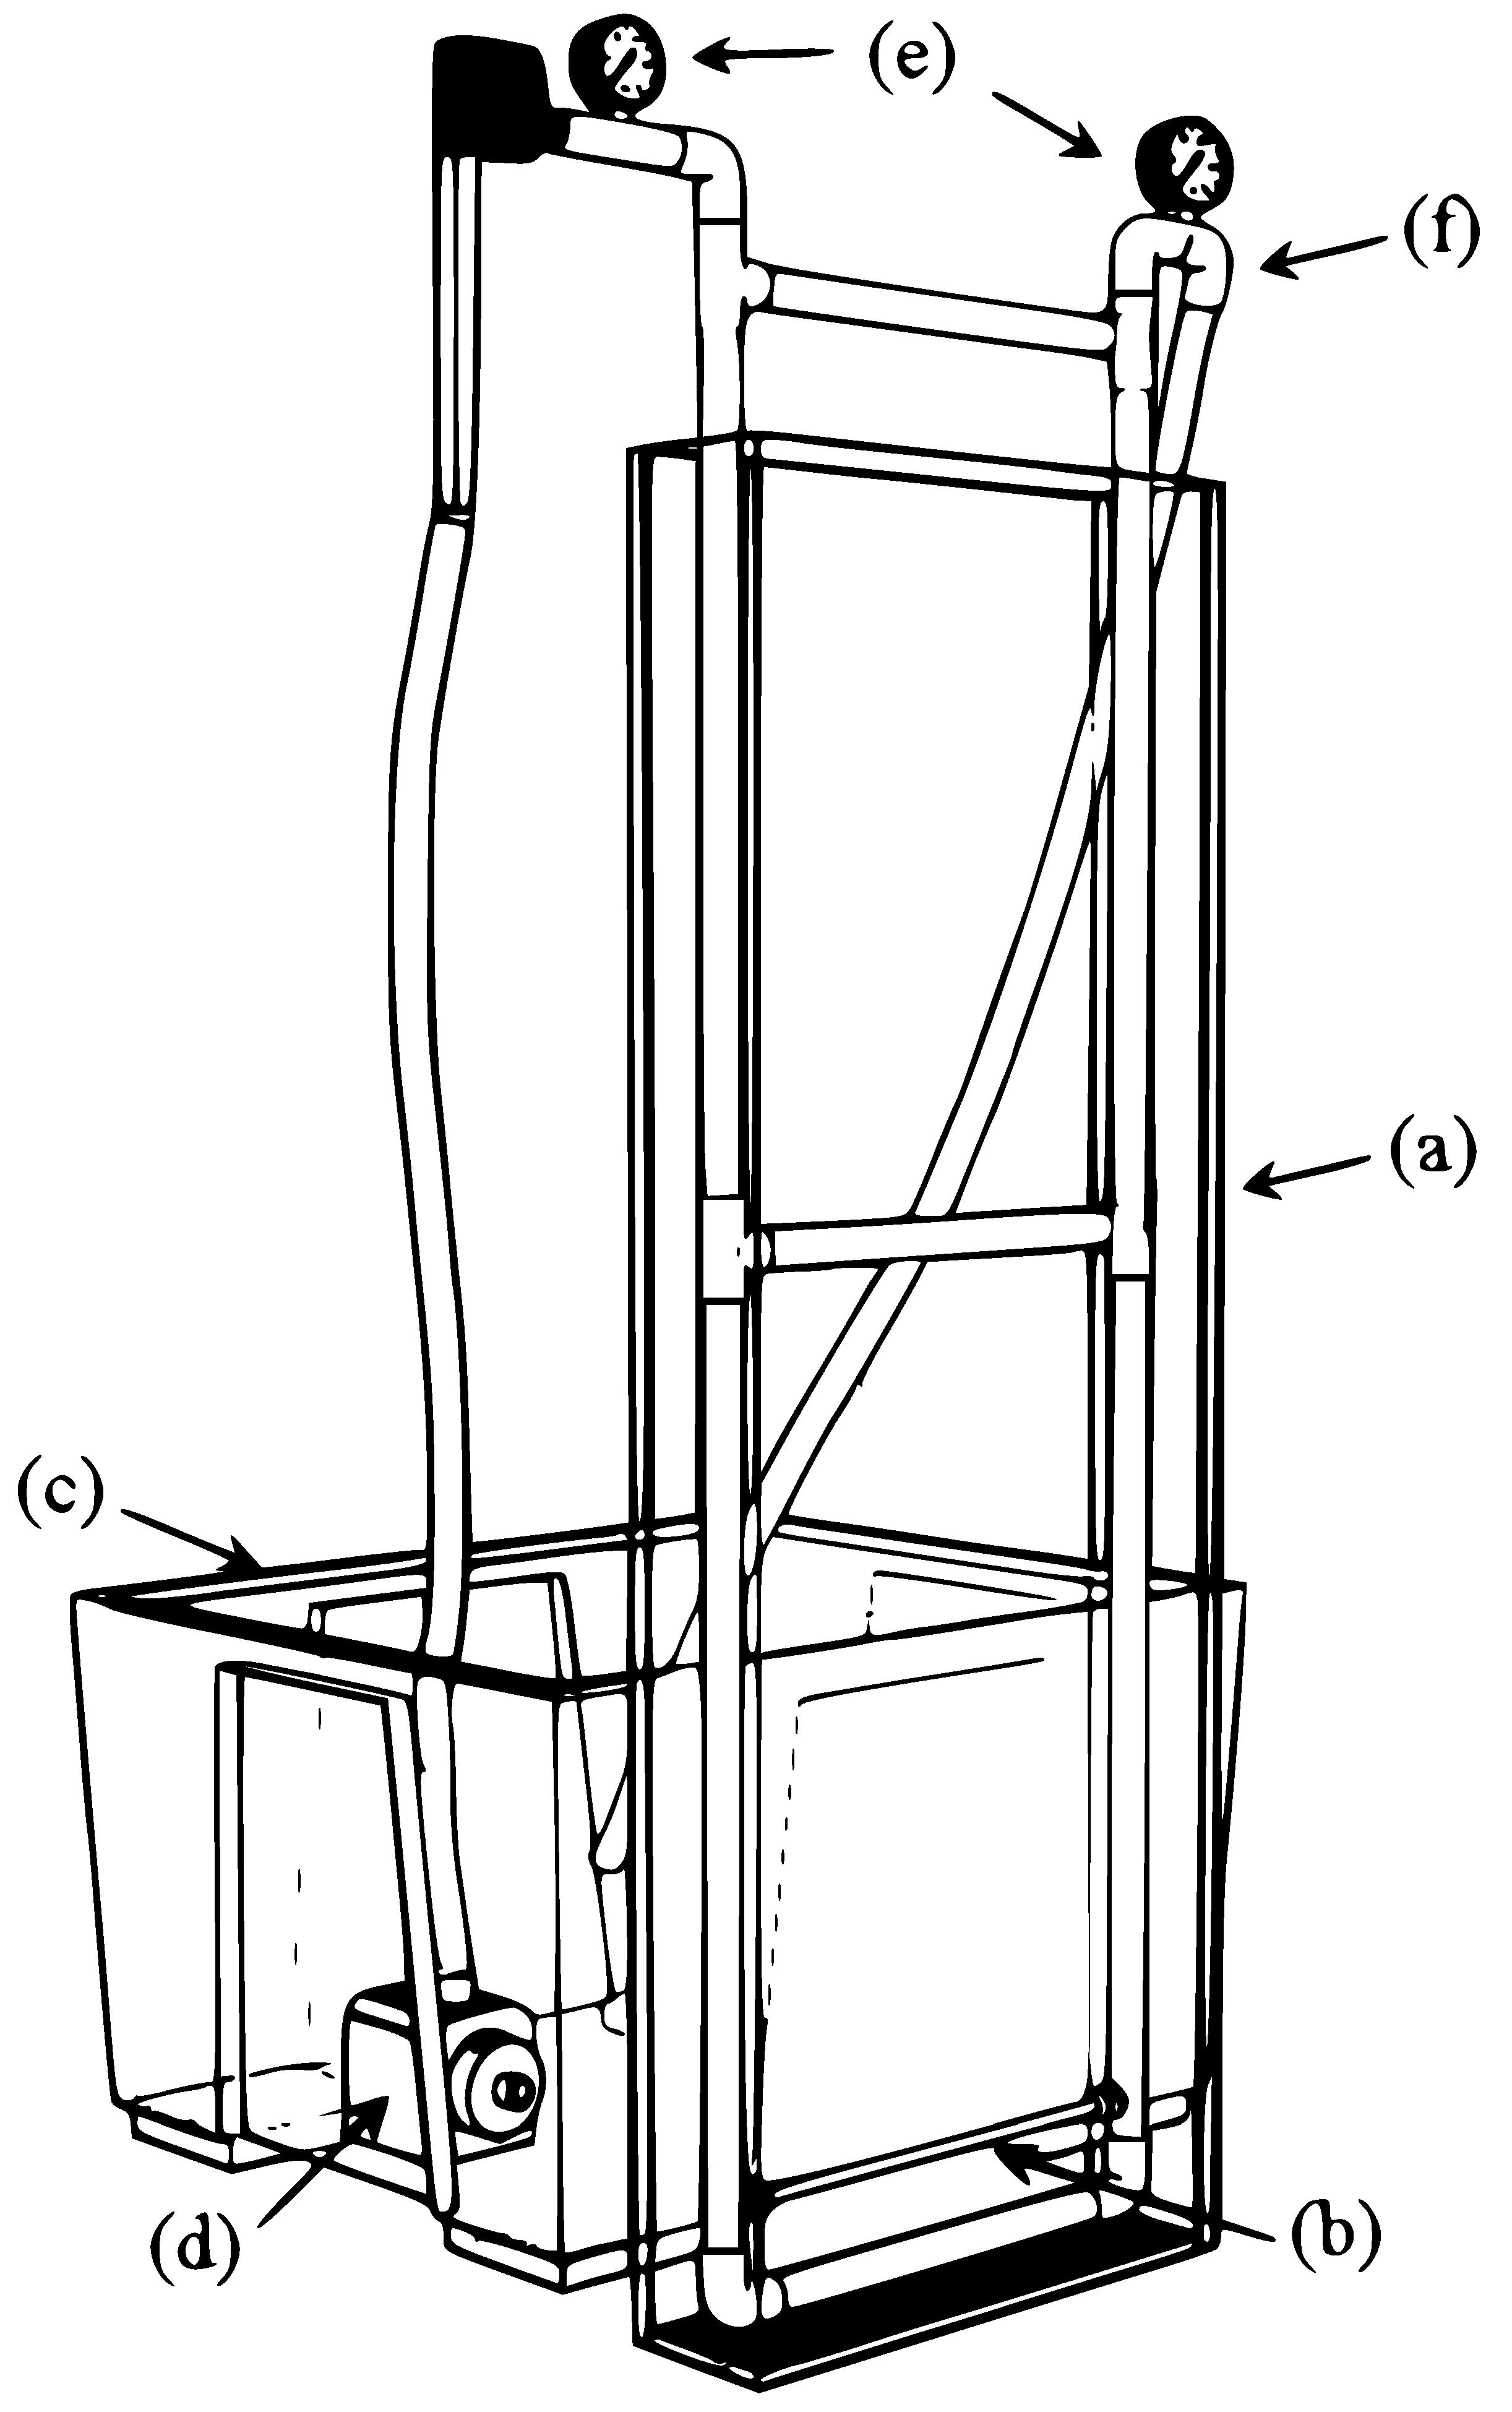
The experimental setup is designed to study fluid behavior in elastic pipes under controlled conditions. This system is used in the Department of Energy and in the complex systems laboratory of the Metropolitan Autonomous University. The setup consists of several essential components that work together to ensure a constant and measured flow of fluid through the system. As seen in
Figure 2, the central component of the setup is a transparent acrylic container measuring 42 x 10 x 120 cm. This container allows the visualization of the fluid during the experiment, which is crucial for visual monitoring and analysis of fluid behavior. Acrylic is an ideal material due to its strength and clarity, facilitating unobstructed observation. The elastic tubes, 40 cm in length and with an average diameter of 8 mm, are placed inside this container and secured at their ends with appropriate fixing devices to ensure they are well-supported and correctly aligned.
The elastic tubing used
Figure 3 in the experiment is critical for studying fluid behavior under different flow conditions. These tubes, 40 cm in length, must be clean and free of obstructions to ensure accurate results. The elasticity of the tubes allows them to adapt to changes in fluid pressure and volume without the risk of ruptures. The system includes a 150-liter water storage tank open to the atmosphere, which acts as the primary fluid source. This reservoir is designed to maintain a constant supply of double-distilled water throughout the experiment. A submersible pump with a capacity of 1140 liters per hour and a maximum piezometric head of 3.5 meters is used to move the fluid through the system. This pump is located in the water reservoir, enhancing efficiency and reducing the risk of overheating.
Pressure gauges and the flowmeter are essential devices for measuring and controlling fluid conditions within the system. These devices are installed at strategic points to monitor the pressure and flow rate of the fluid at different stages of the experiment. The accuracy and calibration of these gauges are crucial for obtaining reliable data. PVC piping is used to connect all the components of the system. The straight pipes located upstream and downstream of the pipe are made of 1DN Schedule 40 PVC (25 mm). This material is chosen for its durability, resistance to corrosion, and easy of installation. The volumetric flow rate is controlled by globe-type valves and measured by a flowmeter. The globe valve is connected to the inlet of the flowmeter, allowing control of the water flow within a range of 3 to 20 LPM to the elastic pipe. This ensures precise control of fluid flow during the experiment. This experimental setup is meticulously designed to study fluid behavior under controlled conditions. Each component serves a specific function that contributes to the system’s integrity and the accuracy of the collected data. The use of materials such as acrylic and PVC, along with precise measuring devices, ensures that the experiment is successfully conducted and reliable results are obtained.
The experiment was recorded with a Dantec Dynamics PHANTOM high-speed camera at 1000 FPS with a resolution of 512 x 200 at an exposure of 30 s. For image analysis we use free-use software Fiji (FIJI Is Just ImageJ), and VirtualDub.
3.1. Strength and Rigidity of the Material
In the tensile test, a specimen of a certain geometry is subjected to the action of an axial force, usually until fracture [
20].
The tensile test provides very complete information since it allows the elastic and plastic response of the material to be quantified through its resistant properties (elastic or Young’s modulus and breaking stress) and ductile (percentage of elongation at break) [
20,
21]. There are multiple ways of working in a tensile test, even allowing work in fatigue conditions. The usual thing is to carry out a control by stroke, that is, establishing a constant speed of separation of the jaws, in this work this system has been used.
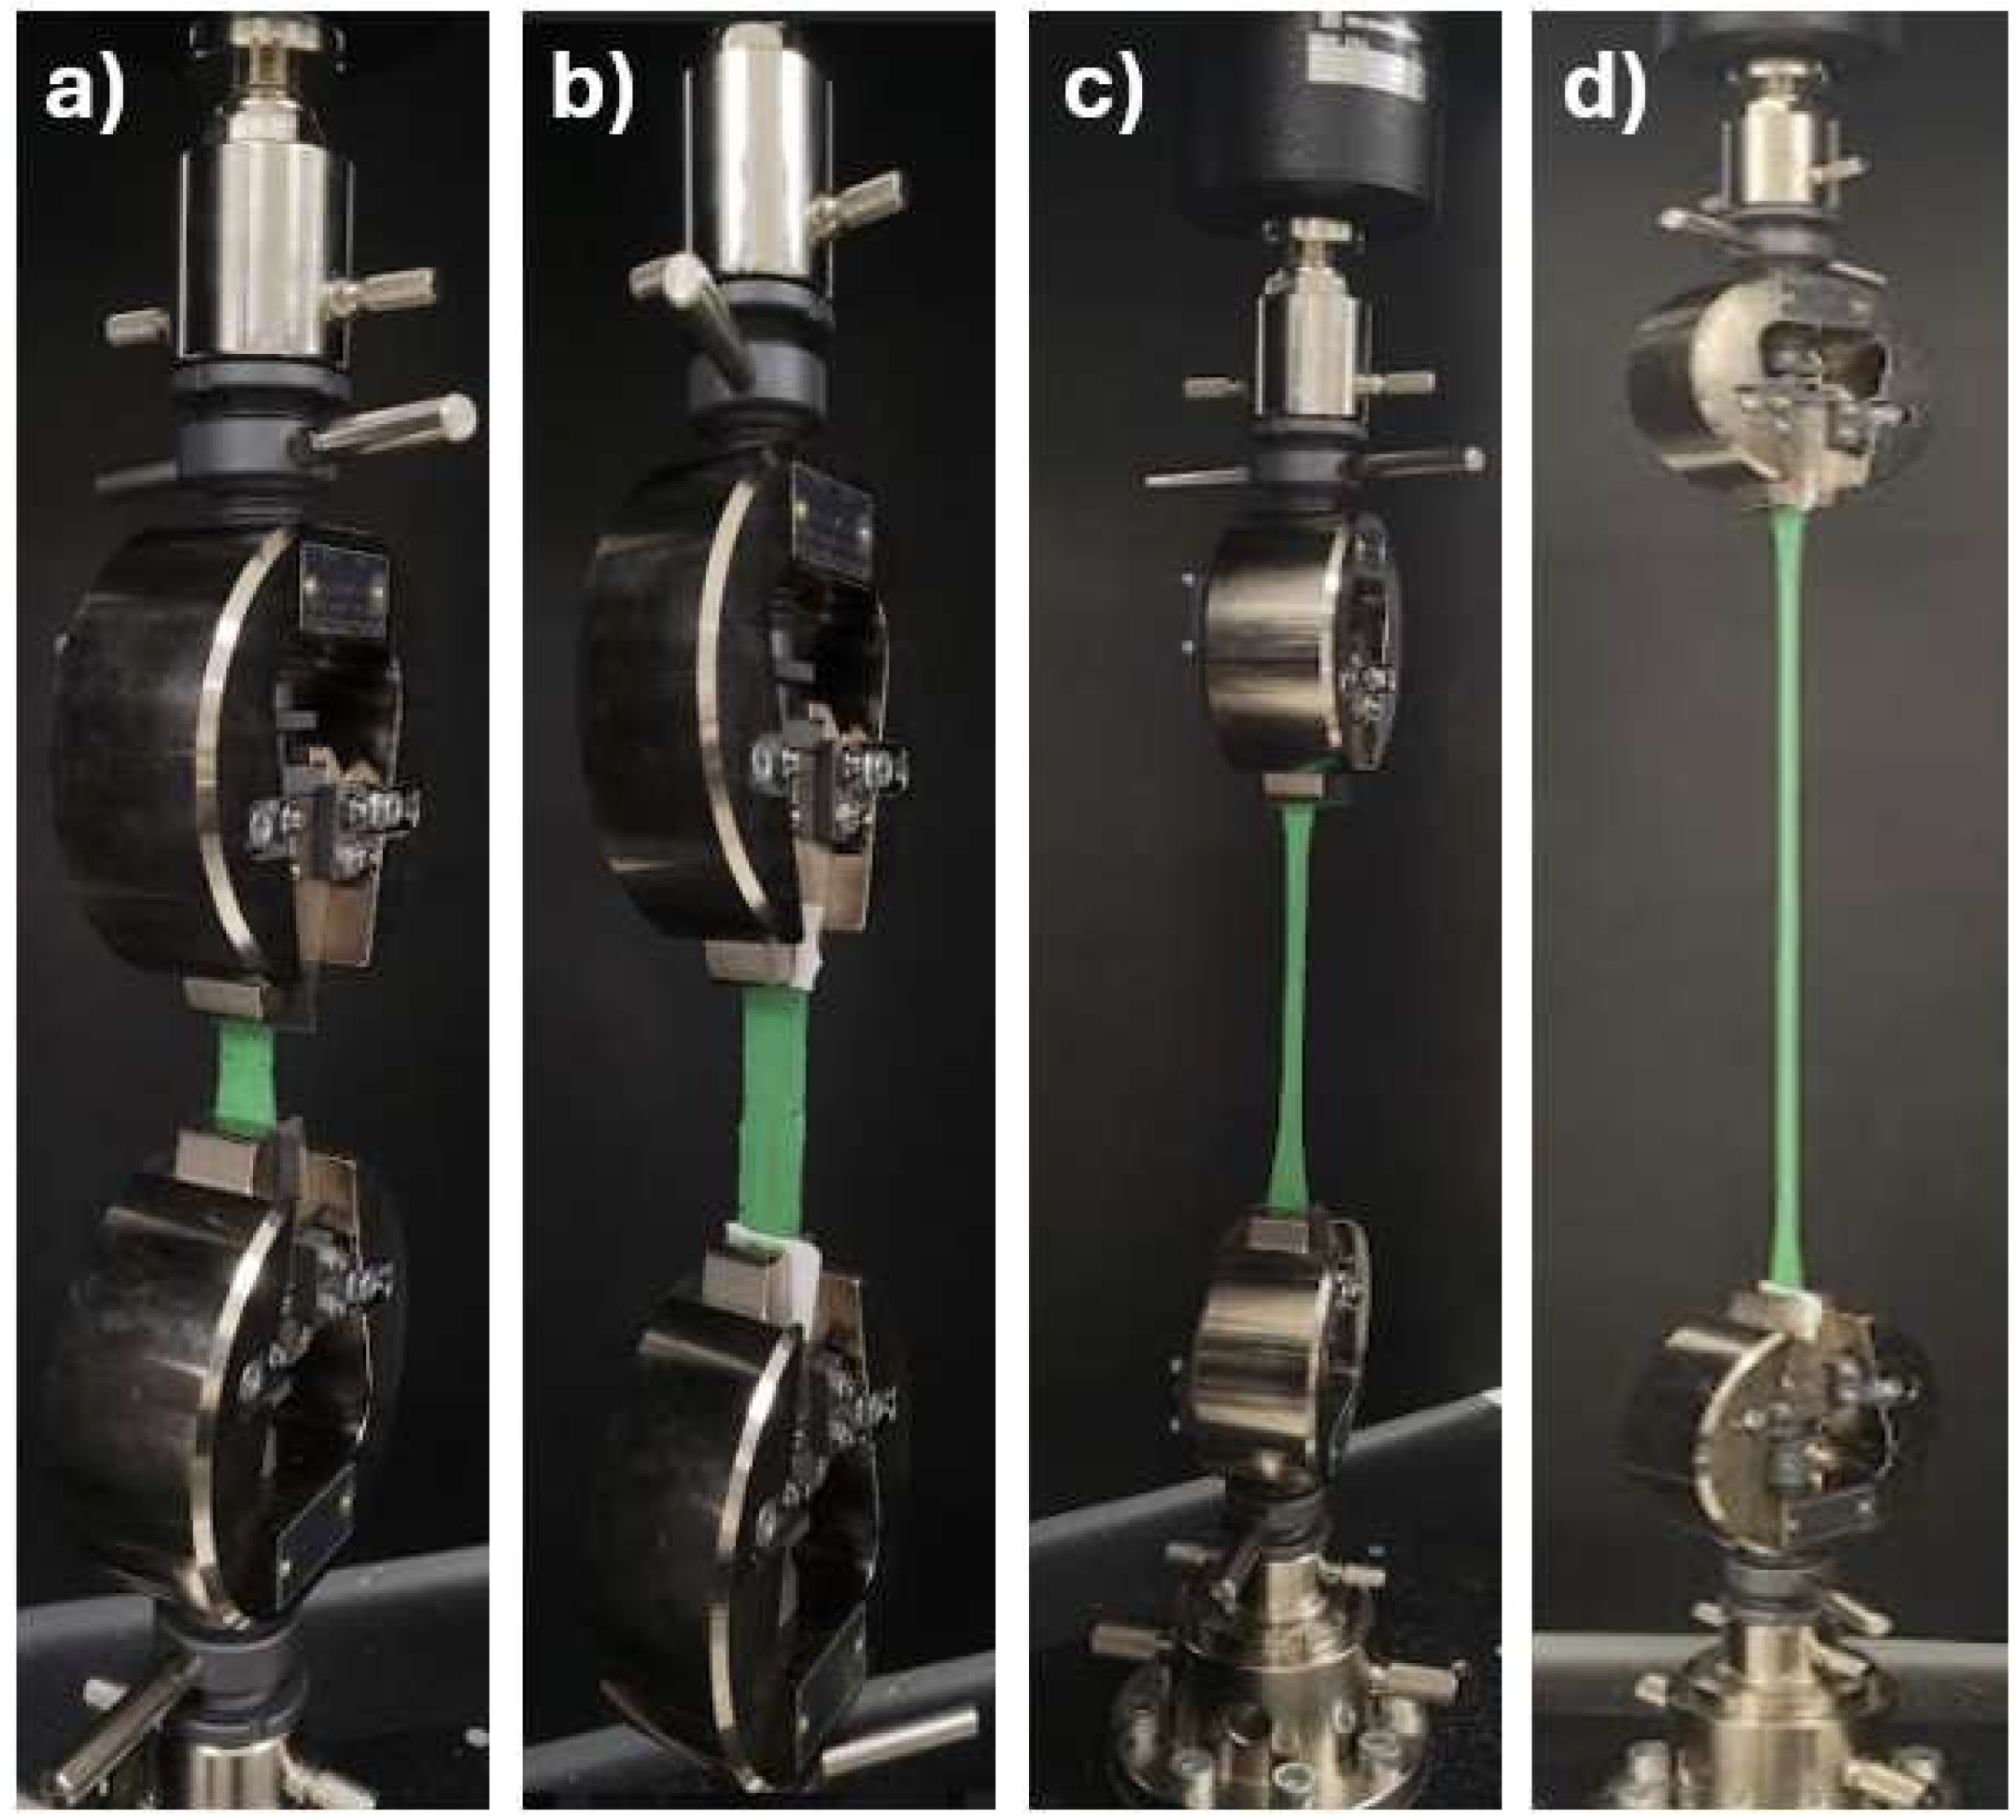
Figure 4.
Images of the SHIMADZU universal tensile testing machine with a capacity of 10 tons, operating at a speed of 100 ± 50 mm/min, conducting tensile tests.
Figure 4.
Images of the SHIMADZU universal tensile testing machine with a capacity of 10 tons, operating at a speed of 100 ± 50 mm/min, conducting tensile tests.
The tests were carried out on a SHIMADZU universal tensile testing machine with a capacity of 10 TON, at a speed of 100 ± 50 mm/min. ISO 527-1 and ISO 527-2 plastic tensile test and ISO 527-2 standard describe methods for determining the tensile properties of vulcanized thermoset rubber and thermoplastic elastomers, respectively. ASTM D412-16 [23] also describes methods for determining the tensile properties of vulcanized thermoset rubber.
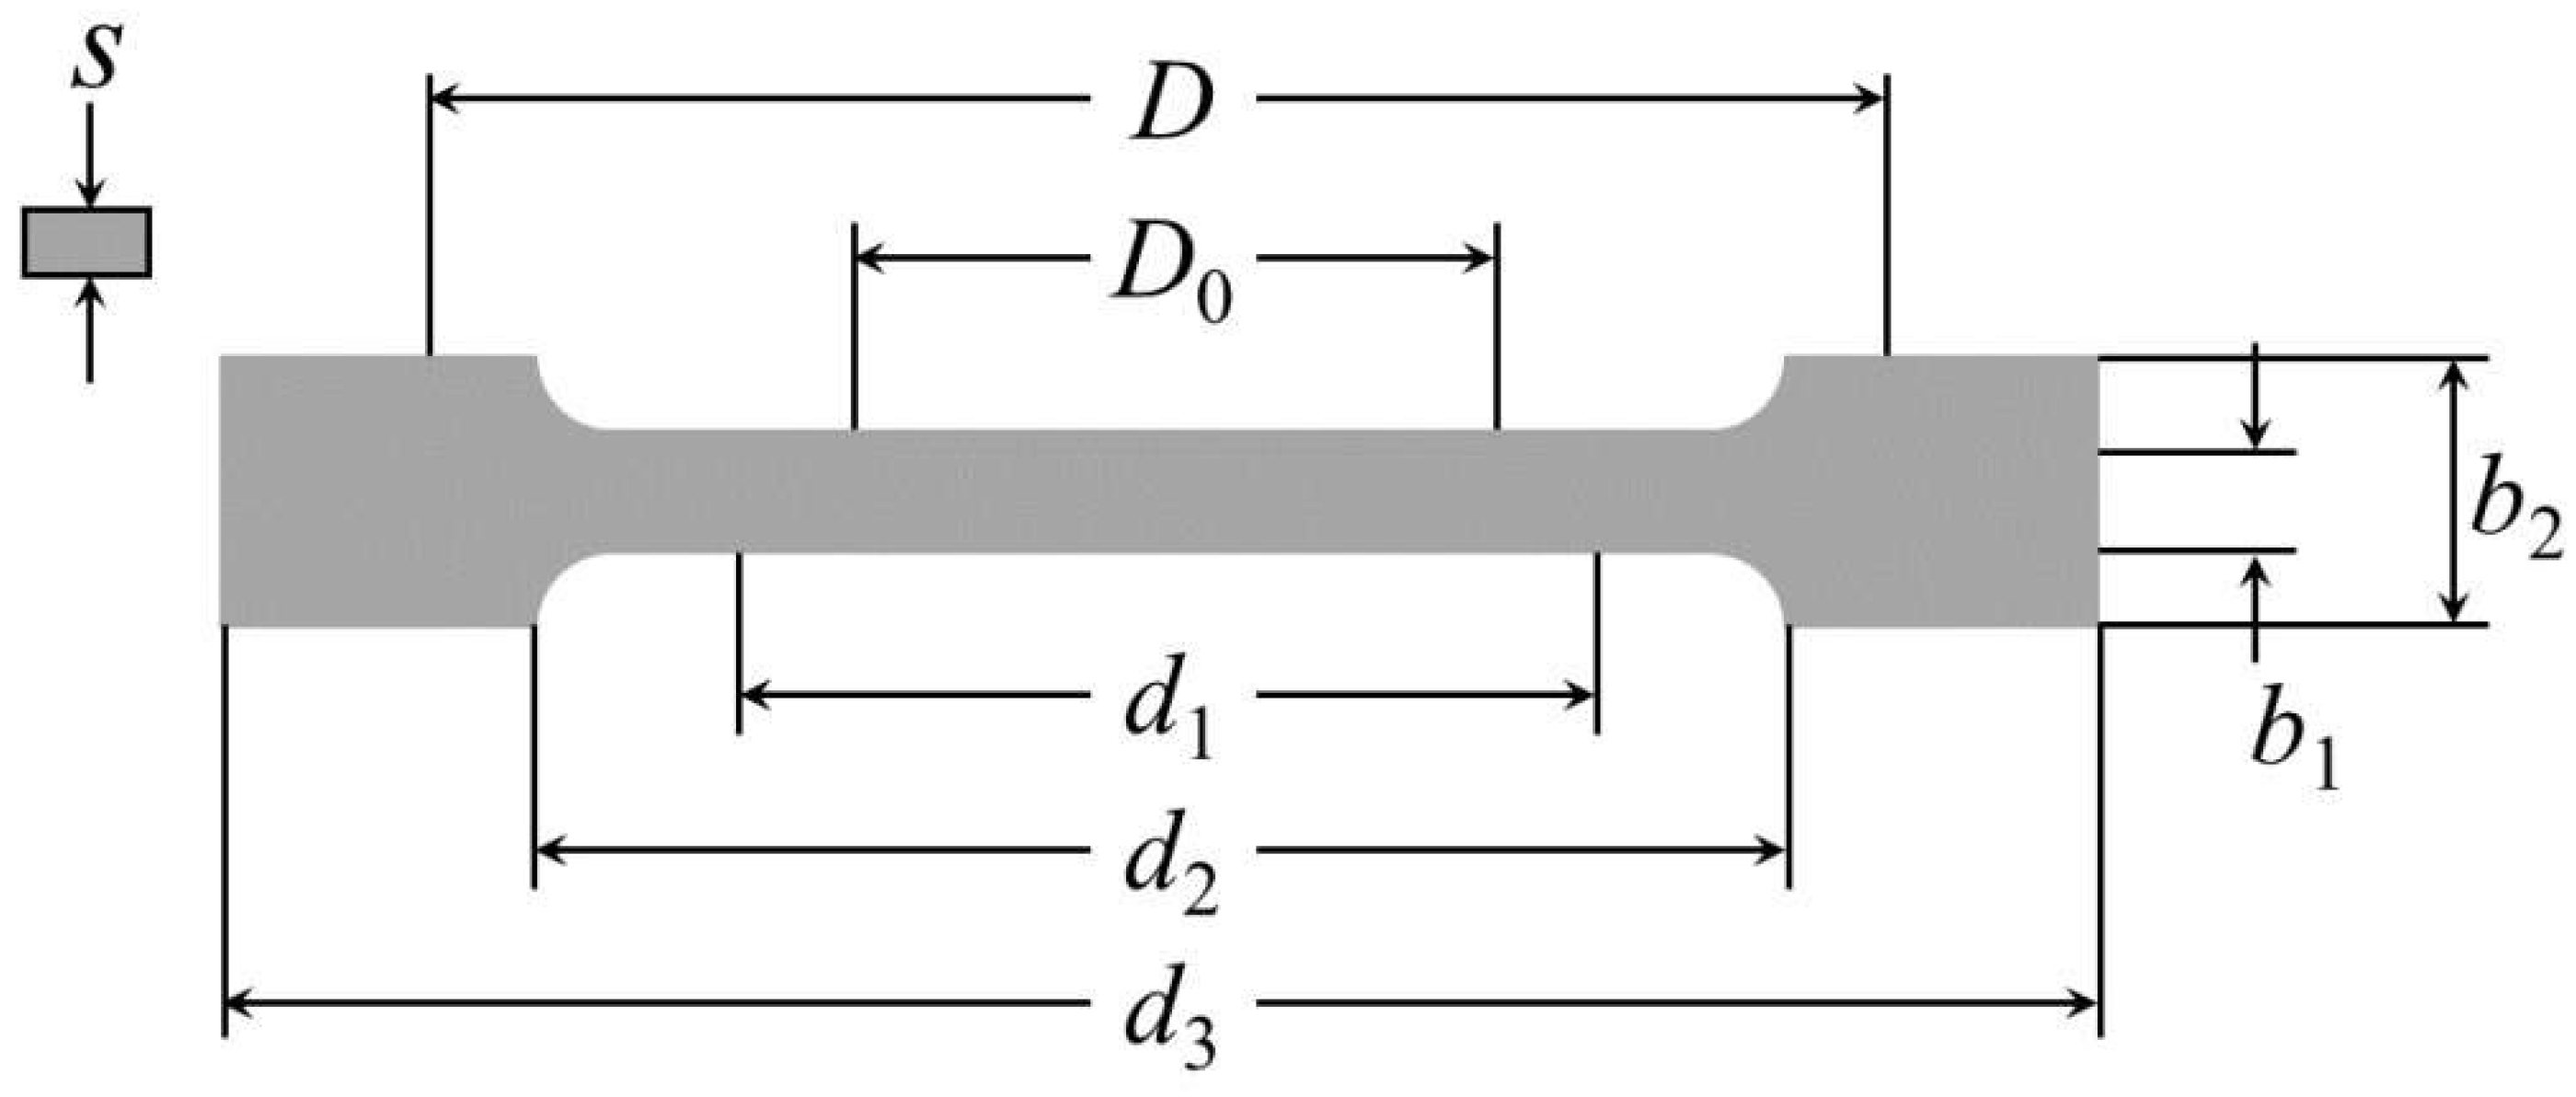
Figure 6 illustrates the elastic pipe section used for the typical tensile test and its characteristic dimensions. The original length
l and the calibration length
, which are used to measure deflections, are recorded before starting the test. Then, the specimen is mounted on the testing machine and slowly loaded in tension while observing the load
F and the deflection. The load is converted into stress through the formula
donde
, donde s, es el espesor de la probeta.
es el área original de la probeta.
The deflection or extension of the calibrated length is given by
l -
where
l is the calibrated length corresponding to the load
F. The normal unit strain is calculated from:
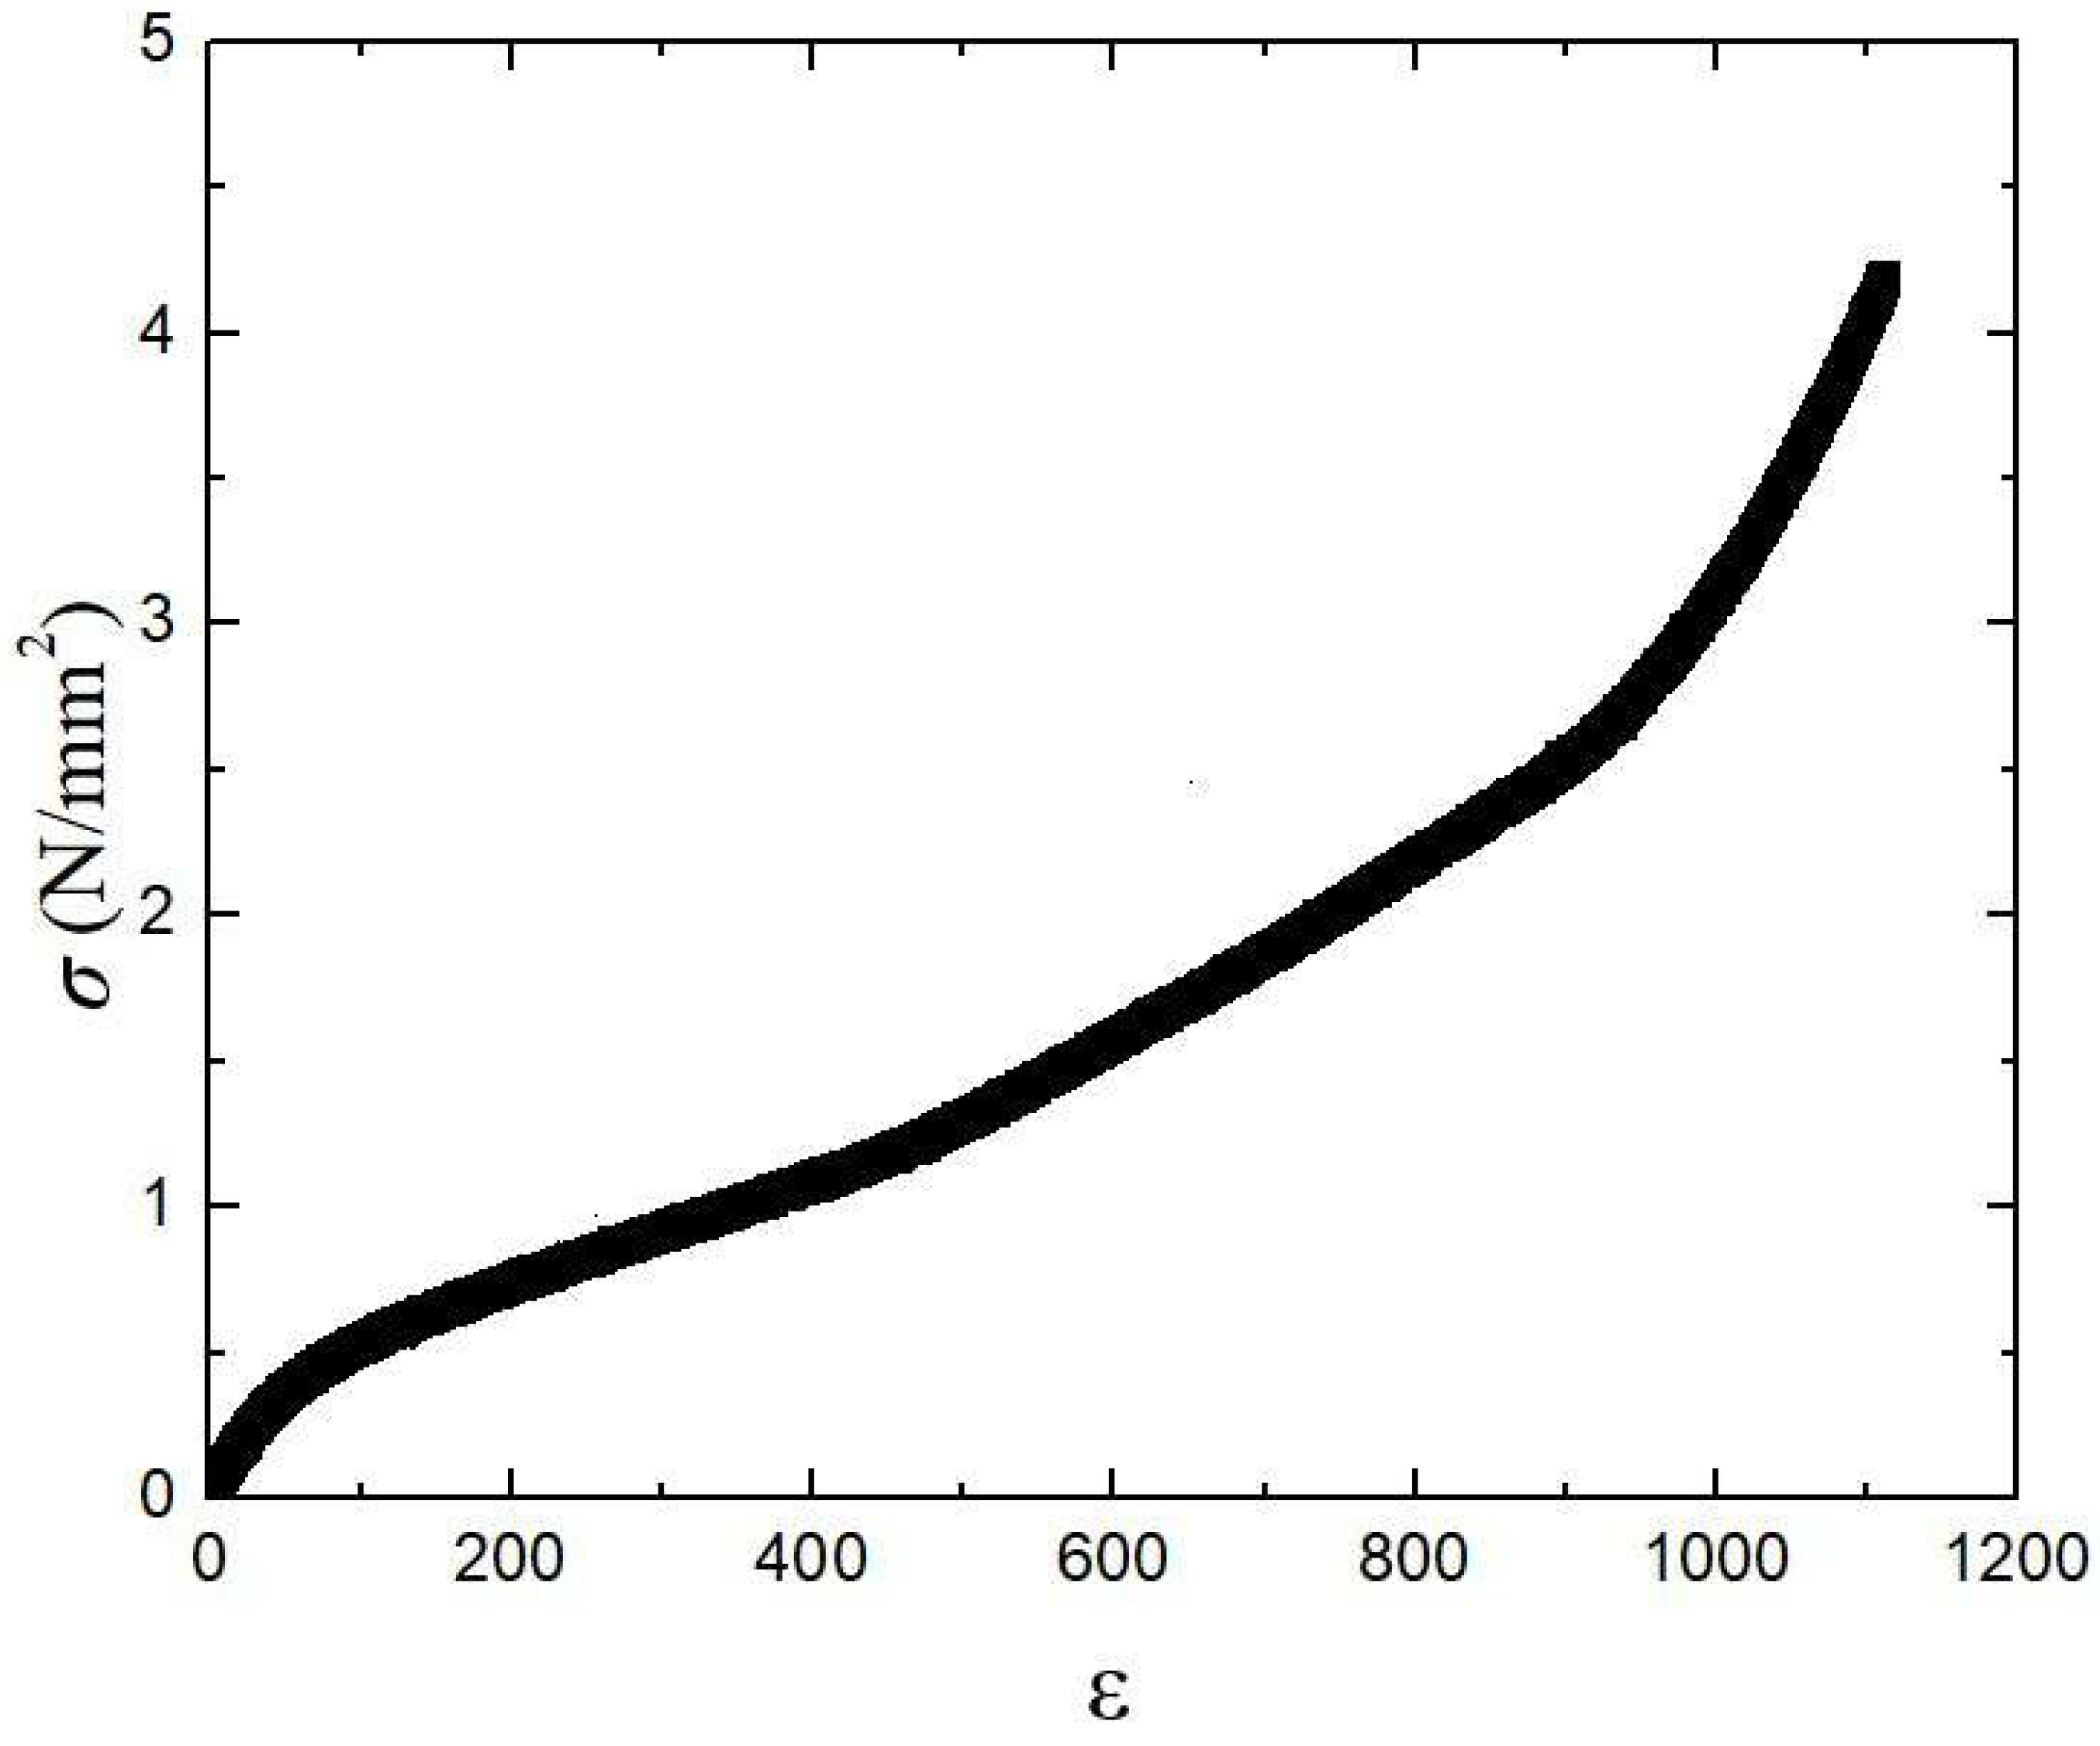
At the conclusion of or during the test, the results are plotted as a stress-strain diagram. In the linear range, the uniaxial stress-strain relationship is given by Hooke’s law as:
where the proportionality constant
E, the slope of the linear part of the stress-strain curve, is called Young’s modulus or modulus of elasticity
E as Young’s modulus or Hooke’s law for elastic materials can also be written in terms of a compliance
J:
where, the elastic compliance
J is the inverse of the modulus
E;
The stiffness and strength of materials is often illustrated by a stress–strain curve, which is obtained by applying experimentally a constant rate of strain to a Tensile test specimen of the elastic material [23,24].
Figure 5 shows the dimensions of the most common specimen, which is a standard weightlifting specimen (ASTM D412 Type A). The dimensions are as follows:
Measuring length
D Clamping length
Length of parallel narrow part
Distance between wide, parallel sections
Total length
Width of test piece in end area
Width of specimen in measuring length area
s Test tube thickness
Figure 5.
The
Figure 4 shows the dimensions of the weightlifting specimen in accordance with the standard (ASTM D412 Type A).
Figure 5.
The
Figure 4 shows the dimensions of the weightlifting specimen in accordance with the standard (ASTM D412 Type A).
Figure 6.
Stress-strain diagram obtained from standard tension test.
Figure 6.
Stress-strain diagram obtained from standard tension test.
4. Experimental Results
The first test was carried out at 10 cm of hydrostatic pressure, where
=
, where
is the density of the fluid,
g is the gravity and
h is the height of the fluid surface [
13,
14]. For the first case
= 981
, At room temperature.
For the second case of a height of 20 cm, = 1.962 and in the last case at a height of 30 cm = 2.943 .
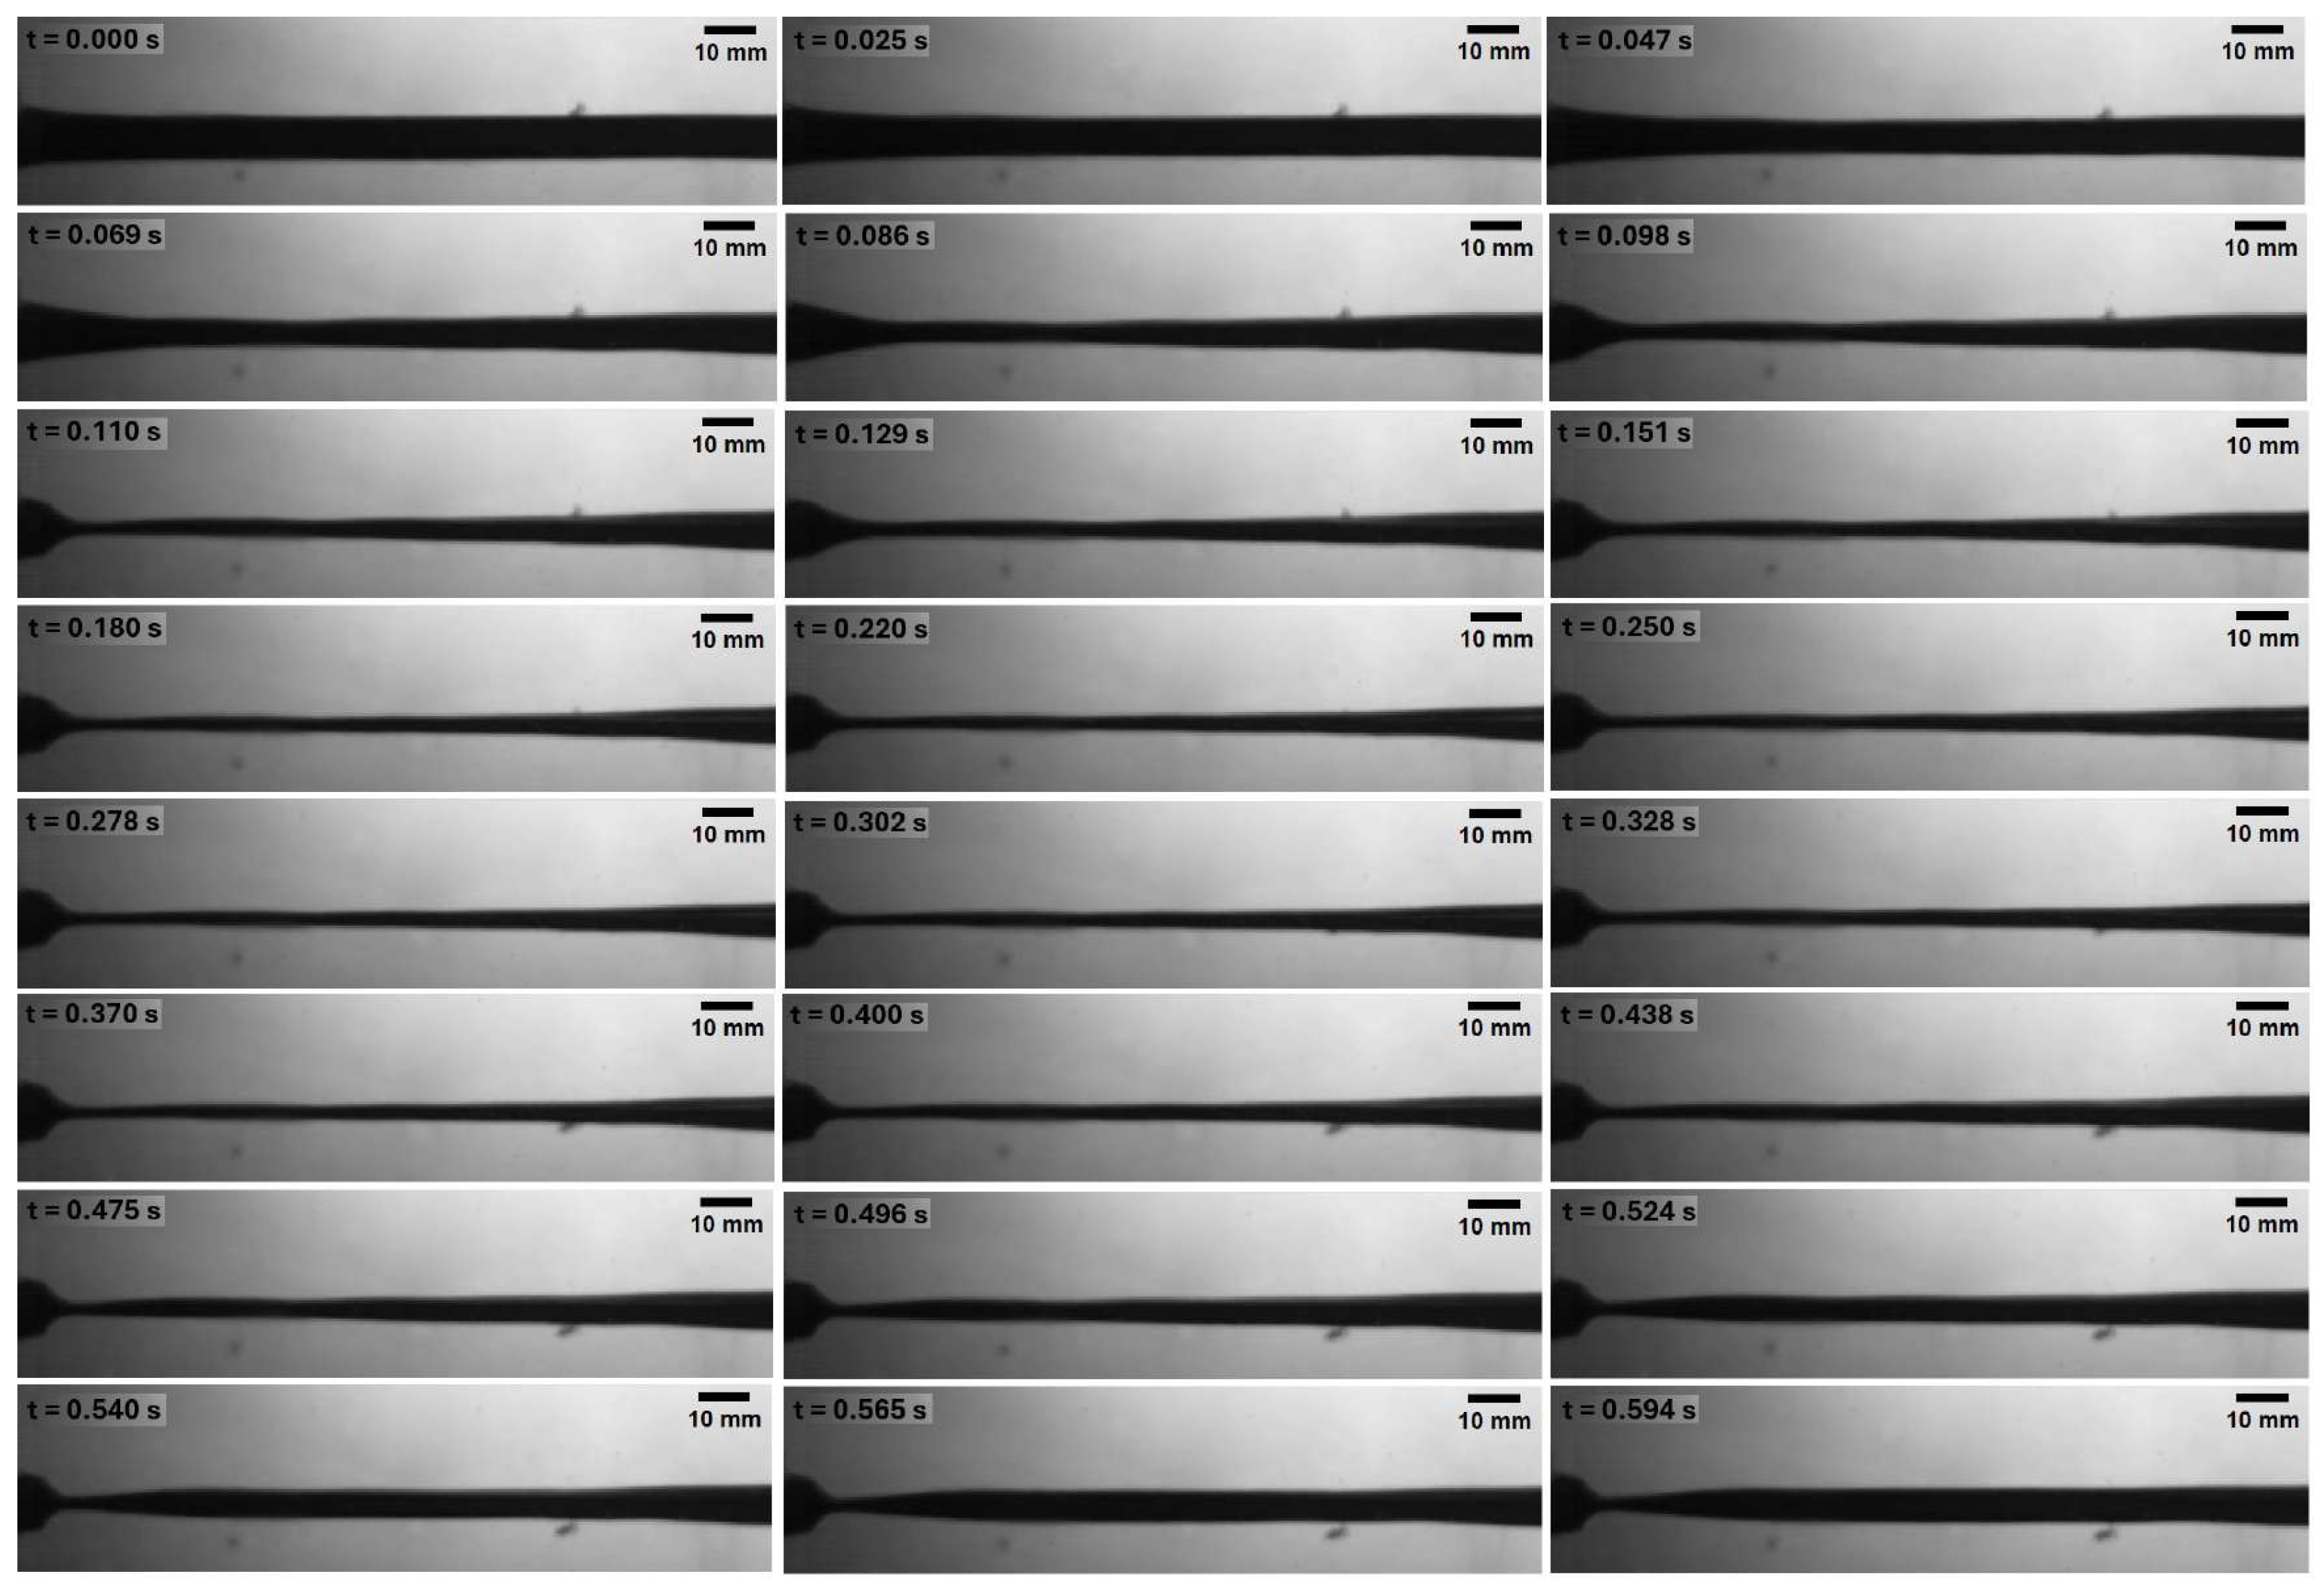
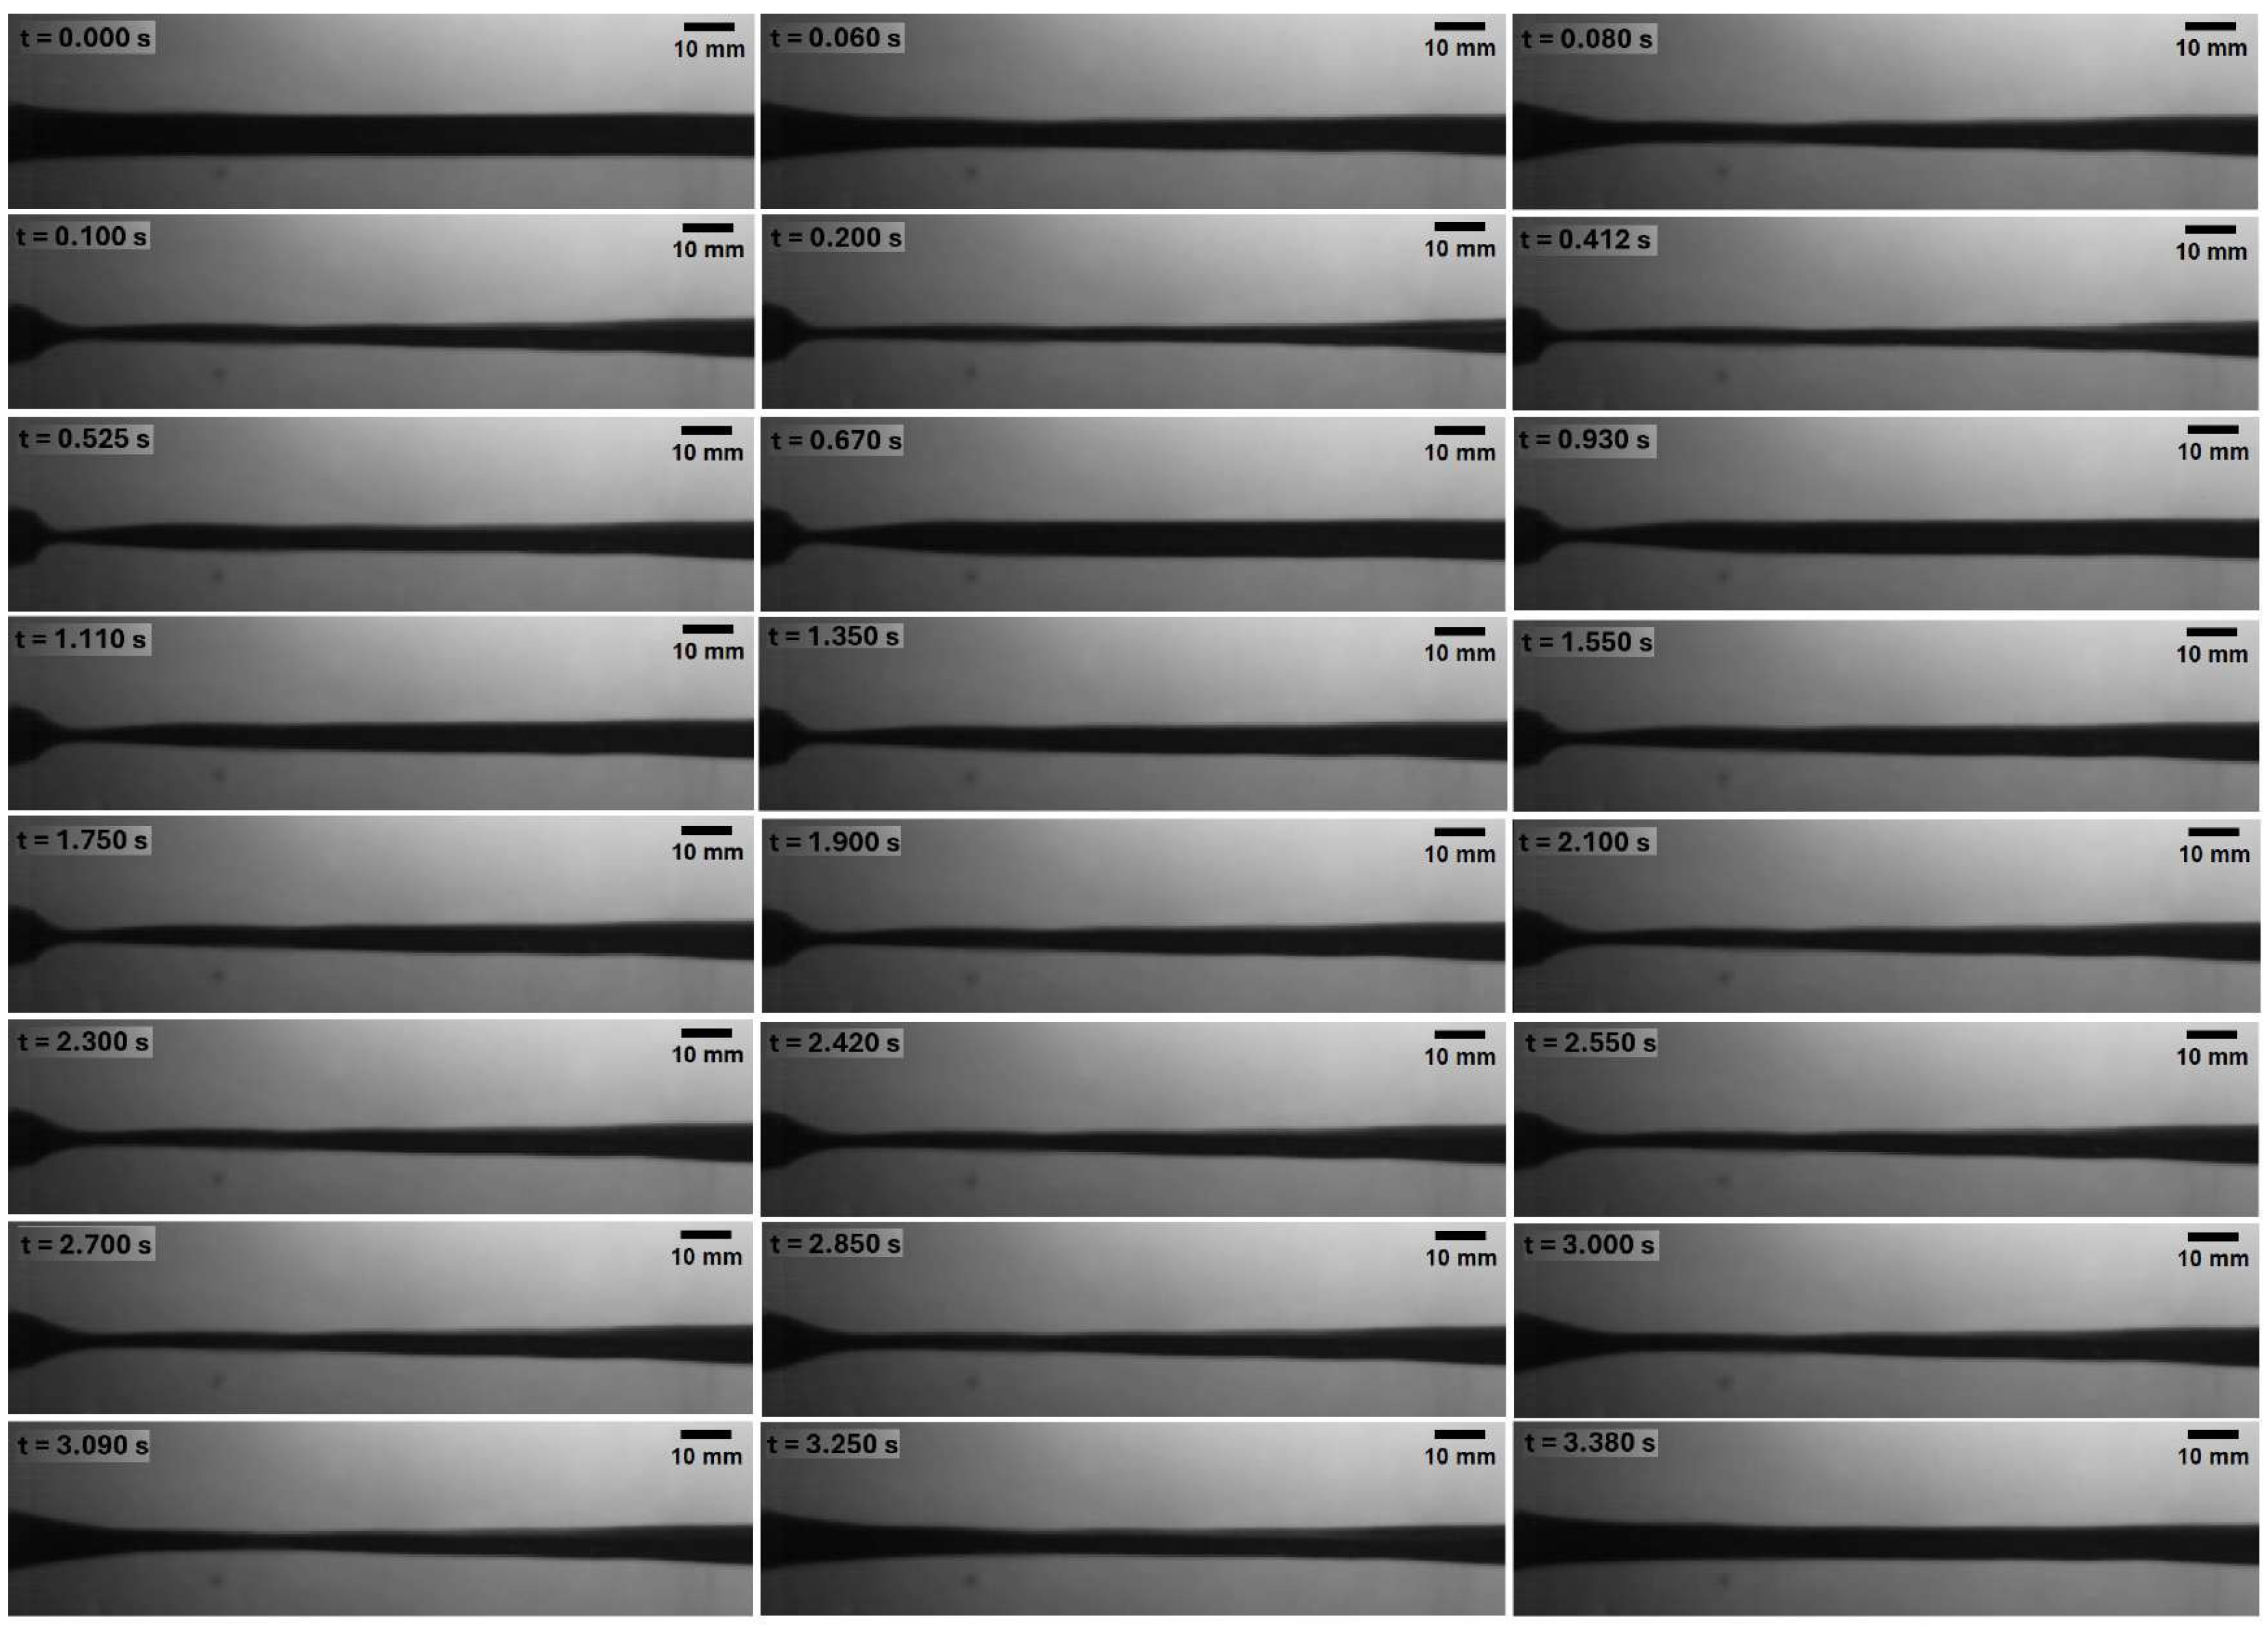
We can observe that the greater the hydrostatic pressure on the elastic pipe, a neck is formed upstream of the tube. i.e. for h = 20 cm and h = 30 cm. Observe in the Figure 8 and Figure 9.
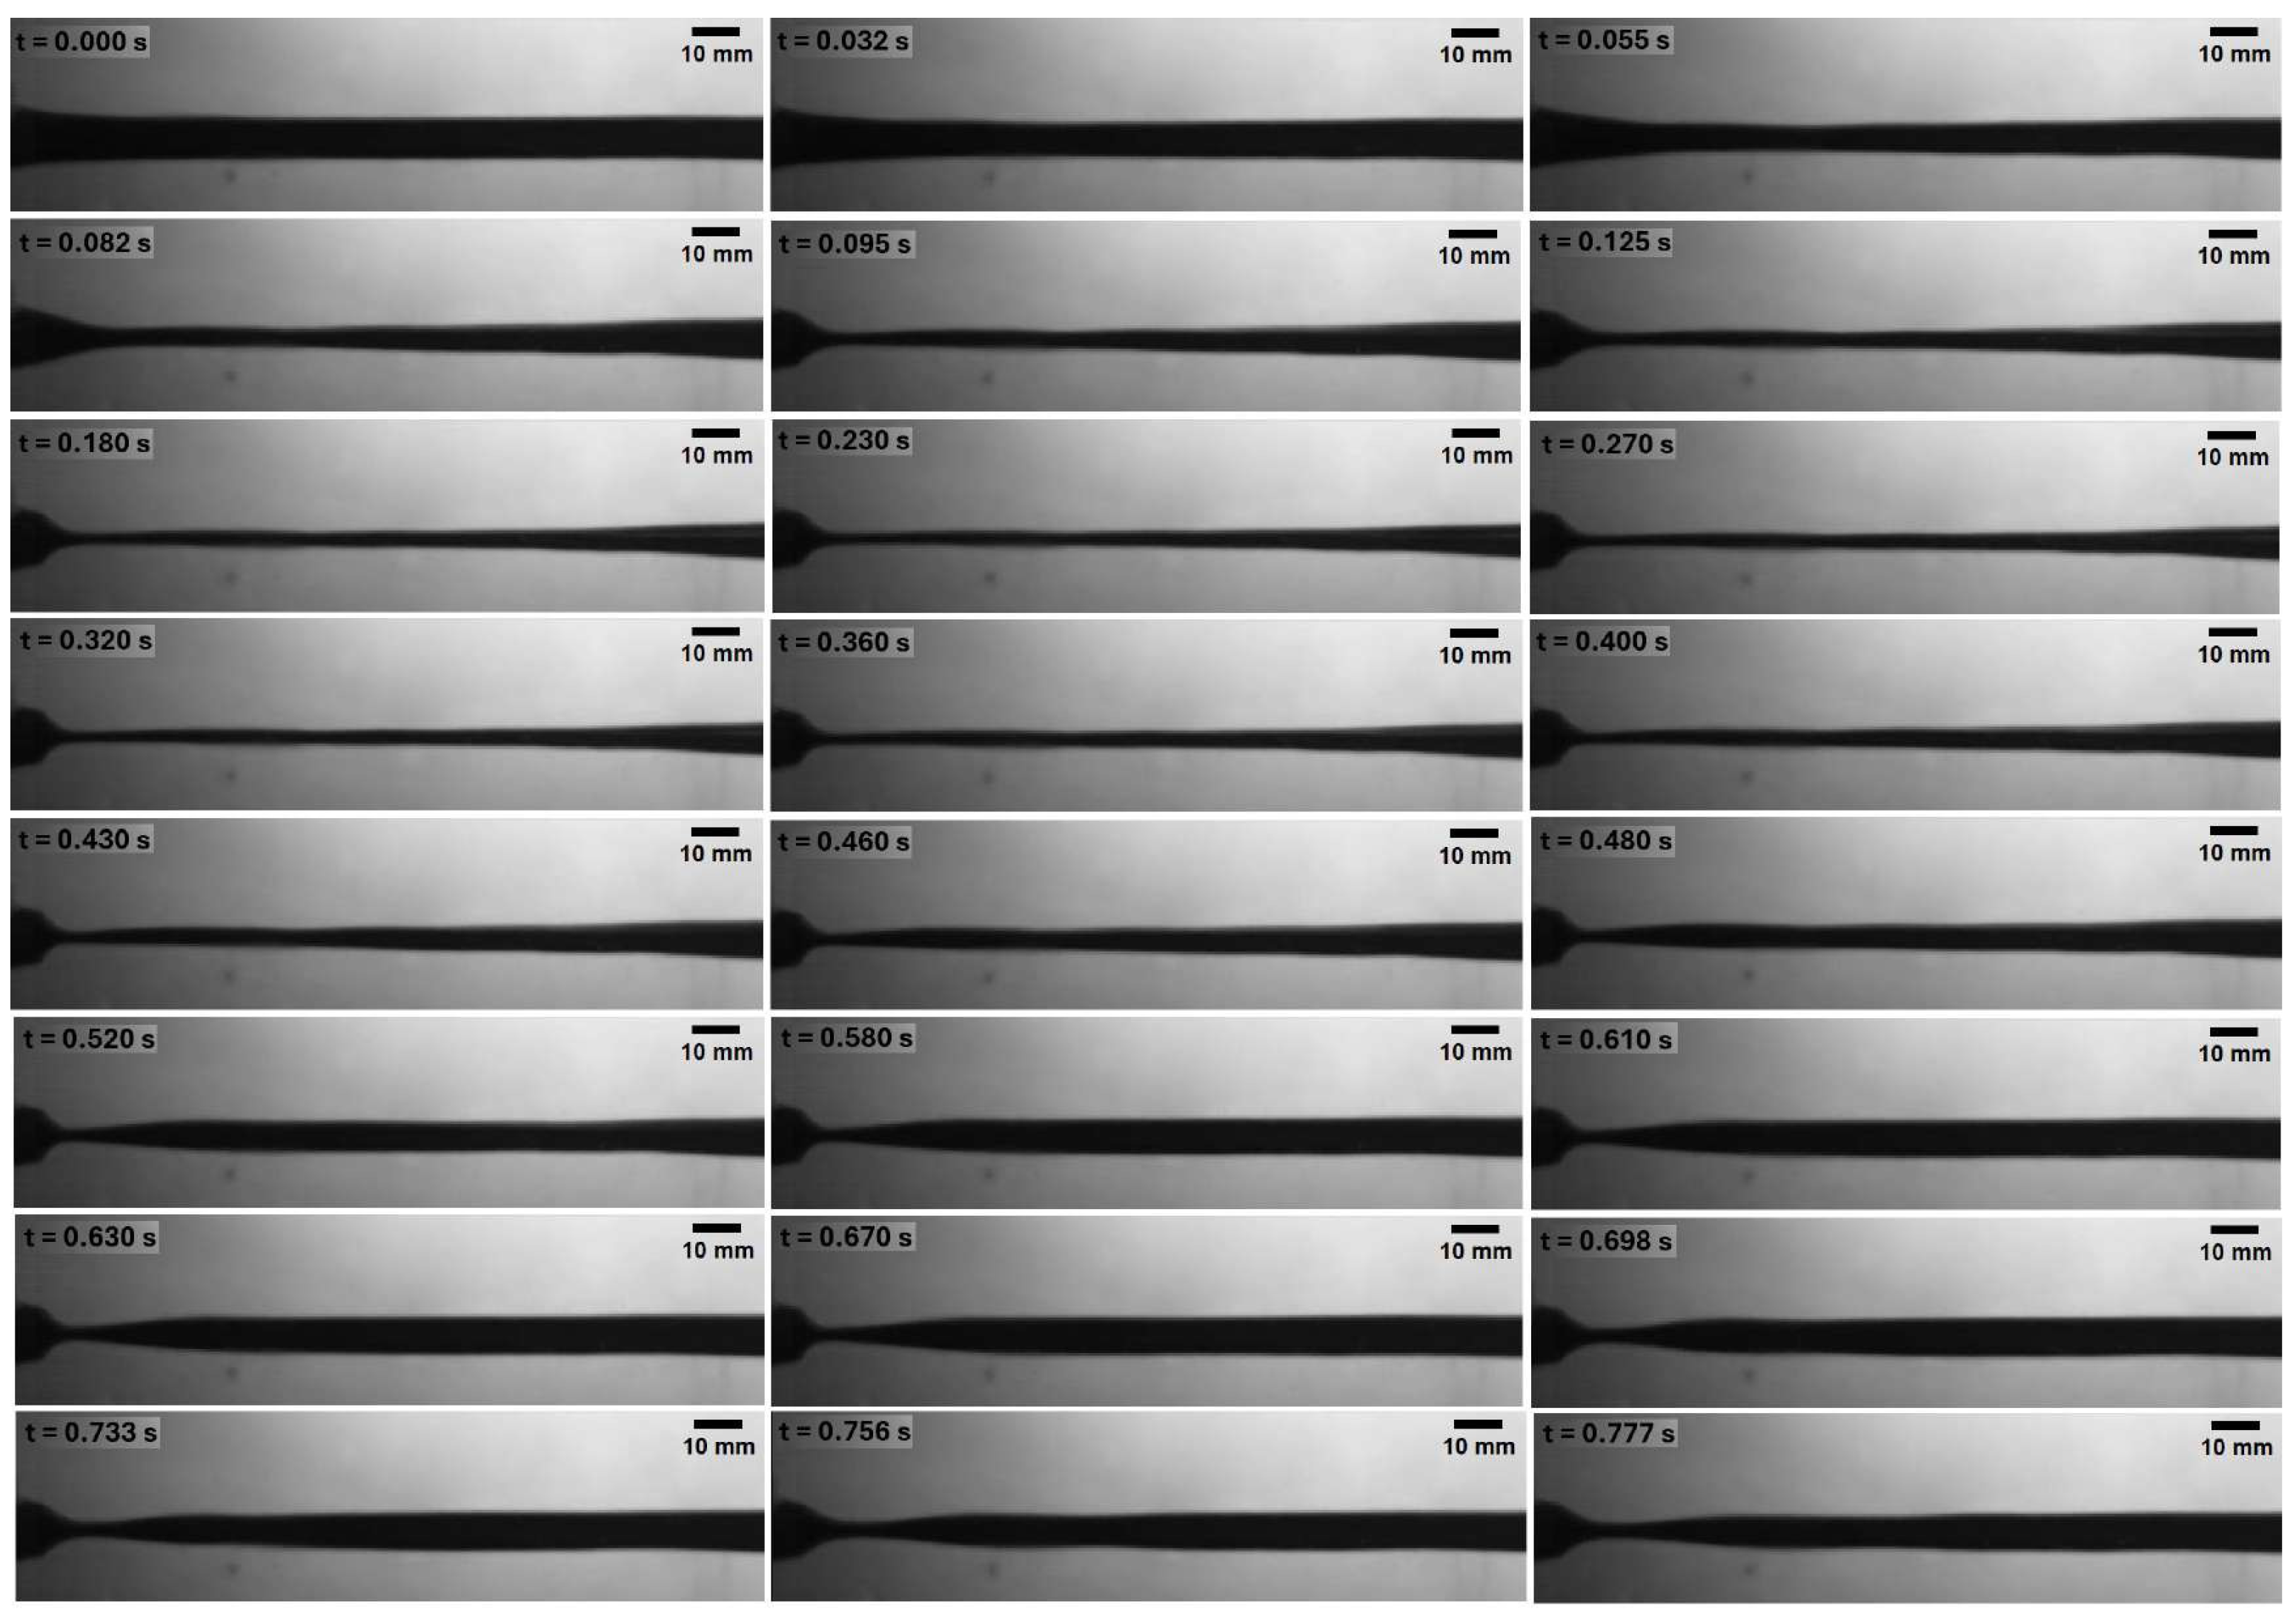
Figure 7 shows the sequences of the first test at 10 cm of hydrostatic pressure on the elastic tube. The frames have been taken each time there is a radical change in the elastic tube, at t = 400 s it reaches its minimum radius. elastic tube and after that time it tries to return to its initial state. It is observed that a neck is still present upstream of the elastic tube, but there is still flow within it.
Figure 7.
Sequence of images obtained from the first test at a hydrostatic pressure of = 981 Pa.
Figure 7.
Sequence of images obtained from the first test at a hydrostatic pressure of = 981 Pa.
Figure 8.
Sequence of images obtained from the first test at a hydrostatic pressure of = 1.962 kPa.
Figure 8.
Sequence of images obtained from the first test at a hydrostatic pressure of = 1.962 kPa.
Figure 9.
Sequence of images obtained from the first test at a hydrostatic pressure of = 2.943 kPa.
Figure 9.
Sequence of images obtained from the first test at a hydrostatic pressure of = 2.943 kPa.
Figure 8 shows the sequences of the second test at 20 cm of hydrostatic pressure on the elastic tube. At t = 250 s it reaches its minimum radius of the elastic tube and after that time it tries to return to its initial state. Again, it is observed that a neck is still present upstream of the elastic tube, but there is still flow within it.
Finally, the sequences of the second test at 30 cm of hydrostatic pressure on the elastic tube are observed. We observe that it reaches its minimum radius at t = 0.200 s, since the hydrostatic pressure is greater, it tries to return to its initial state but reaches it almost after 3,360 s.
5. Conclusions
We can observe how the deformation of the tube varies depending on the applied hydrostatic pressure and volumetric flow, which allows us to better understand the elastic properties of the material. These experiments on elastic tubes are an interesting way to study in different fields of science and technology.
The Moens-Korteweg expression of pulsatile flow presents agreement with the experiments carried out in terms of the pulse speed of propagation of the waves of the incompressible fluid within the elastic tube subjected to hydrostatic pressure. In the context of biomechanics this expression is fundamental for understand how pressure and velocity waves are transmitted.
Acknowledgments
This research was funded by the Mexican CONAHCYT-SENER-Hidrocarburos Programme under grant number B-S-69926 agreement 220001. The authors of this paper are grateful to the Laboratory of complex system at the UAM-A for their valuable contributions and provision of resources.
References
- Shukurov, Z. K.; Yuldoshev,B. Sh.; Begjanov,A. Investigation of hydraulic resistance of pulsating flows of viscous fluid in elastic pipe. Proceedings of the Annual Conference Powering Canada’s Future Vol. 2, Toronto, Canadian Nuclear Society, 1997, pp. 1–20. CONMECHYDRO-2022 E3S Web of Conferences 365, 03026 (2023).
- Womersley, J.R. Oscillatory flow in arteries: the constrained elastic tube as a model of arterial flow and pulse transmission. Phys. Med. Biol. 2014, 2, 178–187. [Google Scholar] [CrossRef] [PubMed]
- Rodkiewicz, C.M. Arteries and arterial blood flow, 3rd ed.; International Centre for Mechanical Sciences, Courses and lectures - No. 270, Springer-Verlag Wien, UNIVERSITY OF ALBERTA. 1983; pp. 129–140.
- Kuchkarovich, S.Z. Method for determining hydraulic resistance during fluid flow in pipes. IJIERT 2021, 8 12, 80–84. [Google Scholar]
- Sarraf, S.; López, E.; D’Elía, J.; Craiem, D. Analysis of flow pulse propagation in elastic pipes for the estimation of arterial stiffness. Asociación Argentina de Mecánica Computacional 2022, 39, 901–910. [Google Scholar]
- Desjardins, B.; Esteban, M.J.; Grandmont, C.; le Talec, P. Weak solutions for a fluid-structure interaction model. Rev. Mat. Comput. 2001, 14, 523–538. [Google Scholar] [CrossRef]
- Gilbert, R.P.; Mikelic, A. Homogenizing the acoustic properties of the seabed: Part I. Nonlin. Anal. Theory Methods Appl. 2000, 40, 185–212. [Google Scholar] [CrossRef]
- Grandmont, C.; Maday, Y. Existence for an unsteady fluid-structure interaction problem. Math. Model. Numer. Anal. 2000, 34, 609–636. [Google Scholar] [CrossRef]
- Canic, S.; Mikelic, A. Effective equations modeling the flow of a viscous incompressible fluid through a long elastic tube arising in the study of blood flowthrough small arteries. SIAM J. Appl. Dyn. Syst. 2003, 2, 431–463. [Google Scholar] [CrossRef]
- Canic, S.; Tambaca, J.; Guidoboni, G.; Mikelic, A.; Hartley, C.J.; Rosenstrauch, D. Modeling viscoelastic behavior of arterial walls and their interaction with pulsate blood flow. SIAM J. Appl. Math. 2006, 67, 164–193. [Google Scholar] [CrossRef]
- Mikelic, A.; Guidoboni, G.; Canic, S. Fluid-structure interaction in a pre-stressed tube with thick elastic walls. I. The stationary Stokes problem. Netw. Heterog. Media 2007, 2, 397–423. [Google Scholar] [CrossRef]
- Long, G.; Liu, Y.; Xu, W.; Zhou, P.; Zhou, J.; Xu, G.; Xiao, B. Analysis of crack problems in multilayered elastic medium by a consequtive stiffness method. Mathematics 2022, 10, 4403. [Google Scholar] [CrossRef]
- Batchelor, G. An Introduction To Fluid Dynamics, 2000 ed.; THE UNIVERSITY OF CAMBRIDGE: The Pitt Building, Trumpington Street, Cambridge, United Kingdom, 2000; pp. 154–196.
- Landau, L.D.; Lifshitz, E.M.; Sykes, J.B.; Reid, W.H.; Feshbach, H. Fluid Mechanics. Physics Today 1961, 14, 62. [Google Scholar] [CrossRef]
- Zamir, M. The Physics of Pulsatile Flow, Springer ed.; Department of Applied Mathematics University of Westem Ontario London, Ontario, Canada.
- Antar, N.; Demiray, H.; The boundary layer approximation and nonlinear waves in elastic tubes. International Journal of Engineering Science, 38, 1441-1457, 2000.
- Malfliet, W.; Ndayirinde, I. Dressed solitary waves in an elastic tube, Physica D, 123, 92- 98, 1998.
- Demiray, H. Waves In Fluid-Filled Elastic Tubes With A Stenosis: Variable Coefficients Kdv Equations. Journal of Computational and Applied Mathematics 202, 328 – 338, 2007.
- Akaike, H. Fitting autoregressive models for prediction. Ann Inst Stat Math, 21, 243-247, 1969.
- Timoshenko, S.P.; Gere, J.M. Theory of Elastic Stability, 1985; Vol. 1985, pp. 1-99.
- R.G.; J. Kith N. Mechanical Engineering Design, 2012; Vol. 9, pp. 30-36.
- Pezzing, G.G. Unsteady Flow in Hydraulic Networks with Polymeric Additional Pipe. J. Hydraul. Eng. 2002, 128, 238–244. [Google Scholar] [CrossRef]
- ASTM D412-16, Standard Test Methods for Vulcanized Rubber and Thermoplastic Elastomers-Tension, ASTM International, West Conshohocken, PA, 2016. Available online: www.astm.org.
- Ferry, J.D. Viscoelastic Properties of Polymers; John Wiley and Sons: Chichester, UK, 1980. [Google Scholar]
- Lowe, G.D.O.; Barbenel, C.; Forbes, C.D. Clinical Aspects of Blood Viscosity and Cell Deformability, 3rd ed.; Royal College of Physicians and Surgeonsof Glasgow, Springer-Verlag, 1987; pp. 129–140.
|
Disclaimer/Publisher’s Note: The statements, opinions and data contained in all publications are solely those of the individual author(s) and contributor(s) and not of MDPI and/or the editor(s). MDPI and/or the editor(s) disclaim responsibility for any injury to people or property resulting from any ideas, methods, instructions or products referred to in the content. |
© 2024 by the authors. Licensee MDPI, Basel, Switzerland. This article is an open access article distributed under the terms and conditions of the Creative Commons Attribution (CC BY) license (https://creativecommons.org/licenses/by/4.0/).
