Submitted:
06 July 2024
Posted:
09 July 2024
You are already at the latest version
Abstract
Keywords:
1. Introduction
2. Materials and Methods
2.1. Isolation and Preparation of Microbial Suspension
2.2. Investigating the Probiotic Properties
2.2.1. Hemolytic Activity
2.2.2. Acid Test
2.2.3. Bile Salts Test
2.2.4. Antagonistic Assay
2.2.5. Antibiogram Assay
2.2.6. Attachment of Bacteria to the Epithelial Cells
2.2.7. Molecular Identification
2.3. Farm Experiment
2.3.1. Diet Composition and Experimental Treatments
2.3.2. Animal Experiment
2.3.3. Evaluation of Growth Parameters
2.3.4. Biochemical and Safety Analyses
2.3.5. Microbial Experiments
2.4. Real-Time Quantitative PCR (qPCR) Analysis
2.5. Data Analysis
3. Results
3.1. Isolation and Screening of Putative Probiotic Bacteria
3.2.1. Physicochemical Indicators
3.2.2. Animal Experiment and Growth Performance
3.2.3. Hematological Parameters
3.2.4. Biochemical and Immune Parameters
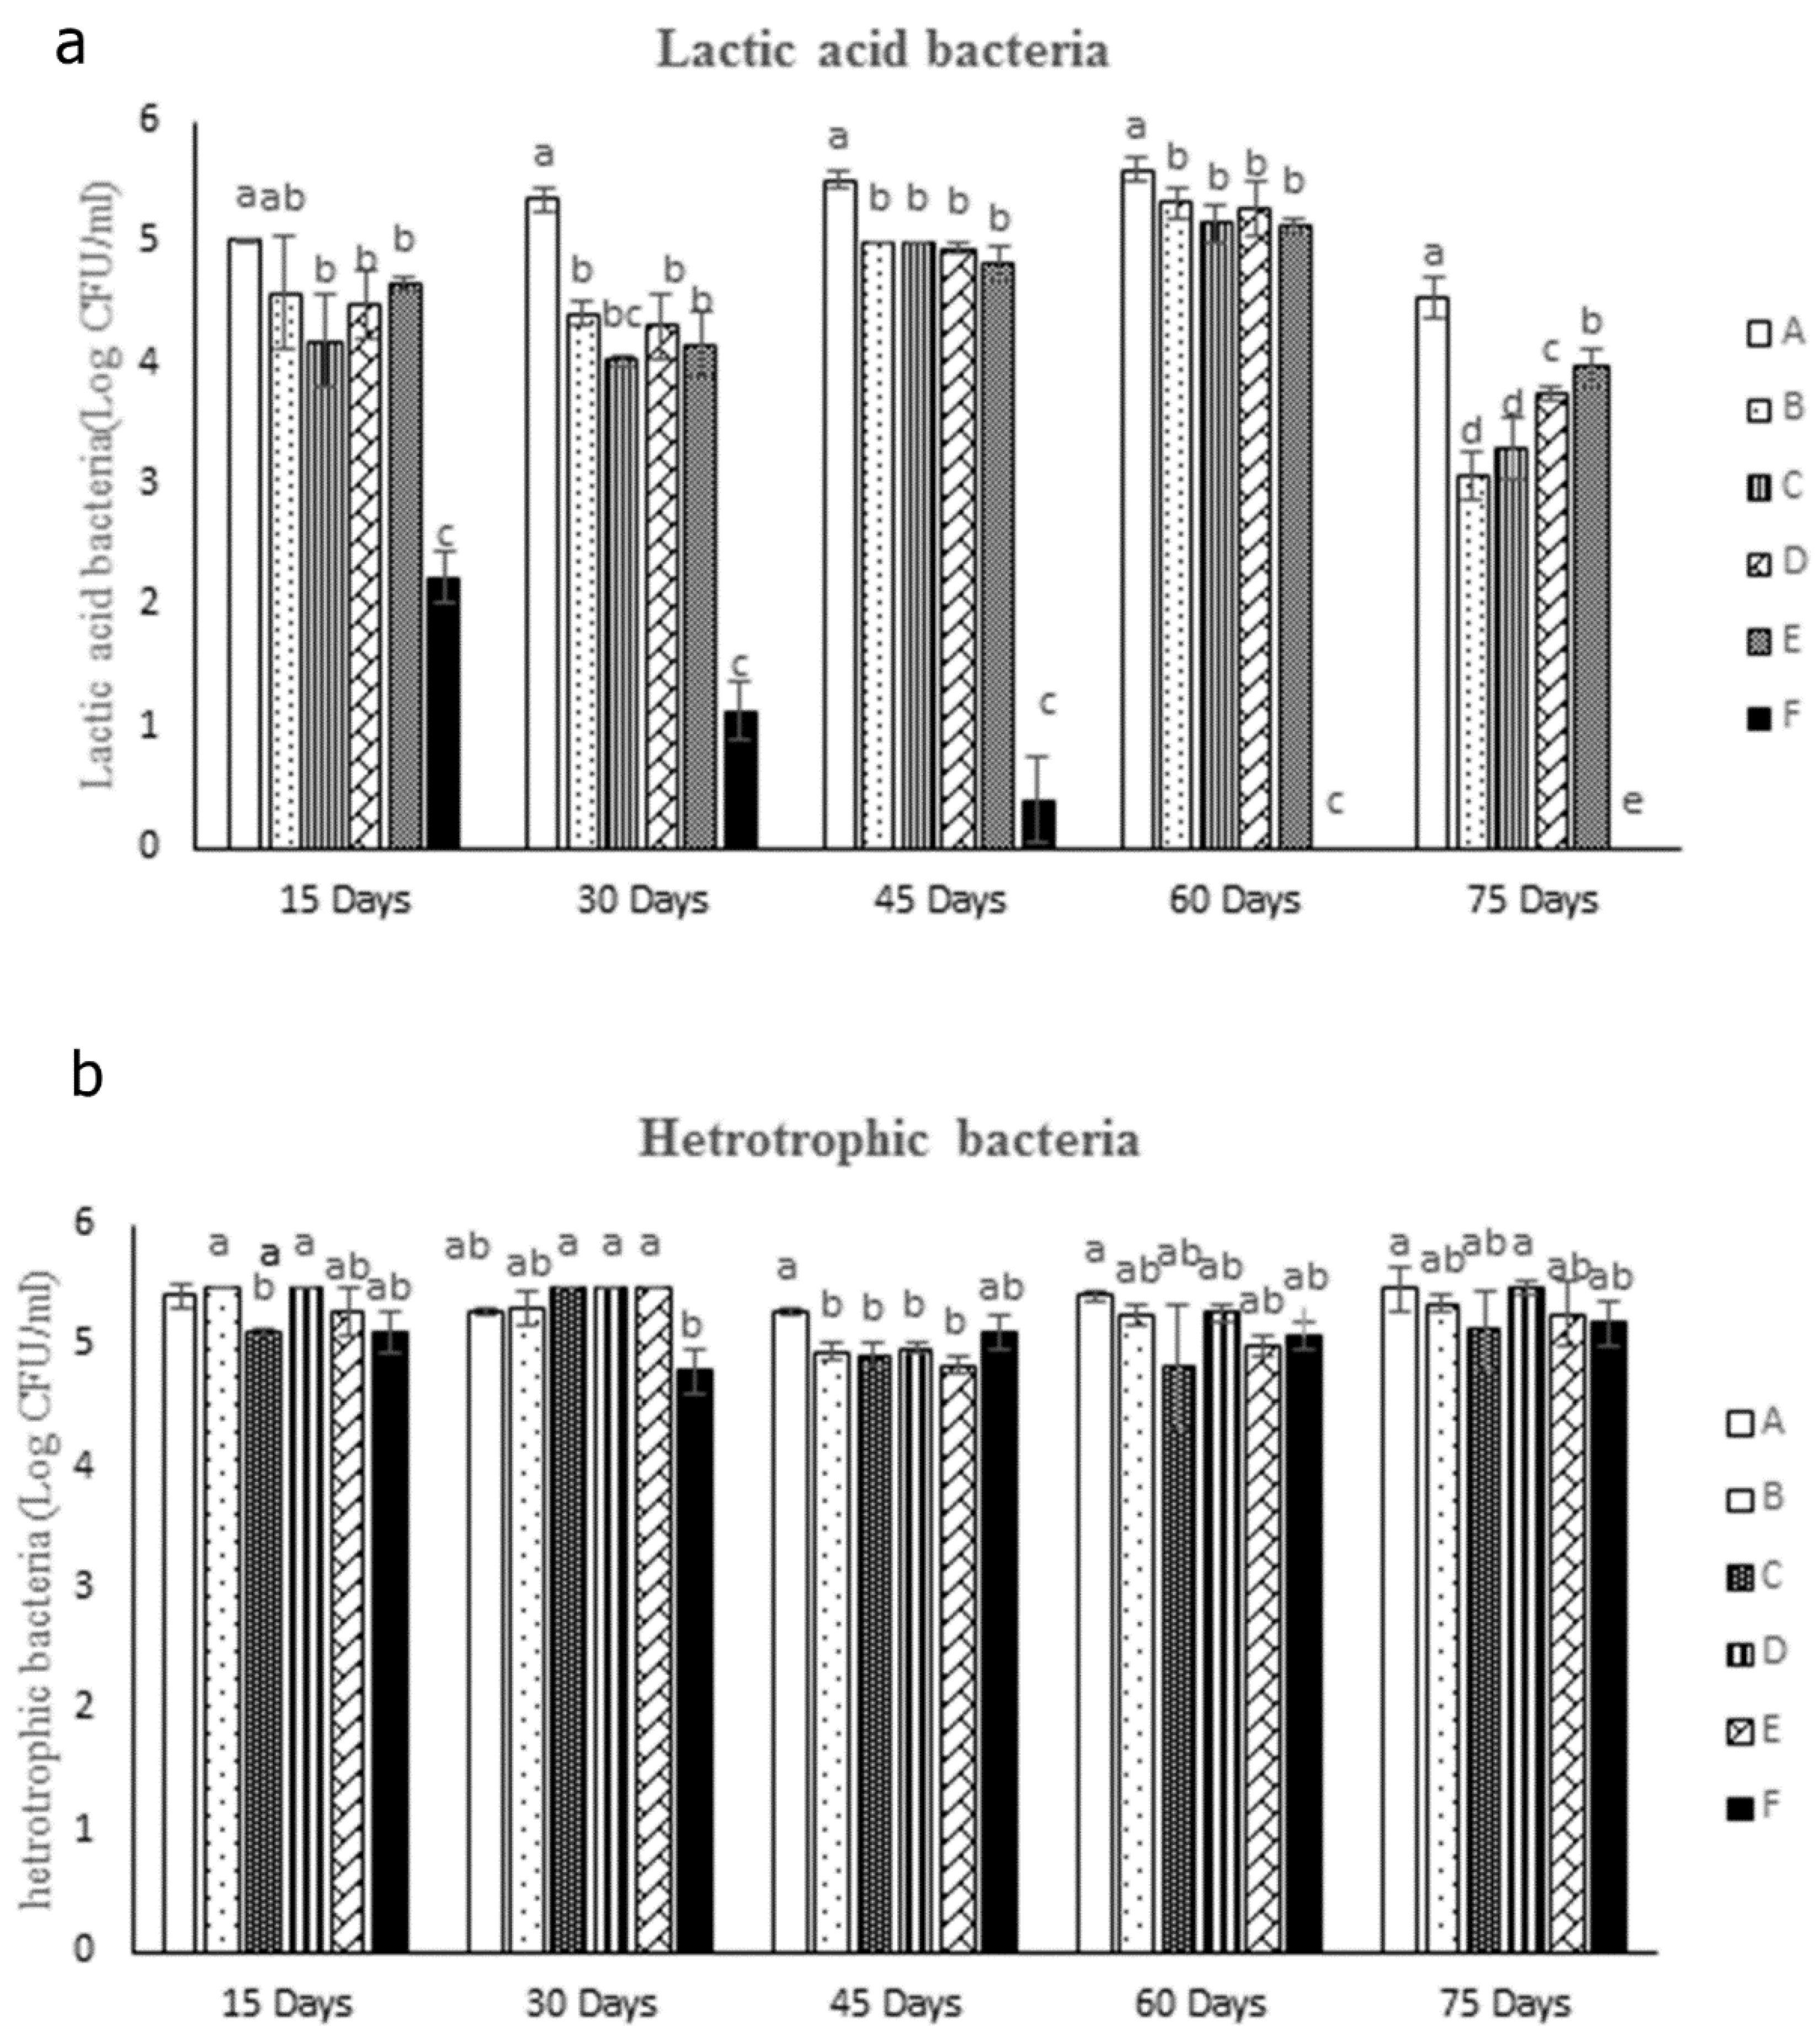
3.2.5. Intestinal Bacteria Measurement
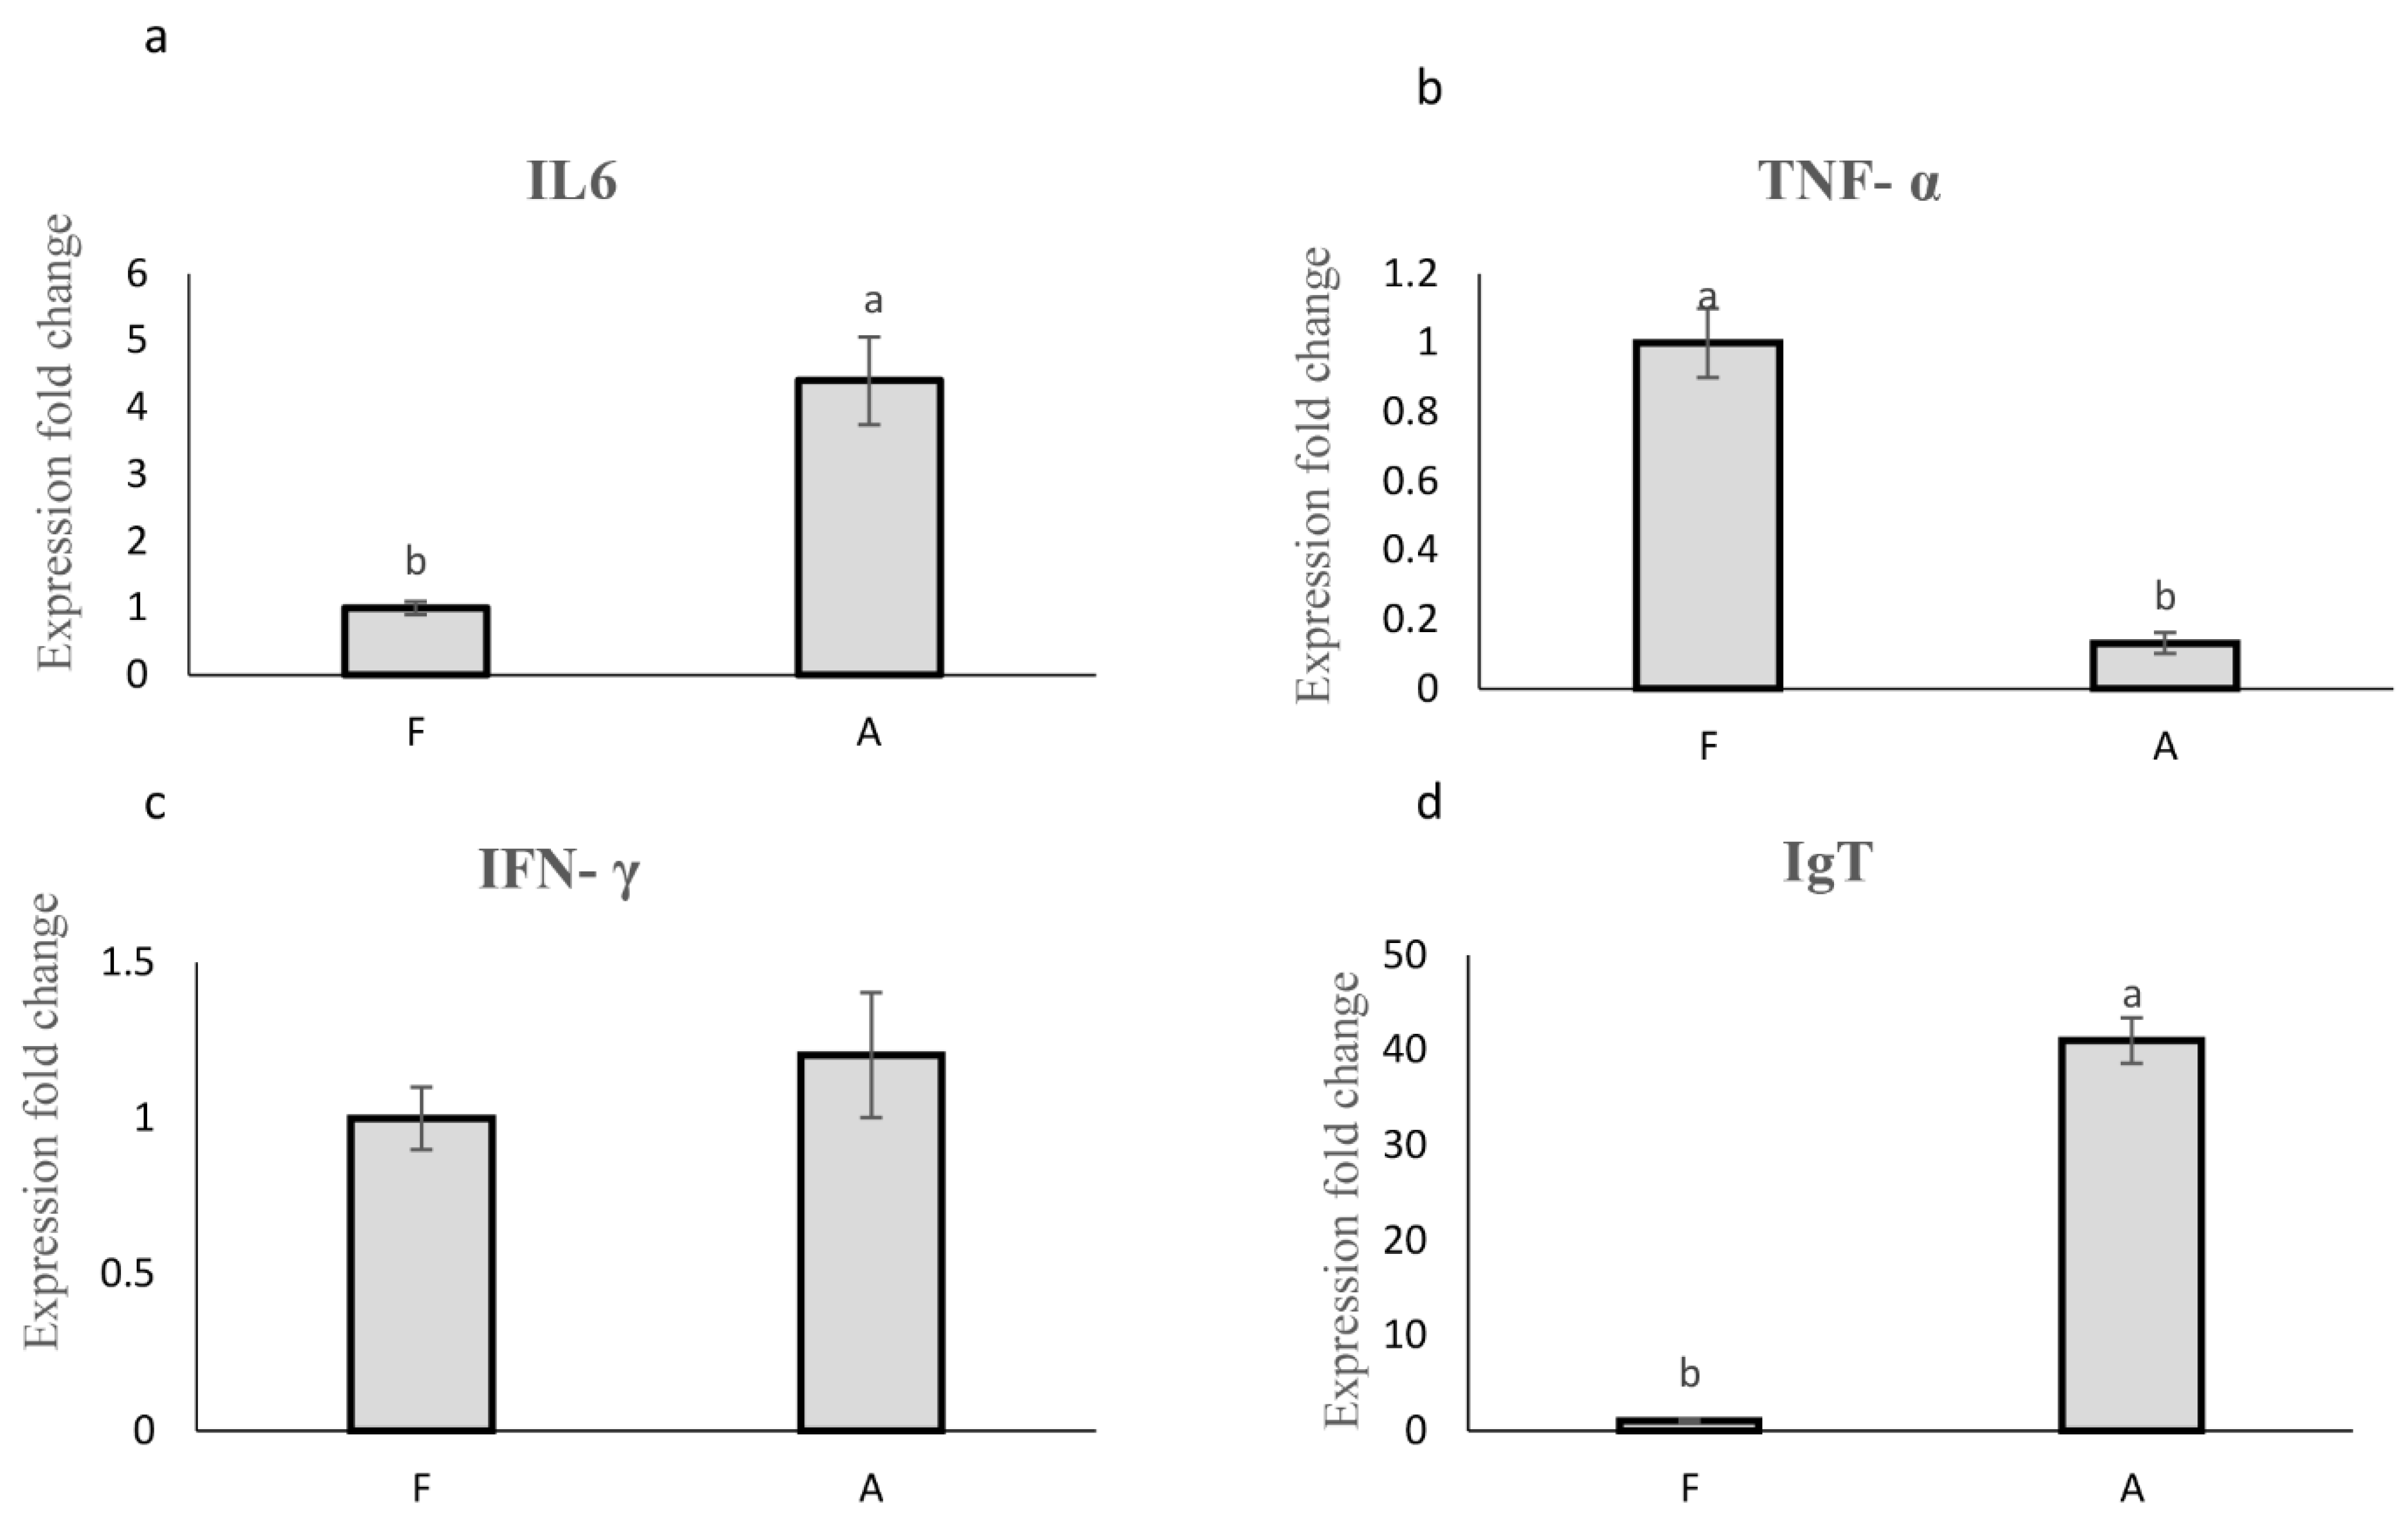
3.3. Relative mRNA Expression of Immune-Related Genes
4. Discussion
5. Conclusion
Author Contributions
Data Availability Statement
Ethical Approval
Acknowledgments
Conflict of Interest
References
- D’Agaro, E.; Gibertoni, P.; Esposito, S. “Recent Trends and Economic Aspects in the Rainbow Trout (Oncorhynchus mykiss) Sector”. Appl. Sci. 2022, 12, 8773. [Google Scholar] [CrossRef]
- FAO ed, “Contributing to food security and nutrition for all.”, Rome, 2016.
- Thorgaard, G.H.; Bailey, G.S.; Williams, D.; Buhler, D.R.; Kaattari, S.L.; Ristow, S.S.; Hansen, J.D.; Winton, J.R.; Bartholomew, J.L.; Nagler, J.J.; Walsh, P.J.; Vijayan, M.M.; Devlin, R.H.; Hardy, R.W.; Overturf, K.E.; Young, W.P.; Robison, B.D.; Rexroad, C.; Palti, Y. “Status and opportunities for genomics research with rainbow trout”. Comp. Biochem. Physiol. B Biochem. Mol. Biol. 2002, 133, 609–646. [Google Scholar] [CrossRef]
- Saettone, V.; Biasato, I.; Radice, E.; Schiavone, A.; Bergero, D.; Meineri, G. “State-of-the-Art of the Nutritional Alternatives to the Use of Antibiotics in Humans and Monogastric Animals”. Anim. Open Access J. MDPI. 2020, 10, 2199. [Google Scholar] [CrossRef] [PubMed]
- Monzón-Atienza, L.; Bravo, J.; Serradell, A.; Montero, D.; Gómez-Mercader, A.; Acosta, F. “Current Status of Probiotics in European Sea Bass Aquaculture as One Important Mediterranean and Atlantic Commercial Species: A Review”. Animals. 2023, 13, 2369. [Google Scholar] [CrossRef]
- Wuertz, S.; Schroeder, A.; Wanka, K.M. “Probiotics in Fish Nutrition—Long-Standing Household Remedy or Native Nutraceuticals?”. Water. 2021, 13, 1348. [Google Scholar] [CrossRef]
- Yasmin; Saeed, M. ; Khan, W.A.; Khaliq, A.; Chughtai, M.F.J.; Iqbal, R.; Tehseen, S.; Naz, S.; Liaqat, A.; Mehmood, T.; Ahsan, S.; Tanweer, S. “In Vitro Probiotic Potential and Safety Evaluation (Hemolytic, Cytotoxic Activity) of Bifidobacterium Strains Isolated from Raw Camel Milk.” Microorganisms. 2020, 8, 354.
- Yu, Z.; Zhang, X.; Li, S.; Li, C.; Li, D.; Yang, Z. “Evaluation of probiotic properties of Lactobacillus plantarum strains isolated from Chinese sauerkraut”. World J. Microbiol. Biotechnol. 2013, 29, 489–498. [Google Scholar] [CrossRef]
- Sato, S.T.A.; Marques, J.M.; da Luz de Freitas, A.; Progênio, R.C.S.; Nunes, M.R.T.; de Vasconcelos Massafra, J.M.; Moura, F.G.; Rogez, H. “Isolation and Genetic Identification of Endophytic Lactic Acid Bacteria From the Amazonian Açai Fruits: Probiotics Features of Selected Strains and Their Potential to Inhibit Pathogens.” Front. Microbiol. 2021, 11.
- Kavitha, M.; Raja, M.; Perumal, P. “Evaluation of probiotic potential of Bacillus spp. isolated from the digestive tract of freshwater fish Labeo calbasu (Hamilton, 1822).” Aquac. Rep. 2018, 11, 59–69. [Google Scholar]
- Hechard, Y.; Dherbomez, M.; Cenatiempo, Y.; Letellier, F. “Antagonism of lactic acid bacteria from goats’ milk against pathogenic strains assessed by the ‘sandwich method. ’” Lett. Appl. Microbiol. 1990, 11, 185–188. [Google Scholar] [CrossRef]
- Dimitrov, Z.; Gotova, I.; Chorbadjiyska, E. “In vitro characterization of the adhesive factors of selected probiotics to Caco-2 epithelium cell line”. Biotechnol. Biotechnol. Equip. 2014, 28, 1079–1083. [Google Scholar] [CrossRef]
- Pérez-Sánchez, T.; Balcázar, J.L.; Merrifield, D.L.; Carnevali, O.; Gioacchini, G.; De Blas, I.; Ruiz-Zarzuela, I. “Expression of immune-related genes in rainbow trout (Oncorhynchus mykiss) induced by probiotic bacteria during Lactococcus garvieae infection”. Fish Shellfish Immunol. 2011, 31, 196–201. [Google Scholar] [CrossRef] [PubMed]
- Evenhuis, J.P.; Cleveland, B.M. “Modulation of rainbow trout (Oncorhynchus mykiss) intestinal immune gene expression following bacterial challenge”. Vet. Immunol. Immunopathol. 2012, 146, 8–17. [Google Scholar] [CrossRef] [PubMed]
- Pfaffl, M.W. “A new mathematical model for relative quantification in real-time RT-PCR”. Nucleic Acids Res. 2001, 29, e45. [Google Scholar] [CrossRef] [PubMed]
- Zhu, L.; Kong, Y.; Chang, X.; Feng, J.; Wang, X.; Hou, L.; Zhao, X.; Pei, C.; Kong, X. “Effects of two fish-derived probiotics on growth performance, innate immune response, intestinal health, and disease resistance of Procambarus clarkii”. Aquaculture. 2023, 562, 738765. [Google Scholar] [CrossRef]
- Mondal, S.; Debashri, M.; Mondal, T.; Malik, J. “Application of probiotic bacteria for the management of fish health in aquaculture.” Bacterial Fish Diseases. pp. 351–378 (2022).
- Hoseinifar, S.H.; Sun, Y.-Z.; Wang, A.; Zhou, Z. “Probiotics as Means of Diseases Control in Aquaculture, a Review of Current Knowledge and Future Perspectives.” Front. Microbiol. 2018, 9.
- Audisio, M.C. “Gram-Positive Bacteria with Probiotic Potential for the Apis mellifera L. Honey Bee: The Experience in the Northwest of Argentina.” Probiotics Antimicrob. Proteins. 2017, 9, 22–31. [Google Scholar] [PubMed]
- Chen, J.; Chen, X.; Ho, C.L. “Recent Development of Probiotic Bifidobacteria for Treating Human Diseases.” Front. Bioeng. Biotechnol. 2021, 9.
- Wang, J.; Chen, L. “Impact of a Novel Nano-Protectant on the Viability of Probiotic Bacterium Lactobacillus casei K17”. Foods. 2021, 10, 529. [Google Scholar] [CrossRef]
- Bălbărău; Ivanescu, L. M.; Martinescu, G.; Rîmbu, C.M.; Acatrinei, D.; Lazar, M.; Cocean, I.; Gurlui, S.; Cocean, A.; Miron, L. “Septicemic Outbreak in A Rainbow Trout Intensive Aquaculture System: Clinical Finds, Etiological Agents, and Predisposing Factors.” Life. 2023, 13, 2083.
- Daneshamouz, S.; Haghi, F.; Zeighami, H. “Detection and Identification of Bacterial Pathogens in Rainbow Trout (Oncorhynchus mykiss) Samples from Fish Farms in Iran”. Thalass. Int. J. Mar. Sci. 2020, 36, 133–141. [Google Scholar] [CrossRef]
- Al-Hisnawi; Rodiles, A. ; Rawling, M.D.; Castex, M.; Waines, P.; Gioacchini, G.; Carnevali, O.; Merrifield, D.L. “Dietary probiotic Pediococcus acidilactici MA18/5M modulates the intestinal microbiota and stimulates intestinal immunity in rainbow trout (Oncorhynchus mykiss).” J. World Aquac. Soc. 2019, 50, 1133–1151.
- Kahyani, F.; Pirali-Kheirabadi, E.; Shafiei, S.; Masouleh, A.S. “Effect of dietary supplementation of potential probiotic Weissella confusa on innate immunity, immune-related genes expression, intestinal microbiota and growth performance of rainbow trout (Oncorhynchus mykiss)”. Aquac. Nutr. 2021, 27, 1411–1420. [Google Scholar] [CrossRef]
- Martinez, M.P.; Pereyra, M.L.G.; Pena, G.A.; Poloni, V.; Juri, G.F.; Cavaglieri, L.R. “Pediococcus acidolactici and Pediococcus pentosaceus isolated from a rainbow trout ecosystem have probiotic and ABF1 adsorbing/degrading abilities in vitro”. Food Addit. Contam. Part Chem. Anal. Control Expo. Risk Assess. 2017, 34, 2118–2130. [Google Scholar] [CrossRef] [PubMed]
- Yeganeh, S.; Adel, M.; Nosratimovafagh, A.; Dawood, M.A.O. “The Effect of Lactococcus lactis subsp. lactis PTCC 1403 on the Growth Performance, Digestive Enzymes Activity, Antioxidative Status, Immune Response, and Disease Resistance of Rainbow Trout (Oncorhynchus mykiss).” Probiotics Antimicrob. Proteins. 2021, 13, 1723–1733. [Google Scholar] [PubMed]
- Pérez-Sánchez, T.; Ruiz-Zarzuela, I.; de Blas, I.; Balcázar, J.L. “Probiotics in aquaculture: a current assessment”. Rev. Aquac. 2014, 6, 133–146. [Google Scholar] [CrossRef]
- del M, M.; Coll, J.; Rimstad, E. “Editorial: The role of red blood cells in the immune response of fish.” Front. Immunol. 2022, 13.
- de C, D.; Tachibana, L.; Iwashita, M.K.P.; Nakandakare, I.B.; Romagosa, E.; Seriani, R.; Ranzani-Paiva, M.J.T. “Probiotic supplementation causes hematological changes and improves non-specific immunity in Brycon amazonicus.” Acta Sci. Biol. Sci. 2020, 42.
- Mohapatra, S.; Chakraborty, T.; Prusty, A.K.; PaniPrasad, K.; Mohanta, K.N. “Beneficial Effects of Dietary Probiotics Mixture on Hemato-Immunology and Cell Apoptosis of Labeo rohita Fingerlings Reared at Higher Water Temperatures”. PLOS ONE. 2014, 9, e100929. [Google Scholar] [CrossRef] [PubMed]
- Xia, H.; Lu, J.; Yang, P.; Chen, F.; Zhang, Y.; Liu, L.; Chen, Z.; Huang, R. “Research Progress in Molecular Biology of Fish Immunoglobulin M (IgM)”. Isr. J. Aquac. - Bamidgeh. 2023, 75, 1–7. [Google Scholar] [CrossRef]
- Kuebutornye, F.K.A.; Tang, J.; Cai, J.; Yu, H.; Wang, Z.; Abarike, E.D.; Lu, Y.; Li, Y.; Afriyie, G. “In vivo assessment of the probiotic potentials of three host-associated Bacillus species on growth performance, health status and disease resistance of Oreochromis niloticus against Streptococcus agalactiae”. Aquaculture. 2020, 527, 735440. [Google Scholar] [CrossRef]
- Soltani, M.; Pakzad, K.; Taheri-Mirghaed, A.; Mirzargar, S.; Shekarabi, S.P.H.; Yosefi, P.; Soleymani, N. “Dietary Application of the Probiotic Lactobacillus plantarum 426951 Enhances Immune Status and Growth of Rainbow Trout (Oncorhynchus mykiss) Vaccinated Against Yersinia ruckeri”. Probiotics Antimicrob. Proteins. 2019, 11, 207–219. [Google Scholar] [CrossRef]
- Soltani, M. “Effect of the probiotic, Lactobacillus plantarum on growth performance and haematological indices of rainbow trout (Oncorhynchus mykiss) immunized with bivalent streptococcosis / lactococcosis vaccine.” Iran. J. Fish. Sci. no. Online First, 2018.
- Singh, R.; Wang, Z.; Marques, C.; Min, R.; Zhang, B.; Kumar, S. “Alanine aminotransferase detection using TIT assisted four tapered fiber structure-based LSPR sensor: From healthcare to marine life”. Biosens. Bioelectron. 2023, 236, 115424. [Google Scholar] [CrossRef] [PubMed]
- Rader, B.A. “Alkaline Phosphatase, an Unconventional Immune Protein.” Front. Immunol. 2017, 8.
- Hasan, K.N.; Banerjee, G. “Recent studies on probiotics as beneficial mediator in aquaculture: a review”. J. Basic Appl. Zool. 2020, 81, 53. [Google Scholar] [CrossRef]
- Hasan; Rimoldi, S. ; Saroglia, G.; Terova, G. “Sustainable Fish Feeds with Insects and Probiotics Positively Affect Freshwater and Marine Fish Gut Microbiota.” Animals. 2023, 13, 1633.
- Knobloch, S.; Skírnisdóttir, S.; Dubois, M.; Kolypczuk, L.; Leroi, F.; Leeper, A.; Passerini, D.; Marteinsson, V.Þ. “Impact of Putative Probiotics on Growth, Behavior, and the Gut Microbiome of Farmed Arctic Char (Salvelinus alpinus).” Front. Microbiol. 2022, 13.
- Moroni, F.; Naya-Català, F.; Piazzon, M.C.; Rimoldi, S.; Calduch-Giner, J.; Giardini, A.; Martínez, I.; Brambilla, F.; Pérez-Sánchez, J.; Terova, G. “The Effects of Nisin-Producing Lactococcus lactis Strain Used as Probiotic on Gilthead Sea Bream (Sparus aurata) Growth, Gut Microbiota, and Transcriptional Response.” Front. Mar. Sci. 2021, 8.
- De, B.C.; Meena, D.K.; Behera, B.K.; Das, P.; Mohapatra, P.K.D.; Sharma, A.P. “Probiotics in fish and shellfish culture: immunomodulatory and ecophysiological responses”. Fish Physiol. Biochem. 2014, 40, 921–971. [Google Scholar]
- Dang, Y.; Sun, Y.; Zhou, Y.; Men, X.; Wang, B.; Li, B.; Ren, Y. “Effects of probiotics on growth, the toll-like receptor mediated immune response and susceptibility to Aeromonas salmonicida infection in rainbow trout Oncorhynchus mykiss”. Aquaculture. 2022, 561, 738668. [Google Scholar] [CrossRef]
- Hasan, K.N.; Banerjee, G. “Recent studies on probiotics as beneficial mediator in aquaculture: a review”. J. Basic Appl. Zool. 2020, 81, 53. [Google Scholar] [CrossRef]
- Yimin; Kohanawa, M. “A regulatory effect of the balance between TNF-alpha and IL-6 in the granulomatous and inflammatory response to Rhodococcus aurantiacus infection in mice.” J. Immunol. Baltim. Md 2006, 177, 642–650.
- Deichaite; Sears, T. J.; Sutton, L.; Rebibo, D.; Morgan, K.; Nelson, T.; Rose, B.; Tamayo, P.; Ferrara, N.; Asimakopoulos, F.; Carter, H. “Differential regulation of TNFα and IL-6 expression contributes to immune evasion in prostate cancer.” J. Transl. Med. 2022, 20, 527.
- Ahmadi-Noorbakhsh, S.; Ardakani, E.M.; Sadighi, J.; Aldavood, S.J.; Abbasi, M.F.; Farzad-Mohajeri, S.; Ghasemi, A.; Sharif-Paghaleh, E.; Hatami, Z.; Nikravanfard, N.; Gooshki, E.S. “Guideline for the Care and Use of Laboratory Animals in Iran”. Lab Anim. 2021, 50, 303–305. [Google Scholar] [CrossRef]
| Pathogens | ATCC |
| Staphylococcus aureus | ATCC 25923 |
| Bacillus. Cereus | ATCC 29213 |
| Yersinia ruckeri | PTCC 1888 |
| Listeria Monocytogens | ATCC 13932 |
| Pseudomonas aeruginosa | ATCC27853 |
| Escherichia coli (E. coli) | ATCC 25922 |
| Candida albicans | ATCC 10231 |
| Enterococcus faecalis | ATCC 29219 |
| gene | Accession number | Primer sequence | Tm | Product length in mRNA | Product length in DNA |
| IL6 | NM_001124657.1 | CGCTCGTGGTGTTAGTTAAGGG CGGGCTTCTGAAACTCCTCC |
60 60 |
201 | 858 |
| TNF |
NM_001124357 | TTATGTGCGGCAGCAGCC CCGTCATCCTTTCTCCACTGC |
61 60 |
221 | 843 |
| Ig T |
AY870265 | GTACTCTGACCATAGACCAGACA TCCTTCTTGGTGTCTTCCTC |
57 55 |
169 | 490 |
| INF |
NM_001160503.1 | TACCTGAGCTGAGGACACA TCCTGCGGTTGTCCTTCT |
57 58 |
153 | 1600 |
| Beta actin |
EZ908974 | CCTCAACCCCAAAGCCAACA CGGAGTCCATGACGATACC |
60 57 |
141 | 694 |
| Tests | 5A | P3 | E10 | P20 | P37 | ml3 | ml6 | P15 | P12 | 13A | ml4 | m6 | P8 |
| Catalase | - | - | - | - | - | - | - | - | - | - | - | - | - |
| Gram | + | + | + | + | + | + | + | + | + | + | + | + | + |
| Morphology | cocci | cocci | cocci | cocci | cocci | cocci | bacilli | cocci | cocci | bacilli | bacilli | bacilli | cocci |
| Hemolytic | - | - | - | - | - | - | - | - | - | - | - | - | - |
| pH3 time 0 | 2×10⁷ | 2×10⁷ | 2×10⁷ | 2×10⁷ | 2×10⁷ | 2×10⁷ | 2×10⁷ | 2×10⁷ | 2×10⁷ | 2×10⁷ | 2×10⁷ | 2×10⁷ | 2×10⁷ |
| pH3 time 3 | 2×10⁵ | 2×10⁶ | 3×10⁶ | 5×10⁶ | 9×10⁶ | 1×10⁷ | 7.6×10⁶ | 2×10⁷ | 1.6×10⁷ | 4×10⁶ | 2×10⁵ | 6×10⁶ | 1.2×10⁶ |
| 0.3% bile | ≥70 | ≥70 | ≥70 | ≥70 | ≥70 | ≥70 | ≥70 | ≥70 | ≥70 | ≥70 | ≥70 | ≥70 | ≥70 |
| Attachment | weak | good | weak | Very good |
Very good |
good | good | Very good |
good | good | weak | weak | good |
| Strains | S. aureus | B. cereus | L. monocytogens | S. enterica | E. coli | En. faecalis |
P. aeruginosa |
Y. ruckeri |
C. albicans |
|---|---|---|---|---|---|---|---|---|---|
| P37 | >2 | >2 | >2 | >2 | >2 | >2 | >2 | - | >2 |
| P20 | >2 | >2 | >2 | - | >2 | >2 | >2 | >2 | - |
| 10A | >2 | >2 | >2 | >2 | - | - | - | >2 | - |
| 13A | - | - | >2 | - | - | >2 | >2 | - | - |
| 5A | - | - | >2 | >2 | - | >2 | - | >2 | - |
| P3 | >2 | >2 | >2 | - | - | >2 | - | - | - |
| ml6 | >2 | >2 | >2 | >2 | >2 | >2 | >2 | >2 | - |
| m6 | >2 | >2 | >2 | >2 | >2 | >2 | >2 | >2 | >2 |
| ml3 | >2 | >2 | >2 | >2 | >2 | >2 | >2 | >2 | - |
| P15 | >2 | >2 | >2 | >2 | >2 | >2 | >2 | >2 | >2 |
| P12 | >2 | >2 | >2 | - | - | >2 | - | >2 | - |
| P8 | >2 | >2 | >2 | - | - | >2 | - | >2 | - |
| ml4 | - | - | >2 | - | - | >2 | >2 | - | - |
| Antibiotics | Abbreviated name | 5A | P3 | E10 | P20 | P37 | ml3 | ml6 | P15 | P12 | 13A | ml4 | m6 | P8 |
| Clindamycin | CC | R | S | S | S | S | S | S | S | S | S | S | S | S |
| Tetracycline | TE | S | S | S | S | S | M | S | S | S | S | S | S | S |
| Ciprofloxacin | CP | S | R | R | R | R | R | R | R | R | R | R | R | R |
| Chloramphenicol | C | S | S | S | S | S | S | S | S | S | S | S | S | S |
| Penicillin | P | M | S | S | S | S | S | S | S | S | S | S | S | S |
| Erythromycin | E | R | S | S | S | S | S | S | S | S | S | S | S | S |
| Ampicillin | AM | S | S | S | S | S | S | S | S | S | S | S | S | S |
| Streptomycin | S | R | R | R | R | R | R | R | R | R | R | R | R | R |
| rifampin | RA | R | S | S | S | S | S | S | S | S | S | S | S | S |
| gentamicin | GM | S | R | R | R | R | S | S | S | R | R | R | S | R |
| fosfomycin | FO | S | R | R | R | R | R | R | R | R | R | R | R | R |
| Enrofloxacin | NFX | S | R | R | R | R | R | R | R | R | R | R | R | R |
| tylosin | TY | R | S | S | S | S | S | S | S | S | S | S | S | S |
| cholestin | CL | M | R | R | R | R | R | R | R | M | R | R | R | R |
| sultrim | SLT | M | R | R | R | R | R | R | R | R | R | R | R | R |
| Florfenicol | FF | M | S | S | S | S | S | S | S | S | S | S | S | S |
| Flumequine | FM | M | R | R | R | R | R | R | R | R | R | R | R | R |
| Strain | Similarity (%) | Full Name | GenBank Accession Number |
| m6 | 100 | Weissella confusa m6 | MZ066823 |
| ml3 | 99.09 | Lactococcus lactis subsp. lactis strain ml3 | MN947246 |
| ml6 | 99.33 | Weissella cibaria strain ml6 | MN947228 |
| P12 | 99.44 | Pediococcus sp. strain P12 | MN120789 |
| P15 | 99.37 | Pediococcus sp. strain P15 | MN120790 |
| P8 | 99.51 | Pediococcus sp. strain P8 | MN093396 |
| P37 | 97.57 | Pediococcus acidilactici strain P37 | MK758075 |
| P20 | 98.71 | Pediococcus acidilactici strain P20 | MK757969 |
| E10 | 90 | Enterococcus faecium strain E10 | MK757968 |
| 13A | 99% | Lactobacillus curvatus13A | MK757915 |
| Indicators | A | B | C | D | E | F |
| Oxygen (mg/l) | 8.3±0.2 | 8.9±0.2 | 8.3±0.3 | 8.8±0.3 | 8.8±0.3 | 8.8±0.2 |
| pH | 7.96±0.5 | 8.05±0.6 | 7.95±0.5 | 8.02±0.7 | 7.96±0.5 | 7.91±0.7 |
| EC(μS/cm) | 521.3±7 | 519.3±8 | 498.3±9 | 504.2±7 | 494.6±8 | 498.5±6 |
| N-NO2(mg/l) | 0.15±0.08 | 0.18±0.06 | 0.2±0.05 | 0.24±0.05 | 0.2±0.04 | 0.29±0.08 |
| N-NH4(mg/l) | 0.42±0.08 | 0.49±0.04 | 0.46±0.05 | 0.48±0.03 | 0.45±0.05 | 0.44±0.08 |
| P-PO4(mg/l) | 0.194±0.006 | 0.198±0.004 | 0.190±0.008 | 0.194±0.006 | 0.190±0.009 | 0.181±0.006 |
Disclaimer/Publisher’s Note: The statements, opinions and data contained in all publications are solely those of the individual author(s) and contributor(s) and not of MDPI and/or the editor(s). MDPI and/or the editor(s) disclaim responsibility for any injury to people or property resulting from any ideas, methods, instructions or products referred to in the content. |
© 2024 by the authors. Licensee MDPI, Basel, Switzerland. This article is an open access article distributed under the terms and conditions of the Creative Commons Attribution (CC BY) license (https://creativecommons.org/licenses/by/4.0/).


