Submitted:
05 July 2024
Posted:
09 July 2024
Read the latest preprint version here
Abstract
Keywords:
1. Introduction
2. Materials and Methods
2.1. Animals
2.2. Intranasal Treatment with Maresin-like 1
2.3. Harvesting of Murine Brains for Immunohistology
2.4. Immunofluorescence Staining
2.5. Image Quantification
2.6. Thioflavin S Staining and Analysis of Plaques
2.7. Statistical Analysis
3. Results
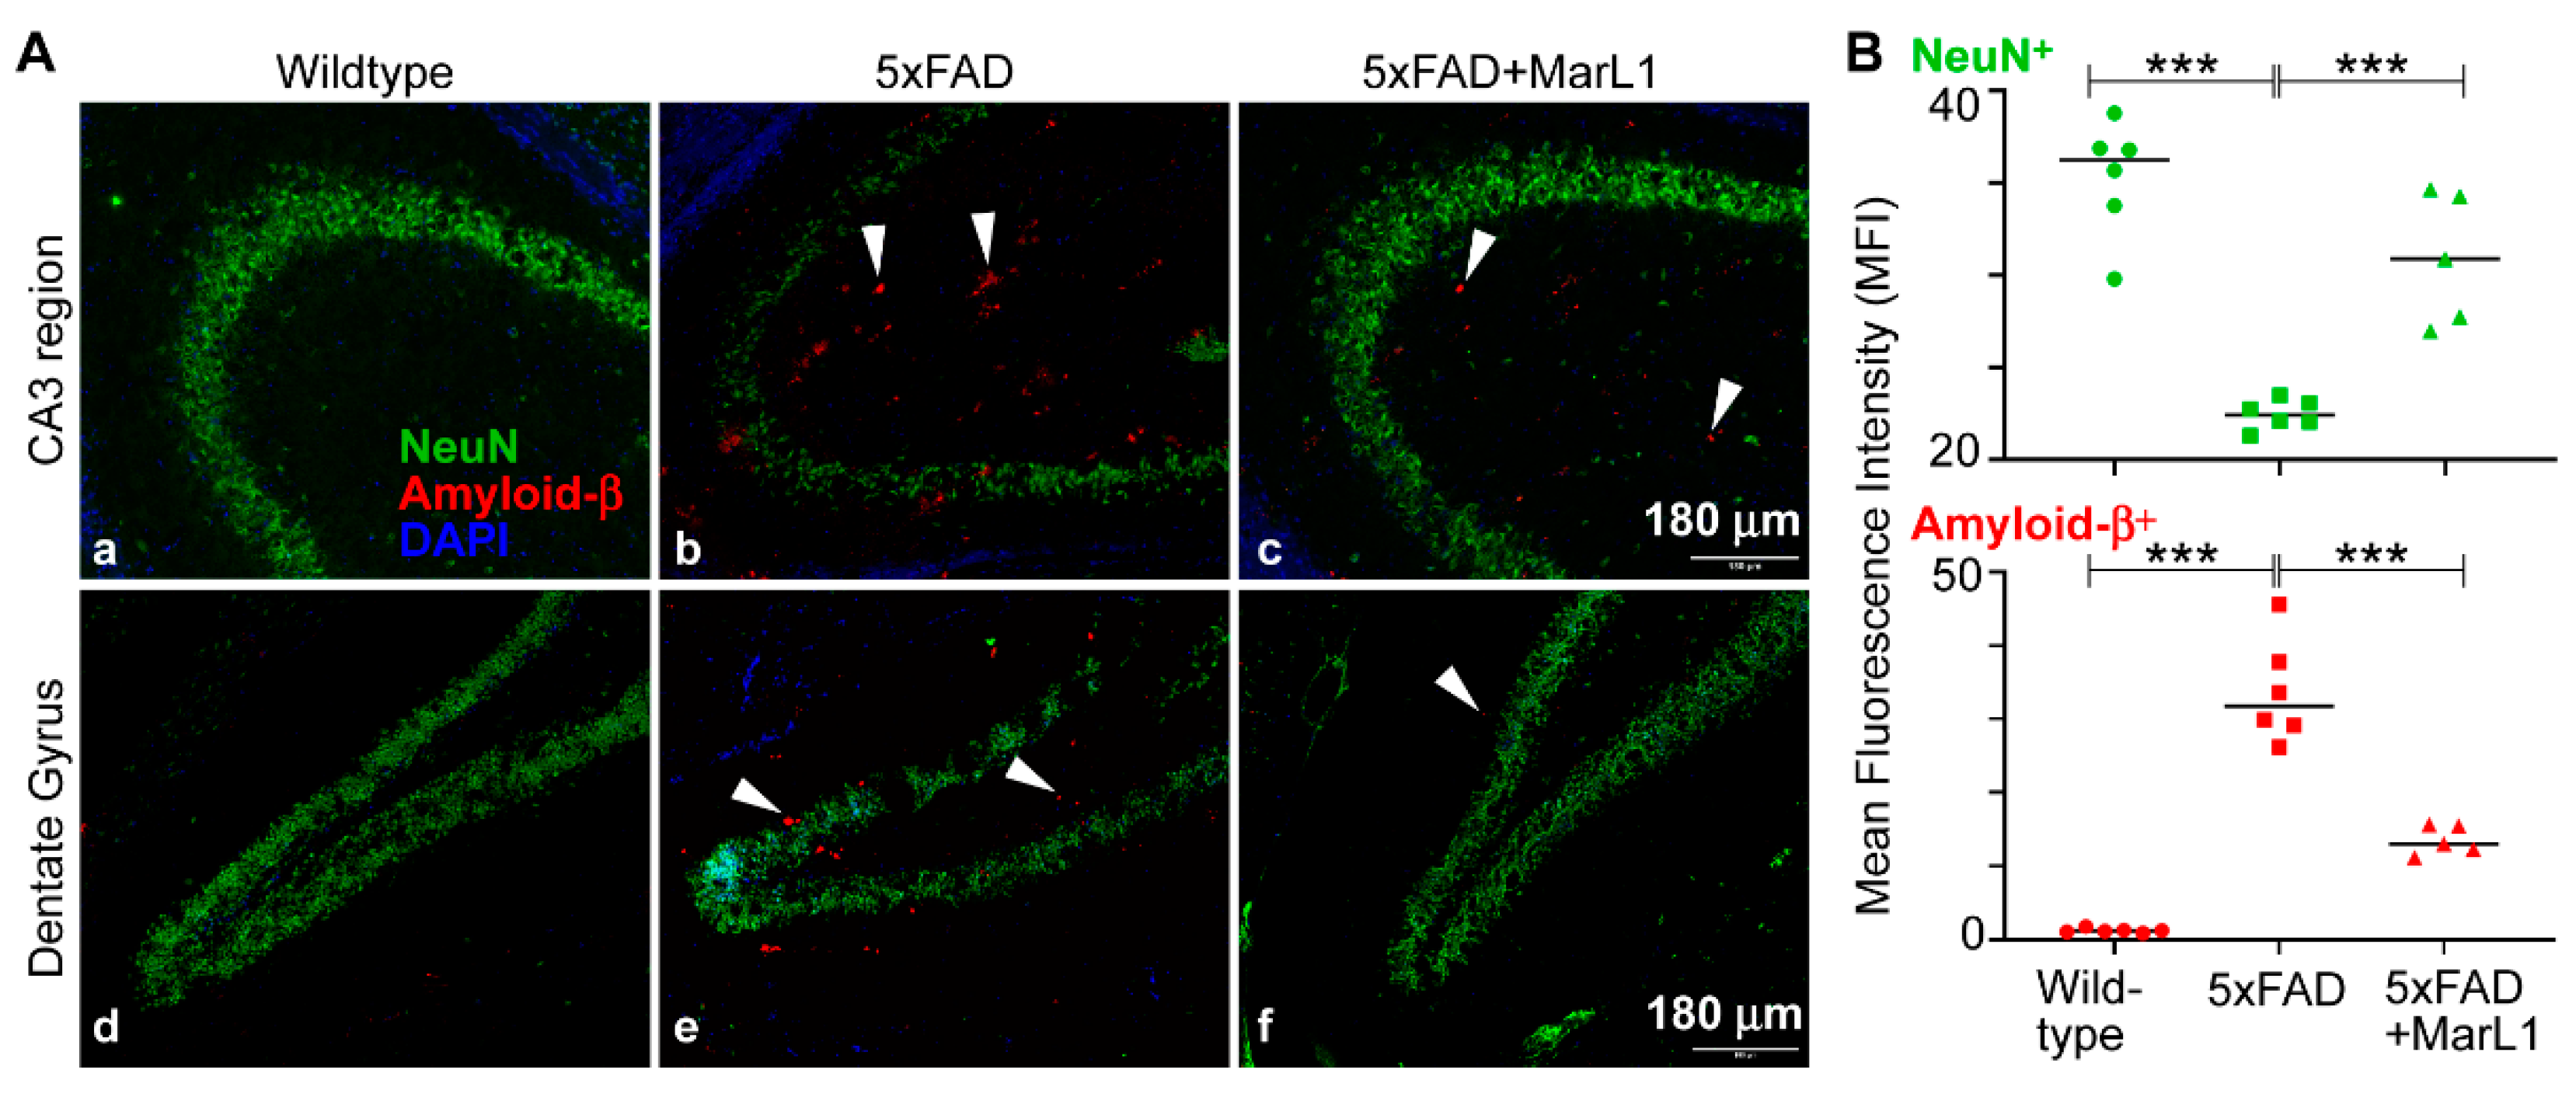
3.1. Maresin-like1 Reduced Aβ Overload and Curbed Neuronal Population Loss in Brain Hippocampi of 5xFAD Mice
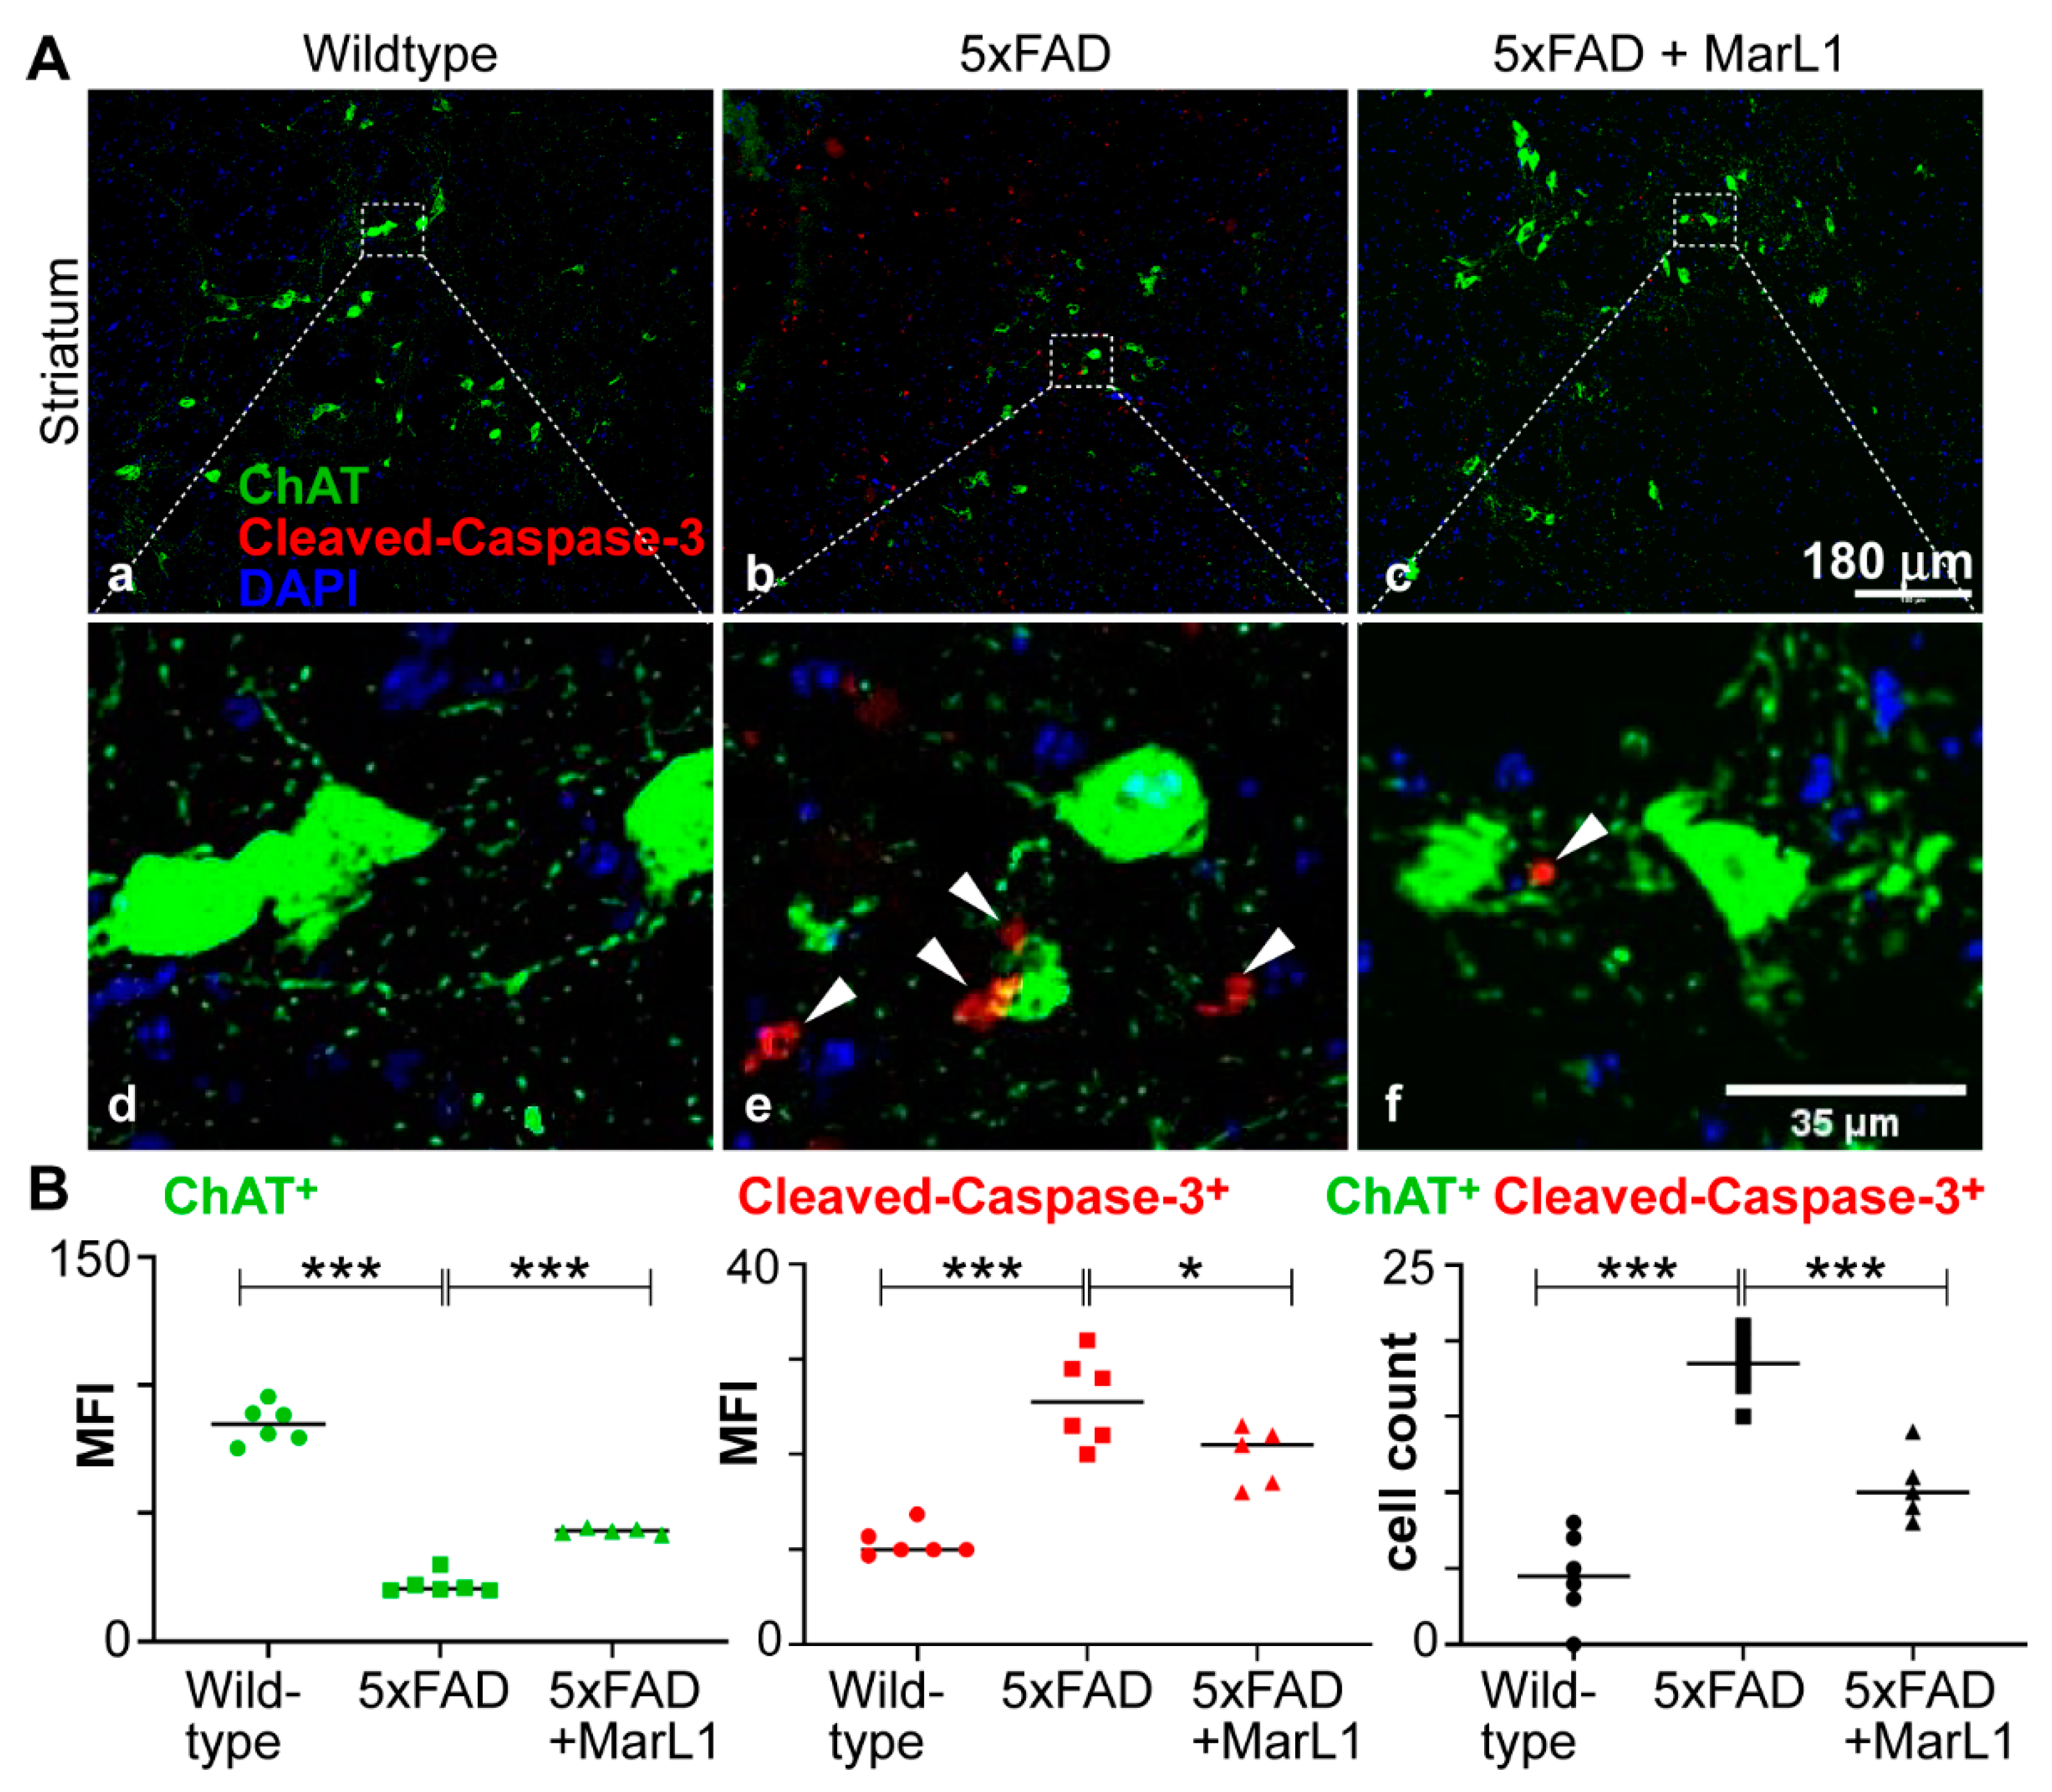
3.2. Maresin-like 1 Treatment of 5xFAD Mice Improved the Survival of Cholinergic Neurons and Decreased Cleaved-Caspase-3-Mediated Apoptotic Degeneration
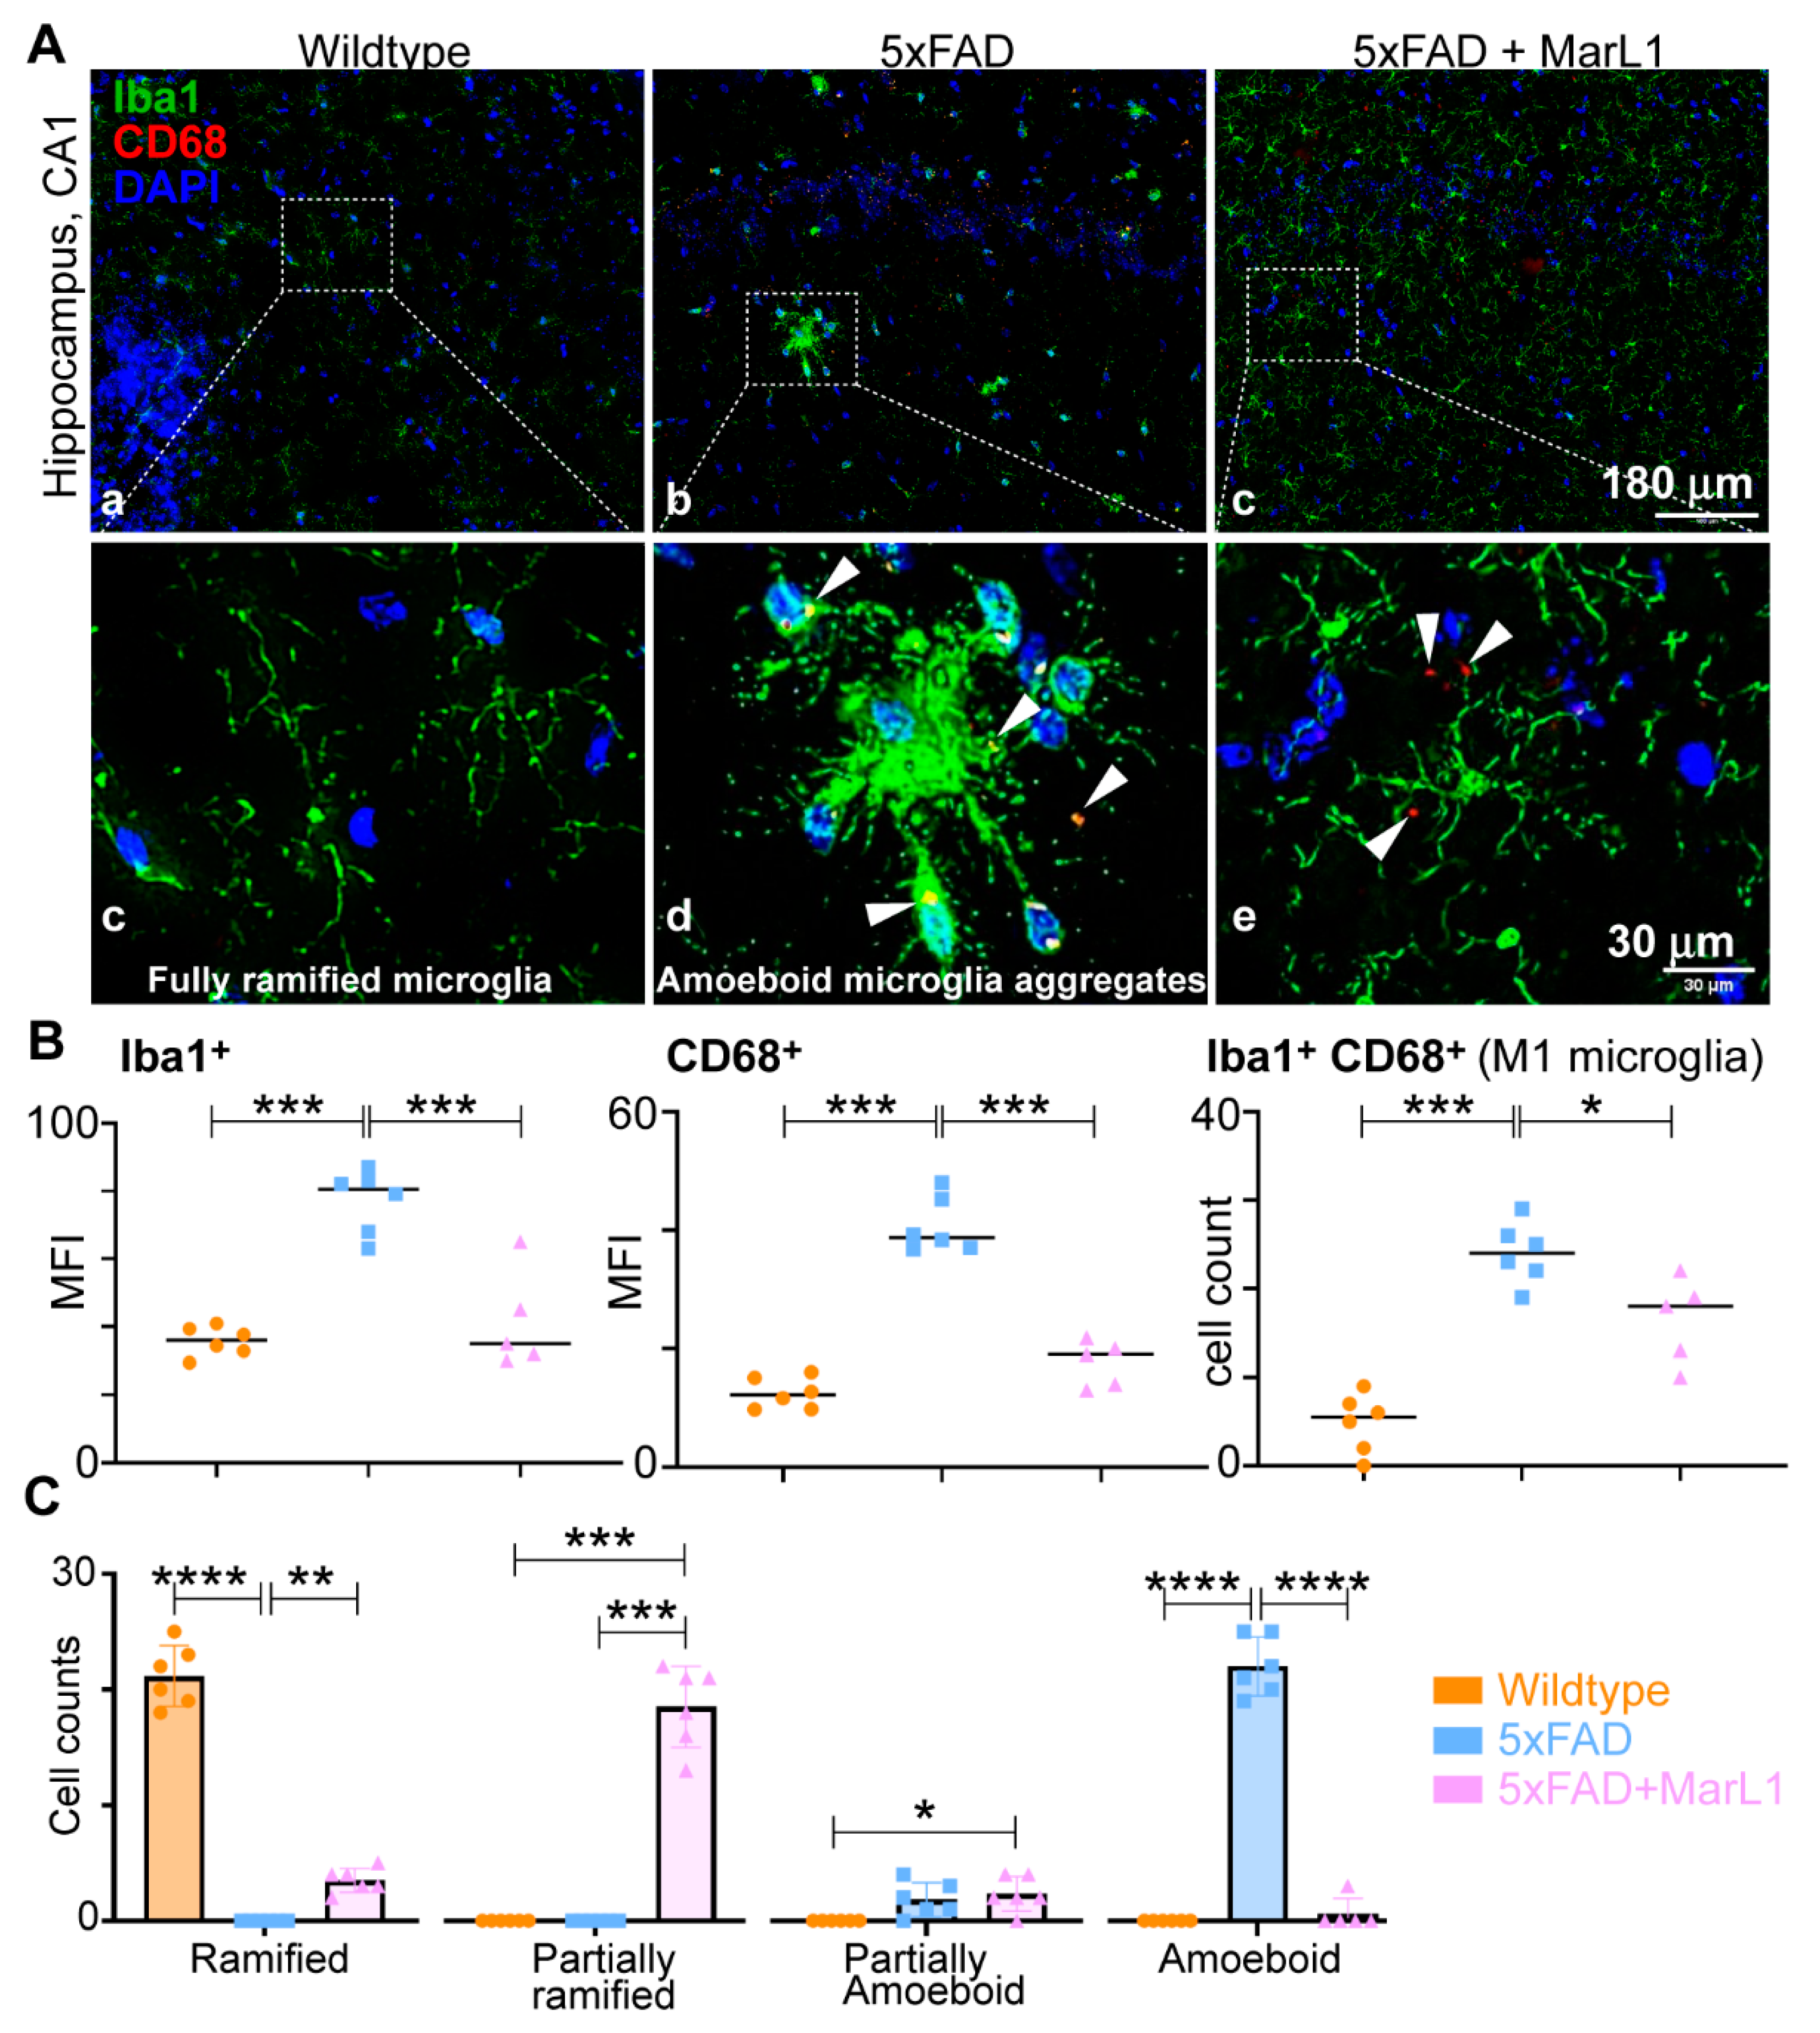
3.3. Maresin-like1 Attenuated the Pro-Inflammatory M1 Phenotypic Switching of Microglia by Inhibiting Iba-1+CD68+ Microglia in Brains of 5xFAD Mice
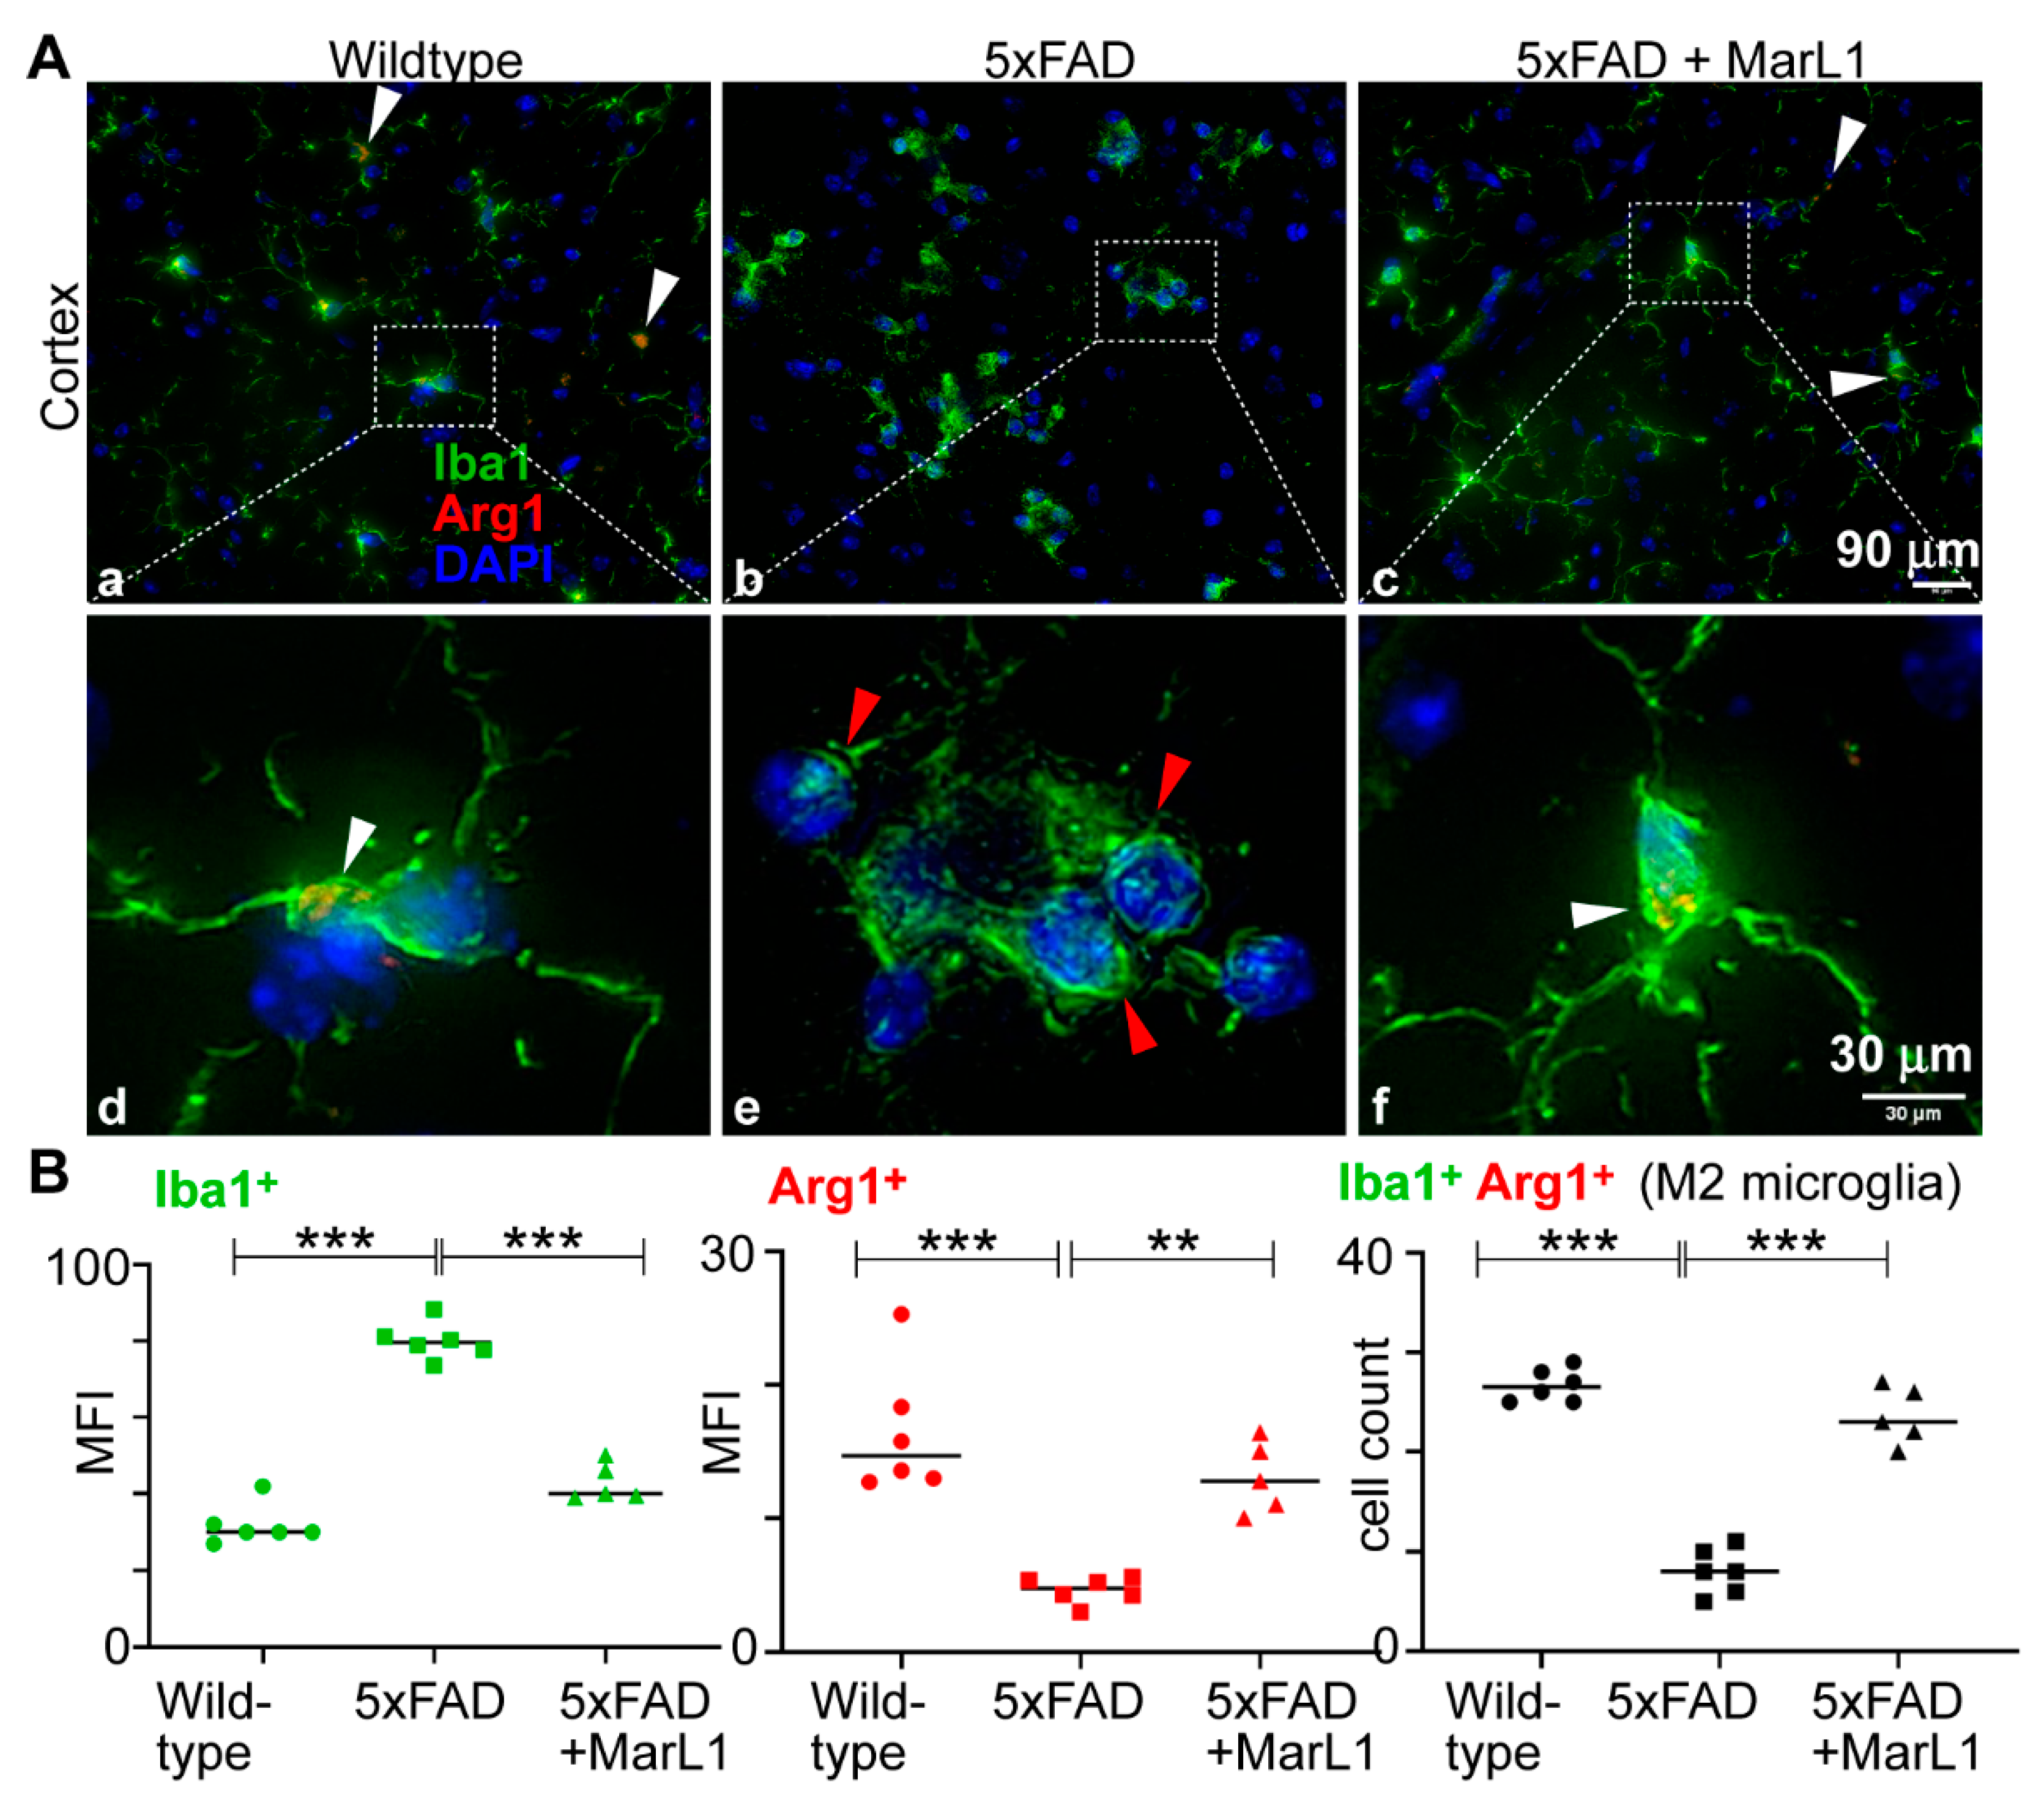
3.4. Maresin-like 1 Curbed the AD Pathogenesis-Associated Decline in the M2 Microglial Population with an Anti-Inflammatory Alternatively Activated Phenotype in Brains of 5xFAD Mice
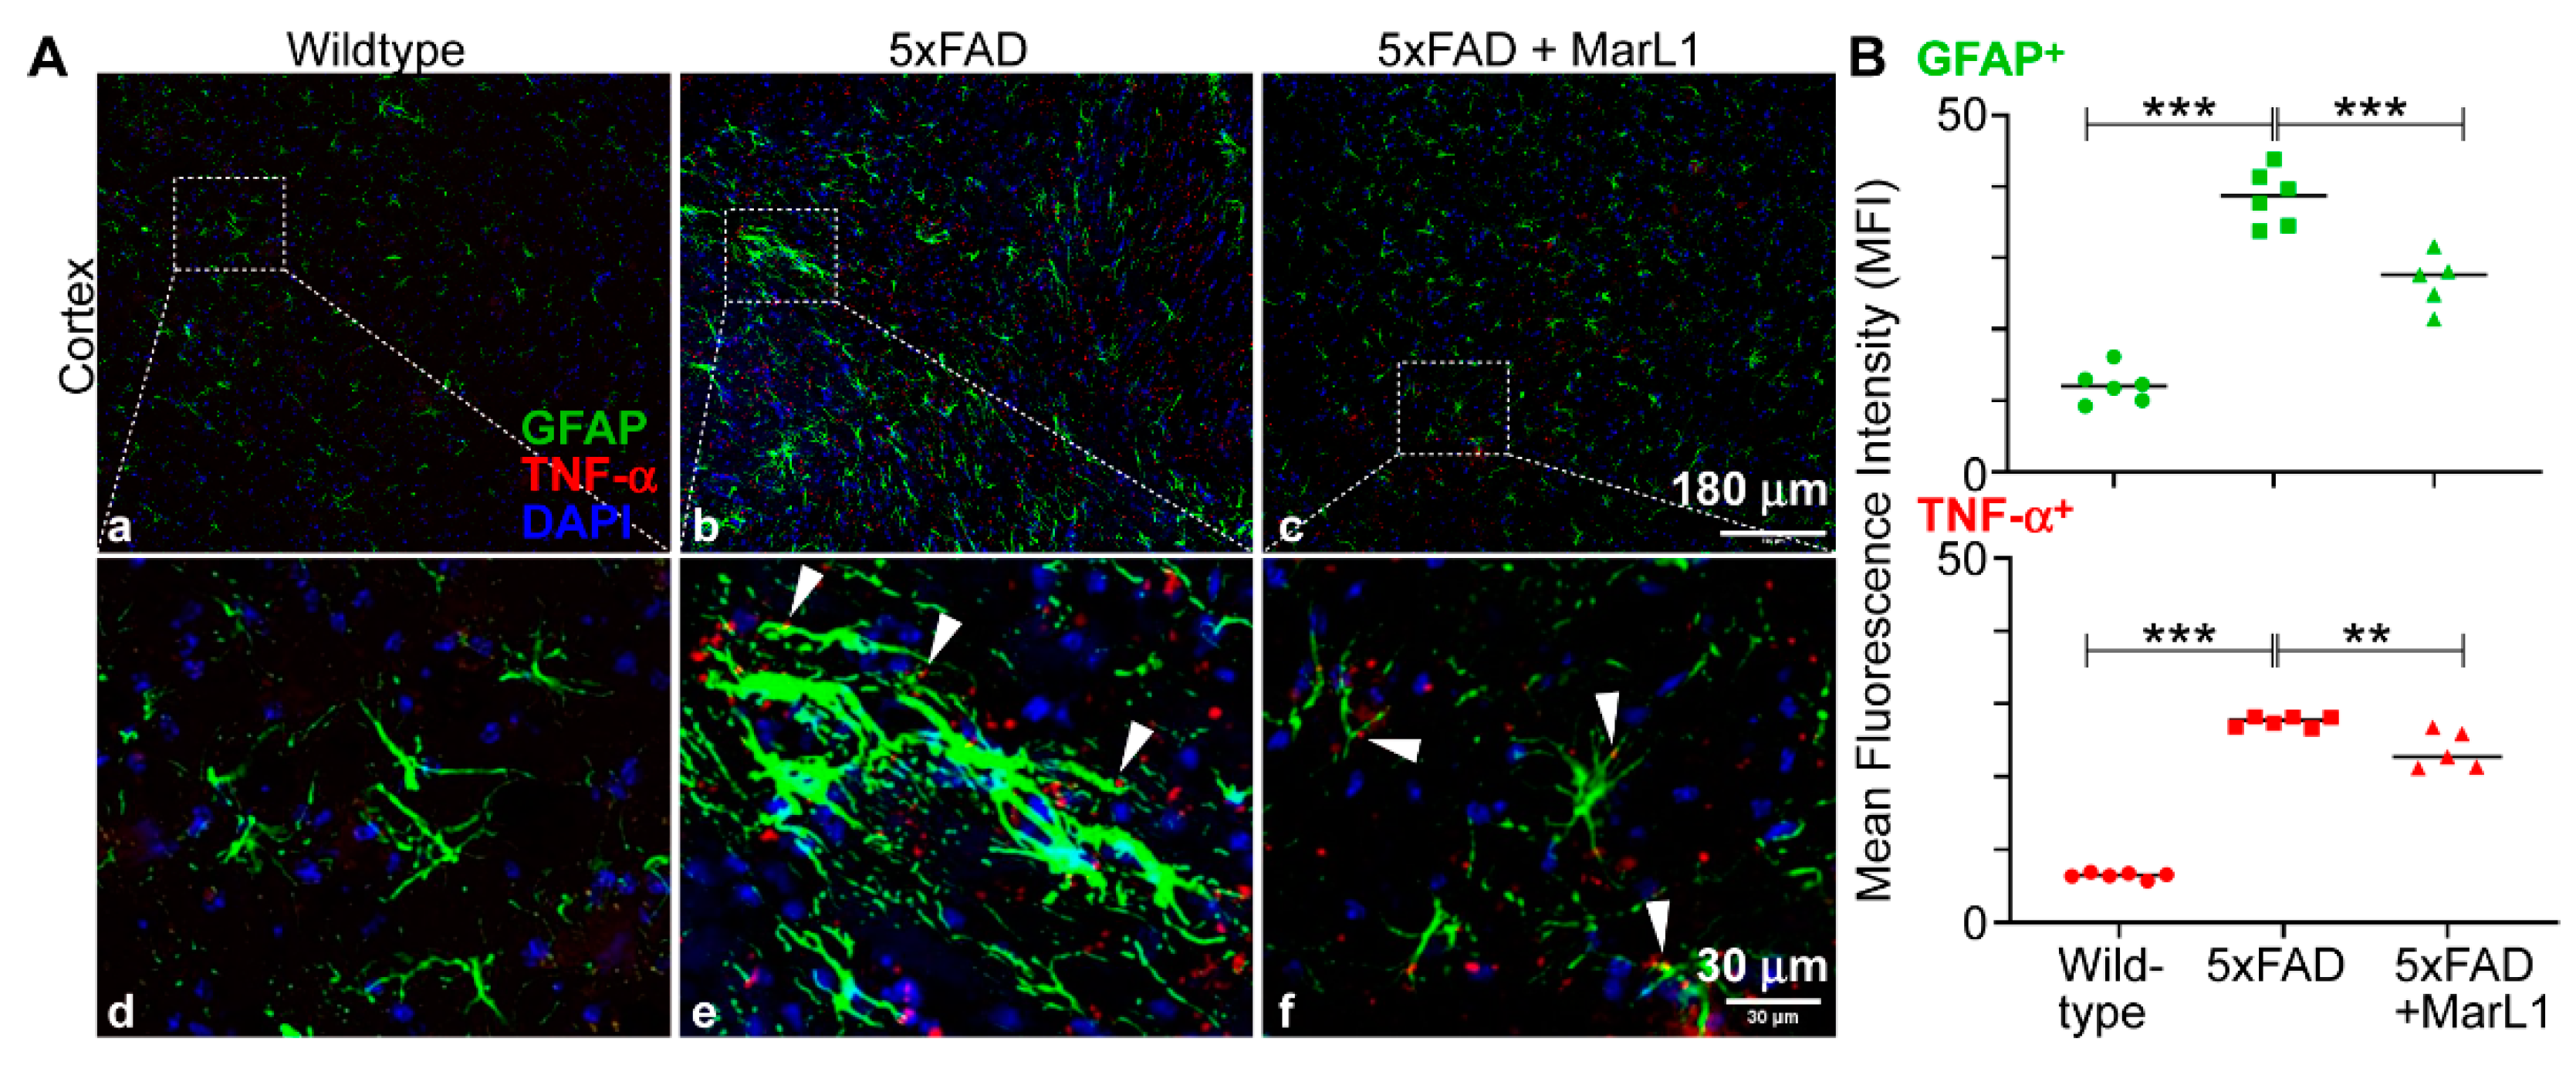
3.5. Maresin-like1 Mitigated Astrogliosis-Associated Neuroinflammation in Brains of 5xFAD Mice
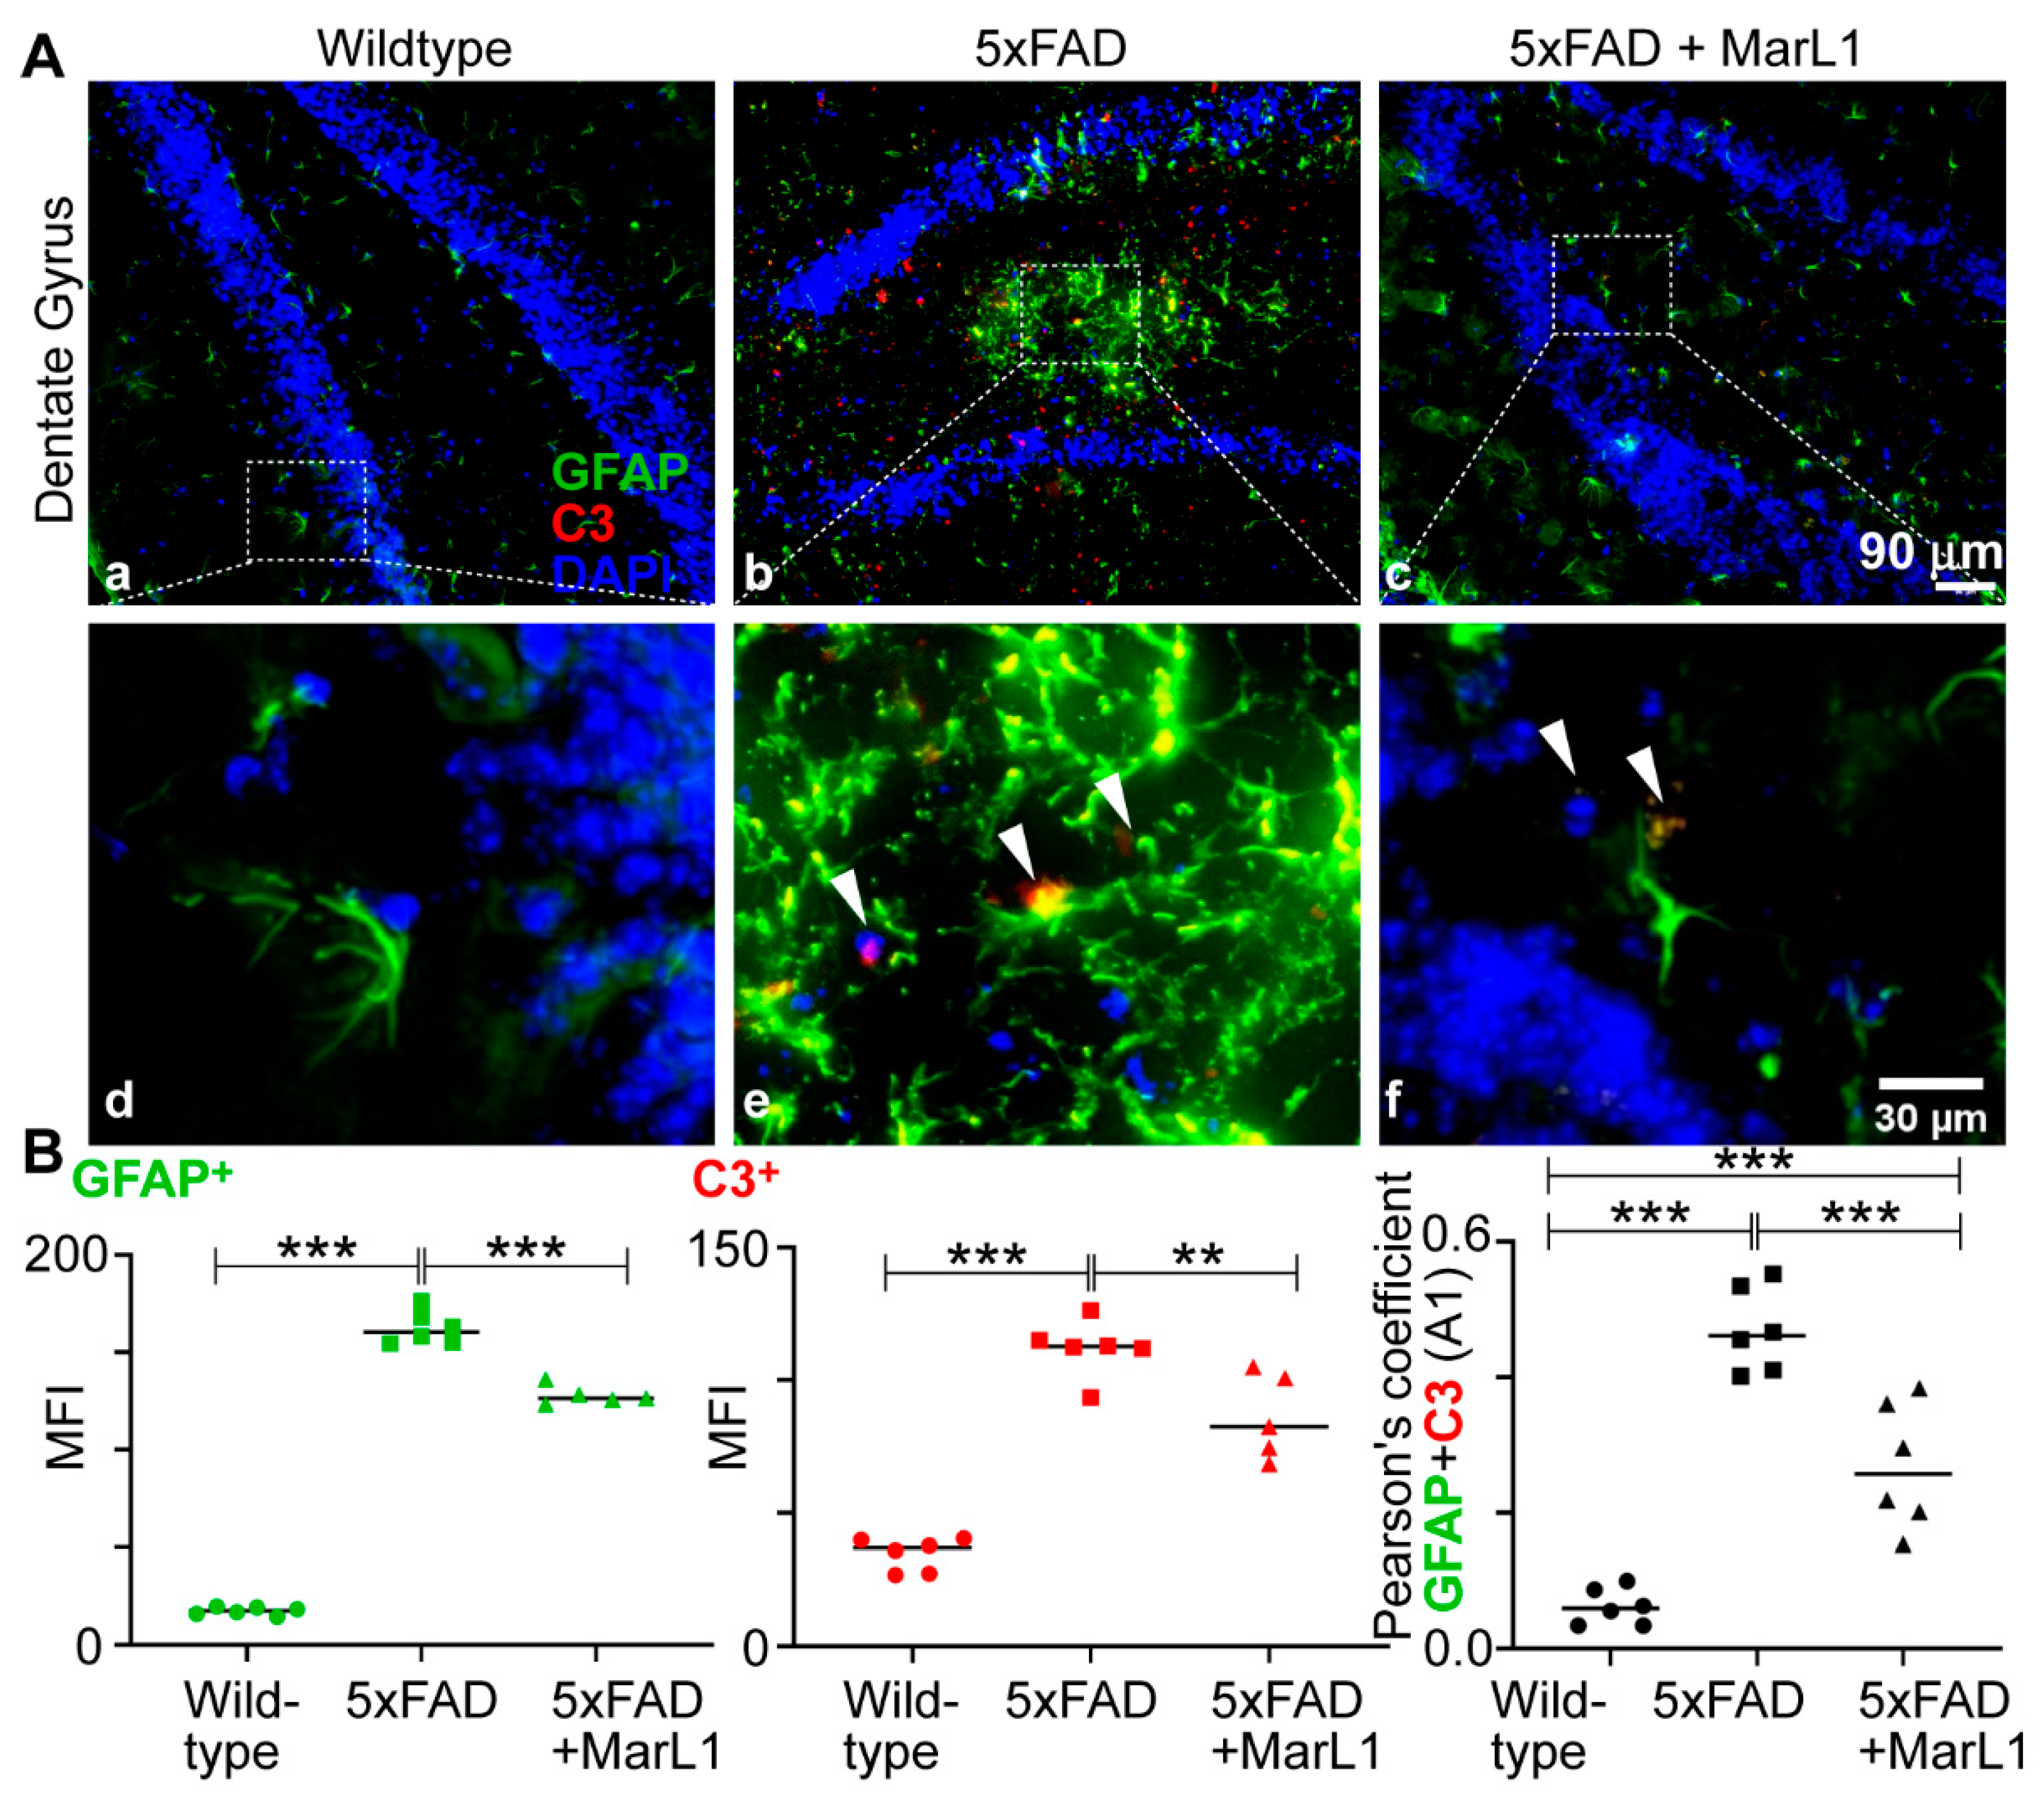
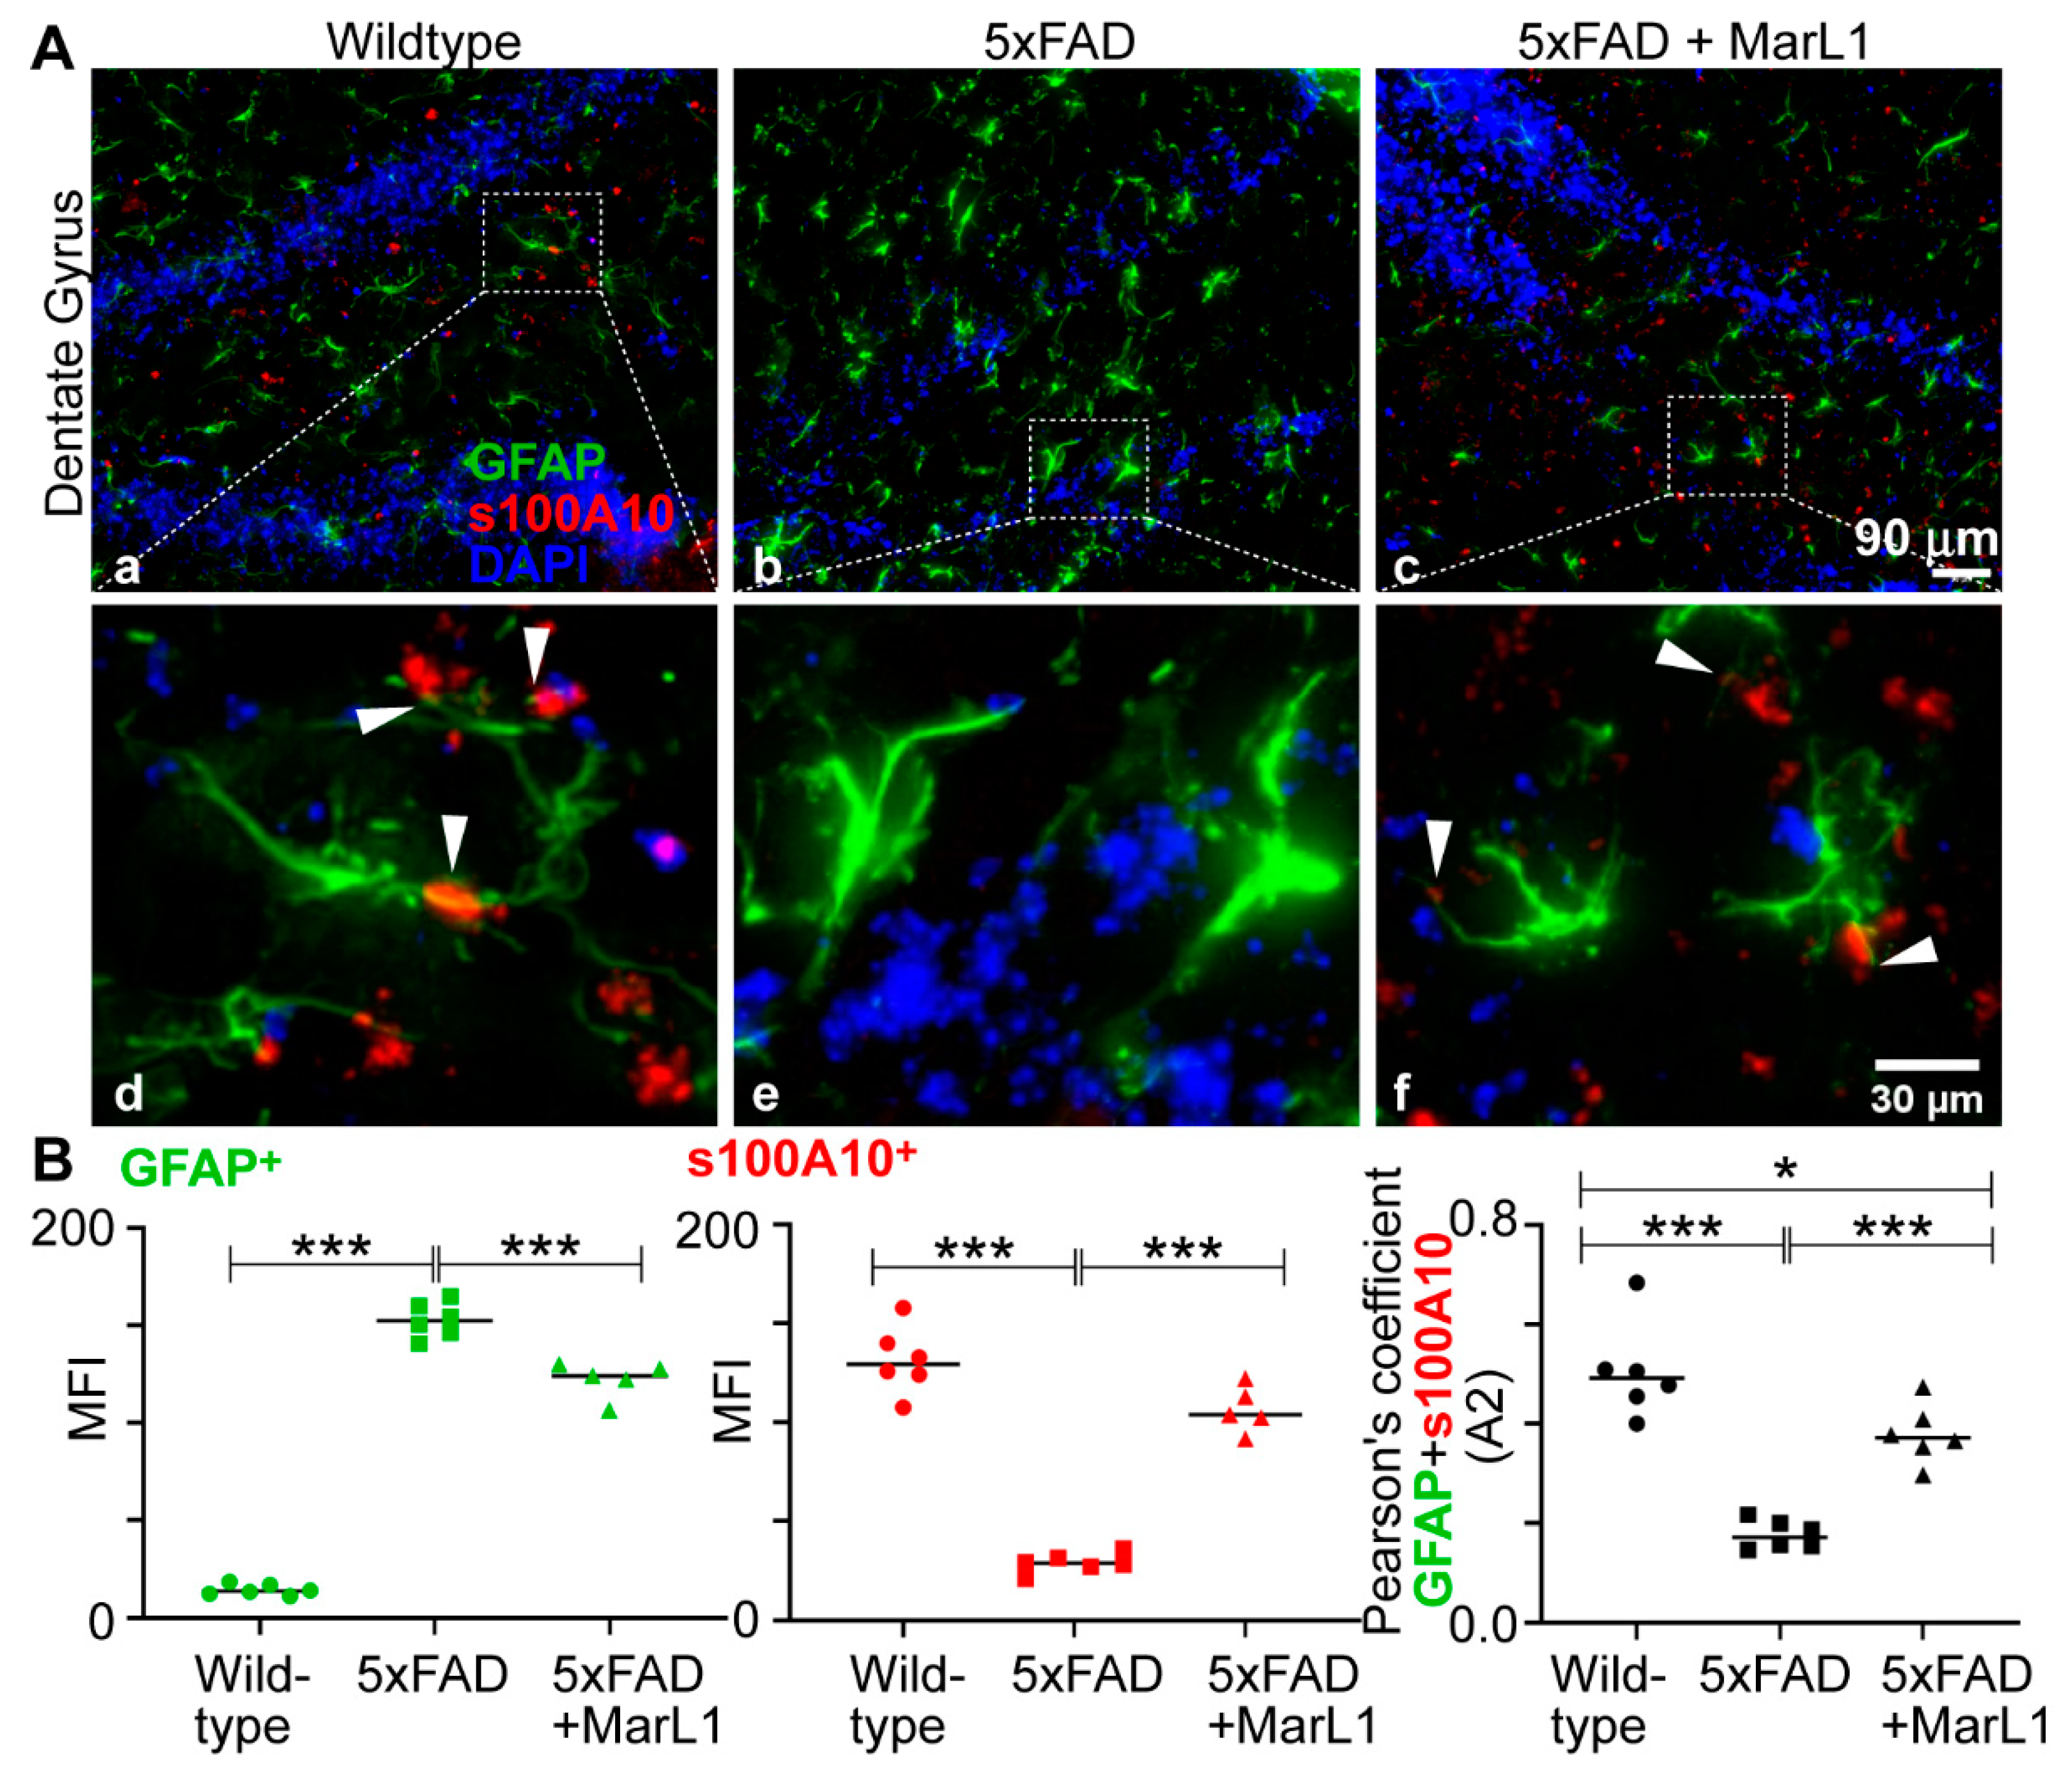
3.6. Maresin-like1 Treatment Inhibited A1 Astrocytes and Promoted A2 Astrocytes in Brains of 5xFAD Mice
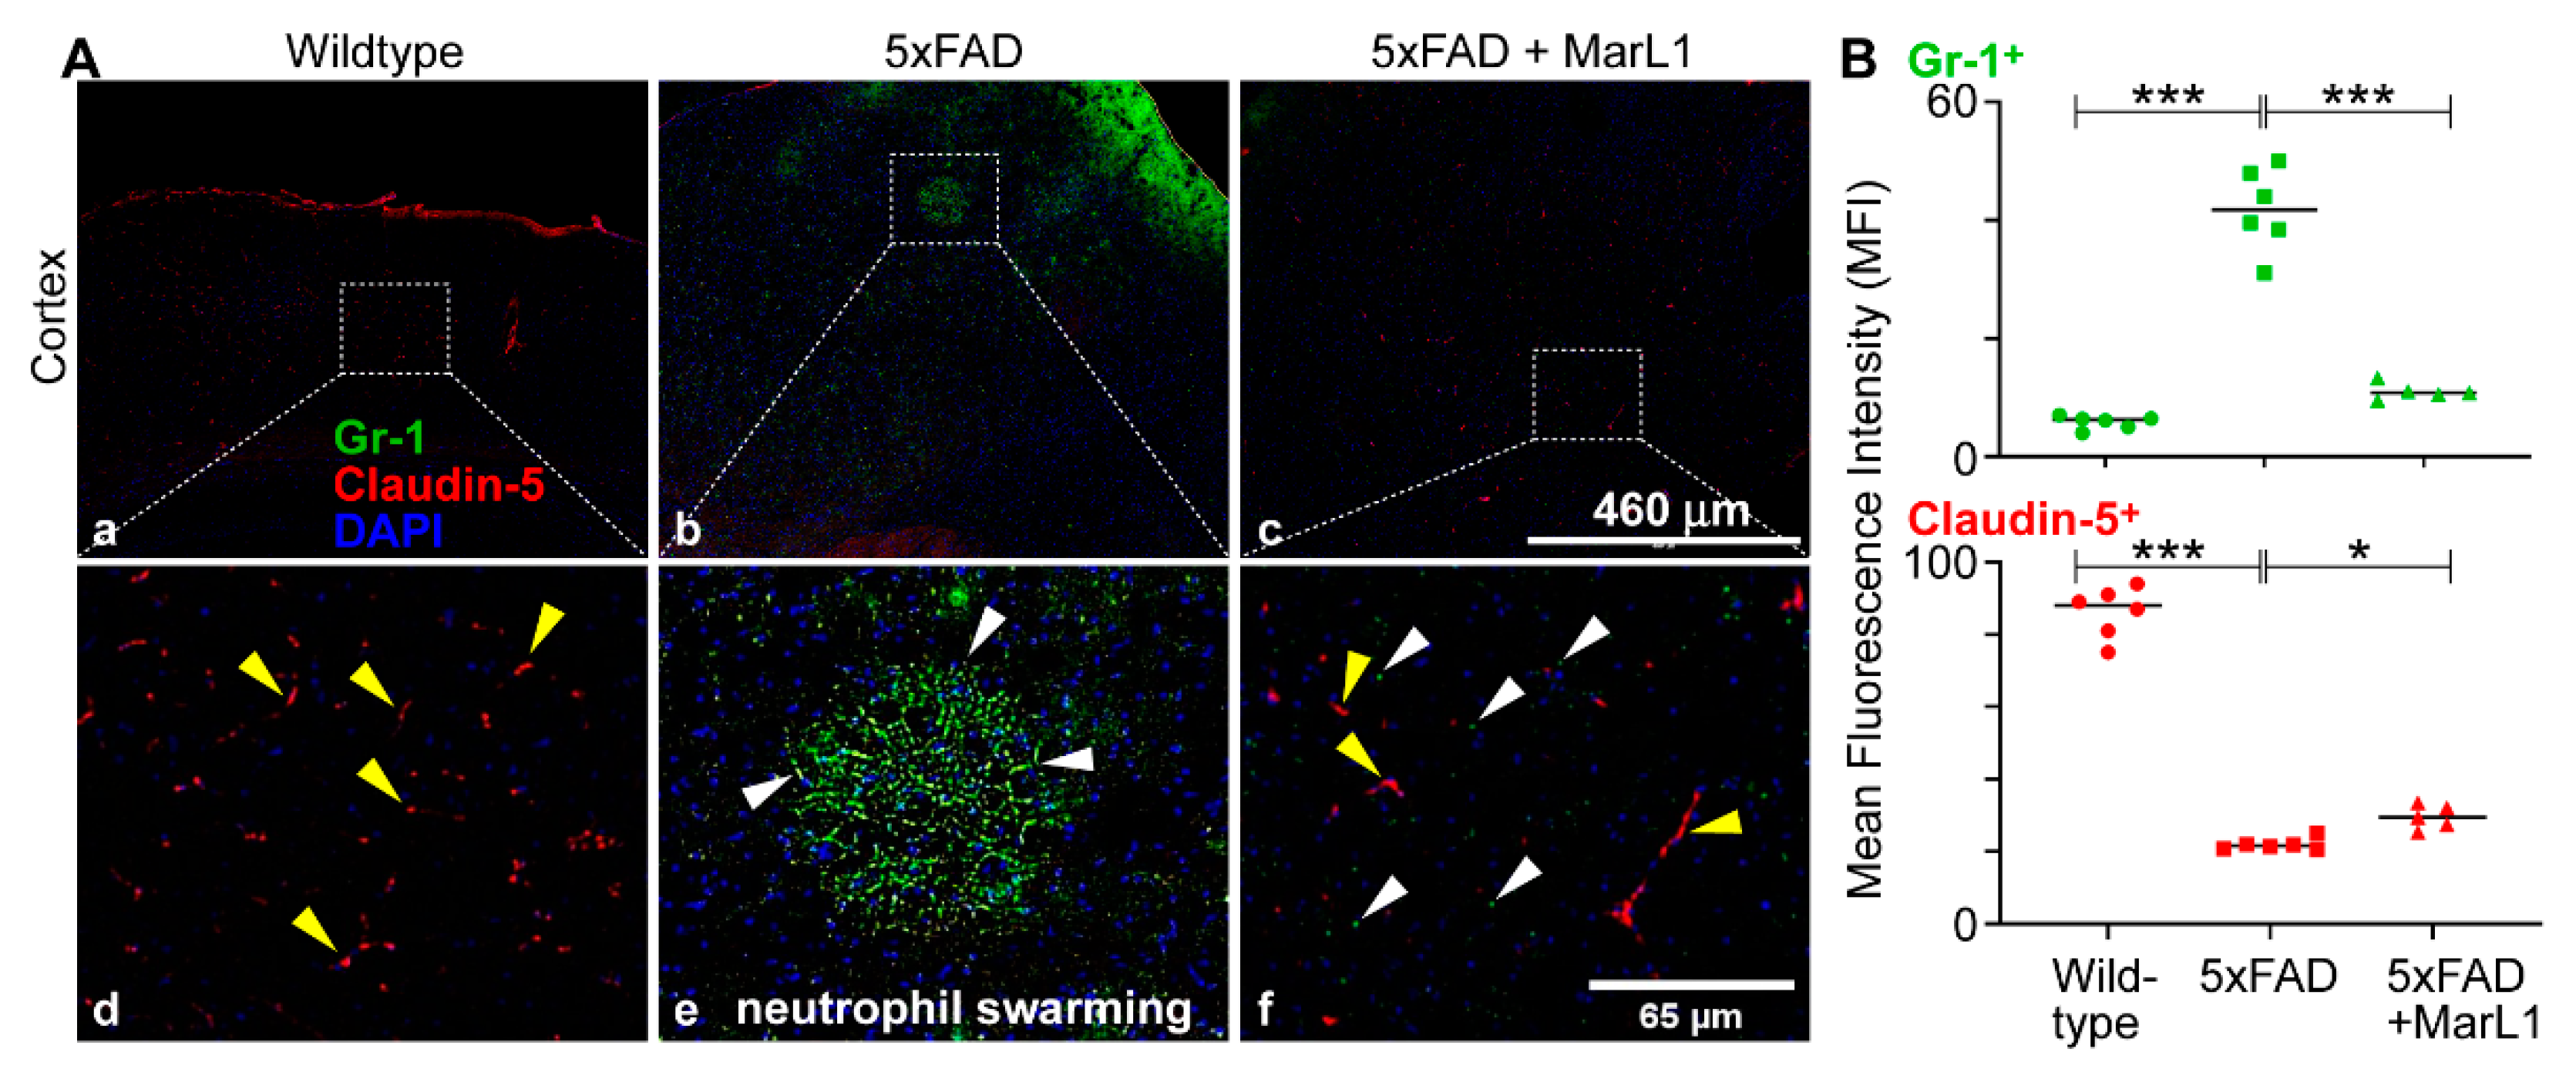
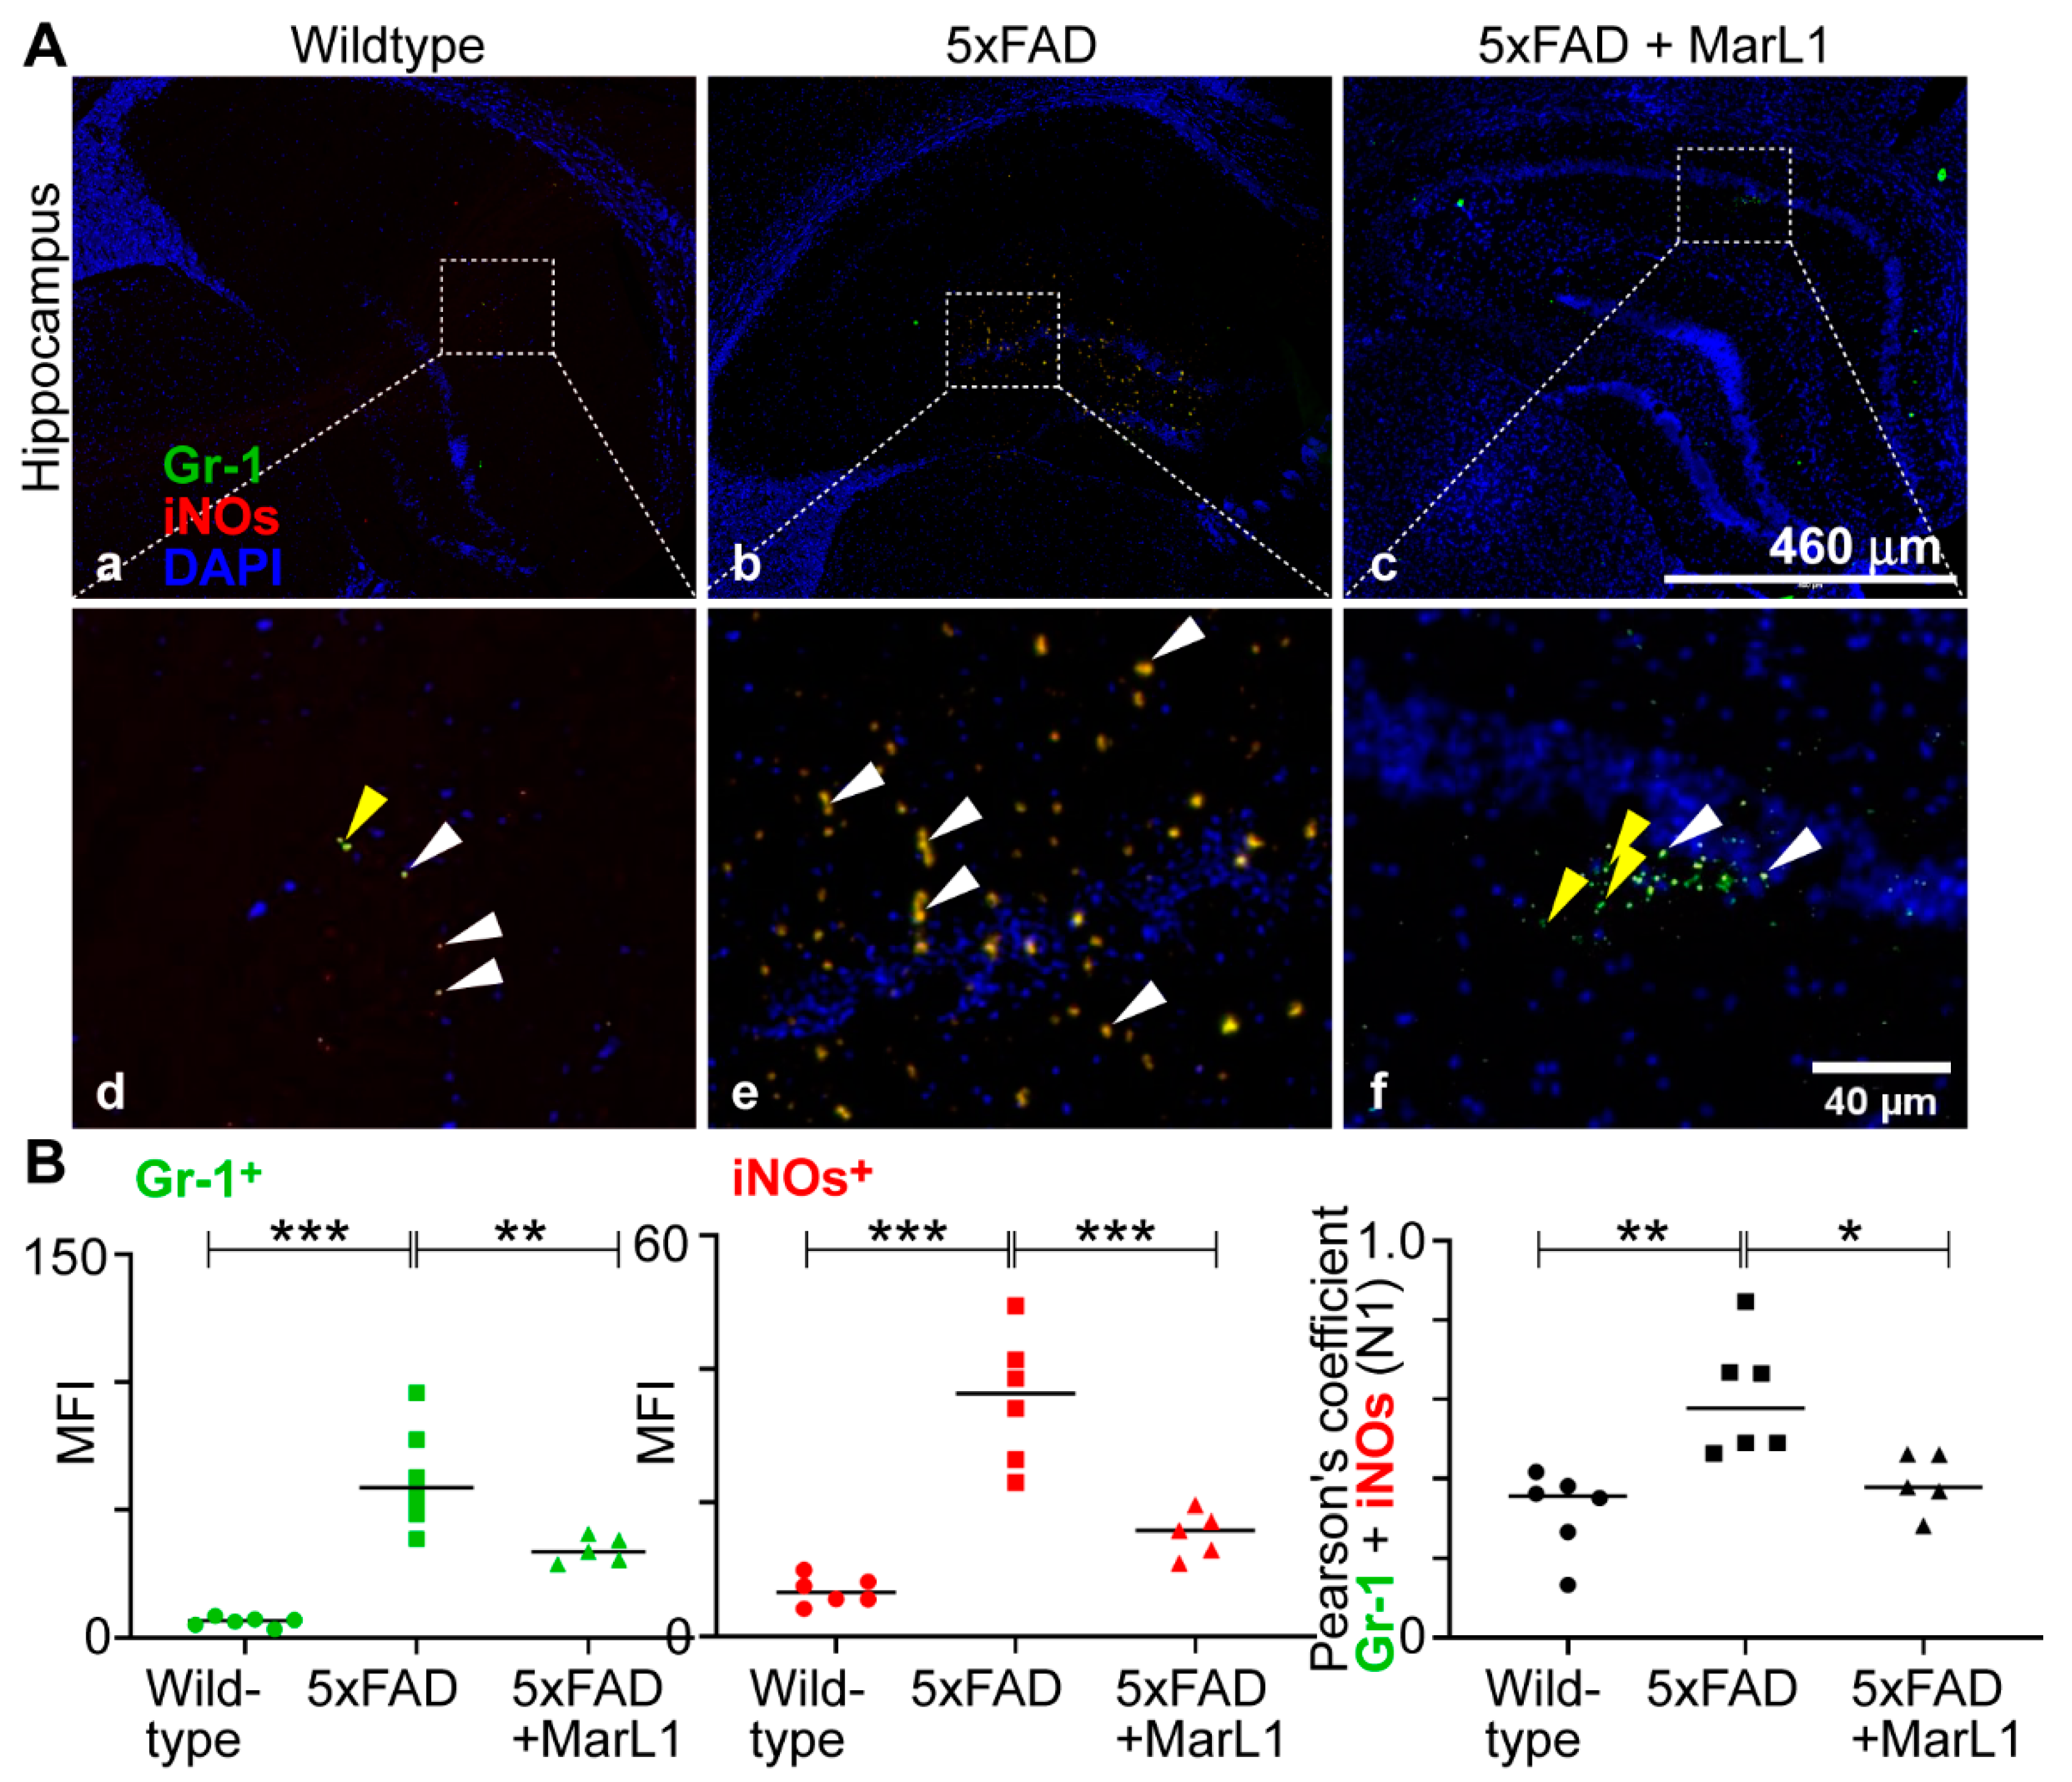
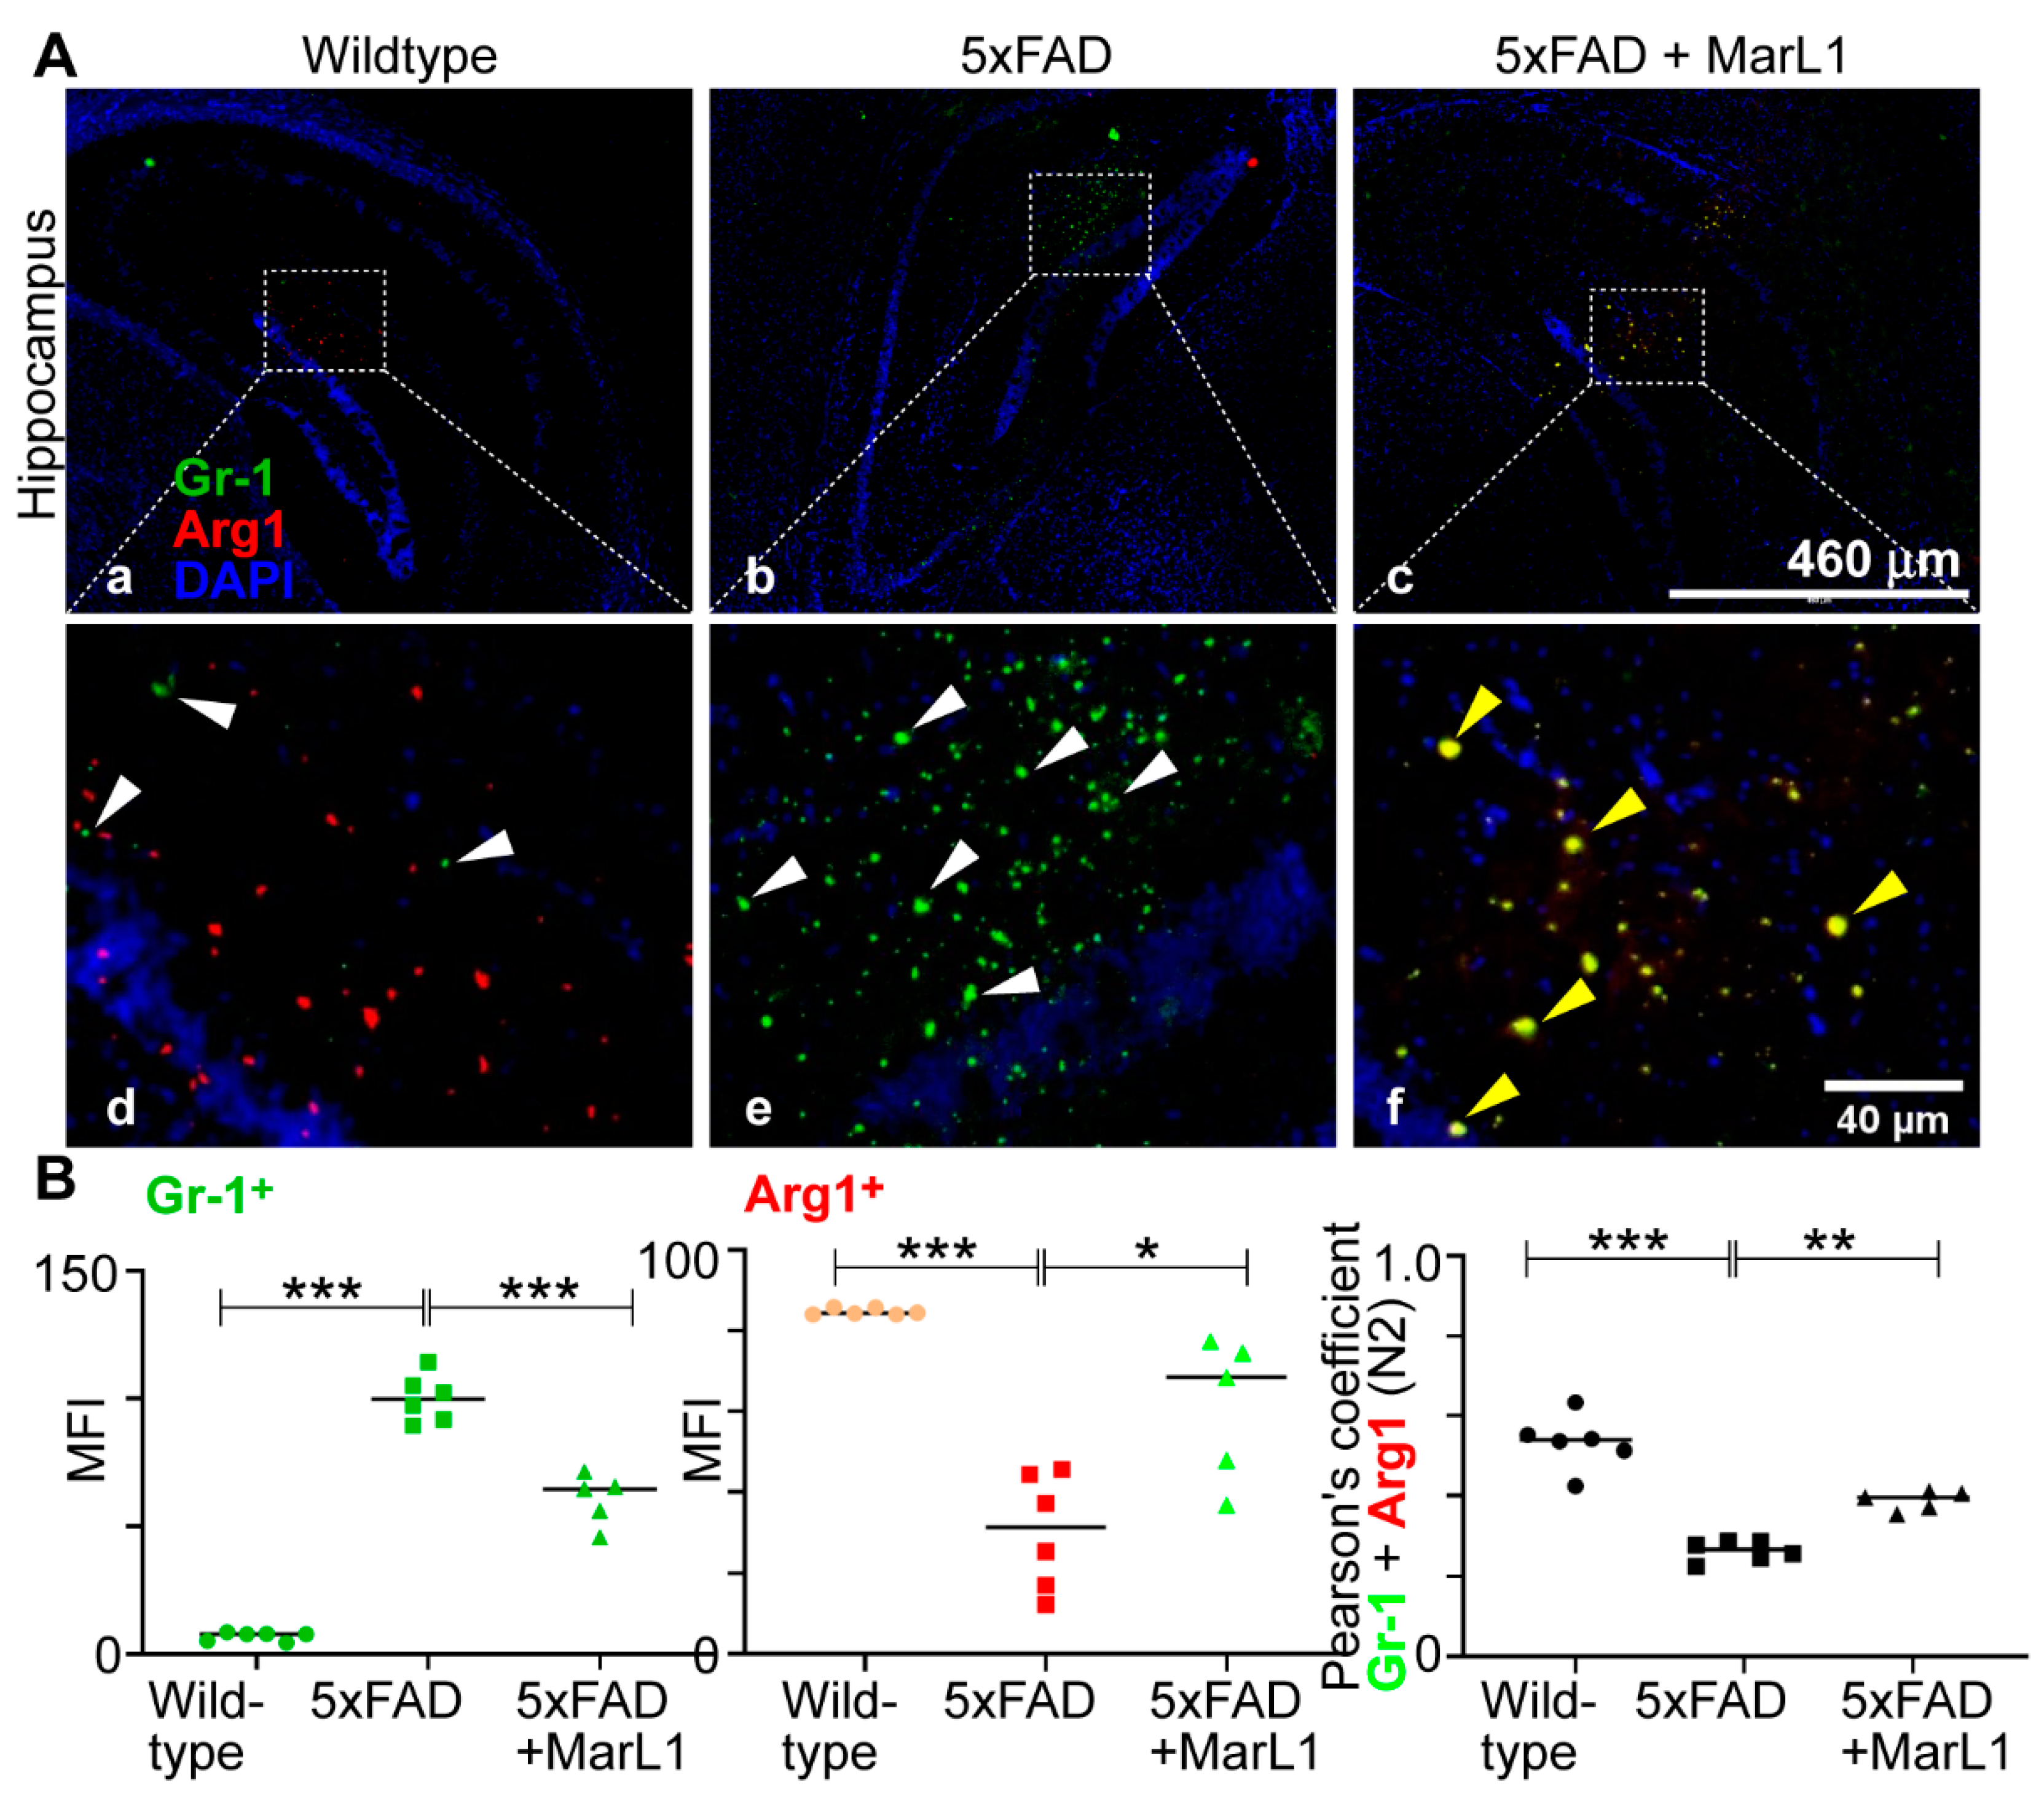
3.7. Maresin-like1 Treatment Promoted the Expression of BBB-Associated Tight-Junction Protein Claudin-5, Decreased Infiltration of Neutrophils in 5xFAD Brains, and Induced the Switch of Neutrophils toward the Inflammation-Resolving N2 Phenotype
4. Discussion
5. Conclusions
Supplementary Materials
Author Contributions
Funding
Institutional Review Board Statement
Data Availability Statement
Acknowledgments
Conflicts of Interest
References
- Scheltens, P.; Blennow, K.; Breteler, M.M.; de Strooper, B.; Frisoni, G.B.; Salloway, S.; Van der Flier, W.M. Alzheimer's disease. Lancet 2016, 388, 505–517. [Google Scholar] [CrossRef] [PubMed]
- 2022 Alzheimer's disease facts and figures. Alzheimers Dement 2022, 18, 700–789. [CrossRef] [PubMed]
- Giridharan, V.V.; Barichello De Quevedo, C.E.; Petronilho, F. Microbiota-gut-brain axis in the Alzheimer's disease pathology - an overview. Neurosci Res 2022, 181, 17–21. [Google Scholar] [CrossRef] [PubMed]
- Long, J.M.; Holtzman, D.M. Alzheimer Disease: An Update on Pathobiology and Treatment Strategies. Cell 2019, 179, 312–339. [Google Scholar] [CrossRef] [PubMed]
- Boyle, P.A.; Yu, L.; Wilson, R.S.; Leurgans, S.E.; Schneider, J.A.; Bennett, D.A. Person-specific contribution of neuropathologies to cognitive loss in old age. Ann Neurol 2018, 83, 74–83. [Google Scholar] [CrossRef] [PubMed]
- Oakley, H.; Cole, S.L.; Logan, S.; Maus, E.; Shao, P.; Craft, J.; Guillozet-Bongaarts, A.; Ohno, M.; Disterhoft, J.; Van Eldik, L.; et al. Intraneuronal beta-amyloid aggregates, neurodegeneration, and neuron loss in transgenic mice with five familial Alzheimer's disease mutations: potential factors in amyloid plaque formation. J Neurosci 2006, 26, 10129–10140. [Google Scholar] [CrossRef]
- Sanchez-Varo, R.; Mejias-Ortega, M.; Fernandez-Valenzuela, J.J.; Nunez-Diaz, C.; Caceres-Palomo, L.; Vegas-Gomez, L.; Sanchez-Mejias, E.; Trujillo-Estrada, L.; Garcia-Leon, J.A.; Moreno-Gonzalez, I.; et al. Transgenic Mouse Models of Alzheimer's Disease: An Integrative Analysis. Int J Mol Sci 2022, 23. [Google Scholar] [CrossRef] [PubMed]
- Oblak, A.L.; Lin, P.B.; Kotredes, K.P.; Pandey, R.S.; Garceau, D.; Williams, H.M.; Uyar, A.; O'Rourke, R.; O'Rourke, S.; Ingraham, C.; et al. Comprehensive Evaluation of the 5XFAD Mouse Model for Preclinical Testing Applications: A MODEL-AD Study. Front Aging Neurosci 2021, 13, 713726. [Google Scholar] [CrossRef]
- Eimer, W.A.; Vassar, R. Neuron loss in the 5XFAD mouse model of Alzheimer's disease correlates with intraneuronal Abeta42 accumulation and Caspase-3 activation. Mol Neurodegener 2013, 8, 2. [Google Scholar] [CrossRef]
- Devi, L.; Ohno, M. Genetic reductions of beta-site amyloid precursor protein-cleaving enzyme 1 and amyloid-beta ameliorate impairment of conditioned taste aversion memory in 5XFAD Alzheimer's disease model mice. Eur J Neurosci 2010, 31, 110–118. [Google Scholar] [CrossRef]
- Neuner, S.M.; Heuer, S.E.; Huentelman, M.J.; O'Connell, K.M.S.; Kaczorowski, C.C. Harnessing Genetic Complexity to Enhance Translatability of Alzheimer's Disease Mouse Models: A Path toward Precision Medicine. Neuron 2019, 101, 399–411.e395. [Google Scholar] [CrossRef] [PubMed]
- O'Leary, T.P.; Brown, R.E. Visuo-spatial learning and memory impairments in the 5xFAD mouse model of Alzheimer's disease: Effects of age, sex, albinism, and motor impairments. Genes Brain Behav 2022, 21, e12794. [Google Scholar] [CrossRef] [PubMed]
- Yuan, P.; Condello, C.; Keene, C.D.; Wang, Y.; Bird, T.D.; Paul, S.M.; Luo, W.; Colonna, M.; Baddeley, D.; Grutzendler, J. TREM2 Haplodeficiency in Mice and Humans Impairs the Microglia Barrier Function Leading to Decreased Amyloid Compaction and Severe Axonal Dystrophy. Neuron 2016, 90, 724–739. [Google Scholar] [CrossRef] [PubMed]
- Luo, J. TGF-beta as a Key Modulator of Astrocyte Reactivity: Disease Relevance and Therapeutic Implications. Biomedicines 2022, 10. [Google Scholar] [CrossRef]
- Lecordier, S.; Pons, V.; Rivest, S.; ElAli, A. Multifocal Cerebral Microinfarcts Modulate Early Alzheimer's Disease Pathology in a Sex-Dependent Manner. Front Immunol 2021, 12, 813536. [Google Scholar] [CrossRef] [PubMed]
- Wang, S.; Mustafa, M.; Yuede, C.M.; Salazar, S.V.; Kong, P.; Long, H.; Ward, M.; Siddiqui, O.; Paul, R.; Gilfillan, S.; et al. Anti-human TREM2 induces microglia proliferation and reduces pathology in an Alzheimer's disease model. J Exp Med 2020, 217. [Google Scholar] [CrossRef]
- Epelbaum, S.; Genthon, R.; Cavedo, E.; Habert, M.O.; Lamari, F.; Gagliardi, G.; Lista, S.; Teichmann, M.; Bakardjian, H.; Hampel, H.; et al. Preclinical Alzheimer's disease: A systematic review of the cohorts underlying the concept. Alzheimers Dement 2017, 13, 454–467. [Google Scholar] [CrossRef] [PubMed]
- Garbuz, D.G.; Zatsepina, O.G.; Evgen'ev, M.B. Beta Amyloid, Tau Protein, and Neuroinflammation: An Attempt to Integrate Different Hypotheses of Alzheimer's Disease Pathogenesis. Mol Biol (Mosk) 2021, 55, 734–747. [Google Scholar] [CrossRef] [PubMed]
- Wang, X. A Bridge Between the Innate Immunity System and Amyloid-beta Production in Alzheimer's Disease. Neurosci Bull 2021, 37, 898–901. [Google Scholar] [CrossRef]
- Wyss-Coray, T.; Mucke, L. Inflammation in neurodegenerative disease--a double-edged sword. Neuron 2002, 35, 419–432. [Google Scholar] [CrossRef]
- Calhoun, M.E.; Burgermeister, P.; Phinney, A.L.; Stalder, M.; Tolnay, M.; Wiederhold, K.H.; Abramowski, D.; Sturchler-Pierrat, C.; Sommer, B.; Staufenbiel, M.; et al. Neuronal overexpression of mutant amyloid precursor protein results in prominent deposition of cerebrovascular amyloid. Proc Natl Acad Sci U S A 1999, 96, 14088–14093. [Google Scholar] [CrossRef] [PubMed]
- Meyer-Luehmann, M.; Spires-Jones, T.L.; Prada, C.; Garcia-Alloza, M.; de Calignon, A.; Rozkalne, A.; Koenigsknecht-Talboo, J.; Holtzman, D.M.; Bacskai, B.J.; Hyman, B.T. Rapid appearance and local toxicity of amyloid-beta plaques in a mouse model of Alzheimer's disease. Nature 2008, 451, 720–724. [Google Scholar] [CrossRef]
- Guo, S.; Wang, H.; Yin, Y. Microglia Polarization From M1 to M2 in Neurodegenerative Diseases. Front Aging Neurosci 2022, 14, 815347. [Google Scholar] [CrossRef] [PubMed]
- Giannoni, P.; Arango-Lievano, M.; Neves, I.D.; Rousset, M.C.; Baranger, K.; Rivera, S.; Jeanneteau, F.; Claeysen, S.; Marchi, N. Cerebrovascular pathology during the progression of experimental Alzheimer's disease. Neurobiol Dis 2016, 88, 107–117. [Google Scholar] [CrossRef] [PubMed]
- Landel, V.; Baranger, K.; Virard, I.; Loriod, B.; Khrestchatisky, M.; Rivera, S.; Benech, P.; Feron, F. Temporal gene profiling of the 5XFAD transgenic mouse model highlights the importance of microglial activation in Alzheimer's disease. Mol Neurodegener 2014, 9, 33. [Google Scholar] [CrossRef]
- Lawson, L.J.; Perry, V.H.; Dri, P.; Gordon, S. Heterogeneity in the distribution and morphology of microglia in the normal adult mouse brain. Neuroscience 1990, 39, 151–170. [Google Scholar] [CrossRef]
- Kobayashi, K.; Imagama, S.; Ohgomori, T.; Hirano, K.; Uchimura, K.; Sakamoto, K.; Hirakawa, A.; Takeuchi, H.; Suzumura, A.; Ishiguro, N.; et al. Minocycline selectively inhibits M1 polarization of microglia. Cell Death Dis 2013, 4, e525. [Google Scholar] [CrossRef] [PubMed]
- Morganti, J.M.; Riparip, L.K.; Rosi, S. Call Off the Dog(ma): M1/M2 Polarization Is Concurrent following Traumatic Brain Injury. PLoS One 2016, 11, e0148001. [Google Scholar] [CrossRef]
- Koizumi, T.; Taguchi, K.; Mizuta, I.; Toba, H.; Ohigashi, M.; Onishi, O.; Ikoma, K.; Miyata, S.; Nakata, T.; Tanaka, M.; et al. Transiently proliferating perivascular microglia harbor M1 type and precede cerebrovascular changes in a chronic hypertension model. J Neuroinflammation 2019, 16, 79. [Google Scholar] [CrossRef]
- Hashimoto, A.; Karim, M.R.; Kuramochi, M.; Izawa, T.; Kuwamura, M.; Yamate, J. Characterization of Macrophages and Myofibroblasts Appearing in Dibutyltin Dichloride-Induced Rat Pancreatic Fibrosis. Toxicol Pathol 2020, 48, 509–523. [Google Scholar] [CrossRef]
- Bottcher, C.; Schlickeiser, S.; Sneeboer, M.A.M.; Kunkel, D.; Knop, A.; Paza, E.; Fidzinski, P.; Kraus, L.; Snijders, G.J.L.; Kahn, R.S.; et al. Human microglia regional heterogeneity and phenotypes determined by multiplexed single-cell mass cytometry. Nat Neurosci 2019, 22, 78–90. [Google Scholar] [CrossRef] [PubMed]
- Gomes-Leal, W. Why microglia kill neurons after neural disorders? The friendly fire hypothesis. Neural Regen Res 2019, 14, 1499–1502. [Google Scholar] [CrossRef] [PubMed]
- Varin, A.; Gordon, S. Alternative activation of macrophages: immune function and cellular biology. Immunobiology 2009, 214, 630–641. [Google Scholar] [CrossRef] [PubMed]
- Martinez, F.O.; Helming, L.; Gordon, S. Alternative activation of macrophages: an immunologic functional perspective. Annu Rev Immunol 2009, 27, 451–483. [Google Scholar] [CrossRef] [PubMed]
- Jurga, A.M.; Paleczna, M.; Kuter, K.Z. Overview of General and Discriminating Markers of Differential Microglia Phenotypes. Front Cell Neurosci 2020, 14, 198. [Google Scholar] [CrossRef]
- Kim, Y.; Park, J.; Choi, Y.K. The Role of Astrocytes in the Central Nervous System Focused on BK Channel and Heme Oxygenase Metabolites: A Review. Antioxidants (Basel) 2019, 8. [Google Scholar] [CrossRef]
- Liddelow, S.A.; Barres, B.A. Reactive Astrocytes: Production, Function, and Therapeutic Potential. Immunity 2017, 46, 957–967. [Google Scholar] [CrossRef] [PubMed]
- Khakh, B.S.; Deneen, B. The Emerging Nature of Astrocyte Diversity. Annu Rev Neurosci 2019, 42, 187–207. [Google Scholar] [CrossRef]
- Jessen, N.A.; Munk, A.S.; Lundgaard, I.; Nedergaard, M. The Glymphatic System: A Beginner's Guide. Neurochem Res 2015, 40, 2583–2599. [Google Scholar] [CrossRef]
- Monterey, M.D.; Wei, H.; Wu, X.; Wu, J.Q. The Many Faces of Astrocytes in Alzheimer's Disease. Front Neurol 2021, 12, 619626. [Google Scholar] [CrossRef]
- Westergard, T.; Rothstein, J.D. Astrocyte Diversity: Current Insights and Future Directions. Neurochem Res 2020, 45, 1298–1305. [Google Scholar] [CrossRef] [PubMed]
- Vanzani, M.C.; Iacono, R.F.; Caccuri, R.L.; Berria, M.I. Immunochemical and morphometric features of astrocyte reactivity vs. plaque location in Alzheimer's disease. Medicina (B Aires) 2005, 65, 213–218. [Google Scholar]
- Muramori, F.; Kobayashi, K.; Nakamura, I. A quantitative study of neurofibrillary tangles, senile plaques and astrocytes in the hippocampal subdivisions and entorhinal cortex in Alzheimer's disease, normal controls and non-Alzheimer neuropsychiatric diseases. Psychiatry Clin Neurosci 1998, 52, 593–599. [Google Scholar] [CrossRef] [PubMed]
- Habib, N.; McCabe, C.; Medina, S.; Varshavsky, M.; Kitsberg, D.; Dvir-Szternfeld, R.; Green, G.; Dionne, D.; Nguyen, L.; Marshall, J.L.; et al. Disease-associated astrocytes in Alzheimer's disease and aging. Nat Neurosci 2020, 23, 701–706. [Google Scholar] [CrossRef] [PubMed]
- von Bohlen und Halbach, O. Immunohistological markers for proliferative events, gliogenesis, and neurogenesis within the adult hippocampus. Cell Tissue Res 2011, 345, 1–19. [Google Scholar] [CrossRef]
- Ding, Z.B.; Song, L.J.; Wang, Q.; Kumar, G.; Yan, Y.Q.; Ma, C.G. Astrocytes: a double-edged sword in neurodegenerative diseases. Neural Regen Res 2021, 16, 1702–1710. [Google Scholar] [CrossRef] [PubMed]
- Zamanian, J.L.; Xu, L.; Foo, L.C.; Nouri, N.; Zhou, L.; Giffard, R.G.; Barres, B.A. Genomic analysis of reactive astrogliosis. J Neurosci 2012, 32, 6391–6410. [Google Scholar] [CrossRef]
- Ben Haim, L.; Carrillo-de Sauvage, M.A.; Ceyzeriat, K.; Escartin, C. Elusive roles for reactive astrocytes in neurodegenerative diseases. Front Cell Neurosci 2015, 9, 278. [Google Scholar] [CrossRef]
- Escartin, C.; Guillemaud, O.; Carrillo-de Sauvage, M.A. Questions and (some) answers on reactive astrocytes. Glia 2019, 67, 2221–2247. [Google Scholar] [CrossRef]
- Cai, Z.; Wan, C.Q.; Liu, Z. Astrocyte and Alzheimer's disease. J Neurol 2017, 264, 2068–2074. [Google Scholar] [CrossRef]
- Kaur, D.; Sharma, V.; Deshmukh, R. Activation of microglia and astrocytes: a roadway to neuroinflammation and Alzheimer's disease. Inflammopharmacology 2019, 27, 663–677. [Google Scholar] [CrossRef]
- Shinozaki, Y.; Shibata, K.; Yoshida, K.; Shigetomi, E.; Gachet, C.; Ikenaka, K.; Tanaka, K.F.; Koizumi, S. Transformation of Astrocytes to a Neuroprotective Phenotype by Microglia via P2Y(1) Receptor Downregulation. Cell Rep 2017, 19, 1151–1164. [Google Scholar] [CrossRef]
- Tchieu, J.; Calder, E.L.; Guttikonda, S.R.; Gutzwiller, E.M.; Aromolaran, K.A.; Steinbeck, J.A.; Goldstein, P.A.; Studer, L. NFIA is a gliogenic switch enabling rapid derivation of functional human astrocytes from pluripotent stem cells. Nat Biotechnol 2019, 37, 267–275. [Google Scholar] [CrossRef]
- Neal, M.; Luo, J.; Harischandra, D.S.; Gordon, R.; Sarkar, S.; Jin, H.; Anantharam, V.; Desaubry, L.; Kanthasamy, A.; Kanthasamy, A. Prokineticin-2 promotes chemotaxis and alternative A2 reactivity of astrocytes. Glia 2018, 66, 2137–2157. [Google Scholar] [CrossRef]
- Healy, L.M.; Antel, J.P. Sphingosine-1-Phosphate Receptors in the Central Nervous and Immune Systems. Curr Drug Targets 2016, 17, 1841–1850. [Google Scholar] [CrossRef]
- Hodgetts, S.I.; Harvey, A.R. Neurotrophic Factors Used to Treat Spinal Cord Injury. Vitam Horm 2017, 104, 405–457. [Google Scholar] [CrossRef]
- Rosales, C. Neutrophil: A Cell with Many Roles in Inflammation or Several Cell Types? Front Physiol 2018, 9, 113. [Google Scholar] [CrossRef]
- Baik, S.H.; Cha, M.Y.; Hyun, Y.M.; Cho, H.; Hamza, B.; Kim, D.K.; Han, S.H.; Choi, H.; Kim, K.H.; Moon, M.; et al. Migration of neutrophils targeting amyloid plaques in Alzheimer's disease mouse model. Neurobiol Aging 2014, 35, 1286–1292. [Google Scholar] [CrossRef]
- Zenaro, E.; Pietronigro, E.; Della Bianca, V.; Piacentino, G.; Marongiu, L.; Budui, S.; Turano, E.; Rossi, B.; Angiari, S.; Dusi, S.; et al. Neutrophils promote Alzheimer's disease-like pathology and cognitive decline via LFA-1 integrin. Nat Med 2015, 21, 880–886. [Google Scholar] [CrossRef]
- Santos-Lima, B.; Pietronigro, E.C.; Terrabuio, E.; Zenaro, E.; Constantin, G. The role of neutrophils in the dysfunction of central nervous system barriers. Front Aging Neurosci 2022, 14, 965169. [Google Scholar] [CrossRef]
- Rossi, B.; Constantin, G.; Zenaro, E. The emerging role of neutrophils in neurodegeneration. Immunobiology 2020, 225, 151865. [Google Scholar] [CrossRef]
- Rossi, B.; Santos-Lima, B.; Terrabuio, E.; Zenaro, E.; Constantin, G. Common Peripheral Immunity Mechanisms in Multiple Sclerosis and Alzheimer's Disease. Front Immunol 2021, 12, 639369. [Google Scholar] [CrossRef]
- Smyth, L.C.D.; Murray, H.C.; Hill, M.; van Leeuwen, E.; Highet, B.; Magon, N.J.; Osanlouy, M.; Mathiesen, S.N.; Mockett, B.; Singh-Bains, M.K.; et al. Neutrophil-vascular interactions drive myeloperoxidase accumulation in the brain in Alzheimer's disease. Acta Neuropathol Commun 2022, 10, 38. [Google Scholar] [CrossRef] [PubMed]
- Stock, A.J.; Kasus-Jacobi, A.; Pereira, H.A. The role of neutrophil granule proteins in neuroinflammation and Alzheimer's disease. J Neuroinflammation 2018, 15, 240. [Google Scholar] [CrossRef]
- Mihaila, A.C.; Ciortan, L.; Macarie, R.D.; Vadana, M.; Cecoltan, S.; Preda, M.B.; Hudita, A.; Gan, A.M.; Jakobsson, G.; Tucureanu, M.M.; et al. Transcriptional Profiling and Functional Analysis of N1/N2 Neutrophils Reveal an Immunomodulatory Effect of S100A9-Blockade on the Pro-Inflammatory N1 Subpopulation. Front Immunol 2021, 12, 708770. [Google Scholar] [CrossRef] [PubMed]
- Cuartero, M.I.; Ballesteros, I.; Moraga, A.; Nombela, F.; Vivancos, J.; Hamilton, J.A.; Corbi, A.L.; Lizasoain, I.; Moro, M.A. N2 neutrophils, novel players in brain inflammation after stroke: modulation by the PPARgamma agonist rosiglitazone. Stroke 2013, 44, 3498–3508. [Google Scholar] [CrossRef]
- Chiurchiu, V.; Maccarrone, M. Bioactive lipids as modulators of immunity, inflammation and emotions. Curr Opin Pharmacol 2016, 29, 54–62. [Google Scholar] [CrossRef]
- Serhan, C.N.; Yang, R.; Martinod, K.; Kasuga, K.; Pillai, P.S.; Porter, T.F.; Oh, S.F.; Spite, M. Maresins: novel macrophage mediators with potent antiinflammatory and proresolving actions. J Exp Med 2009, 206, 15–23. [Google Scholar] [CrossRef]
- Serhan, C.N.; Dalli, J.; Karamnov, S.; Choi, A.; Park, C.K.; Xu, Z.Z.; Ji, R.R.; Zhu, M.; Petasis, N.A. Macrophage proresolving mediator maresin 1 stimulates tissue regeneration and controls pain. Faseb J 2012, 26, 1755–1765. [Google Scholar] [CrossRef]
- Hong, S.; Lu, Y.; Tian, H.; Alapure, B.V.; Wang, Q.; Bunnell, B.A.; Laborde, J.M. Maresin-like lipid mediators are produced by leukocytes and platelets and rescue reparative function of diabetes-impaired macrophages. Chem Biol 2014, 21, 1318–1329. [Google Scholar] [CrossRef]
- Francos-Quijorna, I.; Santos-Nogueira, E.; Gronert, K.; Sullivan, A.B.; Kopp, M.A.; Brommer, B.; David, S.; Schwab, J.M.; Lopez-Vales, R. Maresin 1 Promotes Inflammatory Resolution, Neuroprotection, and Functional Neurological Recovery After Spinal Cord Injury. J Neurosci 2017, 37, 11731–11743. [Google Scholar] [CrossRef]
- Zhu, M.; Wang, X.; Hjorth, E.; Colas, R.A.; Schroeder, L.; Granholm, A.C.; Serhan, C.N.; Schultzberg, M. Pro-Resolving Lipid Mediators Improve Neuronal Survival and Increase Abeta42 Phagocytosis. Mol Neurobiol 2016, 53, 2733–2749. [Google Scholar] [CrossRef]
- Sanchez-Fernandez, A.; Zandee, S.; Mastrogiovanni, M.; Charabati, M.; Rubbo, H.; Prat, A.; Lopez-Vales, R. Administration of Maresin-1 ameliorates the physiopathology of experimental autoimmune encephalomyelitis. J Neuroinflammation 2022, 19, 27. [Google Scholar] [CrossRef]
- Yin, P.; Wang, X.; Wang, S.; Wei, Y.; Feng, J.; Zhu, M. Maresin 1 Improves Cognitive Decline and Ameliorates Inflammation in a Mouse Model of Alzheimer's Disease. Front Cell Neurosci 2019, 13, 466. [Google Scholar] [CrossRef]
- Emre, C.; Arroyo-Garcia, L.E.; Do, K.V.; Jun, B.; Ohshima, M.; Alcalde, S.G.; Cothern, M.L.; Maioli, S.; Nilsson, P.; Hjorth, E.; et al. Intranasal delivery of pro-resolving lipid mediators rescues memory and gamma oscillation impairment in App(NL-G-F/NL-G-F) mice. Commun Biol 2022, 5, 245. [Google Scholar] [CrossRef]
- Van Dam, D.; De Deyn, P.P. Animal models in the drug discovery pipeline for Alzheimer's disease. Br J Pharmacol 2011, 164, 1285–1300. [Google Scholar] [CrossRef]
- Southam, D.S.; Dolovich, M.; O'Byrne, P.M.; Inman, M.D. Distribution of intranasal instillations in mice: effects of volume, time, body position, and anesthesia. Am J Physiol Lung Cell Mol Physiol 2002, 282, L833–L839. [Google Scholar] [CrossRef]
- Torika, N.; Asraf, K.; Cohen, H.; Fleisher-Berkovich, S. Intranasal telmisartan ameliorates brain pathology in five familial Alzheimer's disease mice. Brain Behav Immun 2017, 64, 80–90. [Google Scholar] [CrossRef]
- Xu, J.; Tao, J.; Wang, J. Design and Application in Delivery System of Intranasal Antidepressants. Front Bioeng Biotechnol 2020, 8, 626882. [Google Scholar] [CrossRef]
- Hong, S.; Nagayach, A.; Lu, Y.; Peng, H.; Duong, Q.A.; Pham, N.B.; Vuong, C.A.; Bazan, N.G. A high fat, sugar, and salt Western diet induces motor-muscular and sensory dysfunctions and neurodegeneration in mice during aging: Ameliorative action of metformin. CNS Neurosci Ther 2021, 27, 1458–1471. [Google Scholar] [CrossRef]
- Crouzin, N.; Baranger, K.; Cavalier, M.; Marchalant, Y.; Cohen-Solal, C.; Roman, F.S.; Khrestchatisky, M.; Rivera, S.; Feron, F.; Vignes, M. Area-specific alterations of synaptic plasticity in the 5XFAD mouse model of Alzheimer's disease: dissociation between somatosensory cortex and hippocampus. PLoS One 2013, 8, e74667. [Google Scholar] [CrossRef] [PubMed]
- Bussiere, T.; Bard, F.; Barbour, R.; Grajeda, H.; Guido, T.; Khan, K.; Schenk, D.; Games, D.; Seubert, P.; Buttini, M. Morphological characterization of Thioflavin-S-positive amyloid plaques in transgenic Alzheimer mice and effect of passive Abeta immunotherapy on their clearance. Am J Pathol 2004, 165, 987–995. [Google Scholar] [CrossRef]
- de Sousa, D.M.B.; Benedetti, A.; Altendorfer, B.; Mrowetz, H.; Unger, M.S.; Schallmoser, K.; Aigner, L.; Kniewallner, K.M. Immune-mediated platelet depletion augments Alzheimer's disease neuropathological hallmarks in APP-PS1 mice. Aging (Albany NY) 2023, 15, 630–649. [Google Scholar] [CrossRef]
- Liu, P.; Reichl, J.H.; Rao, E.R.; McNellis, B.M.; Huang, E.S.; Hemmy, L.S.; Forster, C.L.; Kuskowski, M.A.; Borchelt, D.R.; Vassar, R.; et al. Quantitative Comparison of Dense-Core Amyloid Plaque Accumulation in Amyloid-beta Protein Precursor Transgenic Mice. J Alzheimers Dis 2017, 56, 743–761. [Google Scholar] [CrossRef] [PubMed]
- Wood, J.I.; Wong, E.; Joghee, R.; Balbaa, A.; Vitanova, K.S.; Stringer, K.M.; Vanshoiack, A.; Phelan, S.J.; Launchbury, F.; Desai, S.; et al. Plaque contact and unimpaired Trem2 is required for the microglial response to amyloid pathology. Cell Rep 2022, 41, 111686. [Google Scholar] [CrossRef]
- Bonsi, P.; Cuomo, D.; Martella, G.; Madeo, G.; Schirinzi, T.; Puglisi, F.; Ponterio, G.; Pisani, A. Centrality of striatal cholinergic transmission in Basal Ganglia function. Front Neuroanat 2011, 5, 6. [Google Scholar] [CrossRef]
- Zhou, K.; Cherra, S.J., 3rd; Goncharov, A.; Jin, Y. Asynchronous Cholinergic Drive Correlates with Excitation-Inhibition Imbalance via a Neuronal Ca(2+) Sensor Protein. Cell Rep 2017, 19, 1117–1129. [Google Scholar] [CrossRef] [PubMed]
- Okada, K.; Hashimoto, K.; Kobayashi, K. Cholinergic regulation of object recognition memory. Front Behav Neurosci 2022, 16, 996089. [Google Scholar] [CrossRef]
- Lim, S.A.; Kang, U.J.; McGehee, D.S. Striatal cholinergic interneuron regulation and circuit effects. Front Synaptic Neurosci 2014, 6, 22. [Google Scholar] [CrossRef]
- Davies, P.; Maloney, A.J. Selective loss of central cholinergic neurons in Alzheimer's disease. Lancet 1976, 2, 1403. [Google Scholar] [CrossRef]
- Mesulam, M. The cholinergic lesion of Alzheimer's disease: pivotal factor or side show? Learn Mem 2004, 11, 43–49. [Google Scholar] [CrossRef] [PubMed]
- Yan, H.; Pang, P.; Chen, W.; Zhu, H.; Henok, K.A.; Li, H.; Wu, Z.; Ke, X.; Wu, J.; Zhang, T.; et al. The Lesion Analysis of Cholinergic Neurons in 5XFAD Mouse Model in the Three-Dimensional Level of Whole Brain. Mol Neurobiol 2018, 55, 4115–4125. [Google Scholar] [CrossRef] [PubMed]
- Hopperton, K.E.; Mohammad, D.; Trepanier, M.O.; Giuliano, V.; Bazinet, R.P. Markers of microglia in post-mortem brain samples from patients with Alzheimer's disease: a systematic review. Mol Psychiatry 2018, 23, 177–198. [Google Scholar] [CrossRef] [PubMed]
- Sheets, K.G.; Jun, B.; Zhou, Y.; Zhu, M.; Petasis, N.A.; Gordon, W.C.; Bazan, N.G. Microglial ramification and redistribution concomitant with the attenuation of choroidal neovascularization by neuroprotectin D1. Mol Vis 2013, 19, 1747–1759. [Google Scholar]
- Crews, F.T.; Lawrimore, C.J.; Walter, T.J.; Coleman, L.G., Jr. The role of neuroimmune signaling in alcoholism. Neuropharmacology 2017, 122, 56–73. [Google Scholar] [CrossRef] [PubMed]
- Guo, L.; Choi, S.; Bikkannavar, P.; Cordeiro, M.F. Microglia: Key Players in Retinal Ageing and Neurodegeneration. Front Cell Neurosci 2022, 16, 804782. [Google Scholar] [CrossRef] [PubMed]
- Cherry, J.D.; Olschowka, J.A.; O'Banion, M.K. Neuroinflammation and M2 microglia: the good, the bad, and the inflamed. J Neuroinflammation 2014, 11, 98. [Google Scholar] [CrossRef] [PubMed]
- Kwon, H.S.; Koh, S.H. Neuroinflammation in neurodegenerative disorders: the roles of microglia and astrocytes. Transl Neurodegener 2020, 9, 42. [Google Scholar] [CrossRef]
- Gotoh, M.; Miyamoto, Y.; Ikeshima-Kataoka, H. Astrocytic Neuroimmunological Roles Interacting with Microglial Cells in Neurodegenerative Diseases. Int J Mol Sci 2023, 24. [Google Scholar] [CrossRef]
- Huijbers, W.; Mormino, E.C.; Schultz, A.P.; Wigman, S.; Ward, A.M.; Larvie, M.; Amariglio, R.E.; Marshall, G.A.; Rentz, D.M.; Johnson, K.A.; et al. Amyloid-beta deposition in mild cognitive impairment is associated with increased hippocampal activity, atrophy and clinical progression. Brain 2015, 138, 1023–1035. [Google Scholar] [CrossRef]
- Mroczko, B.; Groblewska, M.; Litman-Zawadzka, A.; Kornhuber, J.; Lewczuk, P. Cellular Receptors of Amyloid beta Oligomers (AbetaOs) in Alzheimer's Disease. Int J Mol Sci 2018, 19. [Google Scholar] [CrossRef] [PubMed]
- Wyss-Coray, T.; Loike, J.D.; Brionne, T.C.; Lu, E.; Anankov, R.; Yan, F.; Silverstein, S.C.; Husemann, J. Adult mouse astrocytes degrade amyloid-beta in vitro and in situ. Nat Med 2003, 9, 453–457. [Google Scholar] [CrossRef] [PubMed]
- Glass, C.K.; Saijo, K.; Winner, B.; Marchetto, M.C.; Gage, F.H. Mechanisms underlying inflammation in neurodegeneration. Cell 2010, 140, 918–934. [Google Scholar] [CrossRef] [PubMed]
- Yan, L.J.; Xiao, M.; Chen, R.; Cai, Z. Metabolic Dysfunction of Astrocyte: An Initiating Factor in Beta-amyloid Pathology? Aging Neurodegener 2013, 1, 7–14. [Google Scholar]
- Liddelow, S.A.; Guttenplan, K.A.; Clarke, L.E.; Bennett, F.C.; Bohlen, C.J.; Schirmer, L.; Bennett, M.L.; Munch, A.E.; Chung, W.S.; Peterson, T.C.; et al. Neurotoxic reactive astrocytes are induced by activated microglia. Nature 2017, 541, 481–487. [Google Scholar] [CrossRef] [PubMed]
- Hinkle, J.T.; Dawson, V.L.; Dawson, T.M. The A1 astrocyte paradigm: New avenues for pharmacological intervention in neurodegeneration. Mov Disord 2019, 34, 959–969. [Google Scholar] [CrossRef] [PubMed]
- Joshi, A.U.; Minhas, P.S.; Liddelow, S.A.; Haileselassie, B.; Andreasson, K.I.; Dorn, G.W., 2nd; Mochly-Rosen, D. Fragmented mitochondria released from microglia trigger A1 astrocytic response and propagate inflammatory neurodegeneration. Nat Neurosci 2019, 22, 1635–1648. [Google Scholar] [CrossRef]
- Yun, S.P.; Kam, T.I.; Panicker, N.; Kim, S.; Oh, Y.; Park, J.S.; Kwon, S.H.; Park, Y.J.; Karuppagounder, S.S.; Park, H.; et al. Block of A1 astrocyte conversion by microglia is neuroprotective in models of Parkinson's disease. Nat Med 2018, 24, 931–938. [Google Scholar] [CrossRef]
- Clarke, L.E.; Liddelow, S.A.; Chakraborty, C.; Munch, A.E.; Heiman, M.; Barres, B.A. Normal aging induces A1-like astrocyte reactivity. Proc Natl Acad Sci U S A 2018, 115, E1896–E1905. [Google Scholar] [CrossRef]
- Liu, Y.X.; Sun, H.; Guo, W.Y. Astrocyte polarization in glaucoma: a new opportunity. Neural Regen Res 2022, 17, 2582–2588. [Google Scholar] [CrossRef]
- Morris, J.K.; Honea, R.A.; Vidoni, E.D.; Swerdlow, R.H.; Burns, J.M. Is Alzheimer's disease a systemic disease? Biochim Biophys Acta 2014, 1842, 1340–1349. [Google Scholar] [CrossRef] [PubMed]
- Wang, J.; Gu, B.J.; Masters, C.L.; Wang, Y.J. A systemic view of Alzheimer disease - insights from amyloid-beta metabolism beyond the brain. Nat Rev Neurol 2017, 13, 612–623. [Google Scholar] [CrossRef] [PubMed]
- Nation, D.A.; Sweeney, M.D.; Montagne, A.; Sagare, A.P.; D'Orazio, L.M.; Pachicano, M.; Sepehrband, F.; Nelson, A.R.; Buennagel, D.P.; Harrington, M.G.; et al. Blood-brain barrier breakdown is an early biomarker of human cognitive dysfunction. Nat Med 2019, 25, 270–276. [Google Scholar] [CrossRef]
- Zlokovic, B.V. Neurovascular pathways to neurodegeneration in Alzheimer's disease and other disorders. Nat Rev Neurosci 2011, 12, 723–738. [Google Scholar] [CrossRef] [PubMed]
- Zenaro, E.; Piacentino, G.; Constantin, G. The blood-brain barrier in Alzheimer's disease. Neurobiol Dis 2017, 107, 41–56. [Google Scholar] [CrossRef]
- Abbott, A. Dementia: a problem for our age. Nature 2011, 475, S2–S4. [Google Scholar] [CrossRef] [PubMed]
- Zlokovic, B.V. The blood-brain barrier in health and chronic neurodegenerative disorders. Neuron 2008, 57, 178–201. [Google Scholar] [CrossRef] [PubMed]
- Heneka, M.T.; Carson, M.J.; El Khoury, J.; Landreth, G.E.; Brosseron, F.; Feinstein, D.L.; Jacobs, A.H.; Wyss-Coray, T.; Vitorica, J.; Ransohoff, R.M.; et al. Neuroinflammation in Alzheimer's disease. Lancet Neurol 2015, 14, 388–405. [Google Scholar] [CrossRef]
- Pietronigro, E.; Zenaro, E.; Constantin, G. Imaging of Leukocyte Trafficking in Alzheimer's Disease. Front Immunol 2016, 7, 33. [Google Scholar] [CrossRef]
- Song, Z.; Bhattacharya, S.; Clemens, R.A.; Dinauer, M.C. Molecular regulation of neutrophil swarming in health and disease: Lessons from the phagocyte oxidase. iScience 2023, 26, 108034. [Google Scholar] [CrossRef] [PubMed]
- Lammermann, T. In the eye of the neutrophil swarm-navigation signals that bring neutrophils together in inflamed and infected tissues. J Leukoc Biol 2016, 100, 55–63. [Google Scholar] [CrossRef] [PubMed]
- Nitta, T.; Hata, M.; Gotoh, S.; Seo, Y.; Sasaki, H.; Hashimoto, N.; Furuse, M.; Tsukita, S. Size-selective loosening of the blood-brain barrier in claudin-5-deficient mice. J Cell Biol 2003, 161, 653–660. [Google Scholar] [CrossRef] [PubMed]
- Shadfar, S.; Hwang, C.J.; Lim, M.S.; Choi, D.Y.; Hong, J.T. Involvement of inflammation in Alzheimer's disease pathogenesis and therapeutic potential of anti-inflammatory agents. Arch Pharm Res 2015, 38, 2106–2119. [Google Scholar] [CrossRef] [PubMed]
- Iqbal, K.; Grundke-Iqbal, I. Alzheimer's disease, a multifactorial disorder seeking multitherapies. Alzheimers Dement 2010, 6, 420–424. [Google Scholar] [CrossRef] [PubMed]
- Carreiras, M.C.; Mendes, E.; Perry, M.J.; Francisco, A.P.; Marco-Contelles, J. The multifactorial nature of Alzheimer's disease for developing potential therapeutics. Curr Top Med Chem 2013, 13, 1745–1770. [Google Scholar] [CrossRef] [PubMed]
- Mandrekar-Colucci, S.; Landreth, G.E. Microglia and inflammation in Alzheimer's disease. CNS Neurol Disord Drug Targets 2010, 9, 156–167. [Google Scholar] [CrossRef] [PubMed]
- Wang, W.Y.; Tan, M.S.; Yu, J.T.; Tan, L. Role of pro-inflammatory cytokines released from microglia in Alzheimer's disease. Ann Transl Med 2015, 3, 136. [Google Scholar] [CrossRef] [PubMed]
- Erdo, F.; Bors, L.A.; Farkas, D.; Bajza, A.; Gizurarson, S. Evaluation of intranasal delivery route of drug administration for brain targeting. Brain Res Bull 2018, 143, 155–170. [Google Scholar] [CrossRef]
- Lochhead, J.J.; Thorne, R.G. Intranasal delivery of biologics to the central nervous system. Adv Drug Deliv Rev 2012, 64, 614–628. [Google Scholar] [CrossRef]
- Chauhan, M.B.; Chauhan, N.B. Brain Uptake of Neurotherapeutics after Intranasal versus Intraperitoneal Delivery in Mice. J Neurol Neurosurg 2015, 2. [Google Scholar] [CrossRef]
- Louneva, N.; Cohen, J.W.; Han, L.Y.; Talbot, K.; Wilson, R.S.; Bennett, D.A.; Trojanowski, J.Q.; Arnold, S.E. Caspase-3 is enriched in postsynaptic densities and increased in Alzheimer's disease. Am J Pathol 2008, 173, 1488–1495. [Google Scholar] [CrossRef] [PubMed]
- Cunningham, C.; Wilcockson, D.C.; Campion, S.; Lunnon, K.; Perry, V.H. Central and systemic endotoxin challenges exacerbate the local inflammatory response and increase neuronal death during chronic neurodegeneration. J Neurosci 2005, 25, 9275–9284. [Google Scholar] [CrossRef] [PubMed]
- Sil, S.; Ghosh, T. Role of cox-2 mediated neuroinflammation on the neurodegeneration and cognitive impairments in colchicine induced rat model of Alzheimer's Disease. J Neuroimmunol 2016, 291, 115–124. [Google Scholar] [CrossRef]
- Singhal, G.; Jaehne, E.J.; Corrigan, F.; Toben, C.; Baune, B.T. Inflammasomes in neuroinflammation and changes in brain function: a focused review. Front Neurosci 2014, 8, 315. [Google Scholar] [CrossRef] [PubMed]
- Rodriguez-Prados, J.C.; Traves, P.G.; Cuenca, J.; Rico, D.; Aragones, J.; Martin-Sanz, P.; Cascante, M.; Bosca, L. Substrate fate in activated macrophages: a comparison between innate, classic, and alternative activation. J Immunol 2010, 185, 605–614. [Google Scholar] [CrossRef]
- Gao, C.; Jiang, J.; Tan, Y.; Chen, S. Microglia in neurodegenerative diseases: mechanism and potential therapeutic targets. Signal Transduct Target Ther 2023, 8, 359. [Google Scholar] [CrossRef]
- Ransohoff, R.M.; Perry, V.H. Microglial physiology: unique stimuli, specialized responses. Annu Rev Immunol 2009, 27, 119–145. [Google Scholar] [CrossRef]
- Mackenzie, I.R.; Hao, C.; Munoz, D.G. Role of microglia in senile plaque formation. Neurobiol Aging 1995, 16, 797–804. [Google Scholar] [CrossRef]
- Stalder, M.; Phinney, A.; Probst, A.; Sommer, B.; Staufenbiel, M.; Jucker, M. Association of microglia with amyloid plaques in brains of APP23 transgenic mice. Am J Pathol 1999, 154, 1673–1684. [Google Scholar] [CrossRef]
- Yan, P.; Bero, A.W.; Cirrito, J.R.; Xiao, Q.; Hu, X.; Wang, Y.; Gonzales, E.; Holtzman, D.M.; Lee, J.M. Characterizing the appearance and growth of amyloid plaques in APP/PS1 mice. J Neurosci 2009, 29, 10706–10714. [Google Scholar] [CrossRef]
- Perlmutter, L.S.; Barron, E.; Chui, H.C. Morphologic association between microglia and senile plaque amyloid in Alzheimer's disease. Neurosci Lett 1990, 119, 32–36. [Google Scholar] [CrossRef] [PubMed]
- Cras, P.; Kawai, M.; Siedlak, S.; Mulvihill, P.; Gambetti, P.; Lowery, D.; Gonzalez-DeWhitt, P.; Greenberg, B.; Perry, G. Neuronal and microglial involvement in beta-amyloid protein deposition in Alzheimer's disease. Am J Pathol 1990, 137, 241–246. [Google Scholar] [PubMed]
- Wegiel, J.; Imaki, H.; Wang, K.C.; Wegiel, J.; Wronska, A.; Osuchowski, M.; Rubenstein, R. Origin and turnover of microglial cells in fibrillar plaques of APPsw transgenic mice. Acta Neuropathol 2003, 105, 393–402. [Google Scholar] [CrossRef] [PubMed]
- Bornemann, K.D.; Wiederhold, K.H.; Pauli, C.; Ermini, F.; Stalder, M.; Schnell, L.; Sommer, B.; Jucker, M.; Staufenbiel, M. Abeta-induced inflammatory processes in microglia cells of APP23 transgenic mice. Am J Pathol 2001, 158, 63–73. [Google Scholar] [CrossRef] [PubMed]
- Cai, Z.; Hussain, M.D.; Yan, L.J. Microglia, neuroinflammation, and beta-amyloid protein in Alzheimer's disease. Int J Neurosci 2014, 124, 307–321. [Google Scholar] [CrossRef] [PubMed]
- Shrivastava, P.; Vaibhav, K.; Tabassum, R.; Khan, A.; Ishrat, T.; Khan, M.M.; Ahmad, A.; Islam, F.; Safhi, M.M.; Islam, F. Anti-apoptotic and anti-inflammatory effect of Piperine on 6-OHDA induced Parkinson's rat model. J Nutr Biochem 2013, 24, 680–687. [Google Scholar] [CrossRef] [PubMed]
- Franco-Bocanegra, D.K.; Gourari, Y.; McAuley, C.; Chatelet, D.S.; Johnston, D.A.; Nicoll, J.A.R.; Boche, D. Microglial morphology in Alzheimer's disease and after Abeta immunotherapy. Sci Rep 2021, 11, 15955. [Google Scholar] [CrossRef] [PubMed]
- Poplimont, H.; Georgantzoglou, A.; Boulch, M.; Walker, H.A.; Coombs, C.; Papaleonidopoulou, F.; Sarris, M. Neutrophil Swarming in Damaged Tissue Is Orchestrated by Connexins and Cooperative Calcium Alarm Signals. Curr Biol 2020, 30, 2761–2776.e2767. [Google Scholar] [CrossRef]
- Kotredes, K.P.; Pandey, R.S.; Persohn, S.; Elderidge, K.; Burton, C.P.; Miner, E.W.; Haynes, K.A.; Santos, D.F.S.; Williams, S.P.; Heaton, N.; et al. Characterizing molecular and synaptic signatures in mouse models of late-onset Alzheimer's disease independent of amyloid and tau pathology. Alzheimers Dement 2024, 20, 4126–4146. [Google Scholar] [CrossRef]
- Oblak, A.L.; Forner, S.; Territo, P.R.; Sasner, M.; Carter, G.W.; Howell, G.R.; Sukoff-Rizzo, S.J.; Logsdon, B.A.; Mangravite, L.M.; Mortazavi, A.; et al. Model organism development and evaluation for late-onset Alzheimer's disease: MODEL-AD. Alzheimers Dement (N Y) 2020, 6, e12110. [Google Scholar] [CrossRef]
- Sukoff Rizzo, S.J.; Masters, A.; Onos, K.D.; Quinney, S.; Sasner, M.; Oblak, A.; Lamb, B.T.; Territo, P.R.; consortium, M.-A. Improving preclinical to clinical translation in Alzheimer's disease research. Alzheimers Dement (N Y) 2020, 6, e12038. [Google Scholar] [CrossRef] [PubMed]
- Forner, S.; Kawauchi, S.; Balderrama-Gutierrez, G.; Kramar, E.A.; Matheos, D.P.; Phan, J.; Javonillo, D.I.; Tran, K.M.; Hingco, E.; da Cunha, C.; et al. Systematic phenotyping and characterization of the 5xFAD mouse model of Alzheimer's disease. Sci Data 2021, 8, 270. [Google Scholar] [CrossRef] [PubMed]
- Chen, C.; Wei, J.; Ma, X.; Xia, B.; Shakir, N.; Zhang, J.K.; Zhang, L.; Cui, Y.; Ferguson, D.; Qiu, S.; et al. Disrupted Maturation of Prefrontal Layer 5 Neuronal Circuits in an Alzheimer's Mouse Model of Amyloid Deposition. Neurosci Bull 2023, 39, 881–892. [Google Scholar] [CrossRef] [PubMed]
Disclaimer/Publisher’s Note: The statements, opinions and data contained in all publications are solely those of the individual author(s) and contributor(s) and not of MDPI and/or the editor(s). MDPI and/or the editor(s) disclaim responsibility for any injury to people or property resulting from any ideas, methods, instructions or products referred to in the content. |
© 2024 by the authors. Licensee MDPI, Basel, Switzerland. This article is an open access article distributed under the terms and conditions of the Creative Commons Attribution (CC BY) license (http://creativecommons.org/licenses/by/4.0/).


