Preprint
Article

Entropy-Driven Crystallization of Hard Colloidal Mixtures of Polymers and Monomers

Altmetrics

Downloads

116

Views

56

Comments

0

A peer-reviewed article of this preprint also exists.

Submitted:

08 July 2024

Posted:

10 July 2024

You are already at the latest version

Alerts
Abstract
The self-assembly is an intriguing process of great importance in general soft matter and thus re-ceives an ever-growing scientific interest. Its most trivial example is the entropy-driven crystalli-zation of hard spheres. Past works have established the similarities and differences in the phase behavior of monomers and chains made of hard spheres. In the present work, inspired by the dif-ference in the melting points of the pure components, we study, through Monte Carlo simulations, the phase behavior of athermal mixtures composed of fully flexible polymers and individual monomers of uniform size. We analyze how the relative number fraction and the packing density affect crystallization and the established ordered morphologies. A synergetic effect is observed in the crystallization leading to synchronous crystallization of the two species. Structural analysis of the resulting ordered morphologies shows perfect mixing and thus no phase separation, which could split the system into polymer-rich and monomer-rich domains. Due to the constraints imposed by chain connectivity, the local environment of the individual spheres is systematically more spherical and more symmetric compared to the one of spheres belonging to chains. In general, increasing polymer content leads to reduction of the degree of crystallinity. According to the present findings, relative concentration is another determining factor to control the phase behavior of hard colloidal systems based on polymers.
Keywords: 
Subject: Chemistry and Materials Science  -   Physical Chemistry

1. Introduction

Self-assembly and self-organization are spontaneous processes, strongly related to thermal fluctuations, that dominate the behavior of a wide range of systems belonging to the general field of soft matter [1,2,3]. Phase transition [4] is perhaps the most common example of such processes. For athermal systems made of hard bodies such phase transitions are driven solely due to an increase in entropy, rendering them as excellent case studies to understand better the complex phenomenon, especially at the atomic level [5,6].
Perhaps the most well-known example of entropy-driven phase transitions is the isotropic-to-nematic transition of hard rods as originally predicted by Onsager [7] and verified by computer simulations, which demonstrated the formation of liquid crystals once specific conditions are met [8,9,10]. Another eminent example is the crystallization of hard spheres of uniform size in three dimensions, initially predicted by Kirkwood [11] and further confirmed by Molecular Dynamics (MD) [12] and Monte Carlo (MC) [13] simulations. The hard-body nature of both systems leaves entropy as the sole factor that drives the behavior of the system. Thus, at sufficiently high concentrations and at constant volume crystallization occurs because the final crystal made of hard spheres possesses more entropy than the initial amorphous packing. For hard sphere monomers (mon) of the same diameter, initial estimates for the freezing and melting transitions were provided by Hoover and Ree [14] at φ m o n F 0.494 and φ m o n M 0.545 , respectively, which have been revised to the more precise values of φ m o n F 0.4915 and φ m o n M 0.5431 by Vega and Noya [15]. From the thermodynamic perspective, all independent calculations converge to the fact that the face centered cubic (FCC) crystal is only marginally more stable than the hexagonal close packed (HCP) one, with the free-energy difference depending on the estimation method, the proximity (from the above) to the melting point, and the size of the system [16,17,18,19,20].
While the FCC crystal is the most stable polymorph and thus the one expected in experiments and simulations on hard-sphere crystallization the most encountered configuration is a random hexagonal close packed (rHCP) morphology with defects in the form of twins at the boundaries of the HCP and FCC domains [21,22]. Even if almost seven decades have passed since the first computational demonstration of hard sphere crystallization, [23] crystal perfection in the form of a pure FCC crystal, with minimal population of defects in the form of other crystallites or of amorphous clusters, is very rarely reported. This is since the structural transition between polymorphs could be too slow to be appropriately gauged in simulations and experiments given the inherent limitations in the observation time.
Given their simplicity, molecular simulations based on the hard-sphere model constitute an ideal tool to shed light on the mechanism of crystallization as they can assess the precursor structures, track the crystal nucleation and growth and identify with precision the final ordered morphologies [22,24,25,26,27,28,29,30,31,32,33,34,35,36,37,38].
With respect to athermal polymer packings in the bulk, it has been demonstrated that freely jointed chains of tangent hard spheres crystallize as monomers do [39,40,41]. According to the constant-volume simulations of [39,40] at packing densities φ ≤ 0.56 chain systems remain amorphous, while at φ = 0.58 crystallization occurs. This upper estimate for the phase transition of hard-sphere polymers (pol) has been recently revised in [42], according to which the melting point lies in the range φ p o l M 0.56,0.57 . Further studies have demonstrated that chain length has a minimal effect on crystallization and the melting transition [39,40], while other factors like gaps in bonds [43,44] and chain stiffness [42,45,46] affect profoundly the process. Additionally, the established ordered morphologies, while mainly of rHCP character as in the case of monomeric hard spheres, have a unique stacking direction, with the formed HCP and FCC layers being free of fivefold defects [40], which appear abundantly in monomeric athermal rHCP crystals [47,48]. Very recently through very long MC simulations, we have demonstrated that athermal packings of very long chains (N = 1000, N being the molecular length) transit between different crystal polymorphs and eventually form a single FCC crystal of very high perfection [49]. Through semi-analytical calculations, it has been argued that indeed the FCC crystal is the thermodynamically most stable structure for athermal polymers [50], as is in the case of monomers [16,17,18,19,20].
As a result of the constraints imposed by chain connectivity, the melting point of athermal polymers [39,40] is shifted to higher packing densities compared to the one of individual monomers [14,15]. The present work is motivated by these differences and findings. Thus, employing Monte Carlo simulations, executed through the Simu-D software [51], we explore the phase behavior of athermal mixtures made of fully flexible chains and individual monomers. We study in detail the effect of the relative number fraction on the ability of the systems to crystallize in a concentration range above the melting point of monomers and below the one of polymers. The idea is to investigate whether the chains could act as inhibitors to the crystallization of monomers and/or whether monomers could act as promoters to the crystallization of chains. One should not discard further the possibility of phase separation splitting the system volume into polymer-rich and monomer-rich domains.
Towards this, we first provide an updated estimate of the melting point for freely jointed chains of tangent hard spheres. Then we explore the phase behavior as a function of packing density and polymer content. In parallel, we gauge structurally the ordered morphologies to quantify the level of mixing. Finally, we analyze the entropic origins of the spontaneous self-assembly by comparing the shape measures of the Voronoi polyhedral between the initial random packing and the final crystal distinguishing between spheres belonging to chains and individual ones.
The paper is organized as follows: in Section 2 we present the molecular model, the systems studied and the simulation method for the generation, equilibration and characterization of the computer-generated athermal mixtures. In Section 3 we present the results of the simulations and provide an analysis of the established trends. Section 4 summarizes the main conclusions and describes current efforts and plans.

2. Molecular Model, Systems Studied and Simulation Method

2.1 Molecular Model

In the present work, we simulate athermal mixtures of monomers and polymers. All sites, independent of belonging to a chain or not, are represented as hard spheres of uniform collision diameter (σ), which is set as the characteristic length of the system. The pair-wise energy of hard-sphere (HS) model, UHS, is given by:
U H S r i j = 0 ,           r i j σ   ,         r i j < σ
where rij is the distance between the centers of atoms i and j. All polymers are represented as linear, freely jointed chains so that bending and torsion angles are allowed to fluctuate freely without any constraints imposed by corresponding potential functions. Bond lengths are, within a numerical tolerance of 6.5×10⁻⁴, equal to σ, so that tangency condition is enforced between successive spheres along the chain backbone.

2.2 Systems Studied

Simulations are conducted in a cubic simulation cell, with periodic boundary conditions applied in all three dimensions, effectively corresponding to a bulk, unconstraint system. For non-overlapping spheres, like the ones modelled here, packing density (volume fraction), φ, is defined as the total volume occupied by the hard spheres, VHS, over the volume of the simulation cell, Vcell:
φ = V H S V cell = π 6 N a t V cell   σ 3
where Nat is the total number of hard spheres, independently of being part of chains or not. All systems studied are composed of Nat = 1200, which are split into Npol spheres belonging to chains, and Nmon spheres existing as individual entities so that Nat = Npol + Nmon. While spheres change identity due to the application of specific MC moves, as will be described in the next section, the populations Nat, Npol and Nmon remain constant throughout a given simulation. The Npol spheres are further distributed into Nch chains, with an average length (measured in number of spheres), Nav. Based on the above the relative number fraction, x, (or polymer fraction) can be defined as:
x = N p o l N a t = N a v N c h N m o n + N a v N c h
The limiting values of x = 0 and 1, correspond to pure monomeric (Npol = 0; Nmon = Nat) and polymeric (Npol = Nat; Nmon = 0) HS systems, respectively. In the continuation, we will use also the sub-indices “mon” (x = 0) and “pol” (x = 1) to identify these limits.
The pure-component systems serve further as the reference cases to compare against since their phase behavior is well established in the literature [14,15,39,40,42], as described in detail in the introduction. In all simulations considered here, the average chain length is Nav = 12 and chain lengths, N, can fluctuate uniformly in the interval N   6,18 . Table 1 summarizes all mixture compositions simulated in this work. In addition, packing fraction has been explored in the range φ   0.5500 ,   0.5700 , with a step of 0.0025. As explained in the introduction, this interval has been selected to correspond to the regime slightly above the melting point of monomeric (x = 0) hard spheres ( φ m o n M 0.5431 ) and below the most recent estimate for the melting point for HS polymers ( φ p o l M 0.57 ), as identified in [42].

2.3. Simulation Method

All simulations, including the generation and equilibration of the systems, and their successive structural identification have been performed through the Simu-D suite [51]. The simulator part is effectively a Monte Carlo (MC) collection of algorithms which is composed of the following types of moves: i) monomer displacement, ii) reptation, iii) rotation, iv) flip, v) intermolecular reptation [52,53], vi) end-group rearrangement (originally termed CCB [54,55,56]), vii) simplified end-bridging (sEB) [57], viii) simplified intramolecular end-bridging (sIEB) [57], and ix) identity-exchange type 1 (IdEx1) [51]. Moves ii) – viii) affect chains by reconstructing a single sphere (ii) – v)), or a group of spheres (vi)), while moves vii) – viii) change the connectivity of the chains by deleting and reconstructing bonds without displacing spheres [51,57,58] and are inspired by analogous moves for the simulation of polymer melts in atomistic detail [53,59,60]. Monomer displacement targets individual spheres with the amplitude of the displacement being autocorrected to provide an acceptance rate for the move close to a pre-set value. Finally, IdEx1 changes the identity of a pair of spheres, one being individual the other belonging to a polymer. A distance condition must be fulfilled to initiate the move: an individual monomer should lie within a bridgeable distance to a chain end. Bridgeable distance corresponds practically to a distance that can be covered by a bond length (practically equal to σ in the present work since tangency is enforced between bonded spheres). The individual monomer becomes the new chain end while, in parallel, at the other end of the chain the terminal bond is deleted and the sphere becomes an individual monomer, maintaining the populations Nmon and Npol constant. This move, as can be seen in the sketch of Fig. 3 in Ref. [51], does not entail sphere displacement(s), but rather proceeds through the deletion and formation of properly selected bonds. Based on this IdEx1 is expected to have enhanced acceptance rate at very high concentration. A practical implementation of the IdEx1 move can be seen in the panels of Figure 1 for an athermal mixture with x = 0.50 at φ = 0.56.
The attempt probabilities for each move depend heavily on the relative molar fraction. Clearly, in the limit of x = 0 only monomer displacement (i)) is activated and in the limit of x = 1, moves i) and ix) are excluded. Localized polymer moves (ii) – vi)) are executed in a configurational bias way with the number of trials being set at ntrials = 50 at all volume fractions.
Initial configurations are borrowed from Refs. [42,62] corresponding to pure polymer systems (x = 1) of freely-jointed chains (Nch = 100, Nat = Npol = 1200) at a packing density of φ = 0.50, corresponding to an amorphous state, above the freezing transition of HS monomers located at φ m o n F = 0.494 according to [14]. Depending on the target mixture composition, x, a matching number of chains is selected at random, and all corresponding bonds are eliminated. Constant-volume simulations are then conducted at φ = 0.50 so each system loses memory of its initial configuration. Then it is isotropically compressed until the desired density is reached. Finally, production simulations are executed under constant volume, further fixing Nat, Npol and Nmon. The presence of sEB (vii)) and intermolecular reptation (v)) in the MC scheme leads to a (uniform) distribution in chain lengths, which is controlled by properly selecting the spectrum of chemical potentials, as explained originally in Ref. [59] and in the Appendix of Ref. [57]. All simulations are concluded when between 6×10¹¹ and 8×10¹¹ MC steps are reached, a duration which is determined to be at least one order of magnitude longer than the time (measured in MC steps) when crystallization occurs. System configurations (frames) are recorded every 107 MC steps. The reproducibility of the results for the pure monomer system (x = 0) has been verified by conducting collision-driven MD simulations on the same initial configurations through a simple event-driven algorithm [63], as the one utilized in Refs. [47] and [48].

2.4. Post-Simulation Analysis

An essential element of the present modelling scheme is the identification of a possible phase transition and the characterization of the thermodynamically stable morphology at the end of the simulation. Towards this, we employ the characteristic crystallographic element (CCE) norm [64,65] as implemented in the descriptor part of the Simu-D suite [51]. The CCE norm descriptor relies on the characteristic crystallographic elements and actions, which are uniquely defined for each crystal [66,67,68], to gauge the local structure of computer-generated system configurations made of atoms or particles in three [39,43,49,69] or two dimensions [69,70], in the bulk and/or on flat surfaces [71,72]. This is achieved through the quantification of radial and orientational deviations of the “real” environment and the ideal one of a given perfect crystal. The lower the value of the CCE norm, the higher the similarity to the reference crystal. By construction, the CCE norm is highly discriminatory, and no two crystals can have simultaneously very low CCE norm values. The exact details of the CCE norm algorithm can be found in Refs. [51,64,65]. Here the hexagonal close packed (HCP), face centered cubic (FCC), body centered cubic (BCC), and simple hexagonal (HEX) crystals are used as reference templates along with the fivefold (FIV) local symmetry. The CCE norm threshold utilized to label a sphere as of X-type similarity (X corresponding to HCP, FCC, BCC, HEX, or FIV) is set to a value of εthres = 0.245, in consistency with our past studies on athermal packings [39,40,43,47,69,70,71]. Any site not possessing one of the reference similarities stated above (HCP, FCC, BCC, HEX, or FIV) is labelled as amorphous (AMO).
In practice, the CCE norm is applied first by identifying the closest neighbors around each reference site, i, through a Voronoi tessellation performed by the voro++ software [73]. Once the information about the nearest neighbors is available, the crystallographic elements and actions are applied by mapping the computer-generated local environment into the one of the ideal reference crystal X to calculate the corresponding CCE norm, ε i X . The procedure is repeated until all spheres of a system configuration (frame) are analyzed and an order parameter, SX, is calculated for each crystal counting effectively the population of sites with such structural similarity:
S X = 0 ε t h r e s P ( ε X ) d ε X ,   τ c = X S X
where P(εX) is the probability function of the CCE norm for reference crystal X. Finally, we can define total crystallinity, τc, as the sum of all crystal-related CCE-order parameters. Given that the studied systems are mixtures of different components, one can further define the corresponding order parameter and crystallinity at the level of polymer (“pol”), monomer (“mon”) and total (“tot”) population according to:
S t o t X = x S p o l X + ( 1 x ) S m o n X     τ t o t c = x τ p o l c + ( 1 x ) S τ m o n c
Having available the information from the Voronoi tessellation, we can further reconstruct the corresponding polyhedron and calculate its size and shape following the concept of Ref. [49]. This is done by considering the Voronoi cell as a body composed of the vertices, all being treated as unit masses. Asphericity, b, acylindricity, c, and relative shape anisotropy, k2, can be calculated by the eigenvalues ( λ 1 2   , λ 2 2 , λ 3 2   with λ 1 2   λ 2 2   λ 3 2 ) of the number-averaged analog of the moment of inertia tensor of the Voronoi polyhedron as [49]:
b = λ 1 2 1 2 λ 2 2 + λ 3 2 c = λ 2 2 λ 3 2 k 2 = 3 2 λ 1 4 + λ 2 4 + λ 3 4 λ 1 2 + λ 2 2 + λ 3 2 2 1 2
Calculation of the above quantities allows us to compare the symmetry and isotropy of the local environment not only between the amorphous and the ordered states but also between spheres belonging to chains and individual ones.

3. Results

3.1. Phase Behavior

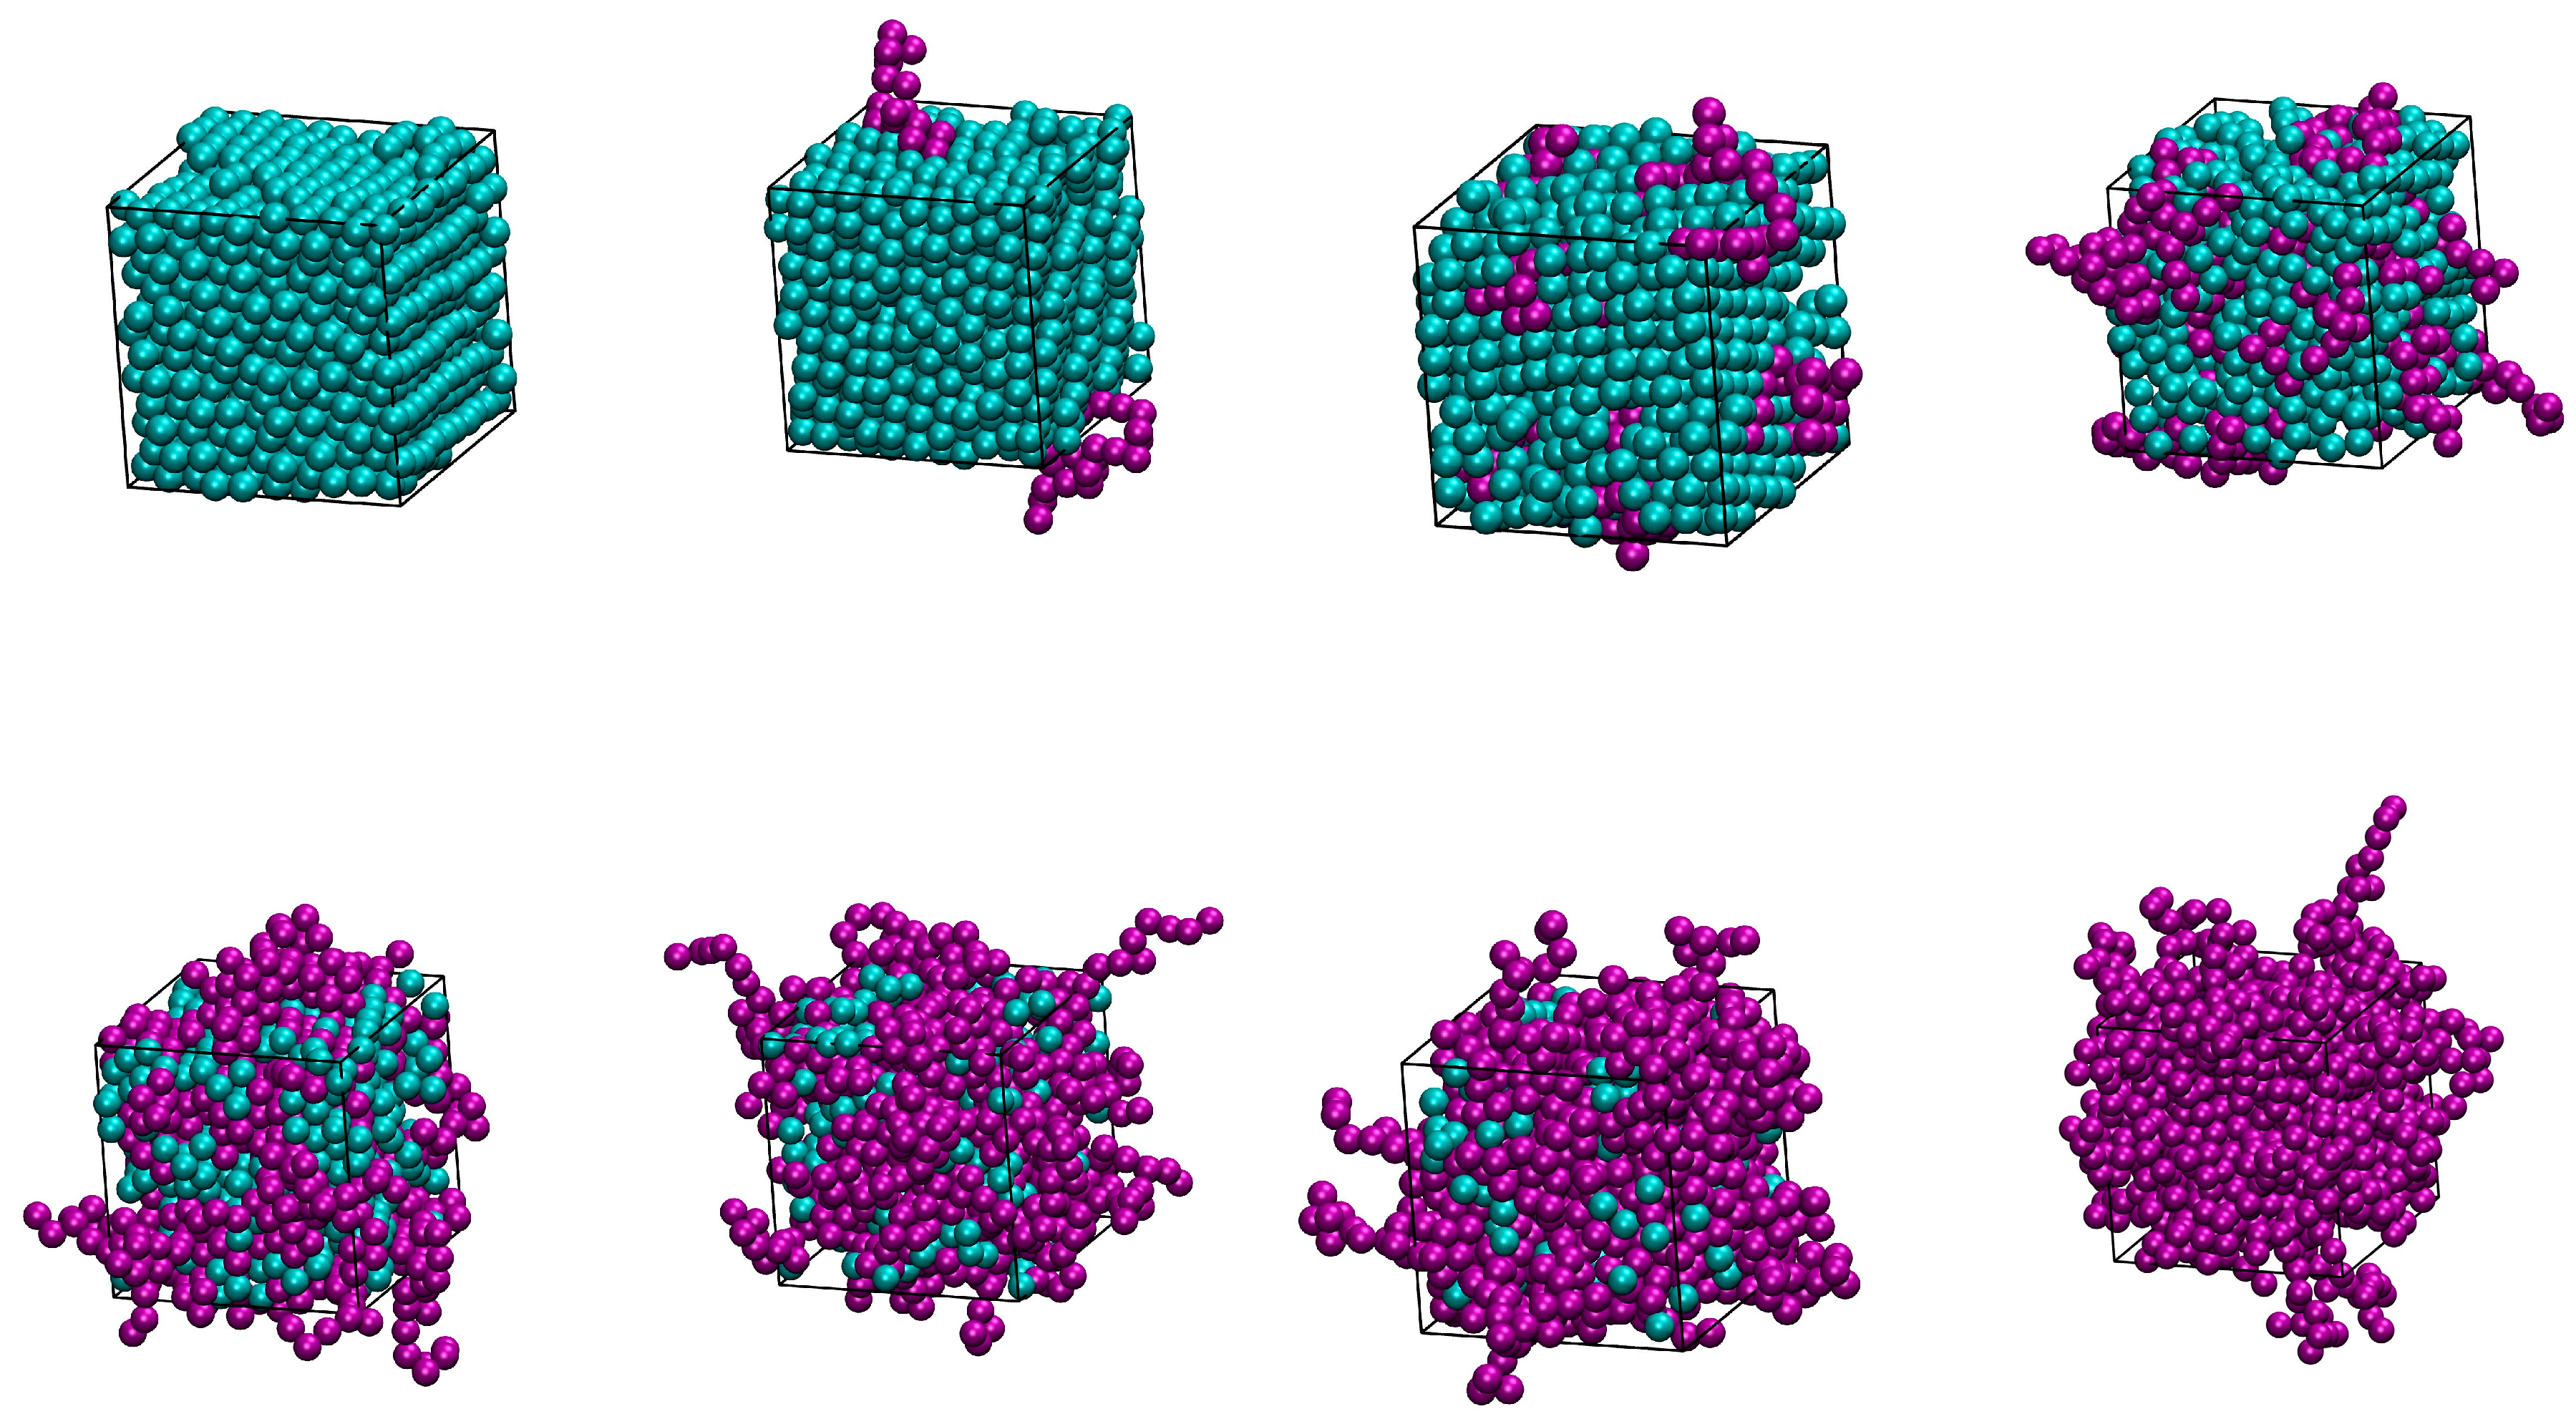
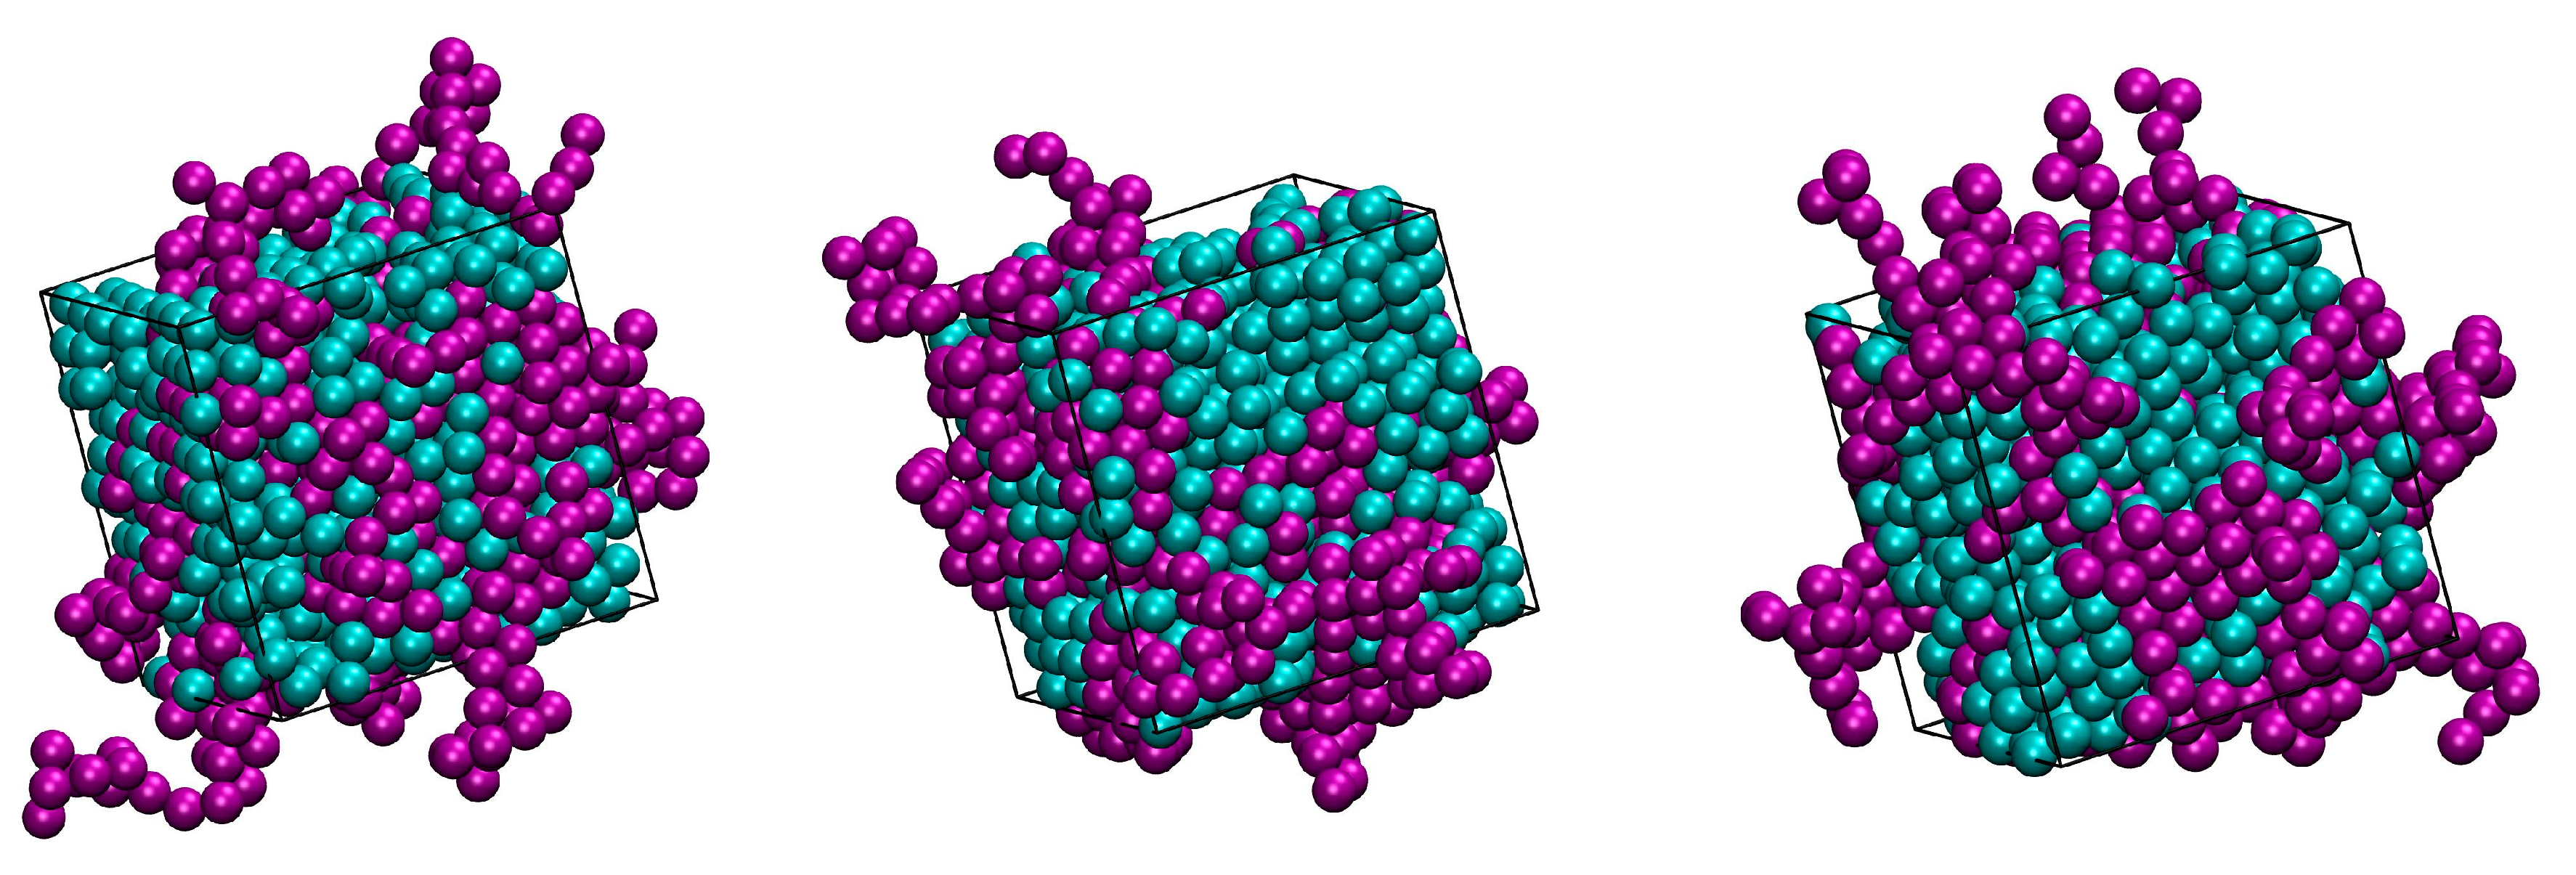
Figure 2 and Figure 3 host snapshots at the end of the MC simulations for different number fractions, x, at a fixed packing density (φ = 0.5575), and at various packing densities for a given number fraction (x = 0.5), respectively. Individual spheres and ones belonging to polymers are colored cyan and purple, respectively, with the latter being shown with the coordinates of their centers being fully unwrapped in space.
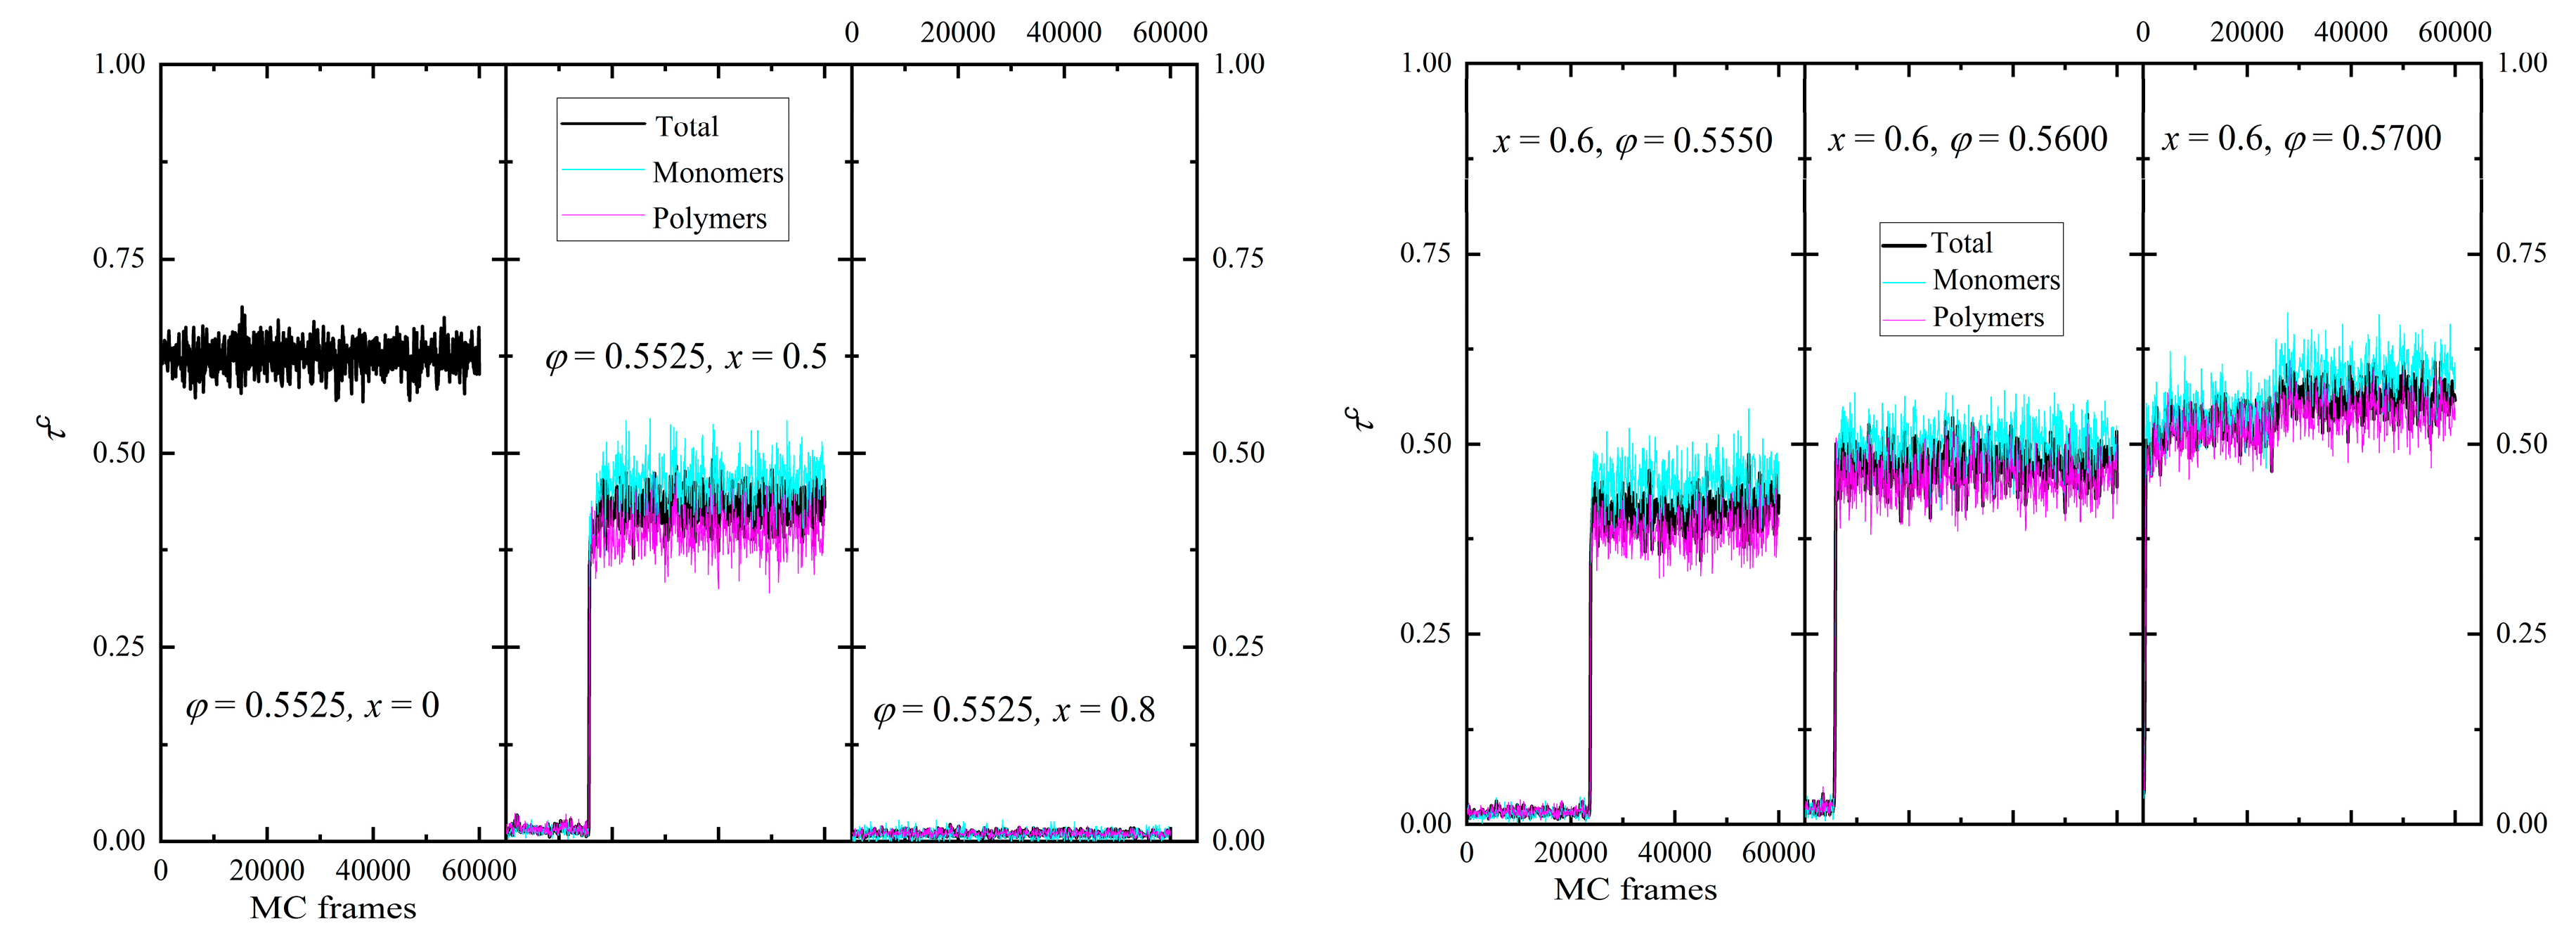
The phase behavior is gauged by tracking the evolution of the degree of crystallinity, τc, and of the individual order parameters, SX, as the simulation evolves, i.e. as a function of MC steps. We should remind here that due to the stochastic nature of the MC scheme and the application of unphysical moves, as the IdEx1 move as seen in Figure 1, no information related to time is available. Thus, how early or late a phase transition may occur along the MC trajectory is expected to depend strongly on the combination of the x and φ conditions but cannot be related to a crystallization rate. The evolution of the degree of crystallinity for the individual components and the total population is presented in the left and right panels of Figure 4 for selected systems. In the former, we keep the volume fraction constant (φ = 0.5525) and vary the relative number fraction (x = 0, 0.5, and 0.8), while, in the latter, we fix x = 0.60 and systematically change φ = 0.555, 0.56, and 0.57. At φ = 0.5525, a concentration value which is above the melting point of individual monomers and quite below the one of chains, the purely monomeric system shows a crystallization which occurs immediately so that even the first analyzed frame has already transited to the ordered state. As the polymer content increases (x = 0.5), crystallization becomes more difficult as indicated by the transition shifting to later steps and by the lower degree of crystallinity. Finally, at x = 0.8 where the polymer component is dominant, no phase transition takes place, and the packing remains amorphous. In parallel, we can observe that for a fixed mixture composition as packing density increases so does the crystallinity of both compounds and accordingly the total one.
Two important trends can be further identified: first, even if the pure components have different melting points, the phase transition occurs simultaneously for both polymers and monomers. This trend is reproducible for all systems studied here and crystallize. Second, the degree of ordering for individual spheres is universally higher than the one of spheres belonging to chains. This combination points towards a synchronous crystallization of the whole mixture, which leads to a better-formed ordered environment around an individual site compared to the one of a polymer segment.
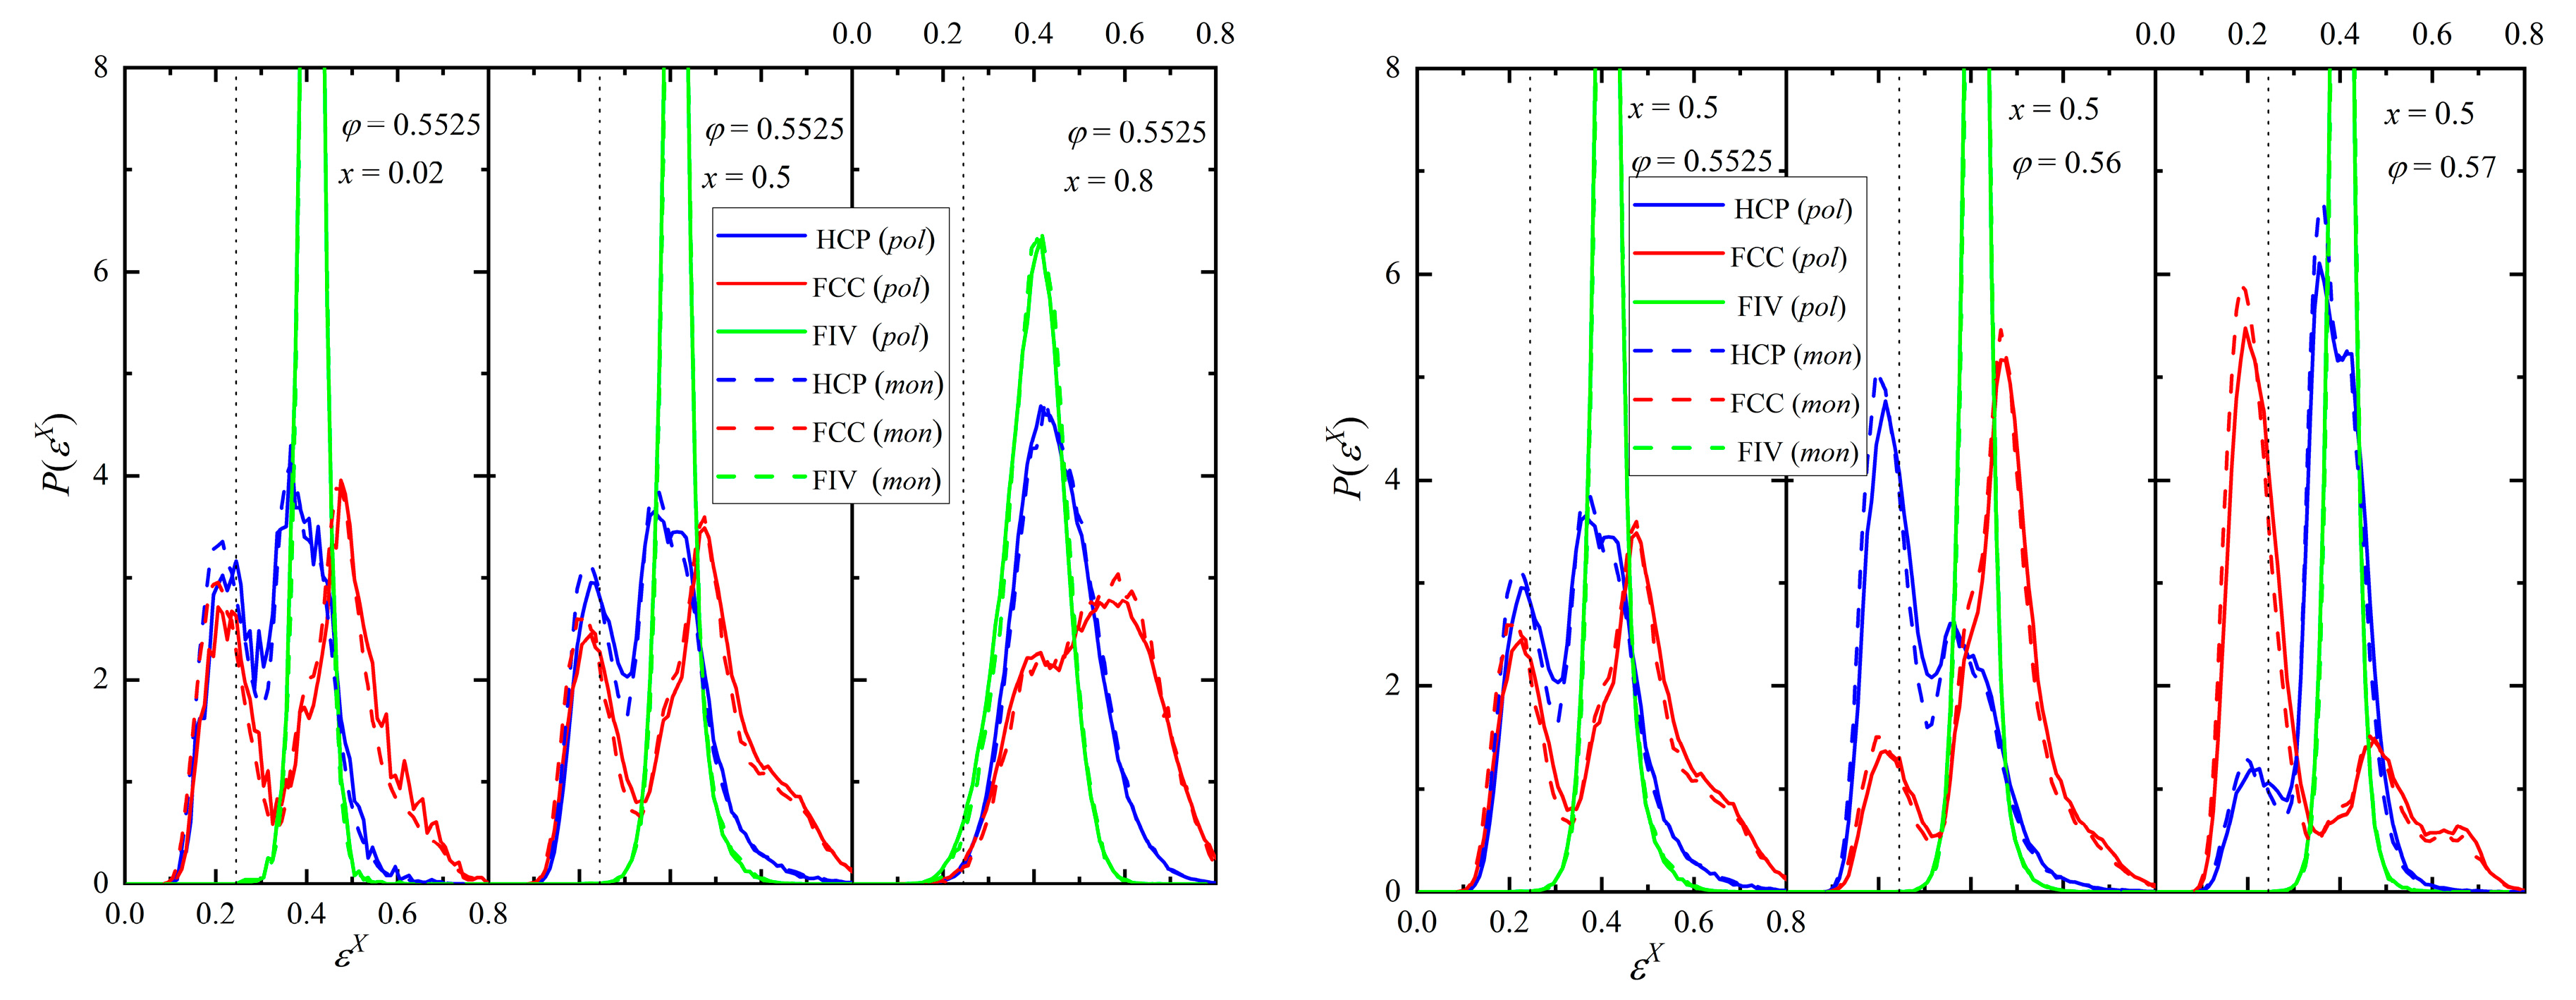
The distribution of the CCE norm with respect to the HCP and FCC crystals and the FIV local symmetry can provide significant information on the local environment at the final stable phase for each simulation trajectory. In the continuation, the following coloring convention is adopted to identify sites in snapshots and curves in figures: HCP (blue), FCC (red), FIV (green), and AMO (yellow). The latter are further represented with reduced dimensions for visual clarity. The left and right panels of Figure 5 show the probability distribution function for the HCP, FCC, and FIV CCE norm for fixed packing density and relative number fraction, respectively. The vertical dotted line identifies the threshold used for the identification of the structural similarity (εthres = 0.245), as explained briefly in the methods section and in more detail in Refs. [64,65]. For a fixed concentration, increasing the polymer fraction shifts the distribution to the right, leading to a lower crystal similarity. In fact, at φ = 0.5525 and x = 0.8 the resulting mixture is predominantly amorphous (disordered) and the fivefold population is higher than the combined ones of close packed crystallites. This is in perfect qualitative agreement with our past findings showcasing the competition between fivefold formation and crystallization for hard-sphere packings [47,48]. For a given polymer content, the higher the density, the larger the population of sites with crystal similarity. The final ordered morphologies of the right panel of Figure 5 are also free of fivefold defects. In parallel, structural competition can be observed between the HCP and FCC crystals, which is not surprising given that they are almost equally stable from the thermodynamic perspective. Accordingly, based on the CCE distribution data we expect the emergence of rHCP structures with varied fractions of HCP and FCC segments, without discarding the possibility of purer but still defect-ridden HCP or FCC morphologies.
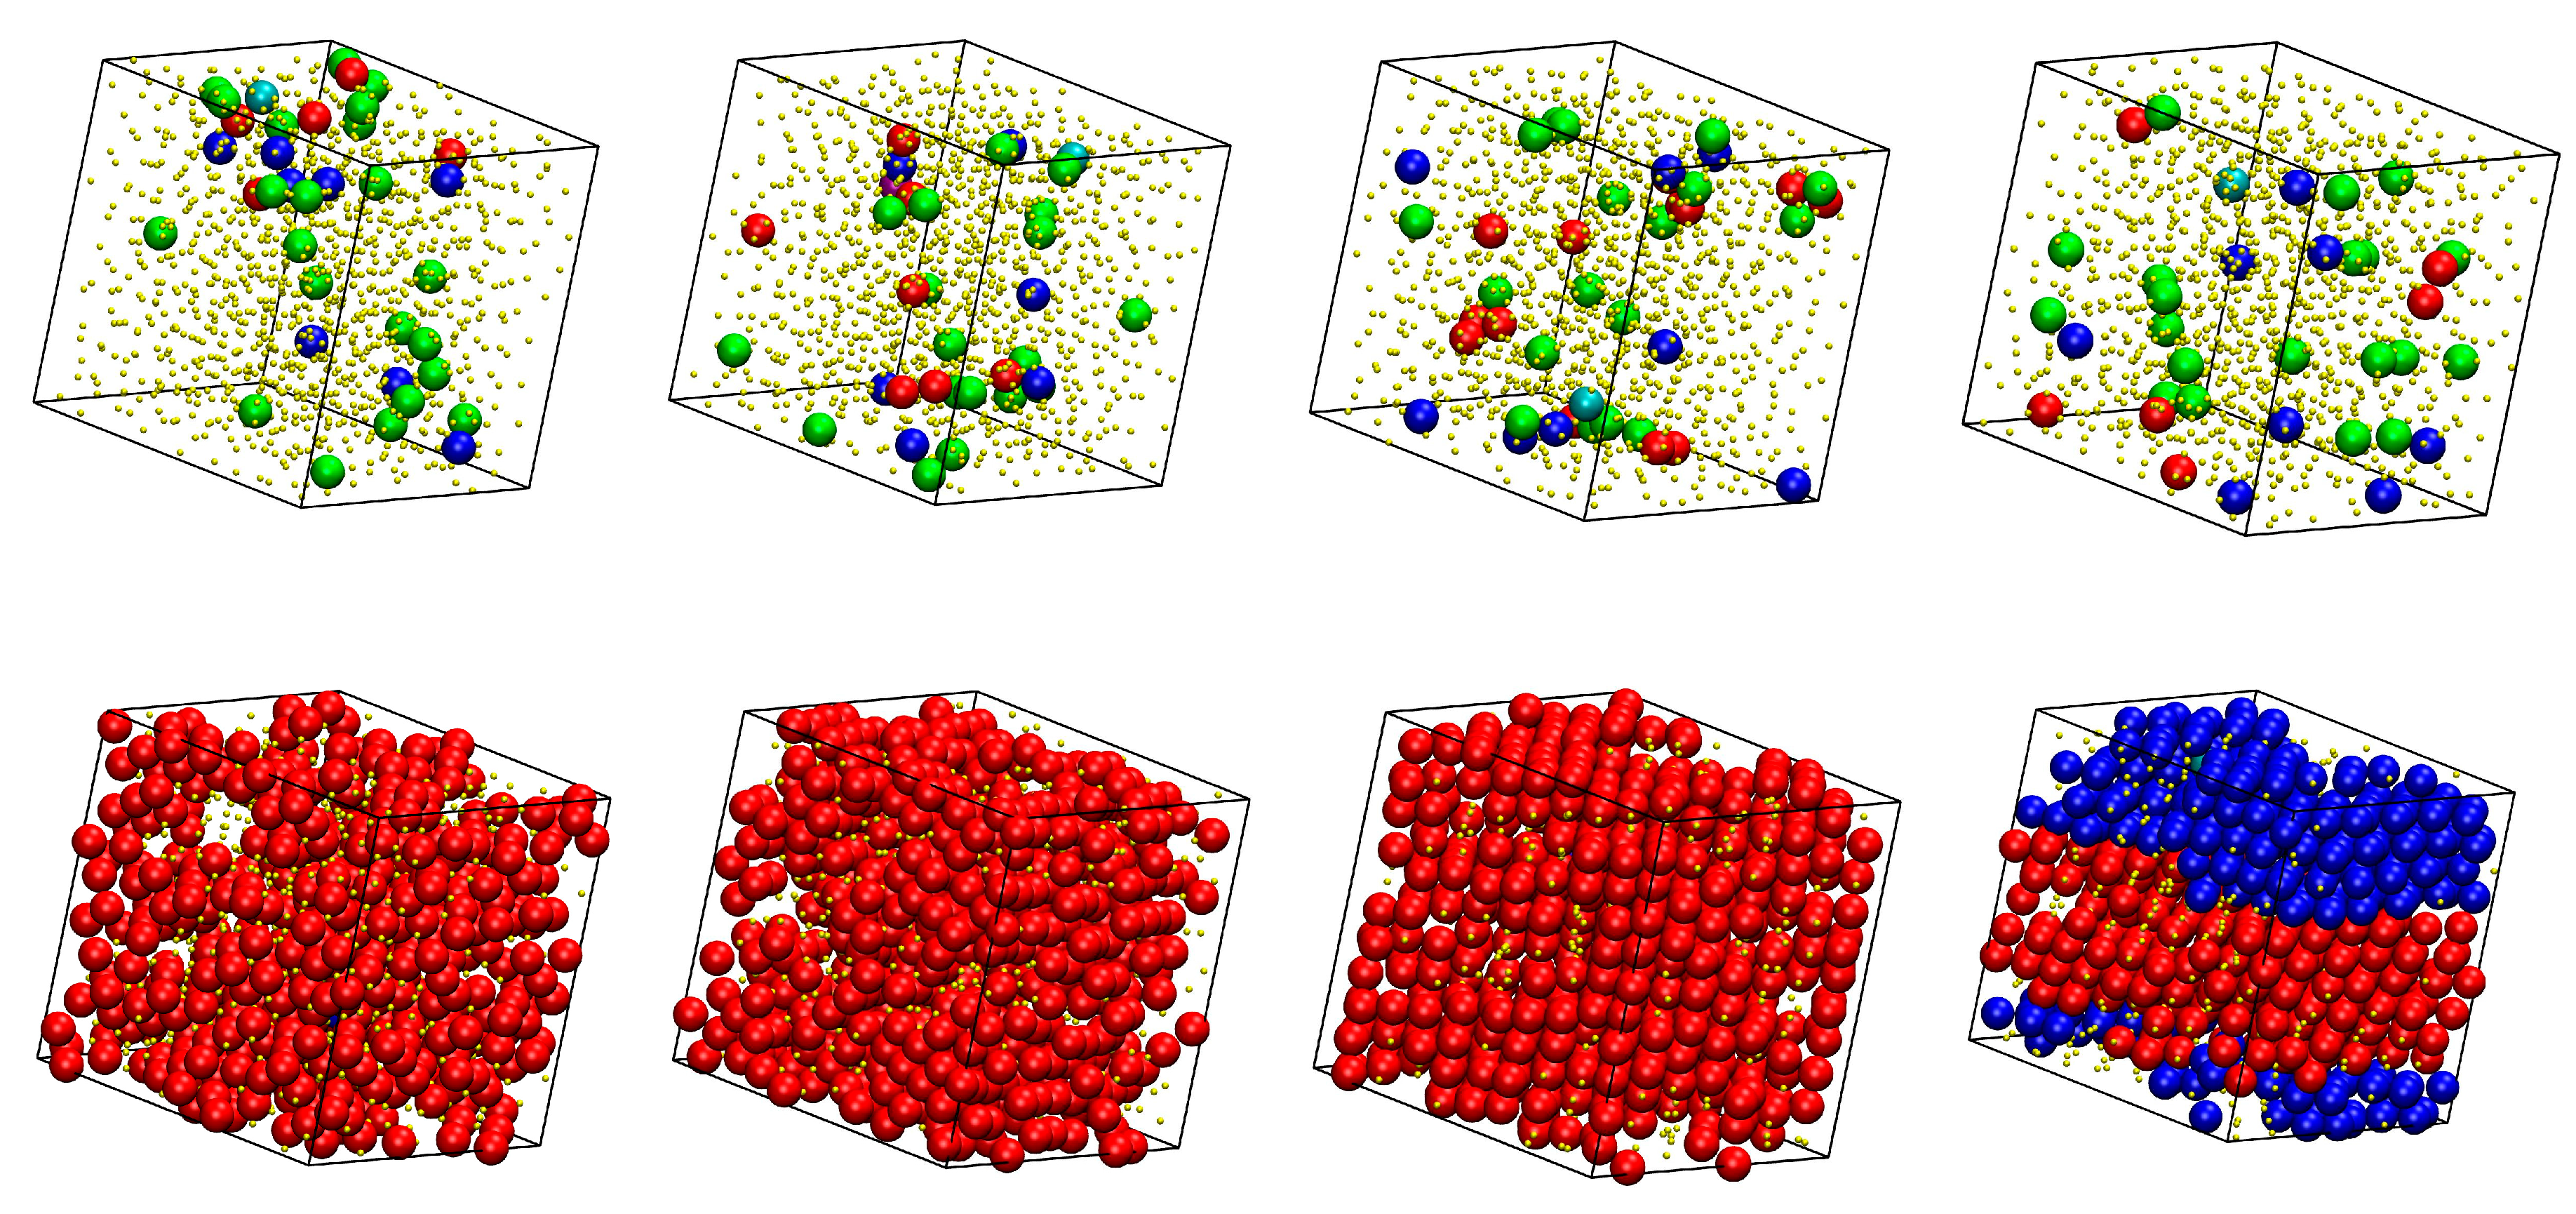
Figure 6 and Figure 7 host snapshots at the end of the MC simulation where sites are colored according to the minimum value of the CCE norm and following the color convention described above. We should note that sites with HEX (purple) or BCC (cyan) similarity are very rarely encountered in the computer-generated configurations and when they appear, they correspond to populations that represent less than 1% of the total. Thus, the discussion below focuses exclusively on the closed packed (HCP and FCC) sites and their antagonist in the form of FIV local symmetry. In Figure 6 packing density is kept constant (φ = 0.5525) and we vary the number fraction (x = 0, 0.2, 0.8, and 1), while in the snapshots hosted in Figure 7 the number density is held constant (x = 0.8) and we explore the composition range.
Depending on the combination of φ and x, a wide spectrum of different final structures is obtained, ranging from predominantly amorphous samples, where the fivefold population exceeds that of the ordered sites, to rHCP morphologies formed by HCP and FCC layers of varied thickness and faultiness to even defect-ridden, single FCC morphologies. In this latter case, as can be seen in the bottom panels of Figure 7, the structural defects correspond to disordered sites which lack any kind of similarity to the reference crystals or the fivefold local symmetry. Another clear trend is that the amount of crystal sites increases with increasing packing density (Figure 7) and decreases with increasing polymer content (Figure 6).
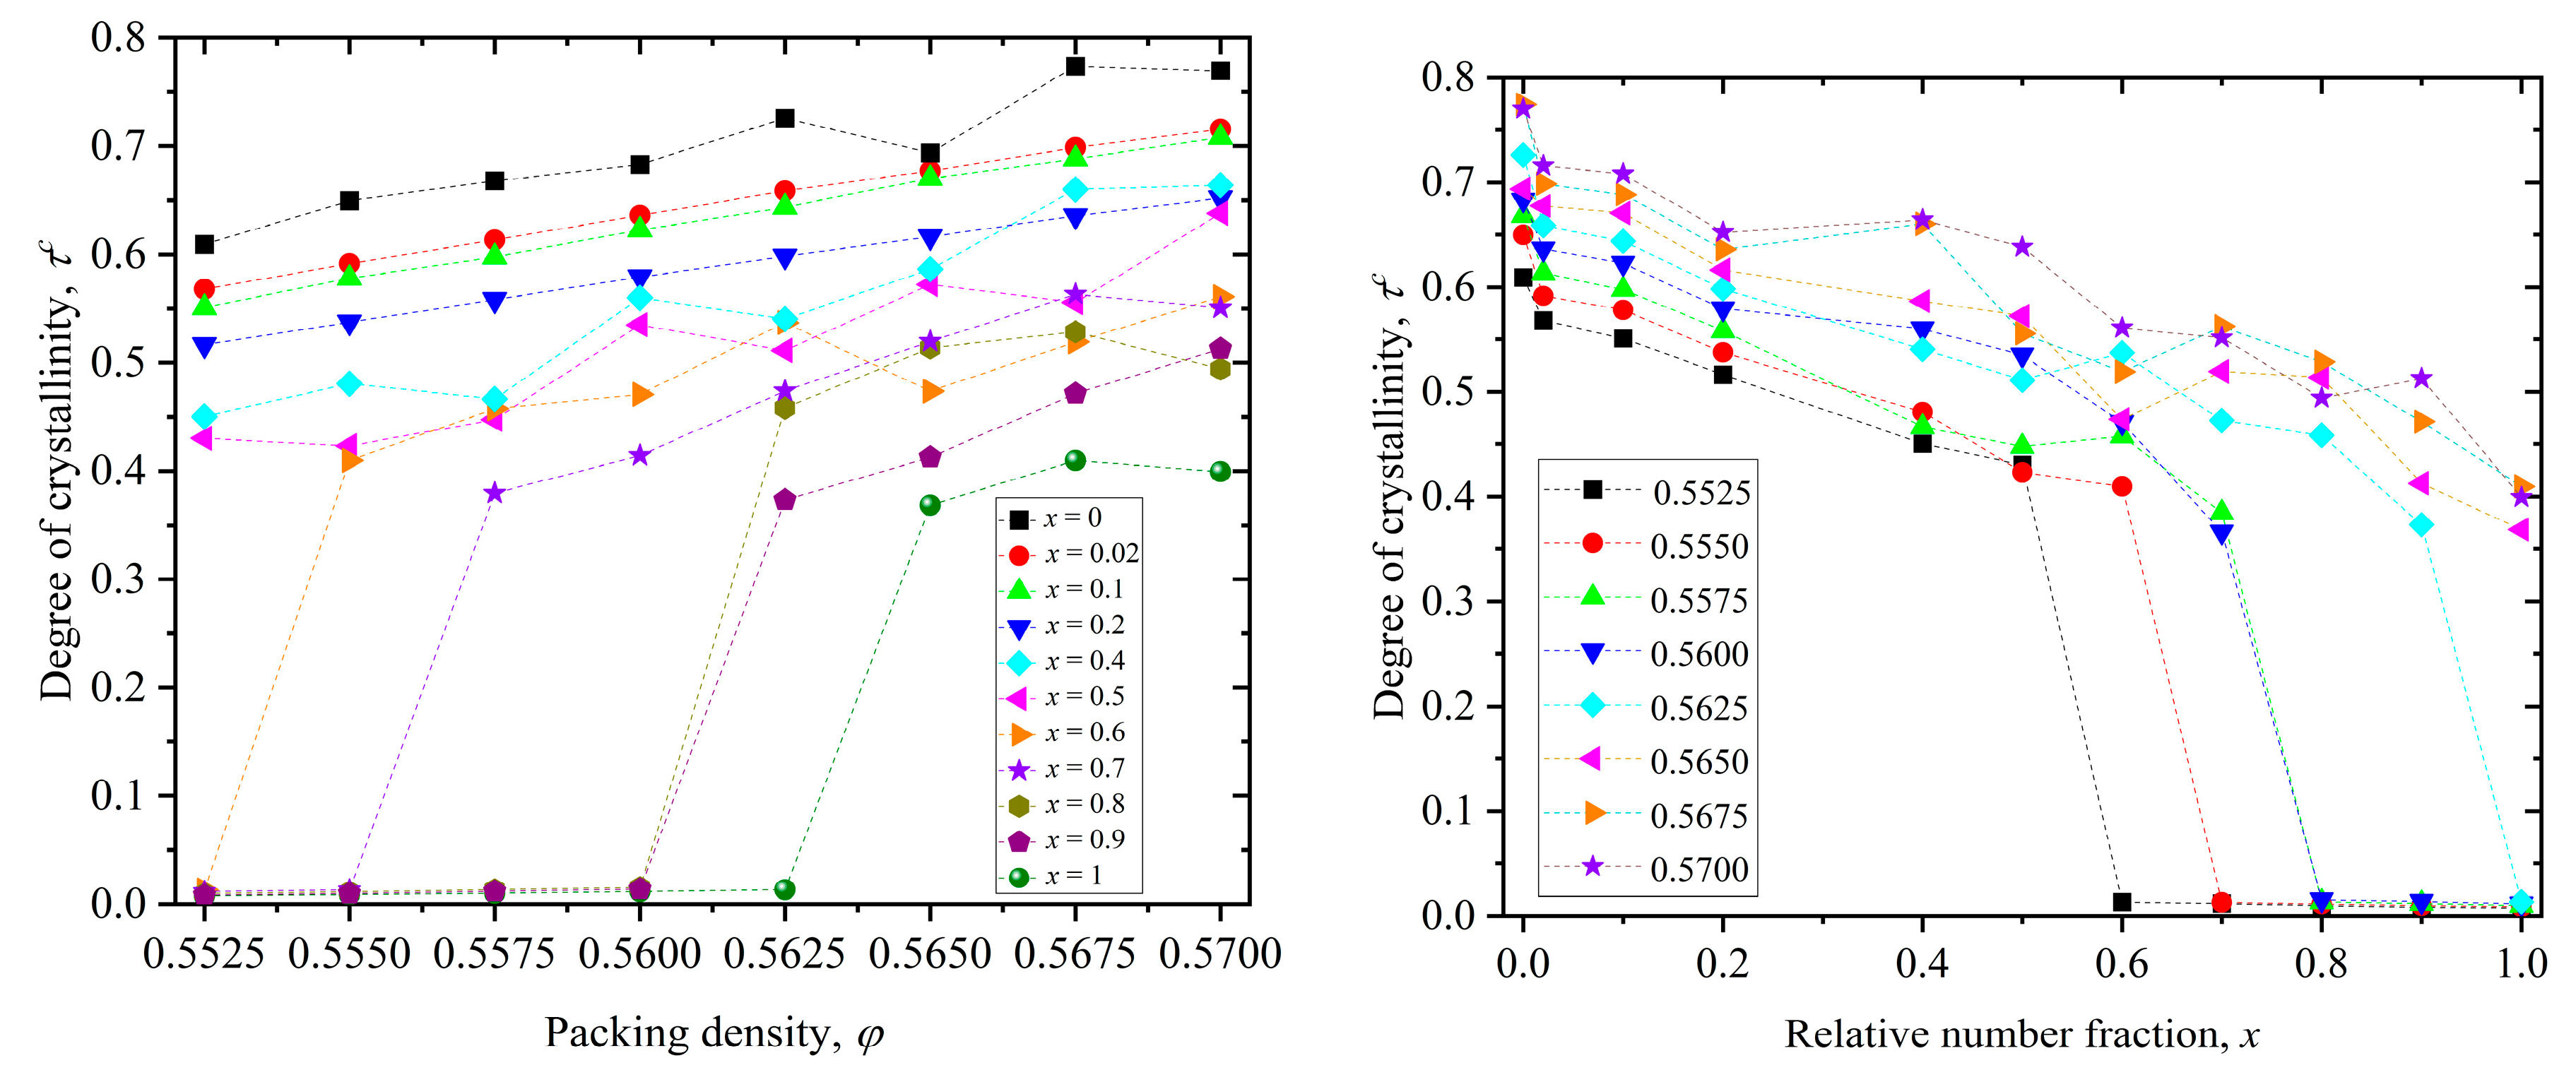
Based on the results presented above over all simulated systems, we can construct a phase diagram where we quantify the dependence of the degree of ordering (crystallinity) first on packing density for different values of relative number fraction (left panel of Figure 8) and then on mixture composition (right panel of Figure 8) for different values of packing density.
We define the melting point as the lowest observed packing density where the system transits from the initial random packing (of minimal order) to an ordered state with at least 30% of the total population of sites possessing a crystal-like local environment. As a first important result of the phase diagram, for the pure polymer system (x = 1) we obtain a more precise estimation of the melting point of linear, freely jointed chains of tangent hard spheres according to which φ p o l M ( 0.5625 ,   0.5650 ] . The second result applies to the two-component athermal mixture (0 < x < 1): the degree of ordering increases, in general, with packing density and decreases with polymer content. More precisely, the pure monomer system (x = 0) systematically shows the highest level of ordering and as polymer content is added the number of sites with crystal character drops. Even a very low relative number fraction of x = 0.02 leads to a significant drop in crystallinity as can be judged by the trends in both panels. Furthermore, it is also clear that increasing polymer content shifts the melting point of the mixture to higher packing densities. For example, adding 10% monomer content to the system (x = 0.9) reduces the melting point from φ p o l M ( 0.5625 ,   0.5650 ] of the pure polymer system (x = 1) to φ x = 0.9 M ( 0.5600 ,   0.5625 ] .

3.2. Polymer Structure

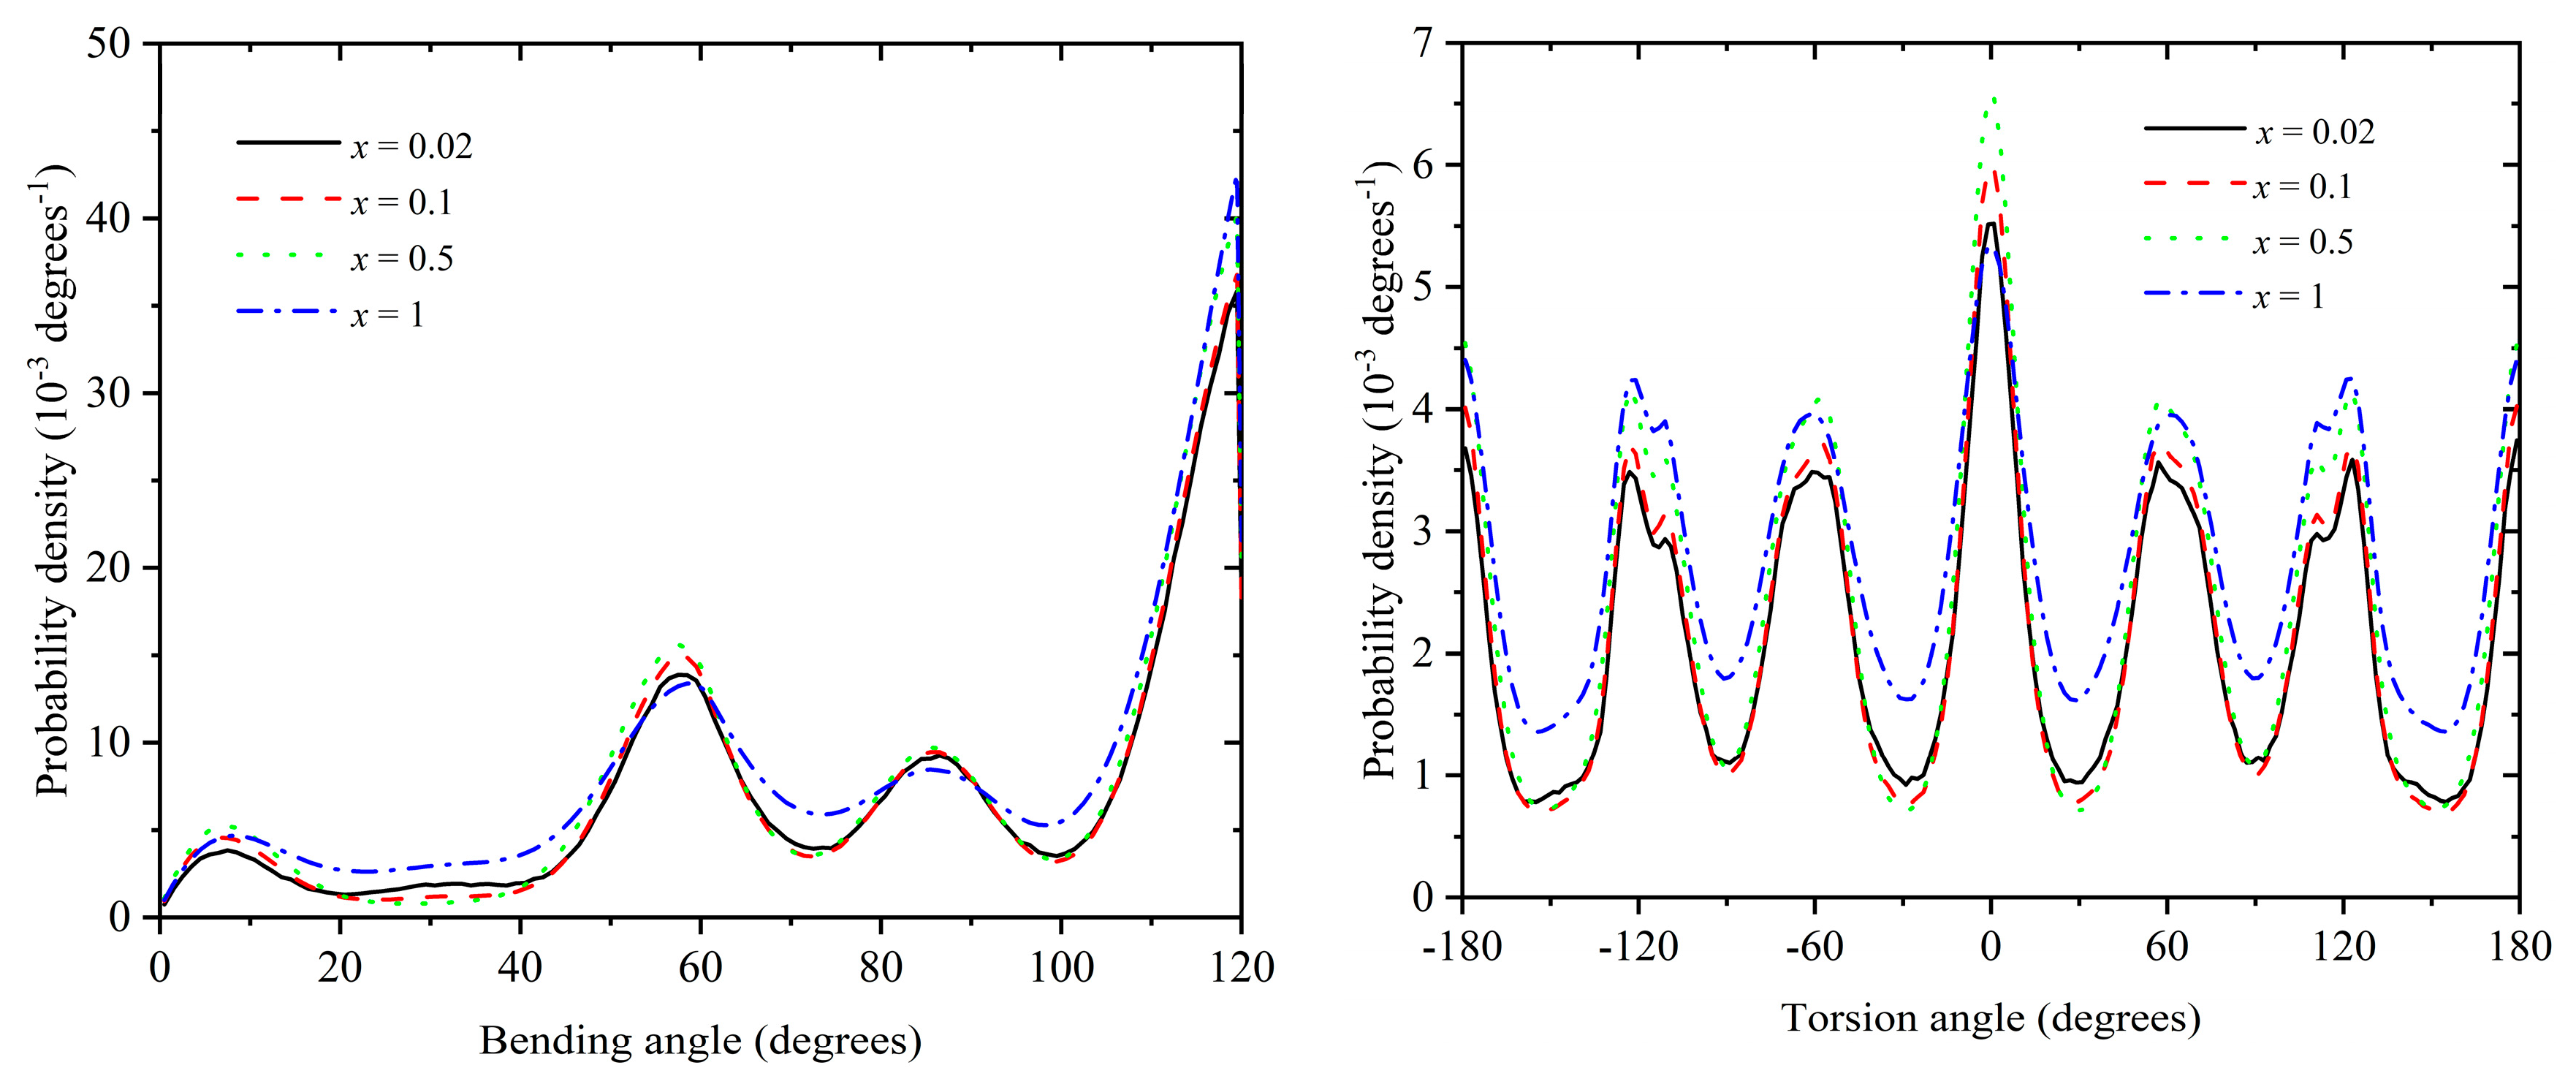
In the present section, we study the local and global structure of polymer chains under various mixture conditions. Figure 9 shows the bending (left panel) and torsion (right panel) distributions for x = 0.02, 0.10, 0.50, and 1 at φ = 0.57. According to the data in Figure 8, all systems crystallize, with the degree of crystallinity being approximately τc ≈ 0.72, 0.71, 0.64, and 0.40 for x = 0.02, 0.10, 0.50, and 1, respectively. Both bending and torsion distributions show characteristic maxima (minima) at the same positions along the angle range, all of them being compatible (incompatible) with specific geometric arrangements of the formed close packed crystals made pure polymeric systems (x = 1) as explained in detail in [49] and [40]. The shape of the distribution is remarkably similar for all systems except for x = 1, where the intensity of the peaks and valleys is reduced. This can be justified by the fact that the degree of crystallization is significantly smaller for the pure polymeric system compared to the other mixtures: approximately 60% of the site population possess a highly disordered local environment for x = 1, while this percentage drops to around 28-29% for the mixture with x = 0.02 and 0.10. One important conclusion that can be drawn here is that the presence of monomers does not directly affect the local polymer structure but rather indirectly by increasing the degree of order and thus forcing more bending and torsion angles to adopt conformations compatible with the established crystal geometry.
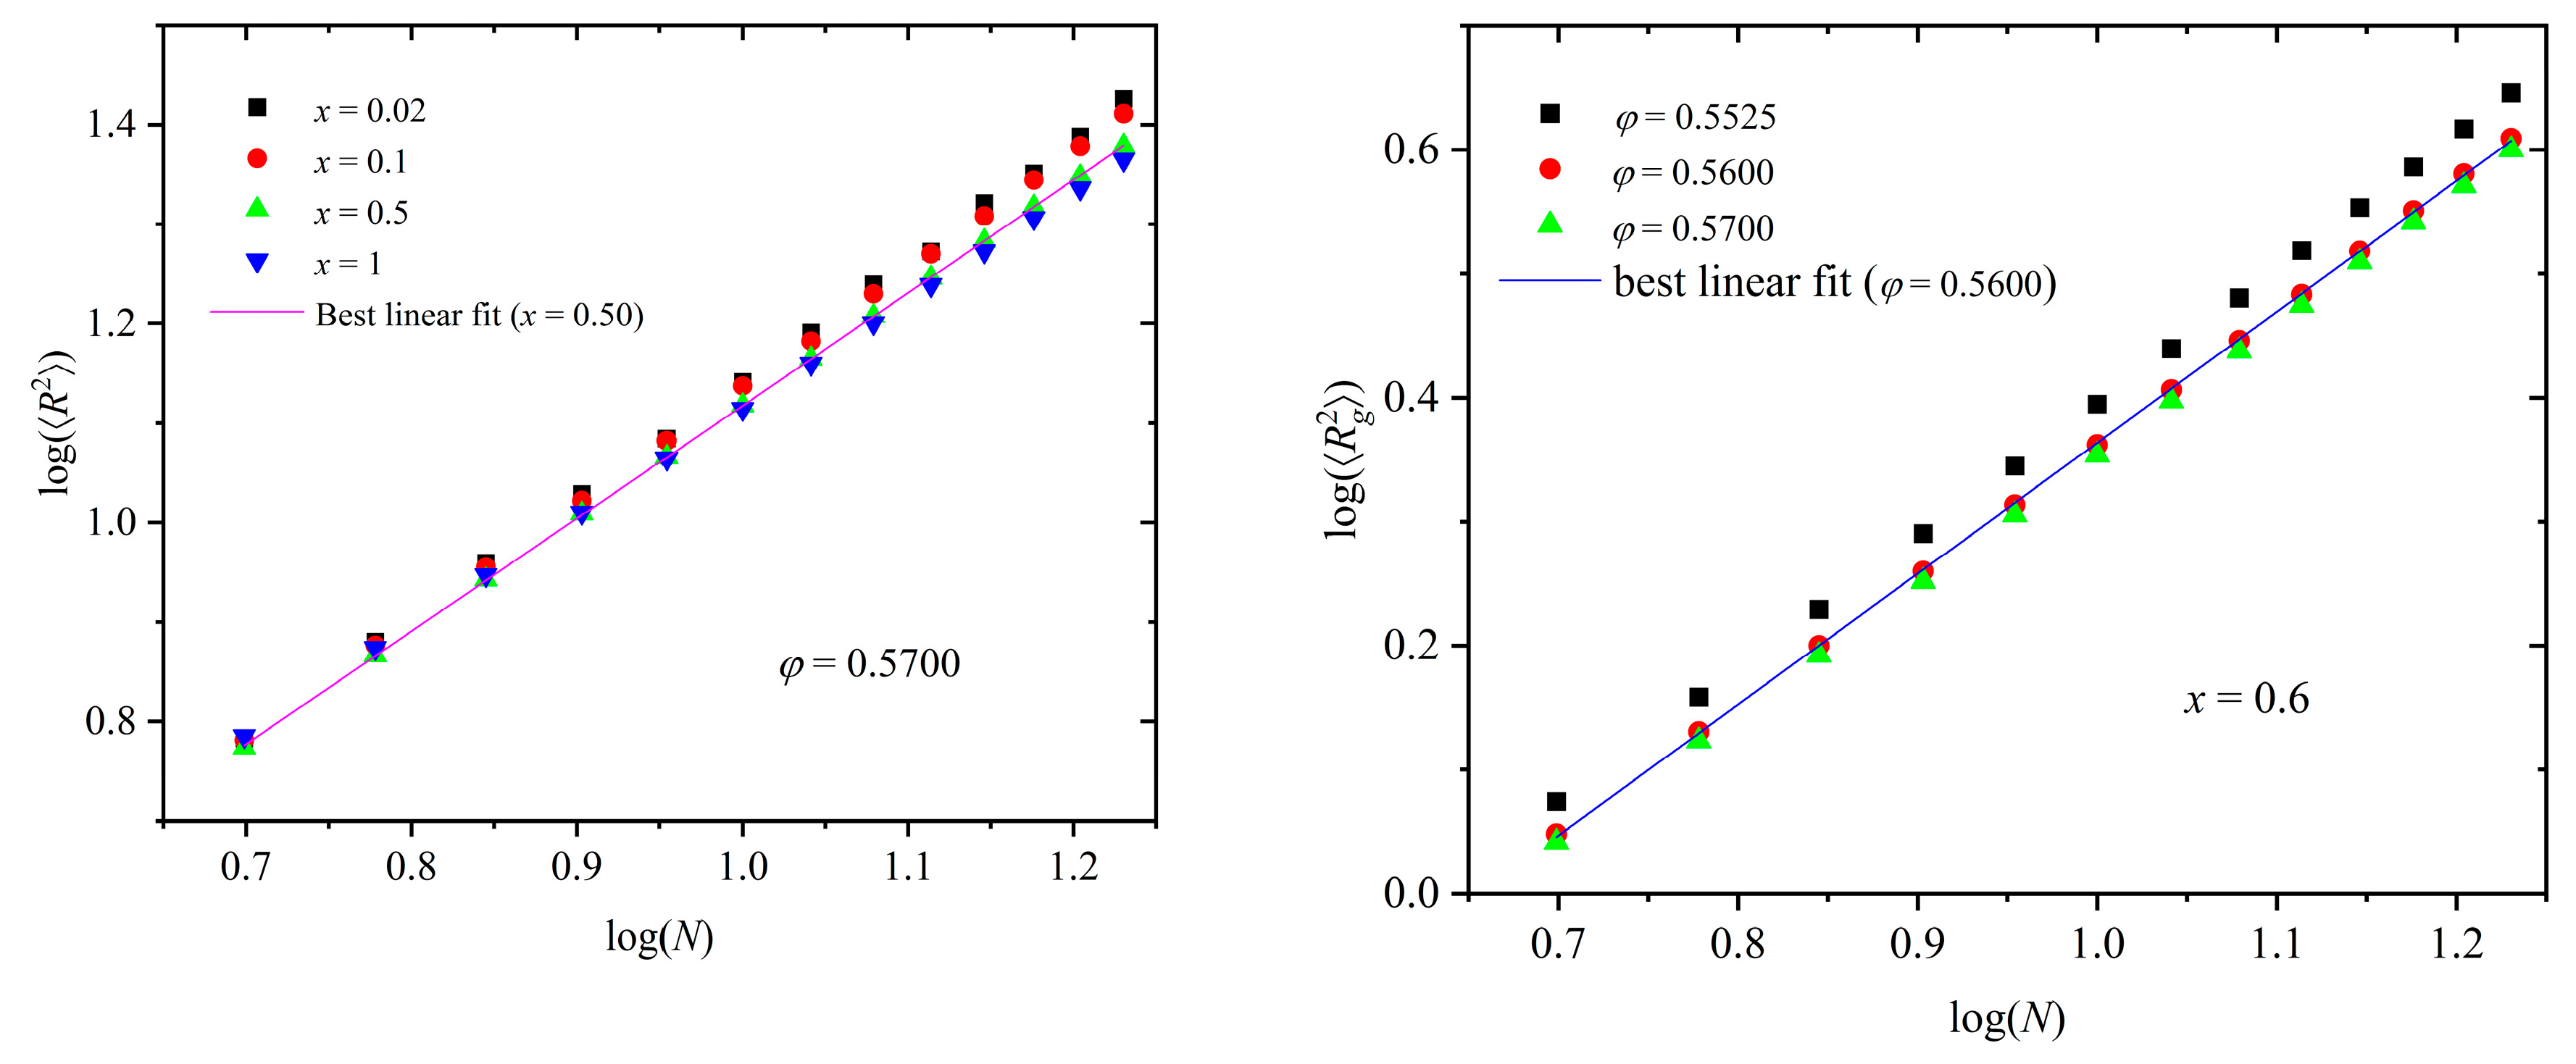
Chain size is typically represented by the mean-square end-to-end distance, R 2 , and the mean-square radius of gyration, R g 2 , where brackets denote average over the number of chains and frames. As in our previous studies [50,57,70], introducing dispersity in chain lengths (here N     6,18 ) allows us to study the dependence of chain size on chain length (in number of monomers) from single simulation trajectories. The left panel of Figure 10 shows log( R 2 ) vs. log(N) for various mixture compositions at a fixed packing density of φ = 0.57. The right panel of Figure 10 hosts the log( R g 2 )-vs.-log(N) curves at various packing densities for fixed x = 0.6. Also shown in both panels are lines corresponding to the best fits on selected simulation data. Through such a fitting we can calculate the characteristic Flory exponent, v [74], which is equal to v = 0.6, 0.59, 0.57, and 0.55 for x = 0.02, 0.10, 0.50, and 1, respectively. The observed differences between the mixtures are exceedingly small in the whole composition range. In general, chain size decreases slightly with the polymer content, a trend which can also be related to the reduction in the degree of ordering. Furthermore, for a fixed relative number fraction, the higher the concentration, the more compact the polymer configurations are, a trend expected as chains tend to coil, while still respecting the geometric constraints of the established crystals, to minimize the local free volume.

3.3. Homogeneity of the Mixture

Essential information about the structure of an atomic or particulate system can be obtained by the pair radial distribution function, g(r), which corresponds to the probability of finding a pair of atoms lying apart at a distance r, compared to the analogous probability for a random distribution at the same density [75,76]. The g(r), here denoted also as gtot(r), is of paramount importance in molecular simulations since it is connected, through a Fourier transform, to the static structure factor, and thus allows for a direct comparison with experiments [63,77,78,79,80]. In parallel, it can be easily calculated from the atomic positions, and it can be used to compute important physical quantities. Compared to an amorphous packing, crystal structure is distinguished in the g(r) through the emergence of sharp maxima (minima), corresponding to specific distances between lattice sites. For molecules, such peaks and valleys are also strongly correlated to the ones appearing in the distributions related to the bond geometry, as for example in Figure 9. For binary mixtures of components a and b, the pair radial distribution function can be calculated for like (aa, bb) and unlike (ab) pair combinations: gaa(r), gbb(r) and gab(r), providing further information on the structural homogeneity or heterogeneity of the system and on the level of mixing. Here, while all sites correspond to the same molecular description, that of hard sphere, we can distinguish between ones belonging to chains (apol) and individual ones (bmon). For monomeric hard spheres, it is now well established that under specific conditions for asymmetric binary mixtures (of small and large sizes or of macromolecules and colloidal particles), a phase separation is possible, as documented in theoretical predictions, computer simulations and experiments [81,82,83,84,85,86,87,88,89,90,91]. Given that polymers and monomers have different melting points, as further demonstrated here through the data in Figure 8, a phase separation should not be excluded, leading eventually to the formation of polymer-rich and monomer-rich regions in the system volume. The homogeneity or heterogeneity of the mixture should thus be reflected in the structural information provided by the g(r) curves [92,93].
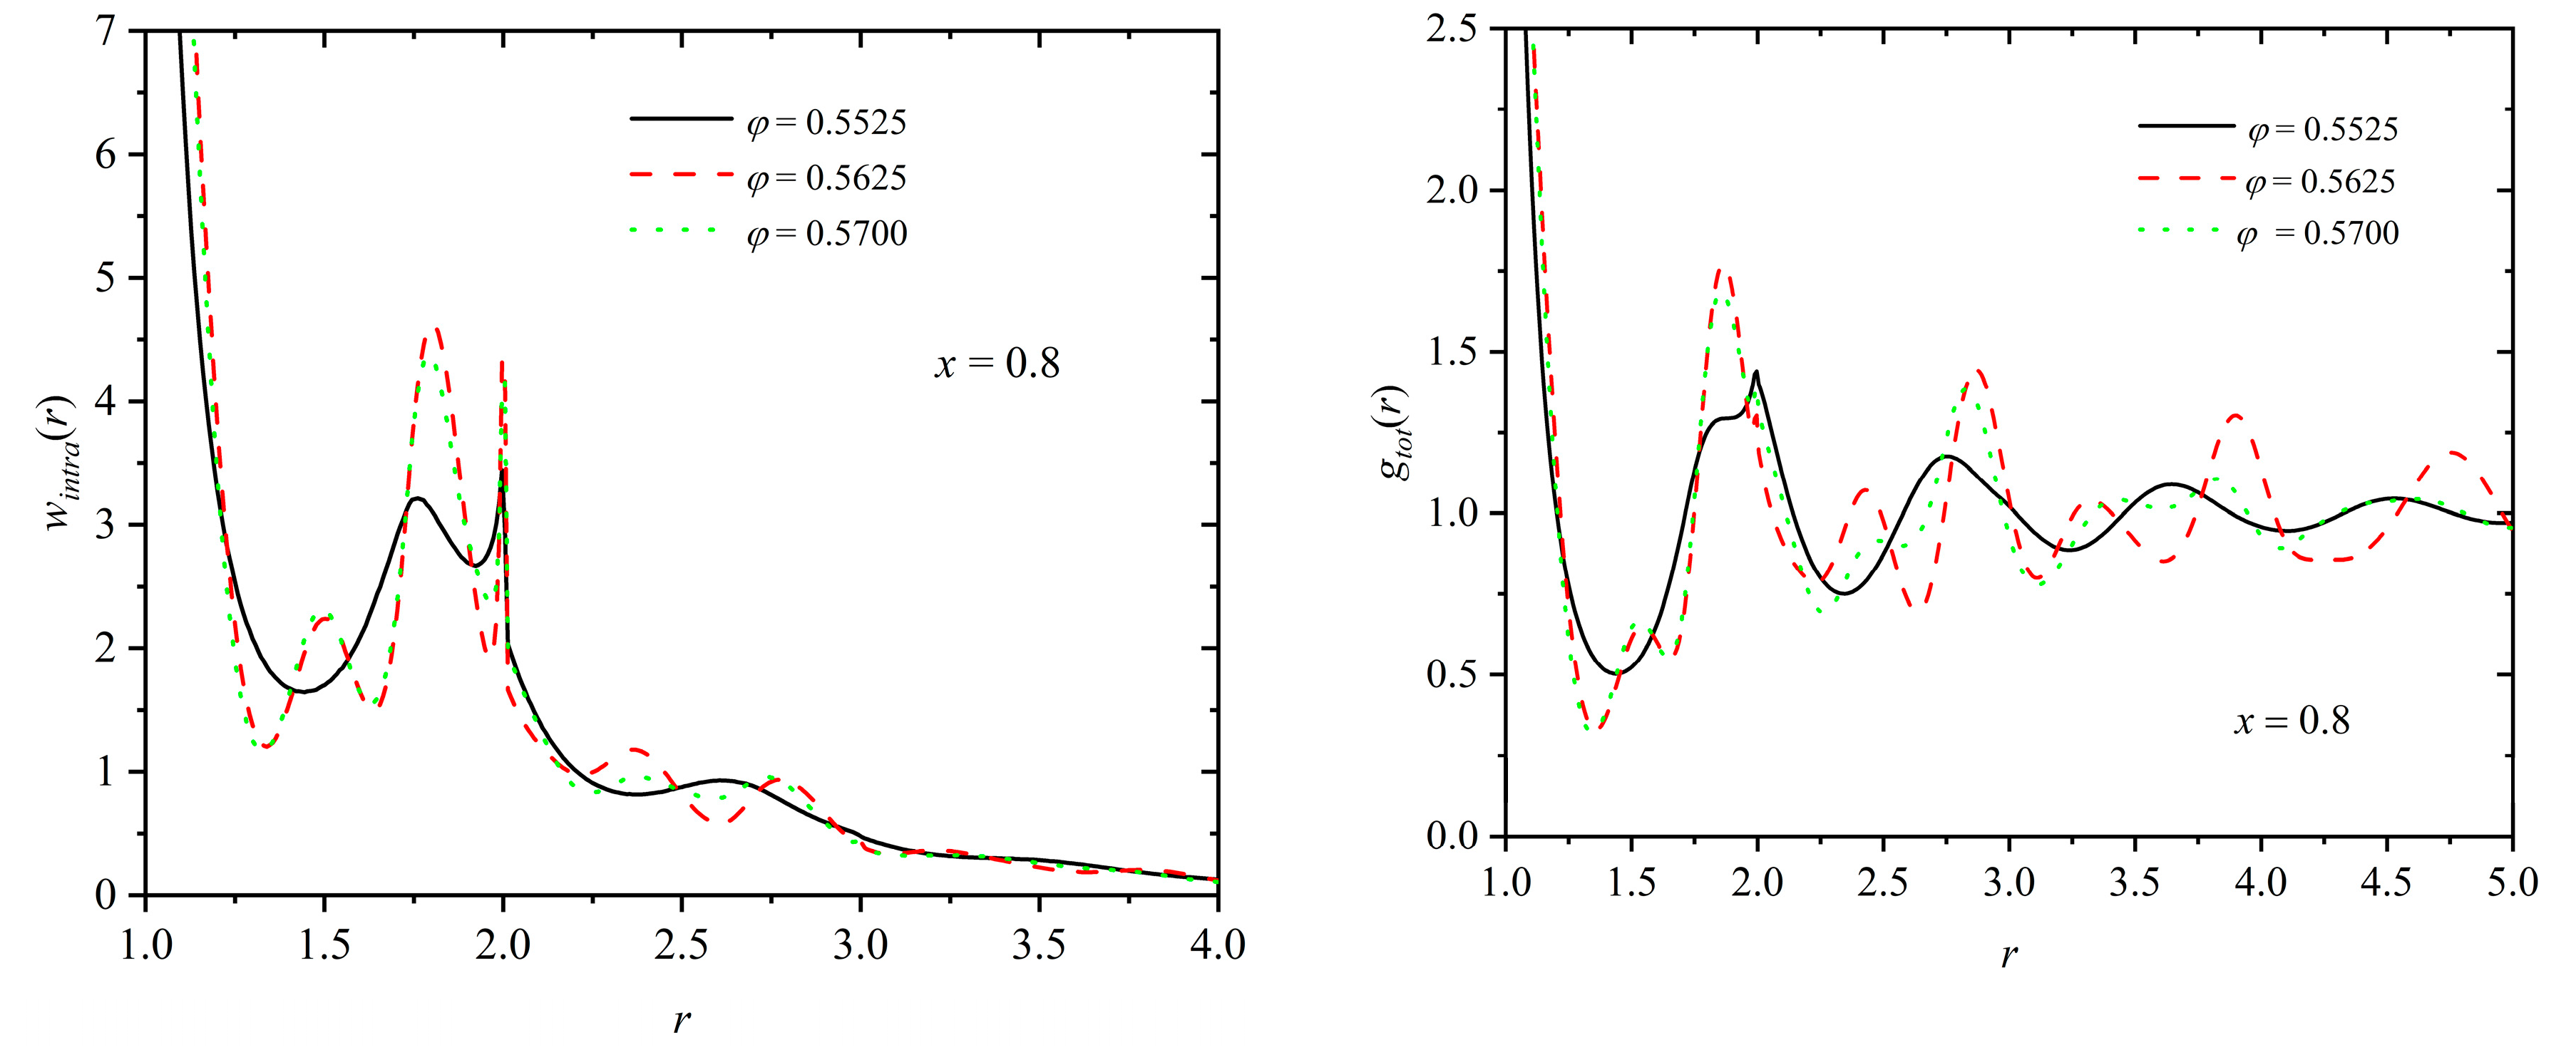
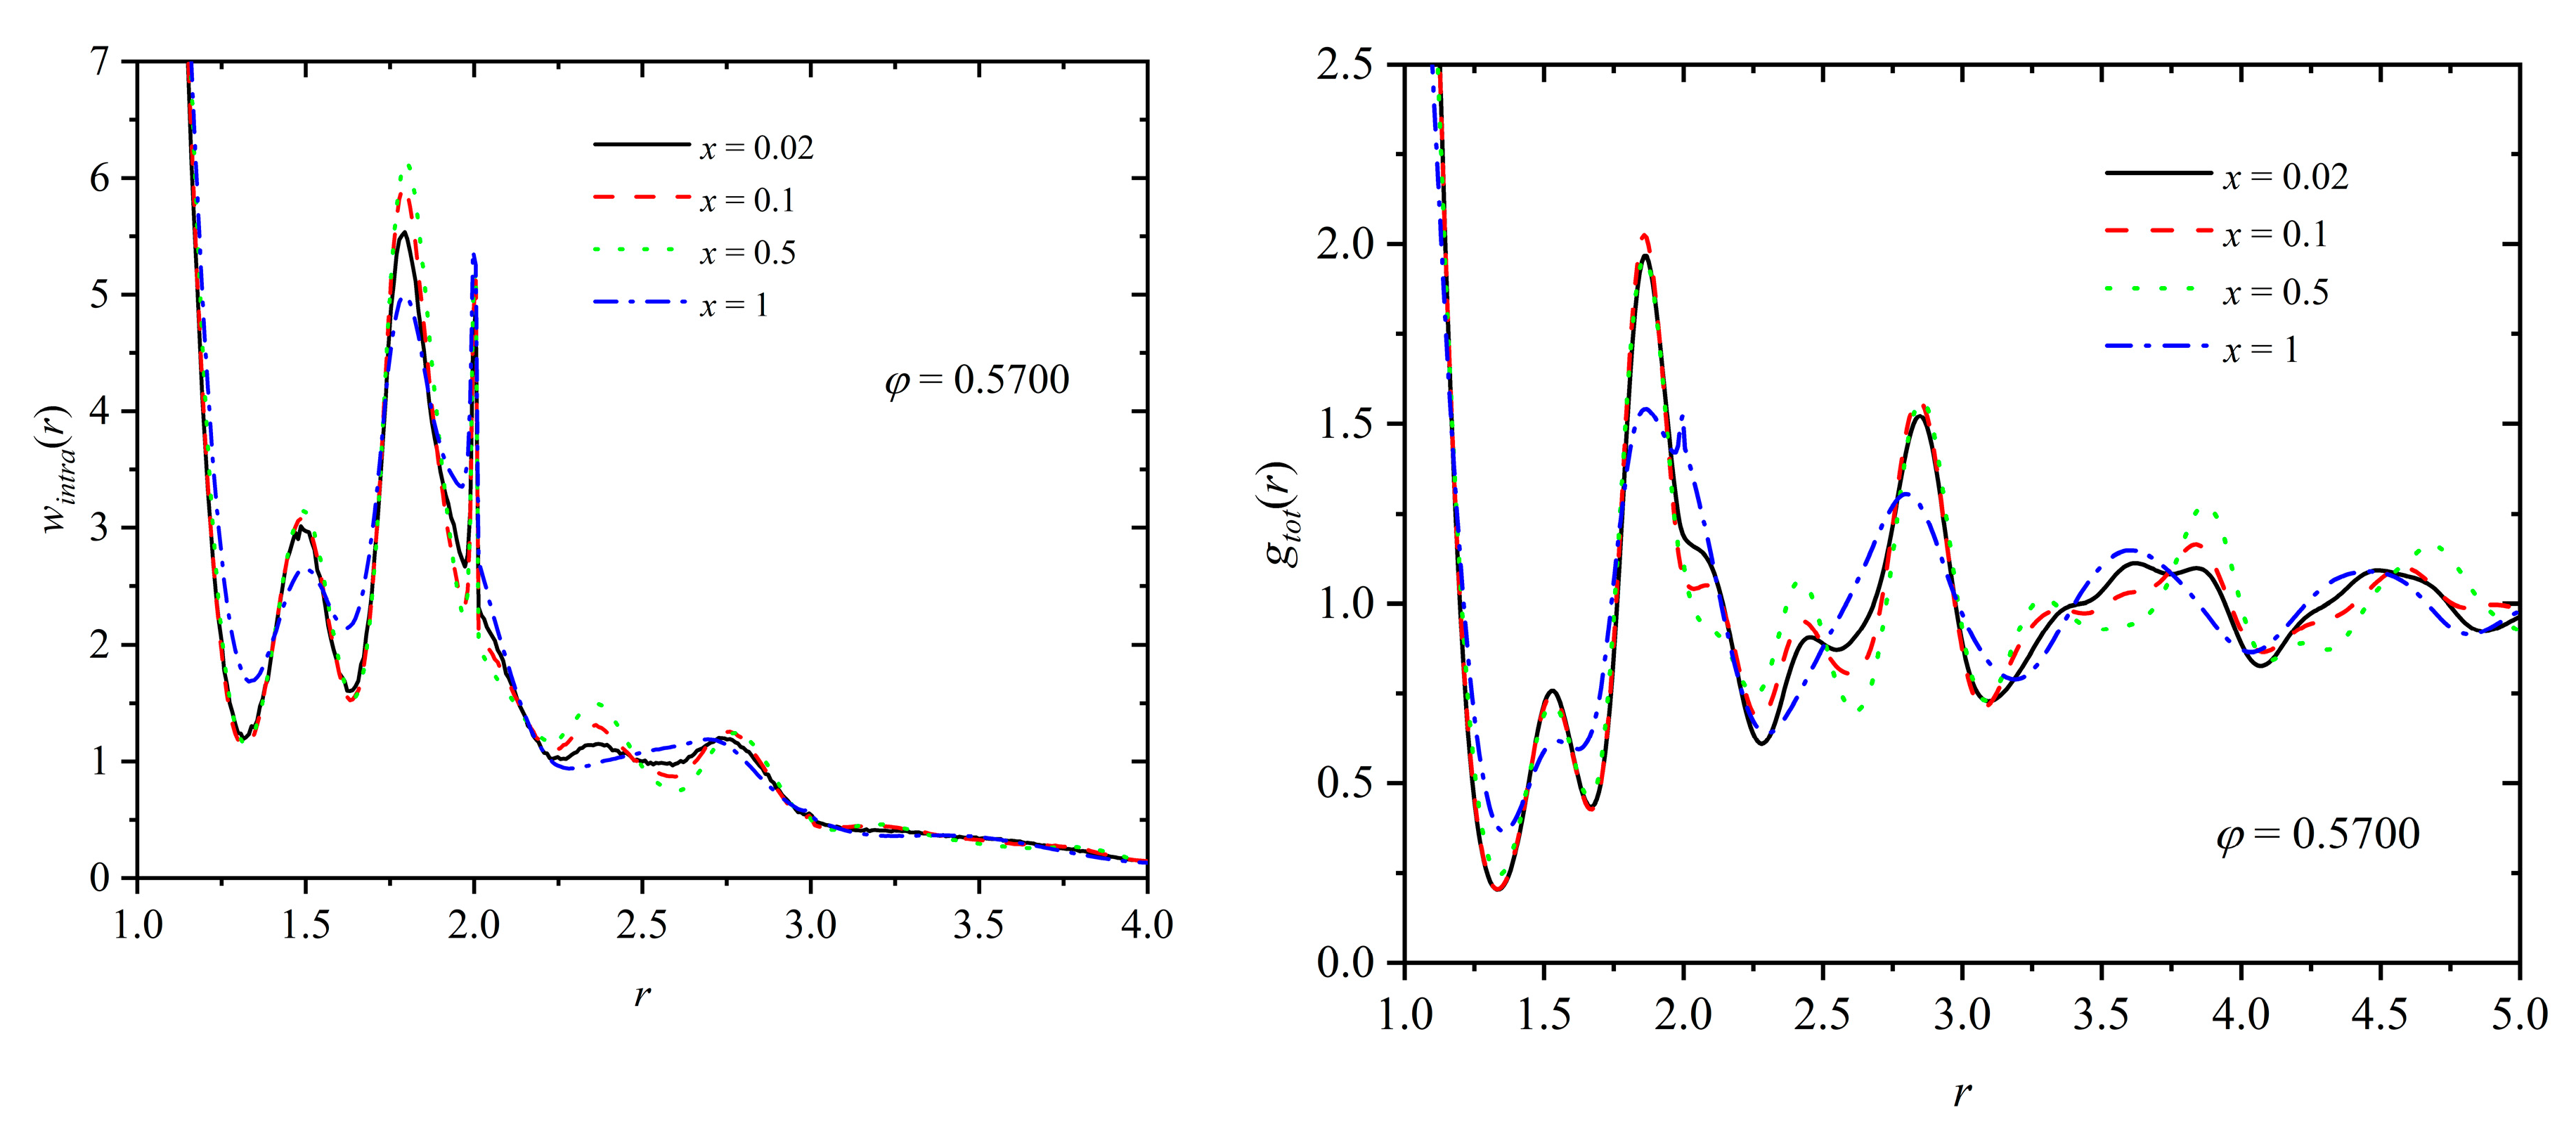
For the polymer component, we can further calculate the intramolecular pair density function, wintra(r), as a structural indicator of the minima and maxima that appear radially along the chain contours. Figure 11 presents the intramolecular density function (left panel) and the total pair distribution function (right) panel for a mixture of fixed composition (x = 0.8) and at various packing densities (φ = 0.5525, 0.5625 and 0.5700). Analogous curves are presented in Figure 12 at fixed packing density (φ = 0.5700) and varied polymer content (x = 0.02, 0.1, 0.5, and 1). First, as expected the intramolecular chain structure is strongly affected by the degree of the established crystallinity, since the formed ordered morphologies force the local bond geometry to adopt specific arrangements, as also confirmed by bending and torsion angle distributions in Figure 9. Accordingly, for x = 0.8 specific peaks appear for the ordered mixtures at φ = 0.5625 and 0.5700, which are inherently absent at the lower density (φ = 0.5525), where the system remains amorphous. Relative number fraction has no appreciable effect on wintra for mixtures of similar degrees of crystallinity, as indicated by the data in the left panel of Figure 12. The deviations observed for the pure-polymer system can be attributed to the significantly lower degree of ordering compared to the other mixtures. For the calculation of the total pair distribution function (right panels in Figure 11 and Figure 12), no distinction is made between spheres belonging to chains and individual ones. For mixtures which reach comparable ordered states, the characteristic minima and maxima observed in the g(r) curves have very similar intensities and occur at remarkably close, if not identical, radial distances. Thus, it can be concluded that mixture composition has no direct effect on the global and intramolecular structure of the systems, as long as the same or similar degree of ordering is reached.
Distinguishing between spheres belonging to chains and individual ones, the radial distribution function for like (pol-pol, mon-mon) and unlike (pol-mon) pairs can be found in Figure 13 for mixtures of composition x = 0.1, 0.5 and 0.9 at φ = 0.57.
Data in all three panels clearly demonstrate that there is homogeneity in the mixing of the spheres, independent of where they belong: no chess-like pattern formation or phase separation are observed, which could lead to the eventual formation of polymer-rich and monomer-rich regions.

3.3. Entropic Origins of Crystallization

Given the athermal nature of the mixture, a potential crystallization should be driven by an increase in the total entropy of the system. The entropic origins of the phase transition for hard bodies have been predicted theoretically [7,11] and confirmed through simulations [5,6,12,13,22,94] and experiments [95,96] under various conditions [32,97,98]. For pure systems of freely jointed chains of hard spheres, constant-volume simulations have demonstrated that the local environment around each site in the crystal phase is more symmetric and more spherical compared to the analogous one in the initial random packing [39,40,43,49,50]. This structural change leads, in turn, to enhanced local mobility of the spheres in the ordered morphology. In MC simulations, this can be quantified by calculating the number of “flippers”, which correspond to chain monomers able to perform local flip moves of small amplitude without causing overlaps with the rest of spheres, which are held fixed in space. It has been documented that the number of flippers increases significantly with crystallization in athermal polymer packings [39,40].
In the present work, we gauge the local environment and compare not only the amorphous and crystal phases but also distinguish between spheres belonging to chains and individual ones. Towards this, we first perform a Voronoi tessellation on the computer-generated configurations through the voro++ software [73]. This allows the identification of the Voronoi polyhedron around each hard sphere. Then, by considering the Voronoi cell as a collection of point masses located at its vertices, we calculate asphericity, b, acylindricity, c, and relative shape anisotropy, k2, through the eigenvalues of the mass moment-of-inertia tensor according to Eq. 6.
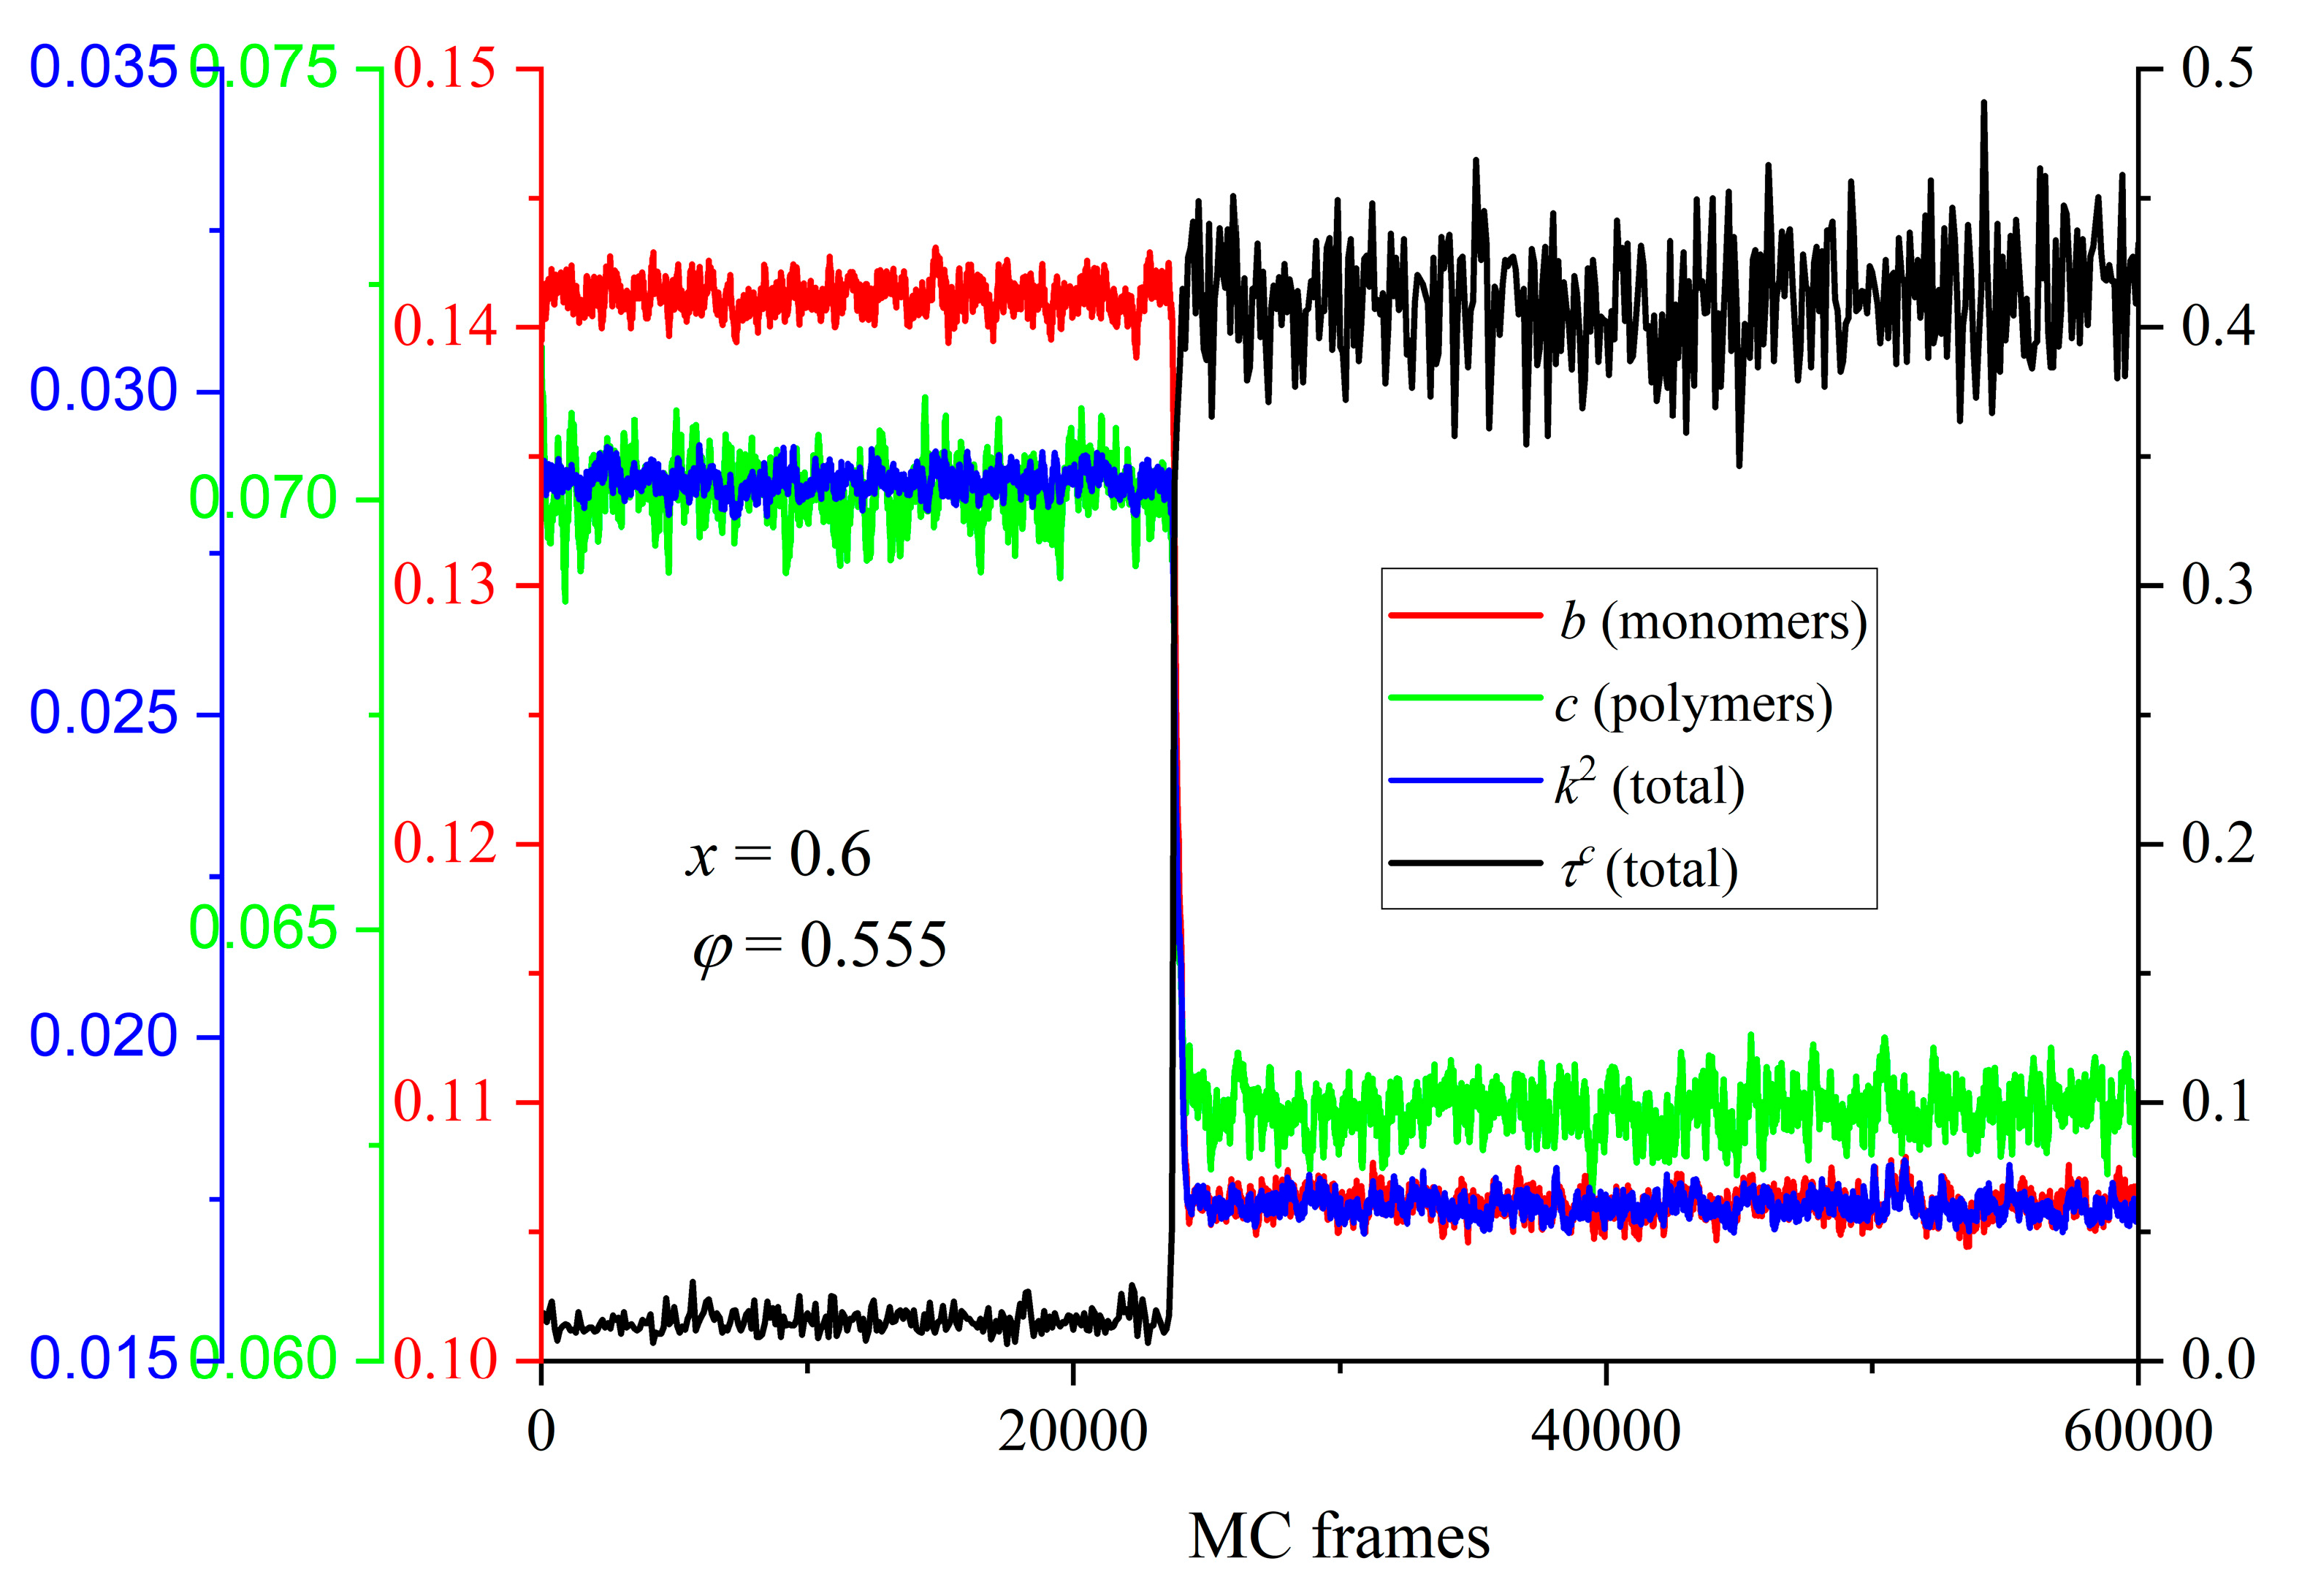
The evolution of the shape measures (b, c and k2) as a function of MC steps is presented in Figure 14 for the mixture of x = 0.6 at φ = 0.555. Also shown for comparison is the corresponding trend of the degree of crystallinity. There is a very strong correlation between the observed phase transition and the change in the average shape of the Voronoi polyhedra: as τc increases very sharply, indicating that the initially amorphous mixture crystallizes, all shape measures adopt instantly significantly lower values. This trend of the shape measures unmistakably implies that the local environment around each site becomes more spherical and more symmetric. Additionally, this shift occurs simultaneously with crystallization and affects the total population, independent of spheres belonging to chains or individual ones. The structural change of the local environment, as reported here, is in perfect agreement with past simulation findings on the pure polymer [39,40] and monomer [47,48] systems. Quantifying the transition of the shape of the Voronoi cells for the specific mixture, b, c and k2 are reduced by 33.1, 13.6% and 66.8% for individual spheres and by 31.7, 11.4 and 63.2% for spheres belonging to chains, respectively. Clearly, among the three measures utilized here, the structural alteration in the average polyhedron, as imposed by crystallization, appears most reflected in the relative shape anisotropy.
Figure 15 presents the probability distribution function of all three shape measures for the Voronoi polyhedra of spheres belonging to chains (solid lines) and of individual ones (dashed lines) for the mixture of x = 0.80 at φ = 0.5525, 0.5625, and 0.5700. The distributions are obtained by considering the final, stable part of the MC trajectory which shows the following degree of crystallinity: τc = 0.01 (φ = 0.5525), 0.46 (φ = 0.5625), and 0.49 (φ = 0.5700). Similarly, Figure S1 (see Supplementary Materials, S.M.) shows the shape measures, this time over all spheres independent of being individual ones or part of chains, at φ = 0.57 for x = 0.02, 0.10, 0.50, and 1. The higher the degree of local order, the higher the symmetry, isotropy, and sphericity of the local environment. Between spheres belonging to chains and individual ones, while the difference is small, the local environment around individual spheres is systematically more spherical and symmetric.
Similar conclusions can be drawn from the data in Figure 16, which correspond to a mixture of composition x = 0.50 at a packing density of φ = 0.5525 with the distributions of the shape measures being calculated in the initial random and the final ordered phases. An essential difference can be observed when we compare the Voronoi cell between the two phases: in the crystal morphologies, the distributions for all three shape measures shift significantly closer to zero and their peaks become sharper. Thus, because of the phase transition (crystallization), the local environment around each site becomes more spherical and symmetric. Between spheres belonging to chains and individual ones, the difference is again small but clearly systematic: the individual spheres have “better” crystal environments than the ones belonging to chains. Thus, individual spheres can explore more efficiently their surroundings.
The less symmetric environment observed for spheres being part of polymers can be attributed to the constraints imposed by chain connectivity: As tangency is enforced between bonded spheres, by construction a sphere belonging to a chain has two (internal spheres) or one (chain end) neighbors that lie in a distance equal to the sphere diameter. For the local environment to be perfectly symmetric in radial terms, this would require the remaining 10 (or 11) neighbors to be also tangent. Practically this would lead to the formation of the most compact crystal (HCP or FCC) with a local density being approximately equal to 0.7404. This should not be possible in constant-volume simulations, like the ones presented here, where packing density is set in the range φ 0.5525 ,   0.5700 , much lower than the maximum one achieved for the HCP and FCC crystals where the 12 closest neighbors are tangent to the reference site. Thus, the bond tangency condition produces a frustration in the formation of the athermal polymer crystal, which is absent in the case of individual monomers. The existence of bond gaps [44] between connected spheres could alleviate such geometric frustration as explained in [43].
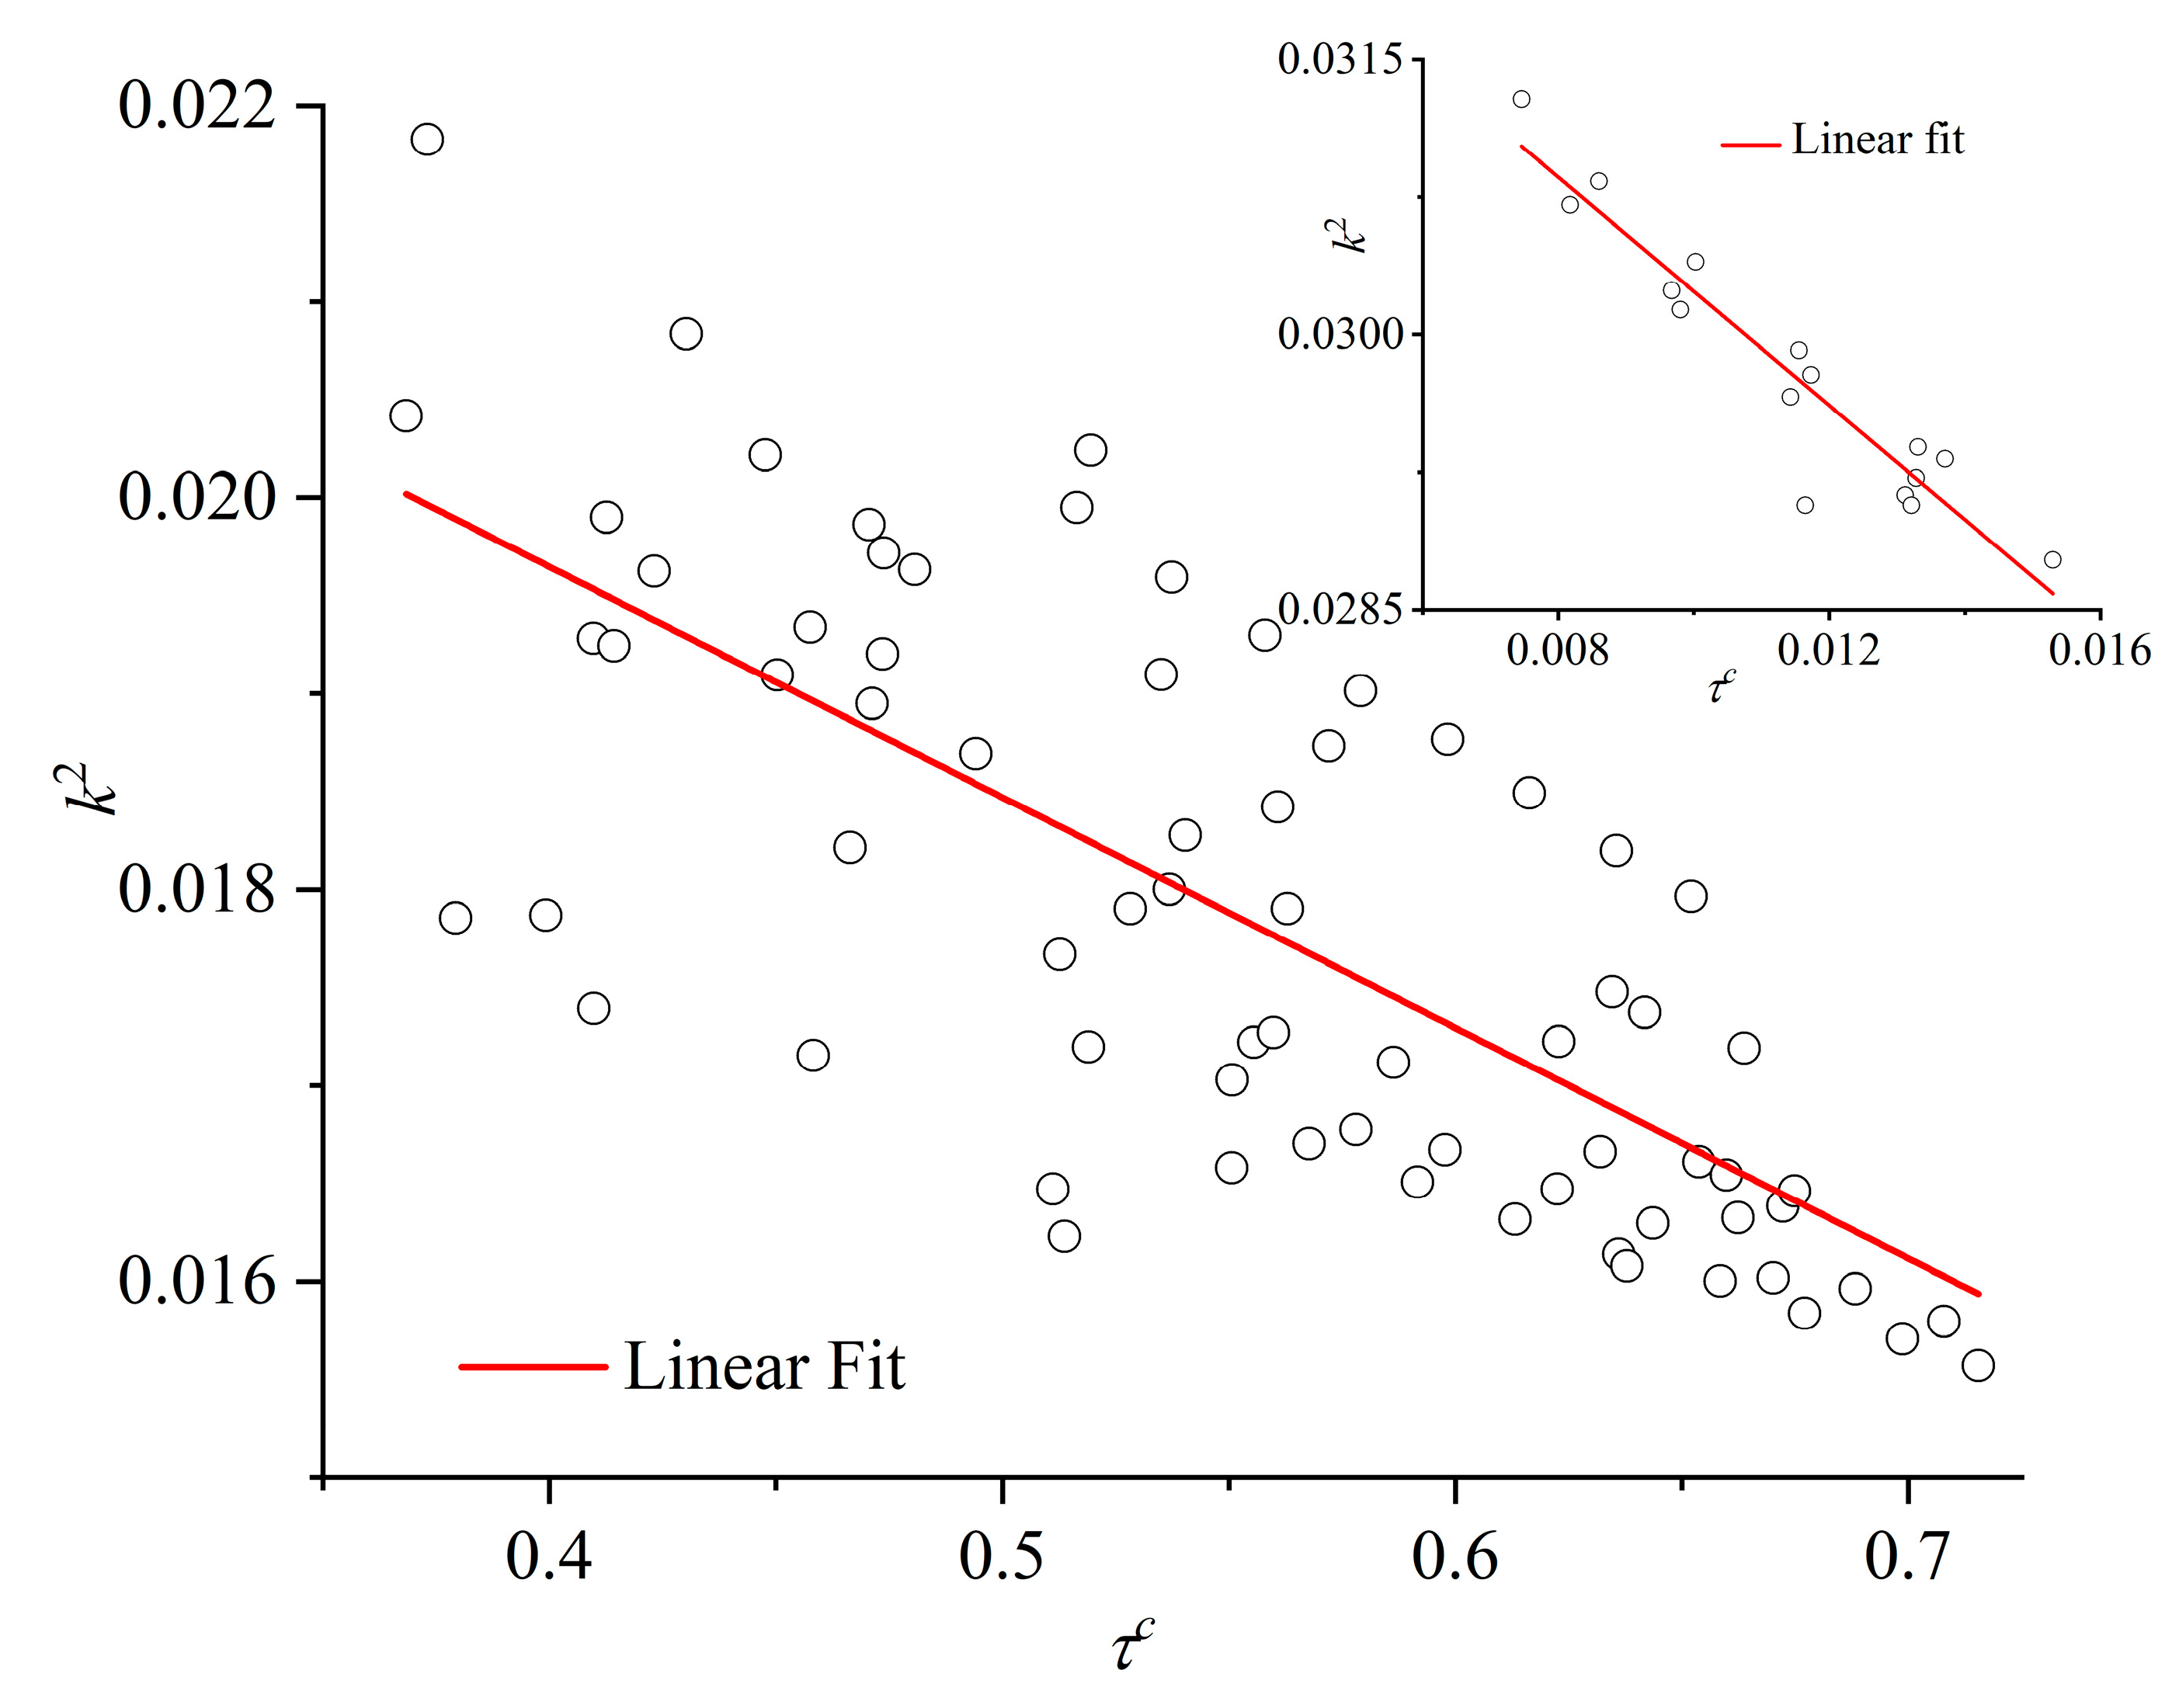
The correlation between the established degree of crystallinity and the relative shape anisotropy of the Voronoi polyhedra is shown in the parity plot of Figure 17. The data correspond to the total population of the mixture and are obtained from the final, stable part of the MC simulation. The main panel shows the data for the high-crystallinity (ordered) systems, while the inset, the low-crystallinity (amorphous) mixtures. Also shown are best linear fits on available simulation data. The parity plot further demonstrates the strong correlation between the established crystallinity and the isotropy of the local environment.

5. Conclusions

We have presented results on the phase behavior of athermal mixtures of hard-sphere polymers and monomers. We systematically study how packing density and the composition of the mixture affect the ability of hard spheres to crystallize. As a first result, through constant-volume MC simulations, we estimate the melting point of pure athermal polymers to be in the interval of φ p o l M ( 0.5625 ,   0.5650 ] , which is a more precise estimate than the previous ones as reported in [42], φ p o l M ( 0.56 ,   0.57 ] , and in [39,40,43], φ p o l M ( 0.56 ,   0.58 ] . As polymer content is added the melting point of the mixture shifts to higher volume fractions. A precise quantification of the effect of composition on the melting point of the mixture can be achieved by accessing packing densities lower than the ones reported here but still higher than the melting point of the pure monomer system.
The phase transition, when available, is synchronous between the two species even at packing densities where pure polymer packings do not crystallize, revealing a synergy in the crystallization. Calculation of the pair radial distribution function and visual inspection of the ordered configurations reveal homogeneity in mixing in the crystal phase. Accordingly, we observe no phase separation which could split the system into polymer-rich and monomer-rich domains. In general, the local environment around the individual spheres is more symmetric and spherical compared to spheres belonging to polymers. This is a direct consequence of the geometric constraints imposed by the chain connectivity and the corresponding tangency condition. The local environment of the mixture in the crystal phase is significantly more symmetric and isotropic compared to the one in the initial random packing, revealing the entropic origins of the phase transition in accordance with past studies on pure athermal polymer packings [39,40,41].
The present modeling study is currently extended to treat athermal mixtures of semi-flexible polymers and monomers and ones of semi-flexible chains of different equilibrium bending angles.

Supplementary Materials

The following supporting information can be downloaded at: www.mdpi.com/xxx/s1, Figure S1: distribution of shape measures for mixtures at φ = 0.57 and for compositions x = 0.02, 0.1, 0.5, and 1; Snapshots of Figures 2, 3, 6, and 7 are also available as standalone, interactive 3-D images (pdf format).

Author Contributions

Conceptualization, N.C.K.; methodology, N.C.K.; software, D.M.F. and M.H.; formal analysis, O.B.; data curation, O.B.; writing—original draft preparation, O.B. and N.C.K.; writing—review and editing, D.M.F. and M.H.; visualization, O.B. and D.M.F.; funding acquisition, N.C.K. All authors have read and agreed to the published version of the manuscript.

Funding

This research was funded by MICINN/FEDER (Ministerio de Ciencia, Innovación y Universidades, Fondo Europeo de Desarrollo Regional), grant number “PID2021-127533NB-I00”, by the scholarship program from the Algerian Ministry of Higher Education and Scientific Research and by UPM and Santander Bank, “Programa Propio UPM Santander”.

Institutional Review Board Statement

Not applicable.

Data Availability Statement

Simulation data are fully available upon reasonable request.

Acknowledgments

Very fruitful discussions with Manuel Laso and Katerina Foteinopoulou are deeply appreciated. The authors acknowledge support through the project “PID2021-127533NB-I00” of MICINN/FEDER (Ministerio de Ciencia e Innovación, Fondo Europeo de Desarrollo Regional). O.B. acknowledges financial support through the scholarship program from the Algerian Ministry of Higher Education and Scientific Research. D.M.F. acknowledges financial support through “Programa Propio UPM Santander” of Universidad Politécnica de Madrid and Santander Bank. The authors gratefully acknowledge the Universidad Politécnica de Madrid for providing computing resources on Magerit Supercomputer through projects “t736”, “r727” and “r531”.

Conflicts of Interest

The authors declare no conflicts of interest. The funders had no role in the design of the study; in the collection, analyses, or interpretation of data; in the writing of the manuscript; or in the decision to publish the results.

References

  1. Nicolis, G.; Prigogine, I. Self-organization in nonequilibrium systems: from dissipative structures to order through fluctuations; Wiley: New York, 1977. [Google Scholar]
  2. Self-Assembly: From Surfactants to Nanoparticles, 1st ed; Nagarajan, R., Ed. John Wiley & Sons: Hoboken, USA, 2018.
  3. Doi, M. Soft Matter Physics Oxford University Press: New York, 2017.
  4. Fultz, B. Phase Transitions in Materials; Cambridge University Press: 2020.
  5. Frenkel, D. Entropy-driven phase transitions. Physica A 1999, 263, 26–38. [Google Scholar] [CrossRef]
  6. Dijkstra, M. ENTROPY-DRIVEN PHASE TRANSITIONS IN COLLOIDS: FROM SPHERES TO ANISOTROPIC PARTICLES. In Advances in Chemical Physics, Vol 156, Rice, S.A., Dinner, A.R., Eds.; Advances in Chemical Physics; 2015; Volume 156, pp. 35-71.
  7. Onsager, L. THE EFFECTS OF SHAPE ON THE INTERACTION OF COLLOIDAL PARTICLES. Annals of the New York Academy of Sciences 1949, 51, 627–659. [Google Scholar] [CrossRef]
  8. Frenkel, D.; Lekkerkerker, H.N.W.; Stroobants, A. THERMODYNAMIC STABILITY OF A SMECTIC PHASE IN A SYSTEM OF HARD-RODS. Nature 1988, 332, 822–823. [Google Scholar] [CrossRef]
  9. Veerman, J.A.C.; Frenkel, D. RELATIVE STABILITY OF COLUMNAR AND CRYSTALLINE PHASES IN A SYSTEM OF PARALLEL HARD SPHEROCYLINDERS. Physical Review A 1991, 43, 4334–4343. [Google Scholar] [CrossRef]
  10. Bolhuis, P.; Frenkel, D. Tracing the phase boundaries of hard spherocylinders. J. Chem. Phys. 1997, 106, 666–687. [Google Scholar] [CrossRef]
  11. Kirkwood, J.G. Crystallization as a Cooperative Phenomenon. In Phase Transformations in Solids, Smoluchowski, R., Mayer, J.E., Weyl, W.A., Eds.; John Wiley & Sons: New York, 1951; pp. 67–76. [Google Scholar]
  12. Alder, B.J.; Wainwright, T.E. Phase Transition For A Hard Sphere System. J. Chem. Phys. 1957, 27, 1208–1209. [Google Scholar] [CrossRef]
  13. Wood, W.W.; Jacobson, J.D. PRELIMINARY RESULTS FROM A RECALCULATION OF THE MONTE CARLO EQUATION OF STATE OF HARD SPHERES. J. Chem. Phys. 1957, 27, 1207–1208. [Google Scholar] [CrossRef]
  14. Hoover, W.G.; Ree, F.H. Melting Transition And Communal Entropy For Hard Spheres. J. Chem. Phys. 1968, 49, 3609. [Google Scholar] [CrossRef]
  15. Vega, C.; Noya, E.G. Revisiting the Frenkel-Ladd method to compute the free energy of solids: The Einstein molecule approach. J. Chem. Phys. 2007, 127. [Google Scholar] [CrossRef]
  16. Bolhuis, P.G.; Frenkel, D.; Mau, S.C.; Huse, D.A. Entropy difference between crystal phases. Nature 1997, 388, 235–236. [Google Scholar] [CrossRef]
  17. Mau, S.C.; Huse, D.A. Stacking entropy of hard-sphere crystals. Phys. Rev. E 1999, 59, 4396–4401. [Google Scholar] [CrossRef]
  18. de Miguel, E.; Marguta, R.G.; del Rio, E.M. System-size dependence of the free energy of crystalline solids. J. Chem. Phys. 2007, 127. [Google Scholar] [CrossRef]
  19. Woodcock, L.V. Entropy difference between the face-centred cubic and hexagonal close-packed crystal structures. Nature 1997, 385, 141–143. [Google Scholar] [CrossRef]
  20. Noya, E.G.; Almarza, N.G. Entropy of hard spheres in the close-packing limit. Mol. Phys. 2015, 113, 1061–1068. [Google Scholar] [CrossRef]
  21. Pronk, S.; Frenkel, D. Can stacking faults in hard-sphere crystals anneal out spontaneously? J. Chem. Phys. 1999, 110, 4589–4592. [Google Scholar] [CrossRef]
  22. O’Malley, B.; Snook, I. Crystal nucleation in the hard sphere system. Phys. Rev. Lett. 2003, 90. [Google Scholar] [CrossRef] [PubMed]
  23. Medvedev, N.N.; Bezrukov, A.; Shtoyan, D. From amorphous solid to defective crystal. A study of structural peculiarities in close packings of hard spheres. J. Struct. Chem. 2004, 45, S23–S30. [Google Scholar] [CrossRef]
  24. Schilling, T.; Schope, H.J.; Oettel, M.; Opletal, G.; Snook, I. Precursor-Mediated Crystallization Process in Suspensions of Hard Spheres. Phys. Rev. Lett. 2010, 105. [Google Scholar] [CrossRef] [PubMed]
  25. O’Malley, B.; Snook, I. Structure of hard-sphere fluid and precursor structures to crystallization. J. Chem. Phys. 2005, 123. [Google Scholar] [CrossRef] [PubMed]
  26. Russo, J.; Tanaka, H. Crystal nucleation as the ordering of multiple order parameters. J. Chem. Phys. 2016, 145. [Google Scholar] [CrossRef] [PubMed]
  27. Shintani, H.; Tanaka, H. Frustration on the way to crystallization in glass. Nat. Phys. 2006, 2, 200–206. [Google Scholar] [CrossRef]
  28. Kawasaki, T.; Tanaka, H. Formation of a crystal nucleus from liquid. Proc. Natl. Acad. Sci. U. S. A. 2010, 107, 14036–14041. [Google Scholar] [CrossRef] [PubMed]
  29. Lam, M.A.; Khusid, B.; Kondic, L.; Meyer, W.V. Role of diffusion in crystallization of hard-sphere colloids. Phys. Rev. E 2021, 104. [Google Scholar] [CrossRef] [PubMed]
  30. Auer, S.; Frenkel, D. Prediction of absolute crystal-nucleation rate in hard-sphere colloids. Nature 2001, 409, 1020–1023. [Google Scholar] [CrossRef]
  31. Sanchez-Burgos, I.; Sanz, E.; Vega, C.; Espinosa, J.R. Fcc vs. hcp competition in colloidal hard-sphere nucleation: on their relative stability, interfacial free energy and nucleation rate. Physical Chemistry Chemical Physics 2021, 23, 19611–19626. [Google Scholar] [CrossRef] [PubMed]
  32. Espinosa, J.R.; Vega, C.; Valeriani, C.; Frenkel, D.; Sanz, E. Heterogeneous versus homogeneous crystal nucleation of hard spheres. Soft Matter 2019, 15, 9625–9631. [Google Scholar] [CrossRef] [PubMed]
  33. Russo, J.; Tanaka, H. The microscopic pathway to crystallization in supercooled liquids. Scientific Reports 2012, 2. [Google Scholar] [CrossRef] [PubMed]
  34. Leoni, F.; Russo, J. Nonclassical Nucleation Pathways in Stacking-Disordered Crystals. Physical Review X 2021, 11. [Google Scholar] [CrossRef]
  35. Gispen, W.; Coli, G.M.; van Damme, R.; Royall, C.P.; Dijkstra, M. Crystal Polymorph Selection Mechanism of Hard Spheres Hidden in the Fluid. ACS Nano 2023, 17, 8807–8814. [Google Scholar] [CrossRef] [PubMed]
  36. Richard, D.; Speck, T. Crystallization of hard spheres revisited. II. Thermodynamic modeling, nucleation work, and the surface of tension. J. Chem. Phys. 2018, 148. [Google Scholar] [CrossRef] [PubMed]
  37. Richard, D.; Speck, T. Crystallization of hard spheres revisited. I. Extracting kinetics and free energy landscape from forward flux sampling. J. Chem. Phys. 2018, 148. [Google Scholar] [CrossRef] [PubMed]
  38. Charbonneau, P.; Gish, C.M.; Hoy, R.S.; Morse, P.K. Thermodynamic stability of hard sphere crystals in dimensions 3 through 10. European Physical Journal E 2021, 44. [Google Scholar] [CrossRef] [PubMed]
  39. Karayiannis, N.C.; Foteinopoulou, K.; Laso, M. Entropy-Driven Crystallization in Dense Systems of Athermal Chain Molecules. Phys. Rev. Lett. 2009, 103. [Google Scholar] [CrossRef] [PubMed]
  40. Karayiannis, N.C.; Foteinopoulou, K.; Abrams, C.F.; Laso, M. Modeling of crystal nucleation and growth in athermal polymers: self-assembly of layered nano-morphologies. Soft Matter 2010, 6, 2160–2173. [Google Scholar] [CrossRef]
  41. Karayiannis, N.C.; Foteinopoulou, K.; Laso, M. Spontaneous Crystallization in Athermal Polymer Packings. Int. J. Mol. Sci. 2013, 14, 332–358. [Google Scholar] [CrossRef] [PubMed]
  42. Martinez-Fernandez, D.; Herranz, M.; Foteinopoulou, K.; Karayiannis, N.C.; Laso, M. Local and Global Order in Dense Packings of Semi-Flexible Polymers of Hard Spheres. Polymers 2023, 15. [Google Scholar] [CrossRef] [PubMed]
  43. Karayiannis, N.C.; Foteinopoulou, K.; Laso, M. The role of bond tangency and bond gap in hard sphere crystallization of chains. Soft Matter 2015, 11, 1688–1700. [Google Scholar] [CrossRef] [PubMed]
  44. Ni, R.; Dijkstra, M. Effect of bond length fluctuations on crystal nucleation of hard bead chains. Soft Matter 2013, 9, 365–369. [Google Scholar] [CrossRef]
  45. Shakirov, T. Crystallisation in Melts of Short, Semi-Flexible Hard-Sphere Polymer Chains: The Role of the Non-Bonded Interaction Range. Entropy 2019, 21. [Google Scholar] [CrossRef]
  46. Shakirov, T.; Paul, W. Crystallization in melts of short, semiflexible hard polymer chains: An interplay of entropies and dimensions. Phys. Rev. E 2018, 97. [Google Scholar] [CrossRef] [PubMed]
  47. Karayiannis, N.C.; Malshe, R.; de Pablo, J.J.; Laso, M. Fivefold symmetry as an inhibitor to hard-sphere crystallization. Phys. Rev. E 2011, 83. [Google Scholar] [CrossRef] [PubMed]
  48. Karayiannis, N.C.; Malshe, R.; Kroger, M.; de Pablo, J.J.; Laso, M. Evolution of fivefold local symmetry during crystal nucleation and growth in dense hard-sphere packings. Soft Matter 2012, 8, 844–858. [Google Scholar] [CrossRef]
  49. Herranz, M.; Foteinopoulou, K.; Karayiannis, N.C.; Laso, M. Polymorphism and Perfection in Crystallization of Hard Sphere Polymers. Polymers 2022, 14. [Google Scholar] [CrossRef] [PubMed]
  50. Herranz, M.; Benito, J.; Foteinopoulou, K.; Karayiannis, N.C.; Laso, M. Polymorph Stability and Free Energy of Crystallization of Freely-Jointed Polymers of Hard Spheres. Polymers 2023, 15. [Google Scholar] [CrossRef] [PubMed]
  51. Herranz, M.; Martínez-Fernández, D.; Ramos, P.M.; Foteinopoulou, K.; Karayiannis, N.C.; Laso, M. Simu-D: A Simulator-Descriptor Suite for Polymer-Based Systems under Extreme Conditions. Int. J. Mol. Sci. 2021, 22, 12464. [Google Scholar] [CrossRef] [PubMed]
  52. Karayiannis, N.C.; Giannousaki, A.E.; Mavrantzas, V.G.; Theodorou, D.N. Atomistic Monte Carlo simulation of strictly monodisperse long polyethylene melts through a generalized chain bridging algorithm. J. Chem. Phys. 2002, 117, 5465–5479. [Google Scholar] [CrossRef]
  53. Karayiannis, N.C.; Mavrantzas, V.G.; Theodorou, D.N. A novel Monte Carlo scheme for the rapid equilibration of atomistic model polymer systems of precisely defined molecular architecture. Phys. Rev. Lett. 2002, 88. [Google Scholar] [CrossRef] [PubMed]
  54. Siepmann, J.I.; Frenkel, D. CONFIGURATIONAL BIAS MONTE-CARLO - A NEW SAMPLING SCHEME FOR FLEXIBLE CHAINS. Mol. Phys. 1992, 75, 59–70. [Google Scholar] [CrossRef]
  55. de Pablo, J.J.; Laso, M.; Suter, U.W. ESTIMATION OF THE CHEMICAL-POTENTIAL OF CHAIN MOLECULES BY SIMULATION. J. Chem. Phys. 1992, 96, 6157–6162. [Google Scholar] [CrossRef]
  56. Laso, M.; de Pablo, J.J.; Suter, U.W. SIMULATION OF PHASE-EQUILIBRIA FOR CHAIN MOLECULES. J. Chem. Phys. 1992, 97, 2817–2819. [Google Scholar] [CrossRef]
  57. Karayiannis, N.C.; Laso, M. Monte Carlo scheme for generation and relaxation of dense and nearly jammed random structures of freely jointed hard-sphere chains. Macromolecules 2008, 41, 1537–1551. [Google Scholar] [CrossRef]
  58. Ramos, P.M.; Karayiannis, N.C.; Laso, M. Off-lattice simulation algorithms for athermal chain molecules under extreme confinement. J. Comput. Phys. 2018, 375, 918–934. [Google Scholar] [CrossRef]
  59. Pant, P.V.K.; Theodorou, D.N. Variable Connectivity Method For The Atomistic Monte-Carlo Simulation Of Polydisperse Polymer Melts. Macromolecules 1995, 28, 7224–7234. [Google Scholar] [CrossRef]
  60. Mavrantzas, V.G.; Boone, T.D.; Zervopoulou, E.; Theodorou, D.N. End-bridging Monte Carlo: A fast algorithm for atomistic simulation of condensed phases of long polymer chains. Macromolecules 1999, 32, 5072–5096. [Google Scholar] [CrossRef]
  61. Humphrey, W.; Dalke, A.; Schulten, K. VMD: Visual molecular dynamics. J. Mol. Graphics Modell. 1996, 14, 33–38. [Google Scholar] [CrossRef] [PubMed]
  62. Karayiannis, N.C.; Foteinopoulou, K.; Laso, M. The structure of random packings of freely jointed chains of tangent hard spheres. J. Chem. Phys. 2009, 130. [Google Scholar] [CrossRef] [PubMed]
  63. Allen, M.P.; Tildesley, D.J. Computer Simulation of Liquids; Oxford University Press: New York, 1987. [Google Scholar]
  64. Karayiannis, N.C.; Foteinopoulou, K.; Laso, M. The characteristic crystallographic element norm: A descriptor of local structure in atomistic and particulate systems. J. Chem. Phys. 2009, 130. [Google Scholar] [CrossRef] [PubMed]
  65. Ramos, P.M.; Herranz, M.; Foteinopoulou, K.; Karayiannis, N.C.; Laso, M. Identification of Local Structure in 2-D and 3-D Atomic Systems through Crystallographic Analysis. Crystals 2020, 10. [Google Scholar] [CrossRef]
  66. Giacovazzo, C.; Monaco, H.L.; Artioli, G.; Viterbo, D.; Ferraris, G.; Gilli, G.; Zanotti, G.; Gatti, M. Fundamentals of Crystallography; Oxford Science: Oxford, 2005. [Google Scholar]
  67. Malgrange, C.; Ricolleau, C.; Schlenker, M. Symmetry and Physical Properties of Crystals; Springer: Dordrecht, 2014. [Google Scholar]
  68. Nye, J.F. Physical Properties of Crystals: Their Representation by Tensors and Matrices; Oxford Science Publications: Oxford 2010.
  69. Herranz, M.; Pedrosa, C.; Martínez-Fernández, D.; Foteinopoulou, K.; Karayiannis, N.C.; Laso, M. Fine-tuning of colloidal polymer crystals by molecular simulation. Phys. Rev. E 2023, 107. [Google Scholar] [CrossRef] [PubMed]
  70. Pedrosa, C.; Martínez-Fernández, D.; Herranz, M.; Foteinopoulou, K.; Karayiannis, N.C.; Laso, M. Densest packing of flexible polymers in 2D films. J. Chem. Phys. 2023, 158. [Google Scholar] [CrossRef] [PubMed]
  71. Ramos, P.M.; Herranz, M.; Foteinopoulou, K.; Karayiannis, N.C.; Laso, M. Entropy-Driven Heterogeneous Crystallization of Hard-Sphere Chains under Unidimensional Confinement. Polymers 2021, 13. [Google Scholar] [CrossRef] [PubMed]
  72. Ramos, P.M.; Herranz, M.; Martinez-Fernandez, D.; Foteinopoulou, K.; Laso, M.; Karayiannis, N.C. Crystallization of Flexible Chains of Tangent Hard Spheres under Full Confinement. J. Phys. Chem. B 2022, 126, 5931–5947. [Google Scholar] [CrossRef] [PubMed]
  73. Rycroft, C.H. VORO++: A three-dimensional Voronoi cell library in C++. Chaos: An Interdisciplinary Journal of Nonlinear Science 2009, 19, 041111. [Google Scholar] [CrossRef] [PubMed]
  74. Flory, P.J. Principles of polymer chemistry; Cornell Univ. Press: Ithaca, 2010. [Google Scholar]
  75. McQuarrie, D.A. Statistical Mechanics; Viva Books: 2011.
  76. Jansen, J.P.; McDonald, I.R. Theory of Simple Liquids, 3rd ed.; Academic Press: 2006.
  77. Terban, M.W.; Billinge, S.J.L. Structural Analysis of Molecular Materials Using the Pair Distribution Function. Chem. Rev. 2022, 122, 1208–1272. [Google Scholar] [CrossRef]
  78. Zhu, H.; Huang, Y.L.; Ren, J.C.; Zhang, B.H.; Ke, Y.B.; Jen, A.K.Y.; Zhang, Q.; Wang, X.L.; Liu, Q. Bridging Structural Inhomogeneity to Functionality: Pair Distribution Function Methods for Functional Materials Development. Advanced Science 2021, 8. [Google Scholar] [CrossRef]
  79. Lábár, J.L.; Hajagos-Nagy, K.; Das, P.P.; Gomez-Perez, A.; Radnóczi, G. Simple ePDF: A Pair Distribution Function Method Based on Electron Diffraction Patterns to Reveal the Local Structure of Amorphous and Nanocrystalline Materials. Nanomaterials 2023, 13. [Google Scholar] [CrossRef] [PubMed]
  80. Tran, D.T.; Svensson, G.; Tai, C.W. <i>SUePDF</i>: a program to obtain quantitative pair distribution functions from electron diffraction data. J. Appl. Crystallogr. 2017, 50, 304–312. [Google Scholar] [CrossRef] [PubMed]
  81. Biben, T.; Hansen, J.P. PHASE-SEPARATION OF ASYMMETRIC BINARY HARD-SPHERE FLUIDS. Phys. Rev. Lett. 1991, 66, 2215–2218. [Google Scholar] [CrossRef] [PubMed]
  82. Lekkerkerker, H.N.W.; Stroobants, A. ON THE SPINODAL INSTABILITY OF HIGHLY ASYMMETRIC HARD-SPHERE SUSPENSIONS. Physica A 1993, 195, 387–397. [Google Scholar] [CrossRef]
  83. Rosenfeld, Y. PHASE-SEPARATION OF ASYMMETRIC BINARY HARD-SPHERE FLUIDS - SELF-CONSISTENT DENSITY-FUNCTIONAL THEORY. Phys. Rev. Lett. 1994, 72, 3831–3834. [Google Scholar] [CrossRef] [PubMed]
  84. Asakura, S.; Oosawa, F. INTERACTION BETWEEN PARTICLES SUSPENDED IN SOLUTIONS OF MACROMOLECULES. Journal of Polymer Science 1958, 33, 183–192. [Google Scholar] [CrossRef]
  85. Kobayashi, H.; Rohrbach, P.B.; Scheichl, R.; Wilding, N.B.; Jack, R.L. Critical point for demixing of binary hard spheres. Phys. Rev. E 2021, 104. [Google Scholar] [CrossRef] [PubMed]
  86. Ayadim, A.; Amokrane, S. Phase transitions in highly asymmetric binary hard-sphere fluids: Fluid-fluid binodal from a two-component mixture theory. Phys. Rev. E 2006, 74. [Google Scholar] [CrossRef] [PubMed]
  87. Vanduijneveldt, J.S.; Heinen, A.W.; Lekkerkerker, H.N.W. PHASE-SEPARATION IN BIMODAL DISPERSIONS OF STERICALLY STABILIZED SILICA PARTICLES. Europhys. Lett. 1993, 21, 369–374. [Google Scholar] [CrossRef]
  88. Miyazaki, K.; Schweizer, K.S.; Thirumalai, D.; Tuinier, R.; Zaccarelli, E. The Asakura-Oosawa theory: Entropic forces in physics, biology, and soft matter. J. Chem. Phys. 2022, 156. [Google Scholar] [CrossRef] [PubMed]
  89. Imhof, A.; Dhont, J.K.G. EXPERIMENTAL PHASE-DIAGRAM OF A BINARY COLLOIDAL HARD-SPHERE MIXTURE WITH A LARGE-SIZE RATIO. Phys. Rev. Lett. 1995, 75, 1662–1665. [Google Scholar] [CrossRef] [PubMed]
  90. Steiner, U.; Meller, A.; Stavans, J. ENTROPY-DRIVEN PHASE-SEPARATION IN BINARY EMULSIONS. Phys. Rev. Lett. 1995, 74, 4750–4753. [Google Scholar] [CrossRef] [PubMed]
  91. Vrij, A. POLYMERS AT INTERFACES AND INTERACTIONS IN COLLOIDAL DISPERSIONS. Pure Appl. Chem. 1976, 48, 471–483. [Google Scholar] [CrossRef]
  92. Lopes, J.N.C. Phase equilibra in binary Lennard-Jones mixtures: phase diagram simulation. Mol. Phys. 1999, 96, 1649–1658. [Google Scholar] [CrossRef]
  93. Thorneywork, A.L.; Roth, R.; Aarts, D.; Dullens, R.P.A. Communication: Radial distribution functions in a two-dimensional binary colloidal hard sphere system. J. Chem. Phys. 2014, 140. [Google Scholar] [CrossRef] [PubMed]
  94. Rintoul, M.D.; Torquato, S. Metastability and crystallization in hard-sphere systems. Phys. Rev. Lett. 1996, 77, 4198–4201. [Google Scholar] [CrossRef] [PubMed]
  95. Lin, K.H.; Crocker, J.C.; Prasad, V.; Schofield, A.; Weitz, D.A.; Lubensky, T.C.; Yodh, A.G. Entropically driven colloidal crystallization on patterned surfaces. Phys. Rev. Lett. 2000, 85, 1770–1773. [Google Scholar] [CrossRef] [PubMed]
  96. Pusey, P.N.; Vanmegen, W. PHASE-BEHAVIOR OF CONCENTRATED SUSPENSIONS OF NEARLY HARD COLLOIDAL SPHERES. Nature 1986, 320, 340–342. [Google Scholar] [CrossRef]
  97. Manoharan, V.N. Colloidal matter: Packing, geometry, and entropy. Science 2015, 349. [Google Scholar] [CrossRef] [PubMed]
  98. Geng, Y.N.; van Anders, G.; Dodd, P.M.; Dshemuchadse, J.; Glotzer, S.C. Engineering entropy for the inverse design of colloidal crystals from hard shapes. Science Advances 2019, 5. [Google Scholar] [CrossRef] [PubMed]
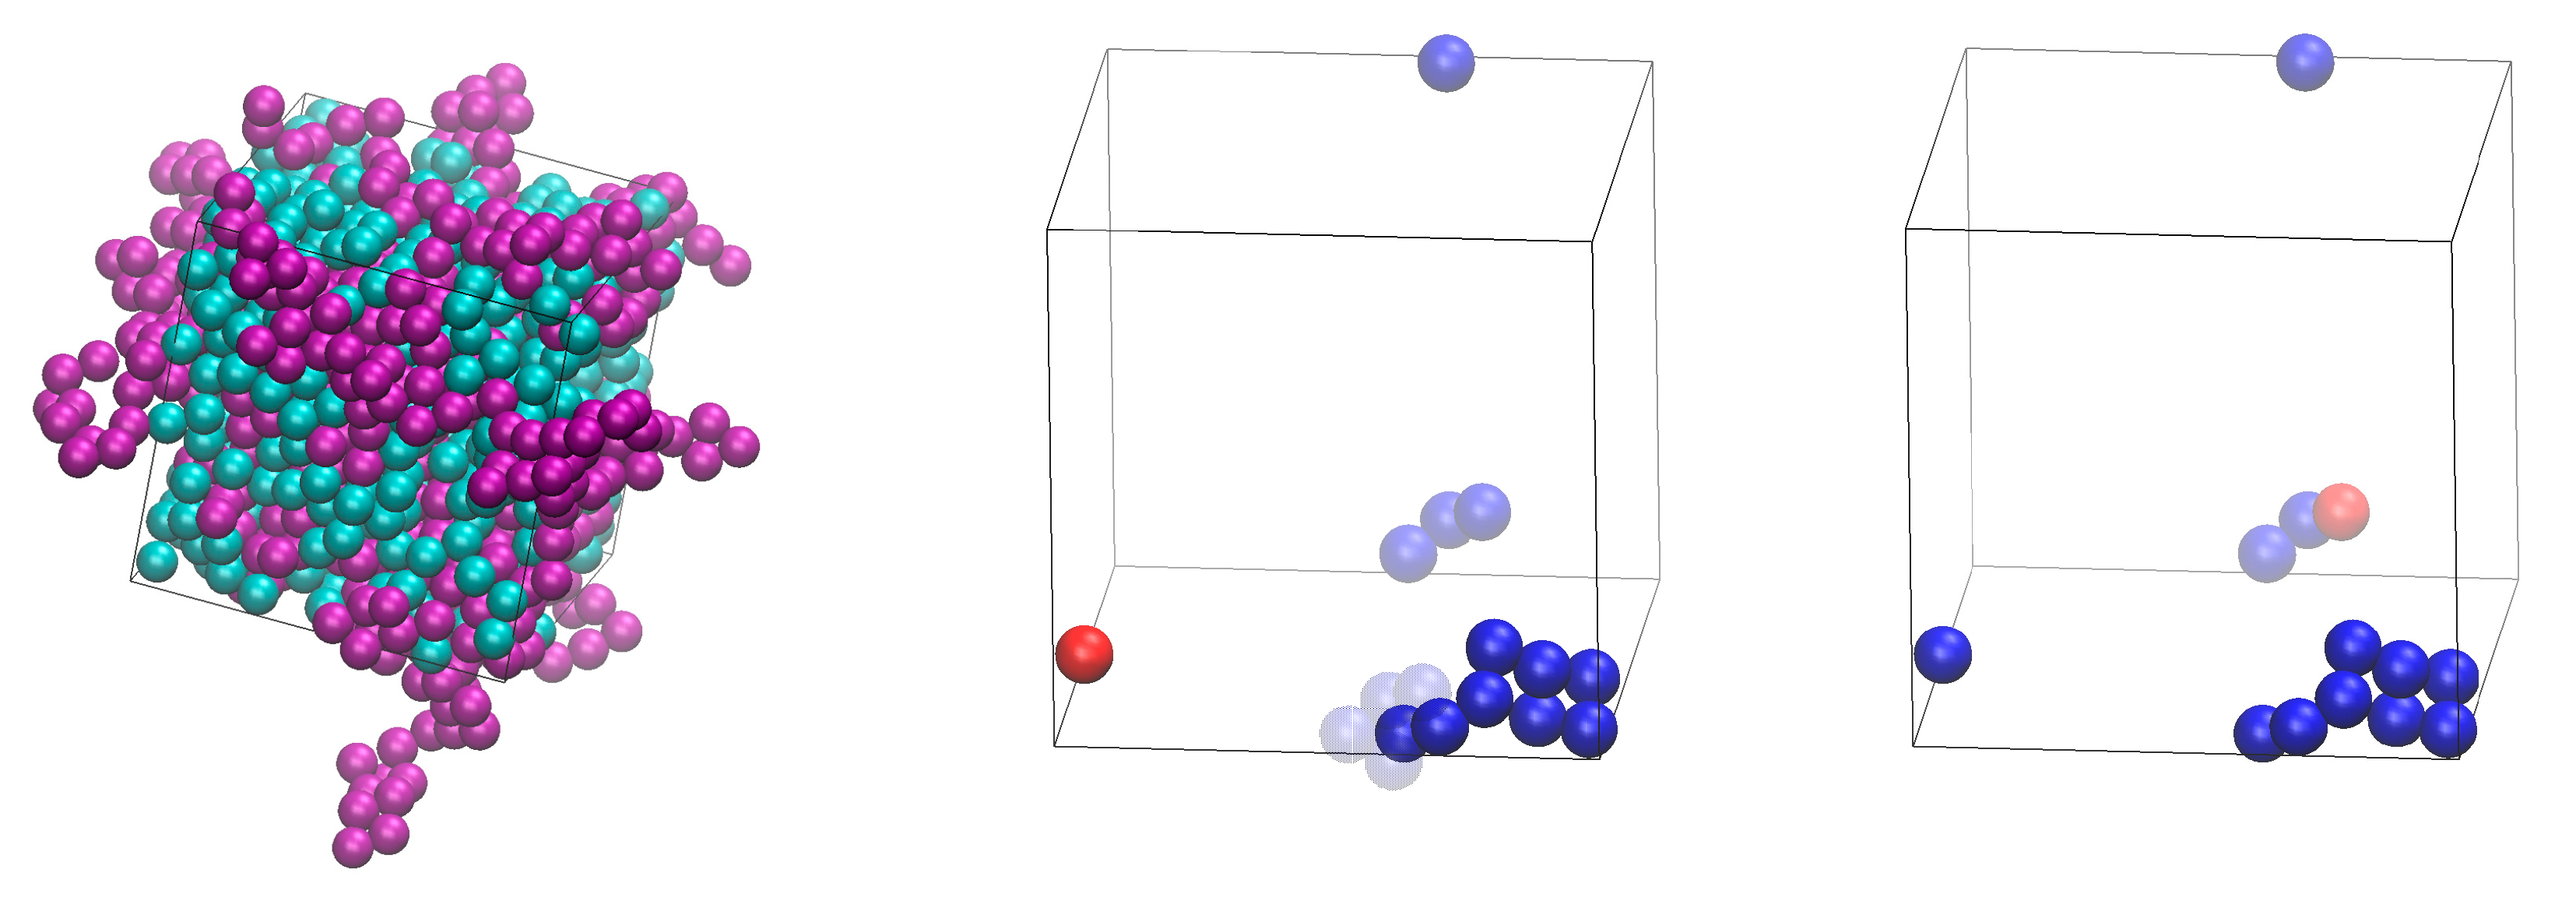
Figure 1. Illustration of the practical implementation of the IdEx1 move. Left panel: system snapshot corresponding to an athermal mixture of x = 0.50 at φ = 0.56 (Nat = 1200, Nch = 50, Nav = 12). Individual spheres and ones being part of polymers are colored in cyan and purple colors, respectively. Spheres belonging to polymers are shown with the coordinates of their centers being fully unwrapped in space. Middle and right panels host the state before and after the application of the IdEx1 move, respectively, showing only the involved chain (in blue color) and monomer (in red color). Solid and transparent representations correspond to chain coordinates subjected to periodic boundary conditions and to being fully unwrapped in space, respectively. For the move to be initiated the red sphere must lie within a bridgeable distance from one of the two ends of the blue chain. Image panels were created with the VMD software [61].
Preprints 111557 g001
Figure 2. Snapshots at the end of the MC simulation for athermal mixtures at φ = 0.5575 and varied number fraction, x. From left to right and from top to bottom: x = 0, 0.1, 0.2, 0.4, 0.6, 0.8, 0.9 and 1. Individual spheres and ones belonging to chains are colored cyan and purple, respectively. The centers of chain spheres are shown with their coordinates fully unwrapped in space. The snapshots were created with the VMD software [61]. The individual panels are also available as 3-D, interactive files in Supplementary Materials (S.M.).
Preprints 111557 g002
Figure 3. Snapshots at the end of the MC simulation for athermal mixtures of x = 0.5 at: φ = 0.5525 (left), 0.5575 (middle) and 0.5700 (right). Individual spheres and ones belonging to chains are colored cyan and purple, respectively. The centers of chain spheres are shown with their coordinates fully unwrapped in space. The snapshots were created with the VMD software [61]. The individual panels are also available as 3-D, interactive files in Supplementary Materials (S.M.).
Preprints 111557 g003
Figure 4. (Left panel) Degree of crystallinity of the individual components and the total population as a function of MC steps for a fixed packing density (φ = 0.5525) and varied relative number fraction (x = 0, 0.5, and 0.8). (Right panel) Same but for a fixed mixture composition (x = 0.6) and varied packing density (φ = 0.5550, 0.56, and 0.57).
Preprints 111557 g004
Figure 5. (Left panel) Probability distribution function of the HCP (blue), FCC (red), and FIV (green) CCE norm at a fixed packing density (φ = 0.5525) and varied relative number fraction (x = 0.02, 0.5, and 0.8). (Right panel) Same but for a fixed mixture composition (x = 0.5) and varied packing density (φ = 0.5525, 0.56, and 0.57). The dotted vertical line corresponds to the CCE norm threshold εthres = 0.245.
Preprints 111557 g005
Figure 6. System configurations at the end of the MC simulations at φ = 0.5525 and from left to right: x = 0, 0.2, 0.8, and 1. Sites are shown with the coordinates of their centers subjected to periodic boundary conditions and they are colored according to their minimum CCE-norm value: HCP (blue), FCC (red), FIV (green), HEX (purple), and BCC (cyan). Amorphous (AMO) sites are yellow and with reduced dimensions in a 2:5 ratio for visual clarity. The snapshots have been created with the VMD software [61]. The individual panels are also available as 3-D, interactive files in Supplementary Materials (S.M.).
Preprints 111557 g006
Figure 7. System configurations at the end of the MC simulations for x = 0.8 and (top row) from left to right: φ = 0.5525, 0.5550, 0.5575, 0.5600; (bottom row) from left to right: φ = 0.5625, 0.5650, 0.5675, 0.5700. Sites are shown with the coordinates of their centers subjected to periodic boundary conditions and they are colored according to their minimum CCE-norm value: HCP (blue), FCC (red), FIV (green), HEX (purple), and BCC (cyan). Amorphous (AMO) sites are yellow and with reduced dimensions in a 2:5 ratio for visual clarity. The snapshots have been created with the VMD software [61]. The individual panels are also available as 3-D, interactive files in Supplementary Materials (S.M.).
Preprints 111557 g007
Figure 8. (Left panel): Degree of crystallinity, τc, as a function of packing density, φ, for various relative number fractions, x. (Right panel): Degree of crystallinity, τc, as a function of relative number fraction, x, for various packing densities, φ. Dashed lines connecting the simulation data points serve only as a guide for the eye.
Preprints 111557 g008
Figure 9. Probability density for the bending (left panel) and torsion (right panel) angles for mixtures with relative number fraction x = 0.02, 0.10, 0.50, and 1 at φ = 0.5700. The scheme of the bond geometry can be found in Figure 1 of Ref [42]: the zero-degrees bending angle corresponds to the straight conformation and the zero-degrees torsion angle corresponds to the all-trans conformation.
Preprints 111557 g009
Figure 10. (Left panel): Logarithm of mean-square end-to-end distance, log( R 2 ), as a function of the logarithm of chain length, log(N), for mixtures characterized by x = 0.02, 0.1, 0.5, and 1 at φ = 0.57. Also shown is the result of the best linear fit on simulation data for x = 0.50. (Right panel): Logarithm of the mean-square radius of gyration, log( R g 2 ), as a function of log(N) for x = 0.6 at φ = 0.5525, 0.5600, and 0.5700. Also shown is the result of the best linear fit on simulation data for φ = 0.5600.
Preprints 111557 g010
Figure 11. (Left panel) Intramolecular pair density function, wintra(r), and (right panel) total pair radial distribution function, gtot(r), as a function of distance, r, for a mixture of x = 0.8 at φ = 0.5525, 0.5625 and 0.5700. According to the data in Figure 8, for x = 0.8, τc ≈ 0.01, 0.46 and 0.49 at φ = 0.5525, 0.5625 and 0.5700, respectively. In the calculation of gtot(r), no distinction is made between individual spheres and ones belonging to polymers.
Preprints 111557 g011
Figure 12. (Left panel) Intramolecular pair density function, wintra(r), and (right panel) total pair radial distribution function, gtot(r), as a function of distance, r, for a mixture at φ = 0.5700 and x = 0.02, 0.1, 0.5, and 1. According to data in Figure 8, at φ = 0.5700 τc ≈ 0.72, 0.71, 0.64, and 0.40 for x = 0.02, 0.1, 0.5, and 1, respectively. In the calculation of gtot(r), no distinction is made between individual spheres and ones belonging to polymers.
Preprints 111557 g012
Figure 13. Pair distribution function for like (pol-pol, mon-mon) and unlike (pol-mon) pairs, gab(r), as a function of distance, r, for mixtures of composition x = 0.1 (left panel), 0.5 (middle panel) and 0.9 (right panel) at φ = 0.57. .
Preprints 111557 g013
Figure 14. Left axes: Exponential running average with a period of 20 for asphericity, b, acylindricity, c, and relative shape anisotropy, k2, of the Voronoi polyhedra of individual spheres (red), ones belonging to polymers (green), and of the total population (blue), respectively, as a function of MC frames. Right axis: The corresponding evolution of the degree of crystallinity, τc (total population, black curve). Simulation trajectory corresponds to the athermal mixture with x = 0.6 at φ = 0.555.
Preprints 111557 g014
Figure 15. Probability distribution function for asphericity, b (left panel), acylindricity, c (middle panel), and relative shape anisotropy, k2 (right panel), for the mixture with composition x = 0.80 at φ = 0.5525, 0.5625, and 0.5700. Distributions correspond to the late, stable part of the MC simulation with the degree of crystallinity being equal to τc = 0.01, 0.46 and 0.49 at φ = 0.5525, 0.5625, and 0.5700, respectively. Dashed and solid lines correspond to individual monomers and ones belonging to chains, respectively.
Preprints 111557 g015
Figure 16. Probability distribution function for asphericity, b (left panel), acylindricity, c (middle panel), and relative shape anisotropy, k2 (right panel), for spheres belonging to chains (dashed lines) and individual ones (solid lines) in the initial random and the final crystal phase for the mixture with composition x = 0.50 at a packing density φ = 0.5525.
Preprints 111557 g016
Figure 17. Parity plot of degree of crystallinity, τc, and relative shape anisotropy of the Voronoi polyhedral, k2, for the total population of stable, final part of the MC trajectory for each athermal mixture studied here. Data in the main panel and inset correspond to high-crystallinity (ordered) and low-crystallinity (random) mixtures, respectively. Also shown are best linear fits (red lines) on corresponding simulation data.
Preprints 111557 g017
Table 1. Composition of the mixtures studied in the present work where x is the relative molar fraction and Nch is the number of chains. In all cases, the average chain length is Nav = 12 and the total number of hard spheres is Ntot = 1200.
Nch 0 2 10 20 40 50 60 70 80 90 100
x 0 0.02 0.1 0.2 0.4 0.5 0.6 0.7 0.8 0.9 1
Disclaimer/Publisher’s Note: The statements, opinions and data contained in all publications are solely those of the individual author(s) and contributor(s) and not of MDPI and/or the editor(s). MDPI and/or the editor(s) disclaim responsibility for any injury to people or property resulting from any ideas, methods, instructions or products referred to in the content.
Copyright: This open access article is published under a Creative Commons CC BY 4.0 license, which permit the free download, distribution, and reuse, provided that the author and preprint are cited in any reuse.
Prerpints.org logo

Preprints.org is a free preprint server supported by MDPI in Basel, Switzerland.

Subscribe

© 2024 MDPI (Basel, Switzerland) unless otherwise stated