Submitted:
08 July 2024
Posted:
10 July 2024
You are already at the latest version
Abstract
Keywords:
1. Introduction
2. Materials and Methods
2.1. Study area and crop characterization
2.2. Climate Characterization
2.3. Soil characterization and soil water content monitoring
2.4. Modelling approach
2.4.1. SIMDualKc modelling tool
2.5. Estimating Kcb values using the A&P approach and remote sensing data
2.4.3. Parameterization and calibration procedures of SIMDualKc model
2.4.4. Modeling tool accuracy assessment
3. Results and Discussion
3.1. Performance of the SIMDualKc Model in Calculating Soil Water Content
3.2. Crop Coefficients Dynamics over the Season
3.3. Estimation of the Fraction of Ground Cover from Vegetation Indices
3.4. Comparison between Kcb obtained with SIMDualKc model and predicted with the A&P approach
3.5. Water Balance and Respective Components
4. Conclusions
Supplementary Materials
Author Contributions
Funding
Data Availability Statement
Acknowledgments
Conflicts of Interest
References
- Fernandes-Silva A, Oliveira M, A. Paço T, Ferreira I (2019) Deficit Irrigation in Mediterranean Fruit Trees and Grapevines: Water Stress Indicators and Crop Responses. In: Ondrašek G (ed) Irrigation in Agroecosystems. IntechOpen. [CrossRef]
- Ferreira MI, Silvestre J, Conceição N, Malheiro AC (2012) Crop and stress coefficients in rainfed and deficit irrigation vineyards using sap flow techniques. Irrig Sci 30:433–447. [CrossRef]
- Groenveld T, Obiero C, Yu Y, et al (2023) Predawn leaf water potential of grapevines is not necessarily a good proxy for soil moisture. BMC Plant Biology 23:369. [CrossRef]
- Edwards E j., Clingeleffer P r. (2013) Interseasonal effects of regulated deficit irrigation on growth, yield, water use, berry composition and wine attributes of Cabernet Sauvignon grapevines. Australian Journal of Grape and Wine Research 19:261–276. [CrossRef]
- Keller M (2010) The Science of Grapevines - 1st Edition. https://shop.elsevier.com/books/the-science-of-grapevines/keller/978-0-12-374881-2. Accessed 19 Jun 2023.
- Savi T, Petruzzellis F, Moretti E, et al (2019) Grapevine water relations and rooting depth in karstic soils. Science of The Total Environment 692:669–675. [CrossRef]
- Smart DR, Schwass E, Lakso A, Morano L (2006) Grapevine Rooting Patterns: A Comprehensive Analysis and a Review. Am J Enol Vitic 57:89–104. [CrossRef]
- Celette F, Wery J, Chantelot E, et al (2005) Belowground Interactions in a Vine (Vitis vinifera L.)-tall Fescue (Festuca arundinacea Shreb.) Intercropping System: Water Relations and Growth. Plant Soil 276:205–217. [CrossRef]
- Iland P, Dry P, Proffitt T, Tyerman S (2011) The Grapevine: from the science to the practice of growing vines for wine - Patrick Iland Wine Books. https://www.piwpwinebooks.com.au/wine-books/the-grapevine-from-the-science-to-the-practice-of-growing-vines-for-wine. Accessed 19 Jun 2023.
- Valentín F, Sánchez JM, Martínez-Moreno A, et al (2023) Using on-the-ground surface energy balance to monitor vine water status and evapotranspiration under deficit irrigation and rainfed conditions. Agricultural Water Management 281:108240. [CrossRef]
- Chaves MM, Zarrouk O, Francisco R, et al (2010) Grapevine under deficit irrigation: hints from physiological and molecular data. Annals of Botany 105:661–676. [CrossRef]
- Chaves MM, Santos TP, Souza CR, et al (2007) Deficit irrigation in grapevine improves water-use efficiency while controlling vigour and production quality. Ann Applied Biology 150:237–252. [CrossRef]
- Costa JM, Oliveira M, Egipto RJ, et al (2020) Water and wastewater management for sustainable viticulture and oenology in South Portugal – a review. Ciência Téc Vitiv 35:1–15. [CrossRef]
- De Souza CR, Maroco JP, Dos Santos TP, et al (2005) Control of stomatal aperture and carbon uptake by deficit irrigation in two grapevine cultivars. Agriculture, Ecosystems & Environment 106:261–274. [CrossRef]
- De Souza CR, Maroco JP, Dos Santos TP, et al (2005) Impact of deficit irrigation on water use efficiency and carbon isotope composition (δ13C) of field-grown grapevines under Mediterranean climate. Journal of Experimental Botany 56:2163–2172. [CrossRef]
- Ferreira MI, Conceição N, Malheiro AC, et al (2017) Water stress indicators and stress functions to calculate soil water depletion in deficit irrigated grapevine and kiwi. Acta Hortic 119–126. [CrossRef]
- MacMillan P, Teixeira G, Lopes CM, Monteiro A (2021) The role of grapevine leaf morphoanatomical traits in determining capacity for coping with abiotic stresses: a review. Ciência Téc Vitiv 36:75–88. [CrossRef]
- Dinis L-T, Correia CM, Ferreira HF, et al (2014) Physiological and biochemical responses of Semillon and Muscat Blanc à Petits Grains winegrapes grown under Mediterranean climate. Scientia Horticulturae 175:128–138. [CrossRef]
- Pacheco CMA (1989) Influência de técnicas de não mobilização e de mobilização sobre aspectos estruturais e hídricos de solos com vinha, bem como sobre o respectivo sistema radical. Consequencias das relações hídricas solo - vinha na produção. Tese de doutoramento, Insituto Superior de Agronomia – Universidade Técnica de Lisboa.
- Costa JM, Vaz M, Escalona J, et al (2016) Modern viticulture in southern Europe: Vulnerabilities and strategies for adaptation to water scarcity. Agricultural Water Management 164:5–18. [CrossRef]
- Dal Santo S, Palliotti A, Zenoni S, et al (2016) Distinct transcriptome responses to water limitation in isohydric and anisohydric grapevine cultivars. BMC Genomics 17:815. [CrossRef]
- Flexas J, Carriquí M, Nadal M (2018) Gas exchange and hydraulics during drought in crops: who drives whom? Journal of Experimental Botany 69:3791–3795. [CrossRef]
- Savi T, Petruzzellis F, Martellos S, et al (2018) Vineyard water relations in a karstic area: deep roots and irrigation management. Agriculture, Ecosystems & Environment 263:53–59. [CrossRef]
- Malheiro AC, Gonçalves IN, Fernandes-Silva AA, et al (2011) Relationships between relative transpiration of grapevines and plant and soil water status in Portugal’s Douro wine region. Acta Hortic 261–267. [CrossRef]
- Pellegrino A, Lebon E, Voltz M, Wery J (2004) Relationships between plant and soil water status in vine (Vitis vinifera L.). Plant Soil 266:129–142. [CrossRef]
- Carbonneau A (1998) Irrigation, vignoble et produits de la vigne. In: Traité d’irrigation, Tiercelin, J.R. (ed.). Lavoisier Tec & Doc, Paris, pp 257–276.
- Allen RG, Pereira LS, Raes D, Smith, M (1998) FAO Irrigation and Drainage Paper. 326.
- Pereira LS, Paredes P, Hunsaker DJ, et al (2021) Standard single and basal crop coefficients for field crops. Updates and advances to the FAO56 crop water requirements method. Agricultural Water Management 243:106466. [CrossRef]
- Rallo G, Paço TA, Paredes P, et al (2021) Updated single and dual crop coefficients for tree and vine fruit crops. Agricultural Water Management 250:106645. [CrossRef]
- Liu M, Shi H, Paredes P, et al (2022) Estimating and partitioning maize evapotranspiration as affected by salinity using weighing lysimeters and the SIMDualKc model. Agricultural Water Management 261:107362. [CrossRef]
- Puig-Sirera À, Rallo G, Paredes P, et al (2021) Transpiration and Water Use of an Irrigated Traditional Olive Grove with Sap-Flow Observations and the FAO56 Dual Crop Coefficient Approach. Water 13:2466. [CrossRef]
- Cammalleri C, Anderson MC, Ciraolo G, et al (2012) Applications of a remote sensing-based two-source energy balance algorithm for mapping surface fluxes without in situ air temperature observations. Remote Sensing of Environment 124:502–515. [CrossRef]
- Conceição N, Häusler M, Lourenço S, et al (2017) Evapotranspiration measured in a traditional rainfed and an irrigated intensive olive orchard during a year of hydrological drought. Acta Hortic 281–288. [CrossRef]
- Paço TA, Pôças I, Cunha M, et al (2014) Evapotranspiration and crop coefficients for a super intensive olive orchard. An application of SIMDualKc and METRIC models using ground and satellite observations. Journal of Hydrology 519:2067–2080. [CrossRef]
- Pereira LS, Paredes P, Melton F, et al (2020) Prediction of crop coefficients from fraction of ground cover and height. Background and validation using ground and remote sensing data. Agricultural Water Management 241:106197. [CrossRef]
- Allen RG, Pereira LS, Smith M, et al (2005) FAO-56 Dual Crop Coefficient Method for Estimating Evaporation from Soil and Application Extensions. J Irrig Drain Eng 131:2–13. [CrossRef]
- Er-Raki S, Chehbouni A, Boulet G, Williams DG (2010) Using the dual approach of FAO-56 for partitioning ET into soil and plant components for olive orchards in a semi-arid region. Agricultural Water Management 97:1769–1778. [CrossRef]
- Paço T, Paredes P, Pereira L, et al (2019) Crop Coefficients and Transpiration of a Super Intensive Arbequina Olive Orchard using the Dual Kc Approach and the Kcb Computation with the Fraction of Ground Cover and Height. Water 11:383. [CrossRef]
- Rallo G, Baiamonte G, Juárez JM, Provenzano G (2014) Improvement of FAO-56 Model to Estimate Transpiration Fluxes of Drought Tolerant Crops under Soil Water Deficit: Application for Olive Groves. J Irrig Drain Eng 140:A4014001. [CrossRef]
- Autovino D, Rallo G, Provenzano G (2018) Predicting soil and plant water status dynamic in olive orchards under different irrigation systems with Hydrus-2D: Model performance and scenario analysis. Agricultural Water Management 203:225–235. [CrossRef]
- Rosa RD, Paredes P, Rodrigues GC, et al (2012) Implementing the dual crop coefficient approach in interactive software. 1. Background and computational strategy. Agricultural Water Management 103:8–24. [CrossRef]
- Rosa RD, Paredes P, Rodrigues GC, et al (2012) Implementing the dual crop coefficient approach in interactive software: 2. Model testing. Agricultural Water Management 103:62–77. [CrossRef]
- Ramos TB, Darouich H, Oliveira AR, et al (2023) Water use and soil water balance of Mediterranean tree crops assessed with the SIMDualKc model in orchards of southern Portugal. Agricultural Water Management 279:108209. [CrossRef]
- Cancela JJ, Fandiño M, Rey BJ, Martínez EM (2015) Automatic irrigation system based on dual crop coefficient, soil and plant water status for Vitis vinifera (cv Godello and cv Mencía). Agricultural Water Management 151:52–63. [CrossRef]
- Fandiño M, Cancela JJ, Rey BJ, et al (2012) Using the dual-Kc approach to model evapotranspiration of Albariño vineyards (Vitis vinifera L. cv. Albariño) with consideration of active ground cover. Agricultural Water Management 112:75–87. [CrossRef]
- Paço TA, Ferreira MI, Rosa RD, et al (2012) The dual crop coefficient approach using a density factor to simulate the evapotranspiration of a peach orchard: SIMDualKc model versus eddy covariance measurements. Irrig Sci 30:115–126. [CrossRef]
- Darouich H, Ramos TB, Pereira LS, et al (2022) Water Use and Soil Water Balance of Mediterranean Vineyards under Rainfed and Drip Irrigation Management: Evapotranspiration Partition and Soil Management Modelling for Resource Conservation. Water 14:554. [CrossRef]
- Allen RG, Pereira LS (2009) Estimating crop coefficients from fraction of ground cover and height. Irrig Sci 28:17–34. [CrossRef]
- Pôças I, Calera A, Campos I, Cunha M (2020) Remote sensing for estimating and mapping single and basal crop coefficientes: A review on spectral vegetation indices approaches. Agricultural Water Management 233:106081. [CrossRef]
- Pôças I, Paço T, Paredes P, et al (2015) Estimation of Actual Crop Coefficients Using Remotely Sensed Vegetation Indices and Soil Water Balance Modelled Data. Remote Sensing 7:2373–2400. [CrossRef]
- Allen RG, Wright JL, Pruitt WO, et al (2007) Water requirements. In: Design and Operation of Farm Irrigation Systems, 2nd Edition, 1st ed. American Society of Agricultural and Biological Engineers, St. Joseph, MI, pp 208–288.
- Anderson MC, Kustas WP, Alfieri JG, et al (2012) Mapping daily evapotranspiration at Landsat spatial scales during the BEAREX’08 field campaign. Advances in Water Resources 50:162–177. [CrossRef]
- Bastiaanssen WGM, Menenti M, Feddes RA, Holtslag AAM (1998) A remote sensing surface energy balance algorithm for land (SEBAL). 1. Formulation. Journal of Hydrology 212–213:198–212. [CrossRef]
- French AN, Hunsaker DJ, Thorp KR (2015) Remote sensing of evapotranspiration over cotton using the TSEB and METRIC energy balance models. Remote Sensing of Environment 158:281–294. [CrossRef]
- Campos I, Neale CMU, Calera A, et al (2010) Assessing satellite-based basal crop coefficients for irrigated grapes (Vitis vinifera L.). Agricultural Water Management 98:45–54. [CrossRef]
- Jayanthi H, Neale CMU, Wright JL (2007) Development and validation of canopy reflectance-based crop coefficient for potato. Agricultural Water Management 88:235–246. [CrossRef]
- Mateos L, González-Dugo MP, Testi L, Villalobos FJ (2013) Monitoring evapotranspiration of irrigated crops using crop coefficients derived from time series of satellite images. I. Method validation. Agricultural Water Management 125:81–91. [CrossRef]
- Rouse W, Haas R, Scheel J, Deering W (1973) Monitoring Vegetation Systems in Great Plains with ERST, Proceedings of the Third ERTS Symposium, NASA SP-351. US Government printing office, Washington, DC, pp. 309–317.
- Huete AR (1988) A soil-adjusted vegetation index (SAVI). Remote Sensing of Environment 25:295–309. [CrossRef]
- Glenn EP, Neale CMU, Hunsaker DJ, Nagler PL (2011) Vegetation index-based crop coefficients to estimate evapotranspiration by remote sensing in agricultural and natural ecosystems: VEGETATION INDEX-BASED CROP COEFFICIENTS. Hydrol Process 25:4050–4062. [CrossRef]
- Jensen JR (2000) Remote Sensing of Environment. An Earth Resource Perspective. Prentice Hall, Inc., New Jersey.
- Qi J, Chehbouni A, Huete AR, et al (1994) A modified soil adjusted vegetation index. Remote Sensing of Environment 48:119–126. [CrossRef]
- Scholander PF, Bradstreet ED, Hemmingsen EA, Hammel HT (1965) Sap Pressure in Vascular Plants. Science 148:339–346. [CrossRef]
- Kottek M, Grieser J, Beck C, et al (2006) World Map of the Köppen-Geiger climate classification updated. metz 15:259–263. [CrossRef]
- Allen RG (1996) Assessing Integrity of Weather Data for Reference Evapotranspiration Estimation. J Irrig Drain Eng 122:97–106. [CrossRef]
- FAO-UNESCO (1974) Soil map of the world. 1: Legend: [Erläuterungen]. Unesco, Paris.
- Paz AM, Cipriano D, Sequeira B, et al (2009) Funções de pedo-transferência para a curva de retenção da água no solo. [CrossRef]
- Bell JP (1976) Neutron probe practice. Institute of Hydrology, Wallingford, In: Report No. 19, second ed.
- Hodnett MG (1986) The Neutron Probe for Soil Moisture Measurement. In: Gensler WG (ed) Advanced Agricultural Instrumentation: Design and Use. Springer Netherlands, Dordrecht, pp 148–192. [CrossRef]
- Allen RG, Pereira LS, Howell TA, Jensen ME (2011) Evapotranspiration information reporting: I. Factors governing measurement accuracy. Agricultural Water Management 98:899–920. [CrossRef]
- Liu Y, Pereira LS, Fernando RM (2006) Fluxes through the bottom boundary of the root zone in silty soils: Parametric approaches to estimate groundwater contribution and percolation. Agricultural Water Management 84:27–40. [CrossRef]
- USDA-SCS (2004) Chapter 10 - Estimation of Direct Runoff from Storm Rainfall. USDA-SCS. National Engineering Handbook. Curve Number (Part 630 Hydrology). In: National Engineering Handbook. p 79.
- Pereira LS, Paredes P, Rodrigues GC, Neves M (2015) Modeling malt barley water use and evapotranspiration partitioning in two contrasting rainfall years. Assessing AquaCrop and SIMDualKc models. Agricultural Water Management 159:239–254. [CrossRef]
- Rosa RD, Ramos TB, Pereira LS (2016) The dual Kc approach to assess maize and sweet sorghum transpiration and soil evaporation under saline conditions: Application of the SIMDualKc model. Agricultural Water Management 177:77–94. [CrossRef]
- González-Altozano P, Pavel EW, Oncins JA, et al (2008) Comparative assessment of five methods of determining sap flow in peach trees. Agricultural Water Management 95:503–515. [CrossRef]
- Siqueira JM, Paço TA, Silvestre JC, et al (2014) Generating fuzzy rules by learning from olive tree transpiration measurement – An algorithm to automatize Granier sap flow data analysis. Computers and Electronics in Agriculture 101:1–10. [CrossRef]
- Huete AR, Liu HQ (1994) An error and sensitivity analysis of the atmospheric- and soil-correcting variants of the NDVI for the MODIS-EOS. IEEE Transactions on Geoscience and Remote Sensing 32:897–905. [CrossRef]
- González-Dugo MP, Mateos L (2008) Spectral vegetation indices for benchmarking water productivity of irrigated cotton and sugarbeet crops. Agricultural Water Management 95:48–58. [CrossRef]
- Comas L h., Bauerle T l., Eissenstat D m. (2010) Biological and environmental factors controlling root dynamics and function: effects of root ageing and soil moisture. Australian Journal of Grape and Wine Research 16:131–137. [CrossRef]
- Liu M, Paredes P, Shi H, et al (2022) Impacts of a shallow saline water table on maize evapotranspiration and groundwater contribution using static water table lysimeters and the dual Kc water balance model SIMDualKc. Agricultural Water Management 273:107887. [CrossRef]
- Moriasi DN, J. G. Arnold, M. W. Van Liew, et al (2007) Model Evaluation Guidelines for Systematic Quantification of Accuracy in Watershed Simulations. Transactions of the ASABE 50:885–900. [CrossRef]
- Nash JE, Sutcliffe JV (1970) River flow forecasting through conceptual models part I — A discussion of principles. Journal of Hydrology 10:282–290. [CrossRef]
- Silva SP, Valín MI, Mendes S, et al (2021) Dual Crop Coefficient Approach in Vitis vinifera L. cv. Loureiro. Agronomy 11:2062. [CrossRef]
- Silvestre JMC (2003) Evapotranspiração e funcionamento hídrico em Vitis vinifera L. Dissertação de Doutoramento, Instituto Superior de Agronomia, Universidade Técnica de Lisboa 222.
- Serrano L, González-Flor C, Gorchs G (2010) Assessing vineyard water status using the reflectance-based Water Index. Agriculture, Ecosystems & Environment 139:490–499. [CrossRef]
- Serrano L, González-Flor C, Gorchs G (2012) Assessment of grape yield and composition using the reflectance-based Water Index in Mediterranean rainfed vineyards. Remote Sensing of Environment 118:249–258. [CrossRef]
- Ramírez-Cuesta JM, Intrigliolo DS, Lorite IJ, et al (2023) Determining grapevine water use under different sustainable agronomic practices using METRIC-UAV surface energy balance model. Agricultural Water Management 281:108247. [CrossRef]
- Ballesteros R, Intrigliolo DS, Ortega JF, et al (2020) Vineyard yield estimation by combining remote sensing, computer vision and artificial neural network techniques. Precision Agric 21:1242–1262. [CrossRef]
- Basile A, Albrizio R, Autovino D, et al (2020) A modelling approach to discriminate contributions of soil hydrological properties and slope gradient to water stress in Mediterranean vineyards. Agricultural Water Management 241:106338. [CrossRef]
- da Silva AJP, Pinheiro EAR, de Jong van Lier Q (2020) Determination of soil hydraulic properties and its implications for mechanistic simulations and irrigation management. Irrig Sci 38:223–234. [CrossRef]
- Galleguillos M, Jacob F, Prévot L, et al (2017) Estimation of actual evapotranspiration over a rainfed vineyard using a 1-D water transfer model: A case study within a Mediterranean watershed. Agricultural Water Management 184:67–76. [CrossRef]
- Wang S, Zhu G, Xia D, et al (2019) The characteristics of evapotranspiration and crop coefficients of an irrigated vineyard in arid Northwest China. Agricultural Water Management 212:388–398. [CrossRef]
- Er-Raki S, Rodriguez JC, Garatuza-Payan J, et al (2013) Determination of crop evapotranspiration of table grapes in a semi-arid region of Northwest Mexico using multi-spectral vegetation index. Agricultural Water Management 122:12–19. [CrossRef]
- Campos I, Villodre J, Carrara A, Calera A (2013) Remote sensing-based soil water balance to estimate Mediterranean holm oak savanna (dehesa) evapotranspiration under water stress conditions. Journal of Hydrology 494:1–9. [CrossRef]
- Alfieri JG, Kustas WP, Prueger JH, et al (2019) A multi-year intercomparison of micrometeorological observations at adjacent vineyards in California’s Central Valley during GRAPEX. Irrig Sci 37:345–357. [CrossRef]

| Equations | Conditions | Parameters |
| Capillary rise | ||
| (mm) | a1 = WFC, soil water storage to maximum root depth (Zr) at field capacity (mm); a1 = θFC Zr ·1000 | |
| (mm) | m | b1 = −0.17 |
| m | a2 = 1.1 [(θFC + θWP)/2] Zr ·1000, i.e., storage above the average between those at field capacity and the wilting point (mm) b2 =−0.27 |
|
| (m) | mm d-1 | a3 = −1.3 |
| (m) | mm d-1 | b3 = 6.7 for clay and silty clay loam soils, decreasing to 6.2 for loamy sands |
| (mm d-1) | a4 = 4.6 for silty loam and silty clay loam soils, decreasing to 3 for loamy sands | |
| (mm d-1) | b4 = −0.65 for silty loam soils and decreasing to −2.5 for loamy sand soils | |
| mm d-1 | ||
| mm d-1 | ||
| (mm d-1) | ||
| (mm d-1) | ||
| Parameters | Initial values* | Calibrated values | |
|---|---|---|---|
| Crop characteristics | Kcb ini | 0.15 | 0.15 |
| Kcb mid | 0.65 | 0.60 | |
| Kcb end | 0.40 | 0.52 | |
| p ini | 0.45 | 0.60 | |
| p dev | 0.45 | 0.60 | |
| p mid | 0.45 | 0.60 | |
| p end | 0.45 | 0.60 | |
| Soil evaporation | TEW | 20 | 20 |
| REW | 10 | 10 | |
| Ze (m) | 0.10 | 0.10 | |
| Runoff and deep percolation | CN | 68 | 68 |
| aD | 285 | 275 | |
| bD | -0.0173 | -0.0173 | |
| Capillary rise | a1 | 260 | 253 |
| b1 | -0.17 | -0.17 | |
| a2 | 200 | 196 | |
| b2 | -0.27 | -0.27 | |
| a3 | -1.3 | -1.3 | |
| b3 | 6.2 | 6.2 | |
| a4 | 3.0 | 3.0 | |
| b4 | -2.5 | -2.5 | |
| Number of observations | b0 | R2 | RMSE (mm) | NRMSE (%) | AAE (mm) | ARE (%) | EF | |
| Calibration | 10 | 0.97 | 1.00 | 11.1 | 12.8 | 9.5 | 0.56 | 0.98 |
| Test | 7 | 0.97 | 1.00 | 11.9 | 11.2 | 10.2 | 0.25 | 0.97 |
| DOY | Date | SAVI ± SD | fc VI |
| 116 | 26/04/1987 | 0.205 ± 0.012 | 0.174 |
| 148 | 28/05/1987 | 0.279 ± 0.066 | 0.286 |
| 180 | 29/06/1987 | 0.271 ± 0.065 | 0.275 |
| 212 | 31/07/1987 | 0.272 ± 0.081 | 0.276 |
| 260 | 17/09/1987 | 0.228 ± 0.058 | 0.209 |
| Date | Kcb SIMDualKc_1D | Kcb A&P | Deviation | Kcb SIMDualKc_2A | Kcb A&P | Deviation |
| 26/04/1987 | 0.29 | 0.29 | -0.01 | 0.27 | 0.29 | 0.01 |
| 28/05/1987 | 0.51 | 0.45 | -0.10 | 0.47 | 0.45 | -0.05 |
| 29/06/1987 | 0.39 | 0.40 | 0.01 | 0.47 | 0.40 | -0.06 |
| 31/07/1987 | 0.20 | 0.43 | 0.21 | 0.32 | 0.43 | 0.09 |
| 17/09/1987 | 0.08 | 0.35 | 0.24 | 0.14 | 0.35 | 0.18 |
| Initial | Development | Mid-season | Late-season | Full Year | |
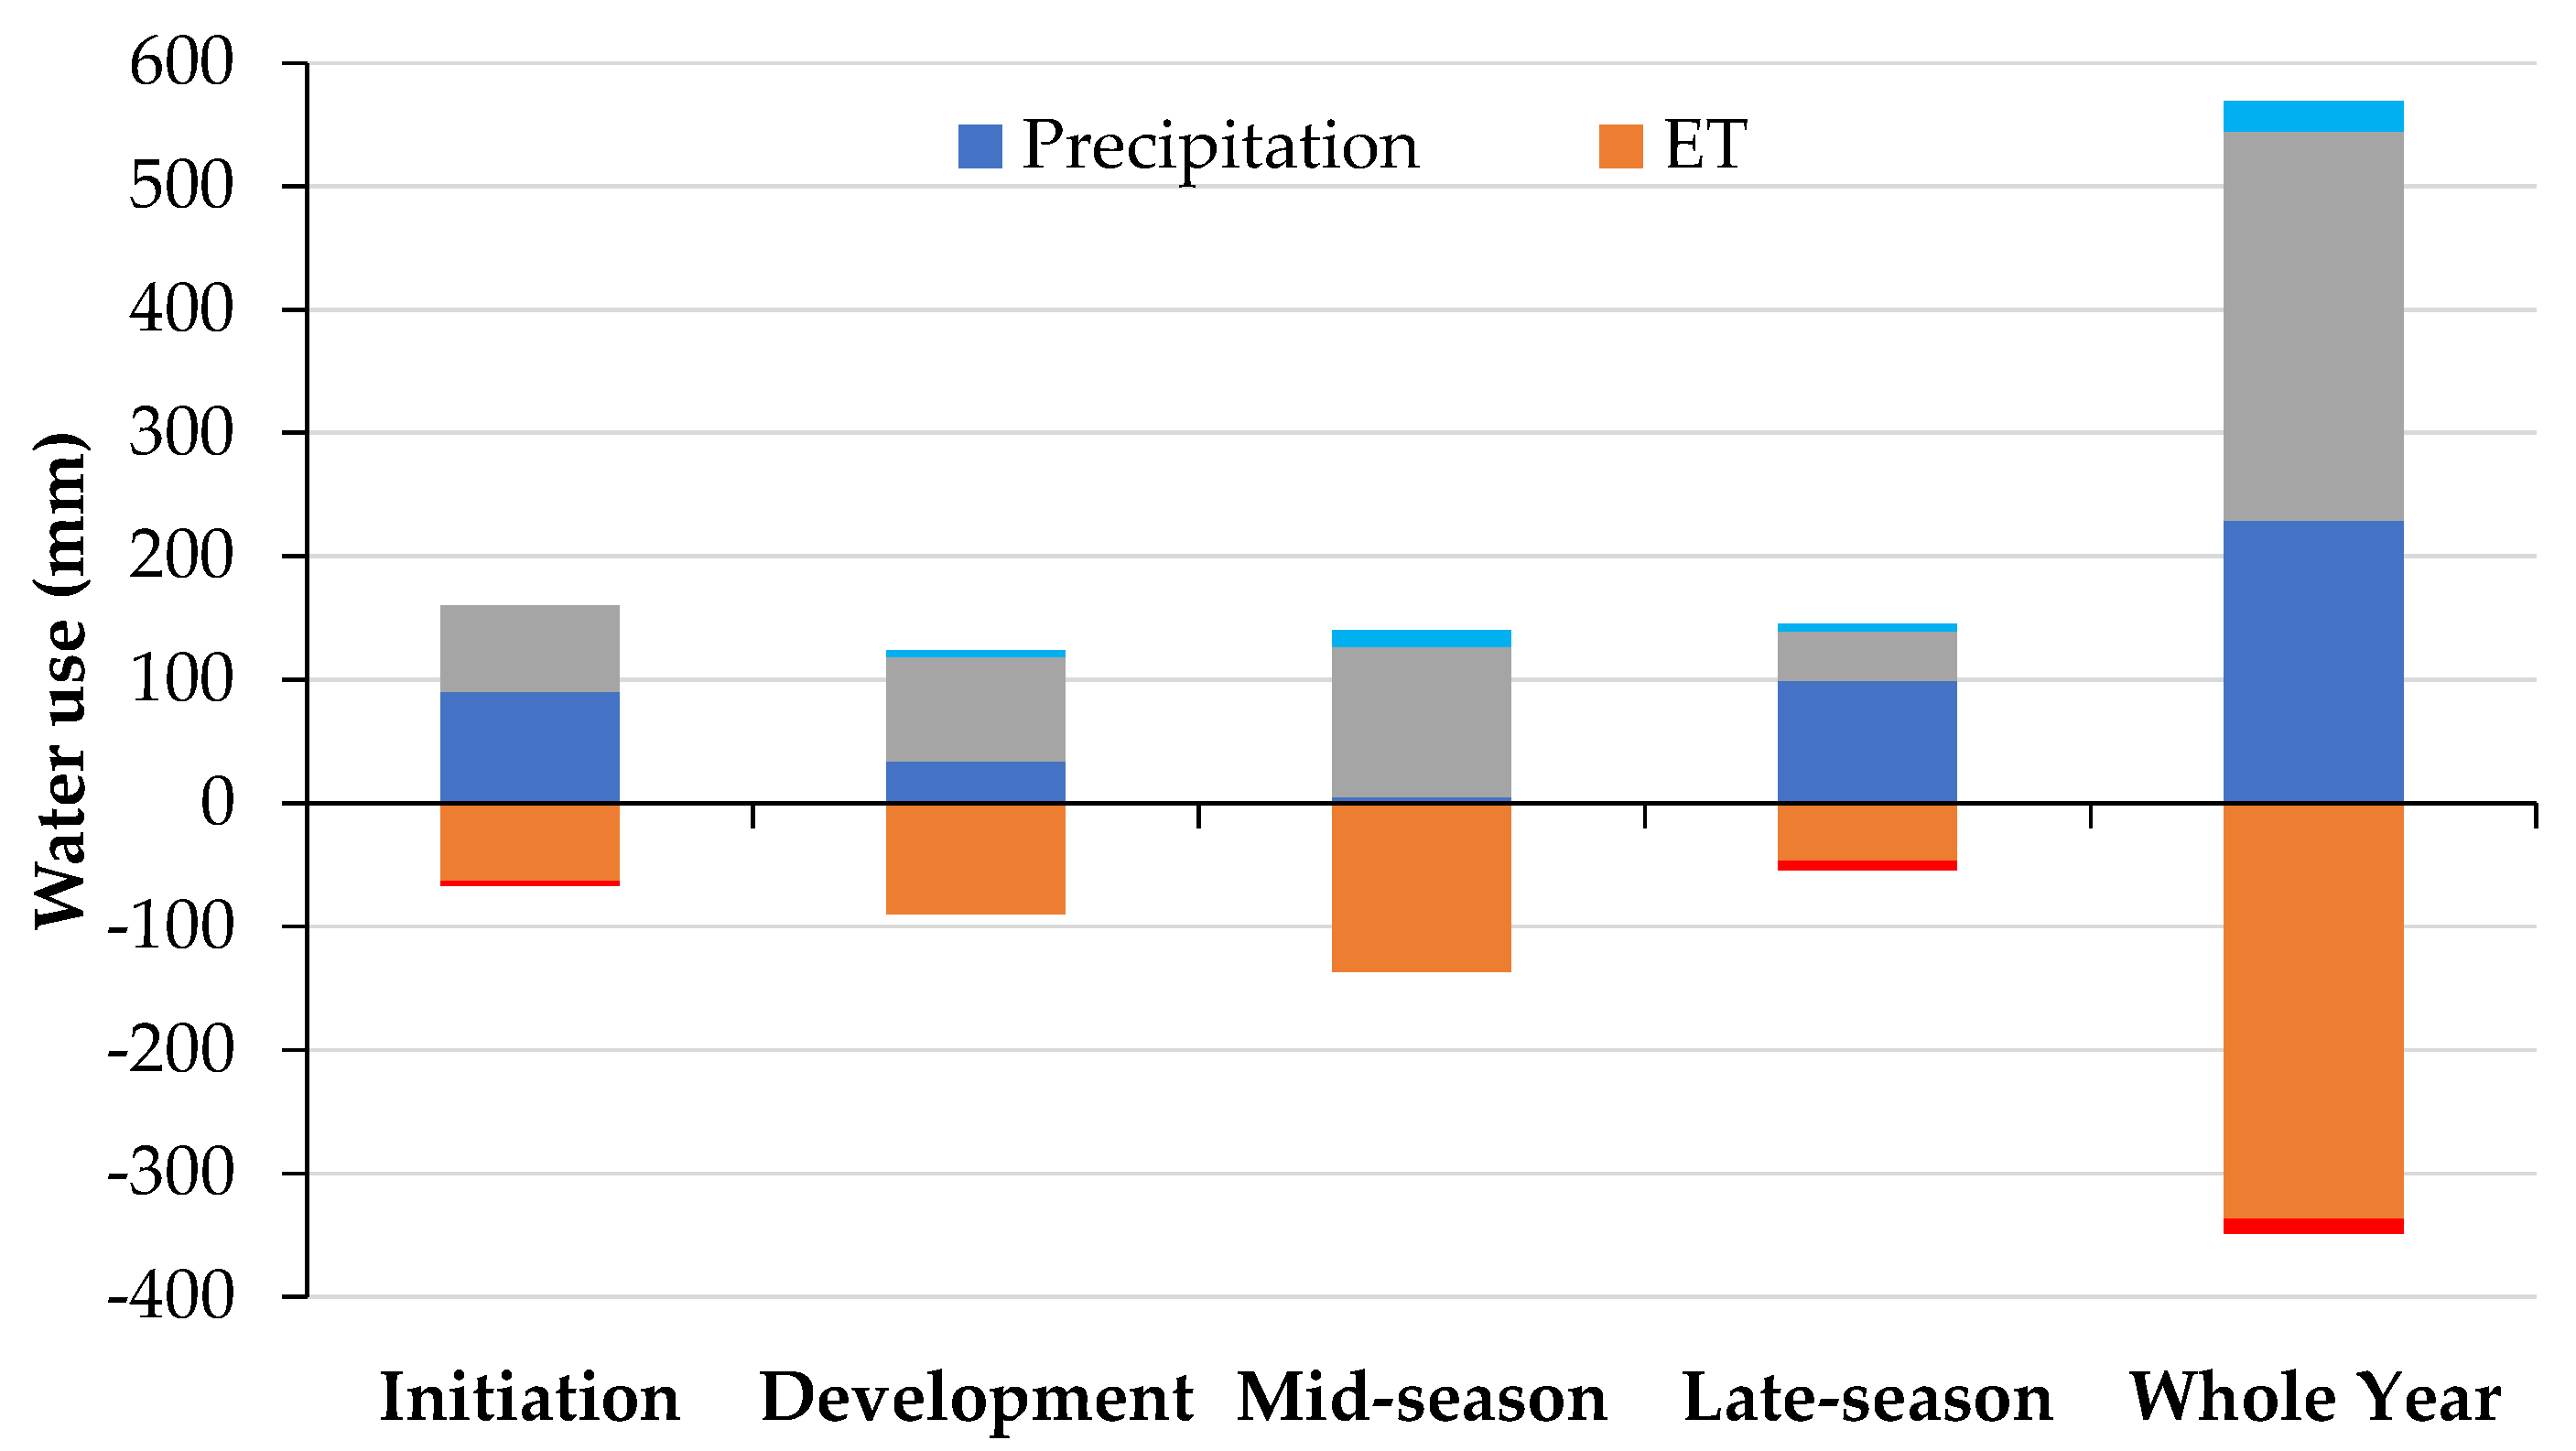
| ETc act (mm) | 68 ± 1.51 | 89 ± 1.16 | 143 ± 7.80 | 55 ± 8.80 | 354 ± 16.95 |
| Es (mm) | 57 ± 1.51 | 46 ± 0.53 | 5 ± 0.15 | 13 ± 0.15 | 121 ± 2.04 |
| Tc act (mm) | 10 ± 0.00 | 43 ± 1.69 | 139 ± 7.17 | 41 ± 9.15 | 234 ± 14.63 |
| Es/ETc act (%) | 83 ± 0.57 | 43 ± 0.84 | 3 ± 0.11 | 16 ± 1.15 | 36 ± 0.09 |
| Tc act/ETc act (%) | 17 ± 0.57 | 57 ± 0.85 | 98 ± 0.50 | 85 ± 1.22 | 64 ± 0.17 |
| ETc act/ETc (%) | 100 ± 0.00 | 100 ± 0.00 | 87 ± 8.45 | 46 ± 8.55 | 83 ± 4.25 |
Disclaimer/Publisher’s Note: The statements, opinions and data contained in all publications are solely those of the individual author(s) and contributor(s) and not of MDPI and/or the editor(s). MDPI and/or the editor(s) disclaim responsibility for any injury to people or property resulting from any ideas, methods, instructions or products referred to in the content. |
© 2024 by the authors. Licensee MDPI, Basel, Switzerland. This article is an open access article distributed under the terms and conditions of the Creative Commons Attribution (CC BY) license (http://creativecommons.org/licenses/by/4.0/).


