1. Introduction
In the last decade, the increase in world population and extreme weather conditions has caused a rise in energy demand. The growth in energy demand results in increased production of electrical energy from fossil fuels, contributing to the deteriorating global warming crisis [
1]. As a result, new policies related to decarbonization have been introduced by the global stakeholders to control and limit the worsening situation. The transition from conventional transportation means to electric vehicles (EVs) represents a significant step toward achieving the decarbonization goals for governments worldwide [
1,
2]. In addition, the penetration of grid-connected inverter (GCI) based renewable energy systems in the power system is increasing over time. Such increased integration results in reduced power system inertia that creates grid frequency management issues. The increased usage of grid-connected renewable energy systems, non-linear loads, and electrification of the transport sector results in non-sinusoidal grid conditions with harmonic injection and grid frequency deviations [
3,
4,
5,
6,
7]. The non-sinusoidal grid conditions can result in the transformer overheating, tripping of power system equipment, and non-reliable power measurement by the conventional power measurement method used in watt-hour meters [
6,
7,
8], and inefficient performance analysis of power electronics applications. For non-sinusoidal signals consisting of extra frequency components, component extraction is a critical part of achieving accurate power measurement and performance analysis. Therefore, it is necessary to extract frequency components accurately [
9,
10,
11].
Digital power measurement methods are becoming famous these days. This type of method records the samples of voltage and current and then calculates the instantaneous power in the time domain. It provides real-time measurement, stores big sizes of data, and is highly protected from tempering. Despite all the advantages of electronic power measurement methods, it is not suitable for measuring the power of a signal having harmonics and frequency fluctuations because of the error in zero-crossing detection which leads to inaccurate power measurement results [
12,
13,
14,
15]. In addition, it struggles to distinguish between different frequency components such as fundamental, harmonics, noise, and interharmonics. Ref [
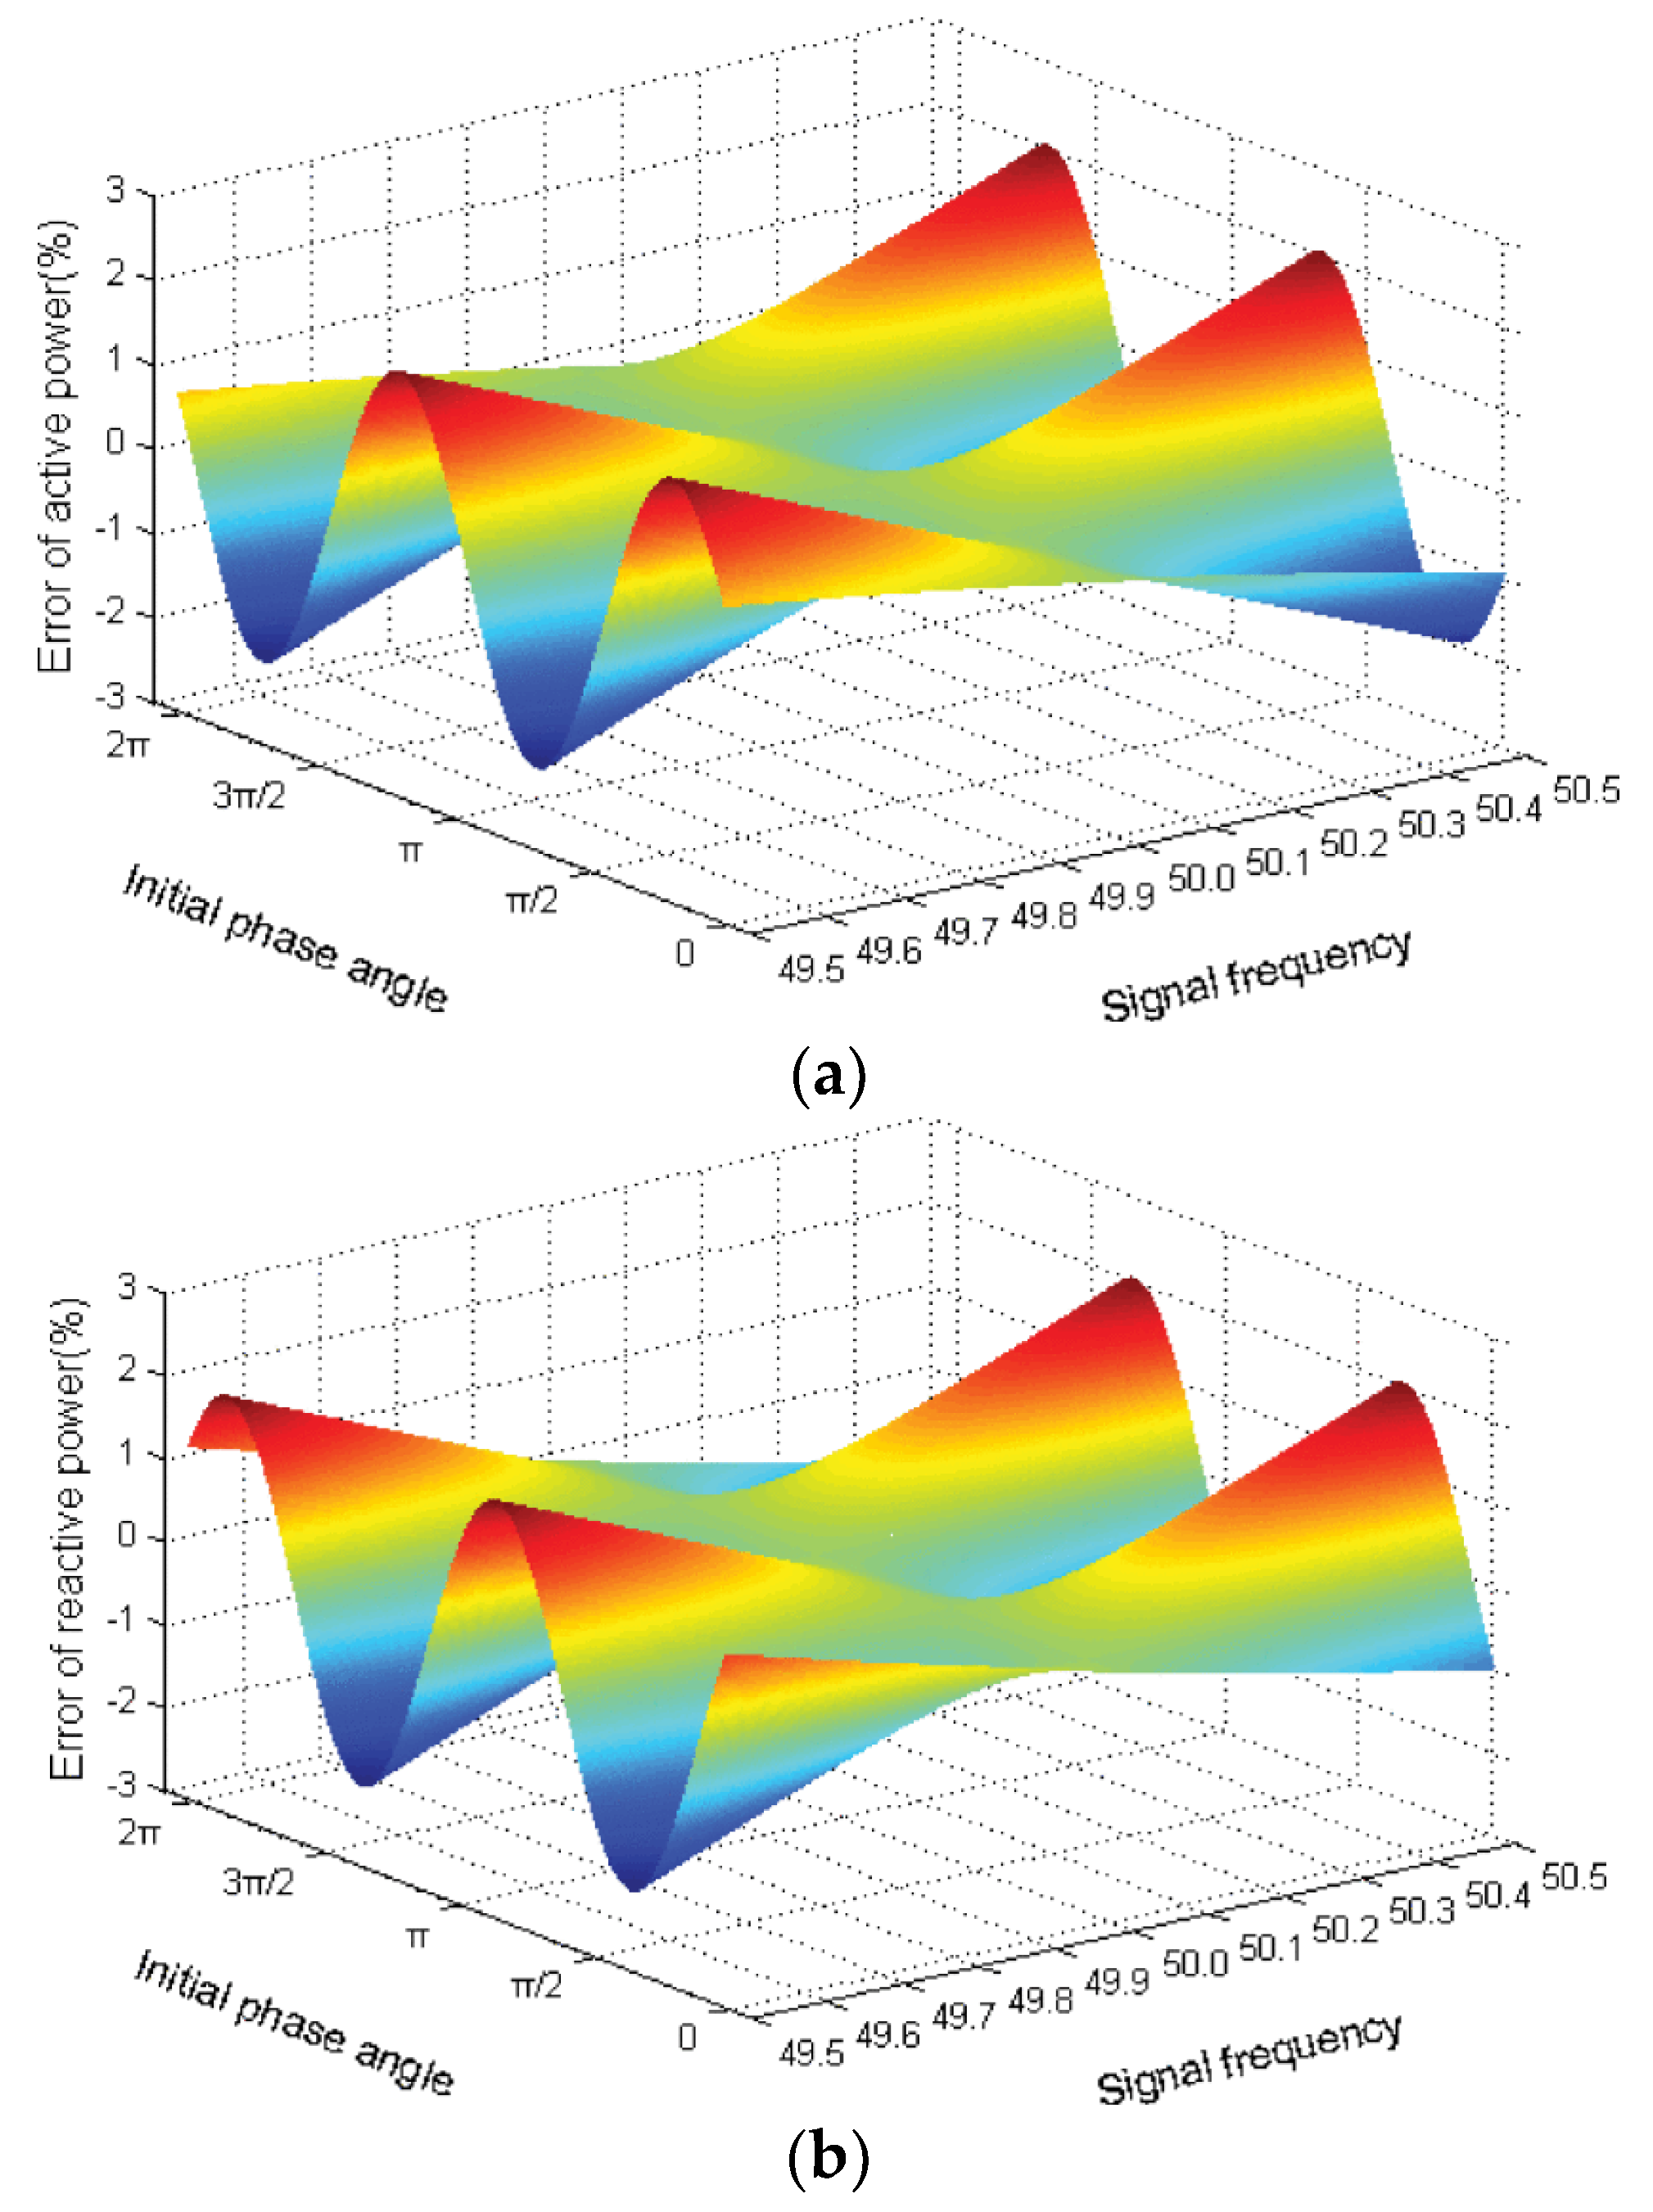
16] presents error analysis for digital input electricity meters, which utilize a time-domain approach for power measurement by taking the integration of input signal over time, which demonstrates a maximum power measurement error of 2% for a frequency offset of ± 0.5Hz shown in
Figure 1.
Fast Fourier transform (FFT) is another widely used method for the extraction of frequency components and using the extracted components for power calculation. The FFT method is very accurate when applied under the conditions of synchronous sampling [
3,
9]. However, the fundamental frequency deviation and introduction of harmonics make it difficult to maintain synchronous sampling in real-world applications. This results in inaccurate measurement due to the picket fencing and spectral leakage effects [
17,
18,
19].
The literature introduced windowed FFT (WFFT) to reduce the effect of spectral leakage. In WFFT, different window functions are multiplied by the input signal followed by FFT calculation. The ideal window should have a low main lobe width and high roll-off for the side lobes to attain higher attenuation and better frequency resolution. There are different types of windows such as Hanning, Hamming, Blackman window, triangular self-convolution window, etc. Although the use of WFFT improves the measurement results; the accuracy is still low as the ideal window cannot be selected because of the trade between the main lobe width and the side lobe attenuation [
18,
19].
Another solution proposed in the literature is the combined use of spectral correction technique and window function to reduce the effect of picket fencing and spectral leakage known as windowed interpolated FFT (WIFFT). In this method, the window function is applied to get the FFT result and then the spectral lines (double-spectrum-line or triple-spectrum-line) with maximum amplitude in the WFFT result are used to calculate the correction factors for the amplitude, frequency, and phase. WIFFT contains higher measurement accuracy as compared to the WFFT. However, WIFFT still has limitations if the frequency change is very fast, in that case, the result is inaccurate, and the use of window function with higher-order combined windows requires to solve the complex equations. As the power system is subject to frequency deviation and harmonic injection, these limitations cause non-reliable power measurements using FFT-based methods [
19,
20,
21].
Digital Lock-in Amplifier (DLIA) is another method used to calculate power by extracting the voltage and current components for different frequencies. It has better performance in terms of component extraction as compared to the FFT [
22,
23,
24,
25]. In addition, the conventional DLIA has less computational burden as compared to FFT, as FFT works for a large range of evenly distributed frequency components and mostly requires complex window functions and interpolation.
Table 1. shows the comparison of the computational burden of FFT and conventional DLIA for (N=10,000) [
26]. However, DLIA has a limitation, under the condition of frequency deviation the measurement results become inaccurate [
22,
23,
24,
25].
The literature demonstrates that many power measurement methods utilize feedback loops such as Frequency Locked Loop (FLL) and Phase Locked Loop (PLL) for tracking and synchronization purposes. The PLL methods include park transformation-based PLL and SOGI-PLL. The PLL-based method performs better around nominal grid frequency and for higher-order harmonics. However, the performance degrades for input signals with DC offset and low-order harmonics [
27]. The FLL has more advantages as compared to PLL including the absence of a voltage control oscillator, which leads to reduced computational burden. However, it is observed that its performance deteriorates in the presence of disturbances such as DC offset and high total harmonic distortion (THD) [
28]. A second-order generalized integrator-based FLL (SOGI-FLL) is introduced with an offset estimation and rejection loop [
29]. However, it has the limitation that slightly wrong offset estimation results in measurement errors. Two more FLL-based methods, multiple adaptive vectorial filter-based FLL (MAVF-FLL) and reduced order generalized integrator-based FLL (ROGI-FLL), are proposed for frequency tracking. These methods are susceptible to DC offset and distorted input signals.
A prefilter-based frequency and phase estimation is proposed in ref [
30], which relies on an additional frequency estimation technique to provide frequency information to be used by the prefilter. This additional loop resulted in increased complexity and computational burden. Similarly, ref [
31] proposed a multi-circular limit cycle oscillator (multi-CLO-FLL). It also requires a prefilter to gain harmonic suppression ability. The currently available synchronization techniques face limitations and performance deterioration in an environment with disturbances such as DC offset and high THD. The solutions proposed to reject DC offset and suppress harmonics resulted in increased complexity and computational burden. Hence, there is a necessity to develop a power measurement method to overcome the limitations of conventional power measurement methods and give accurate results for the condition with frequency dynamics and harmonics.
This article proposes a novel frequency component extraction and three-phase power measurement method based on DLIAs and Digital Lock-in Amplifier Frequency-Locked Loop (DLIA-FLL) with combined filter to get accurate power measurement results for signals with harmonics and frequency fluctuations. The DLIA-FLL tracks the fundamental frequency of the input signal followed by the generation of reference signals using tracked frequency. The DLIA uses the generated reference signals to extract the accurate amplitude and phase information for the fundamental and harmonic frequency components from the input voltage and current signals. These extracted parameters give accurate measurement results for electrical power parameters.
2. Proposed Frequency Component Extraction and Power Monitoring Method by Using DLIA and DLIA-FLL
The proposed component extraction method uses DLIA to extract the magnitude and phase information accurately for the fundamental and harmonic components present in the input signal. However, under the condition of frequency variation, the accuracy of DLIA decreases because of the difference between the frequency of reference signal and input signal. To cope with this limitation the proposed DLIA-FLL tracks any change in the frequency of input signal and updates the reference signals to be used by the DLIA for the component extraction. There are n number of DLIAs for voltage and current each, where n is the number of frequency components to be extracted.
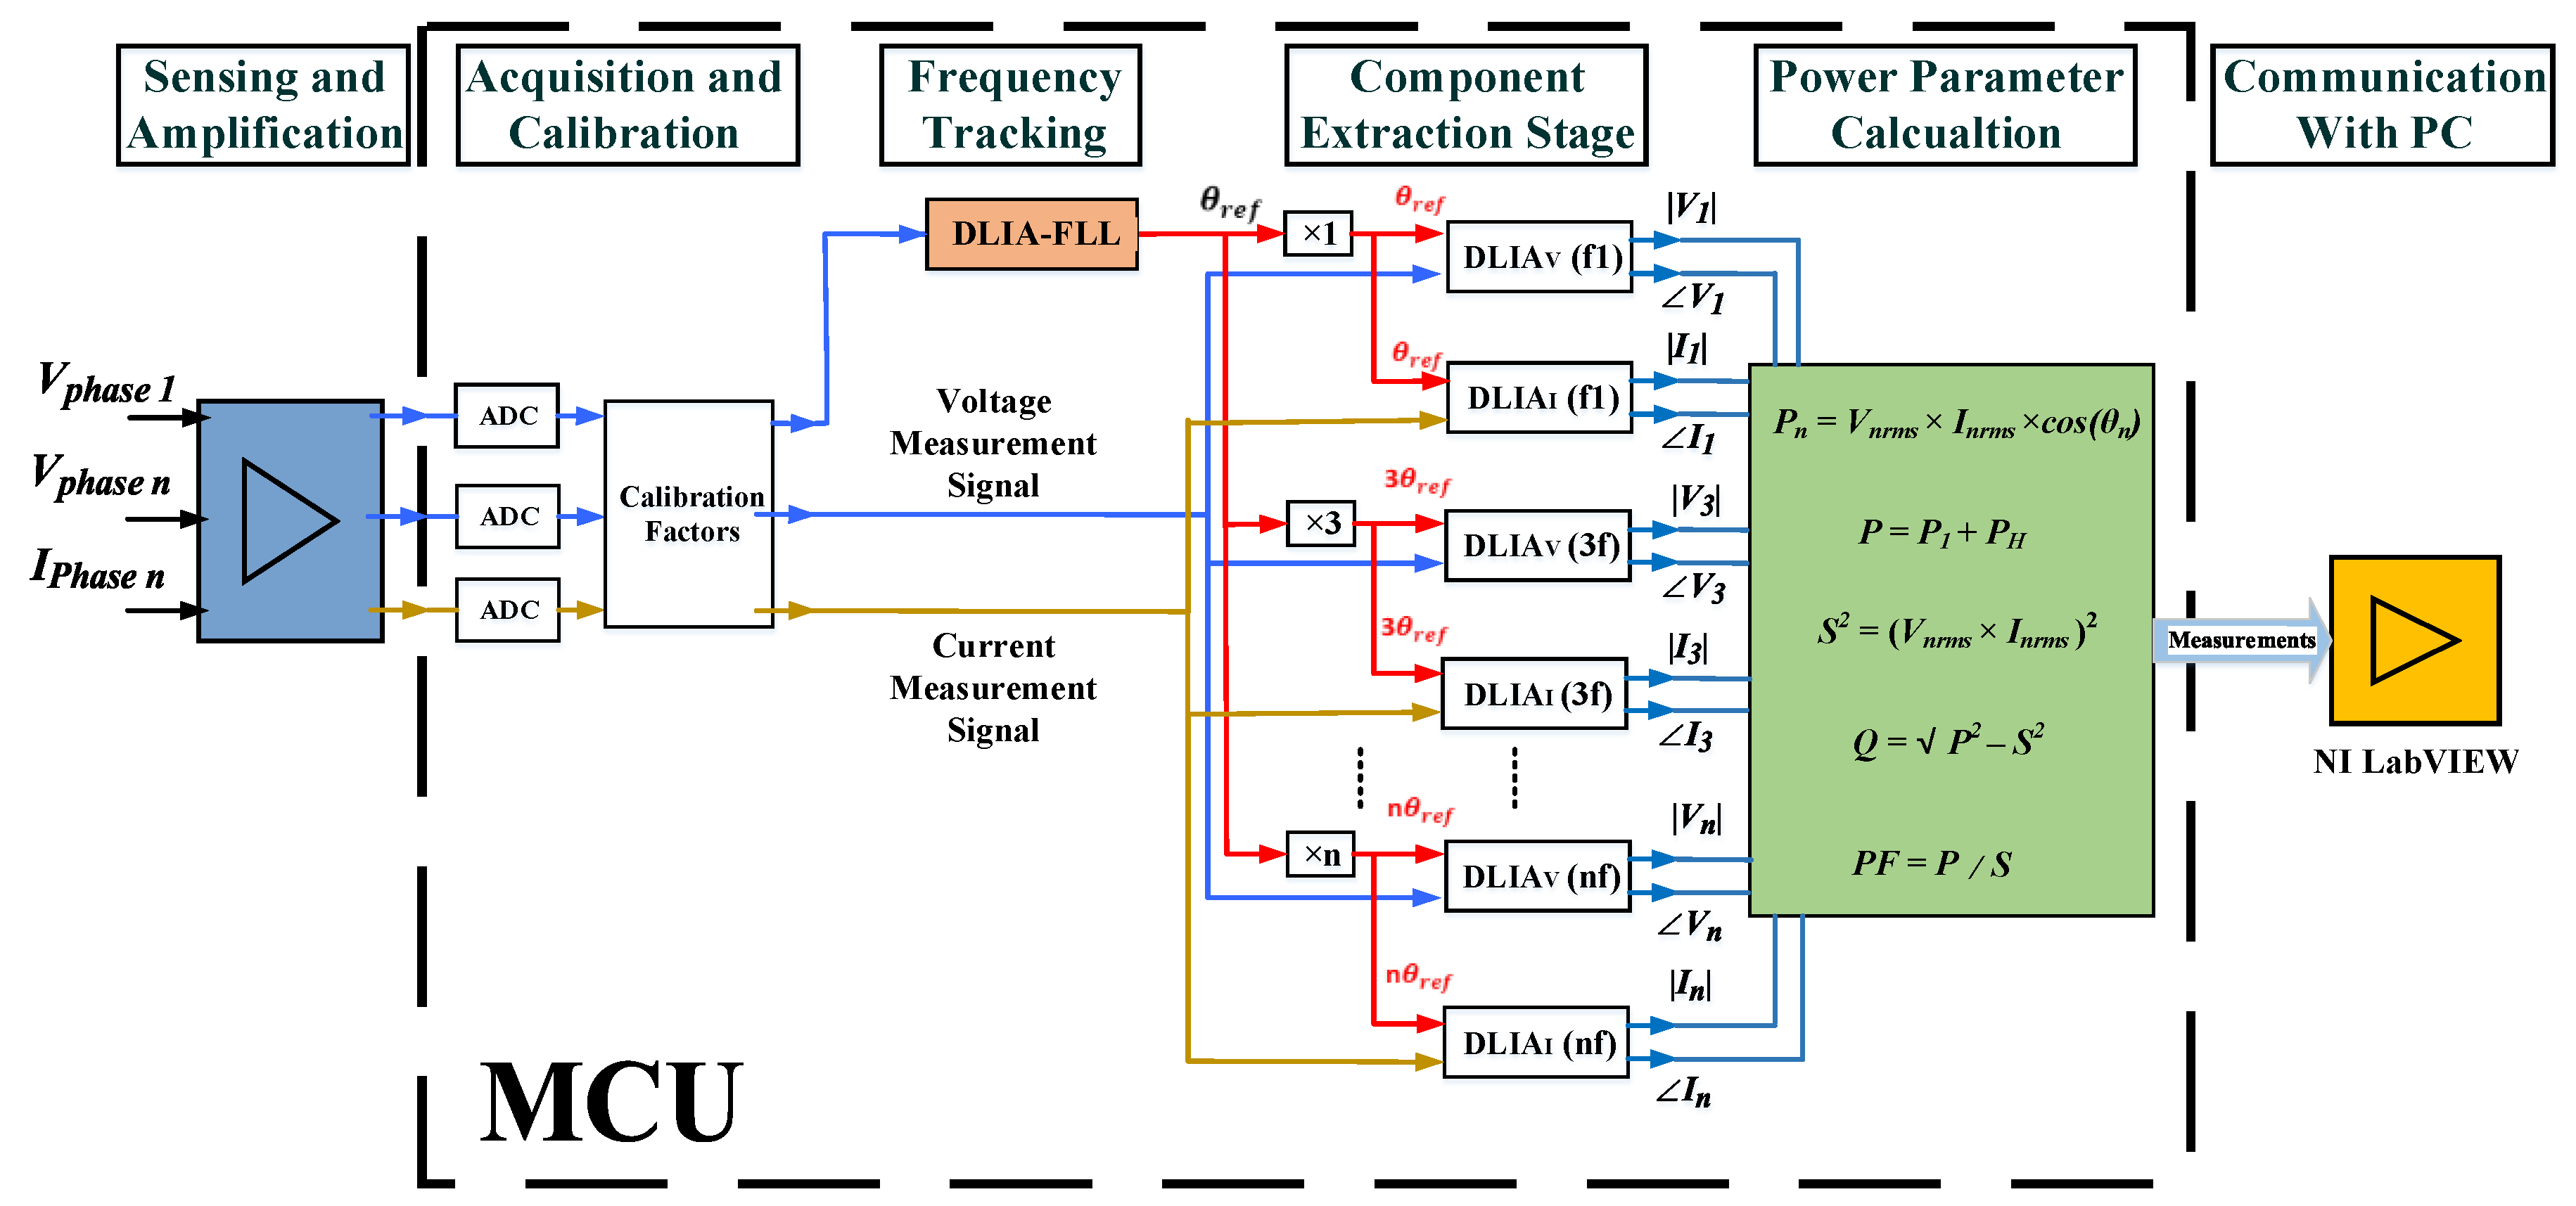
Figure 2. shows the block diagram of complete architecture of the proposed power measurement method with DLIA and DLIA-FLL.
The voltage measurement signal that comes from the sensing and amplification stage, through ADC of the MCU, acts as the input for the proposed DLIA-FLL, which utilizes this input to track the fundamental frequency. In the next stage, these tracked frequency and measurement signals (voltage and current) that come from sensing and amplification stage, through ADCs of the MCU, act as the inputs for the DLIAs (DLIA1 - DLIAn), which utilize these inputs to extract the fundamental and harmonic frequency components. The extracted information of frequency components is represented in terms of magnitude and phase, which is further utilized to calculate the rms voltage, rms current, real power, reactive power, apparent power, phase difference, and power factor. In the final stage, the measurement results for voltage, current, frequency, and power are transferred to the PC (NI LabVIEW) through UART-Serial communication protocol.
Further explanation on the working principle of each component of the proposed power measurement method is given in sub-sections below.
2.1. Digital Lock-in Amplfier Working Principle
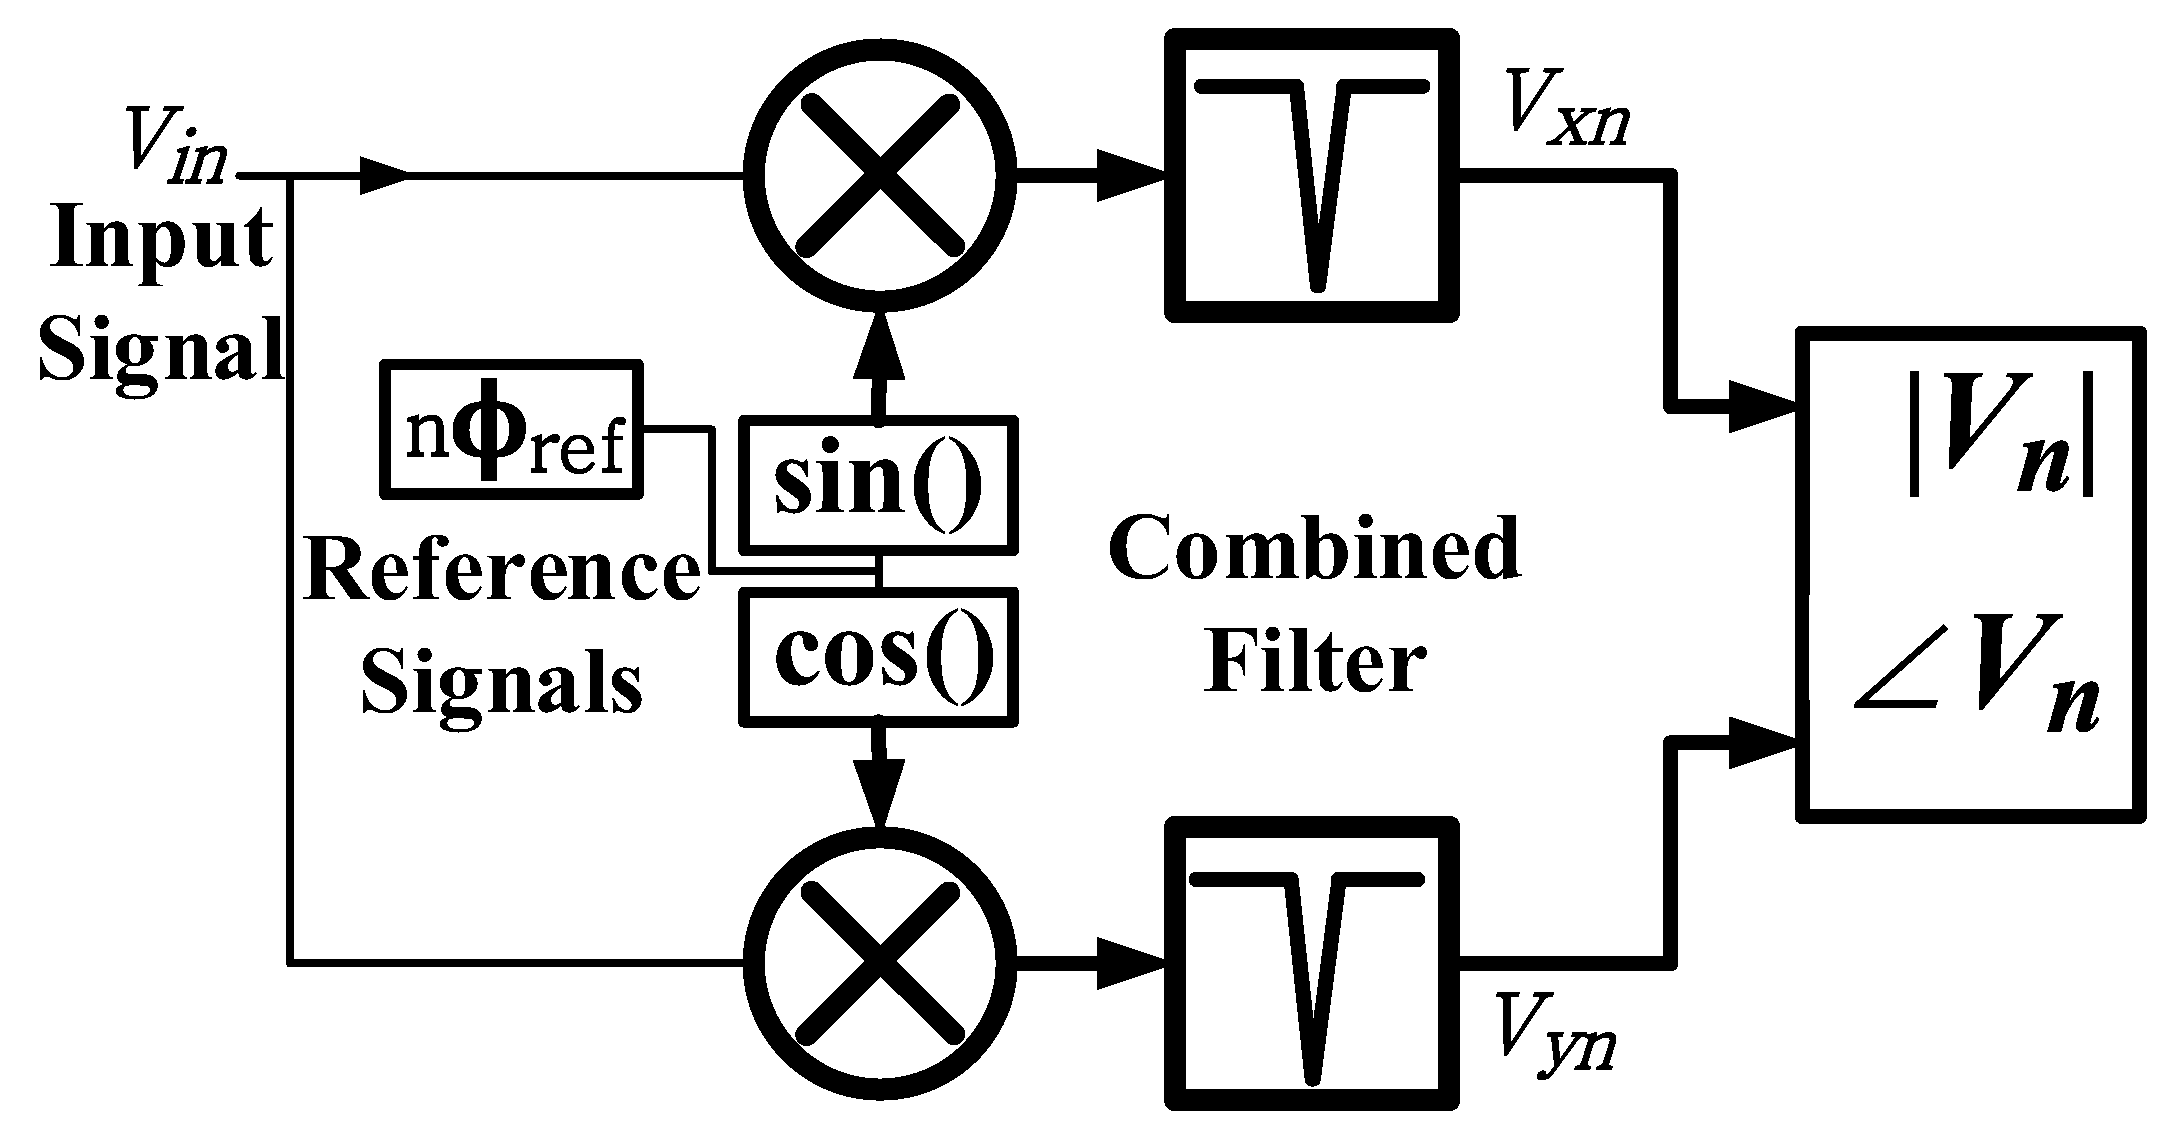
DLIA contains three sections, Phase Sensitive Detector (PSD), Combined Filter (CF), Phase and Amplitude extraction.
Figure 3. shows the block diagram for DLIA.
In PSD the input signal is multiplied by the reference sine and cosine signals with a frequency the same as the frequency of the input signal to perform dual modulation Lock-in. Equation (1) shows the input voltage signal with fundamental and
n odd harmonics.
where
is the peak amplitude of the fundamental component,
is the amplitude ratio of the nth harmonic with the amplitude of the fundamental component,
is the frequency of the fundamental component, and
is the phase information of the fundamental component (0,120,240 degrees) for the three-phase system.
Equation (2) shows the reference signals for DLIA. Where
k defines the harmonic order of the reference signal,
is the frequency of the reference signal, and
is the phase information of the reference signal.
The dual-modulation Lock-in results in two signals,
and
by using the trigonometric identity. Equation (3) and (4) shows the simplified expression for
and
. These signals contain the amplitude of the concerned frequency component from the input signal at DC (0 Hz) and at twice the frequency of the concerned frequency component (120 Hz in this case) from the input signal.
The combination of single order low pass filter and the second-order notch filter is employed to extract the DC component from the and .
Equation (5) shows the transfer function for the combined filter. Where
and
is the cut-off frequency and order of low pass filter respectively.
is the natural frequency for notch filter.
and
are damping factor selected according to the condition (
≪
).
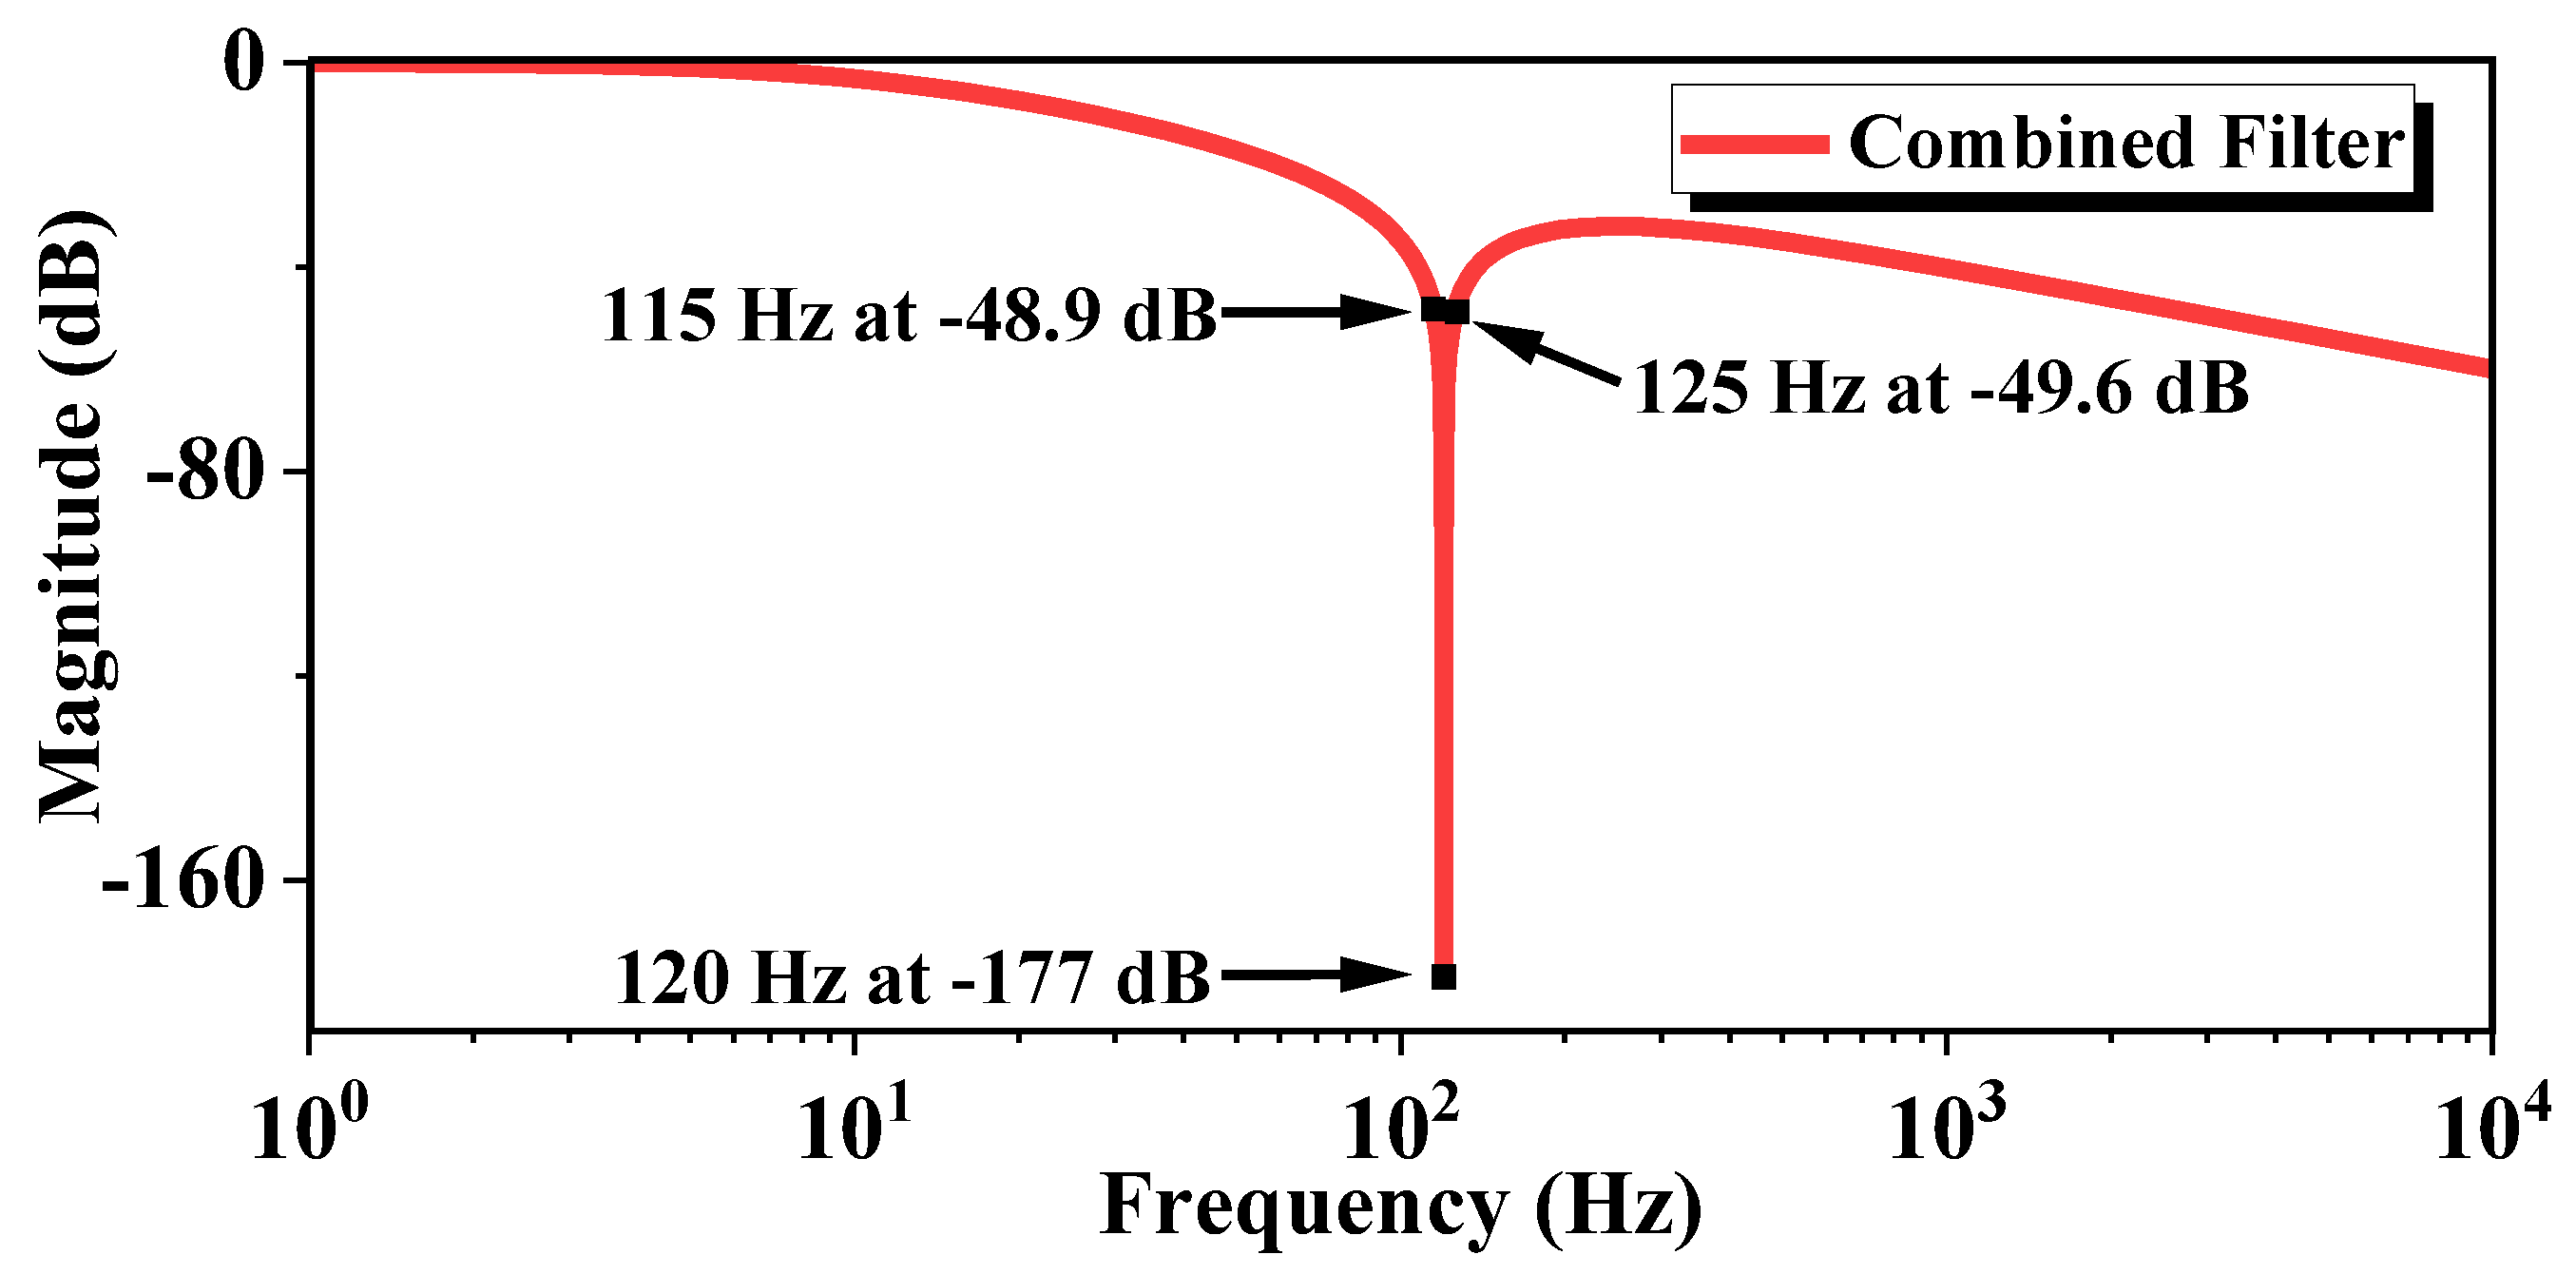
The natural frequency of the notch filter is selected (120 Hz) as the lowest frequency component to be attenuated is twice the grid frequency. To attenuate the higher order frequency components single-order (
k =1) low pass filter with cut-off frequency (
= 10 Hz) is employed.
Figure 4. shows the bode plot for the designed combined filter.
The application of the notch filter allowed the elimination of the lowest frequency component. As a result, a lowpass filter with reduced order and high cut-off frequency can be used. This proposed combined filter with low order and high cut-off leads to less computational burden and faster filter response [
26]. It is important because computational burden is a critical factor in effective practical implementation of measurement method.
Equation (6) and (7) shows the signals at the output of the combined filters. These signals contain just DC component and 120 Hz. The other higher frequency components are attenuated.
In the last section of DLIA, the output signal of the combined filter section is used to calculate the amplitude and phase information of the desired frequency component. Equation (8) and (9) are used to calculate the amplitude and phase for the desired frequency component.
2.2. Digital Lock-in Amplfier Frequency-Locked Loop (DLIA-FLL)
The main objective of the proposed DLIA-FLL is to track the change in the grid-frequency to provide correct frequency
and phase
. This frequency and phase information is used to generate the correct reference signals for the DLIA to provide accurate extraction.
Figure 5. shows the block diagram for the proposed DLIA-FLL.
The working principle of the DLIA-FLL is defined as the DLIA provides the phase output
using the output of the combined filter section shown in (10) that is further simplified to get (11).
Equation (12) is used to find the difference in the frequency
by taking the derivative of phase
with respect to time.
The resultant difference in frequency is passed through a PI controller which provides the updated difference in frequency ∆f. This difference in frequency is added into the grid frequency (60 Hz in this case) to get tracked grid frequency
as shown in (13).
Equation (14) is used to calculate the phase of FLL which is then used to update the reference signals of DLIA.
2.3. Component Extraction and Power Measurement by Proposed DLIA-FLL
As explained in the above sections, the DLIA-FLL tracks the grid-frequency and uses this information to update the reference signals for the DLIAs used in component extraction. The number of DLIAs are equal to the number of frequency components (DLIA1-DLIAn). These DLIAs extract the accurate amplitude and phase information for all the frequency components (fundamental and harmonics) input signals. The amplitude and phase for voltages and currents are used to calculate the real power, reactive power, apparent power, and power factor for each phase.
Equation (15) to (20) are used to estimate the power and power factor for non-sinusoidal conditions according to the standard formulas defined by IEEE Std 1459-2010 [
32]. The power measurement results obtained by the proposed method are then transmitted from microcontroller unit (MCU) to the LabVIEW interface using UART communication to display the power measurement results.
3. Experimental Implementation and Results
To validate the efficiency and accuracy of the proposed method, a three-phase power measurement experiment is carried out for 25% THD condition and an input signal with two different fundamental frequencies (60 Hz, and 61.5 Hz). The experimental results of the proposed method are compared with the results obtained from ZERA COM3003 and WIFFT (classical power measurement method). The below sections discuss the experimental setup and the results obtained from the power measurement experiment.
3.1. Experimental Setup and Configuration
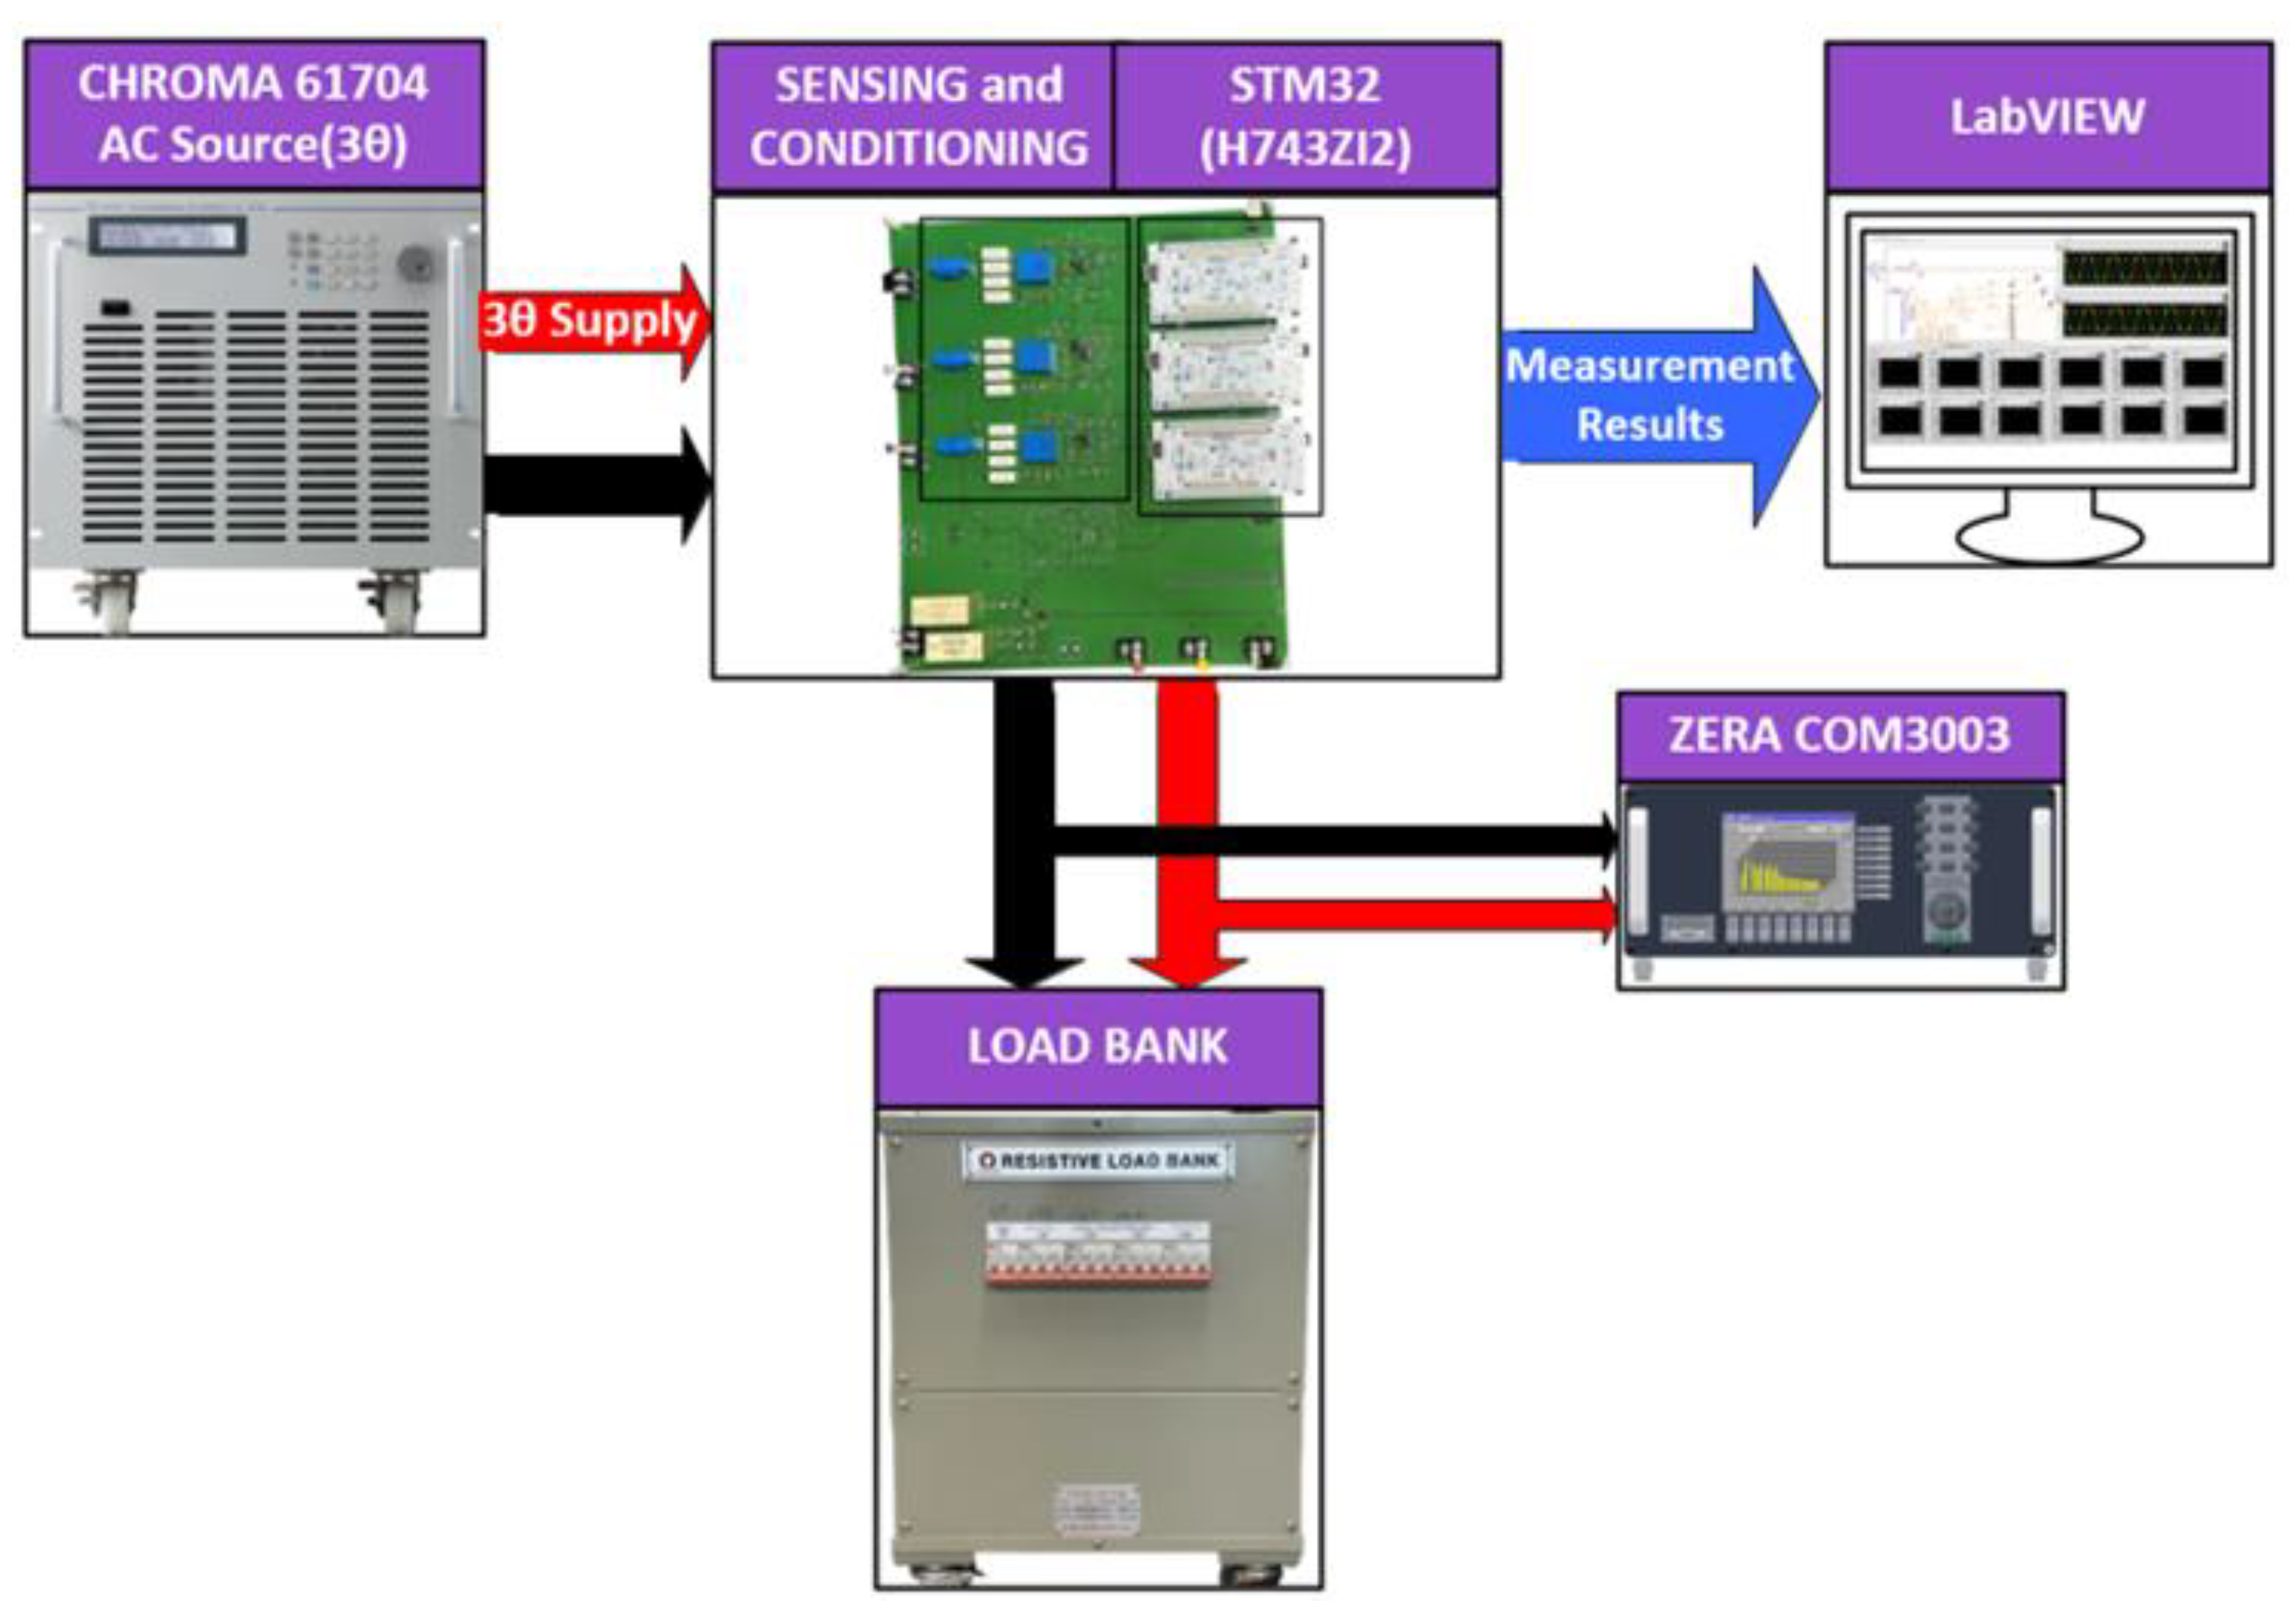
The experimental setup and configuration used for the power measurement experiment is shown in
Figure 6. The programmable AC source (Chroma 61704) is configured for the voltage (220 V per phase), current (4.48 A per phase), frequency (60 Hz, and 61.5 Hz), and harmonic profile for 25% THD.
After configuration, the output of the three-phase AC supply is connected to the input of the sensing and amplification circuit on the designed PCB. The developed sensor interface circuitry is based on LV 25-P for voltage sensing and LAH 50-P for current sensing. A 1.5V DC offset is added to the bi-polar measurement signals of voltage and current sensors to convert the signal into uni-polar form. The sensors are calibrated before the power measurement to remove the sensing and amplification stage error to the maximum. The temperature trends for sensors and sensor resistors are recorded, which leads to the selection of a consistent temperature (44 degrees Celsius for sensors and 40 degrees Celsius for sensing resistors) to avoid temperature-related drift in sensor performance during the experimentation.
The output of the sensing and amplification circuit is a unipolar voltage signal transmitted to the analog-to-digital converter (ADC) of the STM32 MCU. There are three MCUs based on the (H743ZIT6U) ARM Cortex-M7 digital signal processor. The MCU features an operating clock frequency of 480MHz, 16-bit ADC, 2MB of flash, and 1MB of RAM [
33]. In addition, it offers a wide range of peripherals including UART, SPI, I2C, and USB which makes it a suitable MCU for applications involving complex operations.
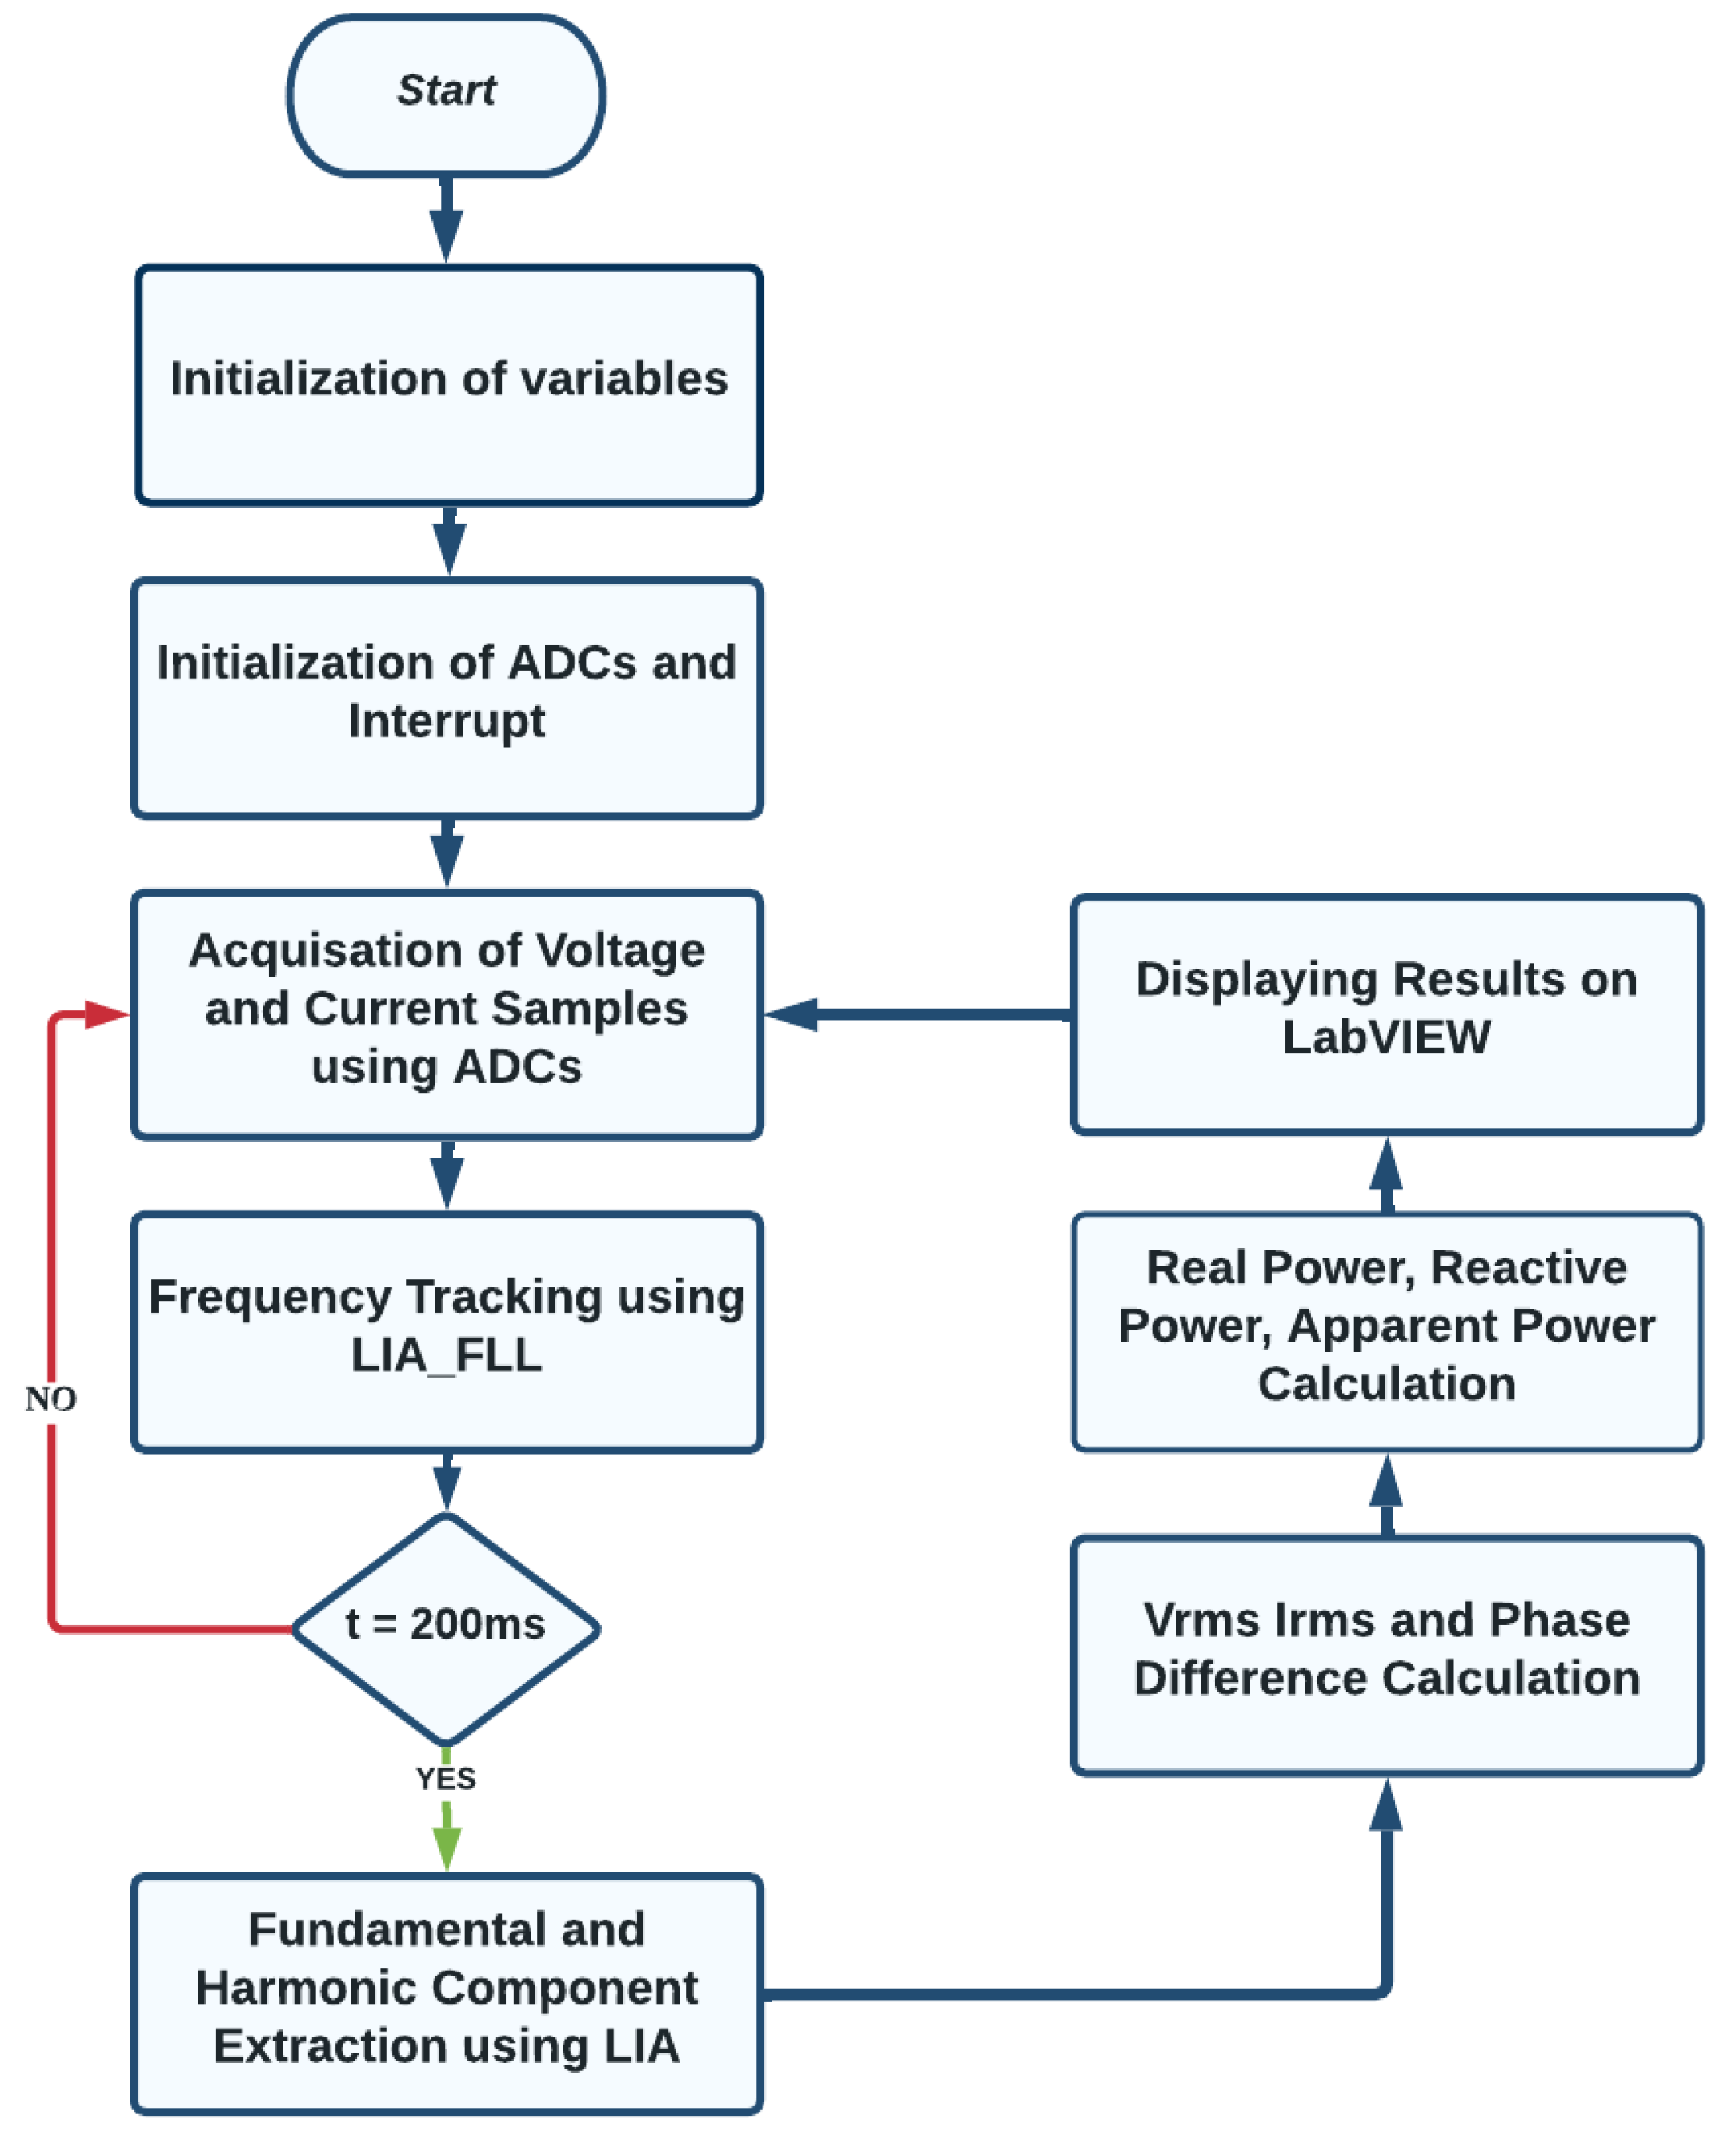
Each STM32 MCU has an algorithm based on the DLIA and DLIA-FLL for precise three-phase power measurement and frequency tracking. The input capture feature of the timer configuration in STM32 MCU is utilized to read external clock signal that helps to synchronize the interrupt generation and ADC acquisition of all the MCUs.
Figure 7. shows the flow chart for the algorithm inside STM32 MCU. At the start, there is an initialization of variables, ADCs, and interrupts. The MCU1 acts as a master and generates a pulse signal at general purpose input output pin (GPIO), which is read by other two slave MCUs to maintain the synchronized operation of all three MCUs. Following that the ADCs start the acquisition of voltage and current signals coming from the sensing and amplification circuit. The DLIA-FLL part of the algorithm uses the acquired signal amplitude to track the frequency of the input signal. Phase-1 voltage is used as the source of DLIA-FLL for all three phases. This process continues until 200 ms is completed. After that, the component extraction algorithm based on DLIA uses the acquired signals and tracked frequency from DLIA-FLL to extract the amplitude and phase for the fundamental and harmonic components.
The extracted information is used to calculate the rms voltage, rms current, and phase difference. This calculation leads to the calculation of real power, reactive power, apparent power, and power factor. All these power measurement results are then transferred to the LabVIEW interface with the help of UART communication. The LabVIEW interface displays the measurement result for each phase to validate and compare the performance.
The three-phase output of the PCB is connected to the load bank and ZERA COM3003. The ZERA COM3003, a commercial reference power measurement instrument is also connected in parallel to the load. Power measurement is also performed with ZERA COM3003 under the same testing conditions of voltage, current, frequency, and THD. The measurement results from ZERA COM3003 are compared with the measurement results generated by the proposed method (DLIA and DLIA-FLL). The comparative analysis allows us to validate the accuracy and reliability of the proposed power measurement.
3.2. Frequency Tracking Results by the Proposed DLIA-FLL
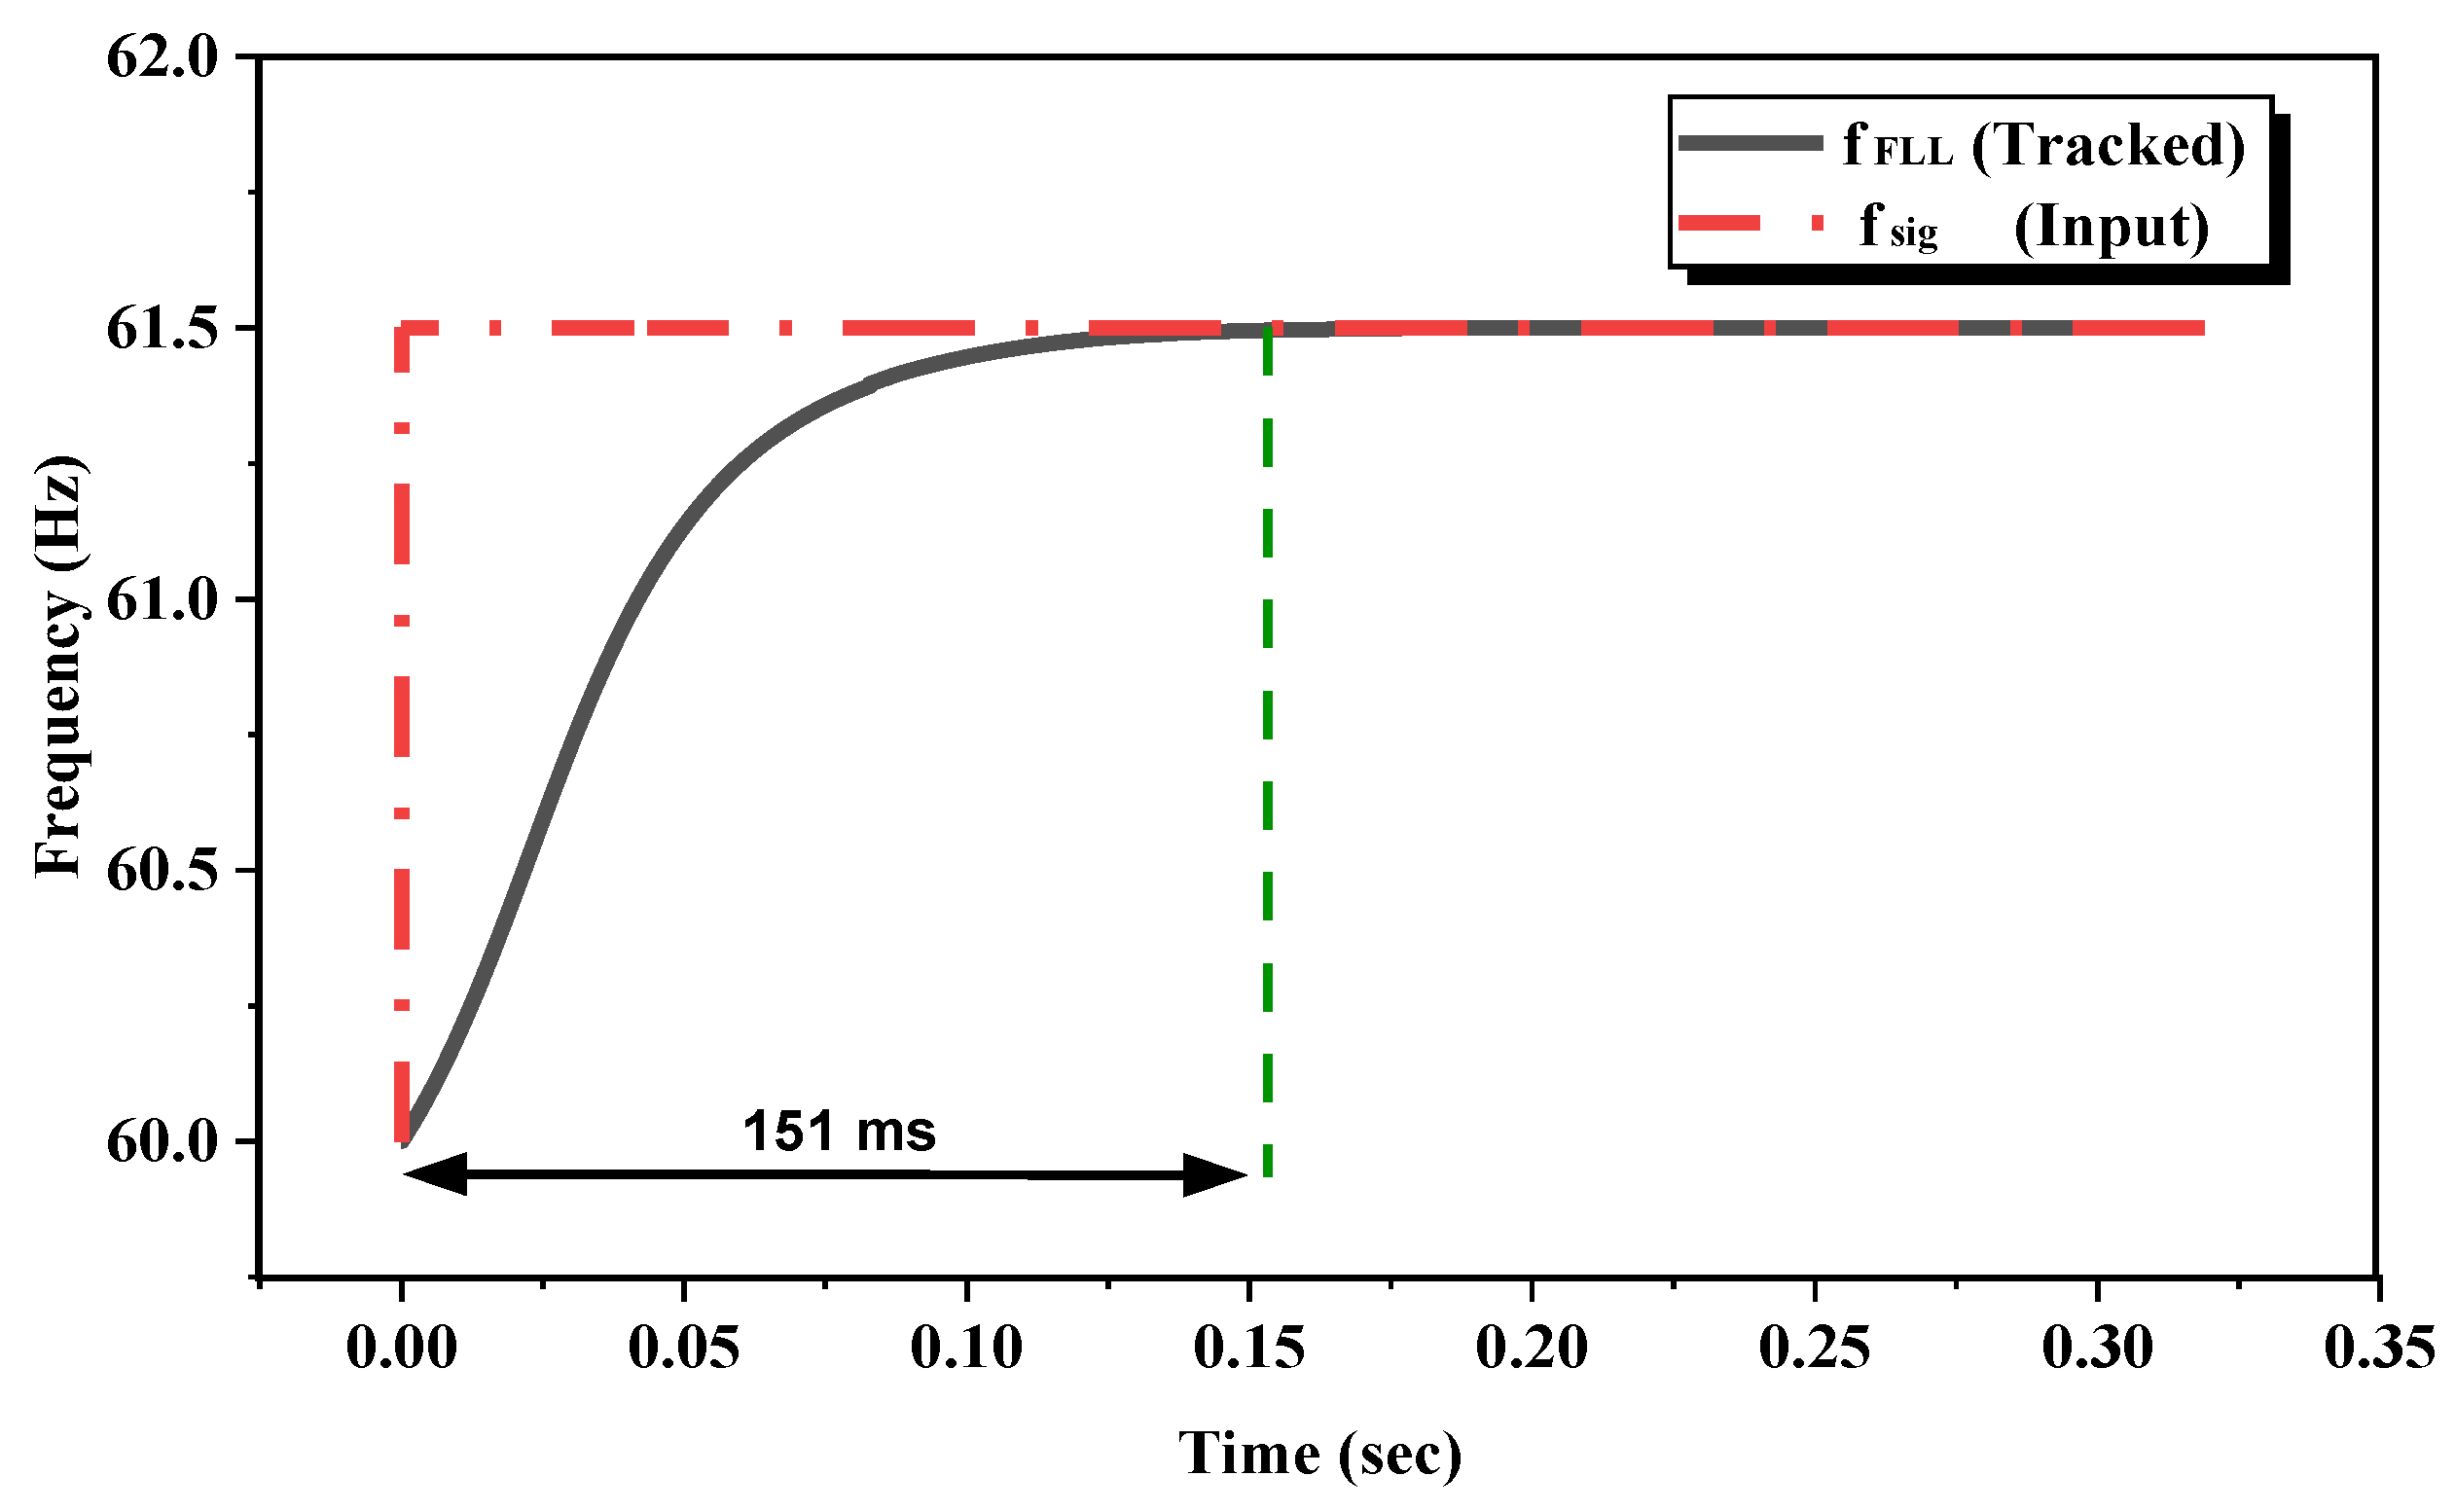
The performance of the proposed DLIA-FLL is presented in this section. The experimental setup defined before is used with a sampling frequency of 40.02 kHz with 25% THD. This experiment is performed with two different cases of input signal frequency. In case a, the frequency of the input signal is fixed at 60 Hz and in case b the frequency of the input signal is changed to 61.5 Hz. The deviation in the frequency is selected according to the frequency deviation standard of ±1.5 Hz defined by the Korea Electric Power Company (KEPCO) [
34]. The tracking results show that the developed DLIA-FLL algorithm inside the STM32 MCU tracks further frequency deviation in 151 ms.
Figure 8. shows the frequency tracking results for frequency deviation from which it works well.
3.3. Component Extraction and Power Measurement by The Proposed DLIA-FLL and ZERA COM3003
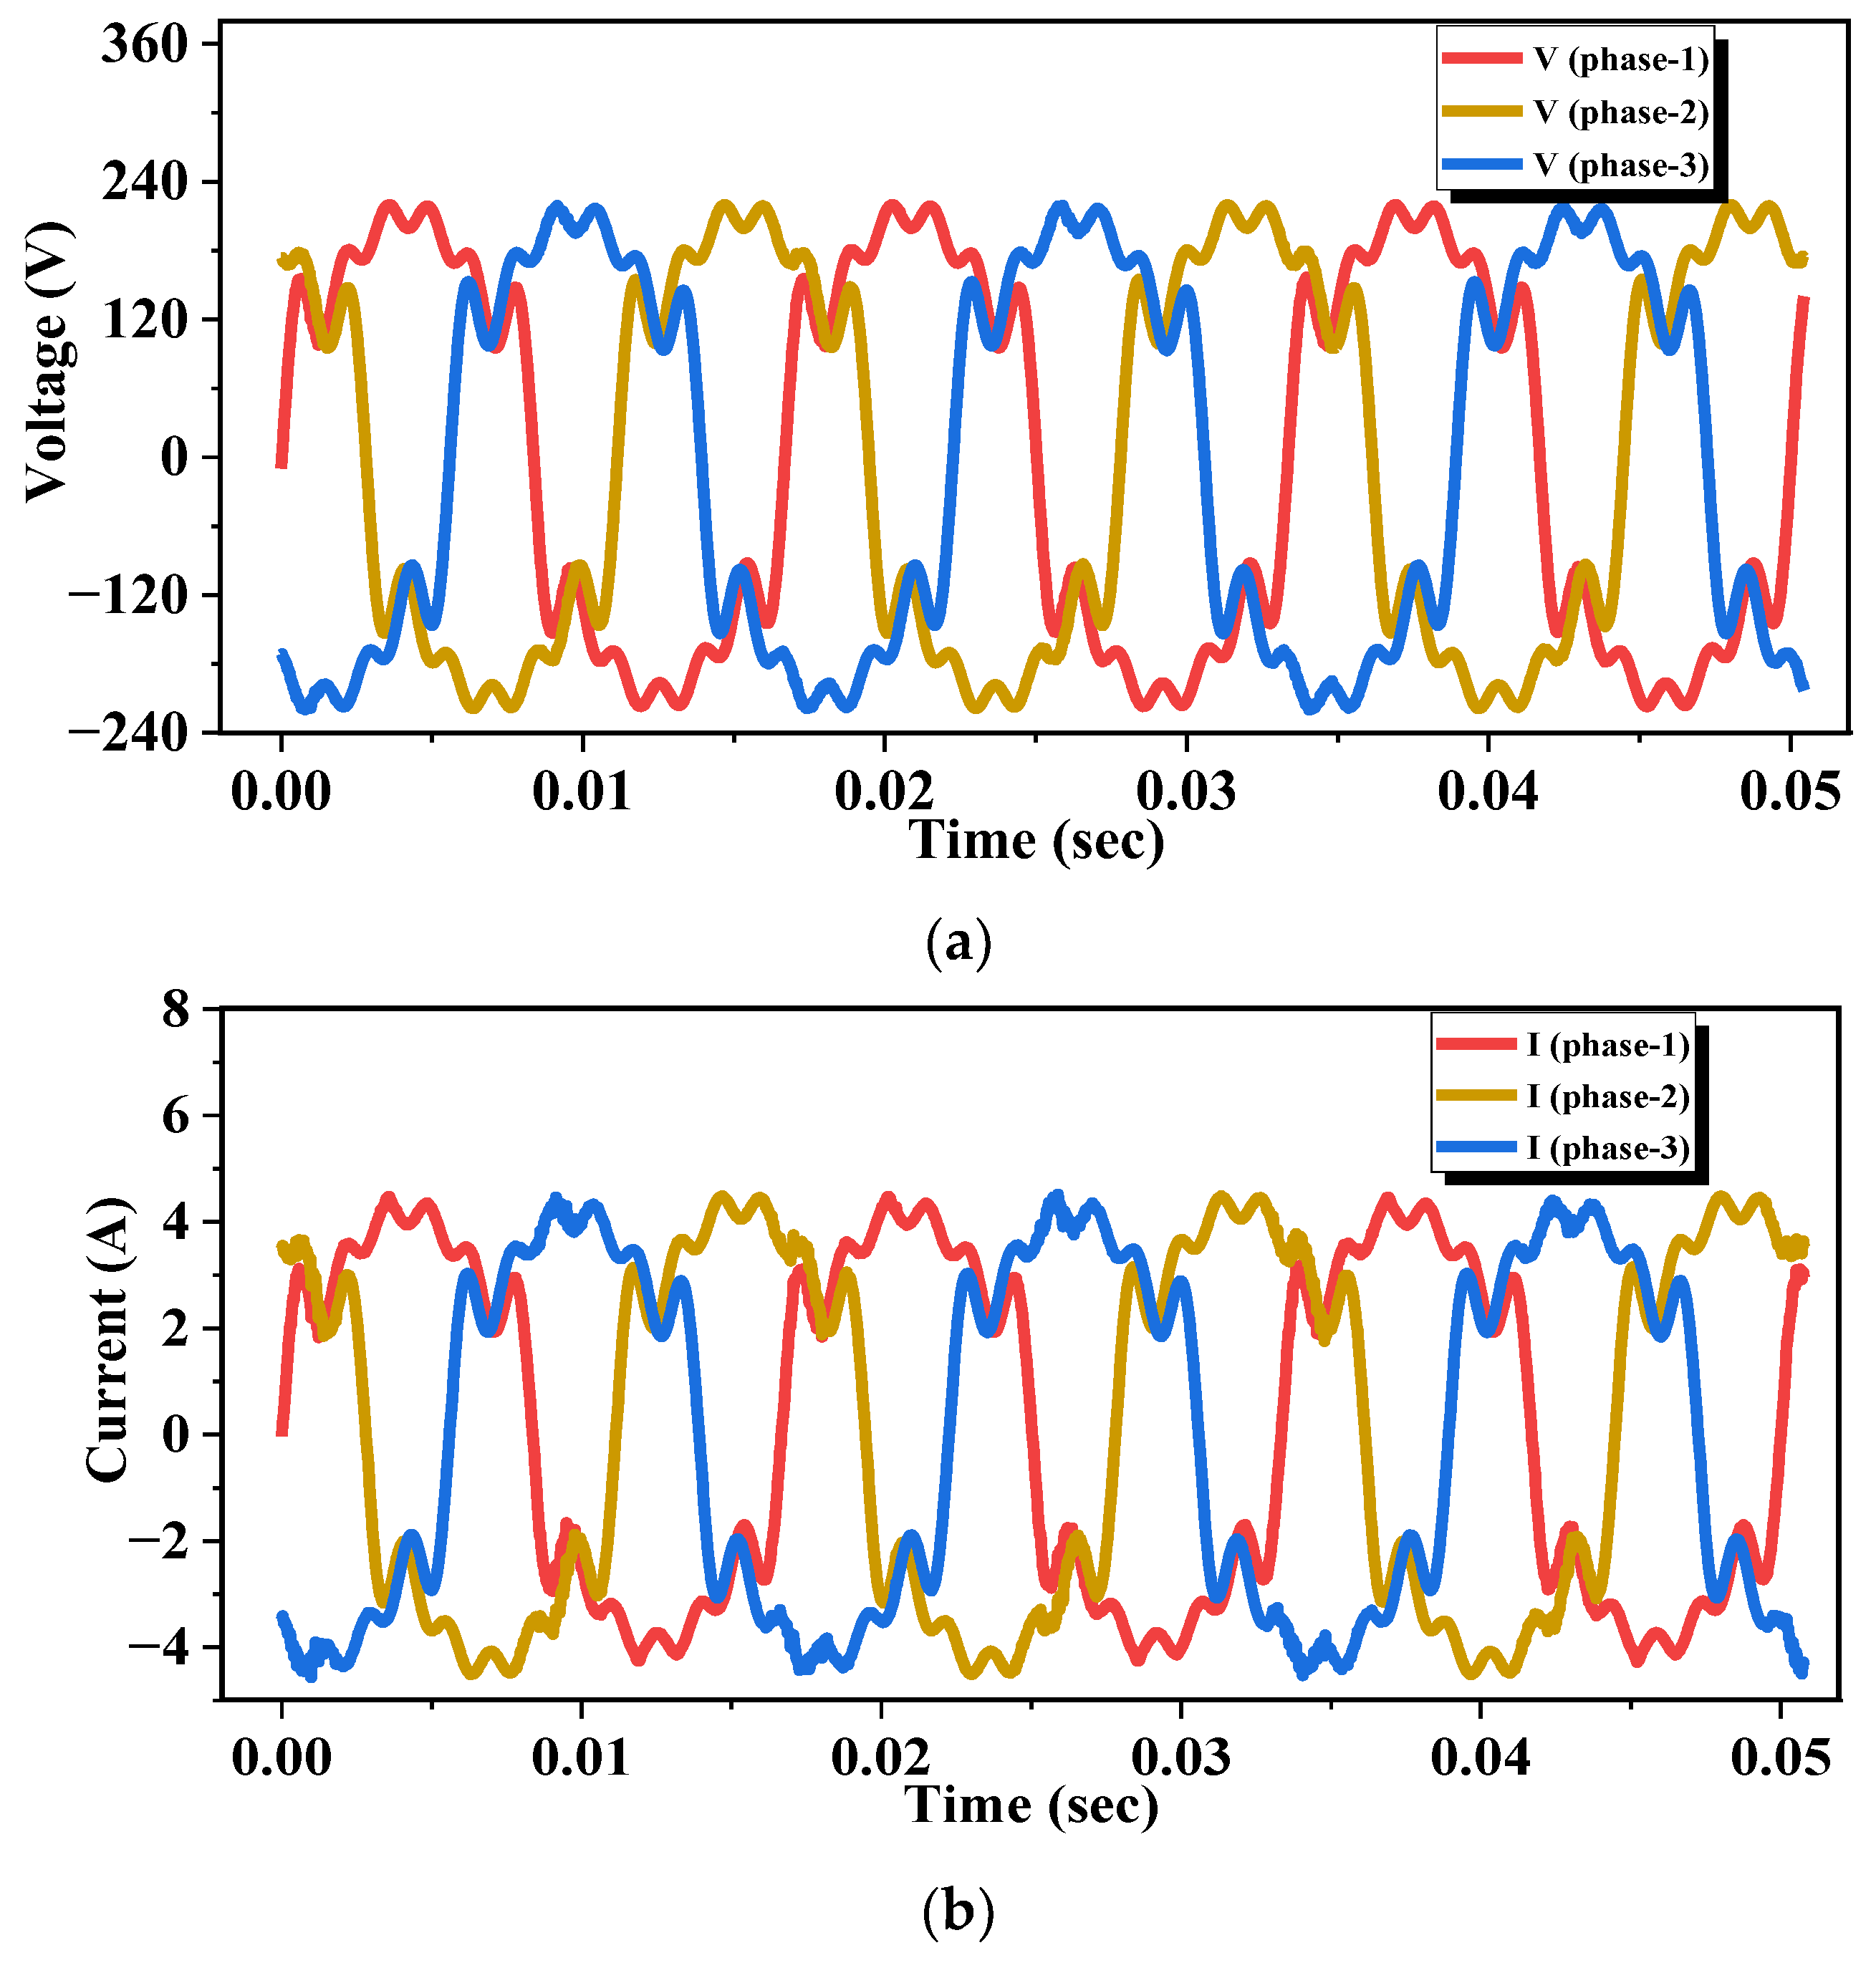
This section explains the power measurement experiment performed with ZERA COM3003 and the proposed three-phase component extraction and power measurement method using the experimental setup explained before. After the definition of voltage, current, frequency, and THD profile with 25% THD, the Chroma AC power supply is used to provide the three-phase supply to the load through the designed PCB. The input signal frequency is set to 60 Hz.
Figure 9. shows the three-phase voltage and current signals generated by chroma.
ZERA COM3003 is also connected to the system to perform the power measurement as well.
Table 2. shows the THD measurement for three-phase system voltage using ZERA COM3003 respectively. It verifies that the generated THD is according to the defined THD profile.
The proposed algorithm defined inside the STM32 MCU detects the voltage and current signals through the sensing and amplification circuit and performs the frequency tracking followed by component extraction and power calculation. The power measurement results are then sent to the LabVIEW interface through UART communication to display the results.
As explained earlier the ZERA COM3003 is connected to the experimental setup as the reference power measurement instrument. The comparative analysis is performed by calculating the percentage error by comparing the power measurement results obtained by the proposed DLIA-FLL to the power measurement results obtained by ZERA COM3003. The above-explained procedure is again repeated with the input signal frequency changed to 61.5 Hz under similar testing conditions of supply voltage, current, load, and THD.
Table 3 and
Table 4. show the comparative analysis results between the power measurement results obtained by the proposed DLIA-FLL and ZERA COM3003 for an input signal frequency of 60 Hz and 61.5 Hz respectively. The results show that the power measurement accuracy is ± 0.019% (accuracy class 0.02). The frequency tracking error under the frequency deviation is ± 0.005%.
3.4. Component Extraction and Power Measurement by WIFFT
Power measurement methods are generally based on different FFT methods. The WIFFT is a proposed method in recent literature to reduce the effect of picket-fencing and spectral leakage. The power measurement experiment is performed under the same testing conditions of voltage, current, load, and 25% THD. The input signal frequency is set to 60 Hz first and then changed to 61.5 Hz for the second measurement.
The WIFFT algorithm (with 1 Hz resolution) is defined in the MCU, which receives the voltage and current signals through a sensing and amplification circuit. WIFFT first calculates the WFFT and then uses the two spectral points with maximum amplitude to get the correction factors which are applied to get the amplitude, phase, and frequency of the voltage and current signal. These parameters lead to power calculation. The power measurement results are again sent to the same LabVIEW interface using UART communication to display the power measurement results.
Table 5 and
Table 6. show the percentage error obtained by comparing the power measurement results obtained by WIFFT with the results obtained by ZERA COM3003. The results show that the power measurement error under the deviation is 0.051% and the frequency tracking error under the frequency deviation is ± 0.013%.
The comparison shows that for an input signal frequency of 60 Hz the proposed method has better performance as compared to WIFFT. However, under the condition of frequency deviation (61.5 Hz), the proposed method has much better performance (0.019%) as compared to WIFFT (0.051%). The reason for the deterioration in the performance of WIFFT is the fact that the 61.5 Hz causes the spectral leakage as the resolution is set to 1Hz with the (1 sec) data set, the resolution is non-integer multiple of input frequency, which results in incorrect results despite the window function and interpolation.
In case the frequency resolution observes variation the magnitude percentage error for WIFFT varies and follows the principle that if the resolution is an integer multiple of the input signal frequency, the resultant error is minimum and incase of non-integer multiple the error will be maximum. In between these two extreme conditions the magnitude of error will depend upon the degree of farness from integer multiple.
The results discussed above show that under the condition of frequency deviation and high THD, the proposed component extraction and three-phase power measurement method based on DLIA and DLIA-FLL has good performance under the frequency deviation ± 1.5 Hz and 25% THD. Though the proposed method is less accurate compared to the reference standard ZERA COM3003. However, this method is being developed for KEPCO to provide a cost-effective alternative compared to high-end power measurement devices with enough accuracy for applications such as inspection and performance analysis of devices such as wattmeter, inverters, and motor drives, for different conditions of frequency and THD focusing on power measurement and power quality.
4. Conclusions
In this article, a novel frequency component extraction method based on DLIA and DLIA-FLL, implemented inside the STM32 MCU, is proposed to get accurate component extraction and power measurement results under the conditions of harmonics and frequency fluctuations. The proposed DLIA-FLL tracks the frequency deviation of the input signal and provides the updated frequency which leads to the generation of reference signals for DLIA. The DLIA uses these updated reference signals to extract the amplitude and phase information from the input voltage and current signals. The introduction of a combined filter leads to a lower computational burden, which means less sampling frequency and faster computation. The extracted information leads to the calculation of real power, reactive power, apparent power, and power factor for each phase.
The validity and effectiveness of the proposed method are verified by conducting a power measurement experiment under the condition of 25% THD and two different input signal’s fundamental frequencies (60 Hz and 61.5 Hz). The experimental setup consists of the PCB with sensing and amplification circuit and STM32 MCUs (containing proposed component extraction and measurement algorithm). The sensors are calibrated, and the temperature environment is kept consistent to mitigate any performance dynamics exhibited by sensing and conditioning circuit. The power measurement results are sent from MCUs to the LabVIEW interface through UART communication. The measurement results of the proposed method are compared with WIFFT and the reference instrument ZERA COM3003. The comparison validates that the proposed method with DLIA and DLIA-FLL demonstrated better measurement accuracy compared to conventional methods such as WIFTT, for frequency variation of ± 1.5 Hz and under 25% THD condition.
Author Contributions
Conceptualization, A.R., T.A. and W.C.; methodology, A.R., T.A. and W.C.; software, A.R.; validation, A.R., T.A. and W.C.; formal analysis, A.R.; investigation, A.R.; resources, A.R.; data curation, A.R.; writing—original draft preparation, A.R.; writing—review and editing, A.R.; visualization, A.R., T.A. and W.C.; manuscript revision and supervision, W.C.; project administration, A.R.; funding acquisition, W.C. All authors have read and agreed to the published version of the manuscript.
Funding
This research was funded by the Korea Electric Power Corporation (KEPCO) (Grant No. R21XO01-35).
Conflicts of Interest
The authors declare no conflicts of interests.
References
- Singh, A., Bhandari, S. & Kumar, J. Suppression of Harmonics in a Novel Multilevel Inverter Using Multi-Carrier Based PWM Technique. J. Electr. Eng. Technol. (2024). [CrossRef]
- F. Teng, Z. Ding, Z. Hu and P. Sarikprueck, “Technical Review on Advanced Approaches for Electric Vehicle Charging Demand Management, Part I: Applications in Electric Power Market and Renewable Energy Integration,” IEEE Trans. Ind. Appl., vol. 56, no. 5, pp. 5684-5694, Sept.-Oct. 2020. [CrossRef]
- Zhang, H., Hu, X., Hu, Z. et al. Sustainable plug-in electric vehicle integration into power systems. Nat Rev Electr Eng 1, 35–52 (2024). [CrossRef]
- V. K. Tiwari, A. C. Umarikar and T. Jain, “Field Programmable Gate Array-Based Measurement System for Real-Time Estimation of Single-Phase Electric Power Quantities,” IEEE Sensors J., vol. 19, no. 13, pp. 5086-5097, 1 July1, 2019. [CrossRef]
- P. Vorobev, D. M. Greenwood, J. H. Bell, J. W. Bialek, P. C. Taylor and K. Turitsyn, “Deadbands, Droop, and Inertia Impact on Power System Frequency Distribution,” IEEE Trans. Power. Syst., vol. 34, no. 4, pp. 3098-3108, July 2019. [CrossRef]
- Li, J., Yao, W., Wang, G. et al. A simple and fast measurement algorithm for power system flicker severity evaluation. Electr Eng (2024). [CrossRef]
- Božiček, J. Kilter, T. Sarnet, I. Papič and B. Blažič, “Harmonic Emissions of Power Electronic Devices Under Different Transmission Network Operating Conditions,” IEEE Trans. Ind. Appl., vol. 54, no. 5, pp. 5216-5226, Sept.-Oct. 2018. [CrossRef]
- S. Kannan, J. Meyer, J. Rens and P. Schegner, “A Novel Extended Noninvasive Harmonic Resonance Detection Technique for Public Low-Voltage Networks,” IEEE Trans. Instrum. Meas., vol. 71, pp. 1-11, 2022, Art no. 9002711. [CrossRef]
- Babuta, A.; Gupta, B.; Kumar, A.; Ganguli, S. “Power and energy measurement devices: A review, comparison, discussion, and the future of research”, Measurement, 2021, 172, 108961.
- R. Morello, C. De Capua, G. Fulco and S. C. Mukhopadhyay, “A Smart Power Meter to Monitor Energy Flow in Smart Grids: The Role of Advanced Sensing and IoT in the Electric Grid of the Future,” IEEE Sensors J., vol. 17, no. 23, pp. 7828-7837, 1 Dec.1, 2017. [CrossRef]
- H. Dirik, İ. U. Duran and C. Gezegin, “A Computation and Metering Method for Harmonic Emissions of Individual Consumers,” IEEE Trans. Instrum. Meas., vol. 68, no. 2, pp. 412-420, Feb. 2019. [CrossRef]
- J. Paris, J. S. Donnal, Z. Remscrim, S. B. Leeb and S. R. Shaw, “The Sinefit Spectral Envelope Preprocessor,” IEEE Sensors J., vol. 14, no. 12, pp. 4385-4394, Dec. 2014. [CrossRef]
- M. K. Ikram, S. M. Amrr, M. S. J. Asghar, T. Islam and A. Iqbal, “Voltage Independent Reactive Current Based Sensor for Static VAr Control Applications,” IEEE Sensors J., vol. 23, no. 9, pp. 10023-10031, 1 May1, 2023. [CrossRef]
- Z. Marais, H. E. van den Brom, G. Kok and M. G. A. van Veghel, “Reduction of Static Electricity Meter Errors by Broadband Compensation of Voltage and Current Channel Differences,” IEEE Trans. Instrum. Meas., vol. 70, pp. 1-11, 2021, Art no. 1501511. [CrossRef]
- Q. Cetina, R. A. J. Roscoe and P. S. Wright, “Challenges for Smart Electricity Meters due to Dynamic Power Quality Conditions of the Grid: A Review,” 2017 IEEE International Workshop on Applied Measurements for Power Systems (AMPS), Liverpool, UK, 2017, pp. 1-6. [CrossRef]
- Z. Yan and H. Wen, “Performance Analysis of Electricity Theft Detection for the Smart Grid: An Overview,” IEEE Trans. Instrum. Meas., vol. 71, pp. 1-28, 2022, Art no. 2502928. [CrossRef]
- W. Wu et al., “Effect of Frequency Offset on Power Measurement Error in Digital Input Electricity Meters,” IEEE Trans. Instrum. Meas., vol. 67, no. 3, pp. 559-568, March 2018. [CrossRef]
- W. Li, G. Zhang, M. Chen, H. Zhong and Y. Geng, “Dynamic Harmonic Phasor Estimator Considering Frequency Deviation,” IEEE Sensors J., vol. 21, no. 21, pp. 24453-24461, 1 Nov.1, 2021. [CrossRef]
- Testa, D. Gallo and R. Langella, “On the Processing of harmonics and interharmonics: using Hanning window in standard framework,” IEEE Trans. Power Del., vol. 19, no. 1, pp. 28-34, Jan. 2004. [CrossRef]
- H. Qian, R. Zhao and T. Chen, “Interharmonics Analysis Based on Interpolating Windowed FFT Algorithm,” IEEE Trans. Power Del., vol. 22, no. 2, pp. 1064-1069, April 2007. [CrossRef]
- D. Belega, D. Dallet and D. Petri, “Accuracy of Sine Wave Frequency Estimation by Multipoint Interpolated DFT Approach,” IEEE Trans. Instrum. Meas., vol. 59, no. 11, pp. 2808-2815, Nov. 2010. [CrossRef]
- H. Wen, J. Zhang, Z. Meng, S. Guo, F. Li and Y. Yang, “Harmonic Estimation Using Symmetrical Interpolation FFT Based on Triangular Self-Convolution Window,” IEEE Trans. Ind. Informat., vol. 11, no. 1, pp. 16-26, Feb. 2015. [CrossRef]
- J. A. F. Ferreira and A. Petraglia, “Analog integrated lock-in amplifier for optical sensors,” IEEE Instrum. Meas. Magazine., vol. 20, no. 2, pp. 43-50, April 2017. [CrossRef]
- M. N. Ashraf, R. A. Khan and W. Choi, “A Novel Selective Harmonic Compensation Method for Single-Phase Grid-Connected Inverters,” IEEE Trans. Ind. Electron., vol. 68, no. 6, pp. 4848-4858, June 2021. [CrossRef]
- B. K. Choudhury and P. Jena, “A Digital Lock-In Amplifier Assisted Active Islanding Detection Technique for DC Microgrids,” IEEE Trans. Ind. Appl., vol. 59, no. 1, pp. 377-391, Jan.-Feb. 2023. [CrossRef]
- X. Fu, D. M. Colombo, H. H. Alamdari, Y. Yin and K. El-Sankary, “Lock-In Amplifier for Sensor Application Using Second Order Harmonic Frequency With Automatic Background Phase Calibration,” IEEE Sensors J., vol. 22, no. 16, pp. 16067-16080, 15 Aug.15, 2022. [CrossRef]
- S. Jana and S. Srinivas, “A Computationally Efficient Harmonic Extraction Algorithm for Grid Applications,” IEEE Trans Power. Del, vol. 37, no. 1, pp. 146-154, Feb. 2022. [CrossRef]
- M. Xie, H. Wen, C. Zhu and Y. Yang: DC Offset Rejection Improvement in Single-Phase SOGI-PLL Algorithms: Methods Review and Experimental Evaluation. IEEE Access, vol. 5, pp. 12810-12819, 2017. [CrossRef]
- S. Golestan, J. M. Guerrero, F. Musavi and J. C. Vasquez, “Single-phase frequency-locked loops: A comprehensive review”, IEEE Trans. Power Electron., vol. 34, no. 12, pp. 11791-11812, Dec. 2019. [CrossRef]
- S. Vazquez, J. A. Sanchez, M. R. Reyes, J. I. Leon, and J. M. Carrasco, ‘‘Adaptive vectorial filter for grid synchronization of power converters under unbalanced and/or distorted grid conditions,’’ IEEE Trans. Ind. Electron., vol. 61, no. 3, pp. 1355–1367, Mar. 2014. [CrossRef]
- Sahoo, J. Ravishankar and C. Jones, “Phase-locked loop independent second-order generalized integrator for single-phase grid synchronization”, IEEE Trans. Instrum. Meas., vol. 70, pp. 1-9, 2021.
- H. Ahmed, M. Bierhoff and M. Benbouzid, “Multiple nonlinear harmonic oscillator-based frequency estimation for distorted grid voltage”, IEEE Trans. Instrum. Meas., vol. 69, no. 6, pp. 2817-2825, Jun. 2020.
- IEEE Standard Definitions for the Measurement of Electric Power Quantities Under Sinusoidal, Nonsinusoidal, Balanced, or Unbalanced Conditions, IEEE Std 1459-2010 (Revision of IEEE Std 1459-2000), vol., no., pp.1-50, 19 March 2010. [CrossRef]
- ST Microelectronics. (2020, march). Getting started with the STM32H7 Series MCU 16-bit ADC. Available at: https://www.st.com/resource/en/application_note/an5354-getting-started-with-the-stm32h7-series-mcu-16bit-adc-stmicroelectronics.pdf.
- CyberKEPCO. Available online: https://cyber.kepco.co.kr/ckepco/front/jsp/CO/H/htmlView/COHAHP00908.jsp#.
|
Disclaimer/Publisher’s Note: The statements, opinions and data contained in all publications are solely those of the individual author(s) and contributor(s) and not of MDPI and/or the editor(s). MDPI and/or the editor(s) disclaim responsibility for any injury to people or property resulting from any ideas, methods, instructions or products referred to in the content. |
© 2024 by the authors. Licensee MDPI, Basel, Switzerland. This article is an open access article distributed under the terms and conditions of the Creative Commons Attribution (CC BY) license (http://creativecommons.org/licenses/by/4.0/).

