Submitted:
09 July 2024
Posted:
10 July 2024
You are already at the latest version
Abstract
Keywords:
1. Introduction
2. Experimental Principles and Research Methods
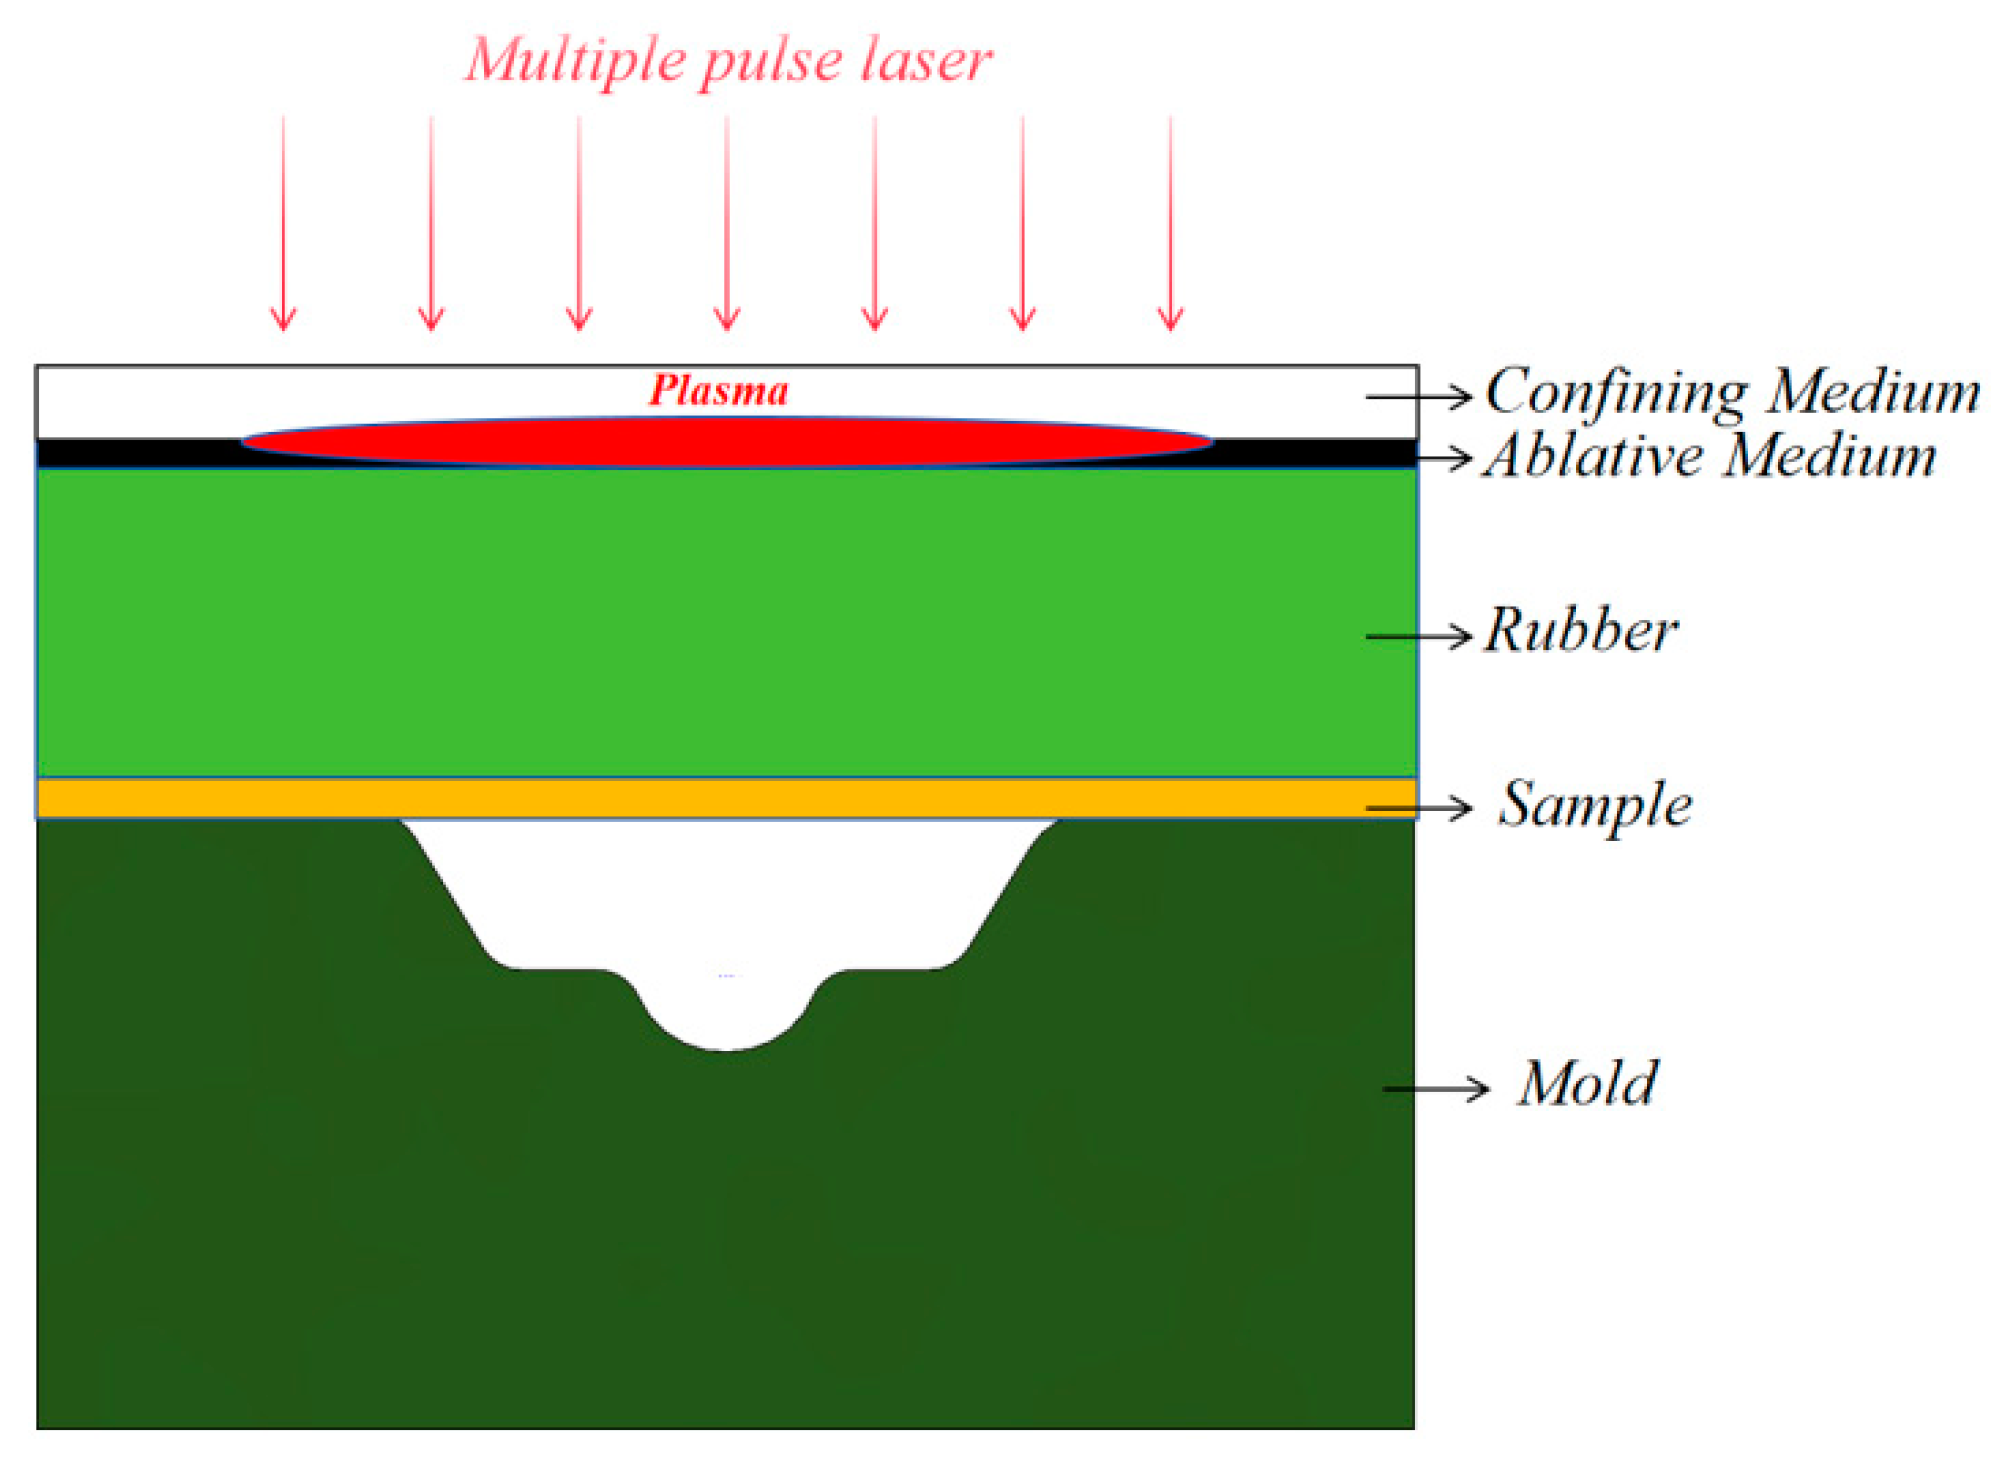
2.1. Mechanism of Multi-Pulse Laser Dynamic Microforming
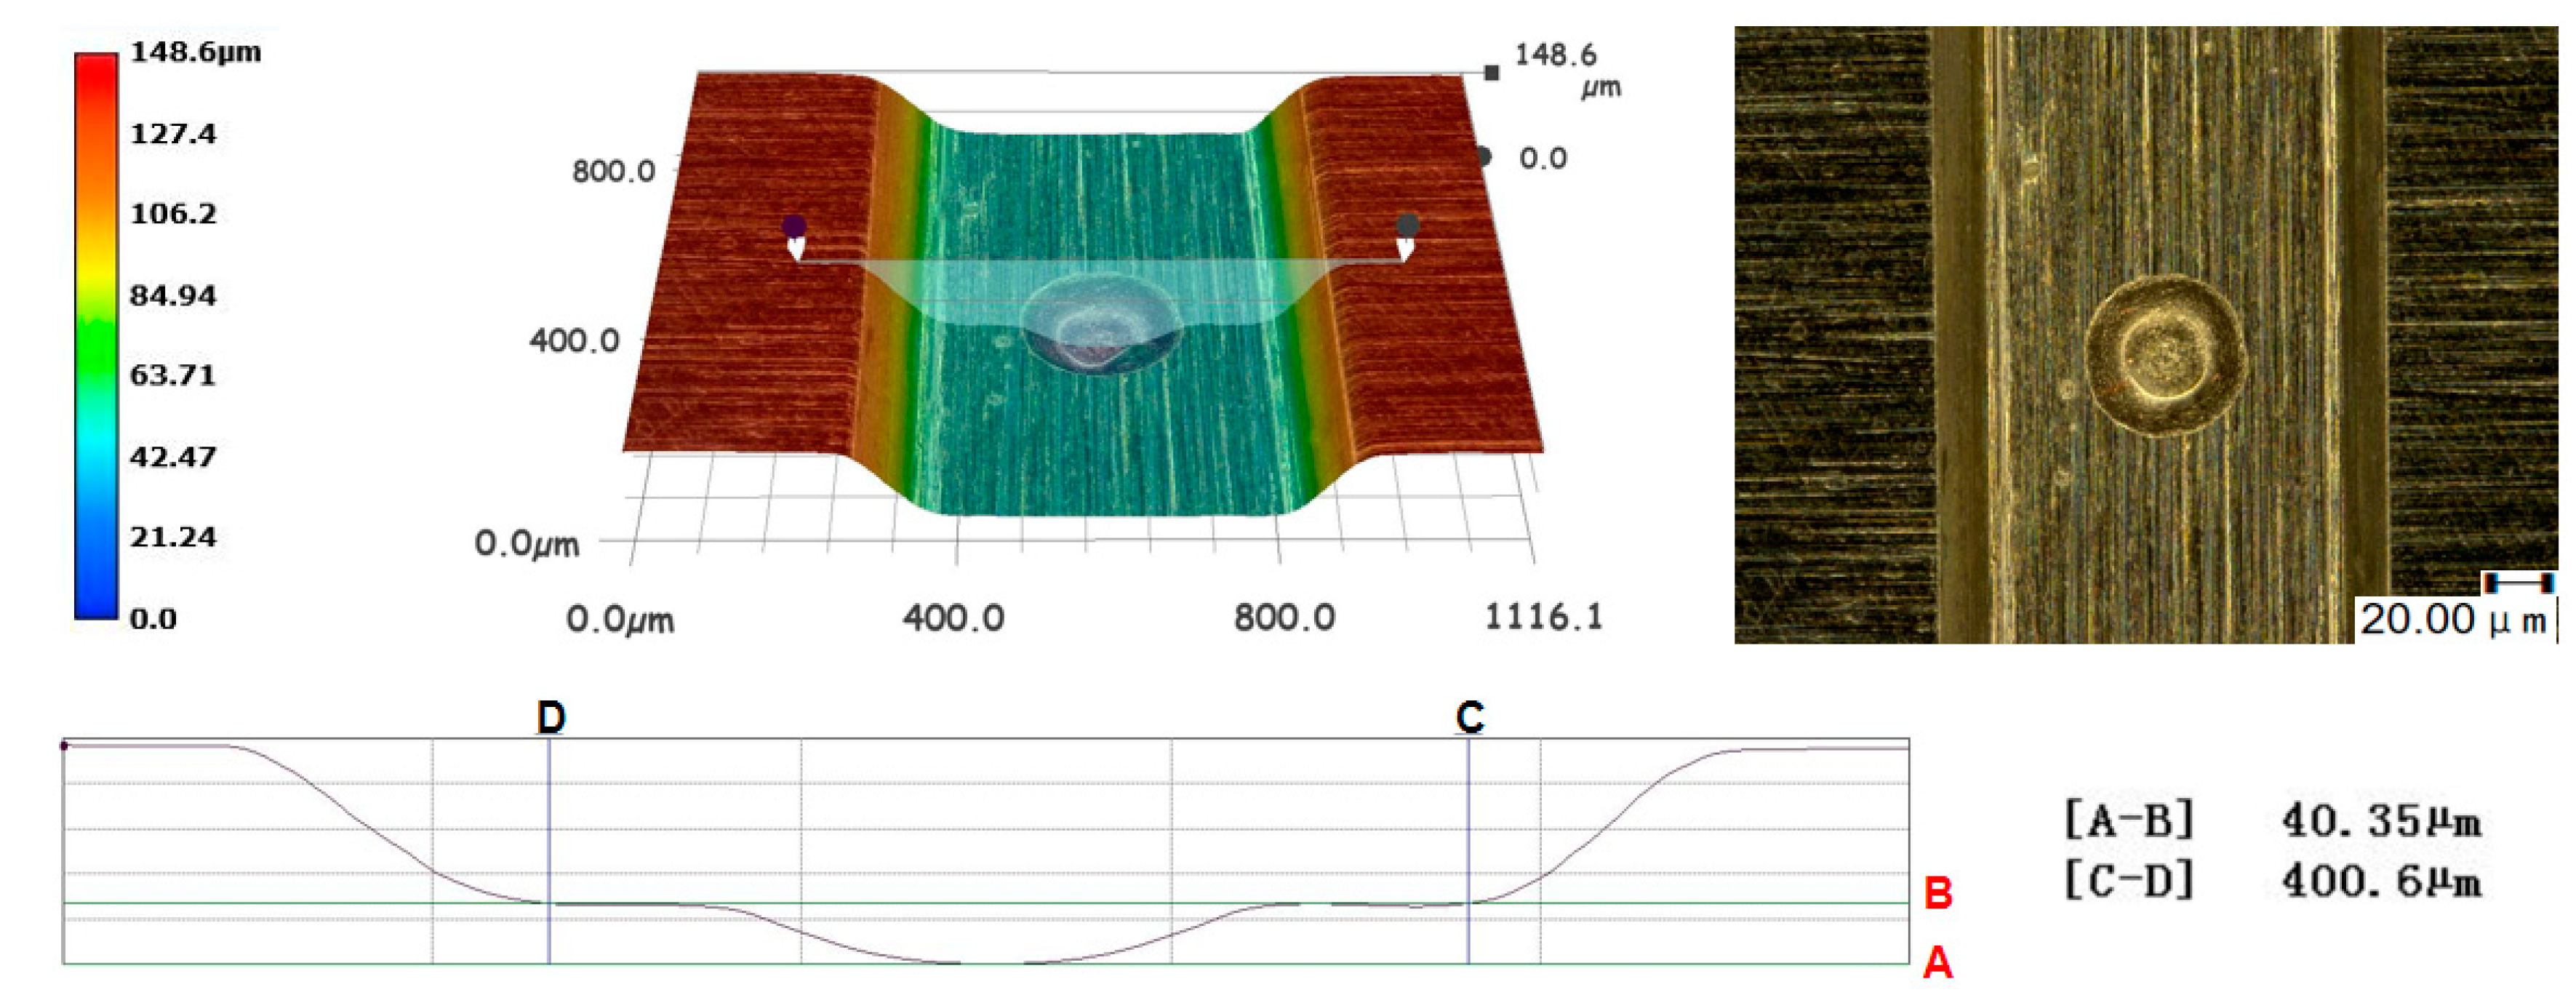
2.2. Micro-Die
2.3. The Scheme Design of the Comparison Experiment
2.4. Constitutive Model of Materials
2.5. Result Characterization
3. Result and Analysis
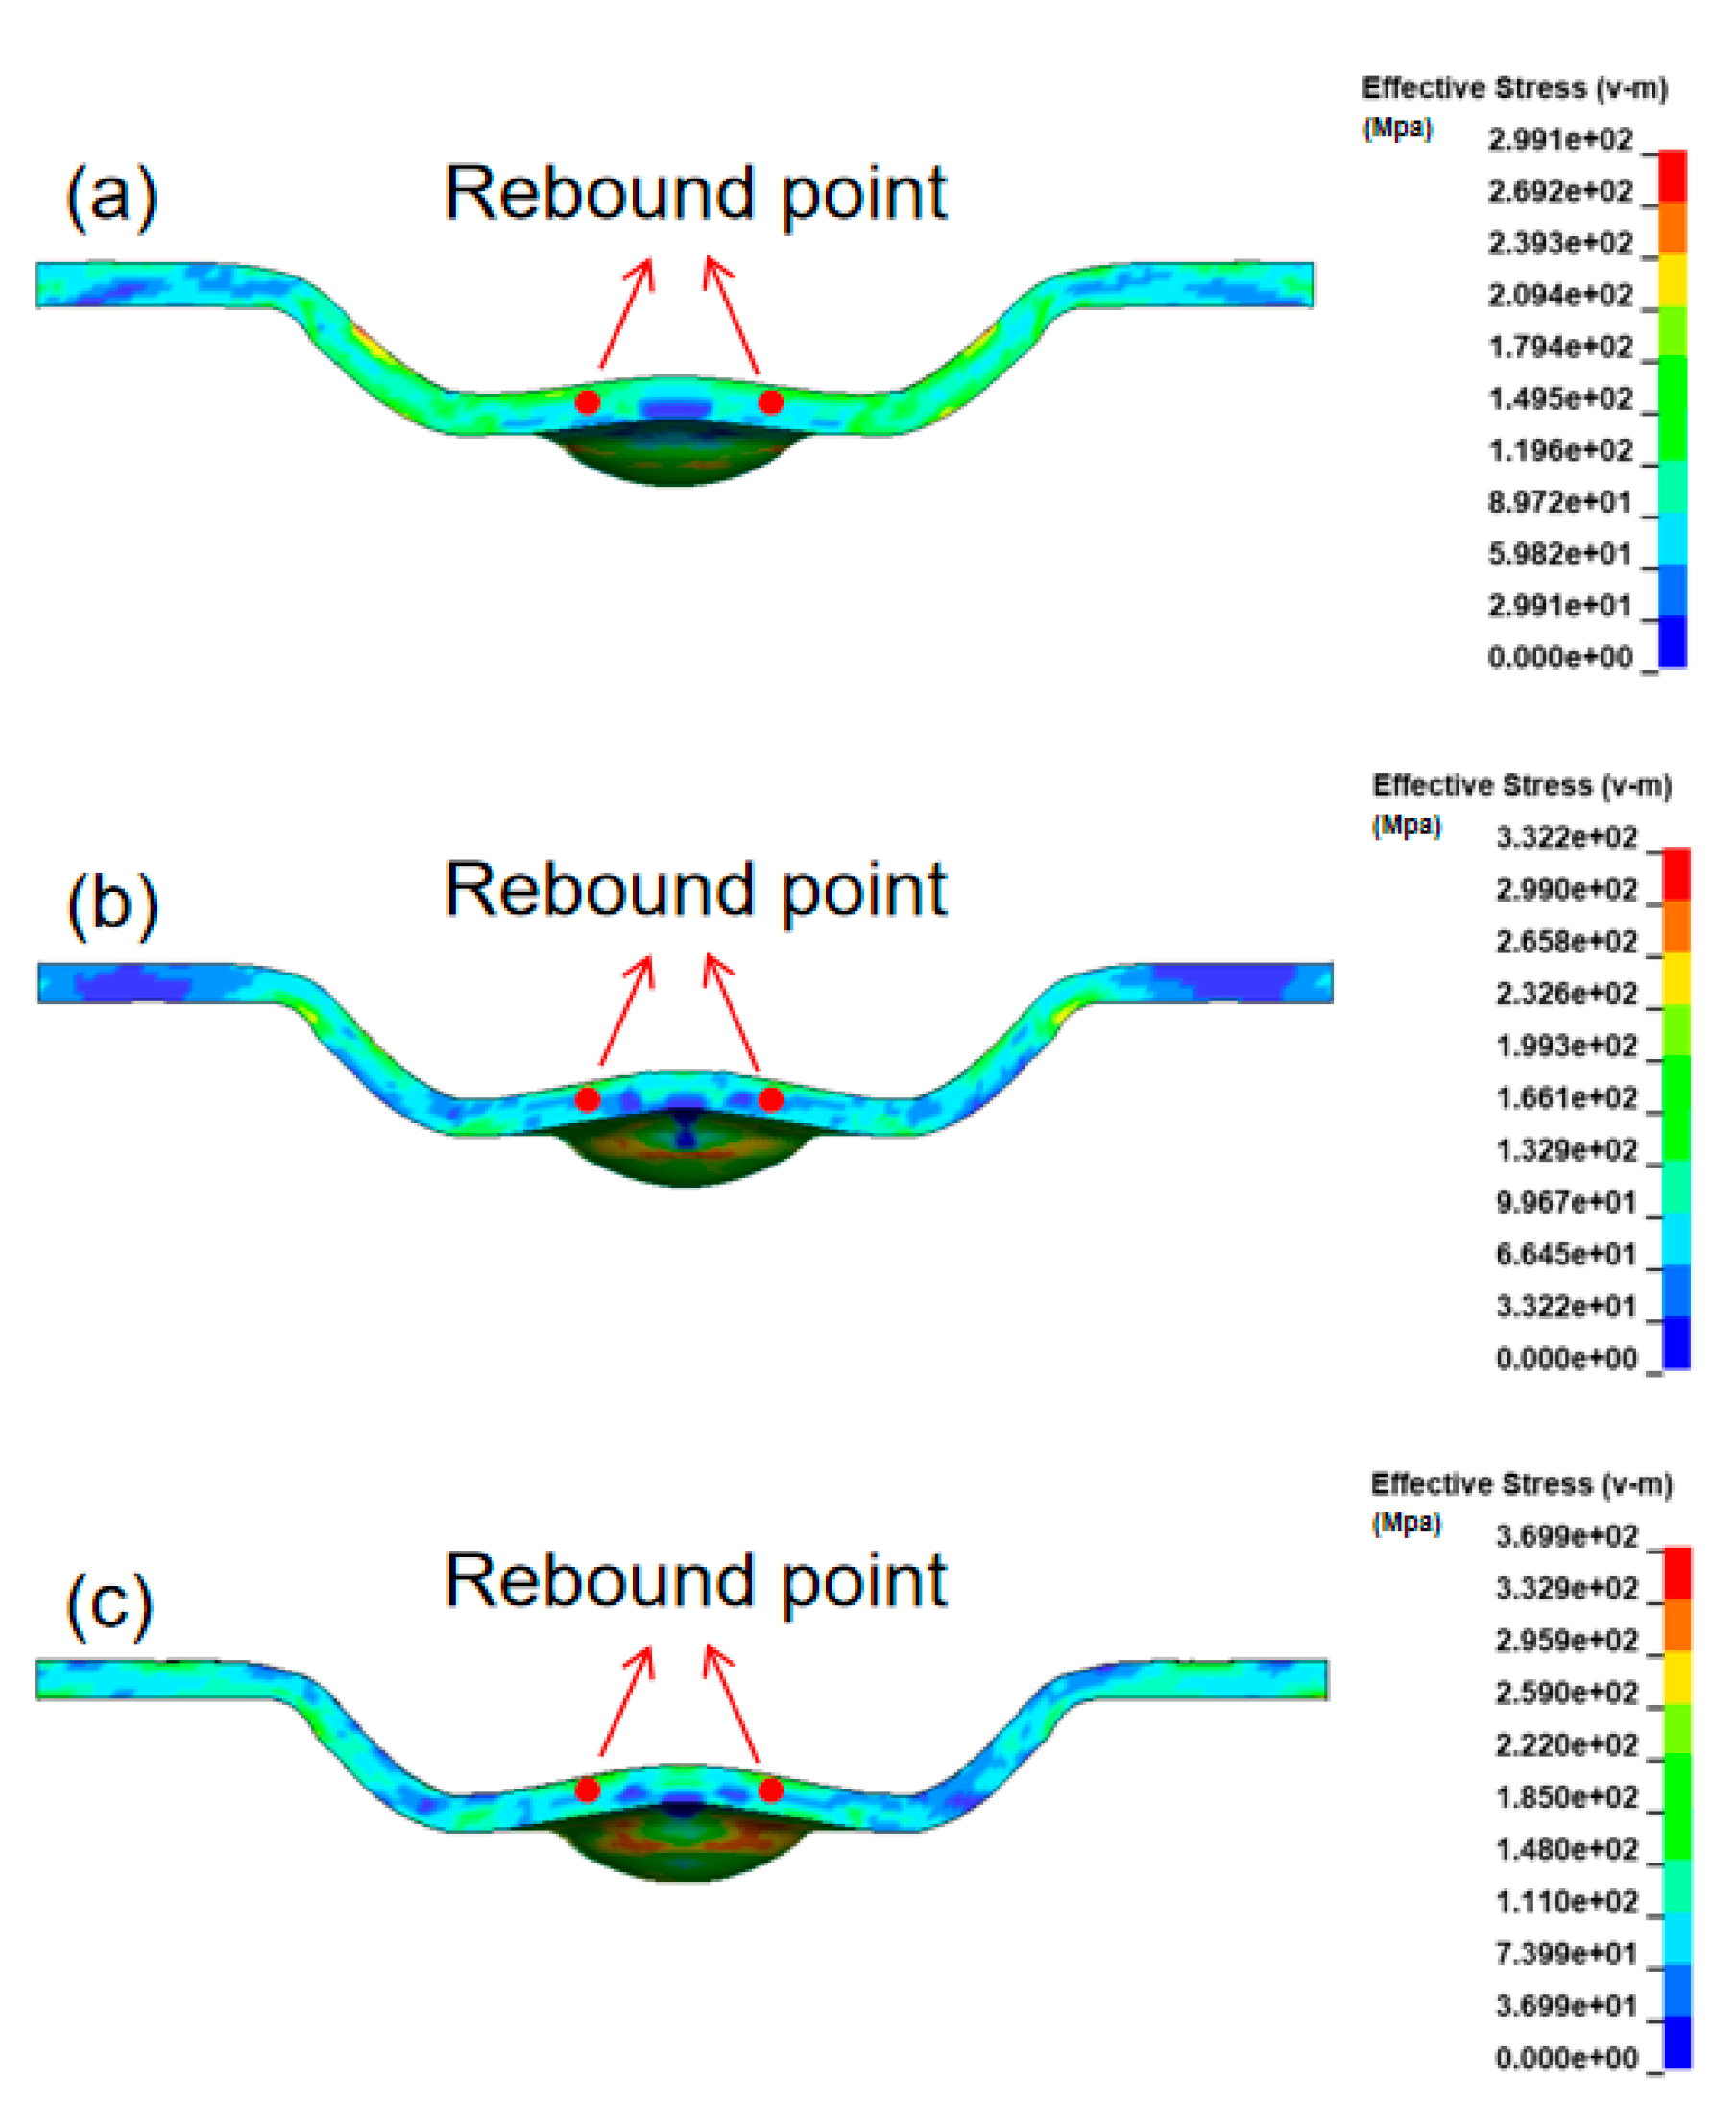
3.1. Rebound Phenomenon in Laser Dynamic Microforming
3.2. Influence of Laser Shock Frequency on Workpiece Forming Result
3.3. Variation Trend of Chemical Element Content on Workpiece Surface after Multi-Pulse Laser Loading
4. Conclusions
- (1)
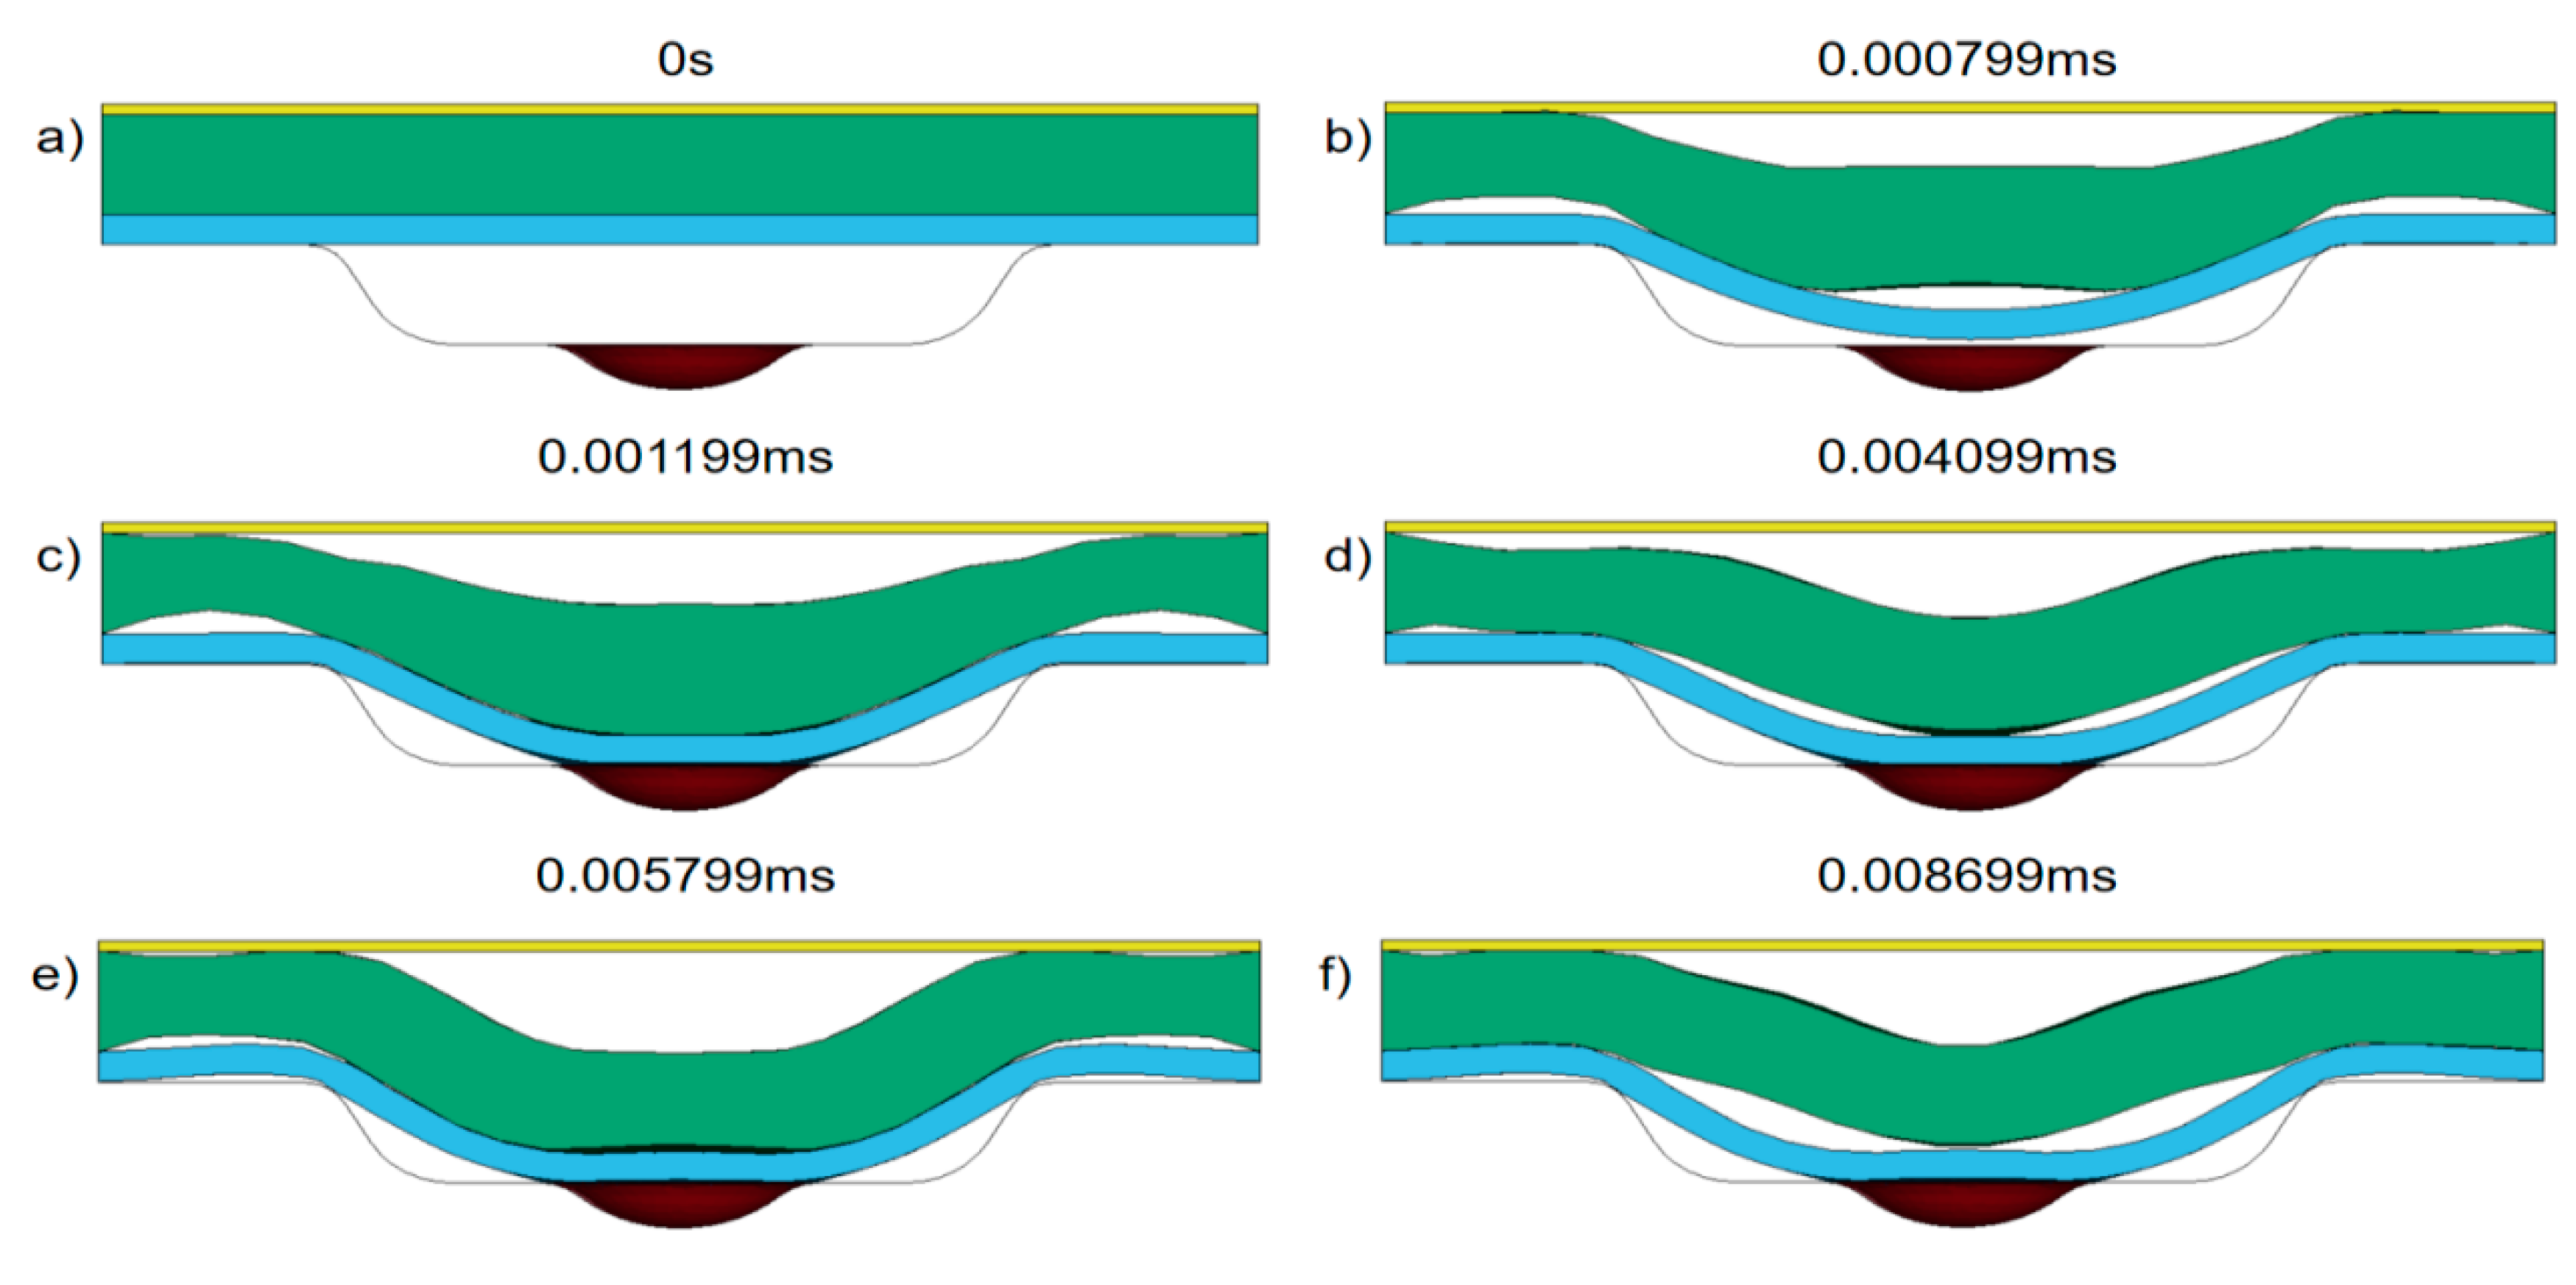
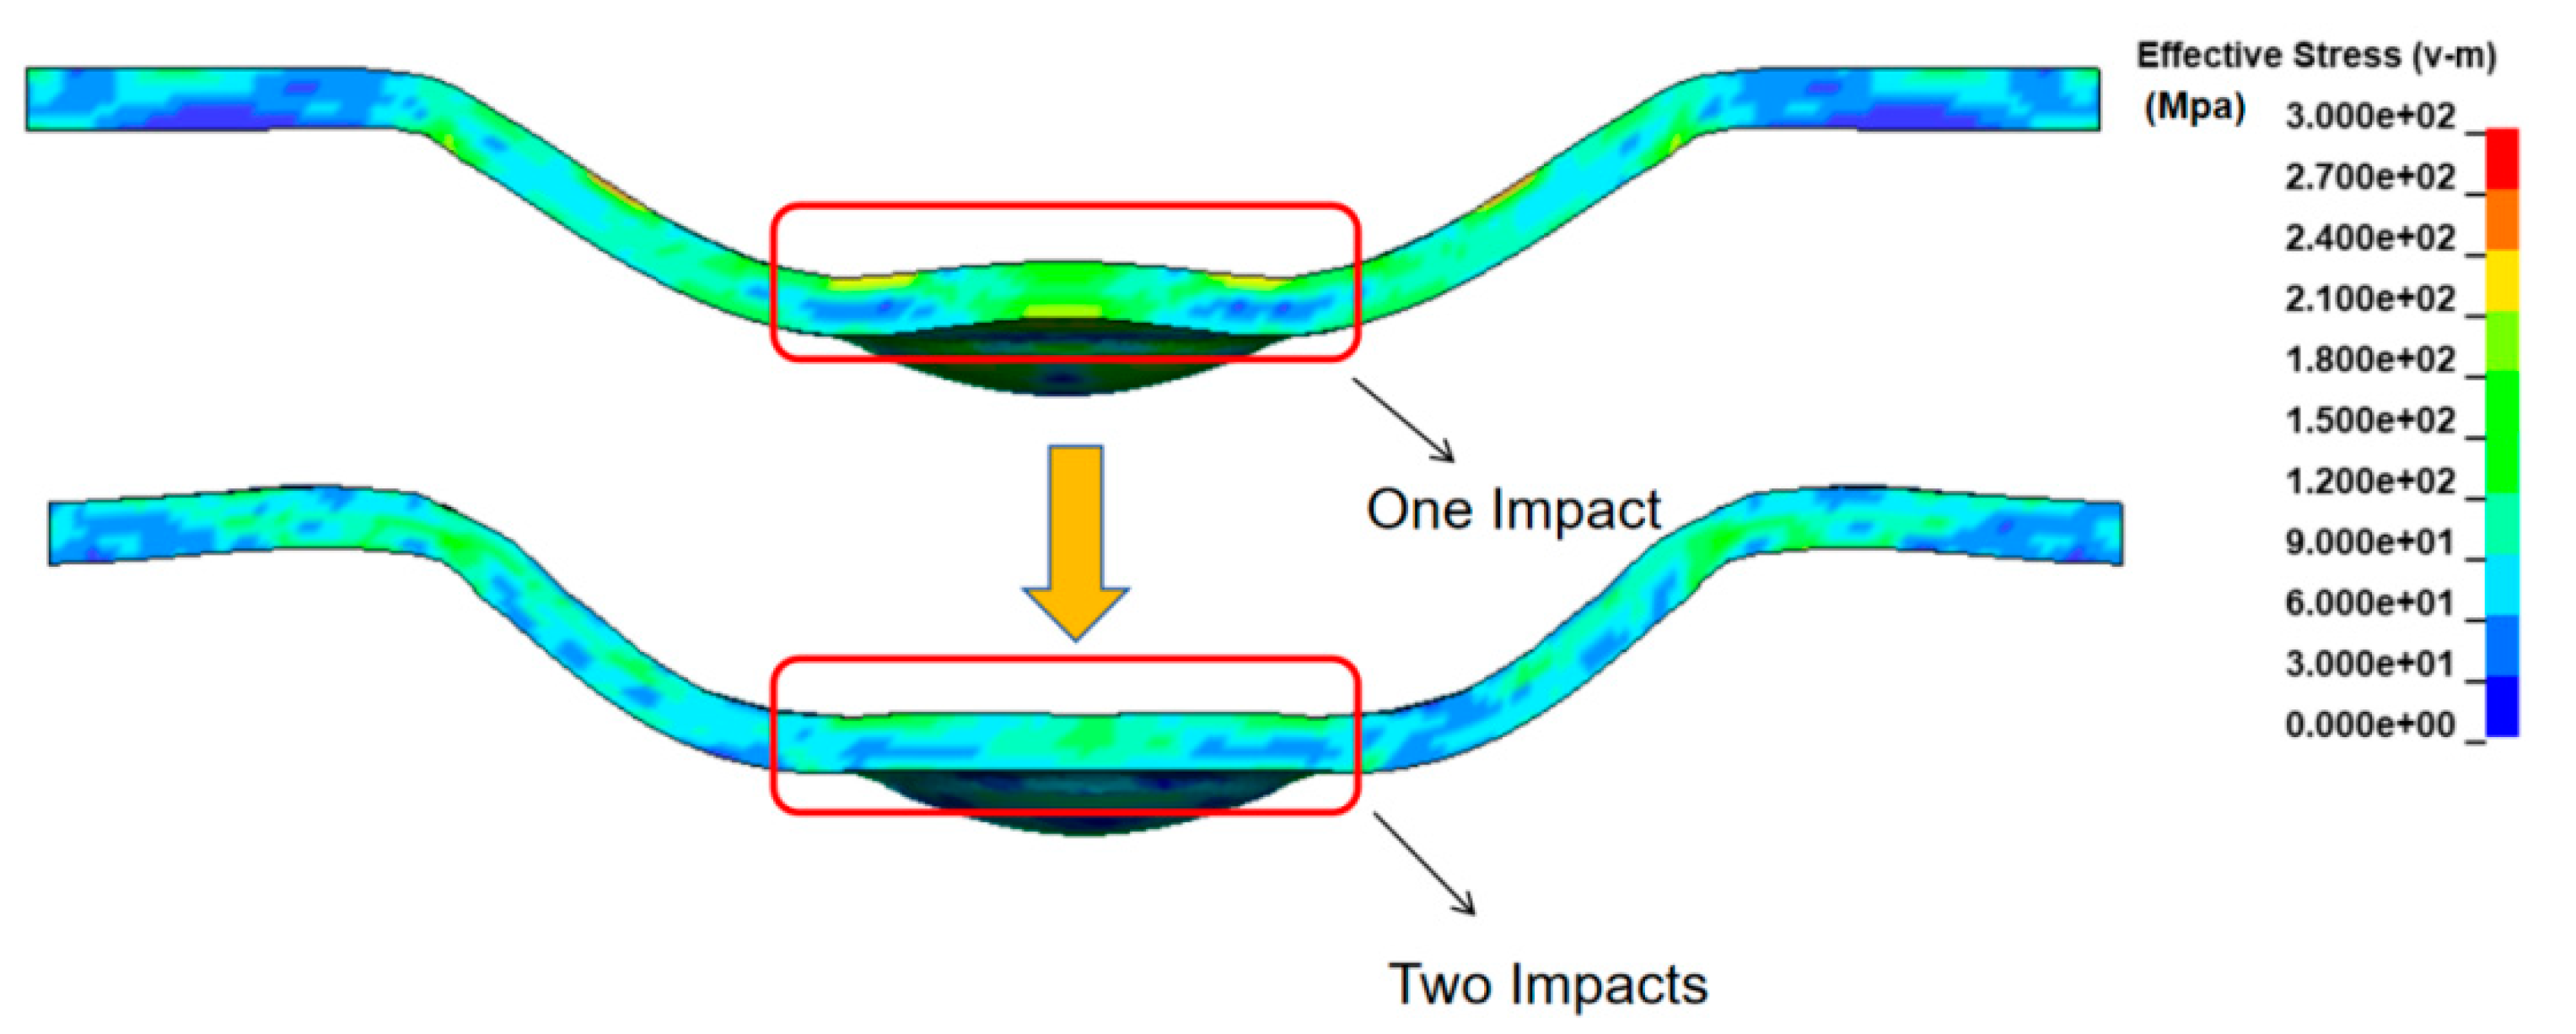
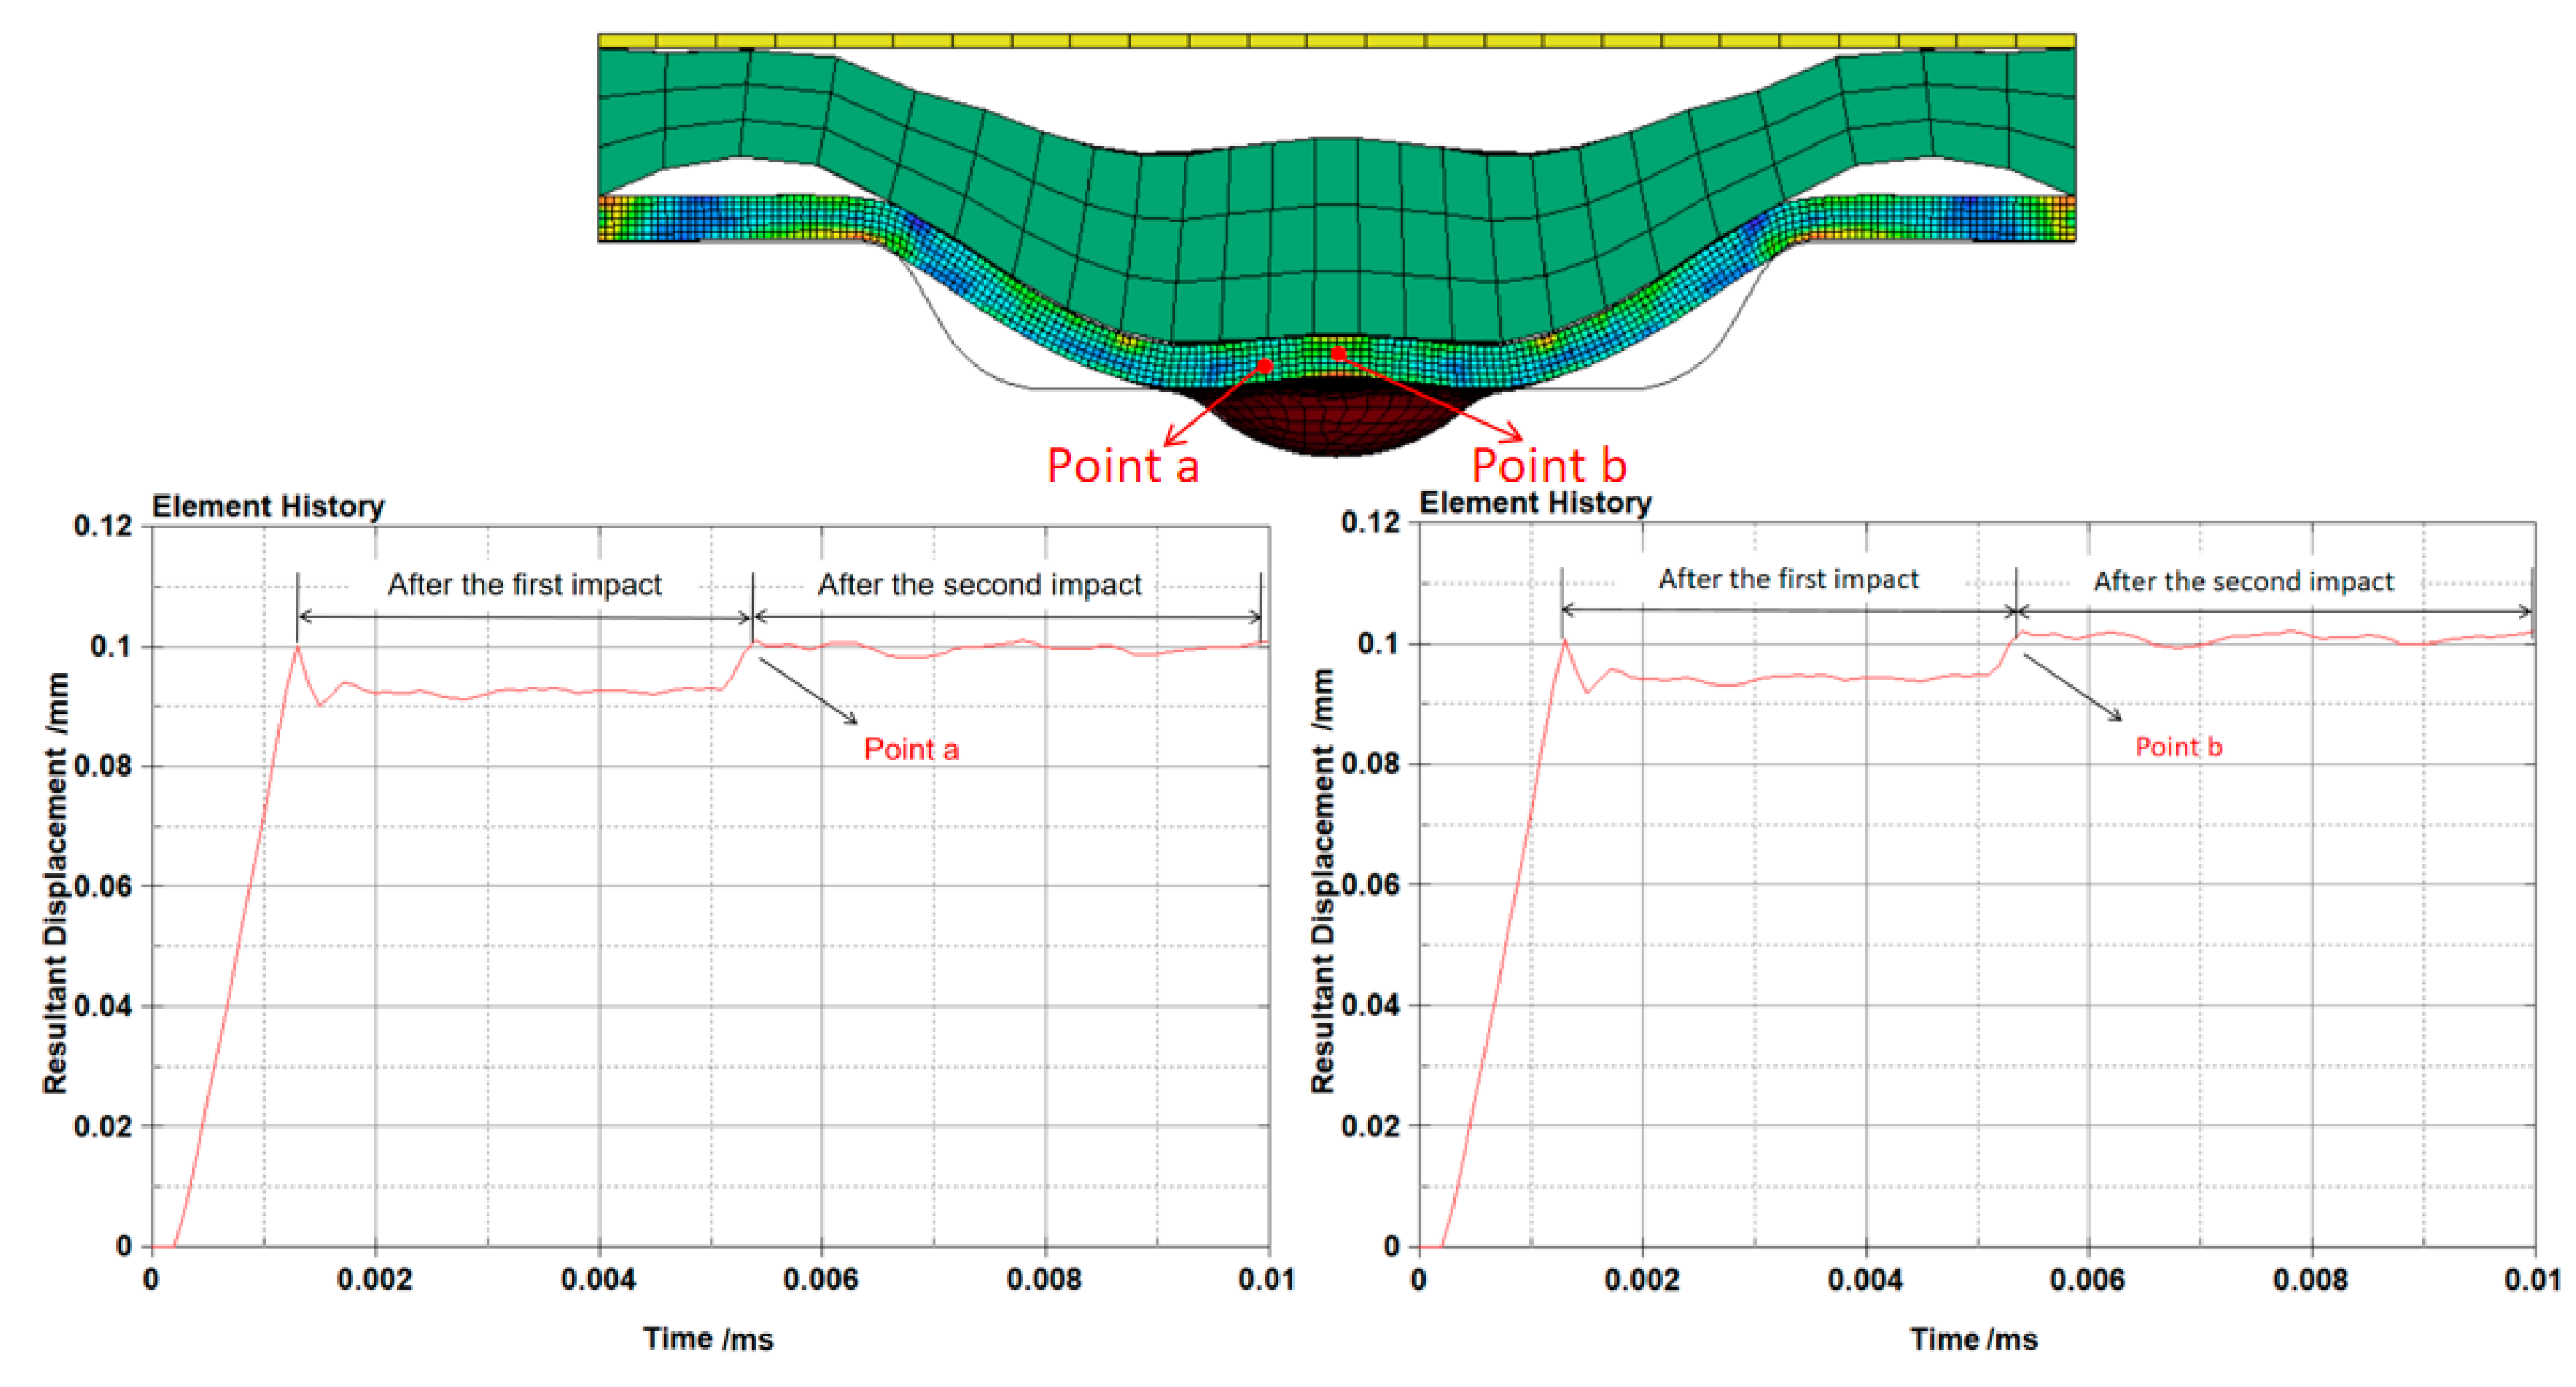
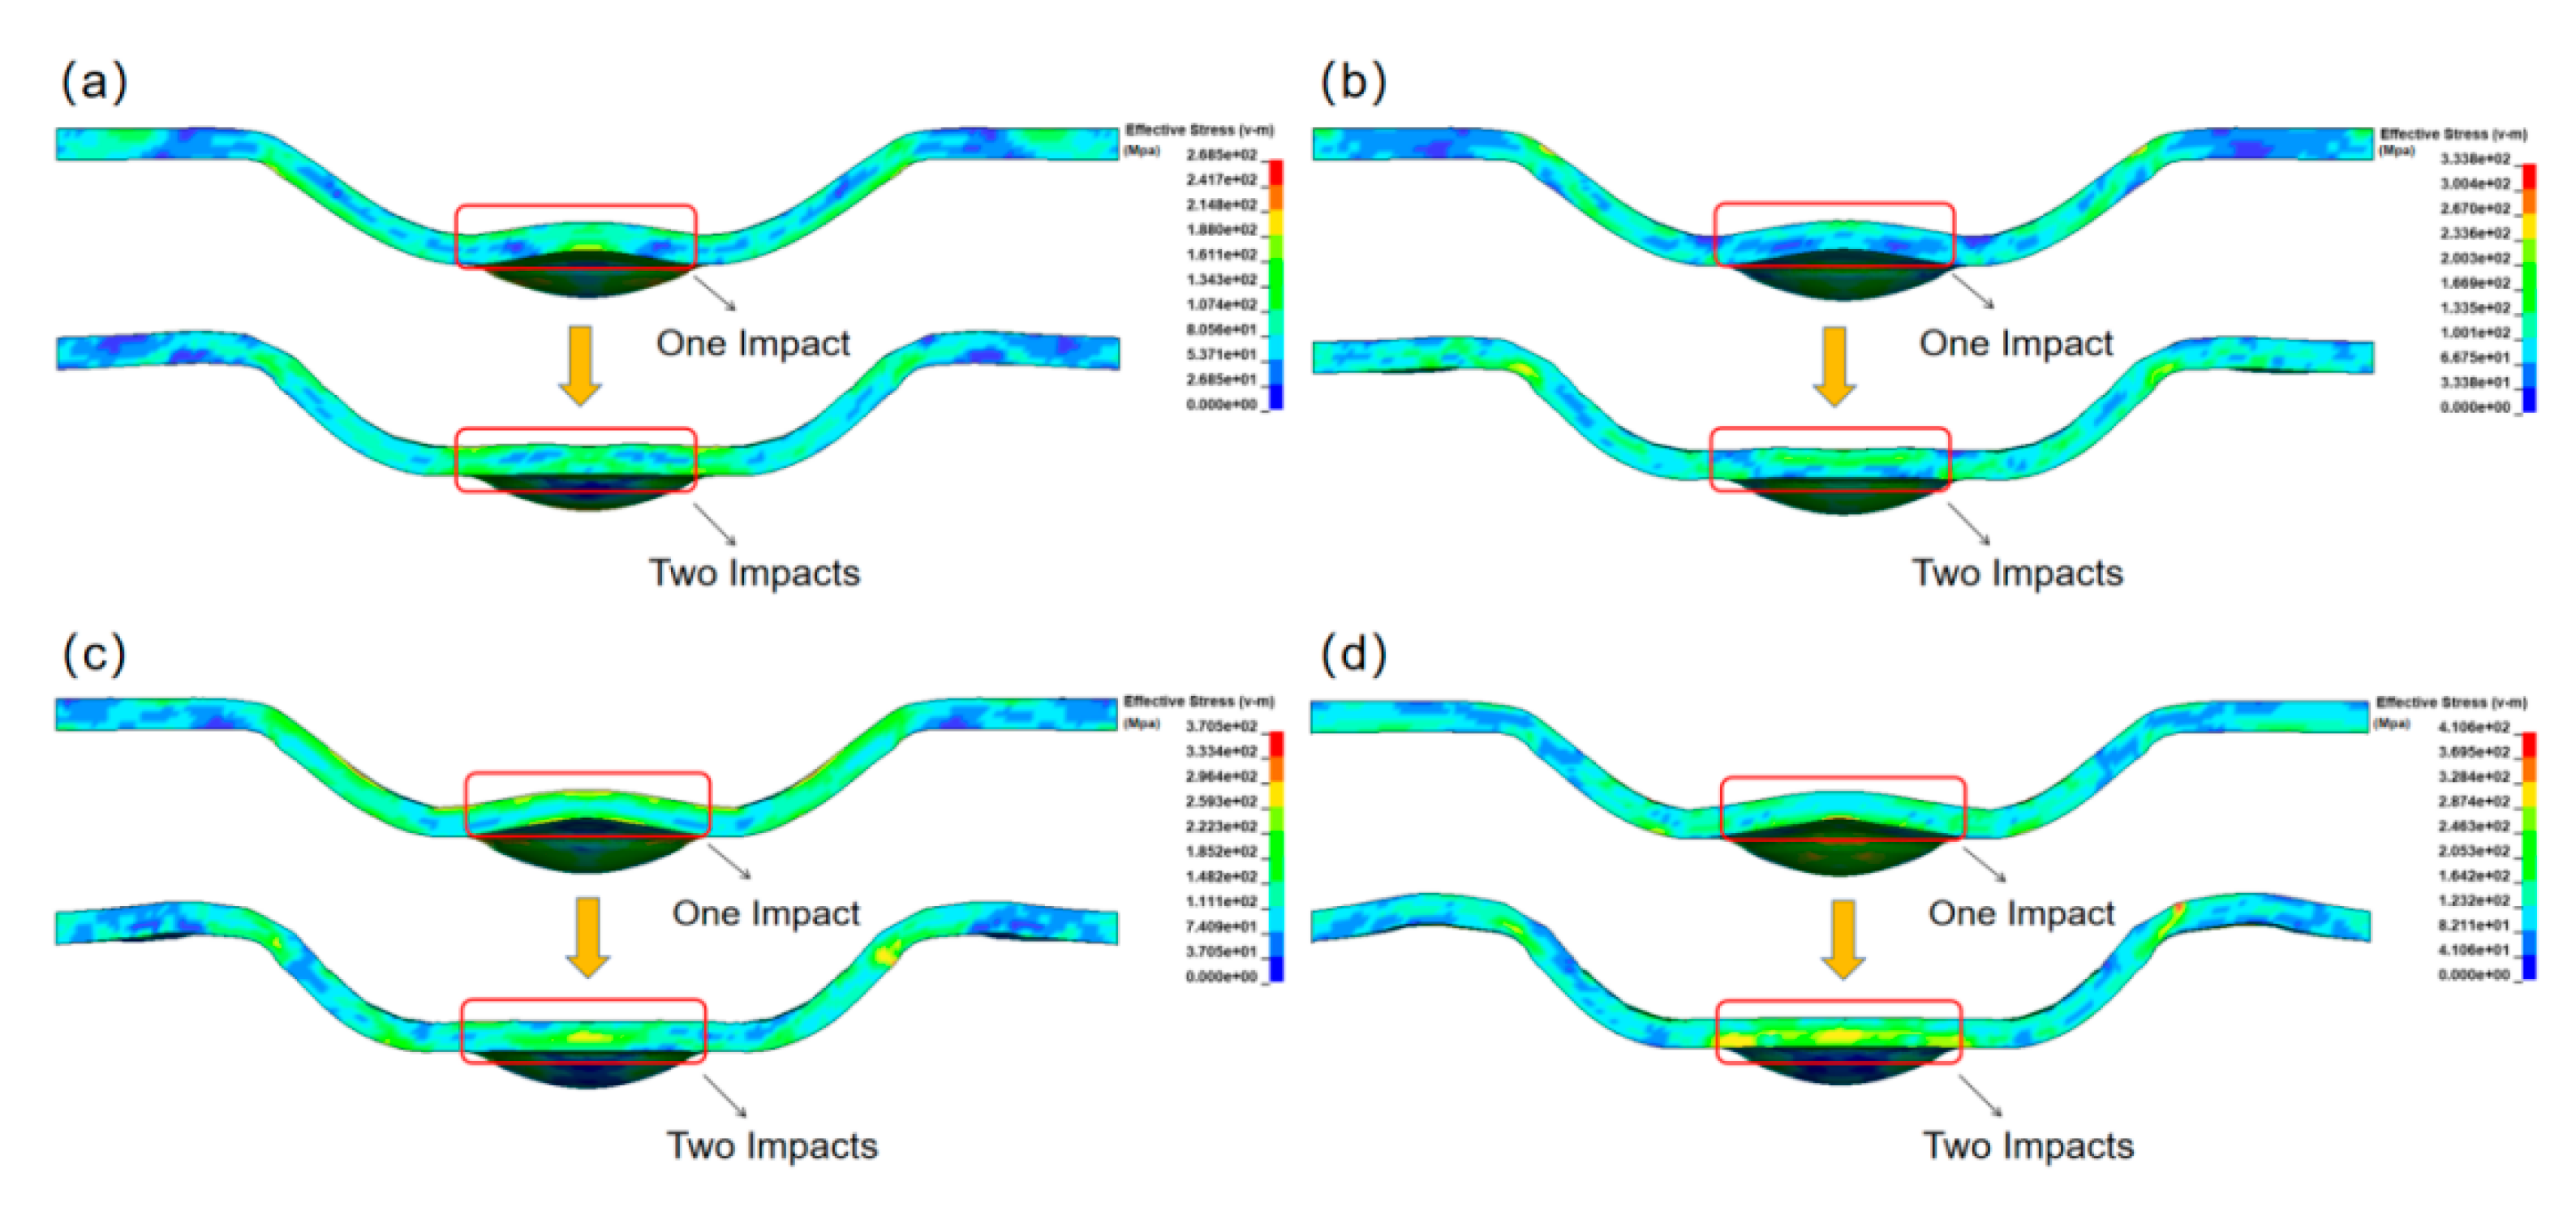
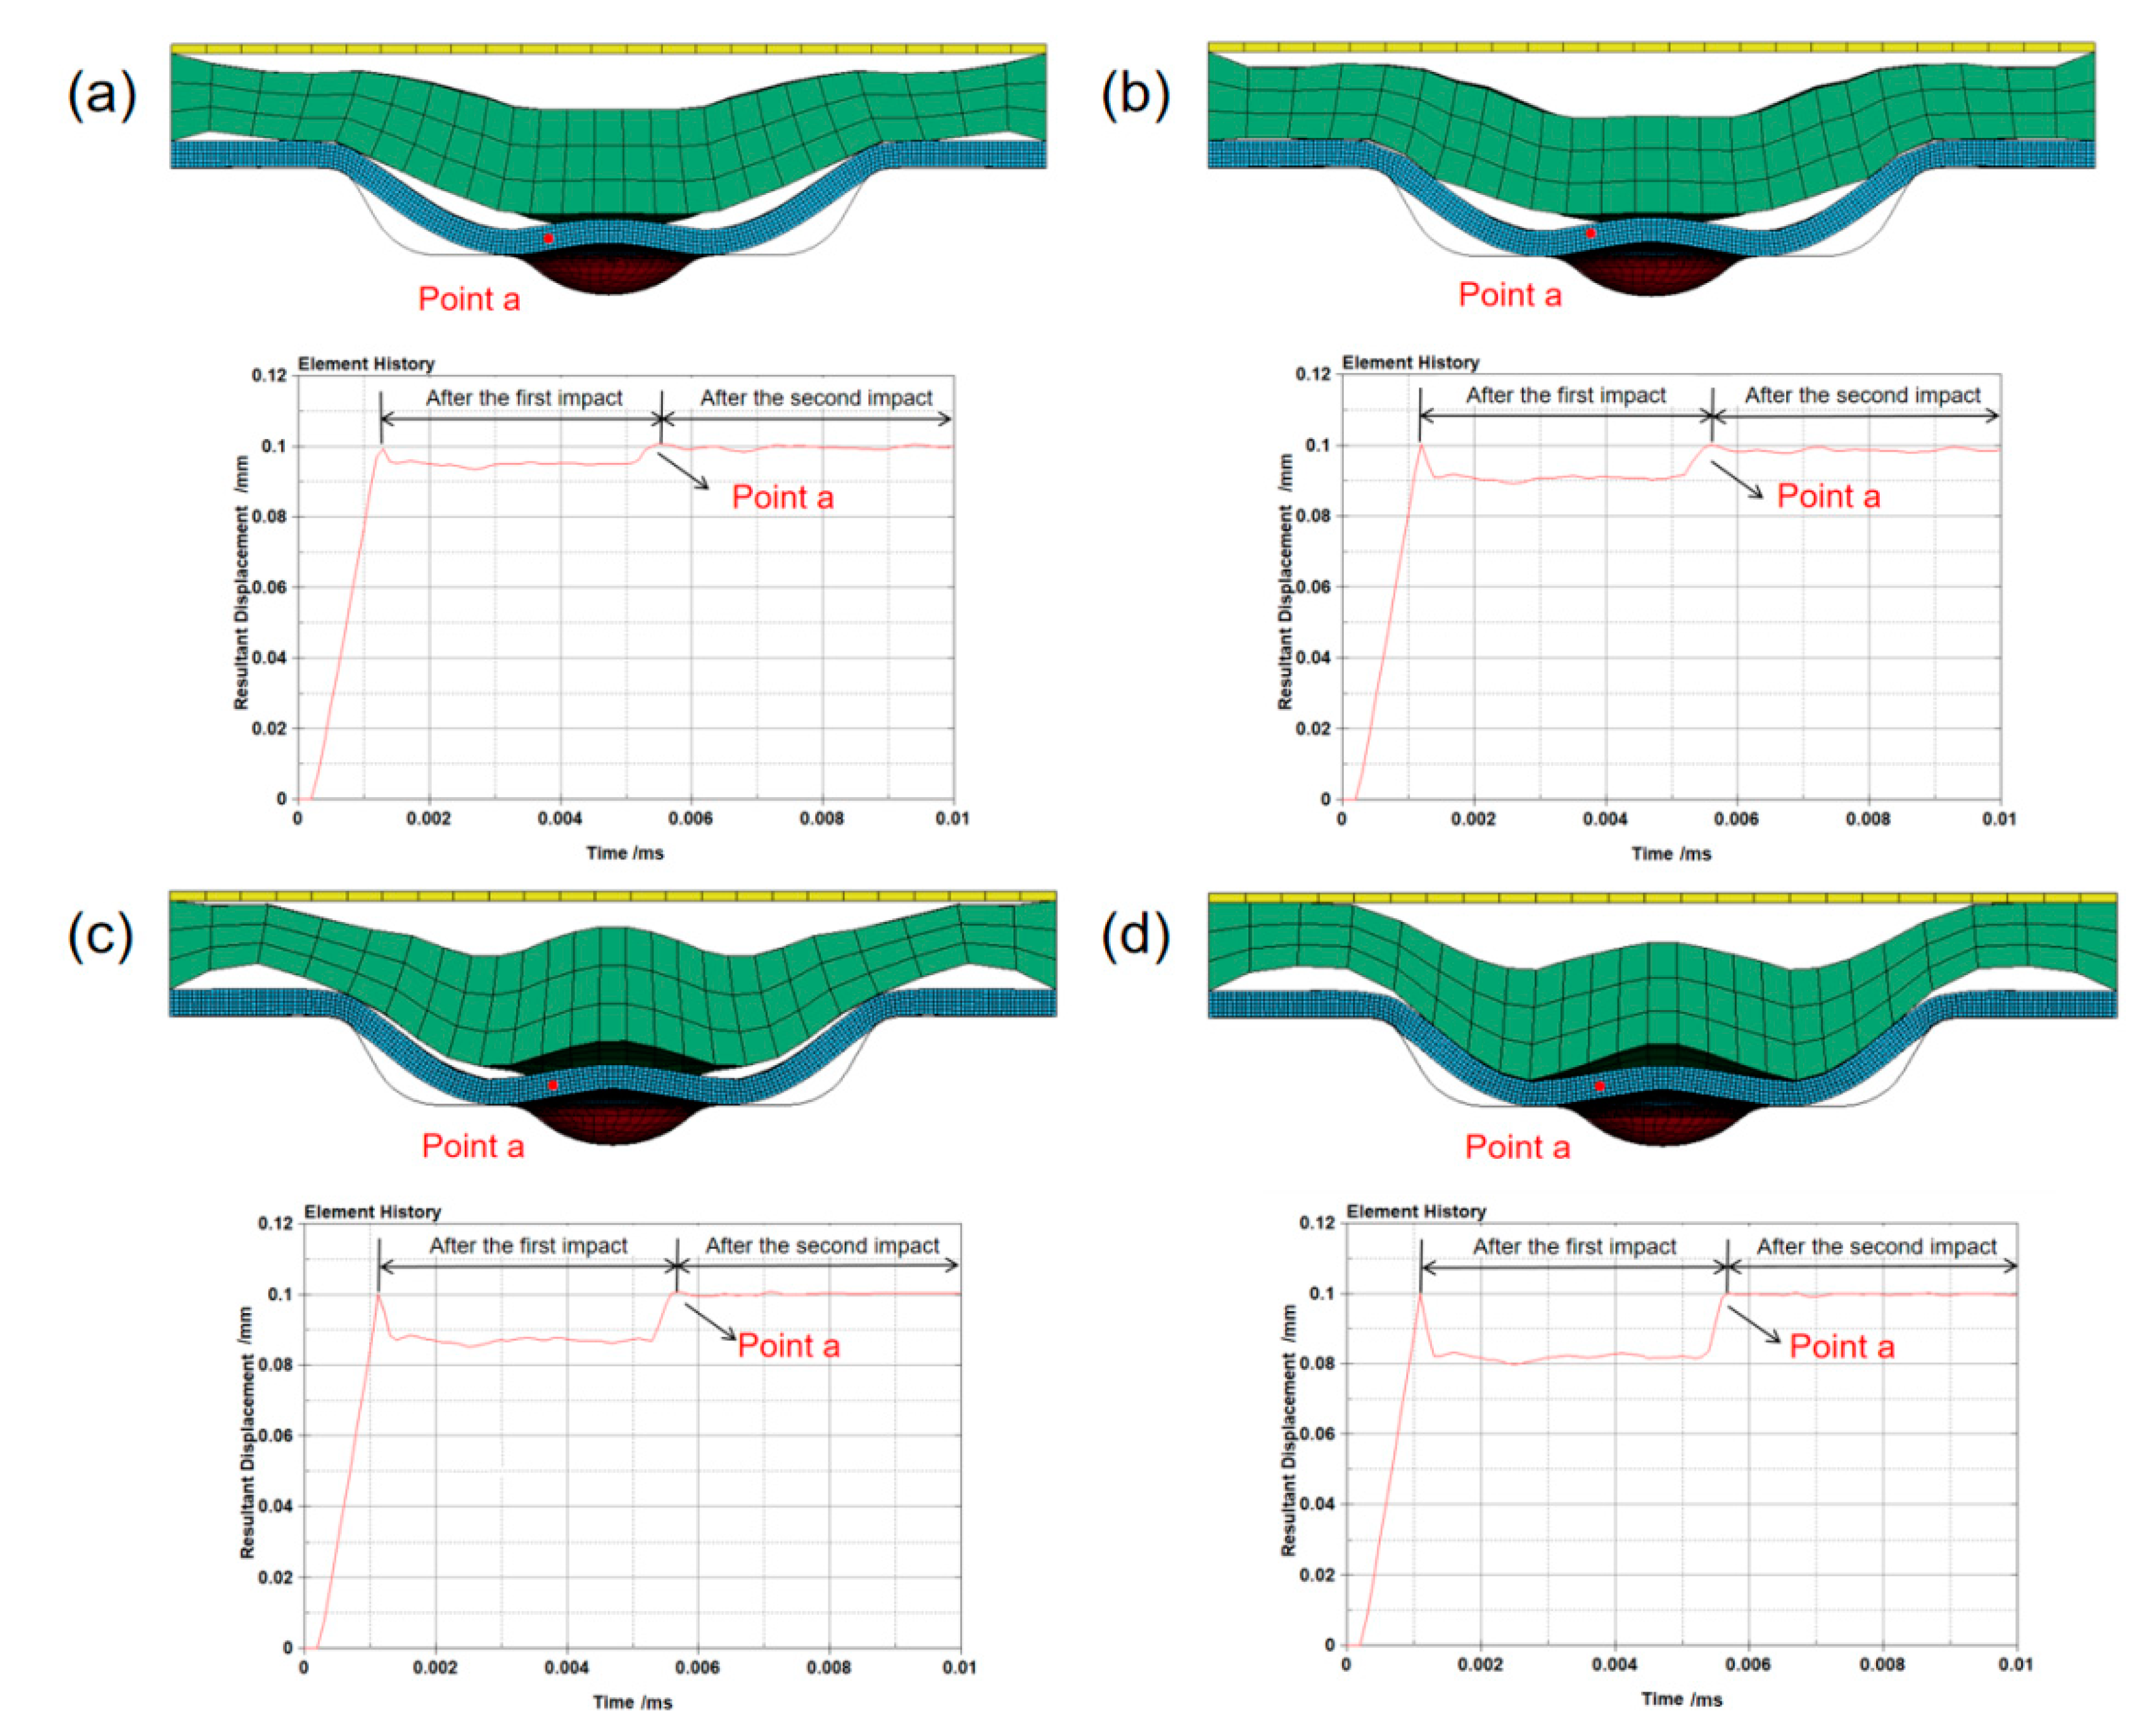
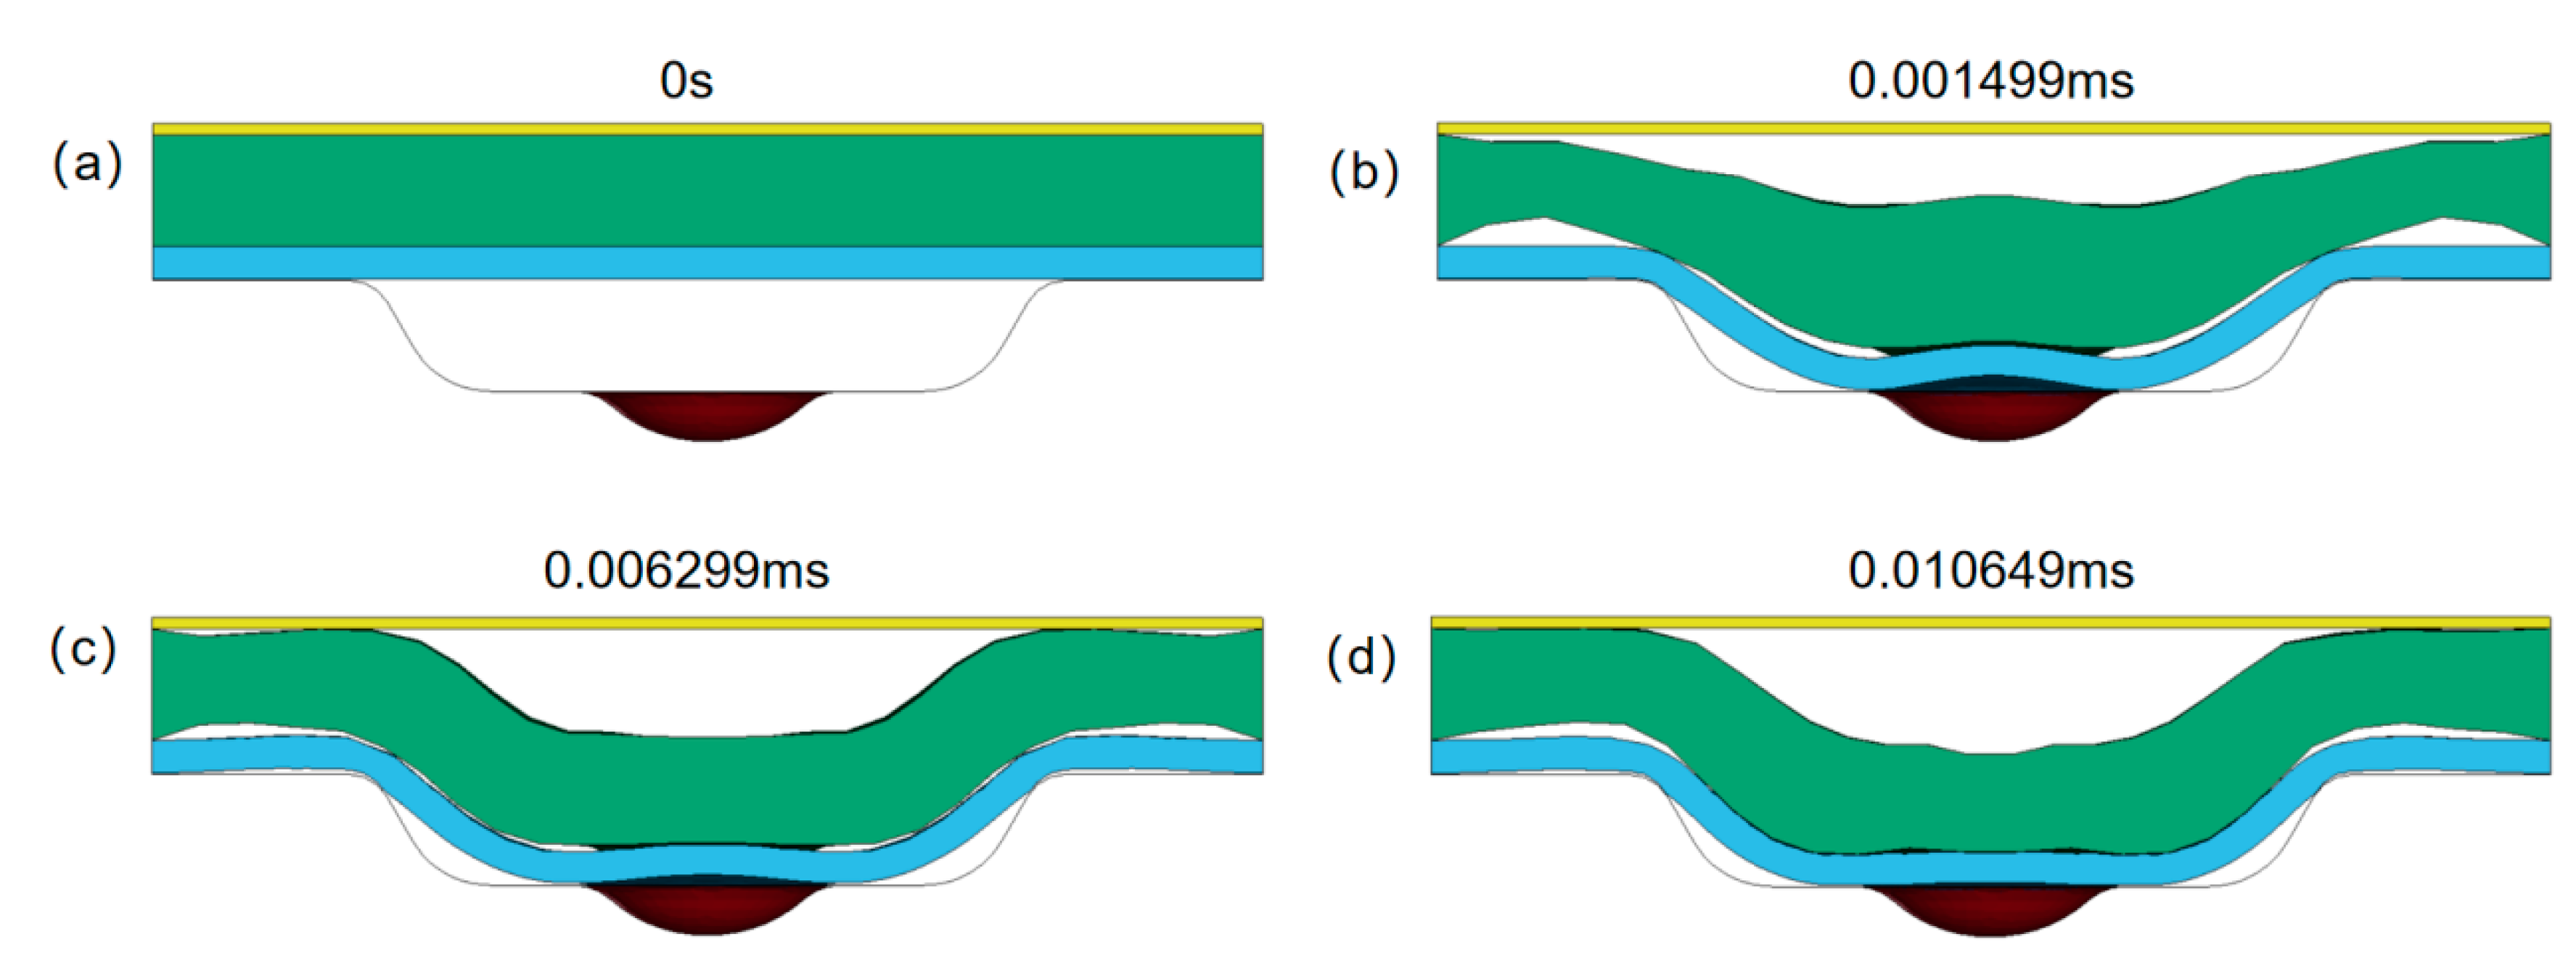
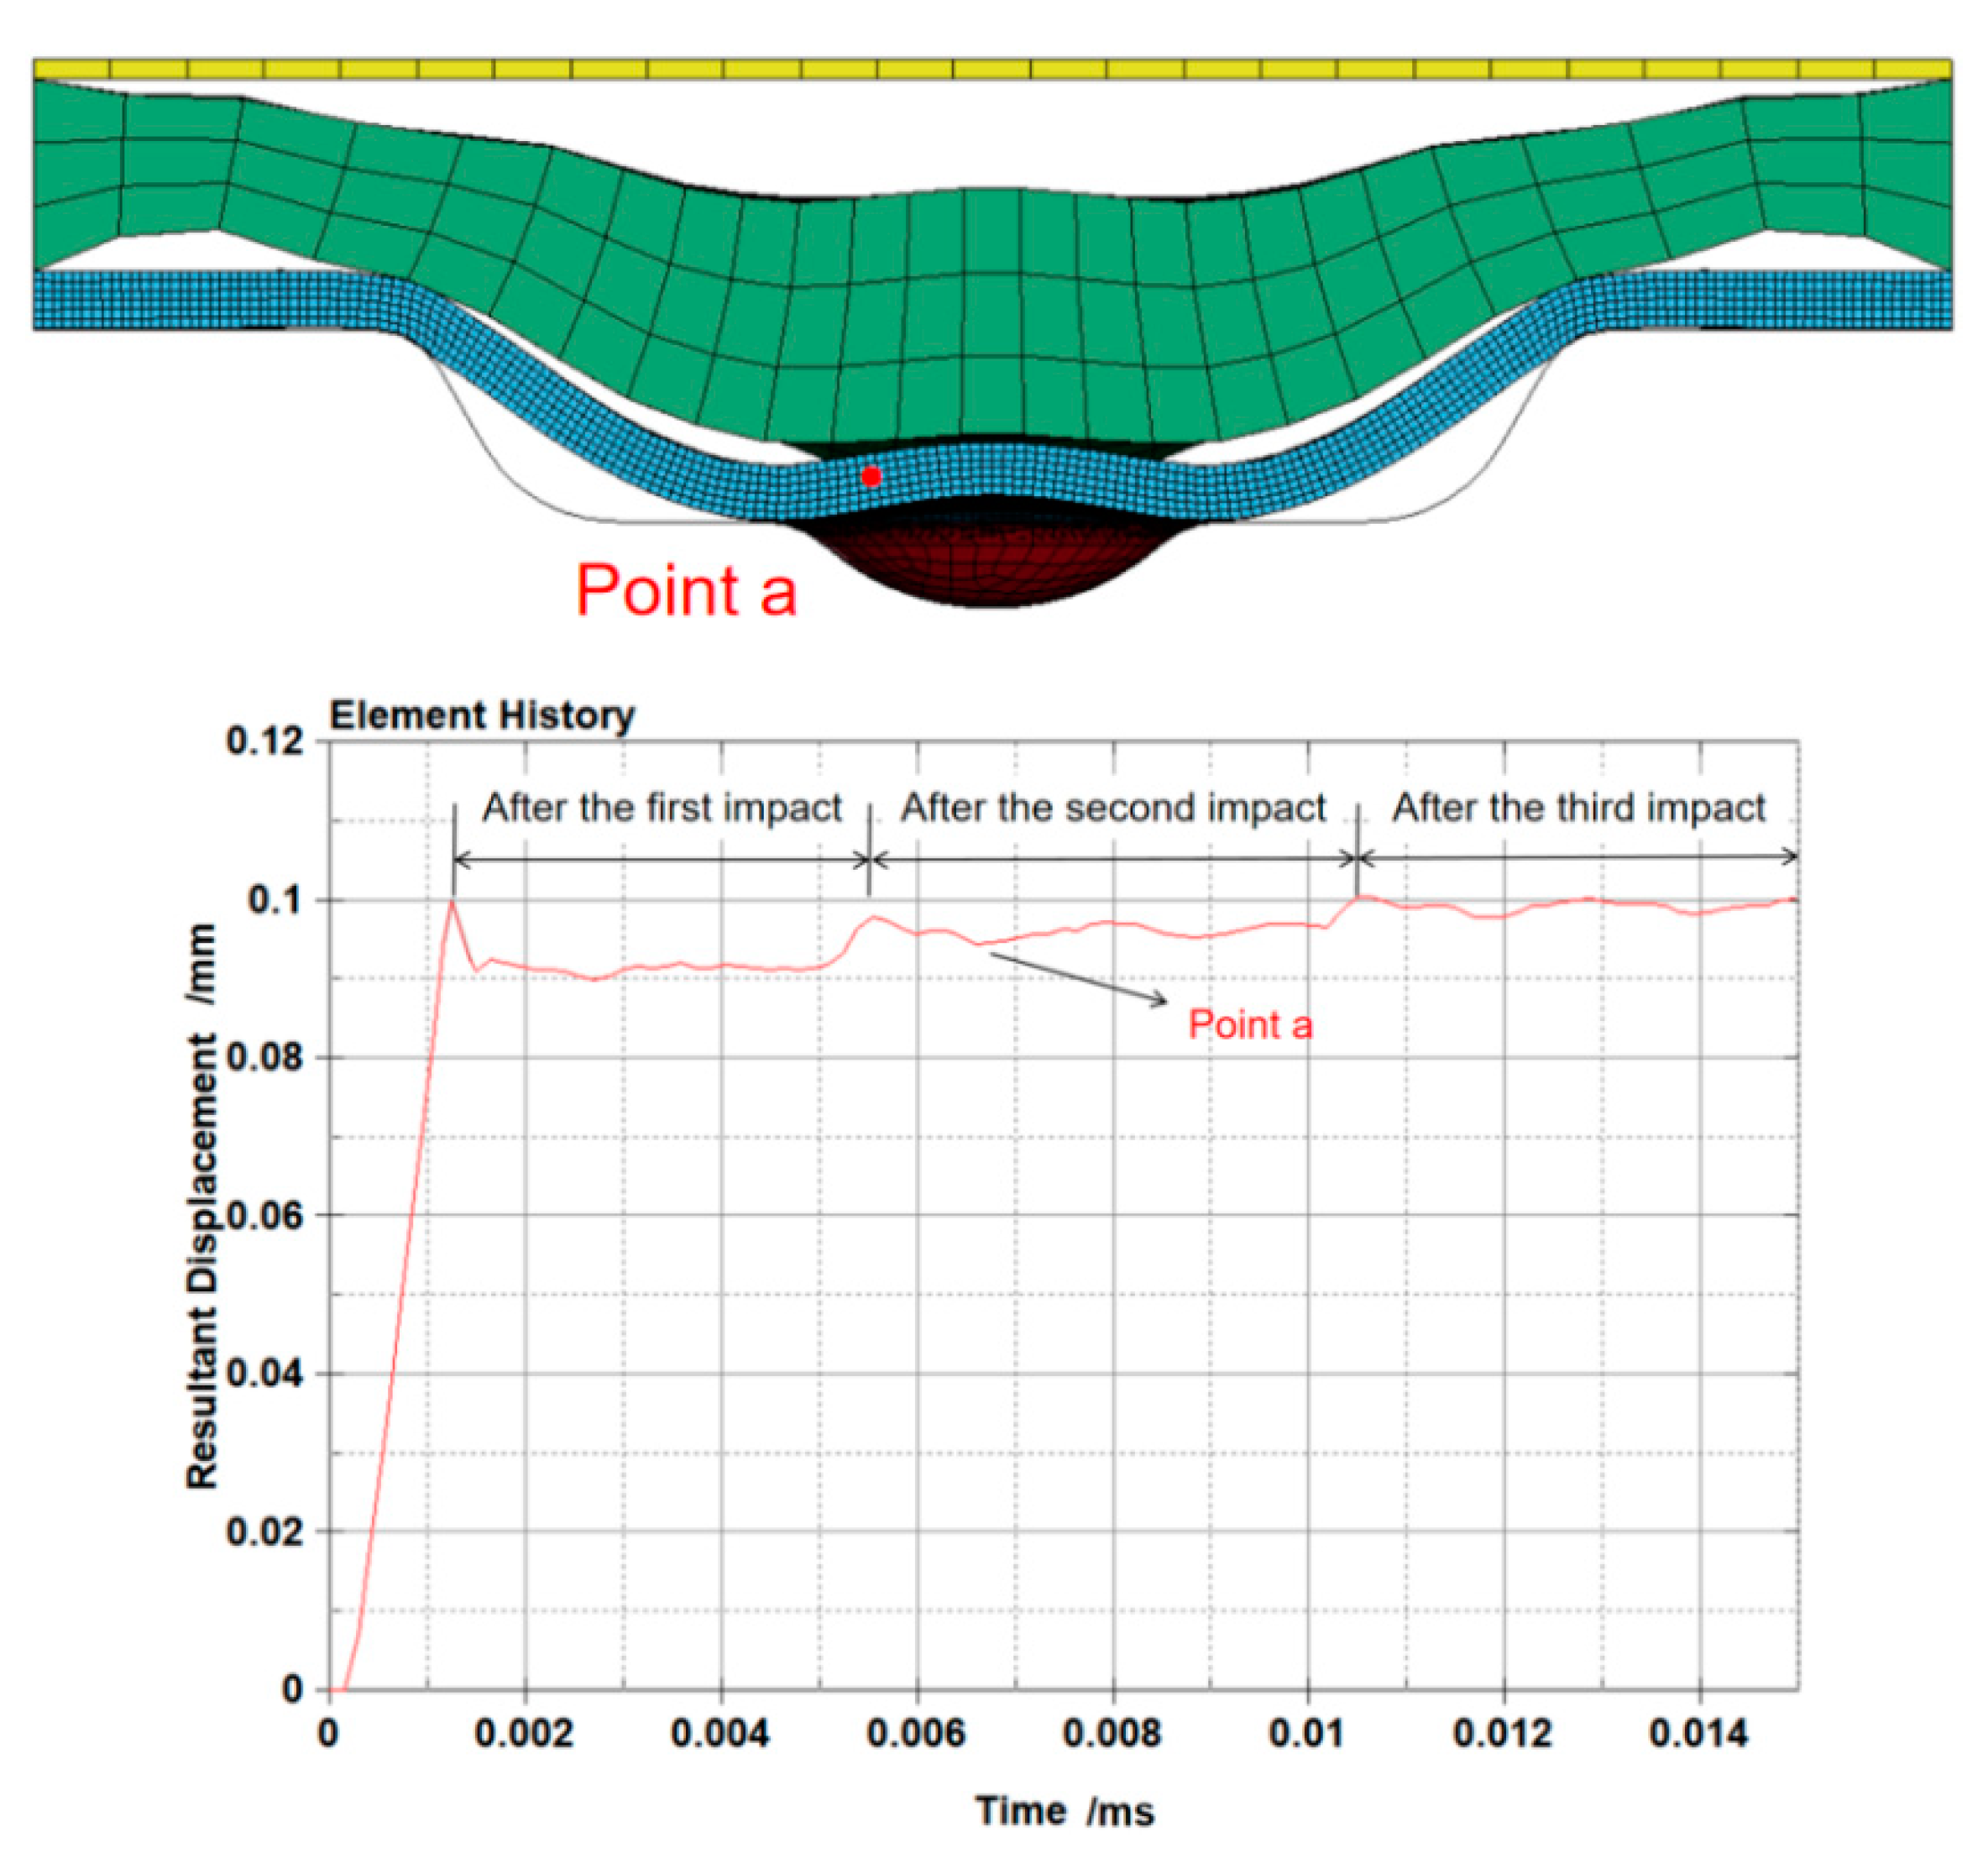
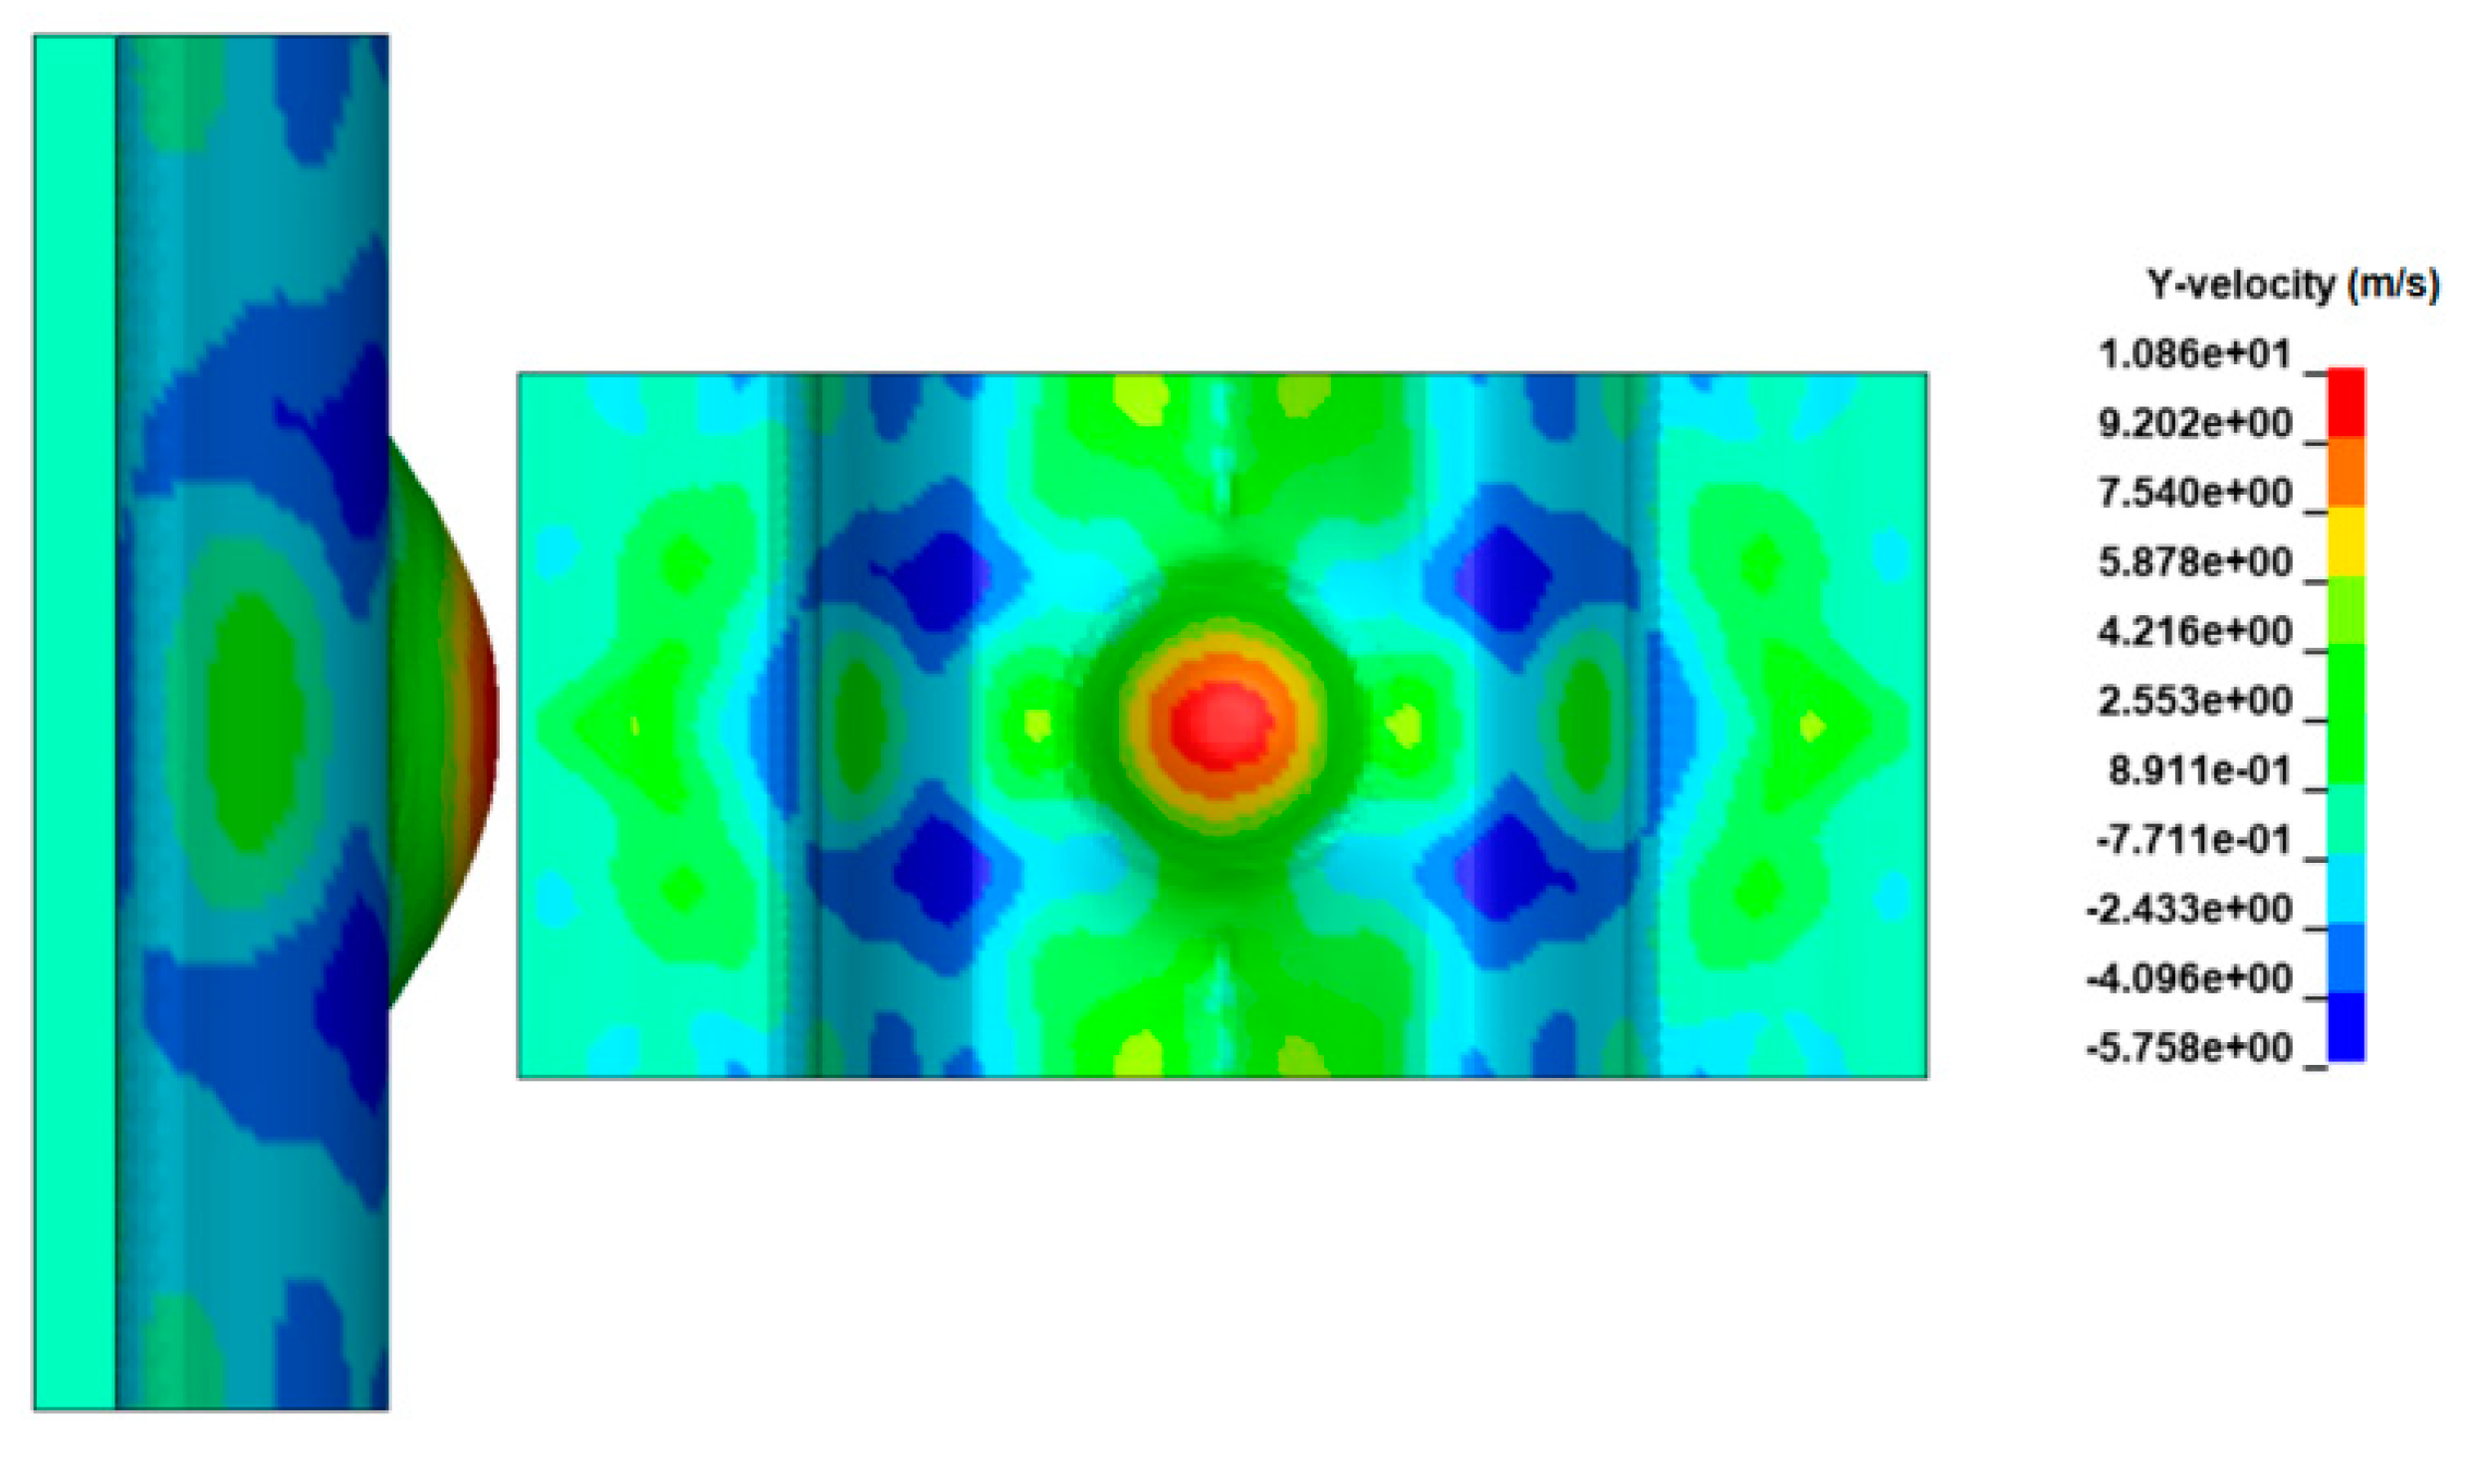
- The forming result of 30 μm thick workpieces after being impacted once, twice, and three times at different laser energies was investigated. In the ANSYS post-processing software, displacement history curves of the rebound regions were characterized. The results indicate that the workpiece exhibited a rebound effect after a single impact. However, by increasing the number of laser impacts, the rebound effect can be successfully suppressed. At high laser energy densities, impacting twice is sufficient to suppress the rebound effect, while at low laser energy densities, three impacts are required to effectively eliminate the rebound effect.
- (2)
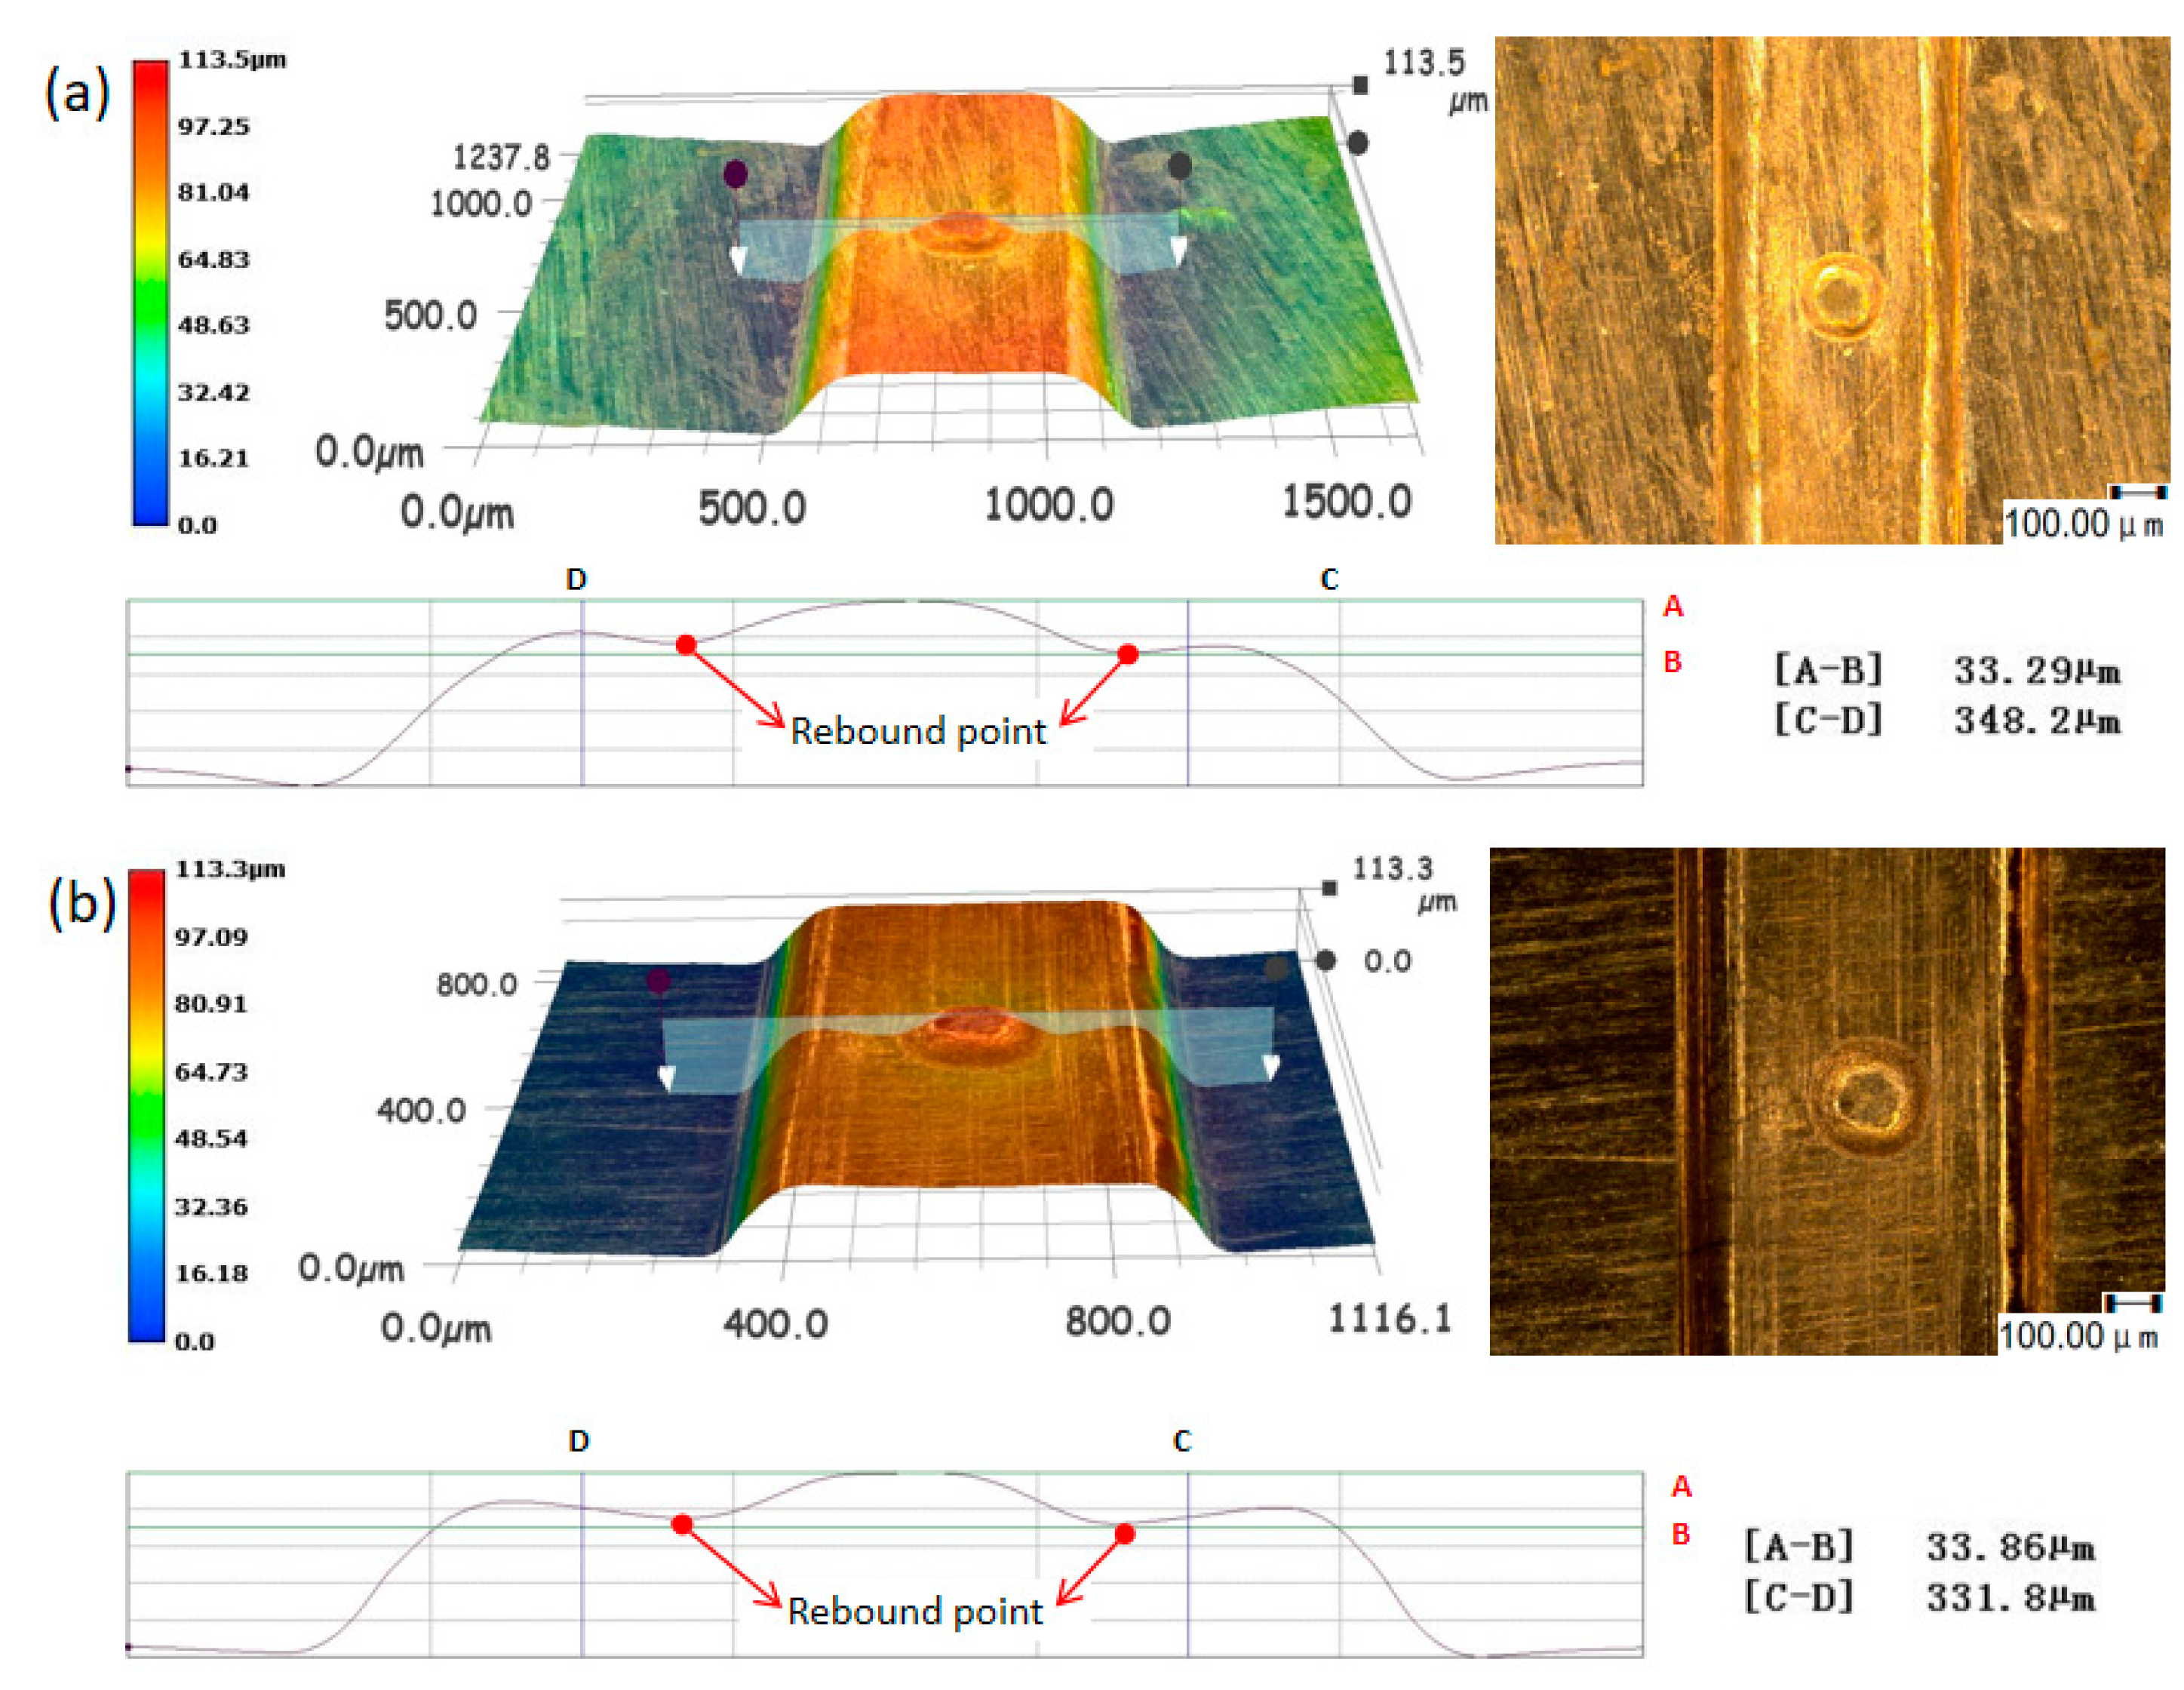
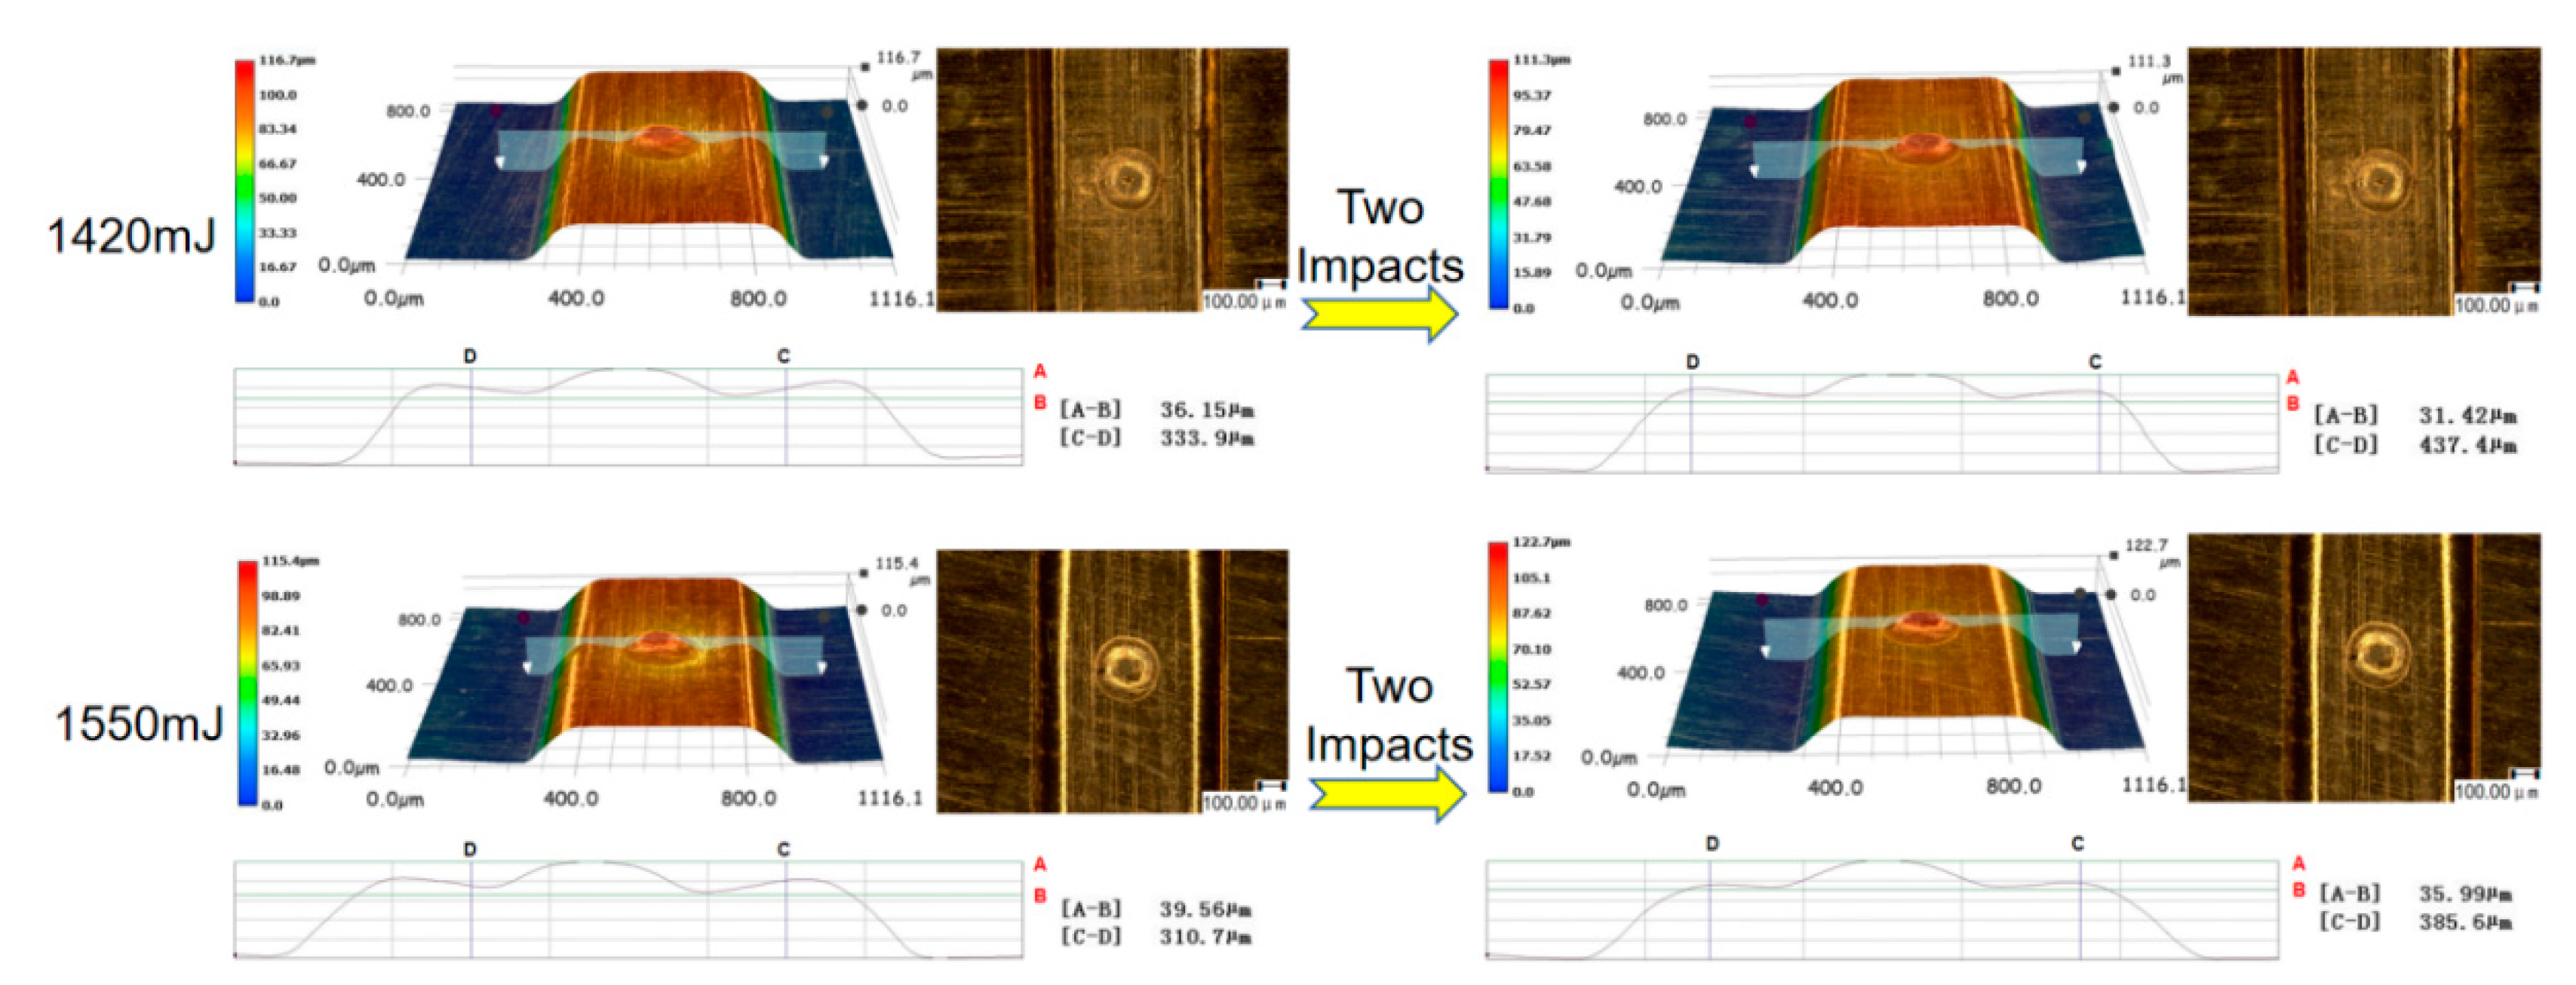
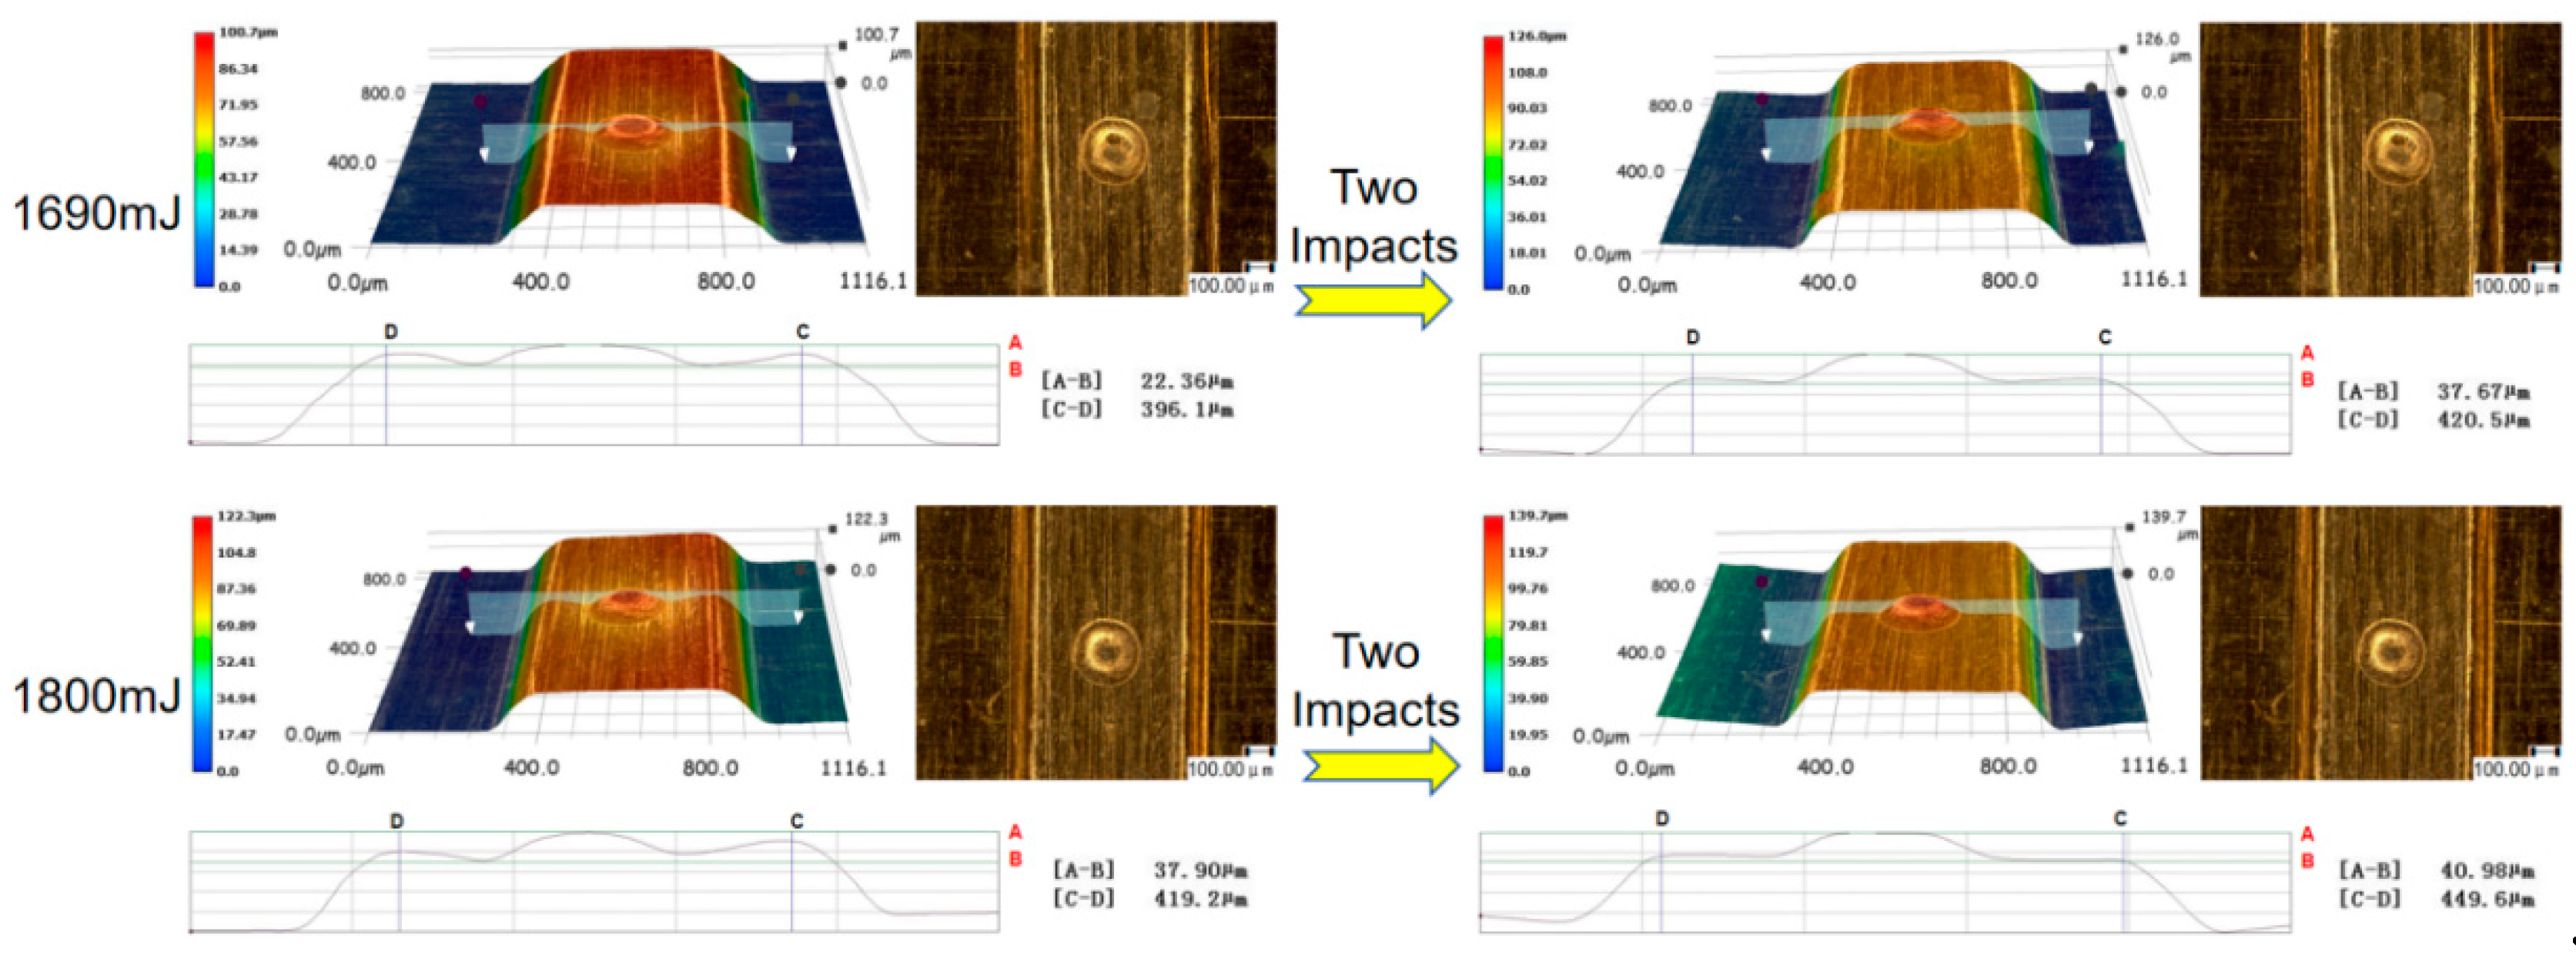
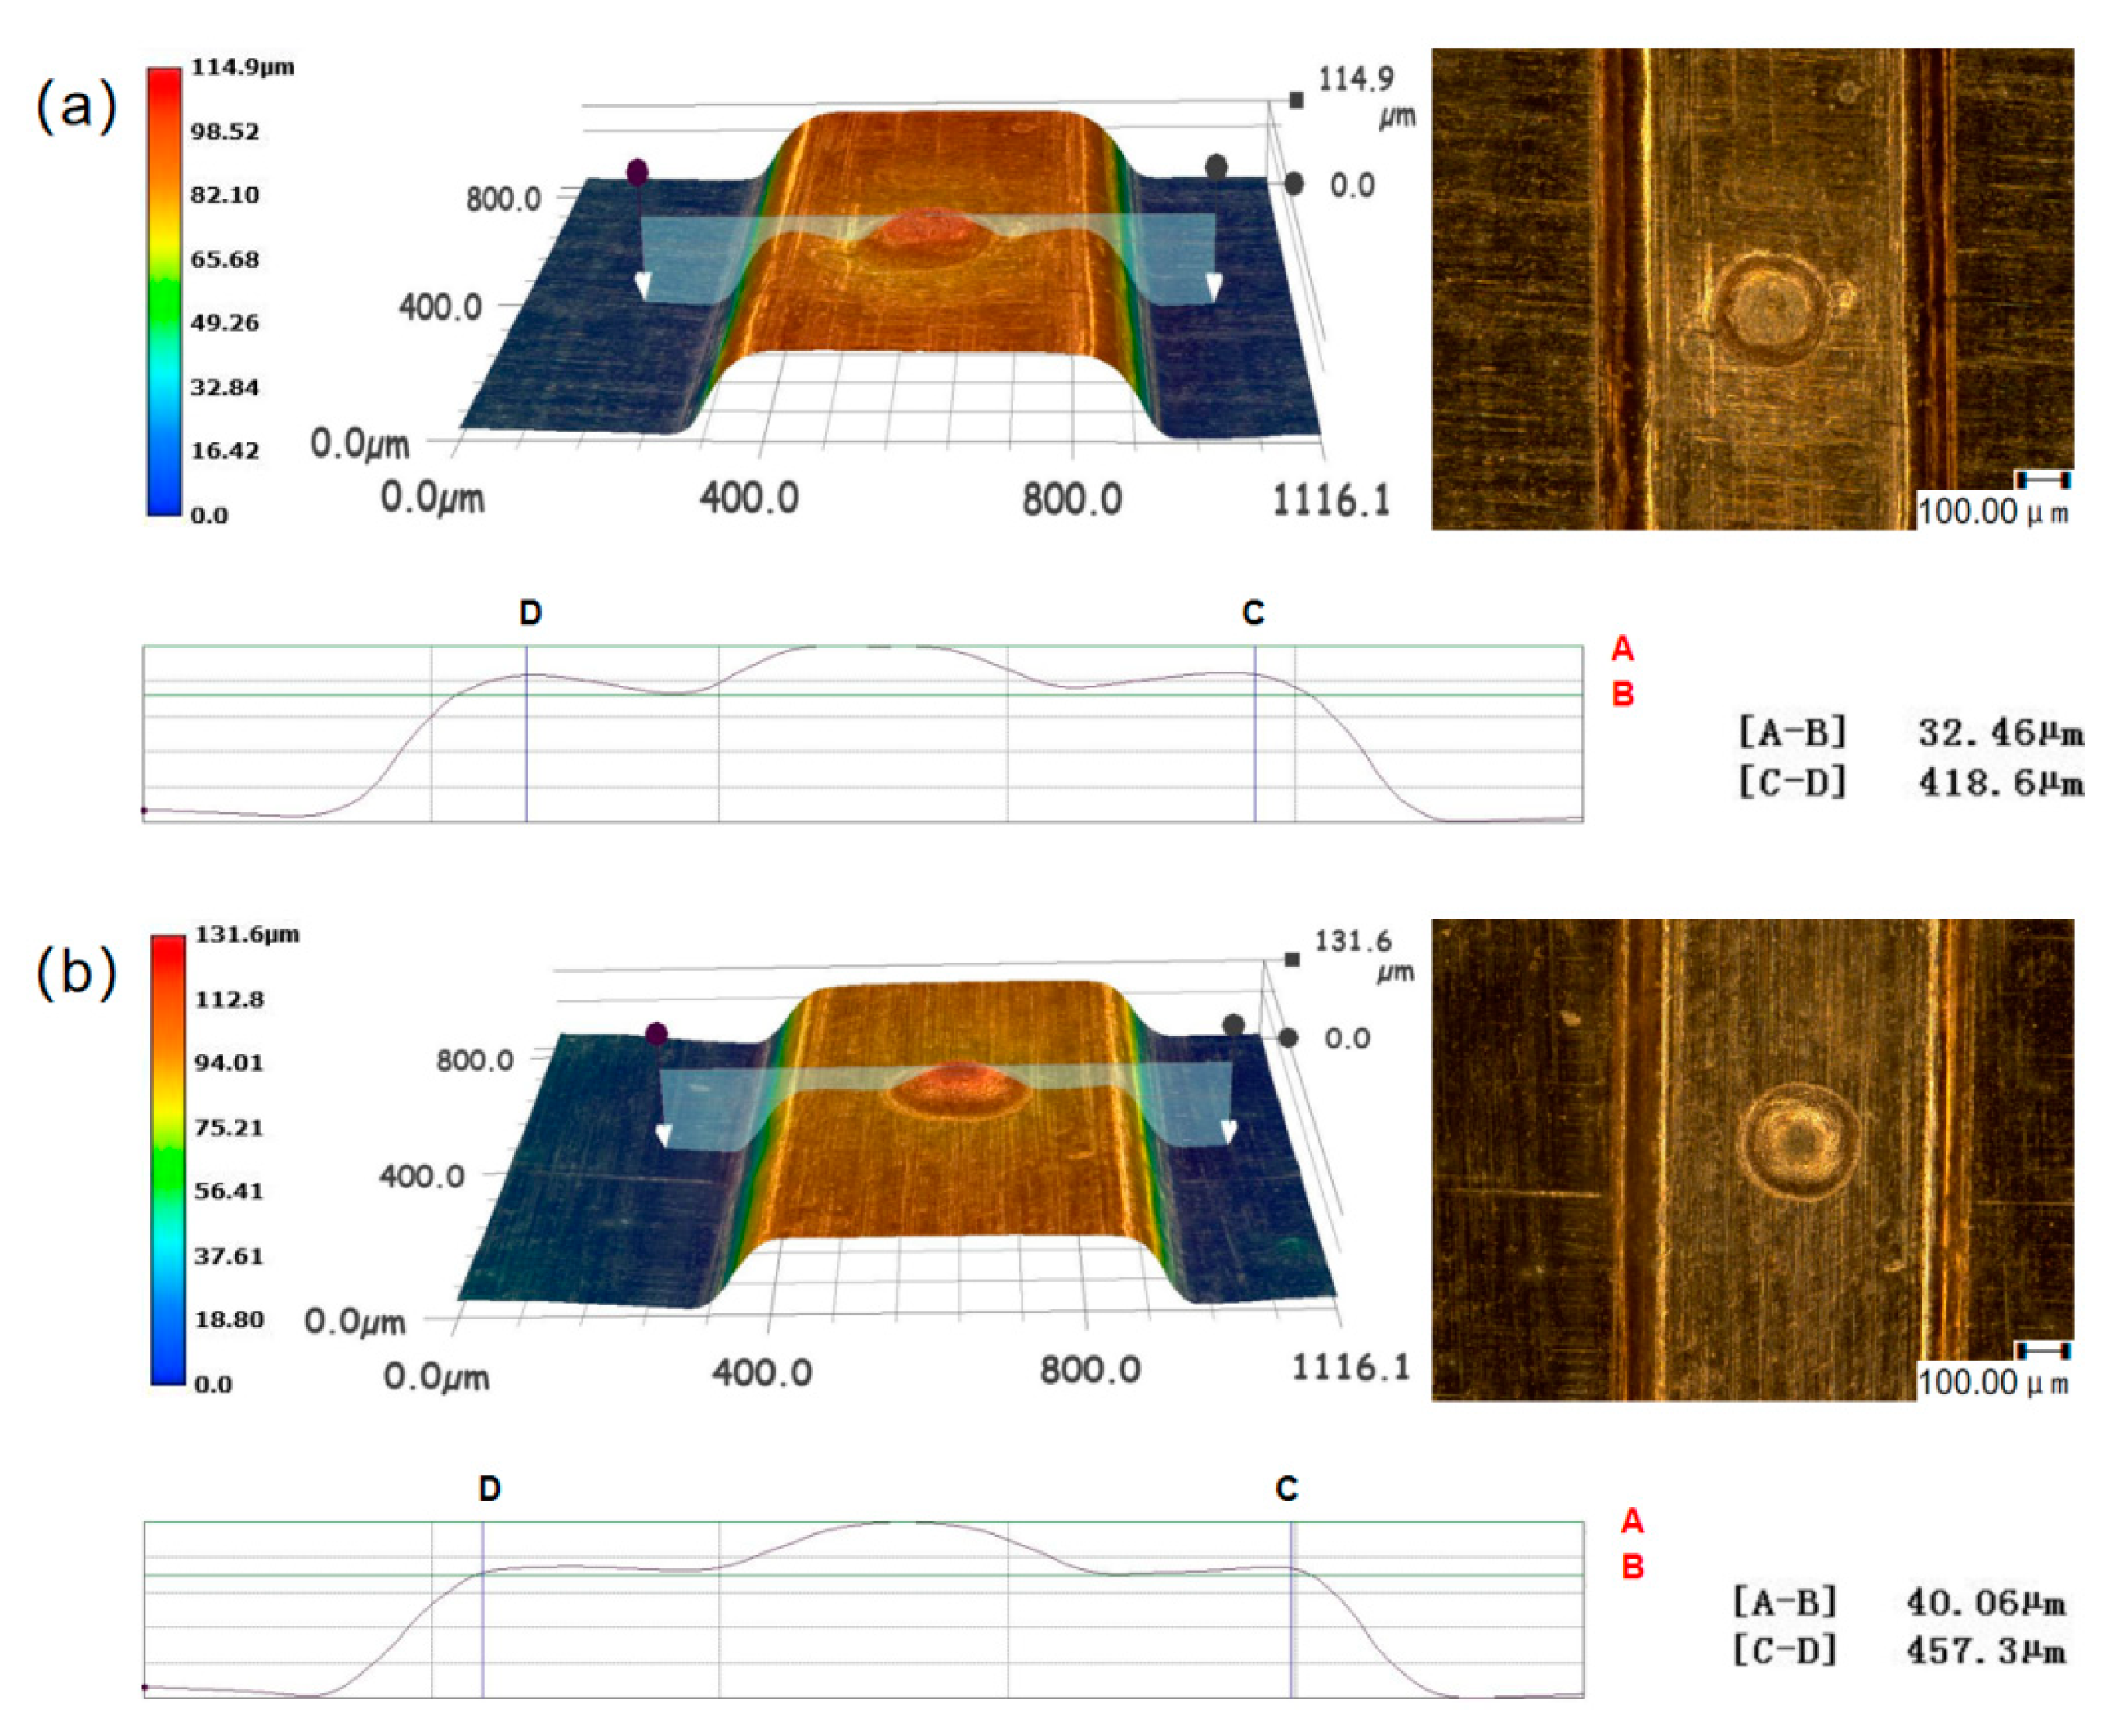
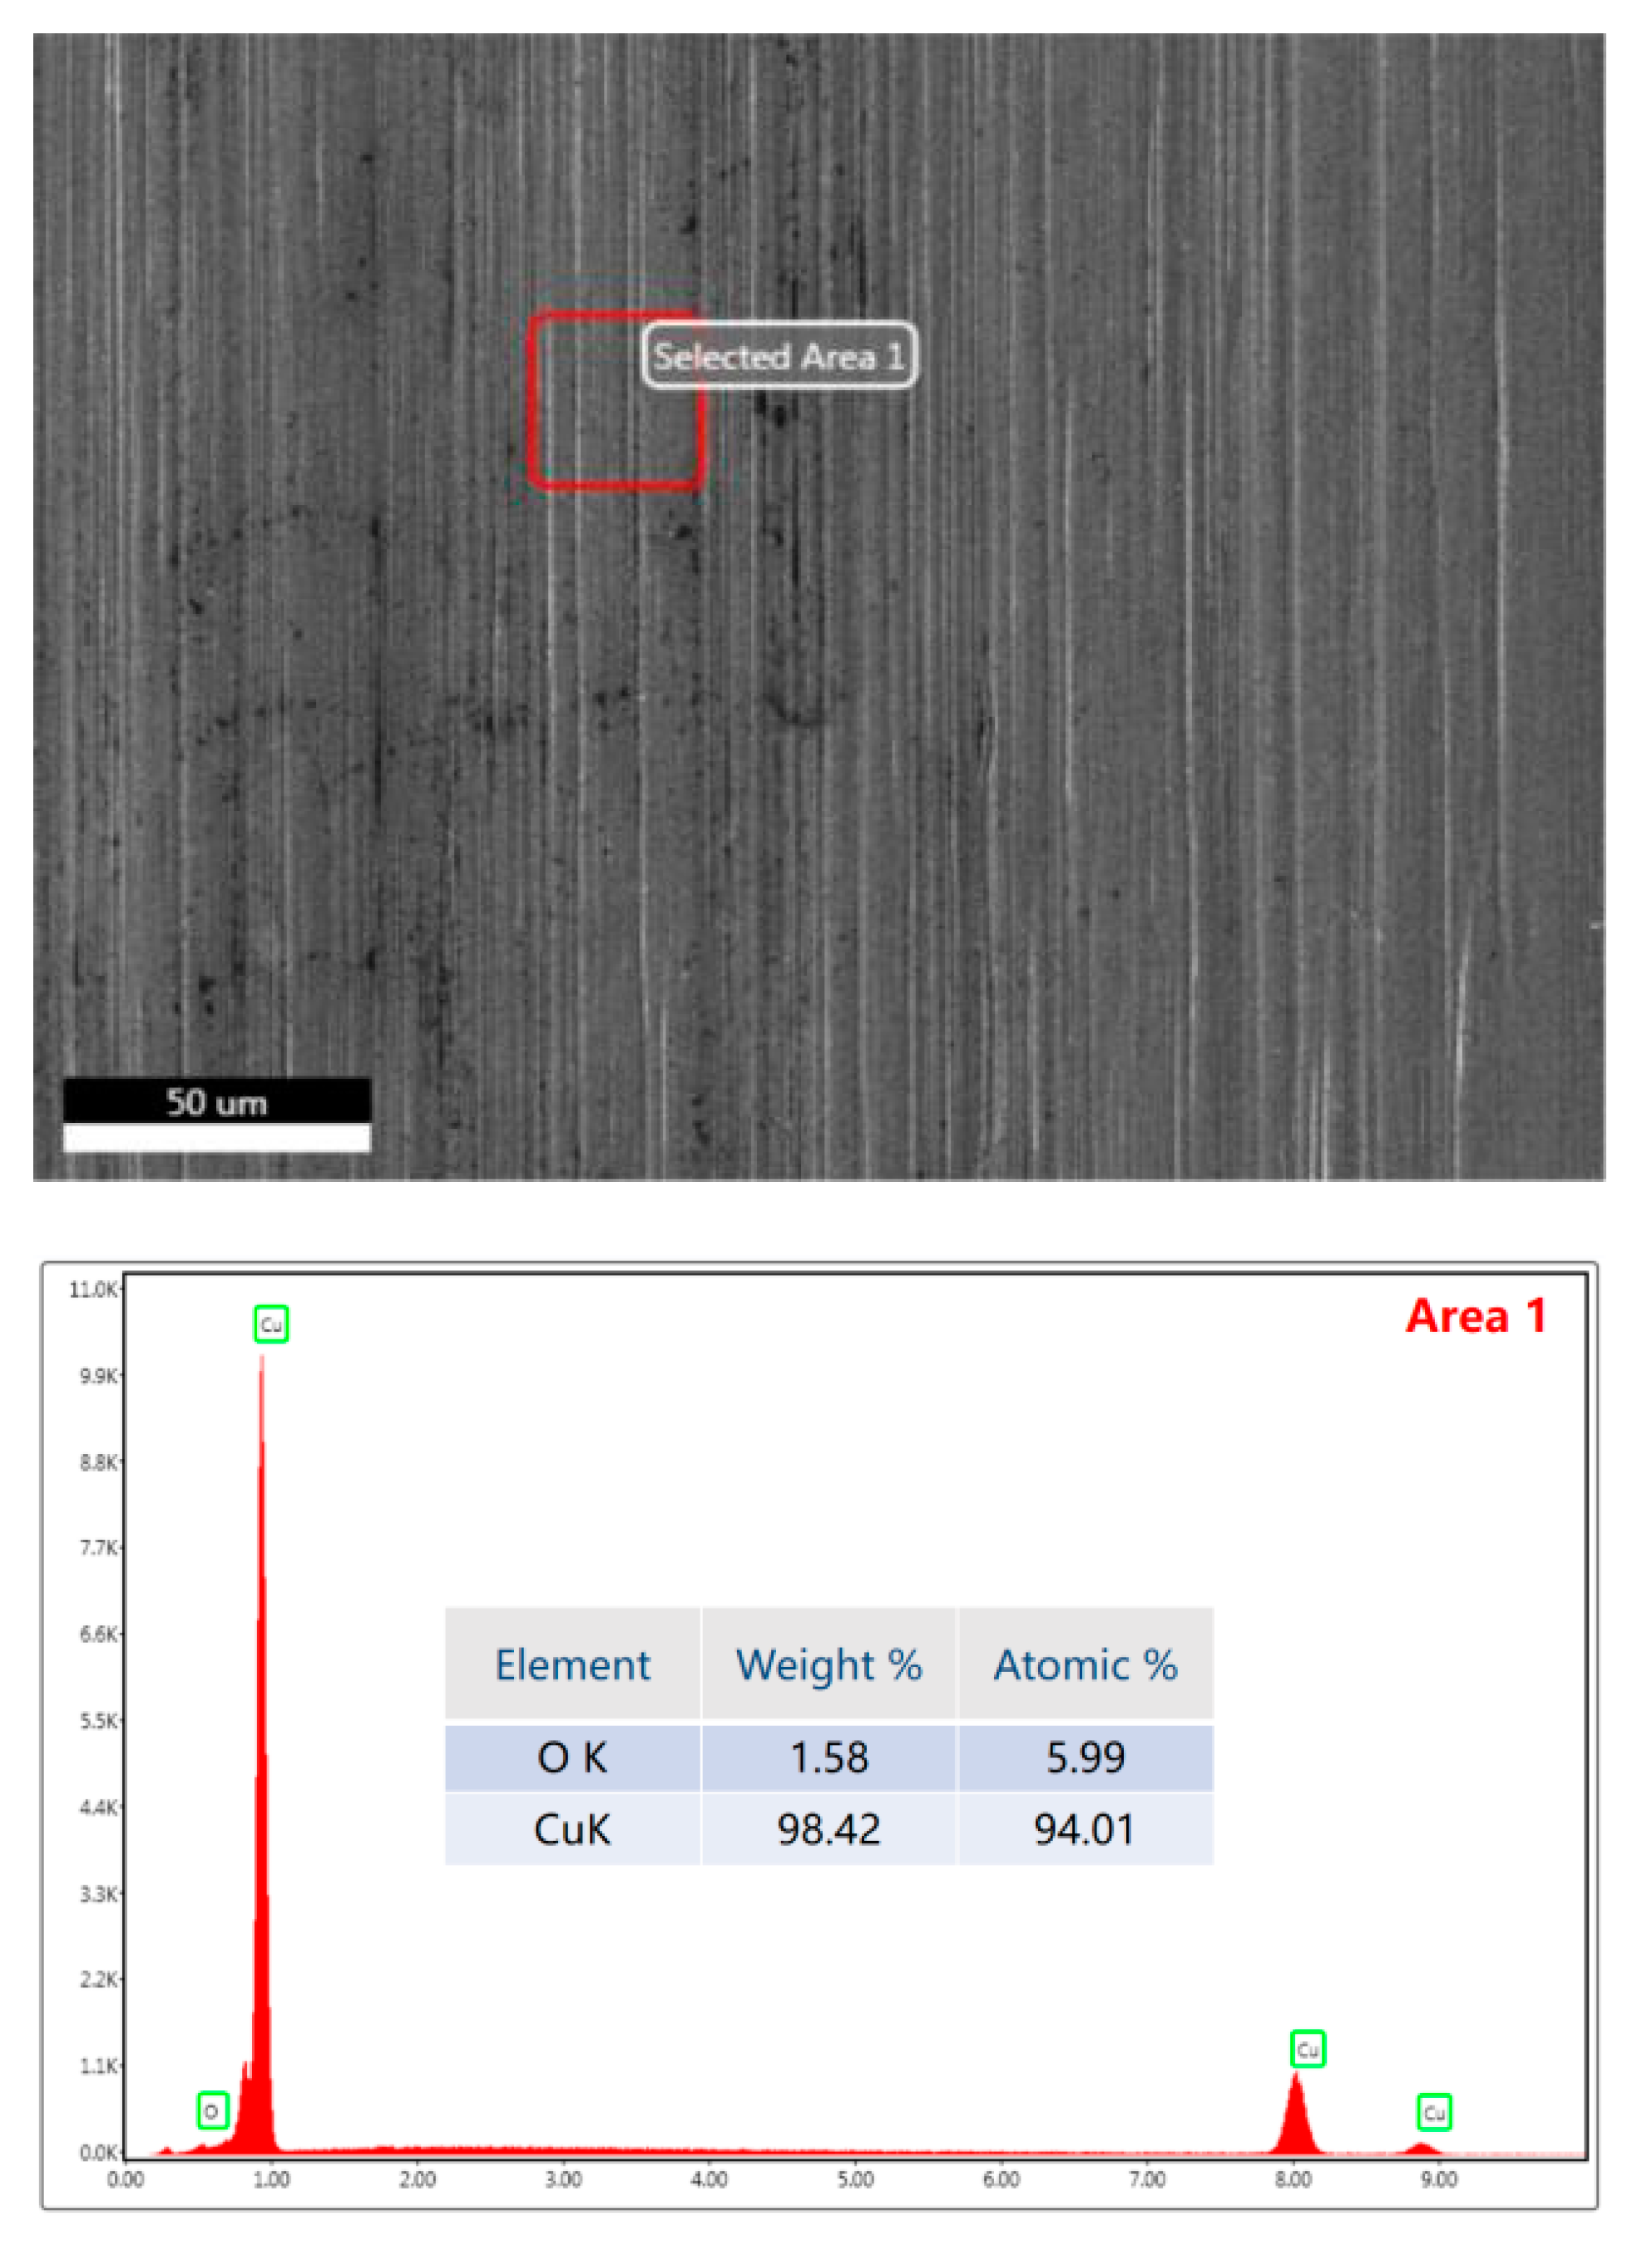
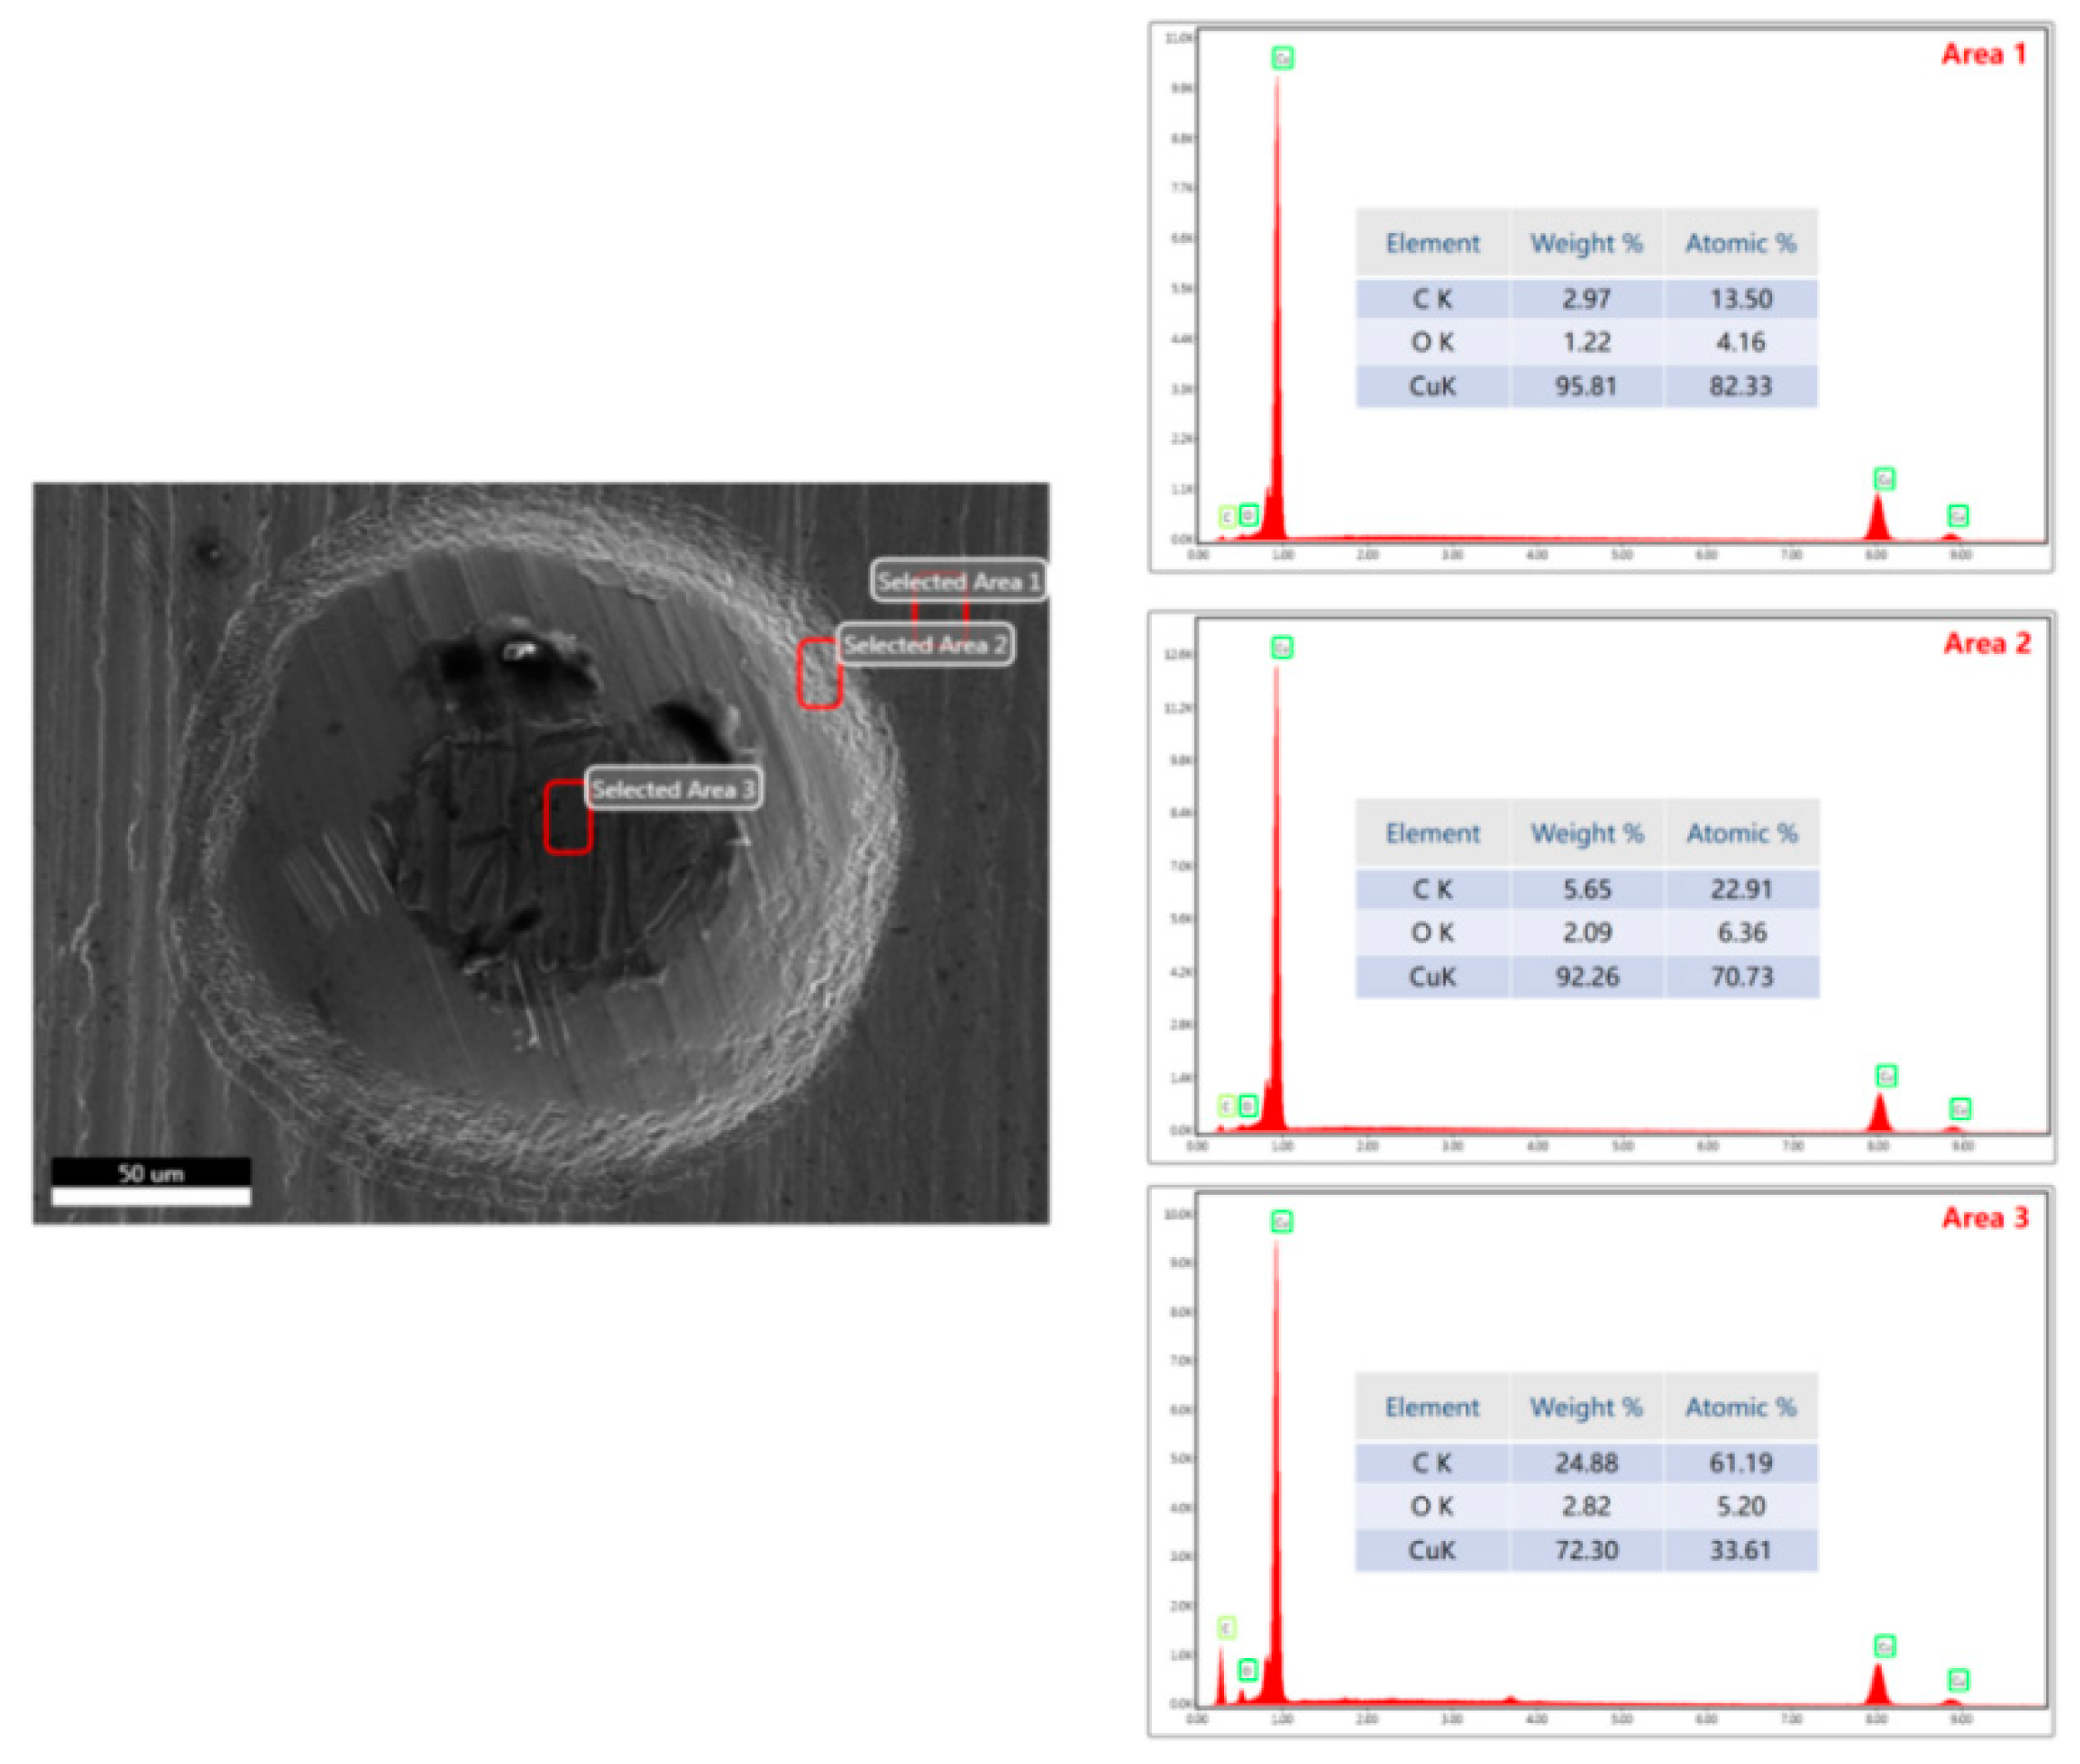
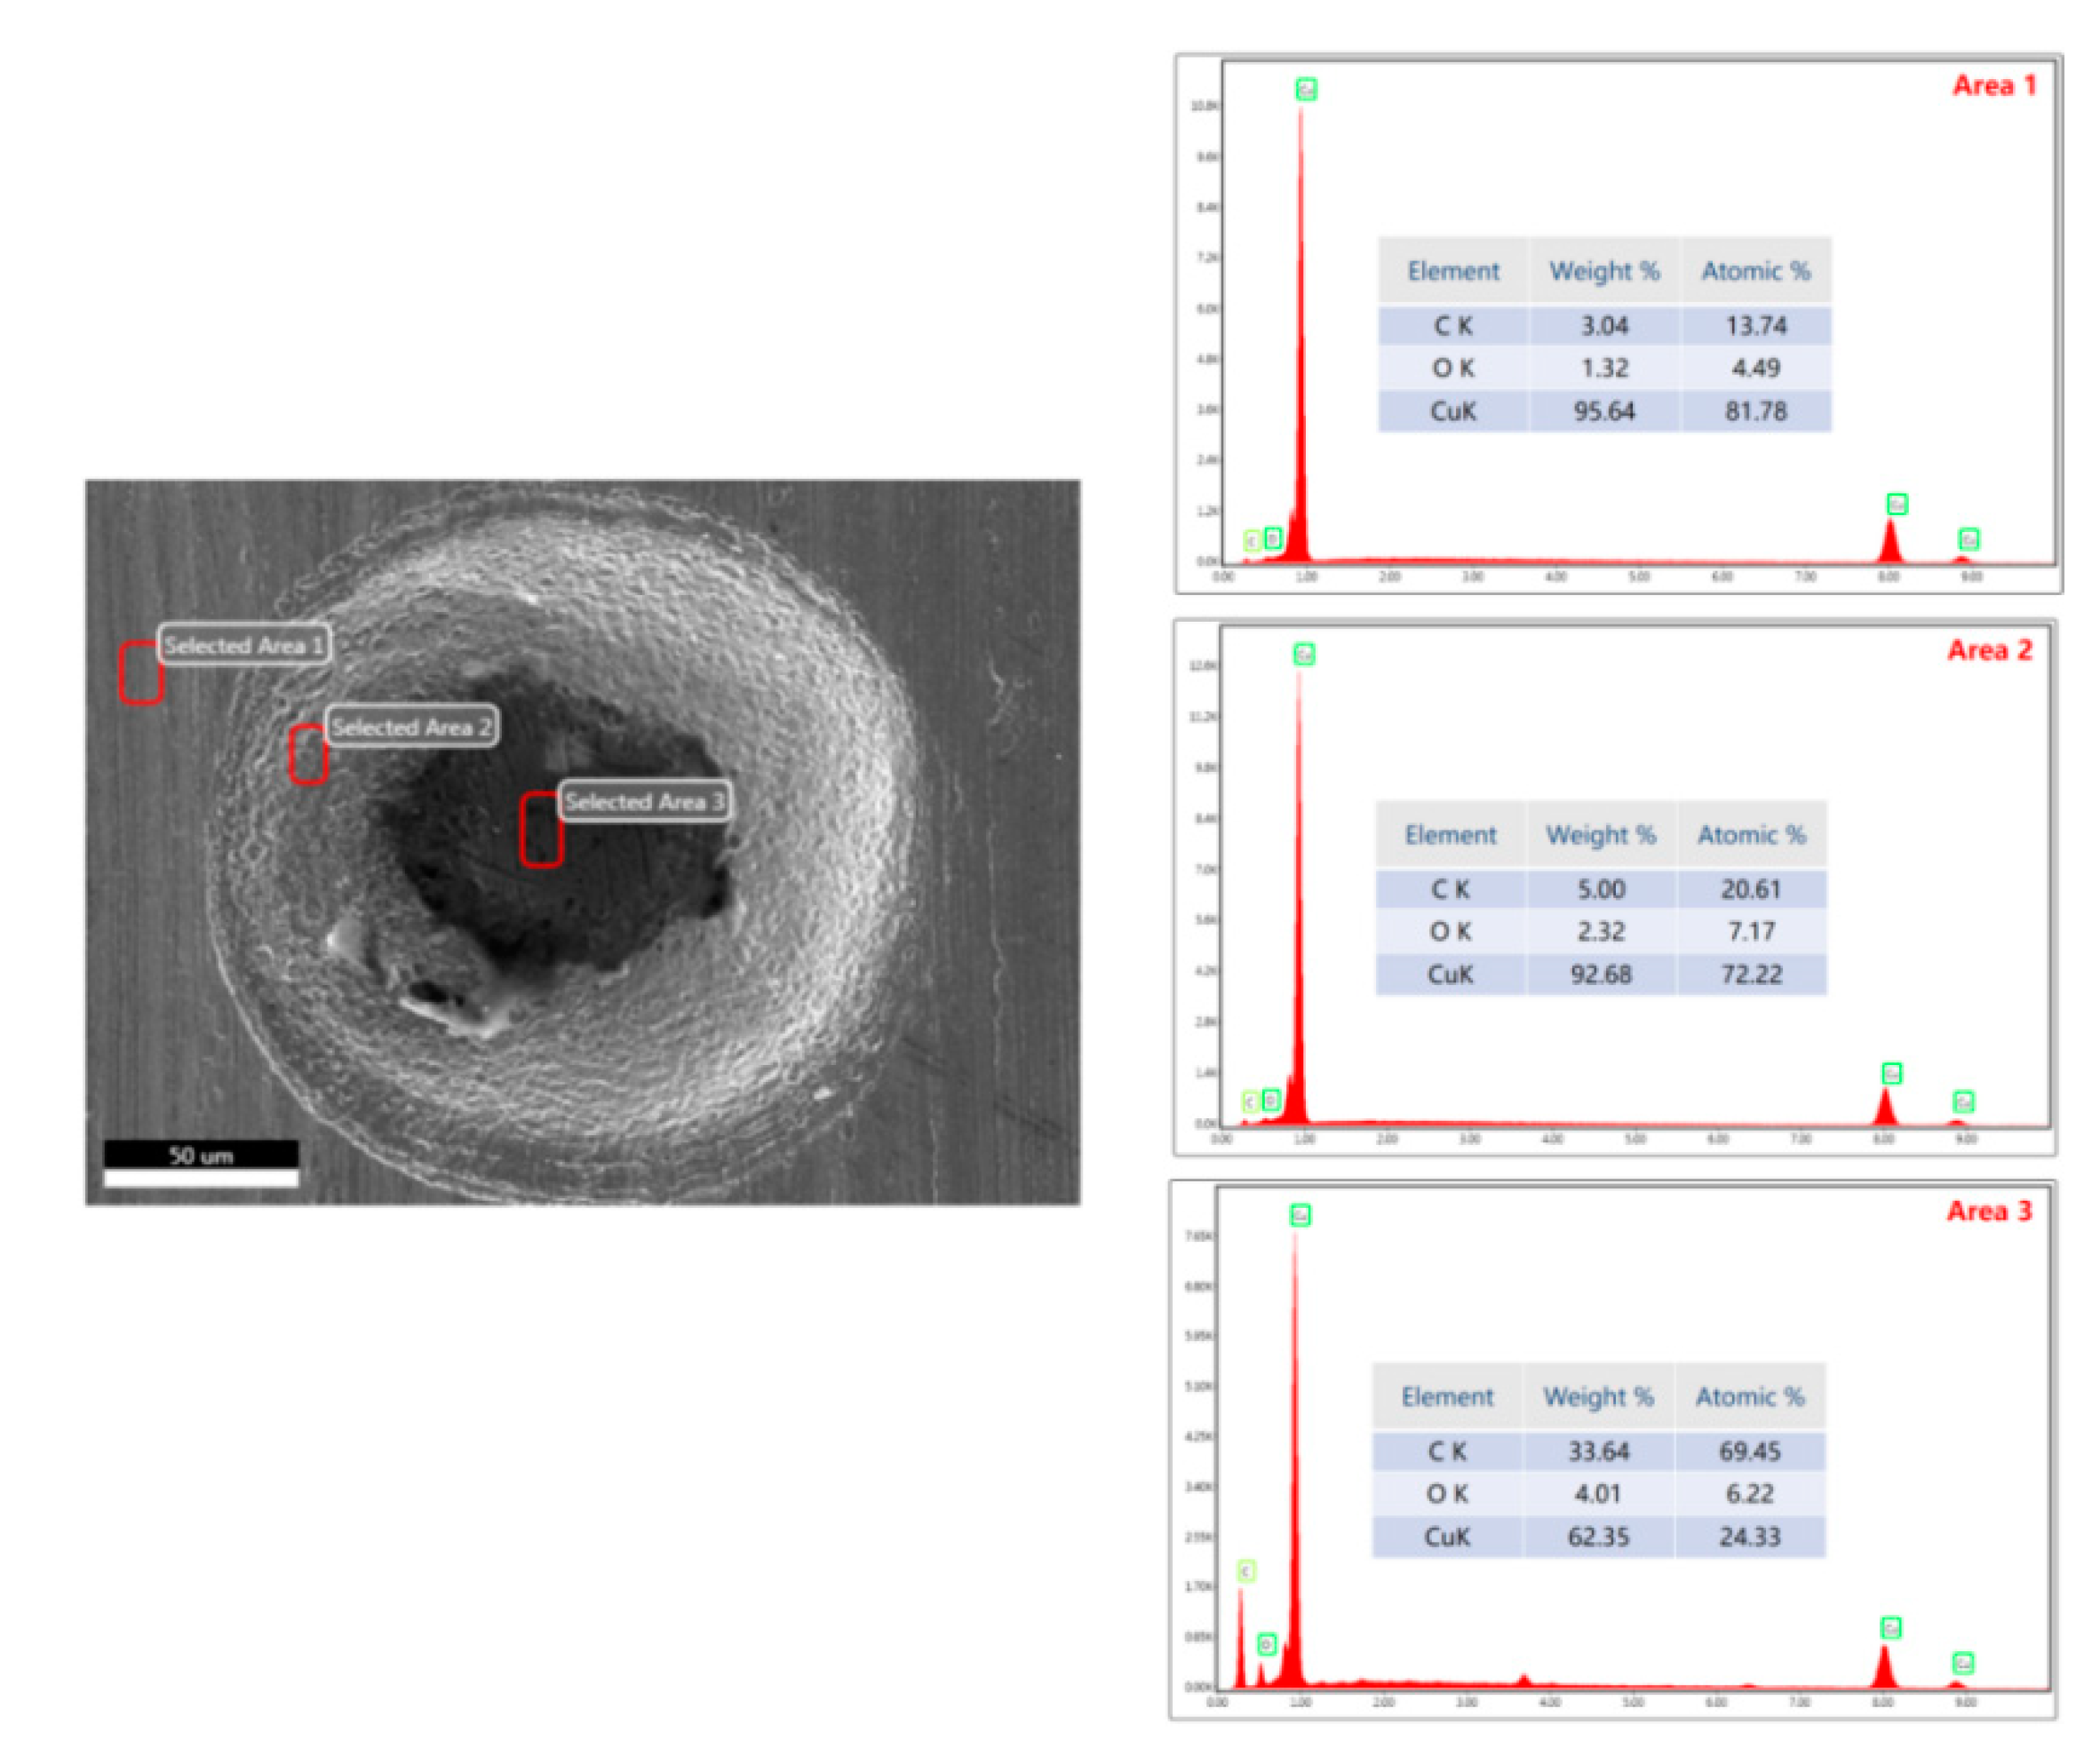
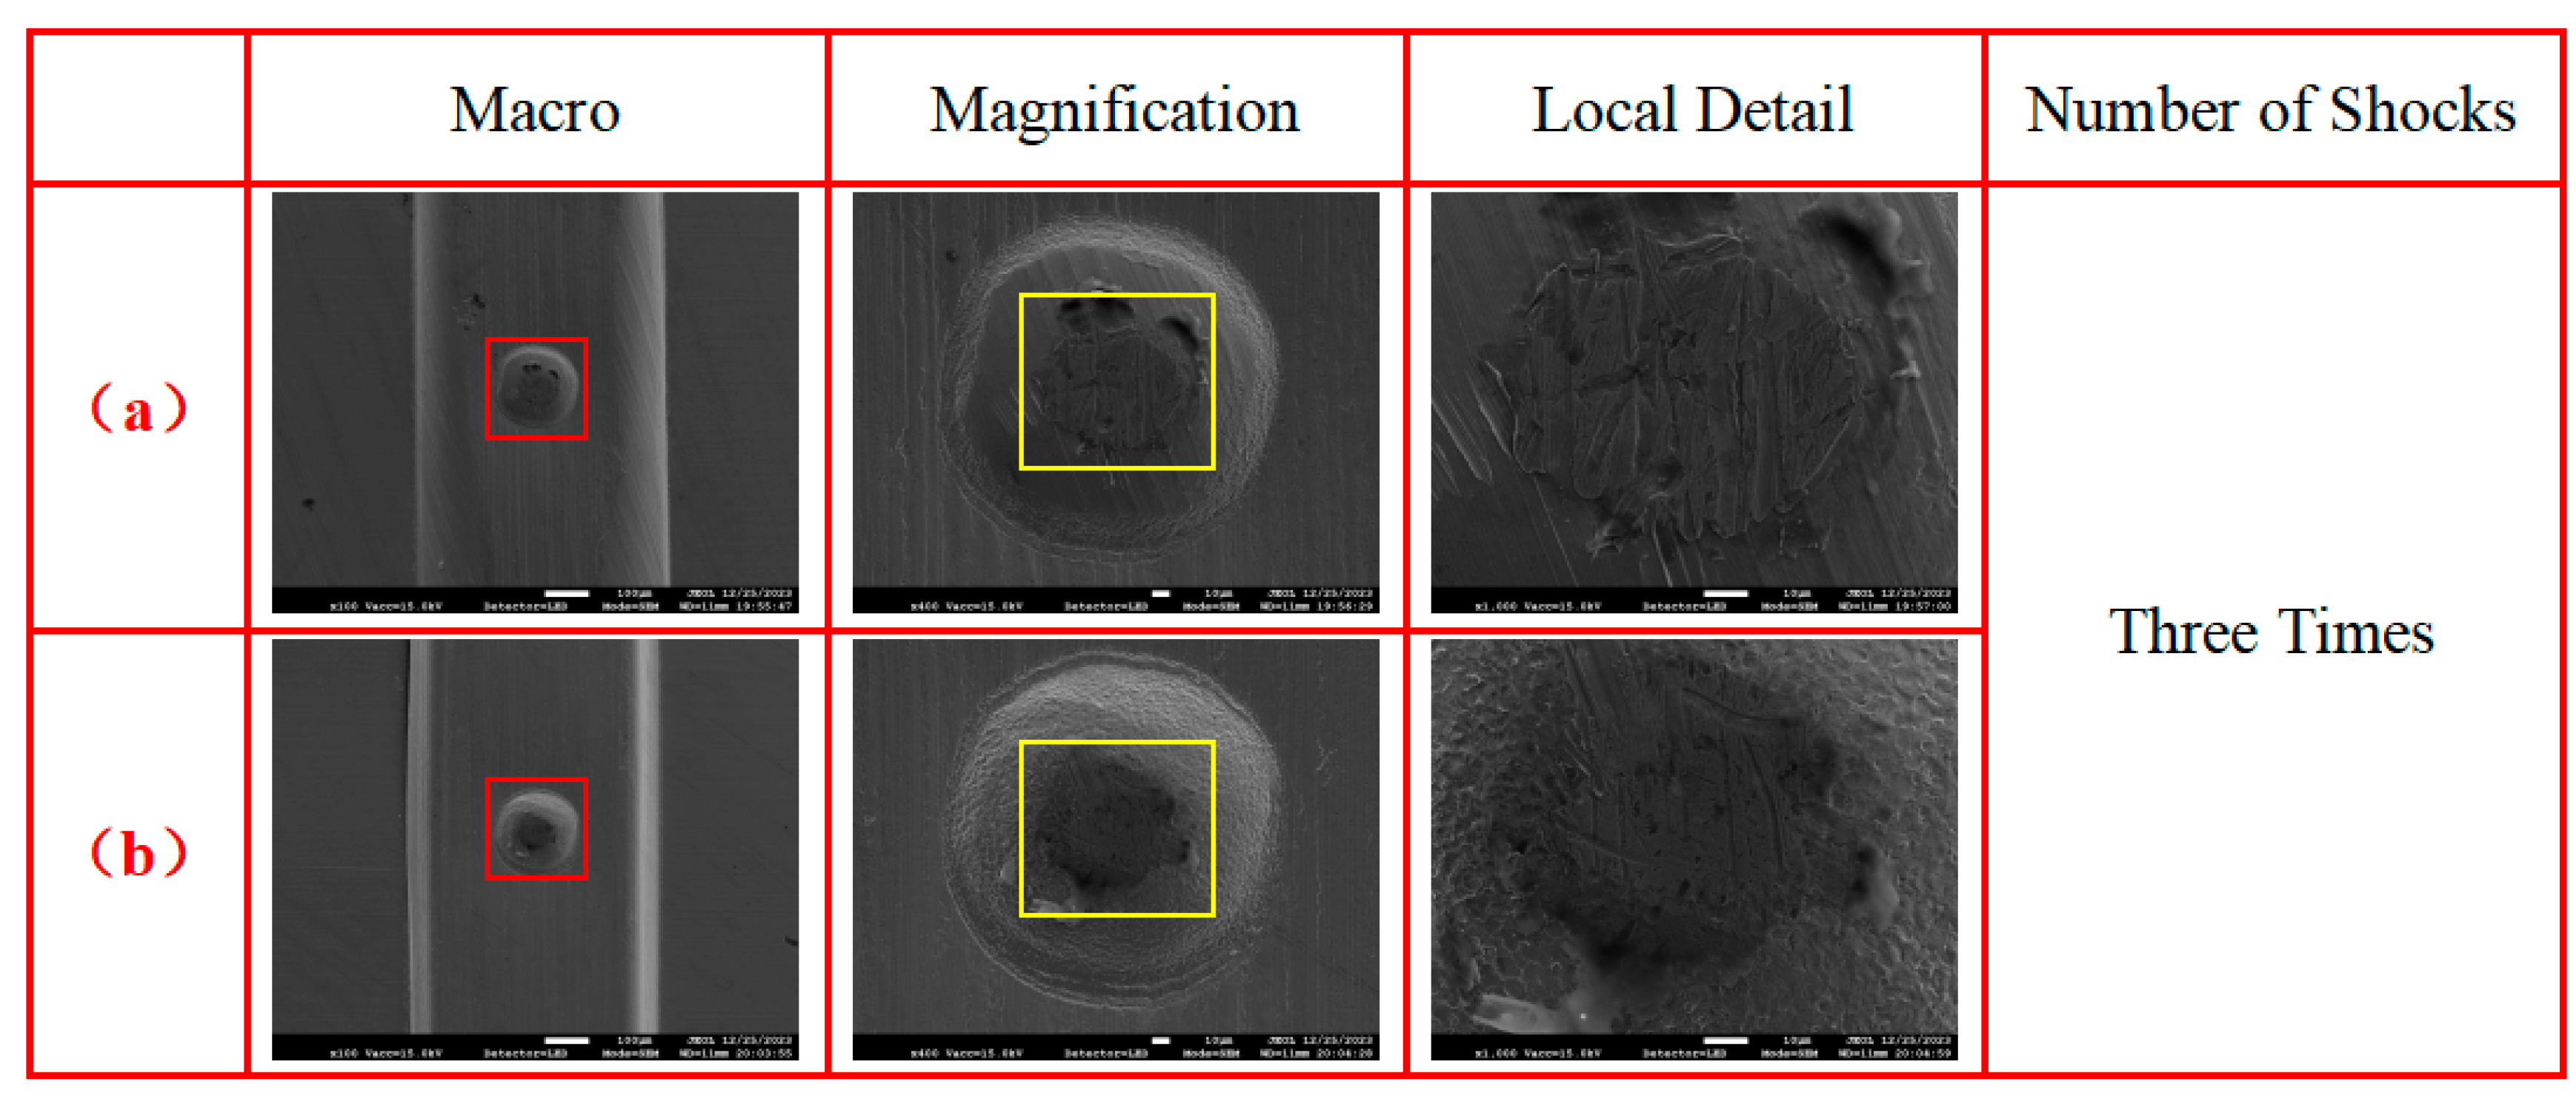
- The numerical simulation results were verified through specific experiments, exploring the forming results of workpieces subjected to multi-pulse laser impacts in actual experiments. The surface morphology and three-dimensional contours of the formed workpieces were characterized, and the experimental results were consistent with the numerical simulations. The comparative analysis of both results indicated that appropriately increasing the number of laser impacts according to the laser energy density can effectively suppress the rebound effect during workpiece forming. Through the combined methods of numerical simulation and experimental validation, it was found that the rapid temperature rise on the material surface due to high strain rate deformation during the forming process, along with the difficulty in dissipating heat, exacerbated the occurrence of "carbonization." This phenomenon is the fundamental reason for the significant increase in C atom content measured after the experiments.
Author Contributions
Funding
Data Availability Statement
Conflicts of Interest
References
- Zhang H, Wang X, Ma Y, et al. Formability and mechanism of pulsed current pretreatment–assisted laser impact microforming[J]. The International Journal of Advanced Manufacturing Technology, 2021, 114(3): 1-19. [CrossRef]
- Tao Z, Xiao W, Di Z, et al. Laser shock micro-sheet bulk metal forming: numerical simulation and experimental validation[J]. International Journal of Material Forming, 2022, 16(1). [CrossRef]
- H. M, L. K. Inhibition of neoatherosclrotic restenosis after laser angioplasty, using paclitaxel administration accompanied by 5-aminolevulinic acid-mediated B-mode ultrasound-guided extracorporeal focused low-level confocal dual pulse electrohydraulic shock wave sonodynamic therapy[J]. Atherosclerosis, 2021, 331: e285-e285.
- Sato S, Hidai H, Matsusaka S, et al. Drilling, bonding, and forming conductive path in the hole by laser percussion drilling[J]. Precision Engineering, 2020, 61: 147-151. [CrossRef]
- K.V. Rama Sateesh; Dinesh Kumar Harursampath. Impact damage of hemispherical shells formed by direct metal laser sintering[J]. Materials Today: Proceedings, 2020, 22(Pt 4): 2983-2989. [CrossRef]
- Yuan L, Mengen D, Xixiang P, et al. Surface mechanical properties and micro-structure evolution of 7075 aluminum alloy sheet for 2-dimension ellipse ultrasonic vibration incremental forming: A pretreatment for laser shock peening[J]. Coatings, 2022, 12(12): 1914-1914. [CrossRef]
- Shen Z, Zhang J, Liu H, et al. Reducing the rebound effect in micro-scale laser dynamic flexible forming through using plasticine as pressure-carrying medium[J]. International Journal of Machine Tools and Manufacture, 2019, 141: 1-18. [CrossRef]
- Zheng C, Tian Z, Zhao X, et al. Effect of pulsed laser parameters on deformation inhomogeneity in laser shock incremental forming of pure copper foil[J]. Optics and Laser Technology, 2020, 127: 106205-106205. [CrossRef]
- Xin G, Xiao W, Jiankun C, et al. Laser shock composite microforming of Fe-based amorphous alloys[J]. Mater Res Express, 2021, 8(3): 036511-. [CrossRef]
- Tao W, Maomao C, Huixia L, et al. Effect of laser shock on the compacting characteristics and rebound behavior of composite powders (Al2O3/Al) with different alumina contents[J]. Optics and Laser Technology, 2024, 168. [CrossRef]
- Feifei Z, Kai H, Zheng L, et al. Strain-rate effect on anisotropic deformation characterization and material modeling of high-strength aluminum alloy sheet[J]. Metals, 2022, 12(9): 1430-1430. [CrossRef]
- Yang H, Wang X, Ni P, et al. Construction of high strain rate loading constitutive model and failure model and prediction of forming limit for la103z magnesium alloy[J]. Metals and Materials International, 2021, 28(8): 1-10. [CrossRef]
- Li J, Cheng G J, Asme. Effect of multiple pulses on the deformation behavior of ultrathin metal foils in 3d micro-scale laser dynamic forming[C]//ASME International Manufacturing Science and Engineering Conference. NEW YORK. Amer Soc Mechanical Engineers, 2011: 299-306.
- Wang X, Yang X, Huang W, et al. Effect of hot deformation on the dynamic precipitation and mechanical properties of AA2099 Al–Li alloy[J]. Journal of Alloys and Compounds, 2024, 985: 173928-. [CrossRef]
- Shahaboddin S, Mahdi B M, Hossein T-G. Numerical-experimental investigation of using rubber blank holder on wrinkling of metallic bipolar plates formed by stamping process[J]. International Journal of Hydrogen Energy, 2023, 48(62): 23967-23991. [CrossRef]
- Johnson G R, Cook W H. A constitutive model and data for metals subjected to large strains, high strain rates and high temperatures[J]. Engineering Fracture Mechanics, 1983, 21: 541-548.
- Christophe, Poizat, Laurence, et al. Modeling and simulation of thin sheet blanking using damage and rupture criteria[J]. International Journal of Forming Processes, 2005. [CrossRef]
- Bae G, Xiong Y, Kumar S, et al. General aspects of interface bonding in kinetic sprayed coatings[J]. Acta Mater, 2008, 56(17): 4858-4868. [CrossRef]
- Wang X, Du D Z, Zhang H, et al. Investigation of microscale laser dynamic flexible forming process-simulation and experiments[J]. Int J Mach Tools Manuf, 2013, 67: 8-17. [CrossRef]
- Dirikolu A H, Akdemir E. Computer aided modelling of flexible forming process[J]. J Mater Process Technol, 2004, 148(3): 376-381. [CrossRef]

| Materials | A | B | C | n | m | |||
|---|---|---|---|---|---|---|---|---|
| T2 copper | 89.63 | 291.64 | 0.025 | 0.31 | 1.09 | 27 | 12 | 1.0 |
| Materials | A(Shore hardness) | C01 | C10 | poisson ratio |
|---|---|---|---|---|
| Urethanes | 70 | 0.184 | 0.736 | 0.49997 |
Disclaimer/Publisher’s Note: The statements, opinions and data contained in all publications are solely those of the individual author(s) and contributor(s) and not of MDPI and/or the editor(s). MDPI and/or the editor(s) disclaim responsibility for any injury to people or property resulting from any ideas, methods, instructions or products referred to in the content. |
© 2024 by the authors. Licensee MDPI, Basel, Switzerland. This article is an open access article distributed under the terms and conditions of the Creative Commons Attribution (CC BY) license (http://creativecommons.org/licenses/by/4.0/).


