1. Introduction
Human epidermal growth factor receptor 2 (HER2) is a member of receptor tyrosine kinases. Heterodimerization of HER2 with other HER family members and the ligands or ligand-independent HER2 homodimerization results in the autophosphorylation of the cytoplasmic domain. The event initiates a variety of signaling, such as RAS-ERK and PI3K-AKT pathways, leading to cancer cell proliferation, survival, and invasiveness [
1]. The overexpression of HER2 is observed in approximately 20% of breast cancers [
2] and 20% of gastric cancers [
3], which are associated with higher rates of recurrence and shorter overall survival.
Trastuzumab, an anti-HER2 monoclonal antibody (mAb), exhibited an
in vitro anti-proliferative efficacy and a potent antitumor effect
in vivo [
4,
5]. The combination of chemotherapy with trastuzumab improves objective response rates, progression-free survival, and overall survival in HER2-positive breast cancer patients with metastasis [
6]. Trastuzumab was approved by the U.S. Food and Drug Administration (FDA) for the treatment of HER2-positive breast cancer [
6] and has been the most effective therapy for it for more than 20 years [
7]. Trastuzumab is administered in patients with HER2-overexpressed tumors, which are defined by solid and complete membranous staining of more than 10% of cells in immunohistochemistry (IHC 3+) and/or
in situ hybridization (ISH)-amplified [
8]. Furthermore, trastuzumab-deruxtecan (T-DXd), a trastuzumab-based antibody-drug conjugate (ADC), has been developed and approved by the FDA [
9]. T-DXd exhibited superior efficacy in not only HER2-positive breast cancers [
10,
11] but also HER2-low (IHC 1+ or IHC 2+ / ISH-non-amplified) advanced breast cancers [
12], HER2-mutant lung cancers [
13]. Because half of all breast cancers are classifiable as HER2-low, a significant number of patients is estimated to receive the benefit from T-DXd therapy [
14].
The immunologic engagement of trastuzumab mediates the clinical efficacy [
4]. Antibody-dependent cellular cytotoxicity (ADCC) is elicited by natural killer (NK) cells or macrophages upon the binding of Fcγ receptors (FcγRs) to the Fc region of mAbs [
4]. Trastuzumab is a humanized IgG
1 mAb that binds to FcγRs [
15] and activates macrophages, dendritic cells, and neutrophils, which change adaptive immune responses by antigen presentation, cytokine production, and chemotaxis [
4]. Moreover, the FcγR binding results in the activation of NK cells and macrophages, which can result in the target cell killing [
4]. However, the ADCC is impaired by the
N-linked glycosylation in the Fc region [
16]. In particular, a lack of core fucose on the Fc
N-glycan enhances the Fc binding to the FcγRs on effector cells [
17]. Therefore, a core fucose deficiency on the Fc
N-glycan has been shown to enhance the binding to FcγR on effector cells [
17] and exerts potent antitumor effects [
18]. The defucosylated recombinant mAbs can be produced using fucosyltransferase 8-knockout Chinese hamster ovary (CHO) cells [
19].
The complement-dependent cellular cytotoxicity (CDC) is also exerted by the Fc domain of mAbs [
20,
21]. Although complements have been thought of as an adjunctive component of the antibody-mediated cytolytic effects, complement is currently considered an essential effector of tumor cytotoxic responses of mAb-based immunotherapy [
21]. Through the development of a chimeric anti-CD20 mAb, rituximab, for the treatment of B cell lymphomas, the involvement with the cytolytic capacity of complement was revealed in the antitumor effect [
22,
23]. In not only anti-CD20 but also anti-CD38 and CD52 immunotherapies, the cytolytic capacity of the tumor by complements has been shown [
23,
24,
25]. Furthermore, growing pieces of evidence suggest that complement plays crucial functions in not only tumor cytolysis but also several immunologic roles in anti-tumor immunity [
26,
27]. The crosstalk of complement effectors and cellular signaling pathways influence the T and B cell responses, T helper/effector T cell survival, differentiation, and B cell activation.
A common adverse effect of anti-HER2 mAbs and the ADCs is cardiotoxicity [
28]. Routine cardiac monitoring is required for patients [
29]. Moreover, the lack of cardiac trabeculae is observed in
ErbB2 (ortholog of
HER2)-knockout mice [
30], and the features of dilated cardiomyopathy are observed in ventricular-specific
ErbB2-knockout mice [
31]. These results indicate that HER2 is involved in normal heart development and homeostasis. Therefore, more selective or specific anti-HER2 mAbs against tumors are required to reduce heart failures.
We previously developed a cancer-specific HER2 mAbs, H
2Mab-214/H
2CasMab-1 [
32] and H
2Mab-250/H
2CasMab-2 [
33] from 278 clones of anti-HER2 mAbs using glioblastoma LN229-expressed HER2 as an antigen. Notably, both H
2Mab-214 and H
2Mab-250 did not react with spontaneously immortalized normal epithelial cells (HaCaT and MCF 10A) [
32,
33]. Moreover, H
2Mab-250 did not react with immortalized normal epithelial cells derived from the mammary gland, lung bronchus, gingiva, kidney proximal tubule, thymus, corneal, and colon [
33]. In contrast, most anti-HER2 mAbs, including trastuzumab, reacted with both cancer and normal epithelial cells [
34]. The epitope mapping revealed that the Trp614 in HER2 extracellular domain (ECD) 4 mainly contributes to the recognition by H
2Mab-250 [
33]. H
2Mab-214 also recognized a similar epitope of H
2Mab-250, and a crystal structure suggests that H
2Mab-214 recognizes a structurally misfolded region in the HER2-ECD4, which usually forms a β-sheet [
32]. The result indicates that the local misfolding in the Cys-rich-ECD4 governs the cancer-specificity of H
2Mab-214. Furthermore, we produced mouse IgG
2a-type and human IgG
1-type mAbs from H
2Mab-214 and H
2Mab-250. We found that both H
2Mab-214 and H
2Mab-250 possess a compatible
in vivo antitumor effect against breast cancer xenograft with trastuzumab despite the lower affinity and effector activation than trastuzumab
in vitro [
32,
34].
This study compared the ADCC and CDC between H2Mab-250 and trastuzumab against CHO/HER2 and breast cancer cell lines.
3. Discussion
We have developed CasMabs against HER2 (H
2Mab-250 [
33,
34]), podocalyxin (PcMab-6 [
35]), and podoplanin (LpMab-2 [
36] and LpMab-23 [
37]) by evaluating the reactivity against cancer and normal cells in flow cytometry and immunohistochemistry. We also showed the
in vivo antitumor effect of the recombinant mAbs (mouse IgG
2a or human IgG
1 types) derived from the abovementioned mAbs [
32,
33,
34]. Especially, H
2Mab-250 showed a potent antitumor effect
in vivo [
34] despite the lower reactivity and affinity than trastuzumab
in vitro [
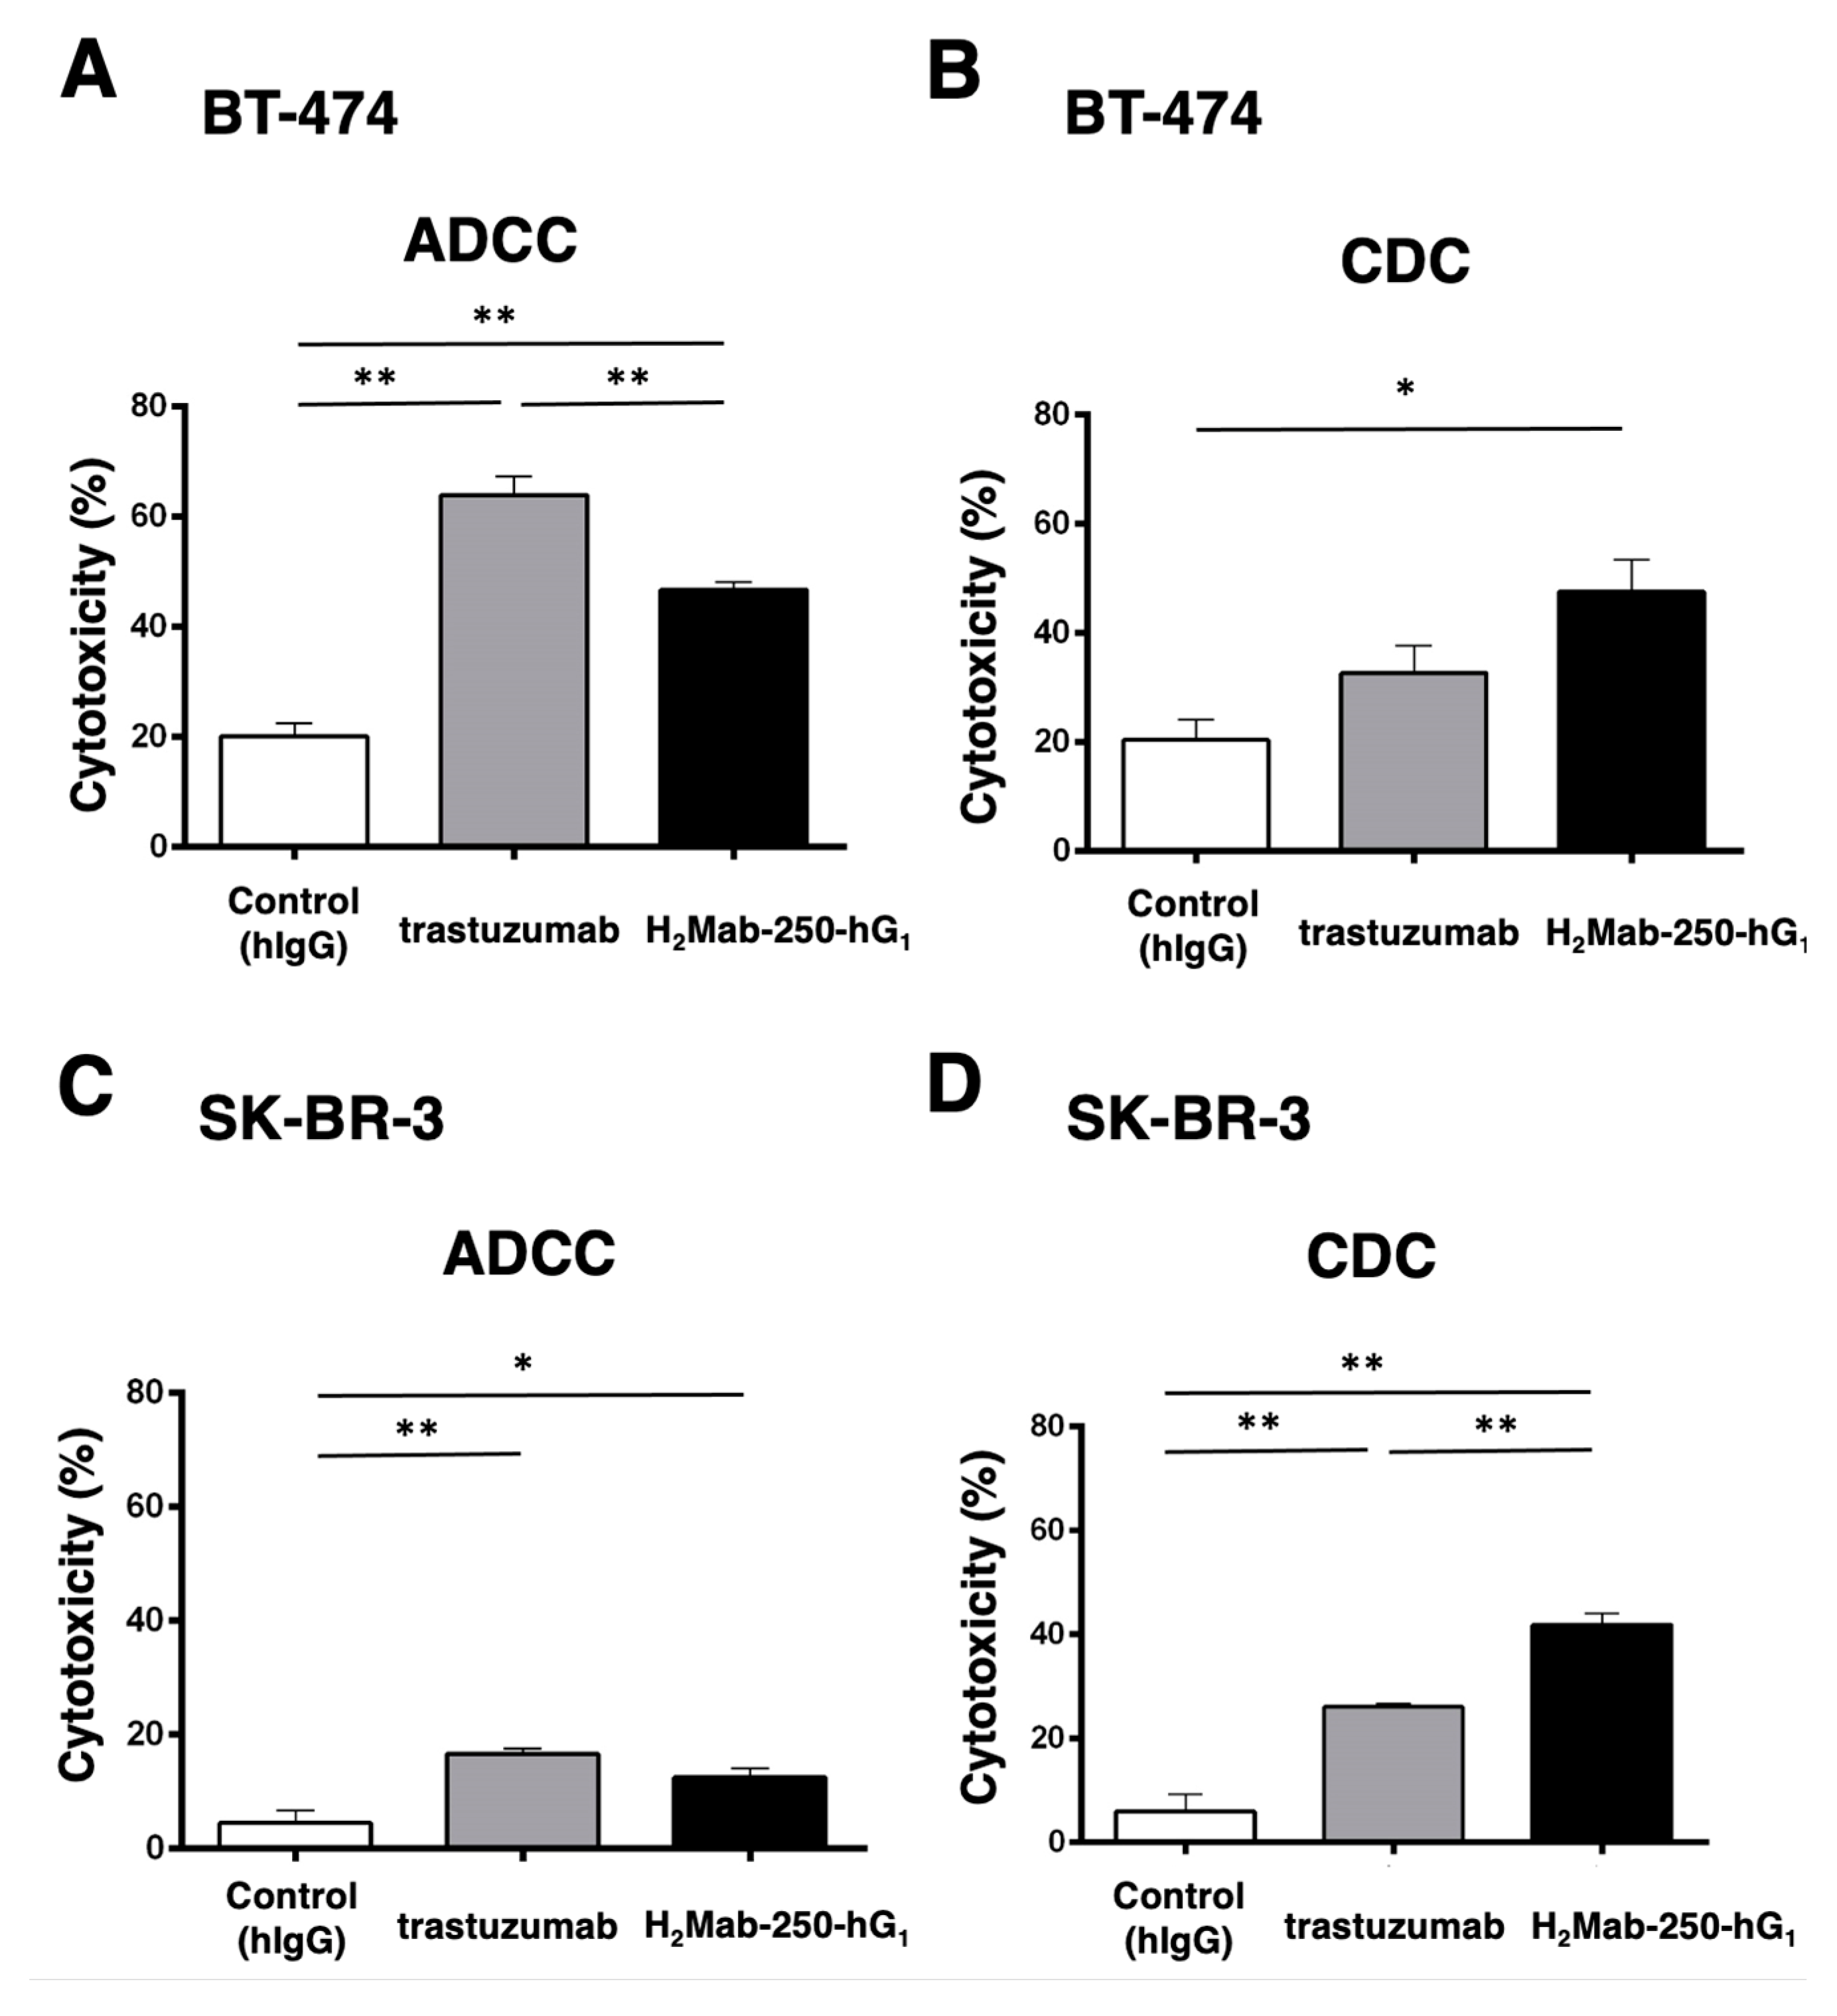
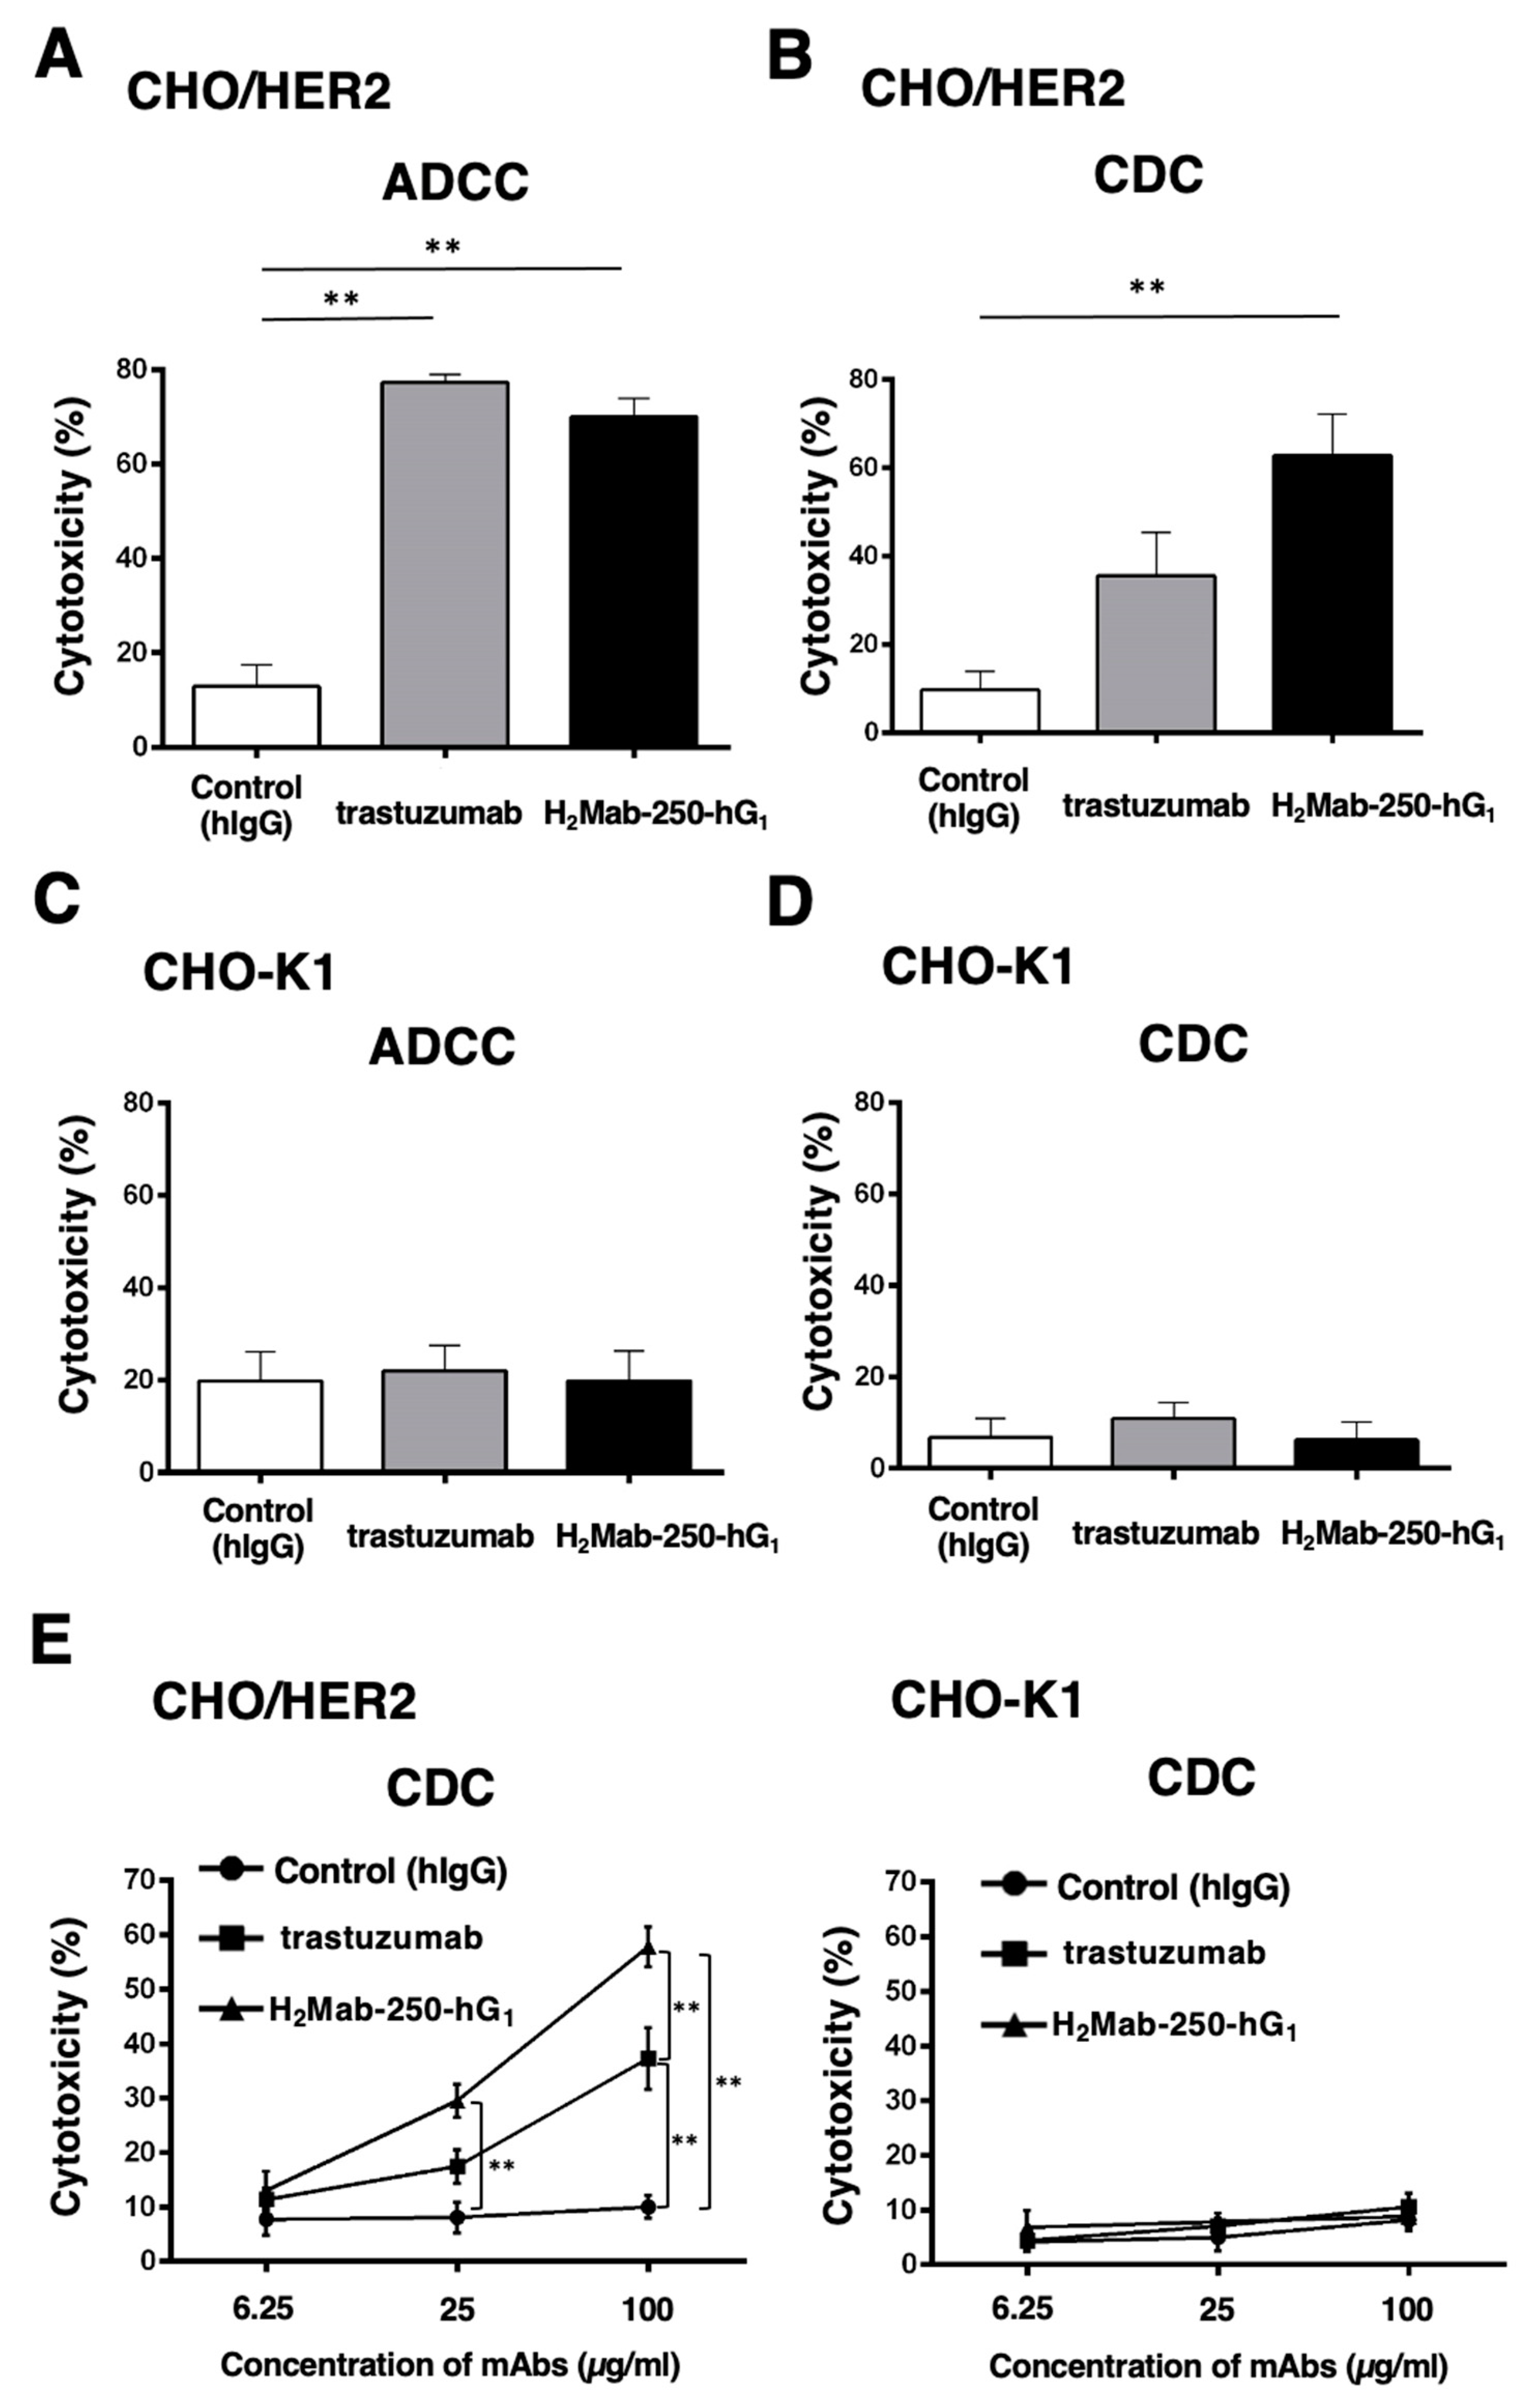
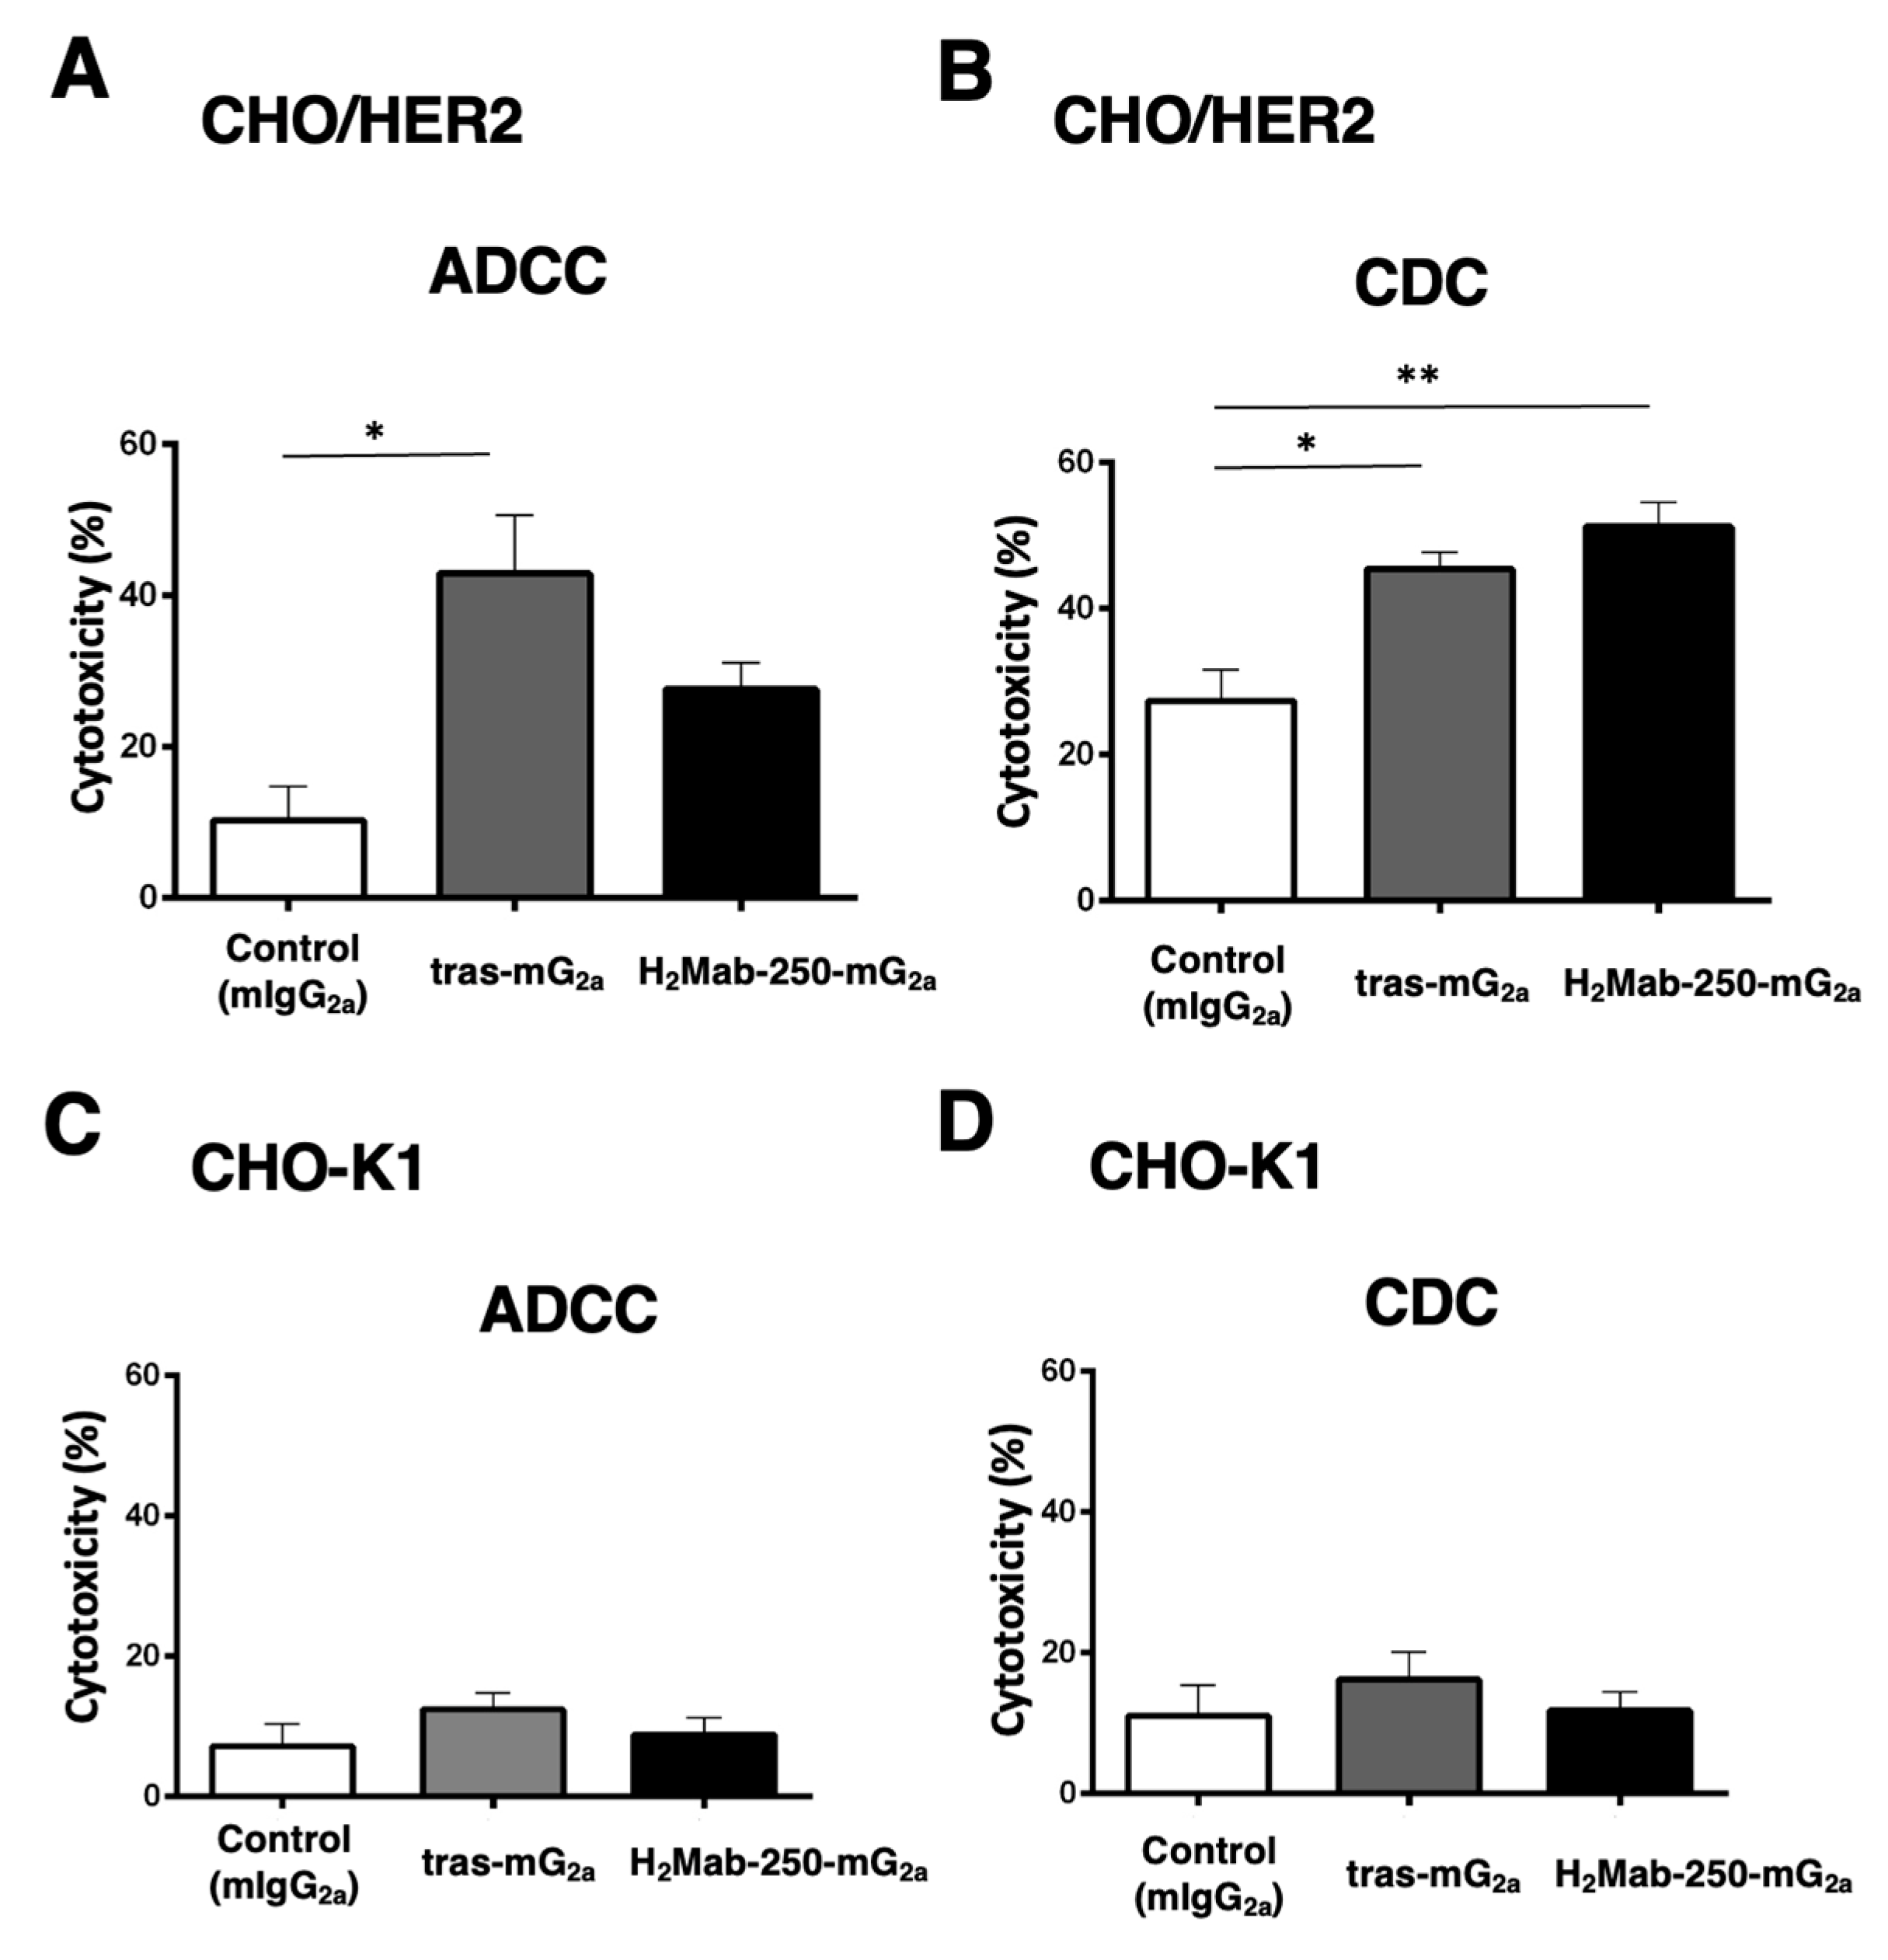
33]. However, the reason has not been clarified. In this study, we compared ADCC and CDC activity of H
2Mab-250 and trastuzumab and found that H
2Mab-250 exhibited a superior CDC activity to breast cancer and HER2-overexpressed cells compared to trastuzumab (
Figure 1,
Figure 2 and
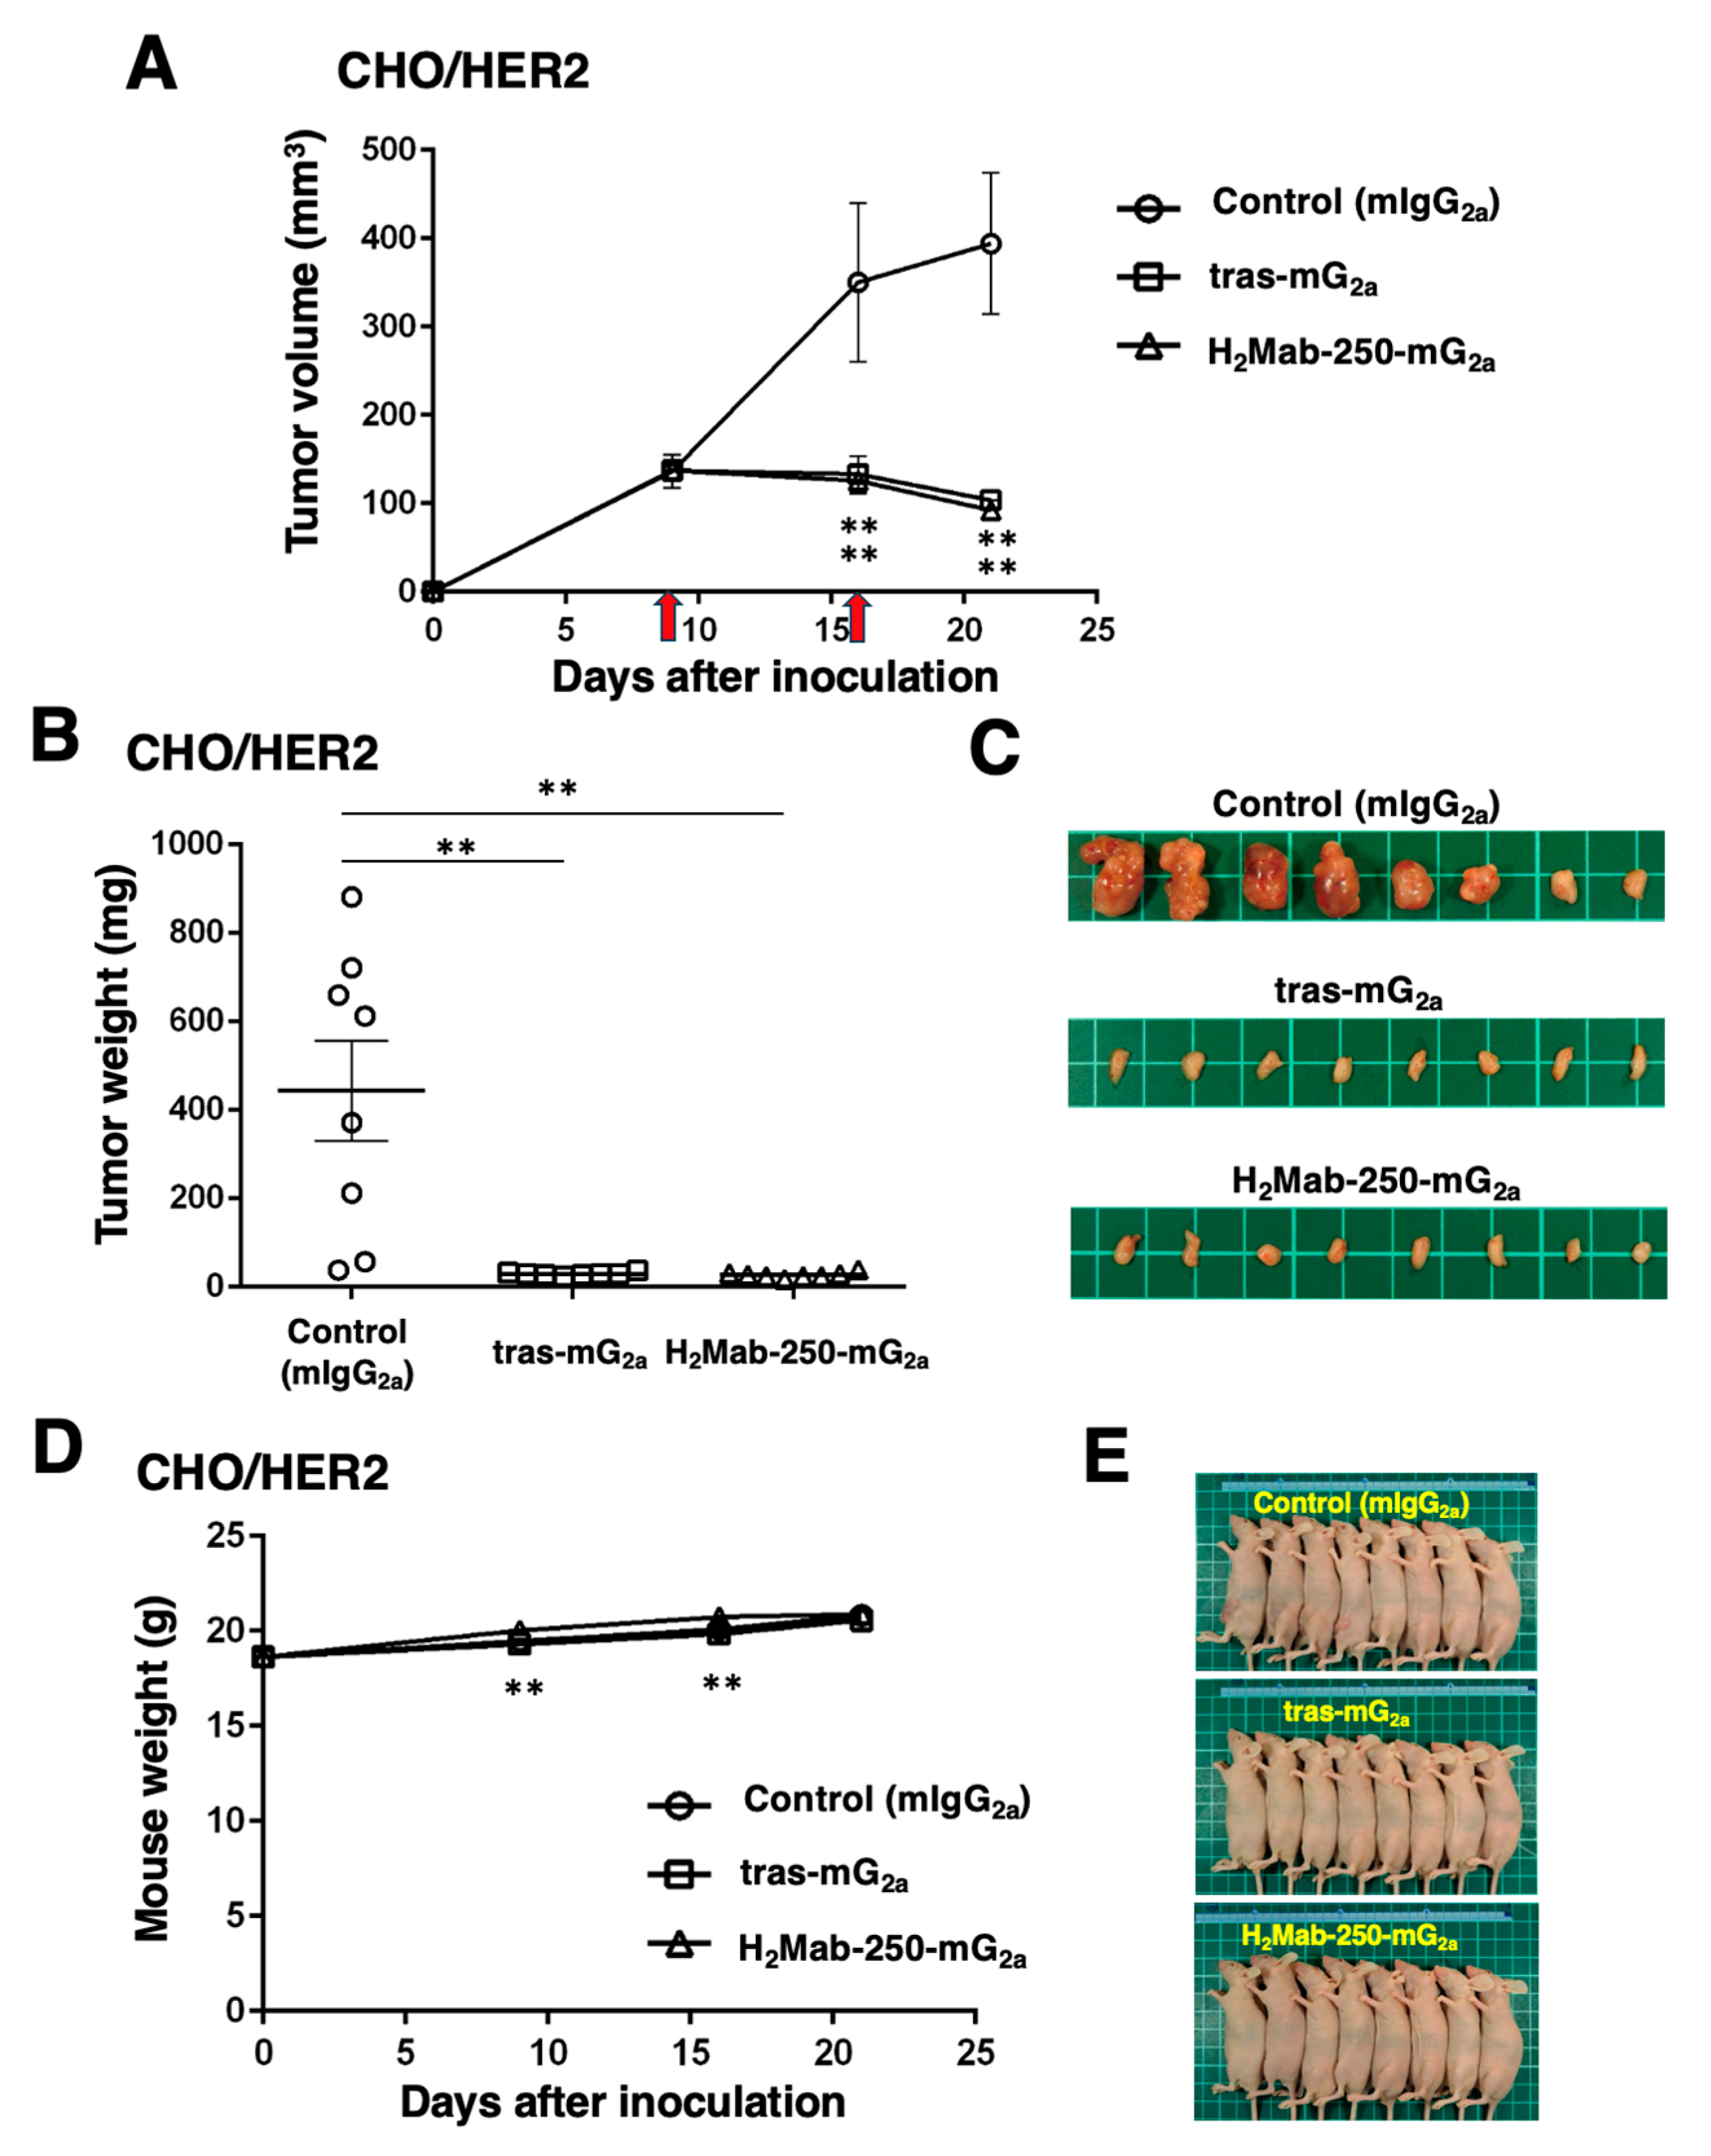
Figure 4). Furthermore, both H
2Mab-250-hG
1 and H
2Mab-250-mG
2a showed compatible antitumor effects compared to the corresponding isotype of trastuzumab (
Figure 3 and
Figure 5). These results suggest that the CDC activity of H
2Mab-250 would compensate for the lower ADCC activity in the antitumor efficacy.
Complement is an essential effector of tumor cytotoxic responses in mAb-based immunotherapy [
21]. The engagement of the Fc domain of mAbs with complement C1q triggers the assembly of the active C1 complex (C1q, C1r, and C1s), which initiates the cascade. The downstream activation of terminal complement components results in the assembly of the pore-forming membrane attack complex (MAC or C5b–C9) on the tumor cell membrane, which promotes the terminal lytic pathway [
21]. Complement activation also leads to tumor cell opsonization by C3-derived opsonins (C3b, iC3b, and C3dg), which bind to CR3 / CR4 complement receptors on phagocytes (neutrophils and macrophages) and augment the FcγR-dependent phagocytic uptake of opsonized tumor cells. Furthermore, complement activation generates pro-inflammatory mediators (C3a and C5a). The anaphylatoxin C5a upregulates FcγRs on phagocytes and primes them for enhanced phagocytosis and increasing the magnitude of the tumor cytolytic response [
21].
Because H
2Mab-250 showed increased CDC activity only in the presence of complement (
Figure 1,
Figure 2 and
Figure 4), the assembly of MAC is thought to be efficiently formed on the cells. Furthermore, the predisposition to CDC of H
2Mab-250 is independent of the isotype or species of mAbs (
Figure 2 and
Figure 4). Therefore, the complementarity-determining region and epitope of H
2Mab-250 are thought to be necessary. In
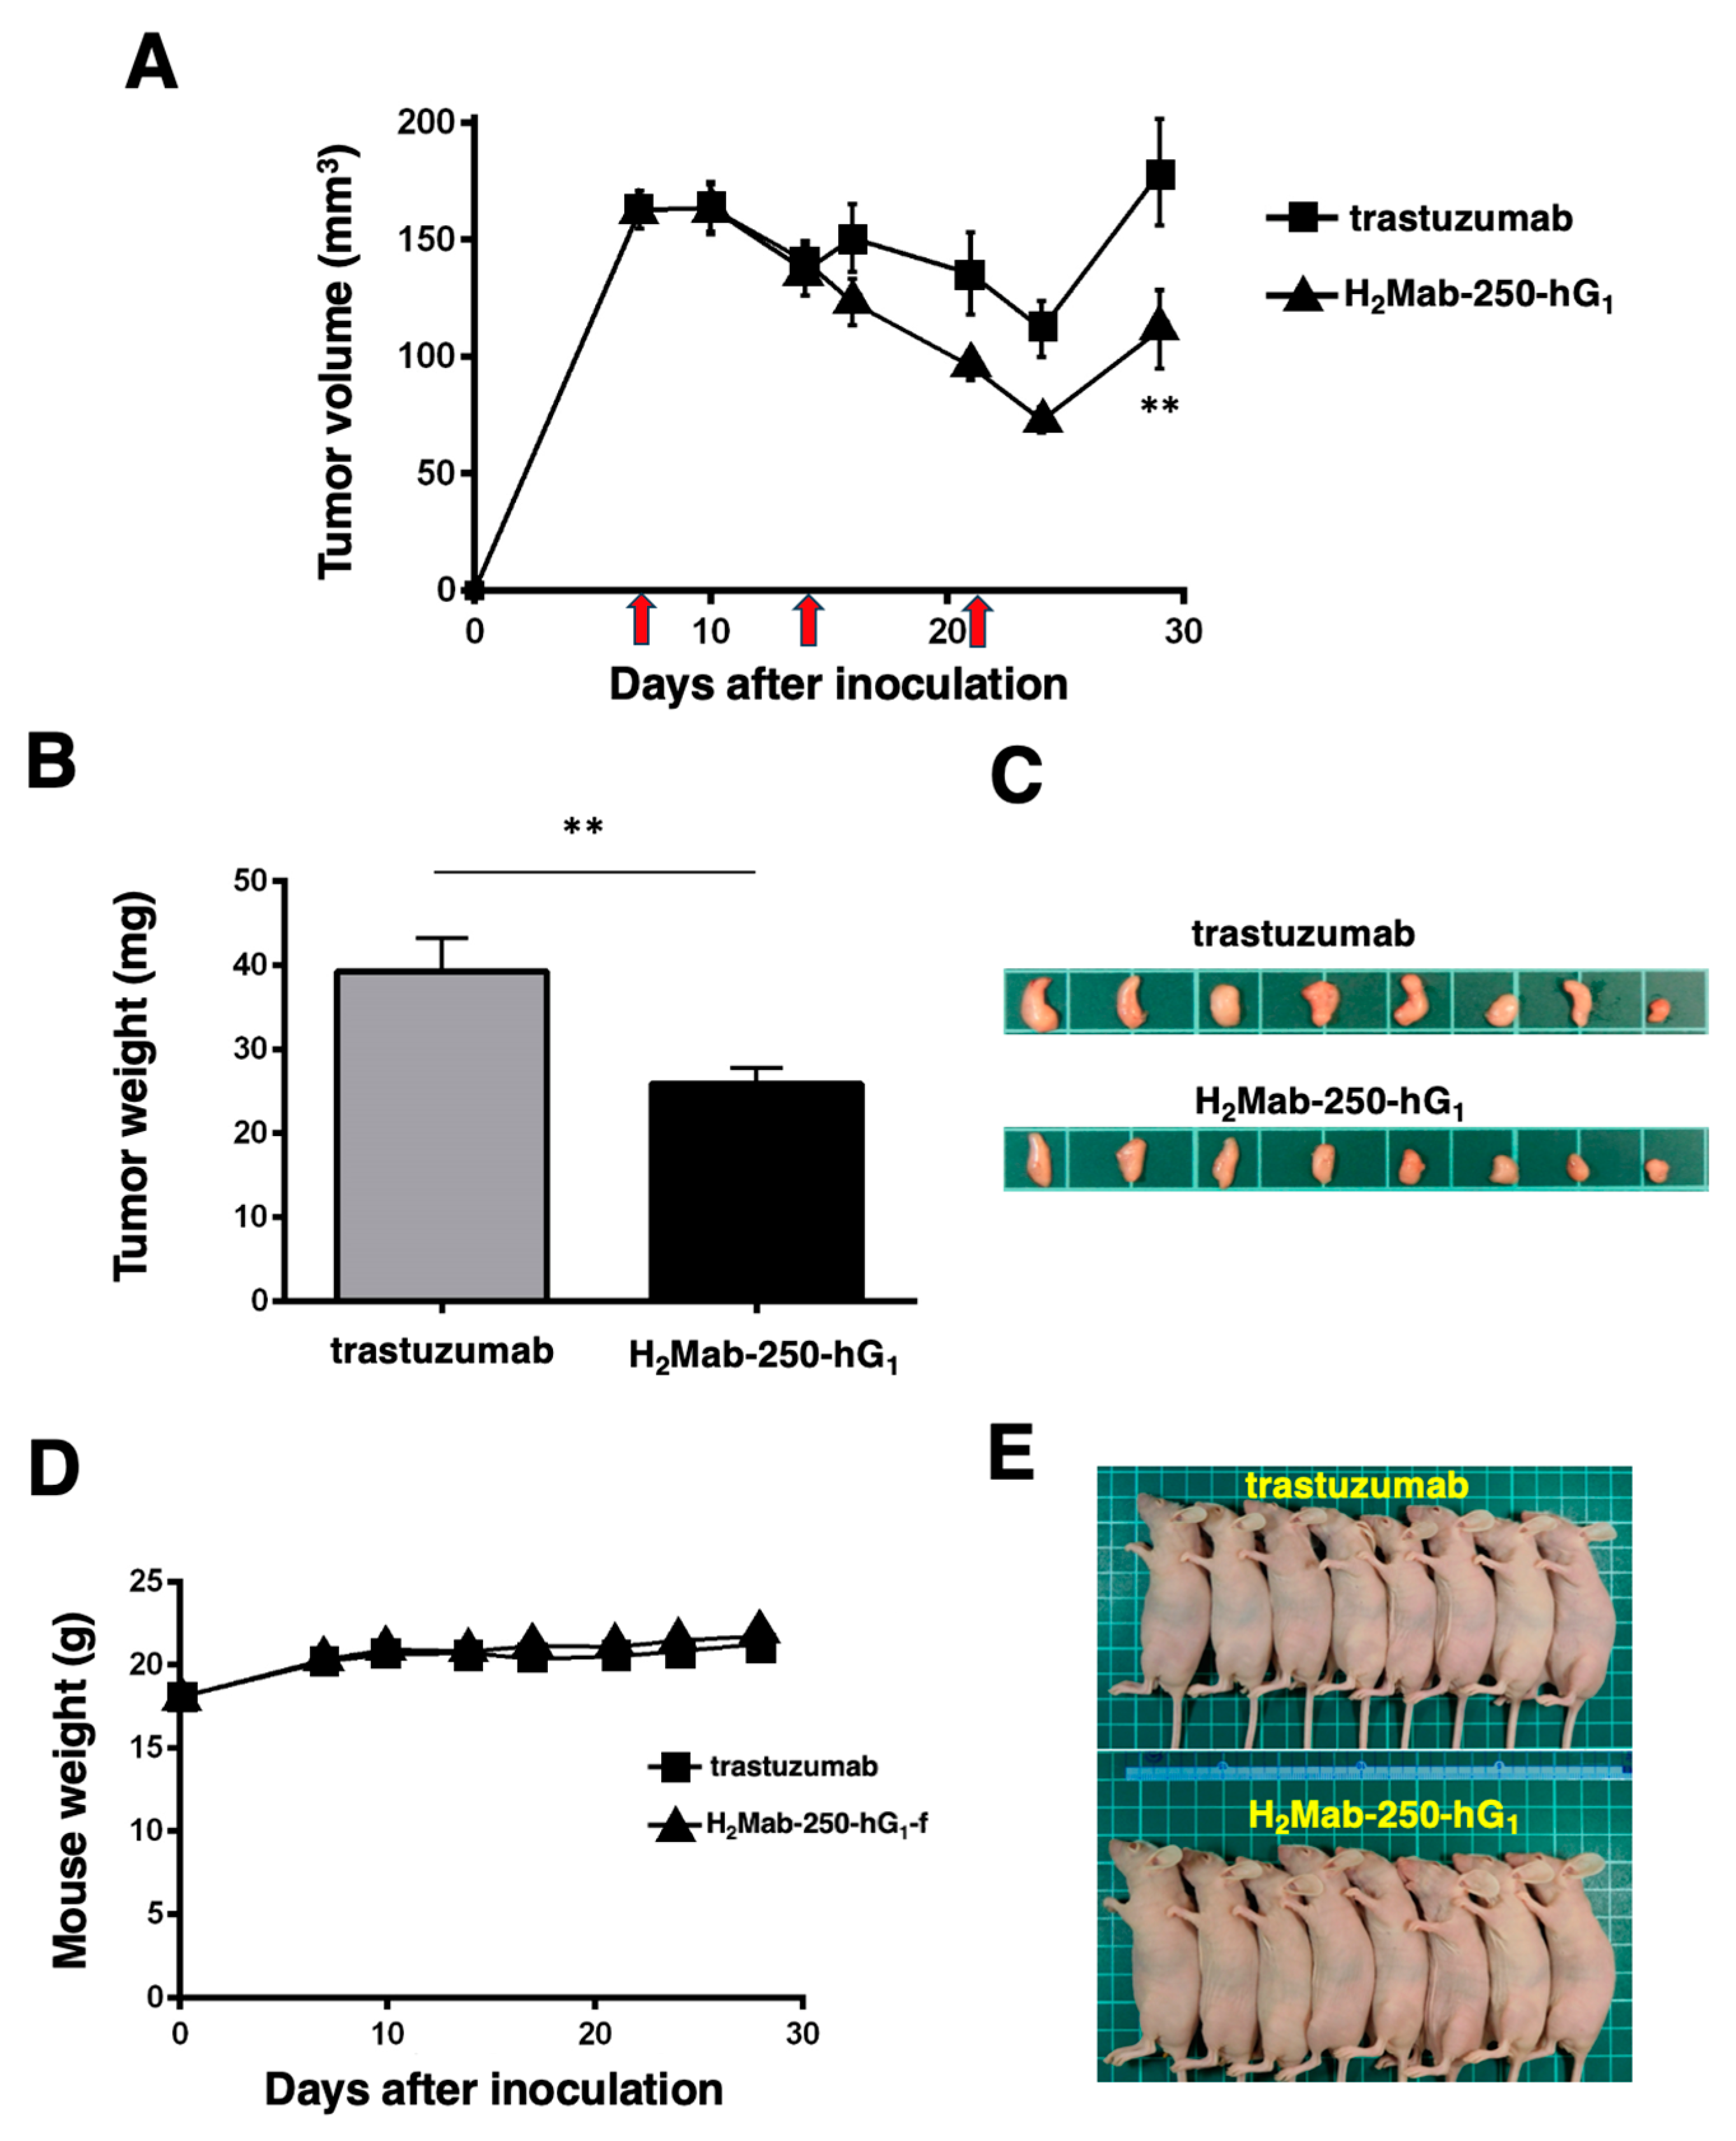
Figure 6, the antitumor effects of H
2Mab-250-hG
1 were higher than that of trastuzumab without human NK cells, indicating that H
2Mab-250-hG
1 exerts antitumor activities with much higher CDC than trastuzumab
in vivo. Several factors, including antigen size and density, determine the engagement of the classical complement pathway. In addition, a geometry of the antigen-mAb complex allows efficient C1q binding [
38]. Further investigation and confirmation are required to clarify the mechanisms of CDC in H
2Mab-250.
Trastuzumab exerts antitumor activity through multiple mechanisms of action but is incapable of eliciting CDC in HER2-positive cancers in the presence of human serum [
39,
40]. As shown in
Figure 1B, trastuzumab did not elicit CDC against BT-474 cells. An anti-HER2 bispecific and biparatopic antibody, zanidatamab, elicited potent CDC against HER2-high tumor cells, including BT-474 cells. Zanidatamab possesses an anti-HER2-ECD4 single chain variable fragment (scFv) linked to heavy chain 1 and an anti-HER2-ECD2 fragment antigen-binding (Fab) domain on heavy chain 2. Zanidatamab binds adjacent HER2 molecules in trans and initiates distinct HER2 reorganization and large HER2 clusters, not observed with trastuzumab [
41]. Optimal CDC activity requires hexameric clustering of mAb Fc domains in the mAb-antigen clusters [
42]. We identified the epitope of H
2Mab-250 as
613-IWKFP
-617 in the HER2-ECD4. The epitope of trastuzumab is a broader sequence (residues 579-625), which includes the H
2Mab-250 epitope [
33]. It is worthwhile to investigate the ability of H
2Mab-250 to form the cluster with HER2.
The chimeric antigen receptor (CAR)-T cell therapy is rapidly advancing as cancer treatment; however, designing an optimal CAR remains challenging. Due to the specific reactivity against cancer cells, H
2Mab-250 is clinically developed as CAR-T cell therapy, which is evaluated in a phase I study for HER2-positive advanced solid tumors in the US (NCT06241456). We discussed the benefit of reducing CAR affinity to limit trogocytosis, which is observed in the high affinity of CAR-T cells [
34]. In the monotherapy of H
2Mab-250, we have reported compatible antitumor effects against breast cancer xenograft compared to trastuzumab [
32,
34] and showed the importance of CDC in this study. Extensive research indicates that resistance to CDC is induced by the expression of complement regulators in tumor cells during the escape from host immune responses. Notably, an upregulation of the regulators, including CD46, CD55, and CD59, has been shown to prevent CDC through suppression of terminal complement activation and MAC assembly [
43,
44,
45]. In this regard, several strategies have been developed to overcome the resistance to CDC in mAb-based immunotherapy [
46,
47,
48,
49]. Therefore, dual targeting of HER2 by H
2Mab-250 and complement regulators should be investigated in future studies in
in vitro models.
4. Materials and Methods
4.1. Cell Culture
BT-474, SK-BR-3, and Chinese hamster ovary (CHO)-K1 were obtained from the American Type Culture Collection (ATCC, Manassas, VA). CHO-K1 and HER2-overexpressed CHO-K1 (CHO/HER2) were previously established [
33] and were cultured in Roswell Park Memorial Institute (RPMI)-1640 medium (Nacalai Tesque, Inc., Kyoto, Japan). BT-474 and SK-BR-3 were cultured in Dulbecco’s Modified Eagle Medium (DMEM) (Nacalai Tesque, Inc.). These were supplemented with 10% heat-inactivated fetal bovine serum (FBS; Thermo Fisher Scientific Inc.), 100 units/mL of penicillin, 100 μg/mL streptomycin, and 0.25 μg/mL amphotericin B (Nacalai Tesque, Inc.). All cell lines were cultured at 37°C in a humidified atmosphere with 5% CO
2 and 95% air.
4.2. Production of Recombinant mAbs
To generate a mouse-human chimeric mAb (H2Mab-250-hG1), VH of H2Mab-250 and CH of human IgG1 were cloned into the pCAG-Ble vector (FUJIFILM Wako Pure Chemical Corporation, Osaka, Japan). The VL of H2Mab-250 and CL of the human kappa light chain were cloned into the pCAG-Neo vector (FUJIFILM Wako Pure Chemical Corporation).
To generate mouse IgG2a-type H2Mab-250 (H2Mab-250-mG2a), we cloned the VH cDNA of H2Mab-250 and CH of mouse IgG2a into the pCAG-Ble vector. The mouse kappa light chain vector of H2Mab-250 was described above. To generate a mouse IgG2a type of trastuzumab (tras-mG2a), the VH cDNA of trastuzumab and the CH cDNA of mouse IgG2a were cloned into the pCAG-Neo vector, and the VL cDNA of trastuzumab and the CL cDNA of mouse kappa light chain were cloned into the pCAG-Ble vector.
To generate the recombinant PMab-231 for control mouse IgG
2a, we cloned heavy and light chains of PMab-231 [
50] into the pCAG-Neo and pCAG-Ble vectors, respectively.
The vectors were transfected into BINDS-09 (fucosyltransferase 8-knockout ExpiCHO-S) cells using the ExpiCHO Expression System (Thermo Fisher Scientific, Inc.) to produce the defucosylated mAbs. H
2Mab-250-mG
2a, tras-mG
2a, H
2Mab-250-hG
1, trastuzumab, and PMab-231 were purified using Ab-Capcher (Kagawa, Japan). After washing with PBS, bound antibodies were eluted with an IgG elution buffer (Thermo Fisher Scientific Inc.) and immediately neutralized using 1M Tris-HCl (pH 8.0). Finally, the eluates were concentrated using Amicon Ultra (Merck KGaA) and replaced with PBS. The purified mAbs were confirmed by SDS-PAGE in reduced and non-reduced conditions (
Supplementary Figure S3).
Normal human IgG was purchased from Sigma-Aldrich Corp. (St. Louis, MO).
4.3. ADCC
The ADCC of H2Mab-250-hG1 and trastuzumab was measured as follows. Human NK cells were purchased from Takara Bio, Inc. (Shiga, Japan) and were used as effector cells. The NK cells were used in the following experiment immediately after thawing. We labeled target cells (BT-474, SK-BR-3, CHO-K1, and CHO/HER2) using 10 µg/mL Calcein AM (Thermo Fisher Scientific, Inc.). The target cells were plated in 96-well plates (1 × 10⁴ cells/well) and mixed with the human NK cells (effector to target ratio, 50 : 1) and 100 μg/mL of H2Mab-250-hG1, trastuzumab or control human IgG. The calcein release was measured after a 4.5 h incubation. Fluorescence intensity was determined using a microplate reader (Power Scan HT; BioTek Instruments, Winooski, VT). After lysing all cells with a buffer containing 0.5% Triton X-100, 10 mM Tris-HCl (pH 7.4), and 10 mM EDTA, cytotoxicity (% lysis) was calculated as % lysis = (E − S)/(M − S) × 100, where E is the fluorescence of the combined target and effector cells, S is the spontaneous fluorescence of target cells only, and M is the maximum fluorescence measured.
The ADCC of H2Mab-250-mG2a and tras-mG2a was measured as follows. Effector cells were obtained from the spleen of female BALB/c nude mice (Jackson Laboratory Japan, Inc., Kanagawa, Japan). The Calcein AM-labeled target cells (CHO-K1 and CHO/HER2) using 10 µg/mL Calcein AM were plated in 96-well plates (1 × 10⁴ cells/well) and mixed with the effector cells (effector to target ratio, 50 : 1) with 100 μg/ml of H2Mab-250-mG2a and tras-mG2a or control mouse IgG2a. After a 4-hour incubation at 37°C, the Calcein release into the medium was measured, and the cytotoxicity (% lysis) was calculated as described above.
4.4. CDC
The calcein-labeled target cells (BT-474, SK-BR-3, CHO-K1, and CHO/HER2) were plated and mixed with rabbit complement (final dilution 1:10, or 1:15 [Fig. 2E], Low-Tox-M Rabbit Complement; Cedarlane Laboratories, Hornby, ON, Canada) and the indicated concentration of H2Mab-250-hG1, trastuzumab or control human IgG. Following incubation for 4.5 h at 37 °C, the calcein released into the medium was measured, as described above. In the case of H2Mab-250-mG2a and tras-mG2a or control mouse IgG2a, we performed a 4-hour incubation at 37°C. The cytotoxicity (% lysis) was calculated as described above.
4.5. Antitumor Activities of H2Mab-250-hG1, Trastuzumab, H2Mab-250-mG2a, and tras-mG2a, in Tumor Xenograft Models
To examine the antitumor effect of H2Mab-250-hG1, trastuzumab, H2Mab-250-mG2a, and tras-mG2a, animal experiments were approved by the Institutional Committee for Experiments of the Institute of Microbial Chemistry (approval no. 2023-066 and 2023-074). We monitored mice in a pathogen-free environment during the experimental period on an 11 h light/13 h dark cycle with food and water supplied ad libitum. Mice were monitored for health and weight every one or five days. We identified body weight loss exceeding 25% and maximum tumor size exceeding 3000 mm3 as humane endpoints and terminated the experiments.
CHO/HER2 cells were suspended in 0.3 mL of 1.33 × 10⁸ cells/mL using DMEM and mixed with 0.5 mL of BD Matrigel Matrix Growth Factor Reduced (BD Biosciences, San Jose, CA). Then, BALB/c nude mice (Jackson Laboratory Japan) were injected subcutaneously in the left flank with 100 μL of the suspension (5 × 10⁶ cells). On day 9 post-inoculation, 100 μg of H2Mab-250-mG2a (n=8), tras-mG2a (n=8), or control mouse IgG2a (PMab-231; n = 8) in 100 µL PBS were intraperitoneally injected. On day 16, additional antibody injections were performed. The tumor diameter was measured on days 9, 16, and 21 after the inoculation of cells.
For evaluation of H2Mab-250-hG1 and trastuzumab, we injected the mice with 100 μg of H2Mab-250-hG1 (n = 8), trastuzumab (n = 8), or control human IgG (n = 8) in 100 μL of PBS through intraperitoneal injection on day 7 post-inoculation. Additional antibodies were injected on days 14 and 21. Furthermore, human NK cells (8.0 × 10⁵ cells, Takara Bio, Inc.) were injected near the tumors subcutaneously on days 7, 14, and 21. The tumor diameter was measured on days 7, 14, 21, and 28 after inoculation with cells.
The tumor volume was calculated using the following formula: volume = W2 × L/2, where W is the short diameter and L is the long diameter. All mice were euthanized by cervical dislocation.
Statistical analyses were performed using GraphPad PRISM 6 (GraphPad Software, Inc., La Jolla, CA).
4.6. Pharmacokinetics of H2Mab-250-hG1 and Trastuzumab
HER2 ectodomain [
34] was immobilized on Nunc Maxisorp 96−well immunoplates (Thermo Fisher Scientific Inc.) at a concentration of 1 µg/mL for 30 min at 37°C. After washing with PBS containing 0.05% (
v/v) Tween 20 (PBST; Nacalai Tesque, Inc.), wells were blocked with 1% (
w/v) bovine serum albumin (BSA)−containing PBST for 30 min at 37°C. To make a standard curve, the serially diluted H
2Mab-250-hG
1 and trastuzumab (0.00064–10 µg/mL) were added to each well, followed by peroxidase−conjugated anti−human Fc (1:3000 diluted; Sigma-Aldrich Corp.). Enzymatic reactions were conducted using ELISA POD Substrate TMB Kit (Nacalai Tesque, Inc.) followed by the measurement of the optical density at 655 nm, using an iMark microplate reader (Bio−Rad Laboratories, Inc., Berkeley, CA, USA). The standard curve was made using GraphPad PRISM 6. H
2Mab-250-hG
1 and trastuzumab (100 µg/mouse, n=3) were intraperitoneally injected and the serums were collected from day 0 (4 hours after injection) to 10. The concentration of mAbs was determined as described above. The half-life of mAbs was calculated as described previously [
51].
Figure 1.
The ADCC and CDC activities were mediated by H2Mab-250-hG1 and trastuzumab in BT-474 and SK-BR-3 cells. (A,C) The ADCC induced by human NK cells in the presence of H2Mab-250-hG1, trastuzumab, or control human IgG (hIgG) against BT-474 (A) and SK-BR-3 (C) cells. (B,D) The CDC induced by complements in the presence of 100 µg/mL of H2Mab-250-hG1, trastuzumab, or control human IgG against BT-474 (B) and SK-BR-3 (D) cells. Values are shown as the mean ± SEM. Asterisks indicate statistical significance (**p < 0.01 and * p < 0.05; one-way ANOVA, Tukey’s multiple comparisons test).
Figure 2.
The ADCC and CDC activities are mediated by H2Mab-250-hG1 and trastuzumab in CHO/HER2 and CHO-K1 cells. (A,C) The ADCC induced by human NK cells in the presence of H2Mab-250-hG1, trastuzumab, or control human IgG (hIgG) against CHO/HER2 (A) and CHO-K1 (C) cells. (B,D) The CDC induced by complements in the presence of 100 µg/mL of H2Mab-250-hG1, trastuzumab, or control hIgG against CHO/HER2 (B) and CHO-K1 (D) cells. Values are shown as the mean ± SEM. Asterisks indicate statistical significance (**p < 0.01 and * p < 0.05; one-way ANOVA, Tukey’s multiple comparisons test). (E) The CDC induced by complements in the presence of 6.25, 25, and 100 µg/mL of H2Mab-250-hG1, trastuzumab, or hIgG. Values are shown as the mean ± SEM. Asterisks indicate statistical significance (**p < 0.01; two-way ANOVA, Tukey’s multiple comparisons test).
Figure 3.
Antitumor activity of H2Mab-250-hG1 and trastuzumab against CHO/HER2 xenografts. (A) CHO/HER2 cells (5 × 10⁶ cells) were injected subcutaneously into the left flank of BALB/c nude mice (day 0). On day 7, 100 μg of H2Mab-250-hG1 (n=8), trastuzumab (n=8), or control human IgG (hIgG) (n=8) were injected into mice. On days 14 and 21, additional antibodies were injected. Human NK cells were injected around the tumors on the same days of Ab administration (arrows). The tumor volume was measured on days 7, 14, 21, and 28. Values are presented as the mean ± SEM. **p < 0.01 (two-way ANOVA and Tukey’s multiple comparisons test). The tumor weight (B) and appearance (C) of excised CHO/HER2 xenografts on day 28. Values are presented as the mean ± SEM. *p < 0.05 (two-way ANOVA and Tukey’s multiple comparisons test). The body weight (D) and appearance (E) of xenograft-bearing mice treated with trastuzumab, H2Mab-250-hG1, or a control hIgG.
Figure 4.
The ADCC and CDC activities are mediated by H2Mab-250-mG2a and tras-mG2a in CHO/HER2 and CHO-K1 cells. (A,C) The ADCC induced by human NK cells in the presence of 100 µg/mL of H2Mab-250-mG2a, tras-mG2a, or control mouse IgG2a (mIgG2a) against CHO/HER2 (A) and CHO-K1 (C) cells. (B,D) The CDC induced by complements in the presence of H2Mab-250-mG2a, tras-mG2a, or control mIgG2a against CHO/HER2 (B) and CHO-K1 (D) cells. Values are shown as the mean ± SEM. Asterisks indicate statistical significance (**p < 0.01 and *p < 0.05; one-way ANOVA, Tukey’s multiple comparisons test).
Figure 5.
Antitumor activity of H2Mab-250-mG2a and tras-mG2a against CHO/HER2 xenografts. (A) CHO/HER2 cells (5 × 10⁶ cells) were injected subcutaneously into the left flank of BALB/c nude mice (day 0). On day 9, 100 μg of H2Mab-250-mG2a (n=8), tras-mG2a (n=8), or a control mouse IgG2a (mIgG2a) (n=8) were injected into mice. On day 16, additional antibodies were injected (arrows). The tumor volume was measured on days 9, 16, and 21. Values are presented as the mean ± SEM. **p < 0.01 (two-way ANOVA and Tukey’s multiple comparisons test). The tumor weight (B) and appearance (C) of excised CHO/HER2 xenografts on day 21. Values are presented as the mean ± SEM. *p < 0.05 (two-way ANOVA and Tukey’s multiple comparisons test). The body weight (D) and appearance (E) of xenograft-bearing mice treated with H2Mab-250-mG2a and tras-mG2a, or a control mIgG2a.
Figure 6.
Antitumor activity of H2Mab-250-hG1 and trastuzumab against CHO/HER2 xenografts without human NK cell injection. (A) CHO/HER2 cells (5 × 10⁶ cells) were injected subcutaneously into the left flank of BALB/c nude mice (day 0). On day 7, 100 μg of H2Mab-250-hG1 (n=8) or trastuzumab (n=8) were injected into mice. On days 14 and 21, additional antibodies were injected (arrows). The tumor volume was measured on days 7, 10, 14, 16, 21, 24, and 29. Values are presented as the mean ± SEM. **p < 0.01 (two-way ANOVA and Tukey’s multiple comparisons test). The tumor weight (B) and appearance (C) of excised CHO/HER2 xenografts on day 29. Values are presented as the mean ± SEM. **p < 0.01 (two-way ANOVA and Tukey’s multiple comparisons test). The body weight (D) and appearance (E) of xenograft-bearing mice treated with trastuzumab or H2Mab-250-hG1.
