2.1. Morphological Features
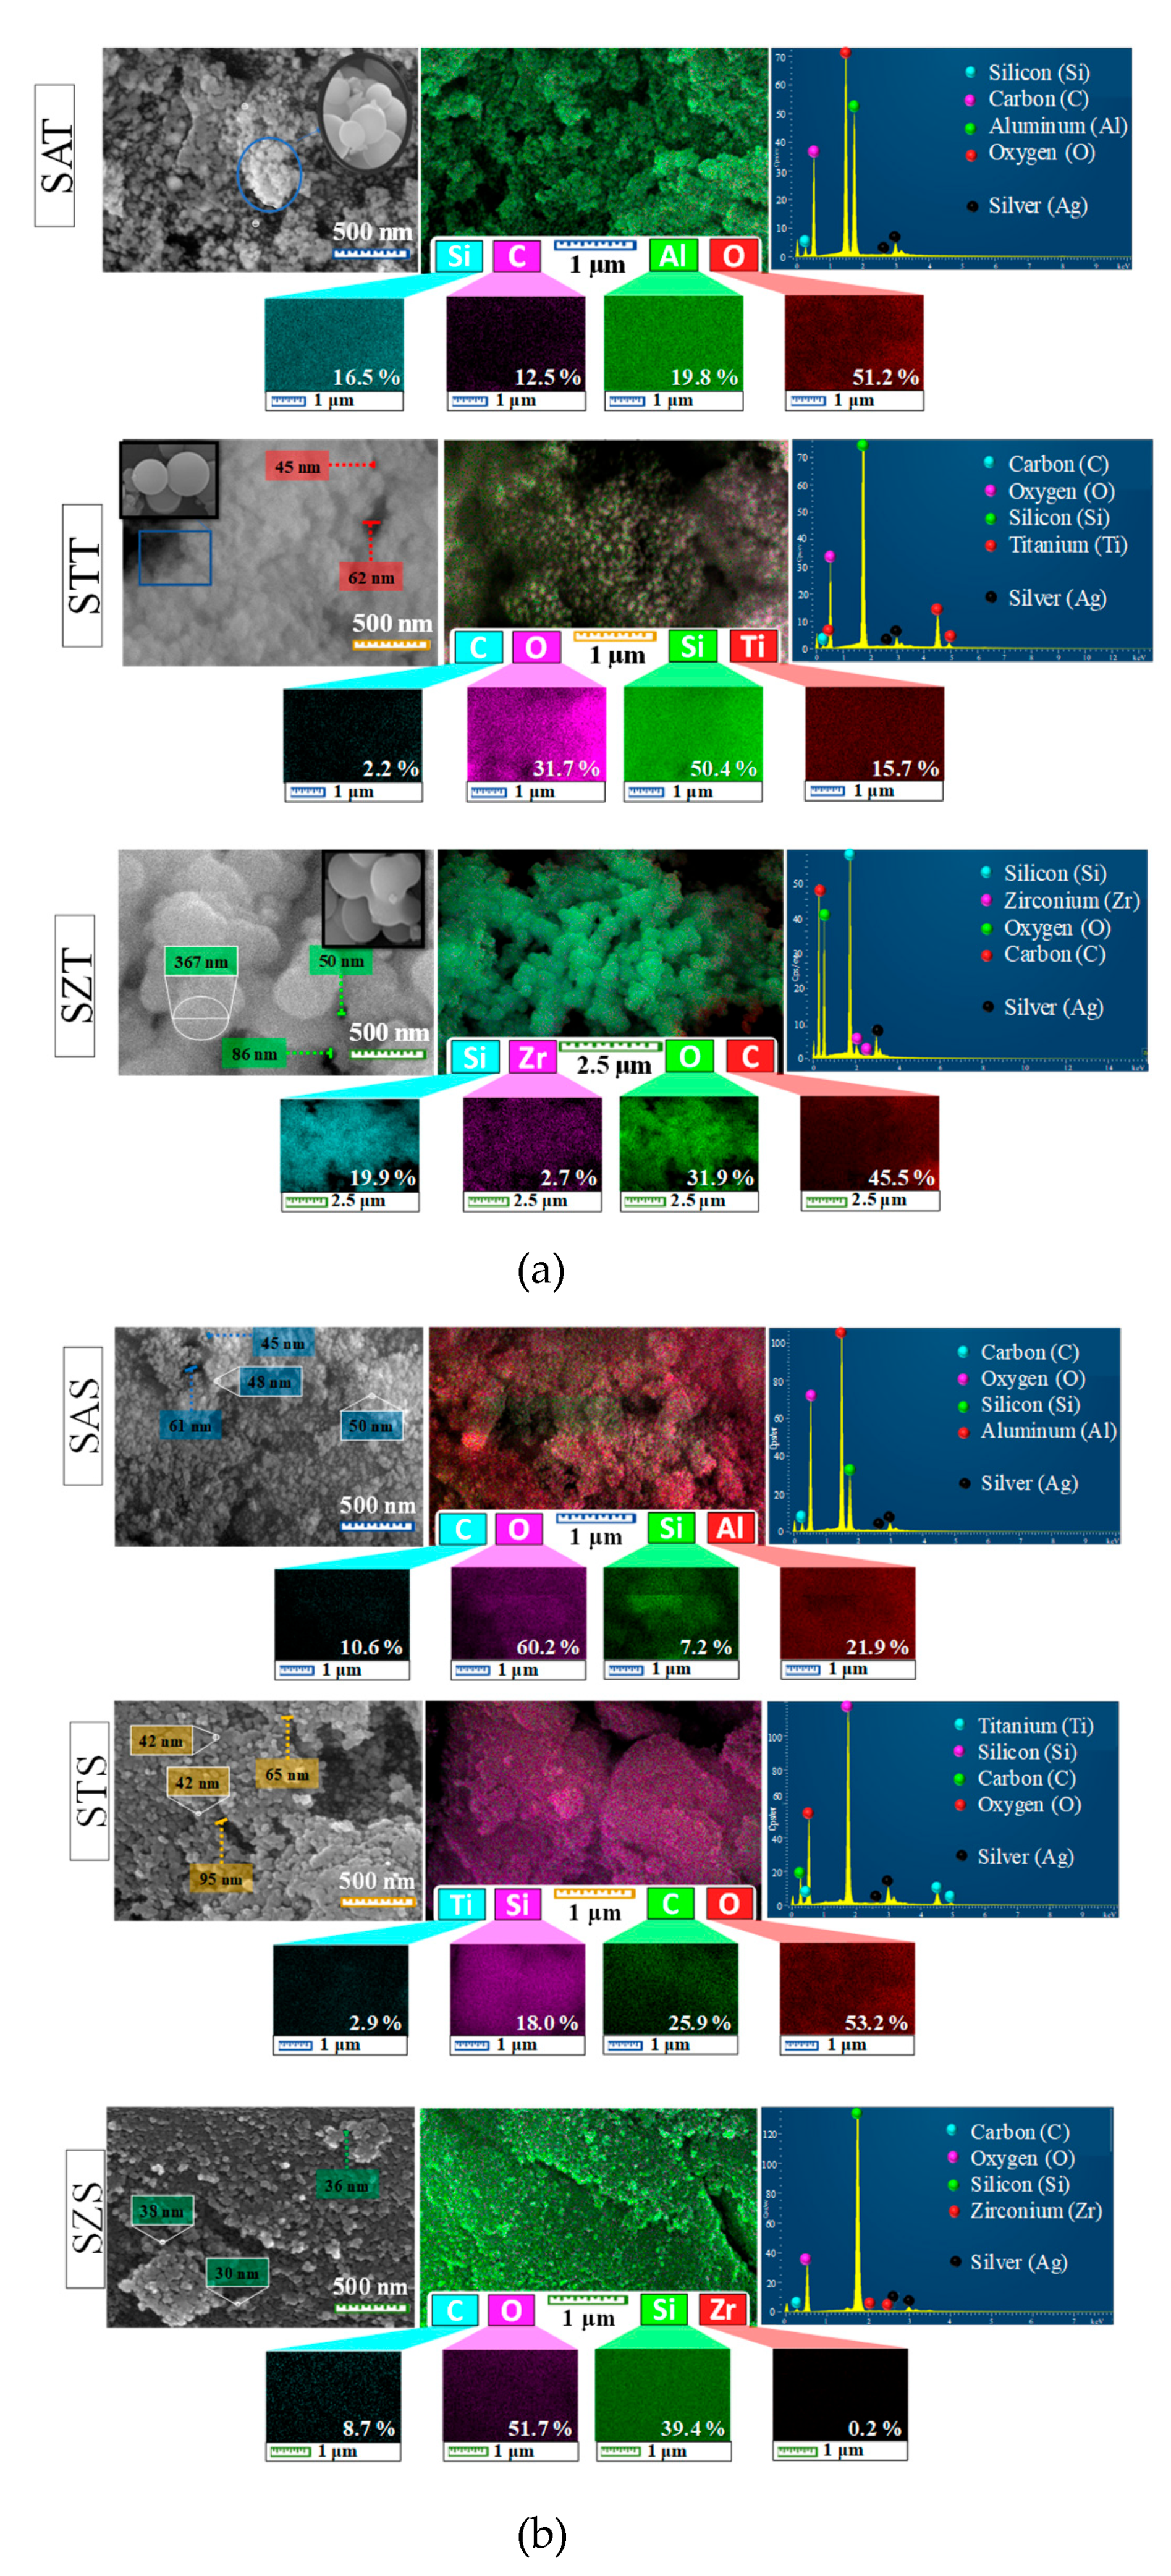
Direct evidence of the formation of solids is given by the morphological aspects of the SEM-EDS analyses. The typical sphere-shaped morphology for the as-synthesized silica-based materials is shown by the SEM micrographs (
Figure 1a, on the top, left side of the panel) with most of the particles agglomerated. A close look in the micrograph illustrates the bunch of grapes shaped nanospheres (
Figure 1a, inset). Moreover, the sizes of the spheres are around 45-367 nm, according to the SEM investigations. This result agrees with the typical monodisperse colloidal spherical particles for the colloidal silica precursor [
26]. Notably, intercrystalline pores are observed on the surface of the solids.
It is important to point out that the soft-template route assisted by sol-gel synthesis to obtain monodispersed spherical-like morphology is known as the Stöber method [
1,
27]. The usage of TEOS as a silica source in aqueous/ethanolic solutions gives an emulsion that actually decrease particle growth, resulting in monomeric/oligomeric silicic acid species via hydrolysis reaction [
27]. Subsequent polycondensation of these monomeric species generates the oligomeric precursors during the nucleation step. Consequently, primary seeds are achieved upon precipitation followed by particle growth to give uniform (nano) spherical-like morphology [
15,
27]. These findings are consistent with spherical-like particles having the entire nanometric range observed in the SEM-EDS results, independently of the metal introduced in the silica framework.
In the EDS map of the as-synthesized spheres (
Figure 1a, at the top, in the left side of the panel), the silicon, oxygen and carbon constituents are shown in all solids, whereas aluminum, titanium and zirconium are observable in SAT, STT and SZT, respectively. The carbon element appears from the organic precursors used during the synthesis. Besides, the magnified EDS images reveal that the elemental distribution of these constituents is uniform in all samples. For instance, EDS mapping of SAT and STT (
Figure 1a, on the bottom of the panel) depicts the accumulation or deposition of relatively high local contents of aluminum and titanium on the particle surfaces. This eventually causes the presence of 19.7 and 15.7% of Al and Ti in the as-synthesized SZT and STT solids, respectively (
Figure 1a, EDS spectra at the top, right side of the panel). On the contrary, SZT depicts the presence of a low amount of ca. 2.5% of Zr on the solid surface, which illustrates that Zr is mainly incorporated into the bulk, implying in the silicon amount of ca. 19.9% on solid surface. The silver element arises from the sputter coating with Ag during the samples preparation to improve their conductivity.
SEM-EDS micrographs of the as-synthesized silica-based solids obtained from a colloidal silica source are shown in
Figure 1b. The SEM morphology at the top left side of
Figure 1b shows that all the as-synthesized solids have a spheroidal particle shape. Even though the EDS images exhibit aggregated clusters in some particle regions for colloidal silica source as-synthesized samples (at the top left side of
Figure 1b), these particles seem to be arranged almost in a more nanospherical shape than those of the as-synthesized silica-based TEOS samples counterparts (at the top left side of
Figure 1a).
It is assumed to be the result from silica colloids whose size could be 0.6–0.8 nm in aqueous/ethanolic assisting the nucleation step [
26,
28]. Upon using mild basic conditions due to the presence of Na from the own solution and added ammonia, these entities act as a catalyst helping in the nucleation process, which leads to the subsequent formation of intermediate Si(OH)
4 accompanied by its condensation to form Si–O–Si bonds [
26,
28,
29]. This has an impact on particle nucleation and growth during the condensation stage and results in monodisperse smaller particles with hollow spherical silica structures holding emulsion droplet shapes, as demonstrated in this work.
Unlike the TEOS precursors, SEM micrographs reveal that the particles have diameters of ca. 30-95 nm, which is much more homogenously distributed and with shorter sizes compared to the as-synthesized silica-based TEOS samples. Furthermore, intercrystalline porosity is also observed on the surface. In the EDS map (in the center of
Figure 1b), there are Si, C and O elements on the surface in an uneven distribution along with Al, Ti and Zr elements for SAS, STS and SZS, respectively. Moreover, the elemental composition of the as-synthesized colloidal silicas taken by EDS spectra (at the top, right side of
Figure 1b) shows that the Si and C amounts are different from those of the TEOS-based as-synthesized samples. While the Si content in SAS is 7.2%, that of STS and SZS are 18.0 and 39.4%, demonstrating that the silicon element existed in larger amount on the surface of these samples.
In the soft template route, the trivalent Al3+ and tetravalent Zr4+ and Ti4+ cations can be incorporated in the silicon framework, having the additional advantage of offering a versatile way to tailor the porous material besides, either inter or intracrystalline, as further shown by the textural properties. Another possibility is the existence of isolated silicon islands formation on a solid surface with the occurrence of possibility in this work. Especially for SAS, the high content of Al just corresponding to 21.9 % on the solid surface indicates the presence of extra-framework aluminum species, as later shown by XRD. The Ti and Zr contents accounting for 2.9 and 0.2% in STS and SZS, respectively, appear to be tailored by the incorporation of these elements in the siliceous frameworks.
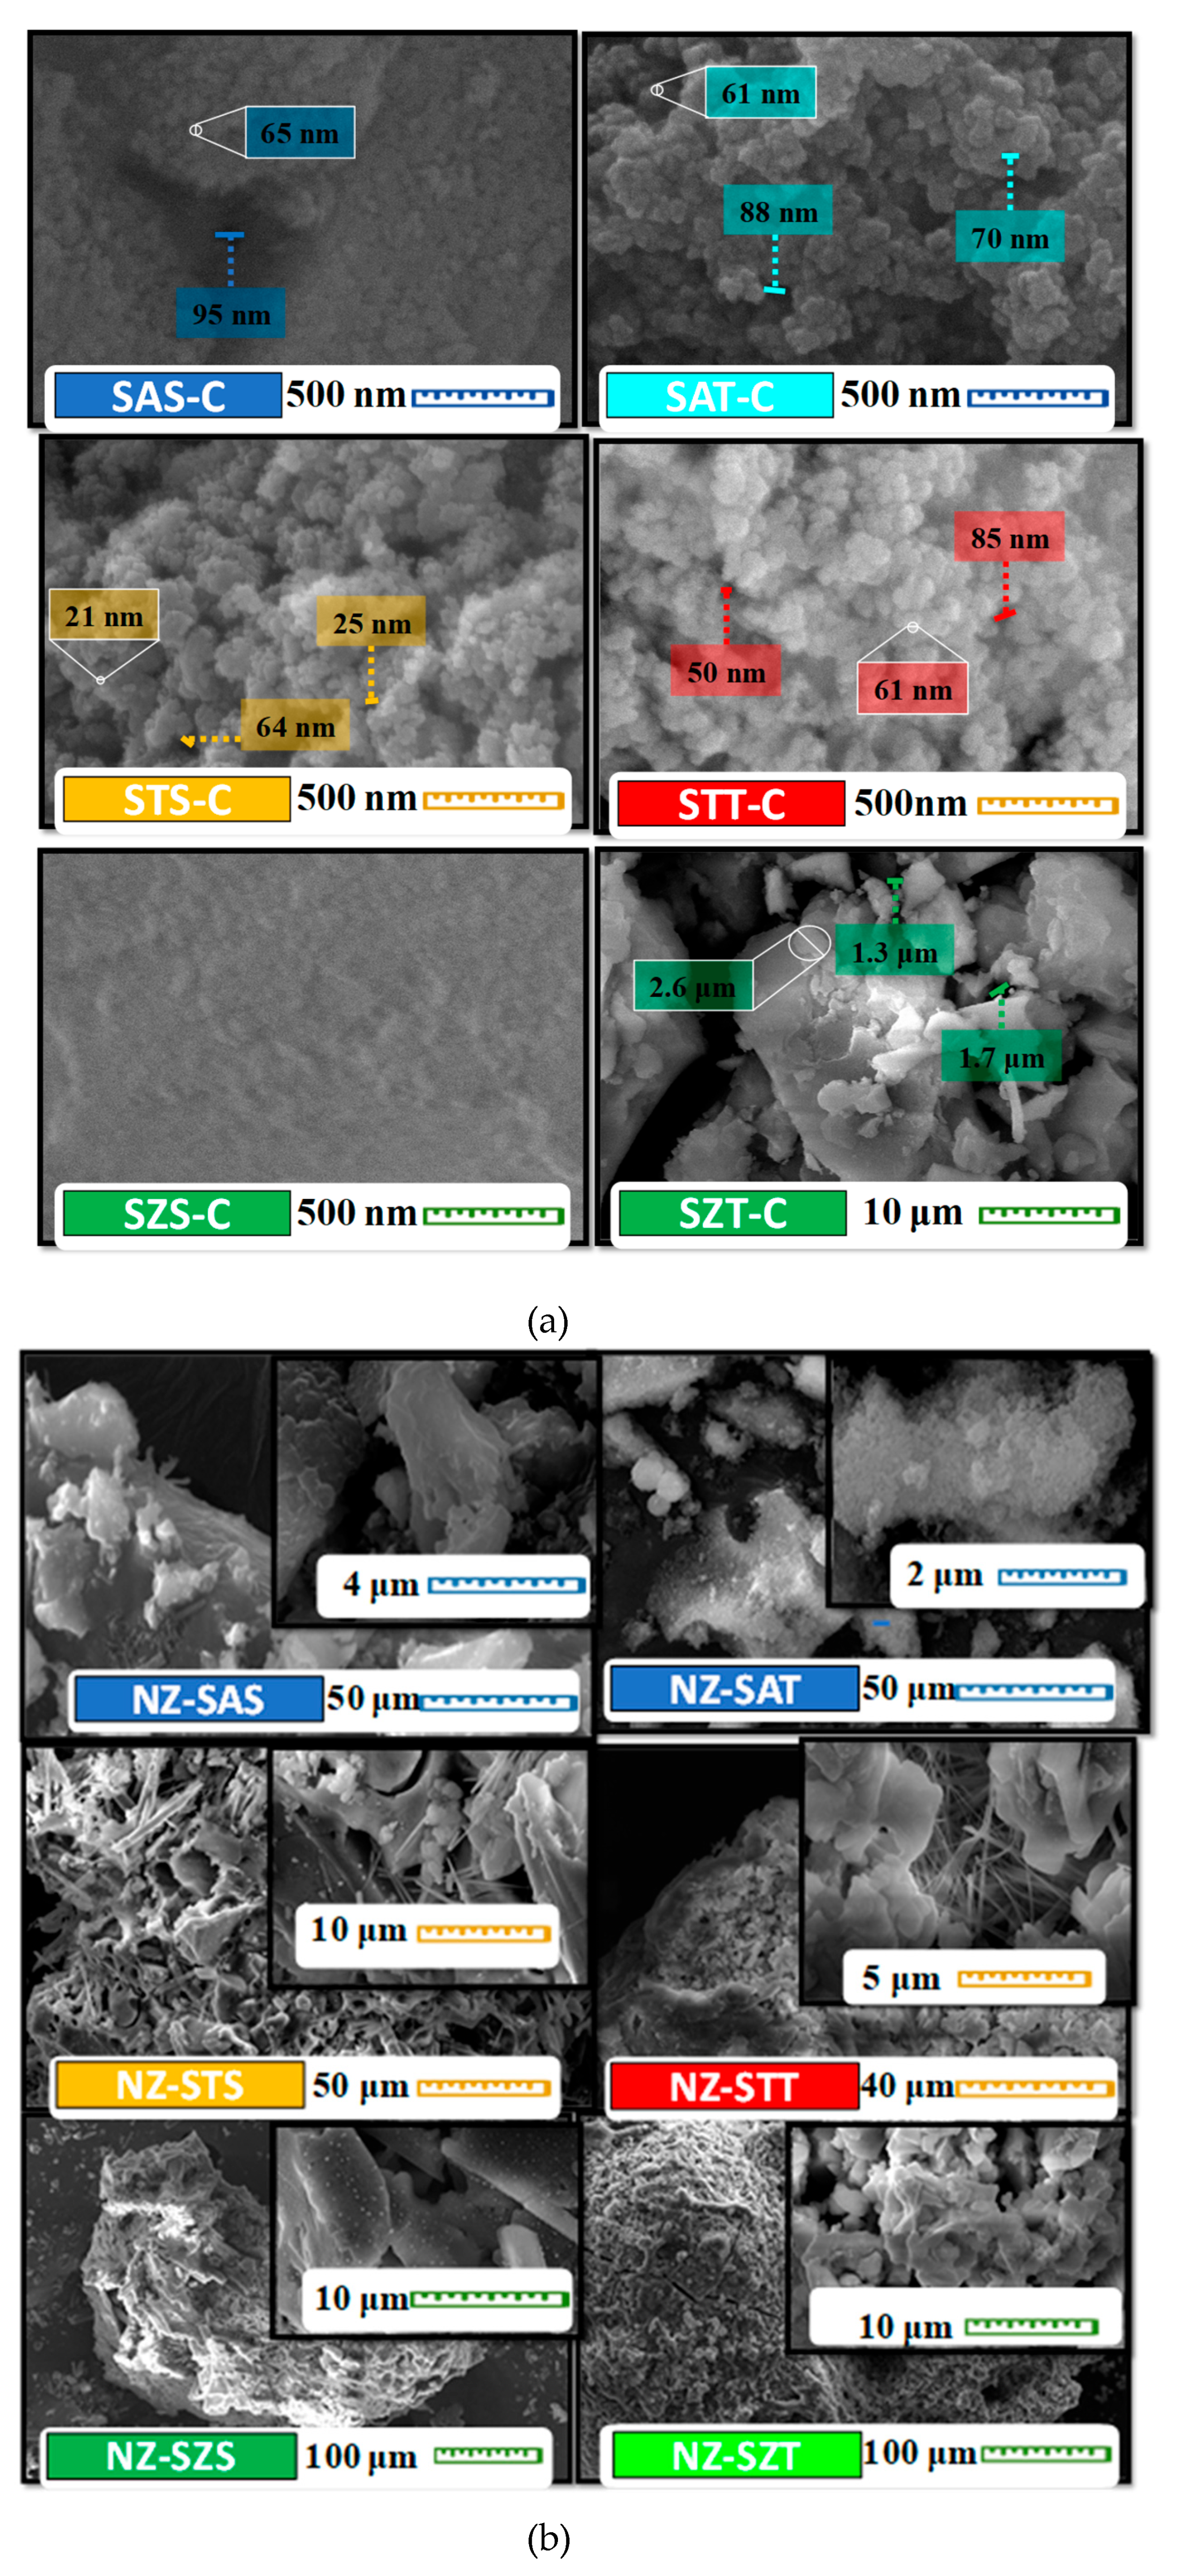
After calcination of the as-synthesized silica-based samples, the morphology of the solids significantly changes to loosely spherical-like particles, most of them being agglomerated (
Figure 2a), irrespective of the silica source used. This phenomenon can be ascribed to the growth of particles upon heating in air flow, where the particles increase their sizes. Moreover, the elements are not uniformly dispersed on the solid surface with obvious aggregation in some regions while having tens of nanometers in sizes.
Regarding the zeolite-based nanostructures obtained by the seed-induced zeolite approach, low magnification SEM images of NZ-SMT series (
Figure 2b), also indicate unevenly distributed particles in all spheres. The mesoporous silica spherical seeds acting as nuclei is a method that has expanded the application domain of hierarchical zeolites nanomaterials [
30,
31]. Thus, a surface coating on the top of the samples is also somewhat spherical with (in)finite rough surface layers covered by layers of other particles, similar to sheet-like particles (
Figure 2a). Because this kind of hard template is composed of mesoporous/microporous silica nutrients for zeolite growth, it keeps silica consumption on the external surface of the template initiating nucleation. Afterwards, zeolite recrystallization and filling of the silica sphere resulted in well-defined sphere-shaped porous solids [
11,
32]. This is probably because the seed solution assists in the creation of particles covered by the layers of other particles, independently of the seed used. These results provide further evidence that the spherical silica seed induces precoating of the TPAOH-micelle solution via a layer-by-layer deposition process on the solid surface [
5,
8,
30]. All these facts are corroborated by the NZ-SMT samples morphologies.
Comparisons of the silica source used, TEOS seed-induced zeolite gives spherical cauliflower-like materials for NZ- STT and NZ-SZT samples (
Figure 2b). The high magnification SEM micrographs of these samples illustrate uneven particles formation (
Figure 2b, included). For NZ-SAT, particle aggregates are depicted in a high magnification image with some accumulation of spherical particles, as shown in a high magnification SEM micrograph.
Upon using silica colloids source in NZ-SAS, a similar morphology is noted. In particular, it has been reported that the alkaline solution with the aid of the TPAOH structure-directing agent enables the silica seed dissolution and the aluminum entities present in the silica seeds to dissolve more readily from the nuclei with the zeolite crystals precipitating around them. Eventually, this promotes the soluble alumina species formation and further recrystallization of zeolite crystal growth giving the MFI structure and extraframework aluminum species covering the zeolite particles [
30,
31]. Such phenomenon is observed for NZ-SAS and NZ-SAT and is then confirmed by the XRD results. In the case of colloidal silica source, rough irregular particle with a diverse morphology with plates in some cases are shown for NZ-SZS and NZ-STS.
Thereby, the size of the particles is controlled by the seed-induced hydrothermal crystallization process affecting the growth to obtain large-size particles with undefined shapes, as found elsewhere [
30]. Contrastingly, the as-synthesized solids are constructed and the sphere shaped particle morphology of the seed precursor is retained for NZ-SAT (
Figure 2a). Also, high magnification SEM images suggest a variety of particles shapes, including spherical, prismatic, needles and globular-like particles (
Figure 2b).
The calcined NZ-SMT samples are converted into large agglomerated particles. The aforesaid thermal treatment of the as-prepared solids induced particle size growth and also led to the simultaneous decomposition of the organic compounds templates altering the morphology to form aggregated particles. Besides, SEM-EDS images and spectra of the impregnated samples are shown in
Figure S1 (
Supplementary Materials).
2.2. Textural Properties
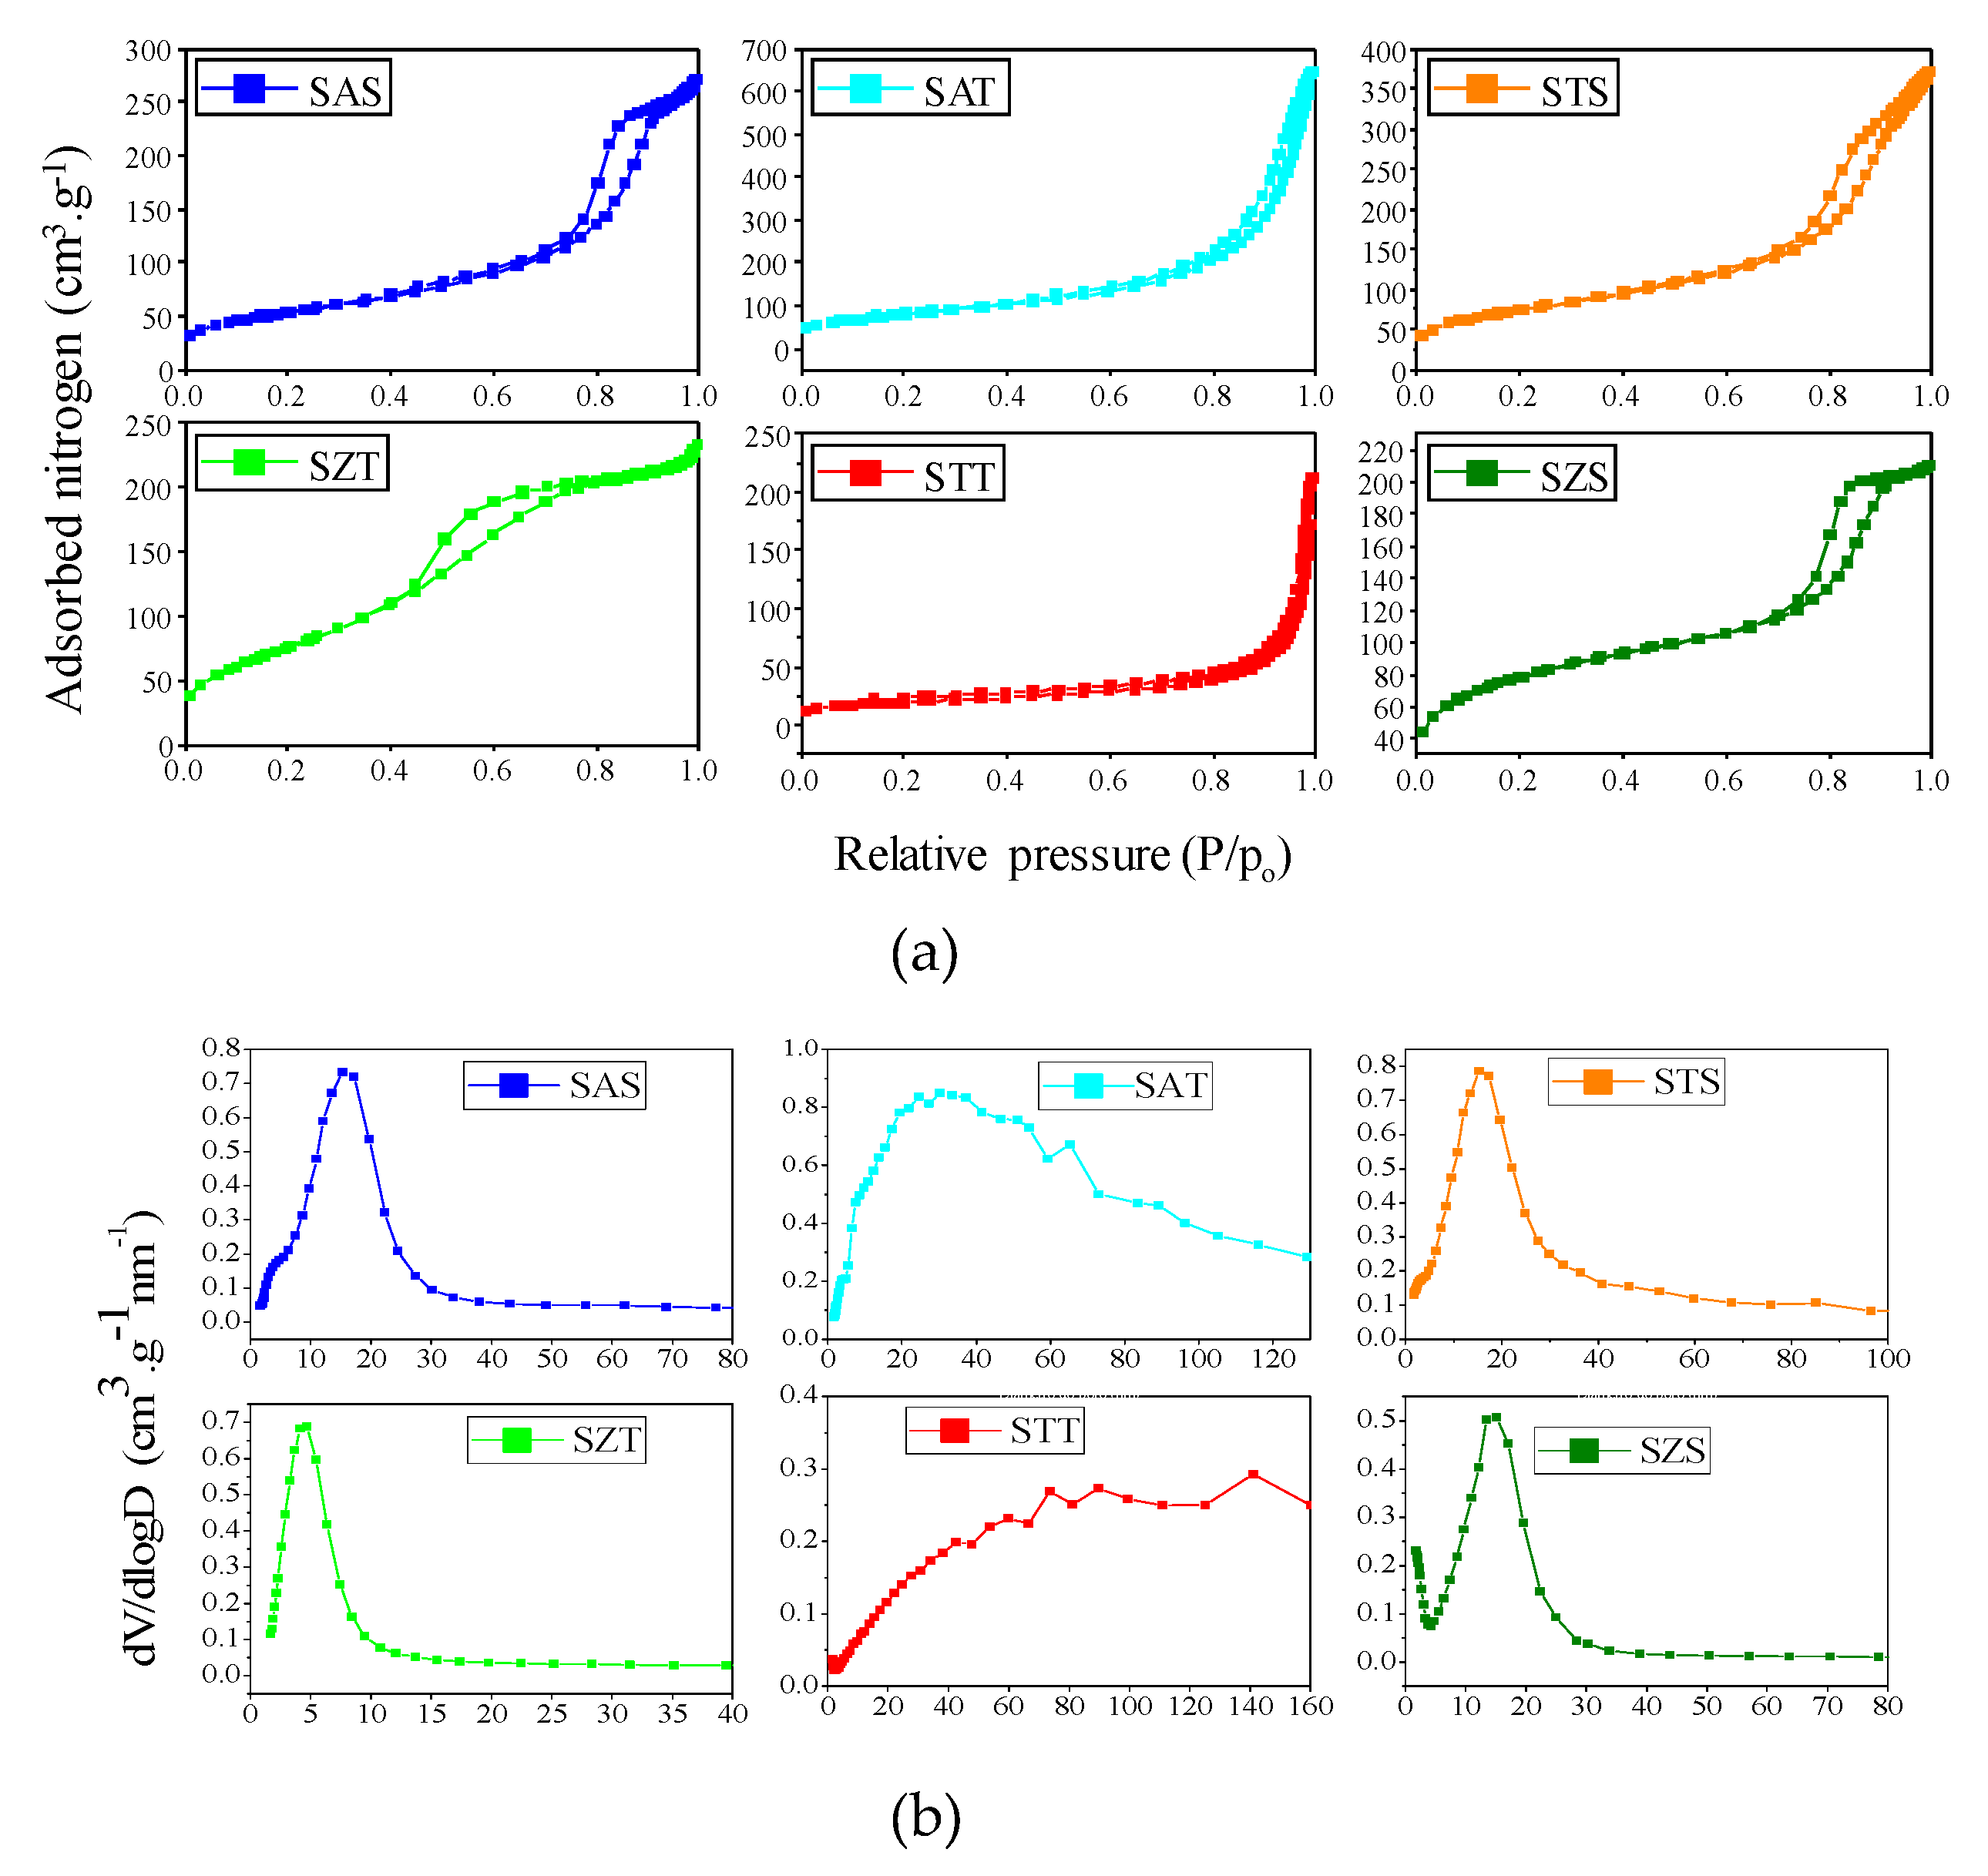
The physisorption isotherms and corresponding pore size curves of the as-synthesized silica-based solids are illustrated in
Figure 3. A detailed
Table 1 summarizes the textural properties derived from these isotherms.
The as-synthesized silica-based spherical samples (
Figure 3a
1) illustrate that solids obtained by colloidal silica e.g., SAS, SAT and SZT, have isotherms close to type IV, according to the IUPAC classification. These curves have a steep capillary condensation curve in the relative pressure range of 0.6−0.8, which demonstrates a hysteresis loop between H
1 and H
3-types. In agreement, H
1-type hysteresis loops suggest the presence of a porous structure derived from cylindrical mesopores, while aggregates of plate-like particles with slit shaped pores are seen in H
3 type [
29,
33]. The pore size curves confirm a uniform distribution of the pores (
Figure 3a2).
Compared with the parent colloidal silica, the TEOS based as-synthesized samples are categorized as type II isotherms with capillary condensation step. There is a shift towards higher relative pressures, reasonably associated with the presence of non-porous or microporous materials, except SZT. This also suggests the presence of large slit shaped pores from intraparticle voids, which are formed due to the aggregation of the particles observed by SEM-EDS analyses and corroborate with literature reports [
33,
34].
Moreover, the pore size curves changes to broad distributions indicating micro-mesoporous materials. In the case of SZT, the sorption isotherm is different from those of SAT and STT, exhibiting an isotherm between type IV and II with two hysteresis loops similar to the mesoporous material. The corresponding pore size distribution curve of SZT indicates mesopores uniformly distributed in the structure. Besides, ethanol may decrease the immiscibility between TEOS and water, which implies the formation of an emulsion, which serves as template for the formation of the spherical-like silica morphology with mesoporous structure [
35,
36].
The textural properties are listed in
Table 1. The BET surface areas for as-synthesized silica-based spheres varies from 193 to 273 m
2 g
−1, whereas the total pore volumes are in the range of 0.26-0.54 cm
3 g
-1, which are higher than those of the micropore volume and surface areas of the
t-plot. This may be assigned to incorporated metals into the silica framework during the hydrolysis of the silica precursors. Pore sizes are calculated on average to be 6-8 nm, resulting in mesoporous materials.
When the TEOS based as-synthesized silica-based spheres are taken into account, the BET surface areas and total pore volumes are comparable to those of the as-synthesized colloidal silica-based spheres counterparts with STT being an exception. It is important to highlight that SAT holds the major BET surface area and pore volume among the solids, being very comparable with those of SZT. Furthermore, the pore sizes of the SAT correspond to the micro-meso and macroporous materials. On the contrary, STT has the lowest textural parameters, probably due to the fact that almost all of the species exist on the external surface of the silica rather than being highly homogeneously dispersed in the mesoporous channels or totally incorporated into the silica framework. This result confirms the assumptions taken by SEM that shows a rough surface of uneven broken spheres with debris on a solid surface, probably coming from titanium species. The XPS results further shows the presence of carbonaceous deposits on the STT-C surfaces, even if calcined and thus, the hypothesis that organic precursors can be deposited on the solid surface is likely.
The nitrogen physisorption isotherms of the calcined silica-based spheres are given in
Figure S2 (
Supplementary Materials). Overall, the textural parameters for calcined silica-based sphere solids follow similar trends as those for silica-based spheres synthesized with slightly lower values of surface area and pore volumes (
Table 2). Accordingly, all solids are mesoporous, except STT-C having a type I isotherm, typical of a microporous solid. No significant changes in pore size are observed, implying that the calcination has more impact on morphology, leading to aggregated particles in some cases, but does not undergo obvious growth of the particles to reduce the textural parameters.
As expected, nitrogen physisorption isotherms of the as-synthesized seed-induced spheres zeolite are of non-porous materials because of the excess of TPAOH and NaOH in the seed suspension. On the contrary,
Table 3 reveals porous materials for the calcined TEOS source seed-induced zeolites. The BET surface areas and pore volumes for the calcined zeolites are estimated to be 77-279 m
2 g
−1 and 0.16 -0.48 cm
3. g
−1, respectively. Meanwhile, the bimodal pore sizes distributions with average pore size up 2.1 nm indicates that the samples contain the micro-mesoporous structures except for NZ-STT.
This provides evidence for hierarchical porosity, but also explains the effect of the formation of large interparticle voids, as suggested by SEM analyses for NZ-SAT and NZ-SZT. The spherical silica seeds work as nuclei to form hierarchical pores, as found elsewhere [
30].
In accordance with literature reports [
30,
32], the hierarchy factor (HF) can be estimated by the ratio V
micro/V
pore multiplied by S
meso/S
BET, which is a tool to classify the hierarchically structured materials. In this sense, the HF factor is found to be in the range of 0.1–0.18, suggesting the presence of MFI type ZSM-5 zeolite possessing hierarchical pores for NZ-SZT and NZ-STT samples.
Based on the above discussion, it can be suggested that the lower textural properties of NZ-SAT compared to those of NA-SZT and NZ-STT are due to the regrowth of extraframework aluminum species on the surface of the zeolite particles, resulting in a less ordered mesoporous structure. Also, unreacted silica or Zr and Ti entities can form of amorphous phase matrix in the product domain, as further seen from the structural properties.
2.3. Structural and Electronic Properties
To further confirm the formation of the samples, the structural properties of the solids are examined using XRD measurements.
Figure 4a shows the XRD diffractograms of the as-synthesized silica-based spherical solids. All XRD patterns exhibit broad diffraction peaks, similar to a halo, in the 2θ range of 20-30°. Considering the fact that the TEOS or silica colloids are used as silica sources, the absence of diffraction peaks implies that the samples are amorphous silicates or are in a nonmetric state, outside the detection limit of the XRD technique. This is a common feature of amorphous silicates obtained by soft-template methods [
9,
30,
31].
Generically speaking, one pot direct hydrothermal synthesis of materials in a single step using the soft template approach uses alkali-sources to form stable materials. These positively charged alkali entities have compatibility with negative silica species through cooperative assembly to build coordinately linked zeolite frameworks [
1,
9]. As the silicon atom constituents react and assemble with themselves during the synthesis, it could stand for a hindrance of the silicate arrangements in long range ordering, so crystallization is not available at the end of the process [
9,
31].
There are some diffraction features in SAS, for example near 2θ=18.7° (002) and 20.4° (110) arising from extra-framework aluminum species, such as gibbsite aluminum hydroxide e.g., α-Al(OH)
3 phase. This agrees with JCPDS 33-0018, confirming the formation of a pure monoclinic α-Al(OH)
3 phase belonging to the
P21/n space group. According to the findings, gibbsite may be formed from the unreacted tri-sec-butoxi aluminum precursor during the condensation and aging synthesis steps [
37].
Moreover, the peaks at 2θ values of 27.8 (120), 40.3 (031), 53.0 (200) and 64.1° (002) can be indexed as bohemite aluminum oxihydroxide e.g., γ-AlOOH phase [
33,
37]. Besides, the γ-AlO(OH) phase has the orthorhombic crystalline symmetry belonging to the
Cmcm space group (JCPDS 021-1307). The bohemite phase of SAS would derive from the hydrolysis of the aluminum alkoxide reaction during aging of the solution [
37,
38,
39].
As yet, residual titanium and zirconium phases are not identified in STT, STS, SZT, and SZS samples, independently of the silica sources. Thus, titanium isopropoxide and zirconium acetate precursors could provide low loading incorporation of Ti and Zr metals into the silicate framework while retaining the low periodicity structure control of the siliceous titanium and zirconium- based materials.
Calcination of the as-synthesized (nano)spheres at 500 °C gives distinct XRD patterns, depending on the metal incorporated (
Figure 4b). It is important to point out that the removal of organic precursors by calcination, and simultaneously the silicate layers topotactic condensation open the silicate framework forming the porous materials. These assumptions confirm the mesostructured materials formation shown by the textural properties results. Moreover, the siliceous amorphous feature is retained for the samples synthesized by colloidal silica and TEOS, the expectations being SAS-C and SZS-C. For SAS-C, narrow low intensity peaks appear at the positions of the γ-AlOOH bohemite phase, as observed in the as-synthesized solid. In the case of SZS-C, the narrowest low intensity diffraction peaks as extraframework t-ZrO
2 tetragonal phase arises with 2θ peaks at 30.2 (101), 35.4 (110), 50.3 (112) and 60.2° (211). These peaks are attributable to zirconium oxide possessing a tetragonal structure belonging to the
P21/a space group (JCPDS card 37-1484), in good agreement with the findings [
40,
41].
These results indicate that the trivalent and tetravalent cations were introduced into the silicate lattice and some of these species remain in the siliceous framework, after the calcination process. Importantly, all solids synthesized by TEOS silica are amorphous or in a nanometric size, which is not detectable by XRD.
In the case of the silica seed-induced zeolite (NZ) series, the spherical silica seed approach yields low-crystallized XRD patterns for all solids, most probably due to the low crystallization temperature used during the hydrothermal synthesis method.
Figure 4c exhibits the diffraction peaks of the calcined samples. For NZ-SAT, the major peaks at 2θ= 7.8, 8.7, 23.1, 23.8 and 24.5° correspond to the ZSM-5 zeolite with MFI topology, in agreement to JCDPS 49–0657. Additionally, the peaks in the 2θ =23-24
o range split into three other peaks at 23.1, 23.8 and 24.5°, along with low intensities peaks, which is commonly observed in ZSM-5 [
36,
42,
43,
44].
According to the findings, zeolite ZSM-5 has both the monoclinic
P21̅n structure and the orthorhombic
Pnma symmetry, when calcined at around 550
oC under flowing air [
42,
43]. Judging from the XRD peaks, orthorhombic symmetry seems to prevail in ZSM-5 with a Si/Al ratio of 77 and no extraframwerok species are detectable. Both the bohemite and gibbsite phases in the previous seed may be leached by excess sodium hydroxide during the ZSM-5 synthesis. Moreover, the diffraction peak at 7.9° (101) suggests the presence of a MFI-type structure, whereas the peak at 8.8° (020) is due to the straight channel of ZSM-5 [
35,
36]. Also, the high intensity of the 2θ= 8.8° (020) plane with respect to 2θ= 7.9° (101) one indicates directional growth in the (020) layers, as found elsewhere [
31,
32].
It is noteworthy that the crystallite size estimated from the Scherer equation from the 2θ= 7.8° (101) peak is about 49 nm. Such crystal size can be a good evidence that seeding influences the crystallization of zeolites and this is reported to occur through nucleation and shorten the nucleation stage [
32,
34]. Besides, the crystal sizes are also affected by alkalinity in the presence of crystalline zeolite as seeds. In other words, free hydroxyl (OH) entities from the alkalinity of the media are involved in the crystallization process and such entities change the electron density during crystal growth acting as a co-template, consistent with previous reports [
43,
44].
The XRD patterns of NZ-STT and NZ-SZT (
Figure 4c) indicate that samples using Ti and Zr as seed result in broad diffraction peaks. Despite the broadening of the peaks, all of these two samples exhibit the silicalite-1 MFI zeolite. Crystalline silicalite-1 has the main 2θ peaks appearing at 7-9 and 12-22.5°, and the prominent peak at 2θ= 23-25° corresponding to the (101), (020), (002),(102), (112),(040), (103), (501) and (303) lattice planes, respectively (JCPDS 43–784). In particular, the MFI-type crystal structure has an assembly of pentasil layers, possessing a 3D pore dimensionality composed of two types of pore channels along the [100] (zig-zag) and [010] (straight) directions, while the 10 MR channels forms the structure [
44,
45]. Additionally, the silicalite-1 pore system has straight channels with 5.3x 5.6 Å dimensions parallel to the b-axis while sinusoidal channels with 5.1x 5.5 Å dimensions extend along the c-axis [
46].
It is clear that silicalite-1 is a polymorph of silicon dioxide with MFI framework topology that holds the crystalline features and chemical defects e.g., twining, MEL intergrowth and silanols, being the most ordered zeolite crystal of MFI topology [
42]. Thus, silicalite-1 displays both orthorhombic
Pnma symmetry and monoclinic structure with a
P21/n11 space group symmetry, depending on the synthesis conditions e.g., type of alkaline ion, pH, temperature and crystallization time, among other factors [
31,
43,
47]. These findings indicate that silicalite-1 adopts the orthorhombic phase at temperatures up 500 °C under the alkali hydrothermal synthesis conditions [
46,
47].
It is important to note that the XRD peaks of the NL-SZT are blunter than those of NZ-STT. It accounts for the distinct crystal orientations and directions of channels in the silicalite-1 zeolite. For instance, directions (101) and (020) do not engender at low seed concentration, whereas the relative intensity of directions (501) and (303) at 2θ= 23-25° are weak, as found elsewhere [
31,
32]. This is attributable to the defective channels of the structure due to the concentration of the pre-coated seed solution determining the density and thickness (layers) of the deposited seed crystal, as previously shown by SEM-EDS.
Besides, the absence of the ZrO
2 tetragonal phase at around 2θ= 30.2, 35.4, 50.3 and 60.2° in NZ-SZT indicates the disruption of the crystal structure due to the difficulties of Zr incorporation resulting in amorphous Zr phases, but somewhat preserving the silicalite-1 phase. On the other hand, the incorporation of low loading of Ti into the crystalline zeolitic framework of NZ-STT forms titanosilicalite-1 with high purity, as found elsewhere [
47]. Indeed, the crystallite sizes of NZ-SZT and NZ-STT were determined by the Debye−Scherrer formula from XRD data assuming a pure Lorentzian contribution to the peak broadening, as found to be 36 and 44 nm. This confirm that these samples have small crystallite sizes whereas NZ-SAT has the smallest, e.g., 26 nm.
Furthermore, the impregnation of Fe and Cu in NZ-SAT and NZ-STT does not affect the XRD patterns and all of samples remain orthorhombic silica-seeded zeolite based samples, irrespective of the metal dispersed.
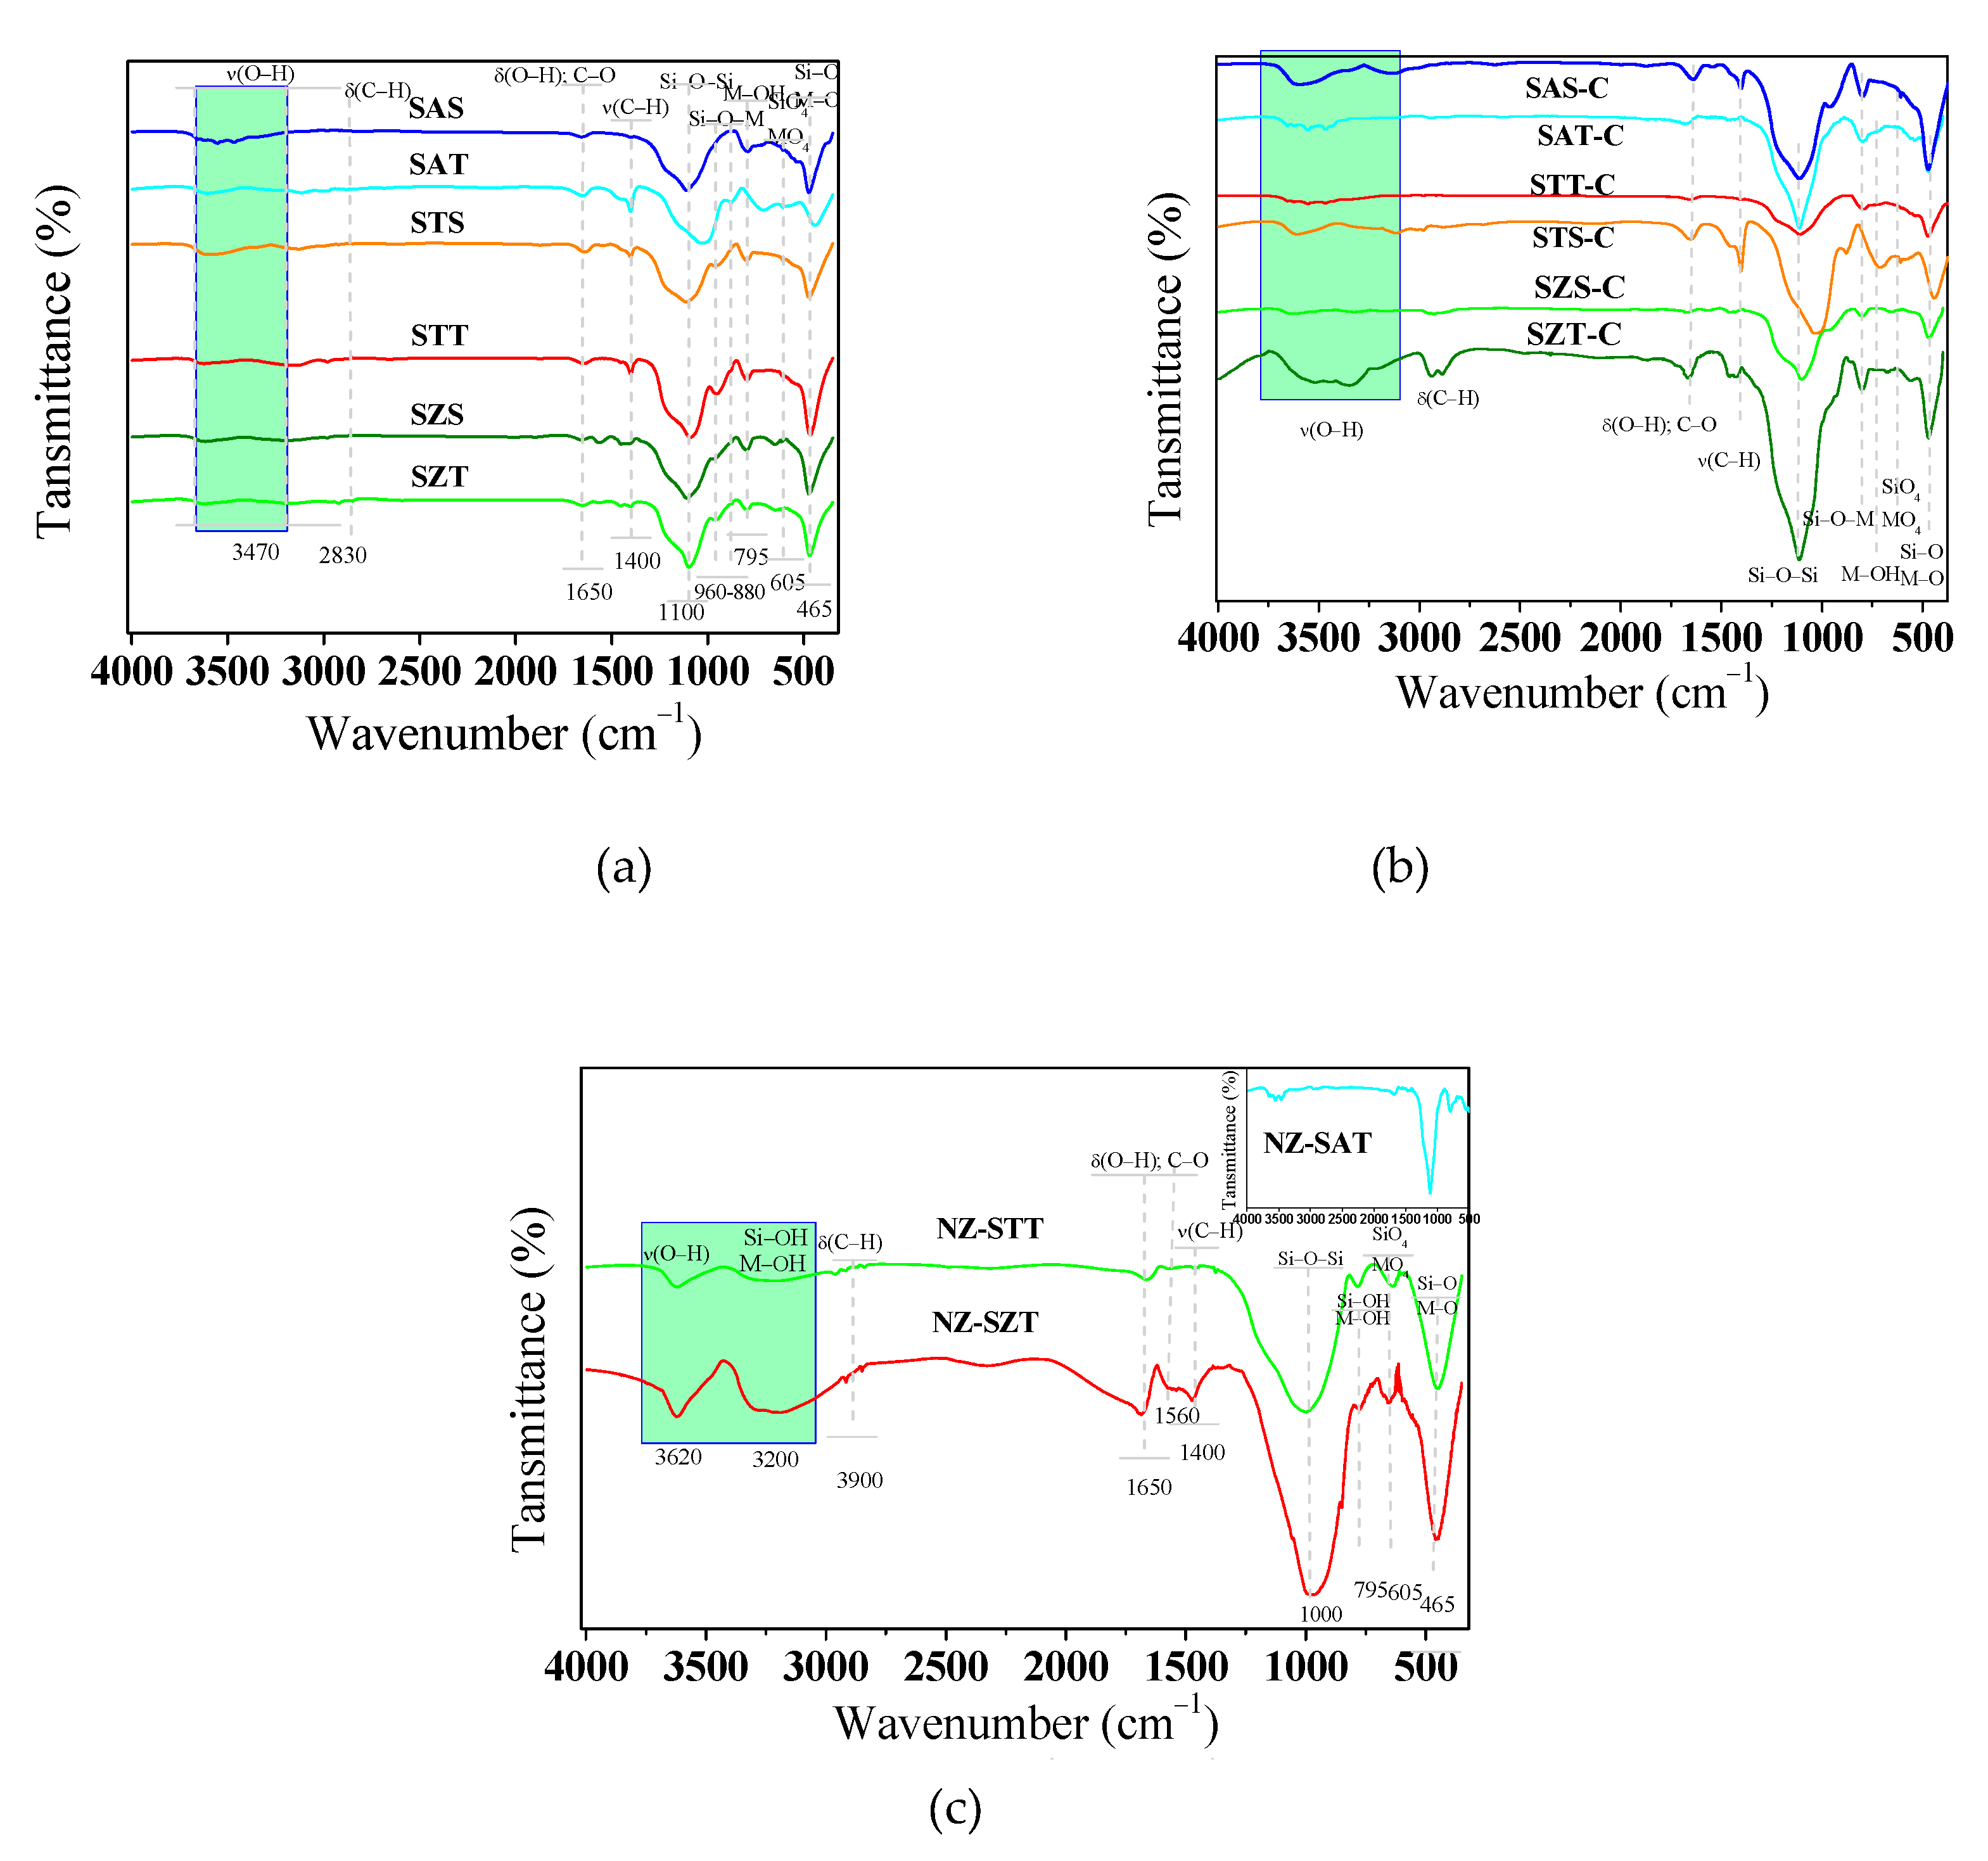
FTIR spectroscopy is performed as a complementary tool to investigate the structural features of solids. The FTIR spectra of the silica-based spheres (
Figure 5a) depict broad bands at about 3470 and 1650 cm
−1. These spectral patterns for the absorption bands are ascribable to the stretching of the surface OH groups and bending OH vibrations of free adsorbed water molecules in all samples, as found elsewhere [
48]. There are no differences in the bands intensities, which is assigned to the presence of the same functional groups in the solids. Also, absorption bands identifiable at 2830 and 1400 cm
-1 due to the bending δ(C-H) and stretching ν(C-H) vibrations arising from the presence of non-hydrolyzed OEt groups are found in TEOS based samples, in agreement with the findings [
4,
49,
50].
Of importance, the strong absorption bands at about 1100 and 800 cm
−1 are likely due to asymmetric and symmetric stretching of the Si–O–Si bonds, besides the Si–O–Si lattice transverse optical modes [
29,
49]. Moreover, the weak absorption bands at 795 and 465 cm
-1 are attributable to the Si-O-Si or O-Si-O bending modes [
4]. Additional strong bands detectable in the 960-880 cm
-1 range can also be associated with Si-O-M, M-OH and M=O bonds [
4,
51]. The presence of these entities is later shown by XPS analysis.
Calcination of the silica-based spheres gives similar spectra with all the bands mentioned above (
Figure 5b). Remarkably, the decrease in intensity or absence of the ν(C-H) bands implies the partial elimination of the organic compounds after calcination, except for SZT-C, probably due to the incomplete removal of the zirconium isopropoxide precursor.
The FTIR spectra of the calcined seed-induced spheres zeolites are shown in
Figure 5c. There is almost no difference between the calcined seeded-base SMT-C spheres and the seed-induced zeolites concerning the surface hydroxyl groups OH stretching region. That is, the absorption bands at around 3630 and 3200 cm
-1 are clearly visible for all samples. Thus, the structure of the seed-induced zeolite solids is preserved after calcination, in agreement with the XRD results. Moreover, the asymmetric stretching vibration of the SiO
4 tetrahedral is identified as a broad band centered at 1000 cm
-1 with shoulders at around 1237 and 1228 cm
-1. This agrees with SEM results that suggest that most of the organics are removed and only hollow silica is retained.
Around 1190 cm
-1, a strong band assignable to the longitudinal-optical mode of the asymmetric stretches of the Si–O–Si linkage is again visible along with the Si–OH stretching at 953 cm
-1. These bands are well recognized in reports on MFI-based metallosilicate structures [
52]. As these bands experience a red shift in the case of NZ-STT and NZ-SZT compared to NZ-SAT, a probable increment in the bond distance between Si and O is likely. This is associated with greater expansion of the MFI lattice due to the possible incorporation of foreign atoms [
49,
52].
Also, FTIR spectra exhibit double ring vibrations of the MFI structure arising at 549 (605), 551 and 465 cm
-1 accompanied by Si–O–Si bending vibrations at 445 and 447 cm
-1. Noticeably, the low intensity bands at approximately at 2994 and 2867 cm
-1 refer to ν(C-H) groups in conjunction with a band at 763-795 cm
−1 from CH
3 rocking and Si–CH
3 stretching. At 1390 and 1440 cm
−1, the δ(C-H) bond vibrations are clearly visible in most of the samples. Also, other bands arising at 1589 and 1520 cm
−1 are ascribable to the C-O and C=O groups, respectively [
52,
53].
It is quite clear from
Figure 5c that the NZ-STT and NZ-SZT do not undergo complete removal of TPAOH species by calcination. Of importance, the band at 958 cm
−1 appearing in NZ-SAT (included
Figure 5c) is ascribable to asymmetric Si–O–Ti vibration, as found elsewhere [
54]. It could indicate that Ti is incorporated into the silicate framework, as suggested by the XRD results.
Based on all the results, it is confirmed that TEOS is more suitable to provide more spherical silicates with high textural properties, compared with its colloidal silica counterparts. Inclusion of Ti, Al or Zr metals into the spherical silicate framework is likely to be done by the applied one pot method, except for SAT. More importantly, these amorphous mesostructured materials are excellent seed precursors for MFI silicate possessing distinct transition methods, while preserving their difference in particle size and crystallinity.
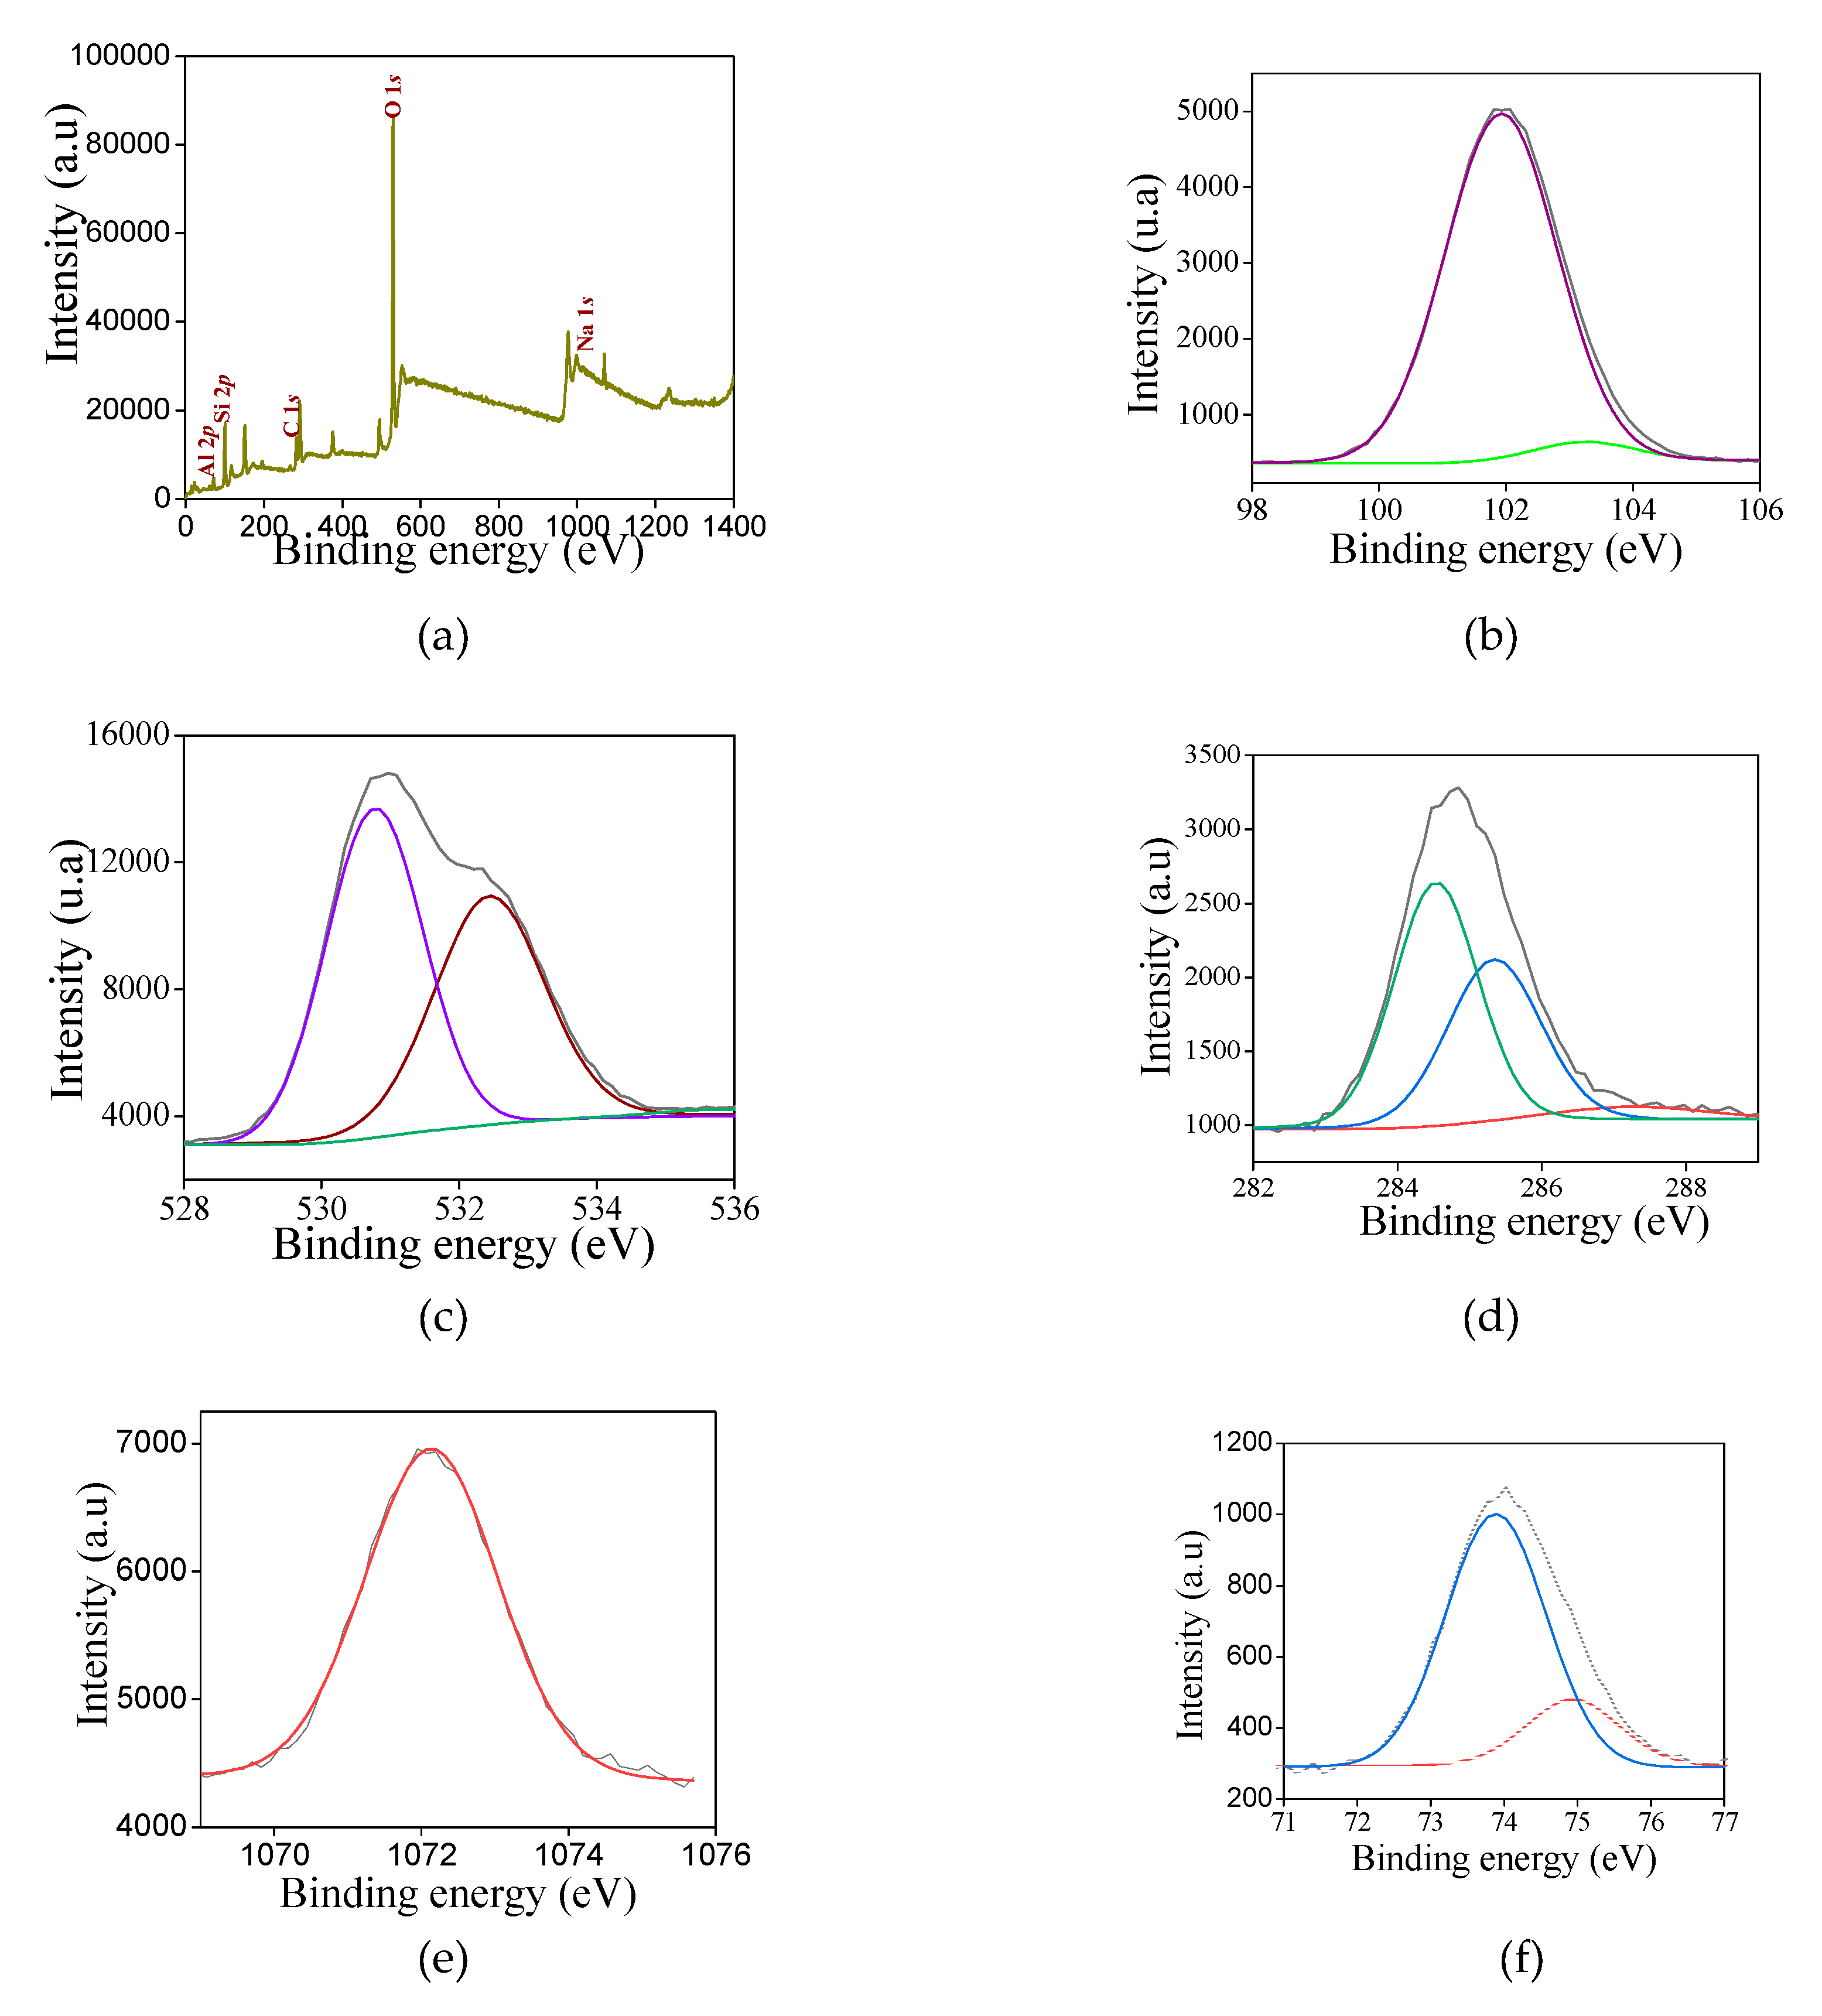
To gain further insights about the electronic properties of the solids, XPS analysis are performed for selected samples. The XPS survey spectrum (
Figure 6a) reveals that all samples contain silicon, oxygen and carbon constituent elements. Besides the peaks of Si 2
p, O 1
s and C 1
s, the Al 2
p, and Na 1
s core level signals appear for NZ-SAT.
Examination of the Si 2
p spectrum (
Figure 6b) illustrates that silicon arises as one asymmetrical and width peak for NZ-SAT. The deconvolution of the spectrum shows two superimposed contributions that can be fitted at 102.1 and 103.5 eV (
Table 4).
It could indicate that surface silicon is present in various environments. Correspondingly, the peak at 102.1 eV is the major component, where the tetrahedral silicon species (Si
4+) with the Si-O-Al bonds is predominant. This is in good agreement with the literature reports showing these types of Si-O bonded with Al species [
51,
55,
56]. A minor contribution positioned at around103.5 eV reveals the silicon existing as Si
4+ entities in amorphous SiO
2 [
55,
56,
57]. These results are in full agreement with FTIR results that identified such species. Importantly, literature reports describe a component at about 102.8 eV recognized as silicon bonded with hydroxyl groups e.g. Si-OH for silicates [
56,
57]. Given the fact of the bordering of the main peak, the existence of the Si-OH entities cannot be ruled out in NZ-SAT, as evidenced by FTIR results. Also, the presence of Si-O-M (M=Al) entities are attributed to a peak at around 104 eV [
51,
55,
56]. Judging from the characterization results, these species can be present in NZ-SAT.
The spherical like SMT-C samples have no relevant peak shifts of Si entities concerning the contributions at 102.2 eV, which is reasonable that the same species are present with much more Si-O-M functionality dominating in their spectra, in line with FTIR measurements. Another contribution located at 103.8 eV arises, in addition to those at 102 and 103.5 eV, that can be associated with the Si-O-C bonds, e.g., Si-O-CH
3, as found elsewhere [
57].
In the case of the O 1
s spectra (
Figure 6c), the asymmetrical peak undergoes more than one contribution. The binding energy is centered at 530.9 eV, confirming the presence of either Si-O-C or Si–OH bonds [
57,
58,
59]. The peak at around 532.0 eV is associated with bridging oxygen atoms containing Si-O-Si and Si-O-Me bonds from the silica framework [
58]. These contributions appear in all solids as depicted in
Table 4.
The Na 1
s photoemission appears in NZ-SAT, SAS-C and SAT-C as weak peak positioned at 1072.1 eV (
Figure 6d). This accounts for 0.26-1.22 wt.% of the Na originated from the residual sodium hydroxide used during the synthesis.
Meanwhile, the C 1
s core level spectrum (
Figure 6e) shows three contributions. The main C 1
s peak appears at 284.5 eV due to the adventious carbon and C-C, -C=C- entities, while the deconvolution exhibits a contribution at 285.3 eV (C–O) and 288.2 eV (O–C=O). This is consistent with the assumptions taken from of the Si environments that suggest all these species are present in the samples and FTIR results, as well. Important is to note that C 1
s core level spectrum has a weak signal indicating the organic component from the synthesis are partially removed from the solids.
Moreover, the typical Al 2
p core level spectrum depicts one contribution at 74.1 eV for SAS-C and SAT-C, which is characteristic of Al
3+ entities in silicoaluminates materials [
55,
60].
For NZ-SAT, the Al 2
p spectrum splits into doublets (
Figure 6f) at binding energies of 74.0 and 75.0 eV. It can be assumed that in aluminosilicates the increment in the binding energy of ca. 75 eV for Al 2
p core level is an indication of tetrahedral coordinated Al substituting some of the silicate units [
61].
Based on these assumption, one considers that most of the aluminum is replacing Si into the silicate framework in NZ-SAT. It is not easy to ascertain the difference between tetrahedral and octahedral Al atoms by XPS results since the binding energy variations are within the margin of error [
61]. In addition, the Al KLL signal cannot be recorded since the monochromator impedes the irradiation of the sample with the Bremsstrahlung radiation. Meanwhile, the Al/Si atomic ratios are also addressed for NZ-SAT, SAT-C and SAS-C, being 0.18, 0.28 and 0.37, respectively. These results clearly indicate that the aluminum could be incorporated into the silica framework in the case NZ-SAT-C whereas SAT-C has aluminum-containing species as finely dispersed nanoparticles, located in the pores and/or on the solid surface, which are not detectable by XRD. Contrary, extraframework Al species are evident on XRD pattern of SAS-C confirming the highest Al/Si atomic ratio observed by XPS.
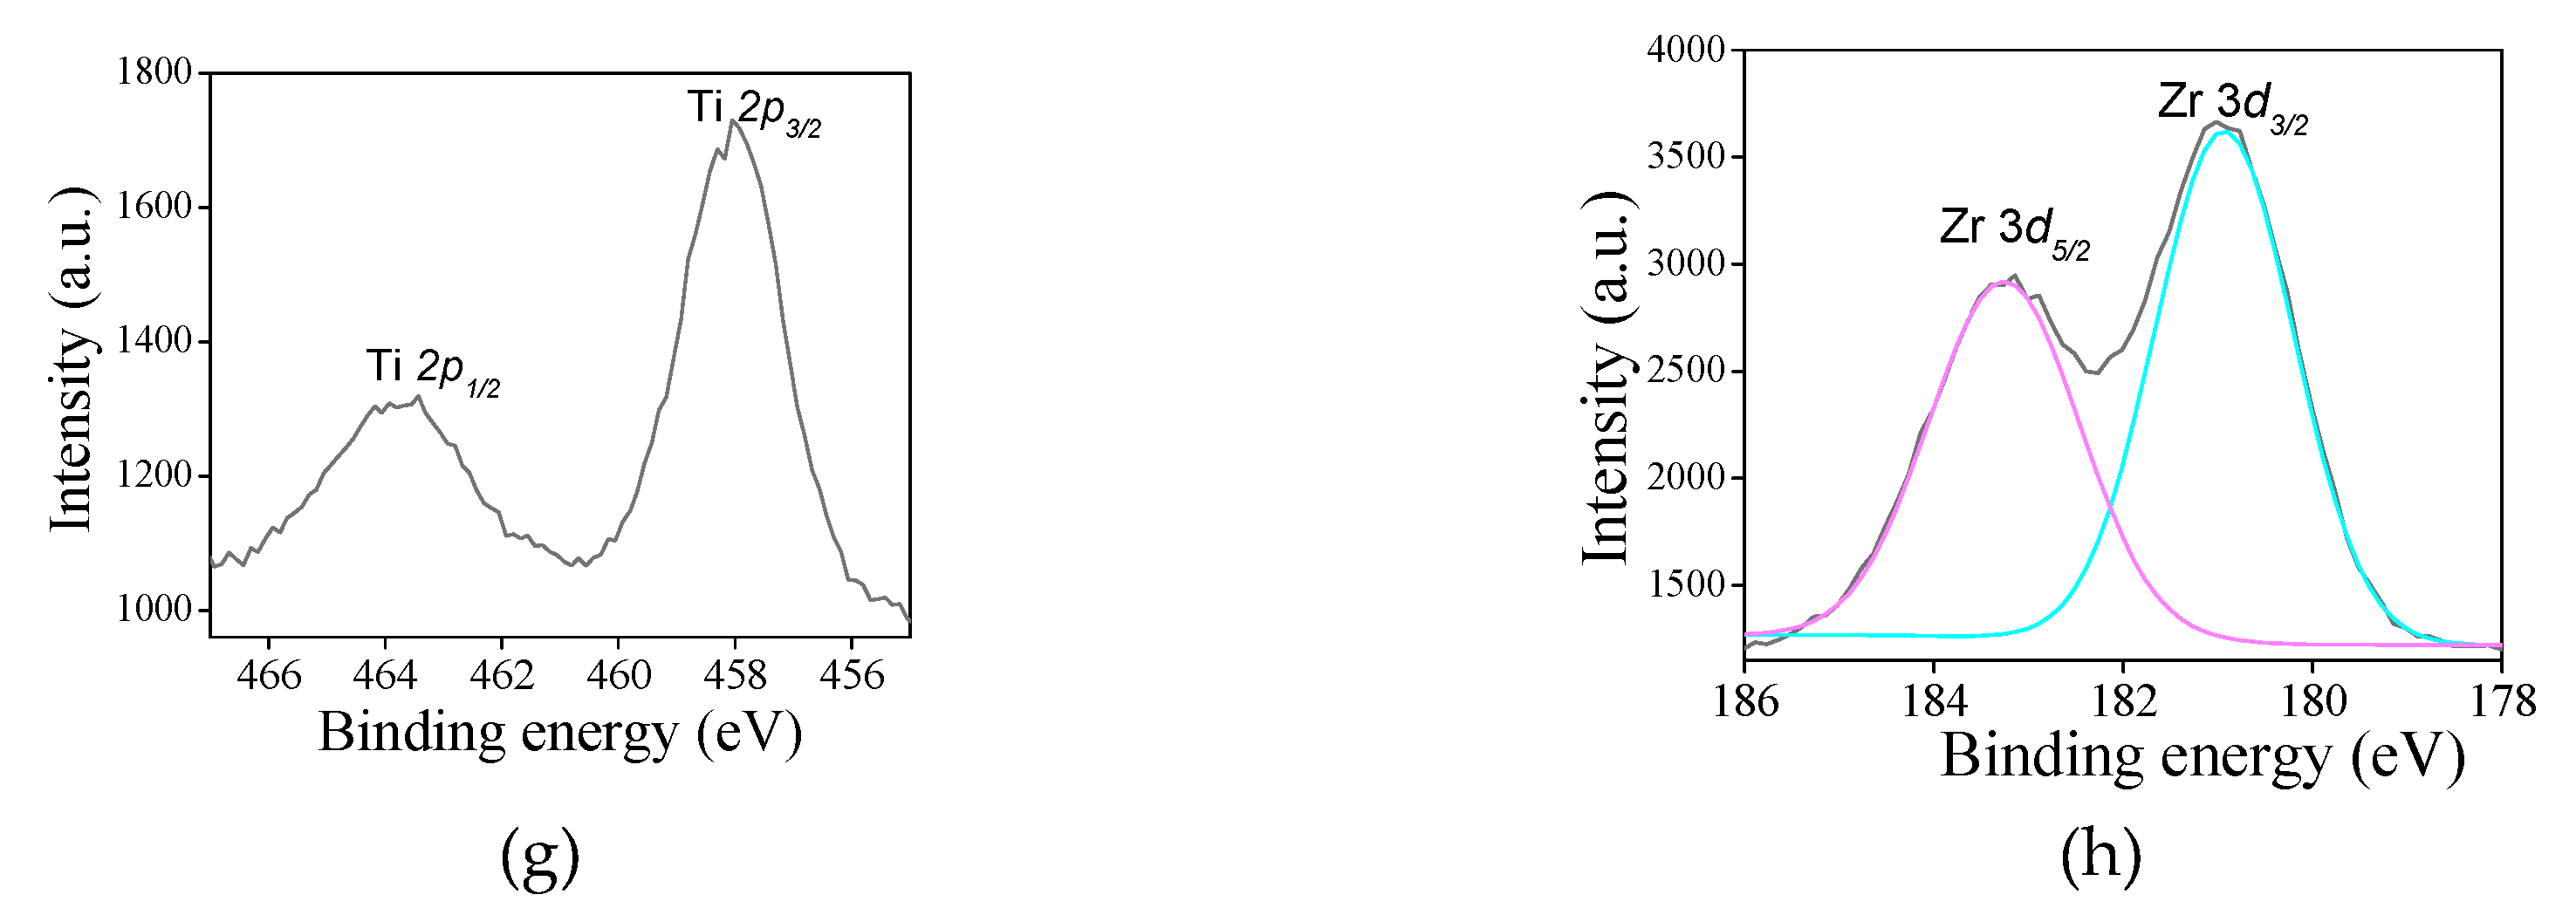
For the titanium-containing samples, the typical Ti 2
p core level spectrum (
Figure 6g) is deconvoluted in a doublet Ti 2
p3/2 -Ti 2
p5/2 at 457.9 eV and 464.5 eV, respectively. It is inferred that the binding energy values of the doublet in addition to the splitting is nearly 6.5 eV are indicative of Ti
4+ valence state in both SAT-C and SAS-C samples, corroborating with the previous work [
55,
62]. In titanium silicates, the Ti 2
p3/2 core level shows the tetrahedral Ti
4+ at binding energy near 460 eV, whereas the octahedral coordination Ti
4+ entities give lower binding energy at around 455.0 eV [
61,
63]. Despite the O 1
s core level spectrum only shows one contribution, it would be possible that there are other contributions at 530.7, 532.6 and 531.1 eV, attributed to be from Ti–O lattice oxygen, surface hydroxyl groups and Ti–O–Si linkage, as described in the literature [
63]. From these assumptions, it can be concluded that Ti
4+ exists included into the silicate framework, as shown by FTIR results. The surface Ti/Si ratio in STS-C is estimated to be 0.35, which is twice of that STS-C e.g.,0.17. These results evidences that Ti atoms are tetrahedral coordinated in STS-C in opposite to the STT-C where octahedral coordinated Ti possibly arises as well-dispersed Ti species on the surface.
Regarding the Zr 3
d spectrum for SZT (
Figure 6h), the doublet Zr 3
d5/2 – Zr 3
d3/2 is visible at 183.1 and 185.2 eV, respectively. This considers the possible existence of zirconium as Zr
4+ included into the silicate framework, in good agreement with the reported values for zirconiumsilicates [
58]. This may be due to the Si–O–Zr bonds formation observed by FTIR results. Besides, The Zr/Si atomic ratio is 0.07, confirming that Zr is accommodated into the MFI silicate framework.
2.4. Catalytic Evaluation in Esterification of Glycerol
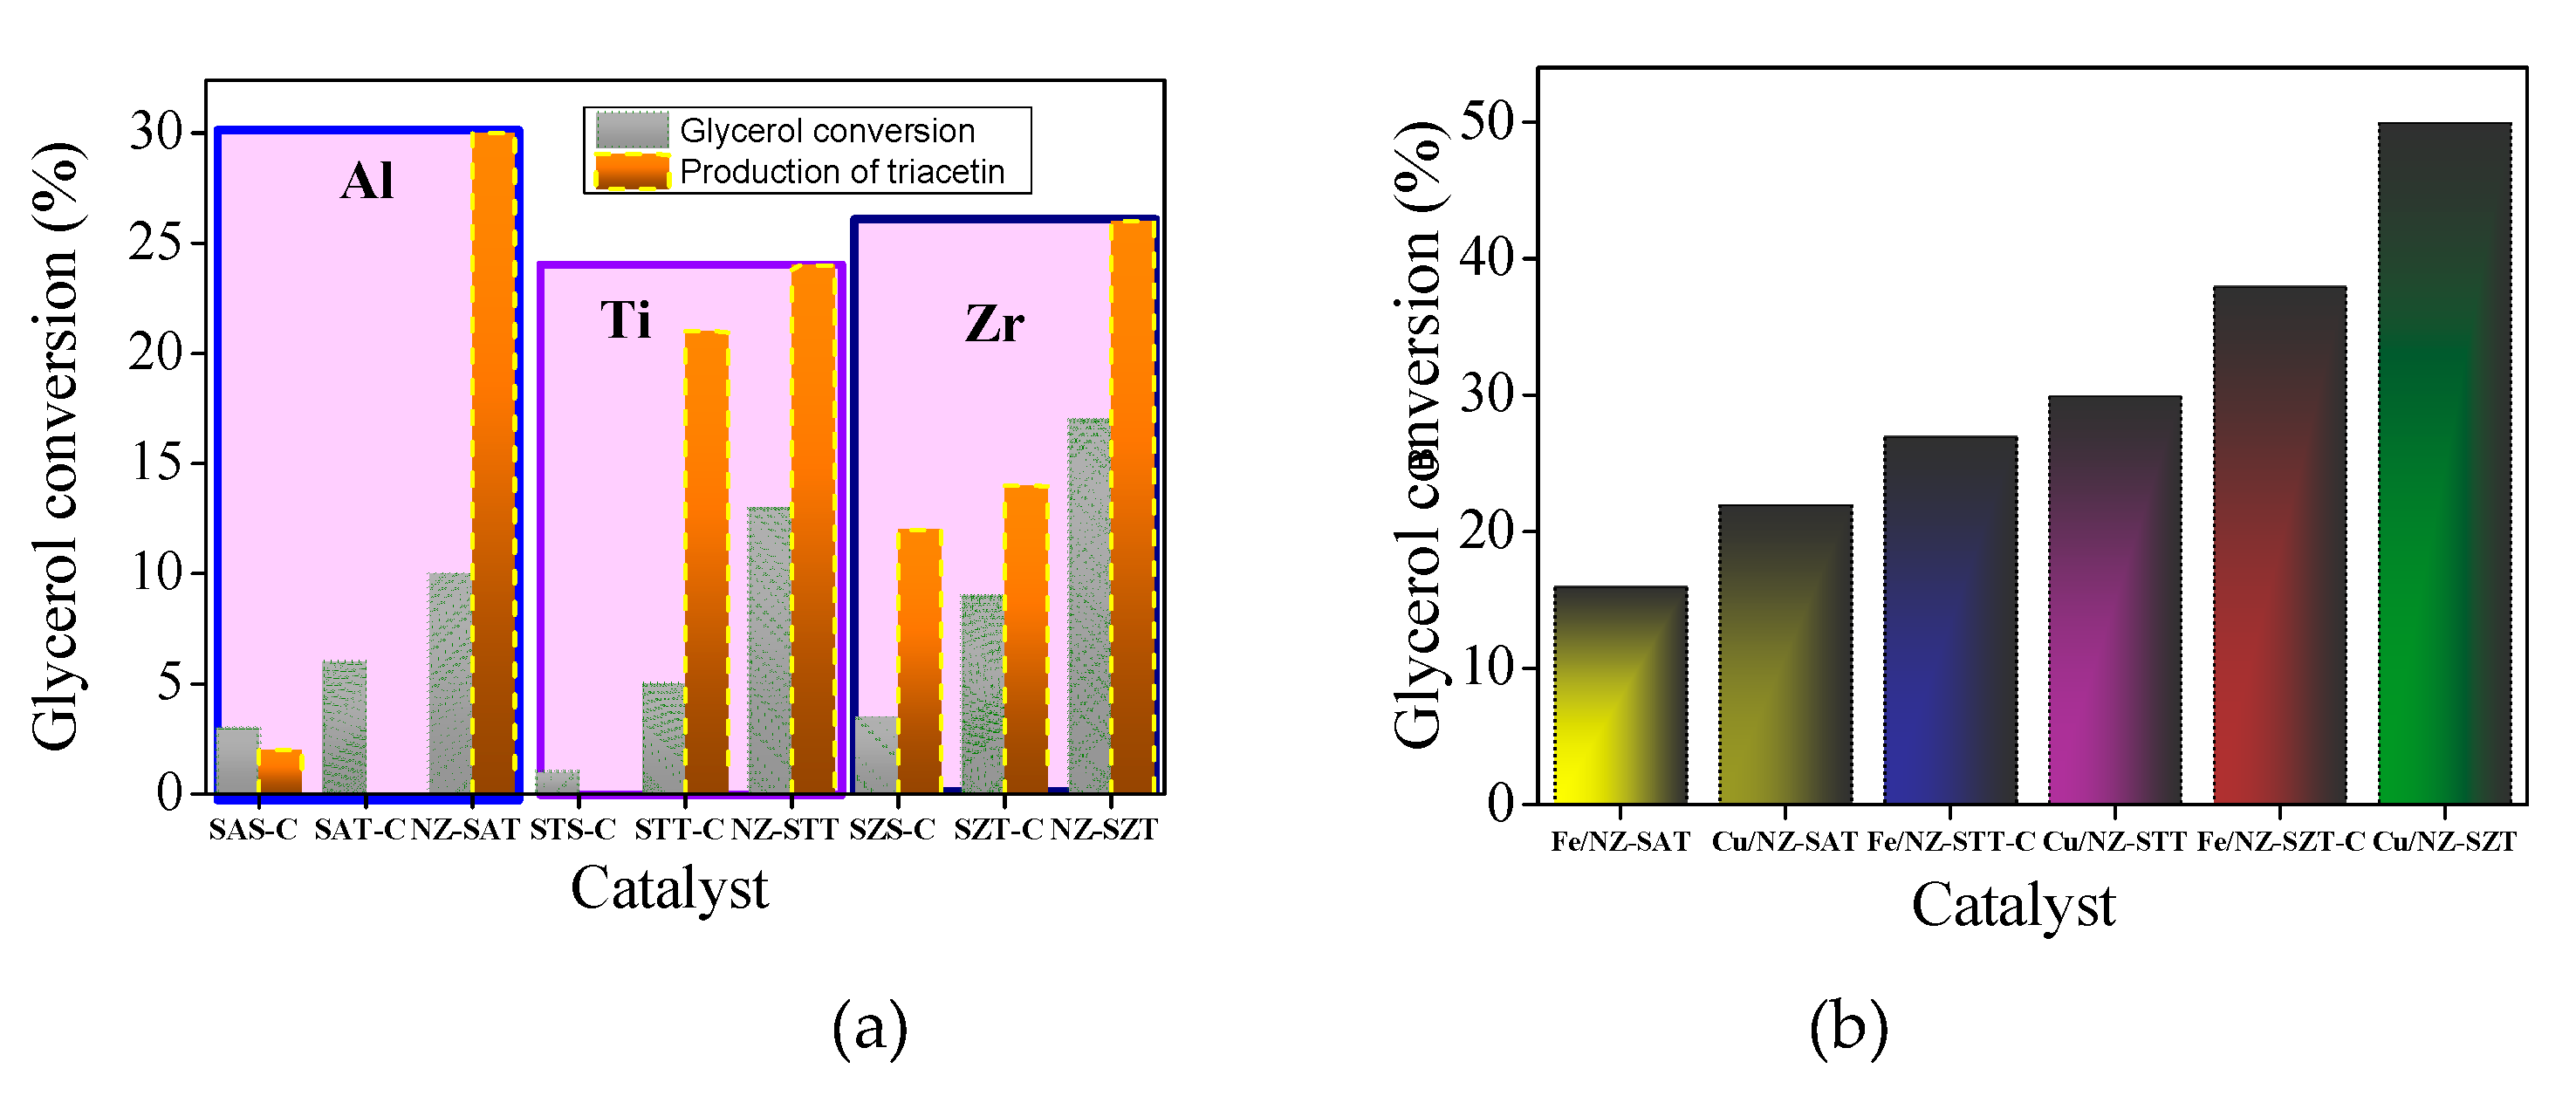
The catalytic performances of the solids are investigated in the esterification of glycerol reaction in the presence of acetic acid for 6 h (
Figure 7a).
All samples exhibit glycerol conversion and produces triacetin, expect STS-C. More surprising is the fact that glycerol conversion is favored by the use of TEOS as a silicon source, achieving glycerol conversions up to 5%. That is, the colloidal silica source does not exert changes in the structural features of the silicates exhibiting modest catalytic behavior, compared with their TEOS counterpart. Since there is a corresponding contribution of the textural properties in the TEOS-based samples, these results should be unambiguously associated with the exposition of the active sites. Besides, the small differences observed in colloid silica as a silicon source e.g., a glycerol conversion below 3.5%, demonstrates that poor activity of these solids is due to their agglomerated particles resulting in lower values of textural parameters.
Likewise, the type of metal included in the silicate e.g. Al, Zr or Ti, has a great effect on the catalytic performance. For instance, samples obtained by TEOS in which Zr and Ti heteroatoms are included in the silicates have maximum glycerol conversion of 13%, while the Al-counterparts only reached 10%, as highlight in the squares.
For product distribution, the triacetin product is obtained almost all solids along with byproducts including glycerol oligomers. The reasons for increase of triacetin in the product distribution in NZ-SAT and NZ-SZT are attributed to their higher acidity, as shown in aluminum-based samples [
33,
51]
Apart from the metal type, catalytic performance is also influenced by another contribution, the zeolite structure. The NZ-SMT samples show the major glycerol conversions among the solids studied, with NZ-STT converting 17%. Since the heteroatoms are located at general points of the MFI crystal structure, this gives unique physicochemical properties (XRD and FTIR results), the catalytic behavior depends on the viability of these sites for the reaction. Hence, to help understand the effect of adding a heteroatom into the MFI structure on the catalytic behavior, it is necessary to revisit the probable reaction active sites of the EA reaction [
22,
51]. Thus, the presence of the heteroatoms may improve the catalytic performance of the solids.
Although all the previous characterization results pointed out that the NZ-SZT and NZ-STT zeolite nanospheres possess a low crystallinity degree, the introduction of Me cations into the zeolite structure through seeding of the zeolites maintains the content adequate Me ions within the silicate framework. Thus, a synergetic role between porosity and surface Me4+ ions i.e., Zr or Ti may form a strong interaction with the zeolite framework compared to Al3+ions. As a consequence, the Me/Si ratios reflect the significant increment in the catalytic activity of the solids.
To improve the catalytic activity, Fe and Cu are supported on the NZ-SMT (M=Al, Ti or Zr) nanospheres by impregnation method, As Cu and Fe are Lewis acid centers for acid-base reactions [
22,
37], each metal alone may induce the creation of more active acid sites for EA reaction and, thus, it would enhance the catalytic activity of the solids. Hence, with the impregnation of Cu or Fe, the physicochemical properties of the solids improved their catalytic performance, which is more prominent upon dispersing Fe rather than Cu on the zeolite support.
Figure 7b displays the performances of the solids indicating that the glycerol conversions follow the order: (Fe or Cu)/NZ-SZT>(Fe or Cu)/NZ-STT> (Fe or Cu)/NZ-SAT. For this last sample, the catalytic performance achieves around 50% glycerol conversion in the EA reaction due to the increment in the highly exposed Cu active site thanks to its high acidity.
This trend is also observed for unsupported solids (
Figure 7a), confirming the best catalytic results when TEOS is used as a silicon source to obtain metallosilicates seeds, in which Zr or Ti are incorporated into the silicate framework. As a result, the derived spheroidal-like zeolite morphology has a relative small amount of the Me
4+ within the silicalite structure along with a micro-mesoporous structure with high surface area. This allows the exposition of their well dispersed Cu or Fe active sites on the zeolite support, while achieving high performances in the EG reaction.

