Preprint
Article

Technical-Economical Study on the Optimization of FDM Parameters for the Manufacture of PETG and ASA Parts

This version is not peer-reviewed.

Submitted:

10 July 2024

Posted:

11 July 2024

You are already at the latest version

A peer-reviewed article of this preprint also exists.

Abstract
The article presents the results of the technical-economical study regarding the optimization of the FDM parameters (Lh – the height of the layer deposited in one pass and Id – the filling percentage) for the manufacture of PETG and ASA parts. To carry out the technical-economical study, we used the fundamental principle of value analysis, which consists in maximizing the ratio between Vi/Cp, where Vi - represents the mechanical characteristic, and Cp - represents the production cost. The results of the study show that for the tensile specimens made of PETG, the parameter that significantly influences the results of the Vi/Cp ratios is Lh, and in the case of the compression specimens made of PETG, the parameter that significantly influences the results of the Vi/Cp ratios is Id. In the case of specimens manufactured by FDM from ASA, the parameter that decisively influences the results of the Vi/Cp ratios of the tensile and compression specimens is Id – the filling percentage. By performing optimization of the process parameters with multiple responses, we identified the optimal parameters for FDM manufacturing of parts from PETG and ASA: Lh = 0.20 mm and Id = 100%.
Keywords: 
Subject: 
Engineering  -   Mechanical Engineering

1. Introduction

Additive manufacturing consists of making components by successively adding material layer by layer, according to the instructions specified by the G-Code file, [1,2,3]. Additive manufacturing technologies have experienced continuous evolution since their inception, and due to their significant advantages over formative and subtractive technologies, these technologies are now widely used in many industrial sectors, [8,9,10,11,12,13,14,15,16,17,18,19,20]. The major advantages of additive manufacturing technologies are represented by the efficiency of the use of materials (the amount of technological residues is negligible), manufacturing of complex geometries without basing and fixing elements, low consumption of electricity, [21,22,23,24,25,26,27,28,29,30,31,32,33,34,35,36,37,38,39,40,41].
The additive manufacturing process represents a major innovation in the field of manufacturing, enabling the transformation of digital concepts into physical objects, [42,43,44,45,46,47,48,49,50]. This process encompasses several essential steps to ensure the transition from digital design to the final physical product:
- CAD conceptualization;
- saving the CAD model and converting it to STL format;
- generation of the G-Code file;
- equipment preparation, construction, extraction and use of parts.
In [4] innovative strategies are presented for the technical-economical optimization of the parameters of 3D printing by FDM, (Lh – the height of the deposited layer in one pass and Id – the filling percentage). To optimize the parameters, the value analysis method was used, which consists in maximizing the ratio between the use value (Vi) and the production cost (Cp). The use value is represented by the mechanical characteristics. The results of the study show that of the two parameters considered (Lh and Id), the height of the layer deposited at one pass decisively influences the bending resistance, and Id categorically influences the resistance to breaking and compression, but also the hardness. The optimal parameters for printing PLA by FDM are: Lh 0.15 mm and Id 100%, heat treated PLA: 0.20 mm and Id 100% and ABS: Lh 0.15 mm and Id 100%.
In [5] the authors present the study on the optimization of FDM parameters (Id – filling percentage; Lh – height of the deposited layer in one pass; Wn – number of walls; Et – extruder temperature; Ps – printing speed; Bt – platform temperature ; Nl – the number of lower and upper layers; Ip – the filling pattern) to minimize energy consumption, but without affecting the traction characteristics. The conclusions show that the parameters that categorically influence the energy consumption, but also the traction characteristics are: Id, Lh, Wn, Bt, and their optimal values ​​are: Id – 90%; Lh – 0.30 mm; Wn – 4; Bt – 60 °C.
In [6] a study is presented on the optimization of FDM parameters (Nd – extrusion nozzle diameter; Wn – number of walls; Et – extruder temperature; Id – filling percentage; Ip – filling pattern) to reduce the printing time, but without affecting the mechanical properties of the parts. The results of the study show that the parameters that decisively influence the printing time are: Nd, Id, Wn. Research suggests that a larger nozzle diameter (Nd = 0.60 mm), four outer shells (Wn = 4) and a 10% infill (Id = 10%) can reduce print time without compromising mechanical characteristics.
In [7], the impact of FDM parameters (Lh – height of the deposited layer in one pass; Et – extruder temperature; Ps – printing speed; Bt – platform temperature) on the compression behavior of the samples made of PLA filament and used in applications is investigated biomedical and clinical. The considered FDM parameters significantly influence the mechanical properties, and statistical simulations and SEM (scanning electron microscopy) analyzes can improve the mechanical properties. The conclusions of the study show that the highest value of the compressive strength (Cs) was obtained for the samples made with the parameters: Lh = 0.10 mm; Te = 205 °C, Bt = 60 and Ps = 50 mm/min. The ANOVA analysis certifies that the parameter that decisively influences the compressive strength (Cs) is the height of the layer deposited at one pass (Lh).
In [12] a study is presented on the influence of the filling pattern (Ip) on the compressive strength of parts manufactured by FDM from PLA. In this context, 28 samples were manufactured on the Anycubic 4 Max Pro 2.0 3D printer using 7 filling patterns (Grid, Tri-hexagon, Octet, Triangles, Cubic subdivision, Gyroid, Cross 3D). The dimensions of the specimens were measured before and after the compression test using a DeMeet 3D coordinate measuring machine. The results show a minimum printing accuracy of 98.98% and a maximum deformation value of 57.70% for the specimens with the Triangles fill pattern. The highest values ​​of compressive strengths were obtained for the specimens with the Triangles filling pattern. To establish the optimal option from a technical-economical point of view, the maximization of the ratio between the use value (Vi) and the production cost (Cp) was used, this ratio being one of the fundamental technical-economical principles of the value analysis. Cubic subdivision fill pattern is the most efficient method for FDM fabrication of PLA compression specimens using lattice structures.
Additive manufacturing technologies have significant potential to contribute to sustainability in various industries, with the main benefits being: waste reduction, optimizing the use of materials, reducing energy consumption, the use of sustainable materials, integration of the production and consumption model based on circularity, [23,24,25,26,27,28,29,30,31,32,33].
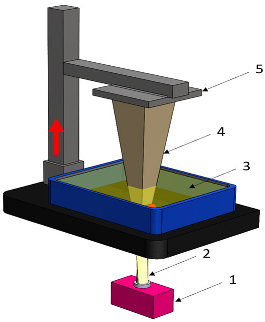
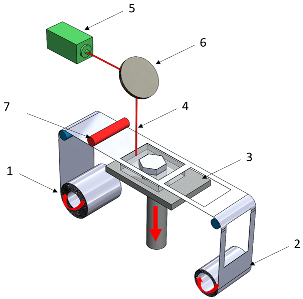
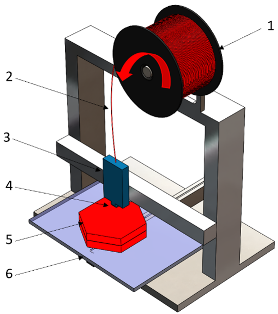
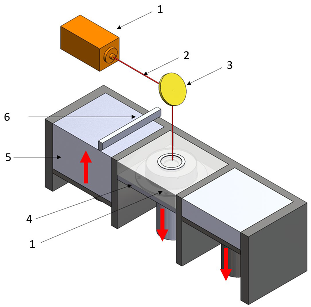
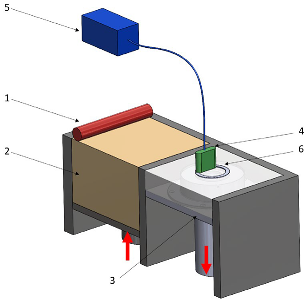
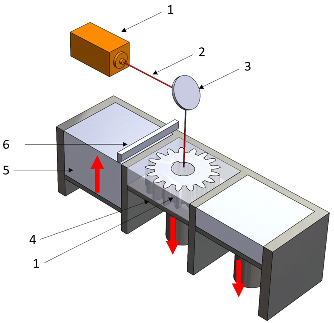
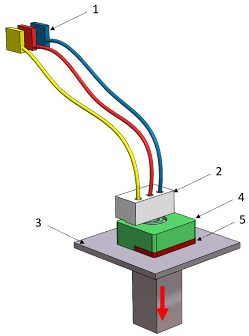
Table 1 details the main additive manufacturing technologies, including the components, operating principles, materials used, and advantages and disadvantages of each technology.
In the following we will focus on additive manufacturing technology through thermoplastic extrusion, this is one of the most widespread additive manufacturing technologies due to its ease of use, but also the low costs of equipment and materials, (see Table 1).
This paper presents a technical-economical study regarding the optimization of the FDM parameters (Lh – the height of the layer deposited in one pass and Id – the filling percentage) for the manufacture of tensile and compression specimens from PETG and ASA. The novelty of the study consists in the application of the fundamental principle of value analysis (AV), which aims to maximize the ratio between the use value (Vi) and the production cost (Cp). Thus we will establish the optimal FDM parameters for the manufacture of tensile and compression specimens from PETG and ASA.

2. Materials and Methods

The variable parameters of FDM used in the manufacture of tensile and compression specimens from PETG and ASA are: the height of the deposited layer in one pass, Lh = (0.10/0.15/0.20) mm and the filling percentage Id = (50/75/100) %. The mechanical properties of tensile and compression specimens were previously determined by the authors in works [43,44], respectively [41,42].
Using the parameters in Table 2, 54 tensile specimens (27 of PETG and 27 of ASA) according to the ASTM D638-14 standard and 90 compression specimens (45 of PETG and 45 of ASA) were manufactured on the Anycubic Pro Max 2.0 3D printer (Figure 1) according to ISO 604:2002. Tensile and compression specimens made from Everfil brand PETG and ASA filament on the Anycubic Pro Max 2.0 3D printer were tested on the Barrus White 20 kN universal testing machine.
Table 3 shows the technical specifications of the Everfil filament used in the manufacture of tensile and compression specimens from PETG and ASA.
Following the realization of the experimental determinations for the two types of mechanical tests (tension and compression), as well as the calculation of the production cost for each set of samples, the technical-economical study on the optimization of the FDM parameters was carried out. To establish the optimal variant, the fundamental principle of value analysis was used, presented in relation 1 and which consists in maximizing the ratio between the use value (Vi) and the production cost (Cp), [4,12,57,58,59,60].
V i C p m a x
Where, Vi represents the value in use (mechanical characteristic), and Cp represents the production cost expressed in monetary units.
Minitab 19 software was used to optimize the ratio between Vi and Cp. To calculate the production cost, the following relationships were used [4,12,57,58,59,60]:
C p = C m a t + C e n
C m a t = Q m a t × P m a t
C e n = P t × E c × P e n
Where, C p represent production cost (euro); C m a t – cost of material (euro); C e n – energy cost (euro); Q m a t – quantity of used material (g); P m a t   – material price (euro/g); P t – printing time (h); E c – energy consumption (kW); P e n – price of electrical energy (euro/ kWh).
The following constant values ​​were used to perform the economical calculations: P m = 0.22 Euro/g (for PETG); P m = 0.23 Euro/g (for ASA); P e n = 0.25 kW/h; E c = 0.23 kW/h, [37,38]. The material consumption and print time values ​​for each set of samples were generated by Cura Slicer.
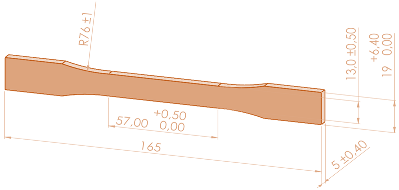
The dimensions and test conditions of the tensile and compression specimens are shown in Table 4.

3. Results and Discussion

3.1. Applications of Value Analysis for Analyzing the Mechanical Behavior of PETG and ASA 3D Printed Samples

3.1.1. Tensile Testing

Table 5 and Table 6 show the results obtained from the application of relations (2 - 4) and the determination of the production cost for the tensile specimens manufactured by FDM from PETG and ASA.
FDM parameters impact the mechanical behavior of parts made of PETG and ASA, but also the consumption of electricity [5]. The results of the Vi/Cp ratio are shown in Table 7 and Table 8.
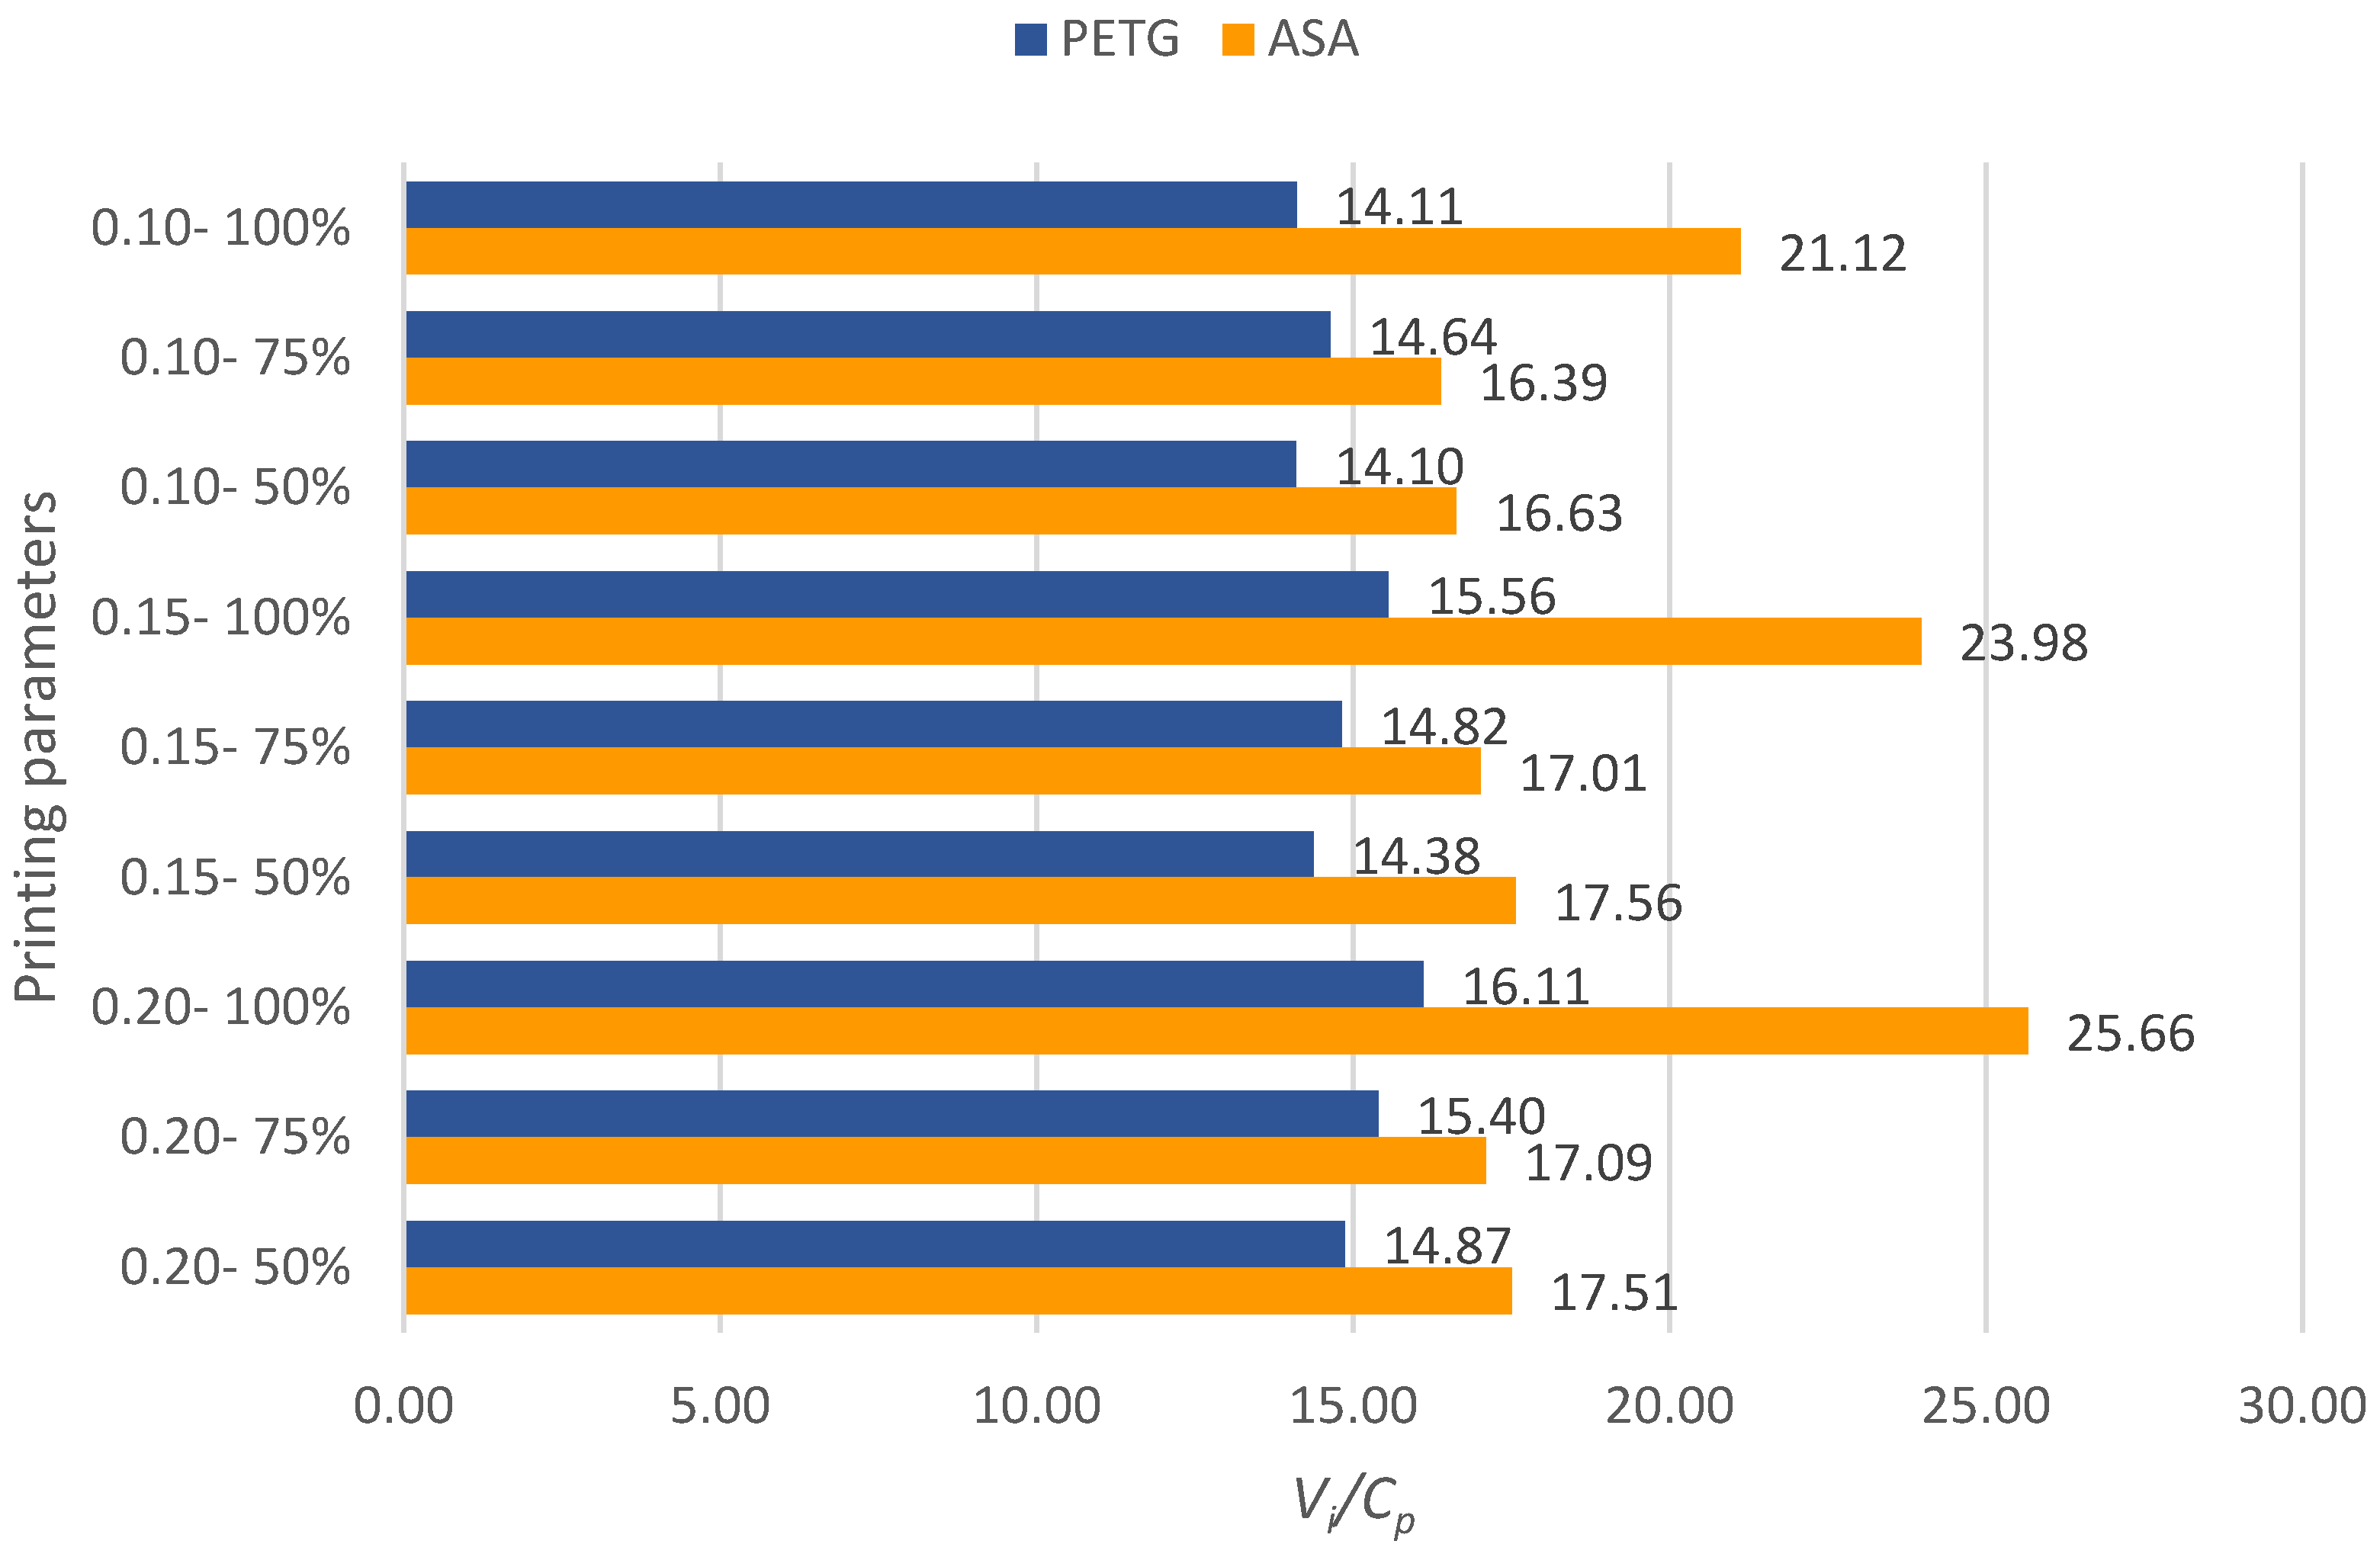
Figure 2 shows graphically the values ​​of the ratios between Vi (ultimate tensile strength) and Cp (production cost) of the samples manufactured by FDM from PETG and ASA.
Analyzing Figure 2 we notice that the highest value of the ratio between Vi (ultimate tensile strength) and Cp (production cost) was obtained for the set of specimens made of ASA with the layer height deposited at a pass Lh = 0.20 mm and the percentage of filling Id = 100%. In the case of specimens made of PETG, the highest value of the ratio between Vi and Cp was obtained for the set of specimens with the layer height deposited at a pass Lh = 0.20 mm and the filling percentage Id = 100%. Comparing the minimum and maximum results of the Vi/Cp ratios of the ASA samples with those obtained for the PETG samples, it is found that for the ASA samples the results are higher by (13.94 – 37.23) % compared to the results of the Vi/Cp ratios of the samples from PETG.
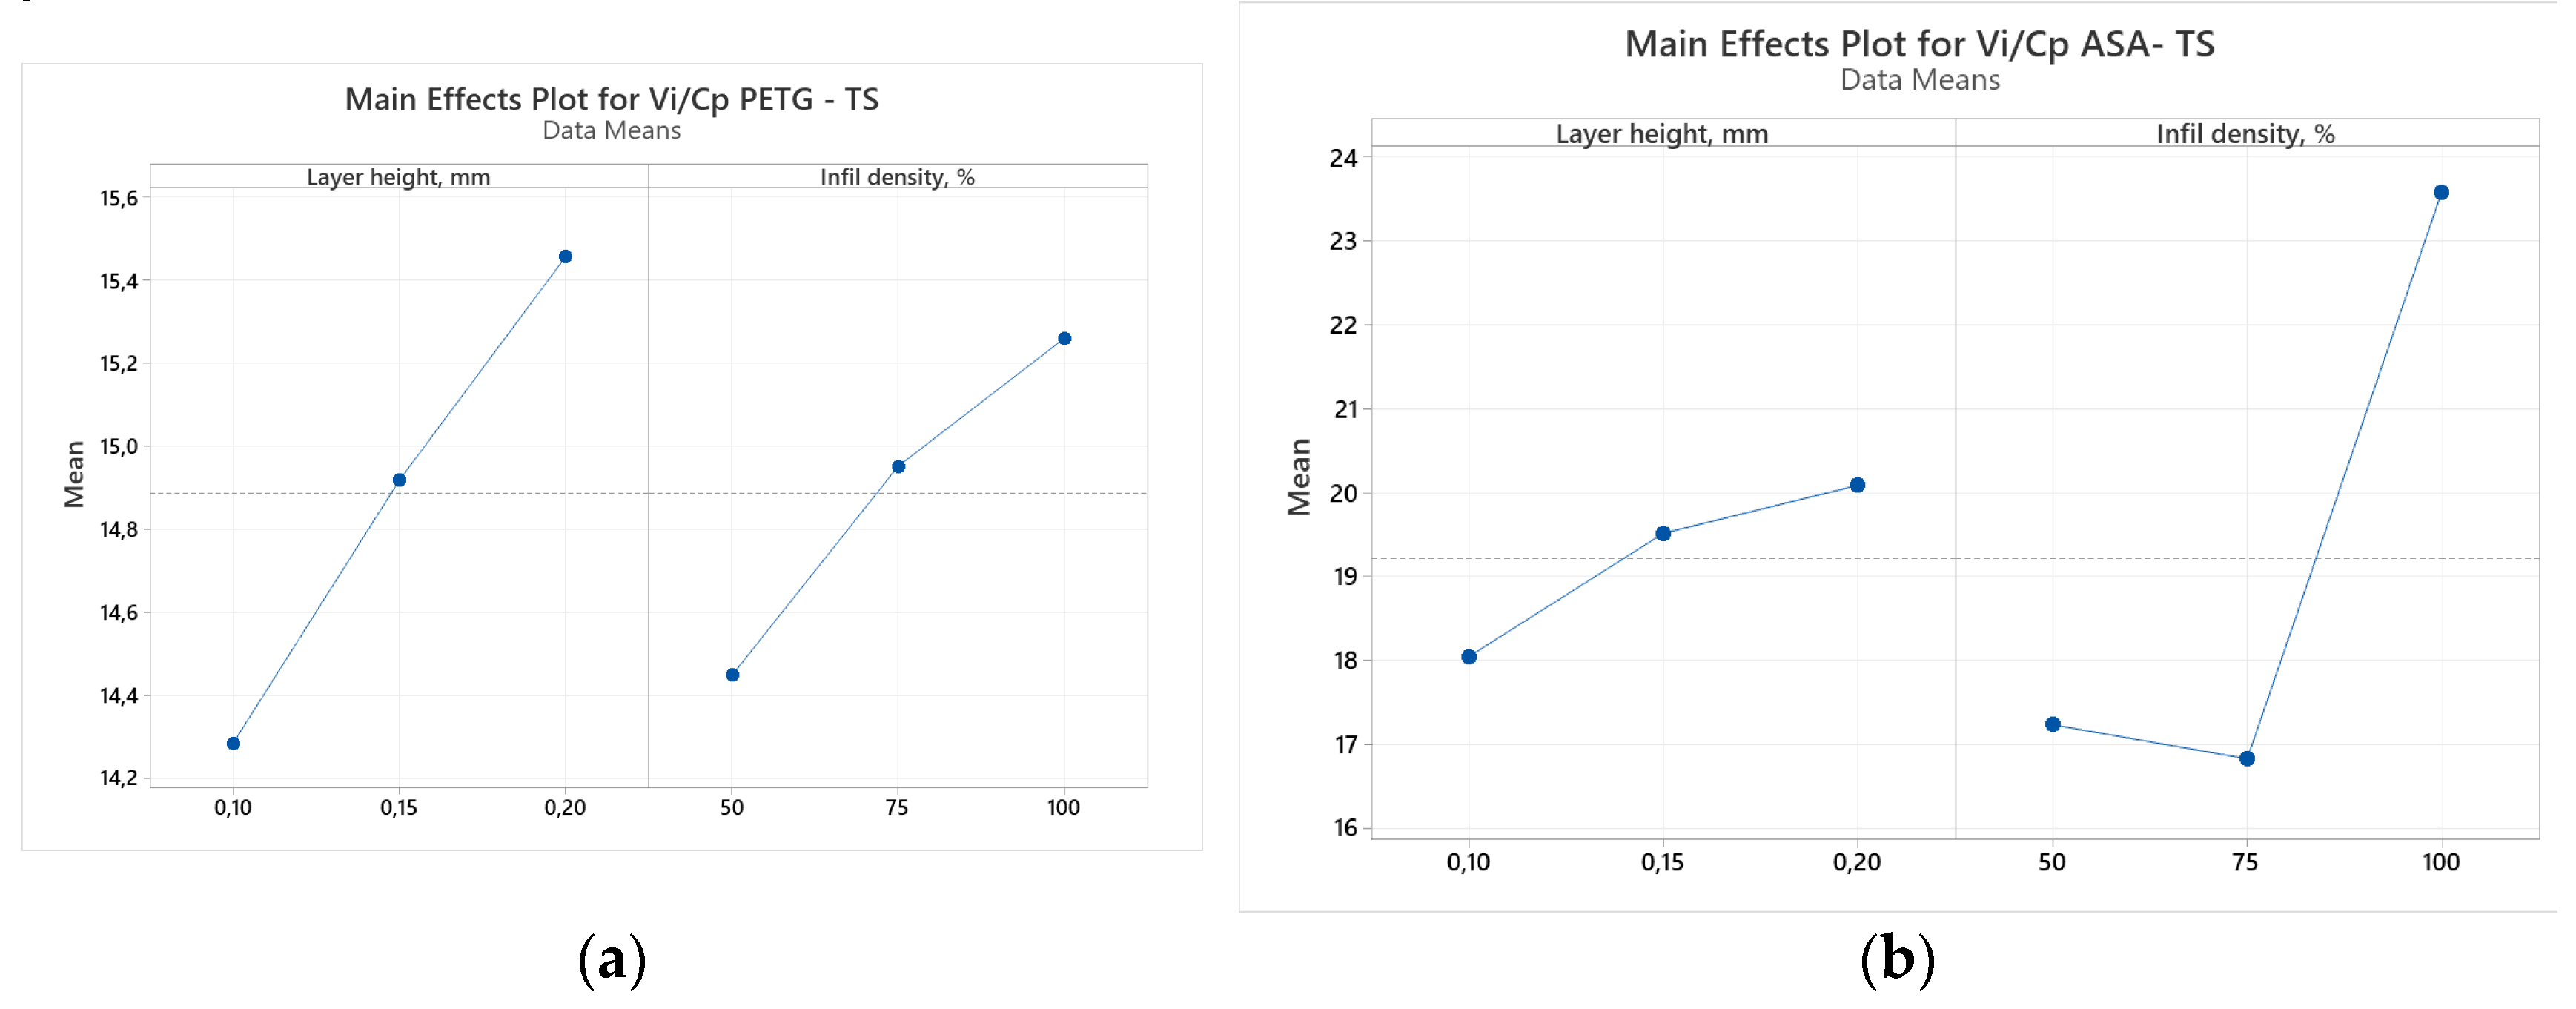
Using the Minitab 19 software, we performed the ANOVA analysis, through which we evaluated the relationship between the FDM parameters (Lh and Id) and the result of the ratio between Vi (ultimate tensile strength) and Cp (production cost), [36]. Figure 3 shows the result of the ANOVA analysis.
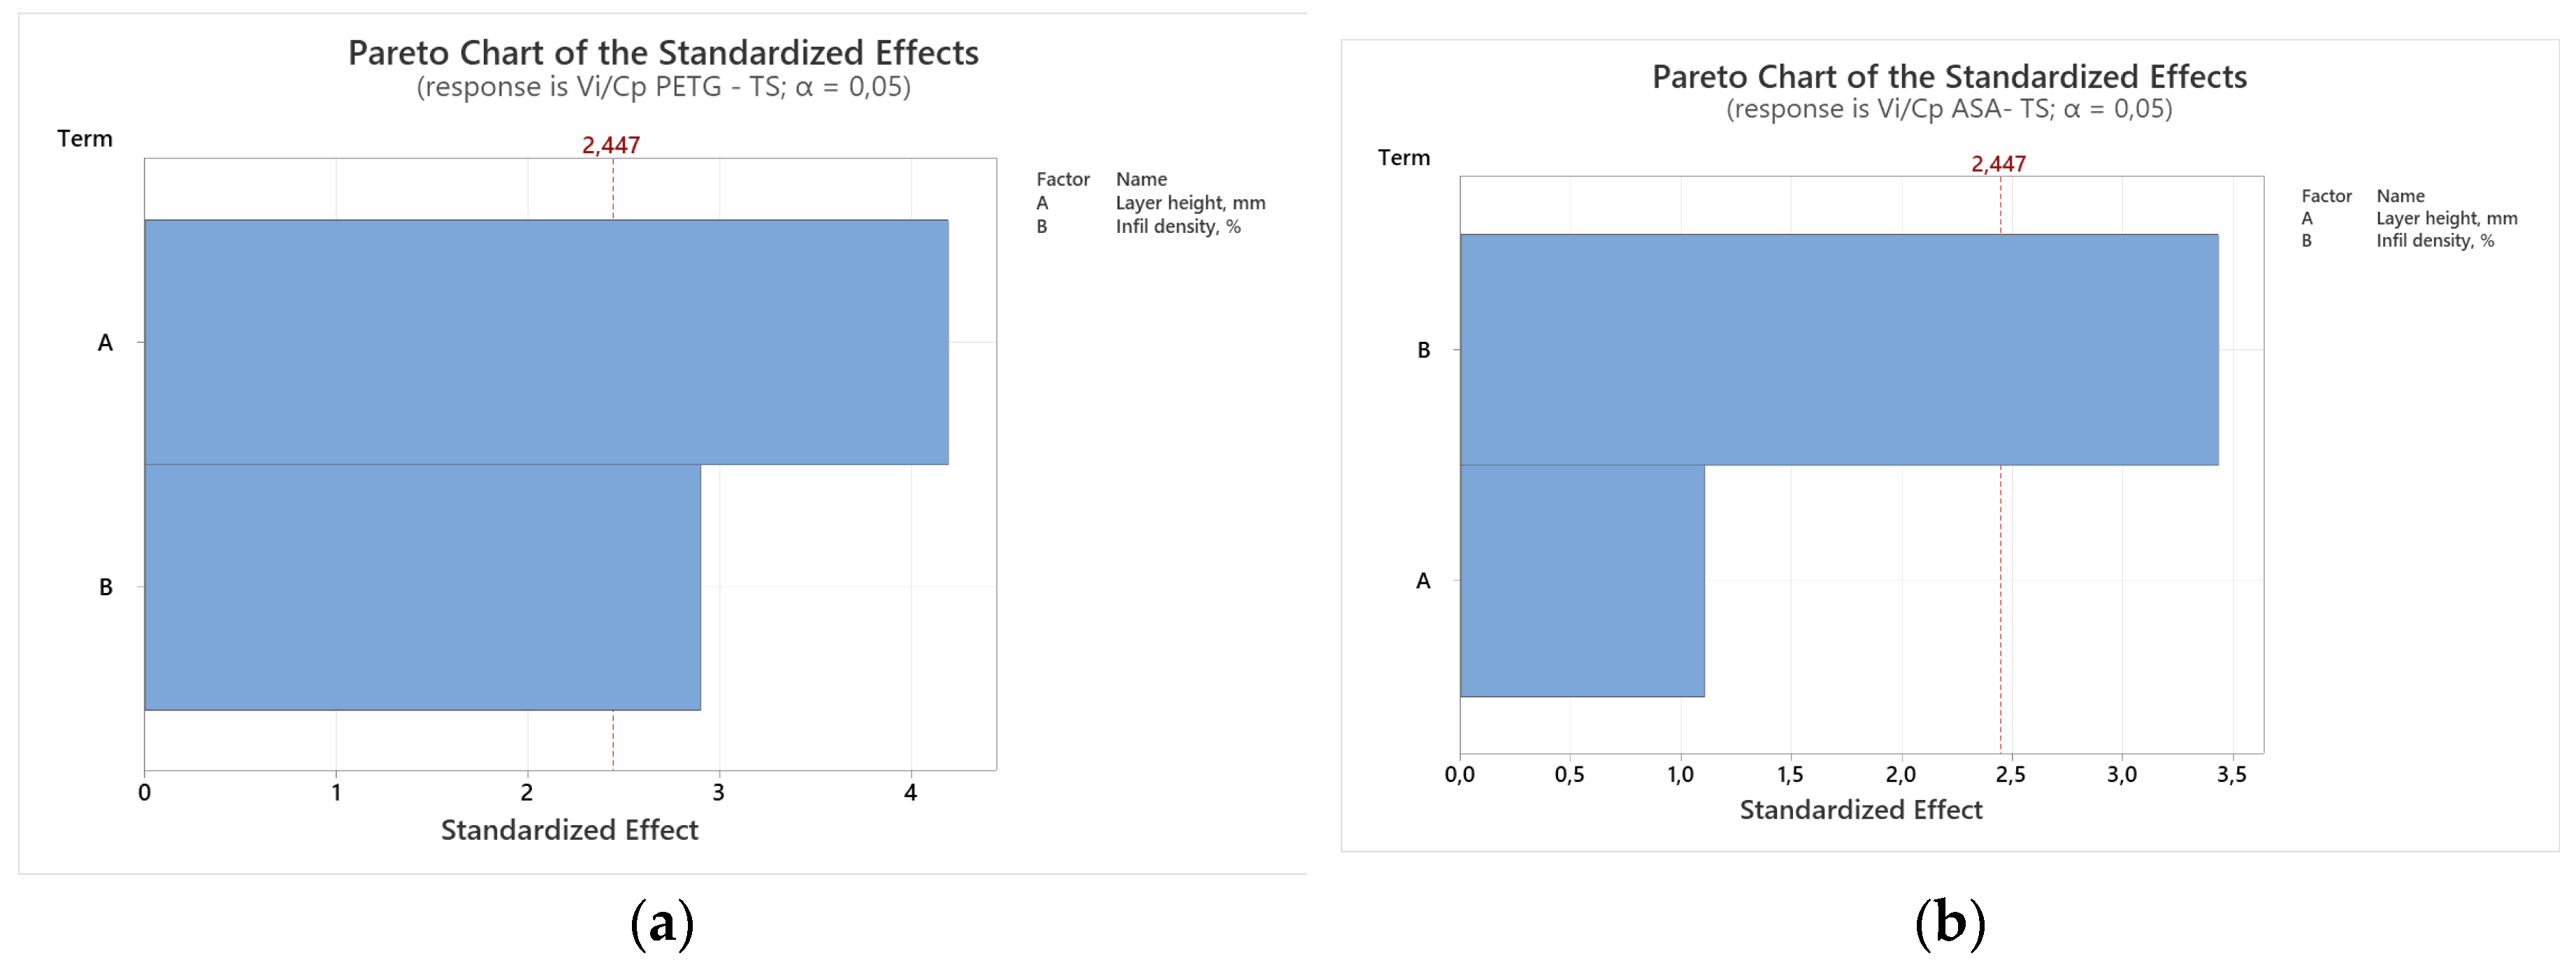
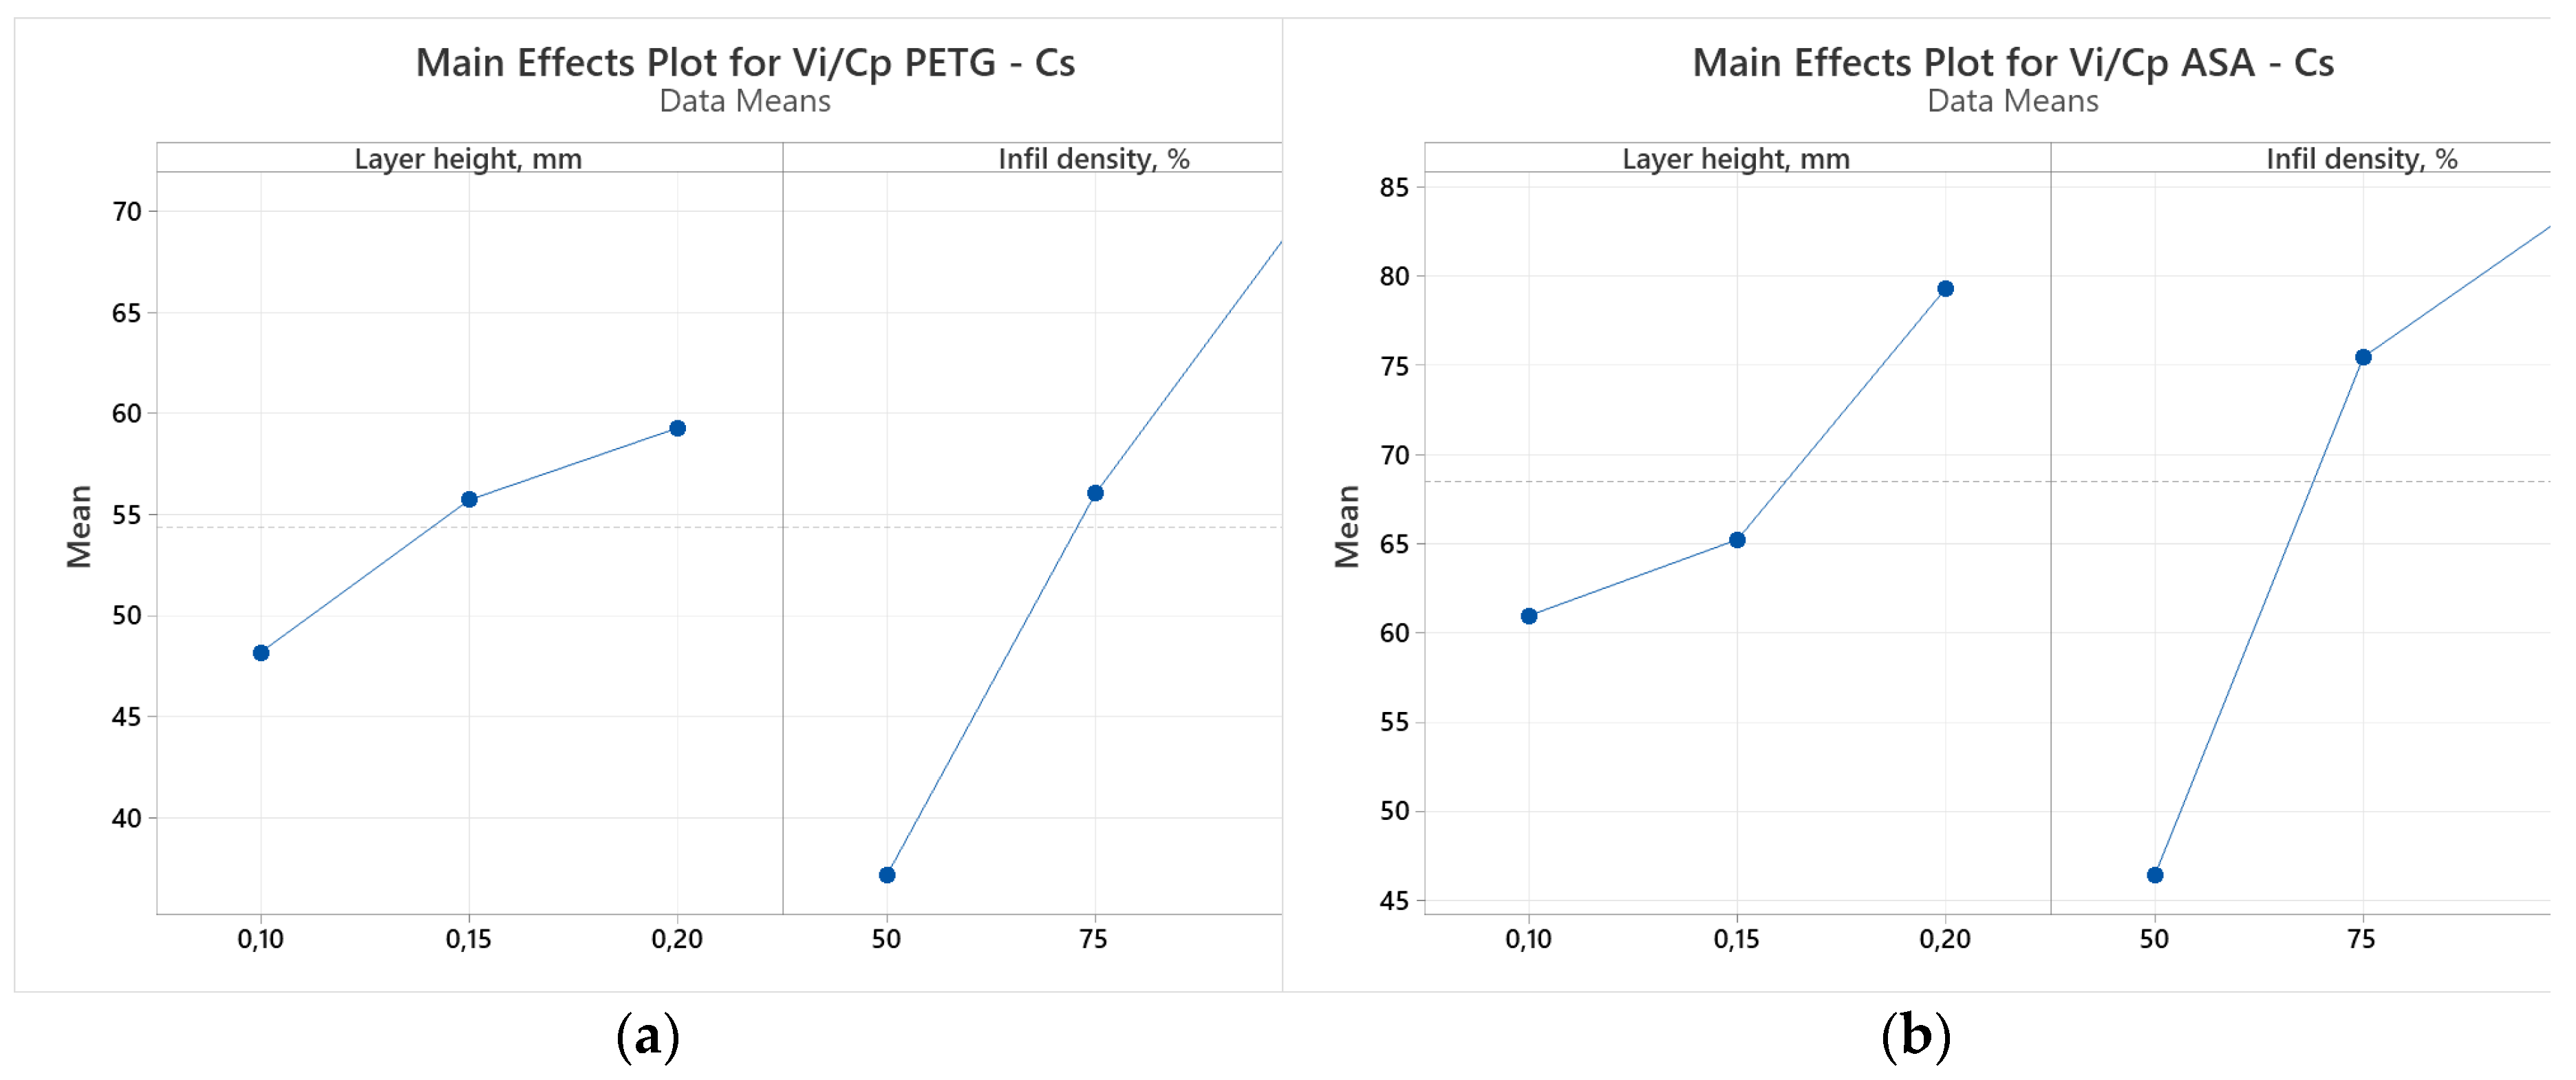
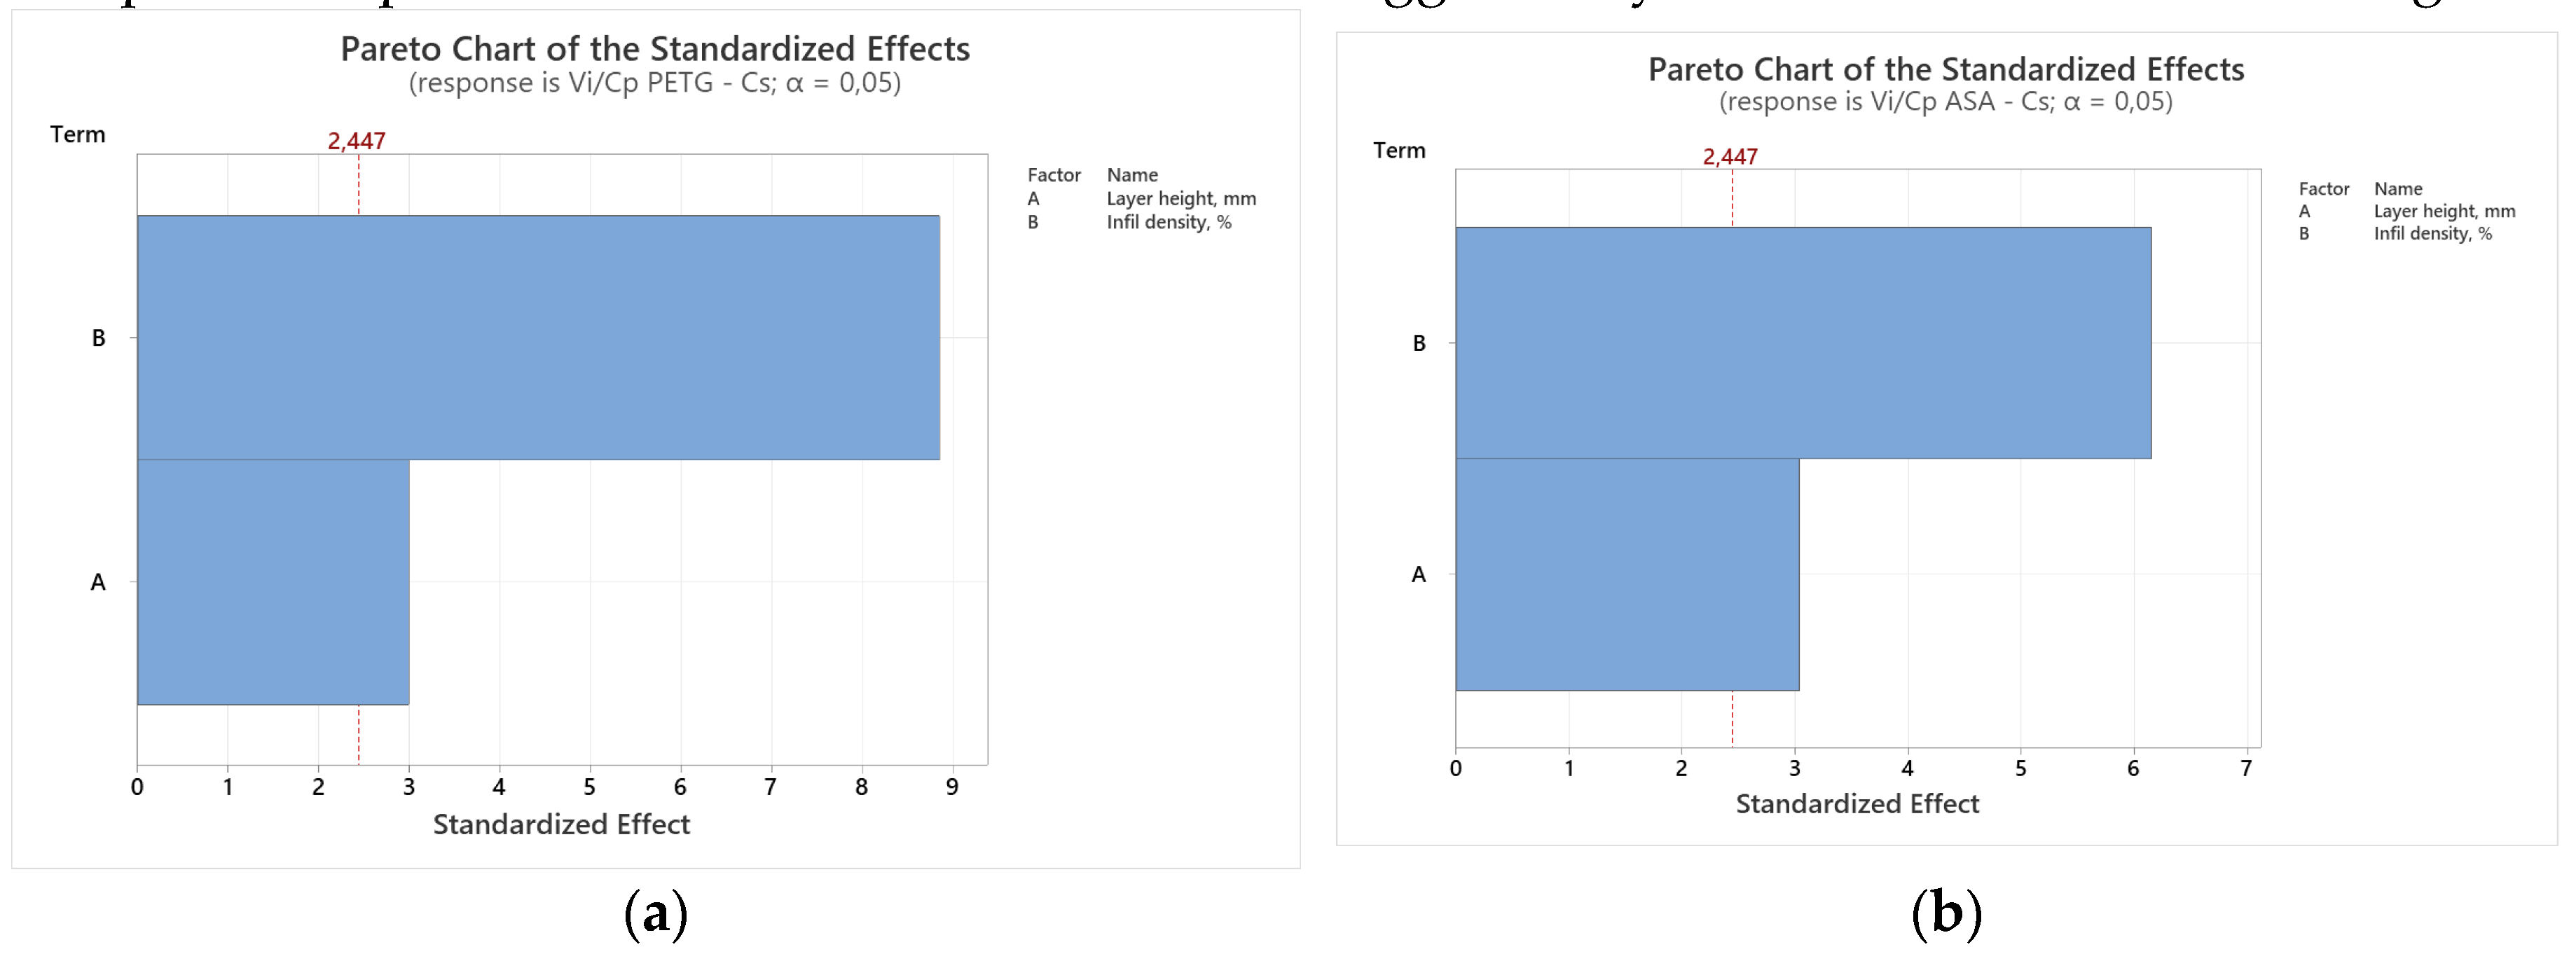
Analyzing Figure 3 we observe how the two considered parameters (Lh and Id) affect the result of the Vi/Cp ratio of the tensile specimens made of PETG (Figure 3a) and ASA (Figure 3b). According to Figure 3a, the layer height deposited in one pass (Lh) is the parameter that significantly influences the result of the Vi/Cp ratio of the tensile specimens made of PETG. Analyzing Figure 3b, we notice that the filling percentage (Id) is the parameter that decisively influences the result of the Vi/Cp ratio of the tensile specimens in ASA. The same conclusions are suggested by the Pareto charts shown in Figure 4.

3.1.1. Compressive Testing

Table 9 and Table 10 present the results obtained following the application of relations (2 - 4) and the determination of the production cost for the compression specimens manufactured by FDM from PETG and ASA.
Table 11 and Table 12 show the Vi/Cp results for the compression specimens manufactured by FDM from PETG and ASA.
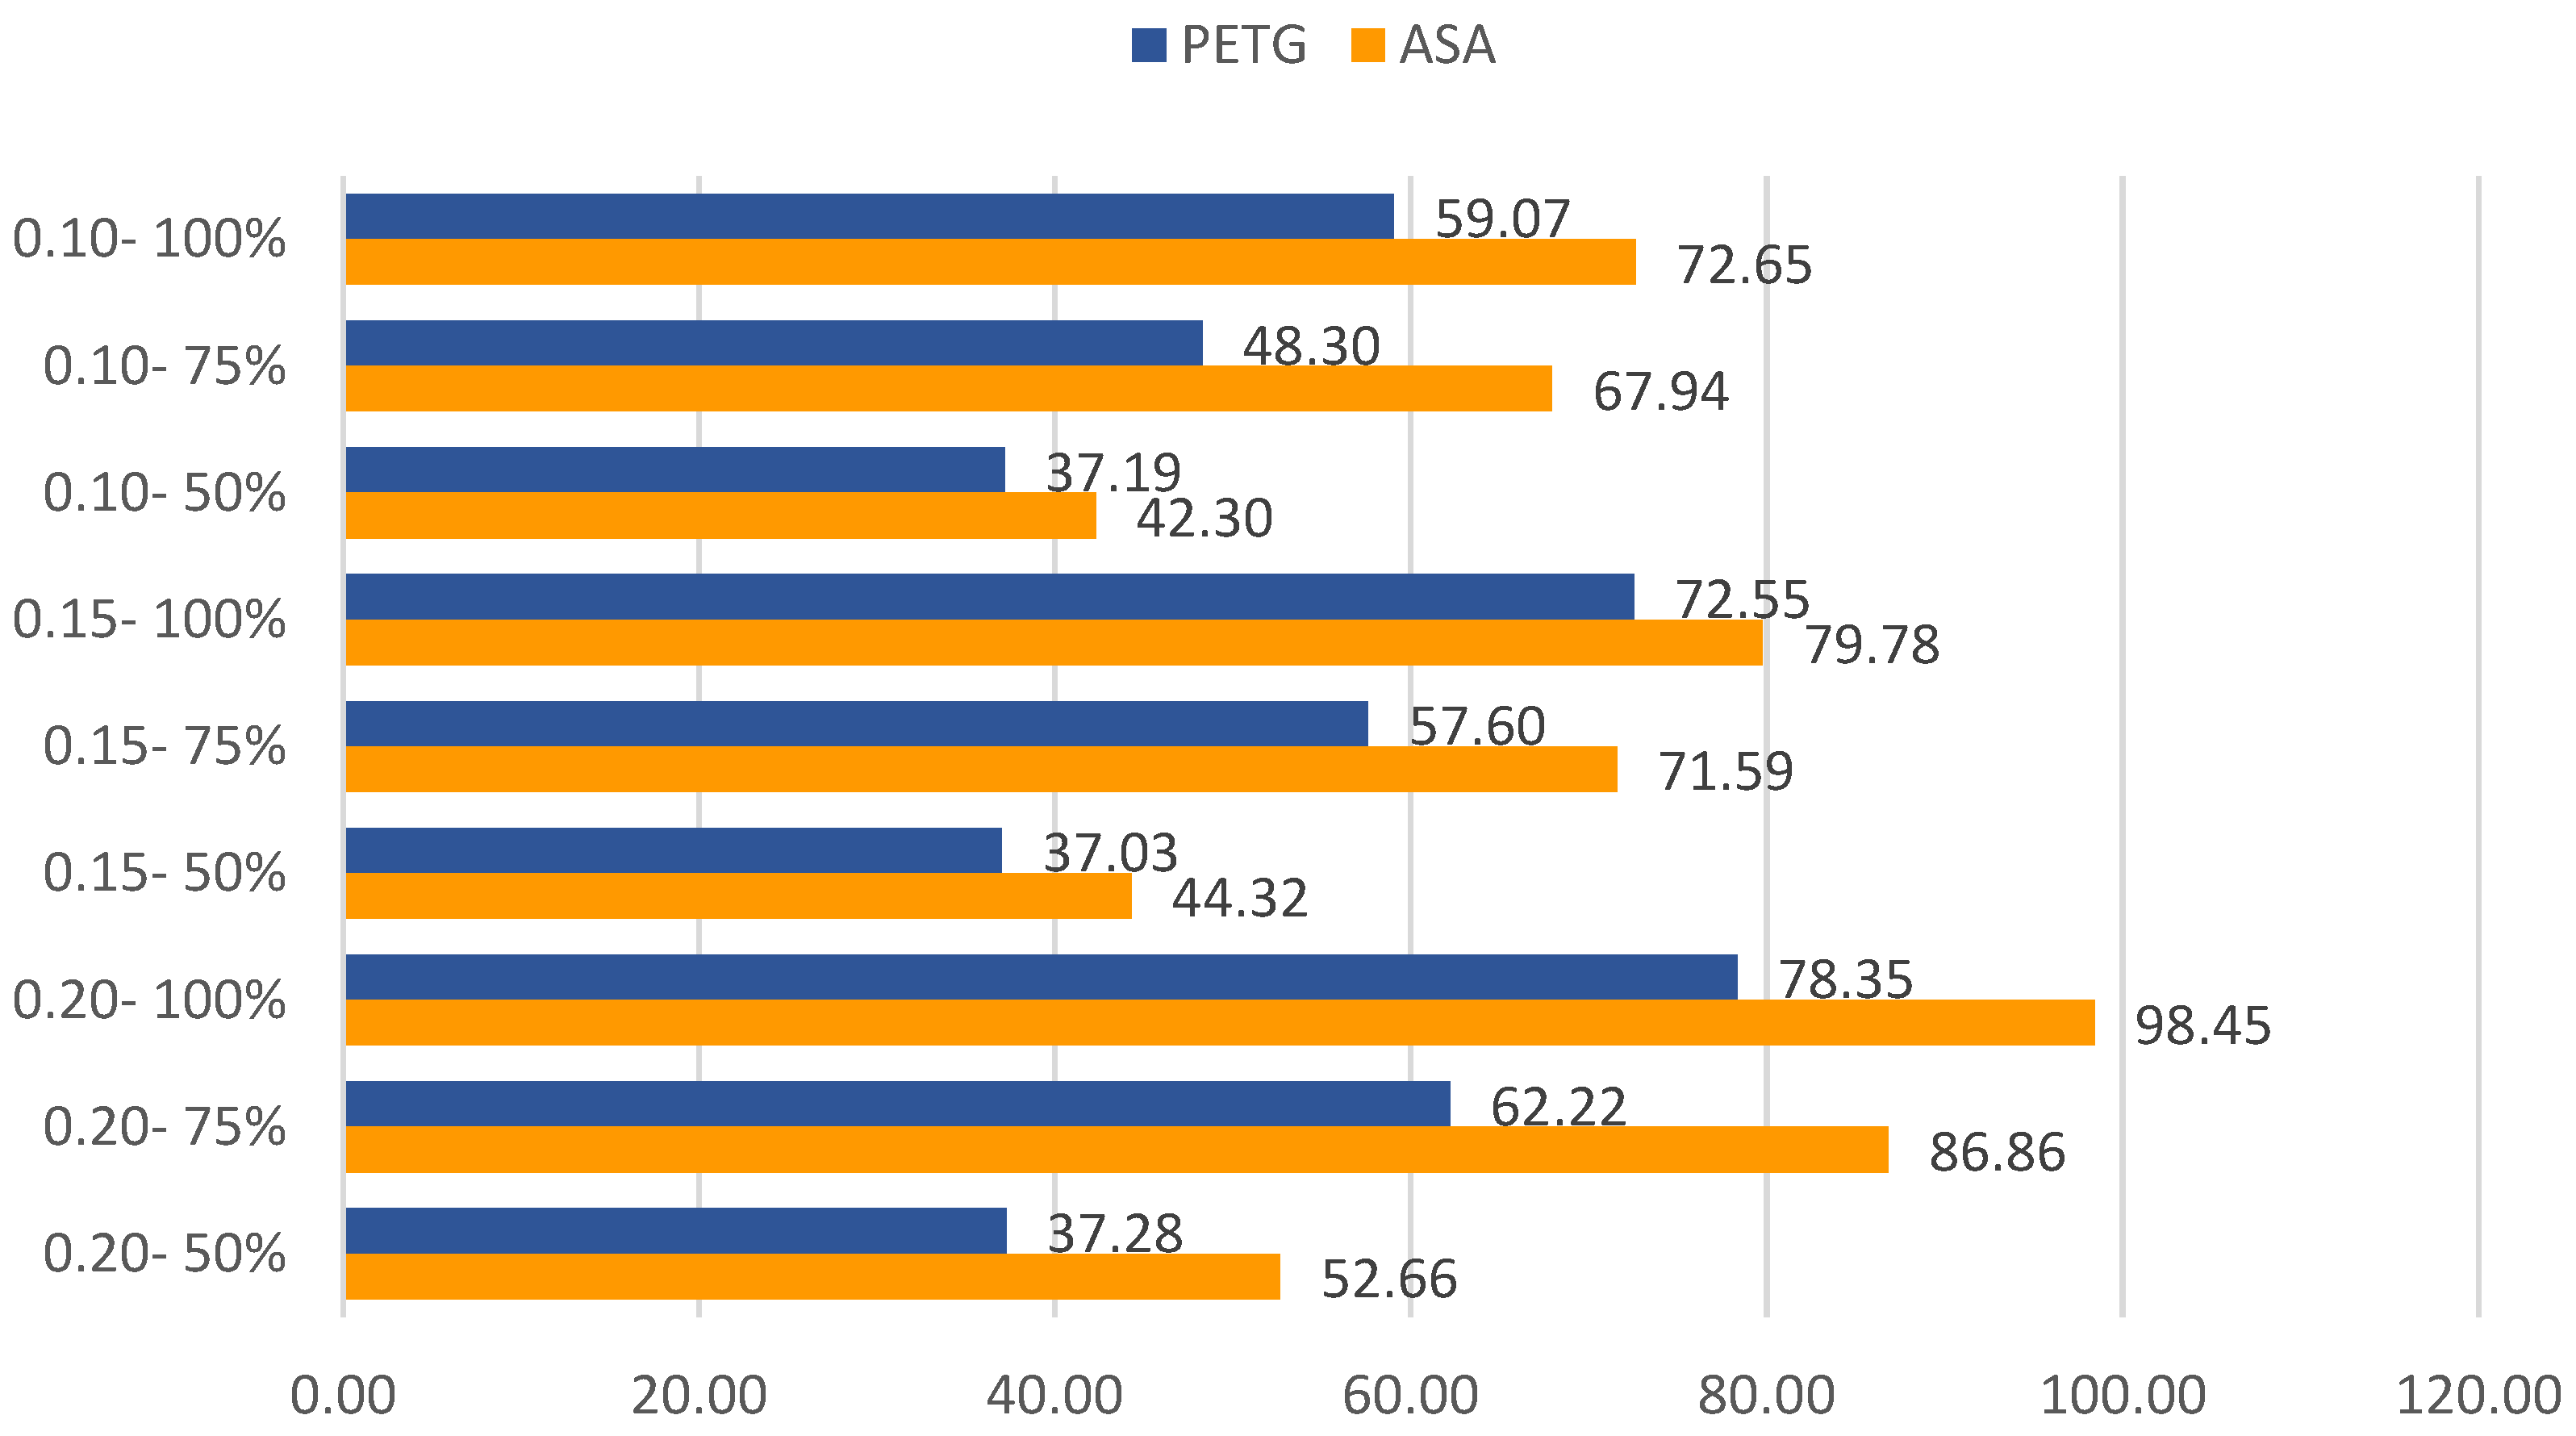
Figure 5 shows graphically the values ​​of the ratios between Vi (compressive strength) and Cp (cost of production) of the samples manufactured by FDM from PETG and ASA.
Analyzing Figure 5, we notice that the highest value of the ratio between Vi (compressive strength) and Cp (cost of production) was obtained for the set of samples made of ASA with the height of the layer deposited at a pass Lh = 0.20 mm and the filling percentage Id = 100%. In the case of specimens made of PETG, the highest value of the ratio between Vi and Cp was obtained for the set of specimens with the layer height deposited at a pass Lh = 0.20 mm and the filling percentage Id = 100%. Comparing the minimum and maximum results of the Vi/Cp ratios of the ASA samples with those obtained for the PETG samples, it is found that for the ASA samples the results are higher by (12.47 - 20.42) % compared to the results of the Vi/Cp ratios of the samples from PETG.
Figure 6 shows the result of the ANOVA analysis, where the relationship between the FDM parameters (Lh and Id) and the result of the ratio between Vi (compressive strength) and Cp (production cost) is studied.
Analyzing Figure 6, we observe how the two considered parameters of FDM (Lh and Id) affect the result of the Vi/Cp ratio of compression specimens made of PETG (Figure 6a) and ASA (Figure 6b). According to Figure 6a, the filling percentage (Id) is the parameter that significantly influences the Vi/Cp ratio result of compression specimens made of PETG. Analyzing Figure 3b, we notice that the filling percentage (Id) is the parameter that decisively influences the result of the Vi/Cp ratio of the ASA compression specimens. The same conclusions are suggested by the Pareto charts shown in Figure 7.

3.2. Optimization of FDM parameters based of Value Analysis for improve the 3D printing efficiency for samples made by PETG and ASA

Using Minitab 19, the FDM parameters presented in Table 2 and the results obtained by applying the fundamental principle of value analysis by maximizing the Vi/Cp ratio, we optimized the FDM parameters with the aim of achieving technical-economical efficiency.
To optimize the FDM parameters, we used the desirability method, where the goal was to maximize the values ​​of the ratios between Vi/Cp for each type of mechanical test (tension and compression) and each type of material (PETG and ASA). Table 13 presents optimization objectives for each studied material.
For the desirability study, we used the following relationships, [3]:
D = ( d 1 · d 2 ·   ·   d n ) 1 / n
d i = 0 ,   i f   y i   < L i d i = y i L i · r i T i L i ,   i f   L i y i   T i d i = 1 ,   i f   y i   > T i
Where, D – is the composite desirability; n – number of responses; d i   – represent the desirability for each individual response, y i ,   L i ,   T i – represent the predicted value, target value, and lowest value, respectively, of the analyzed response of response.
Table 14 shows the composite desirability for each printing parameters and each type of material.
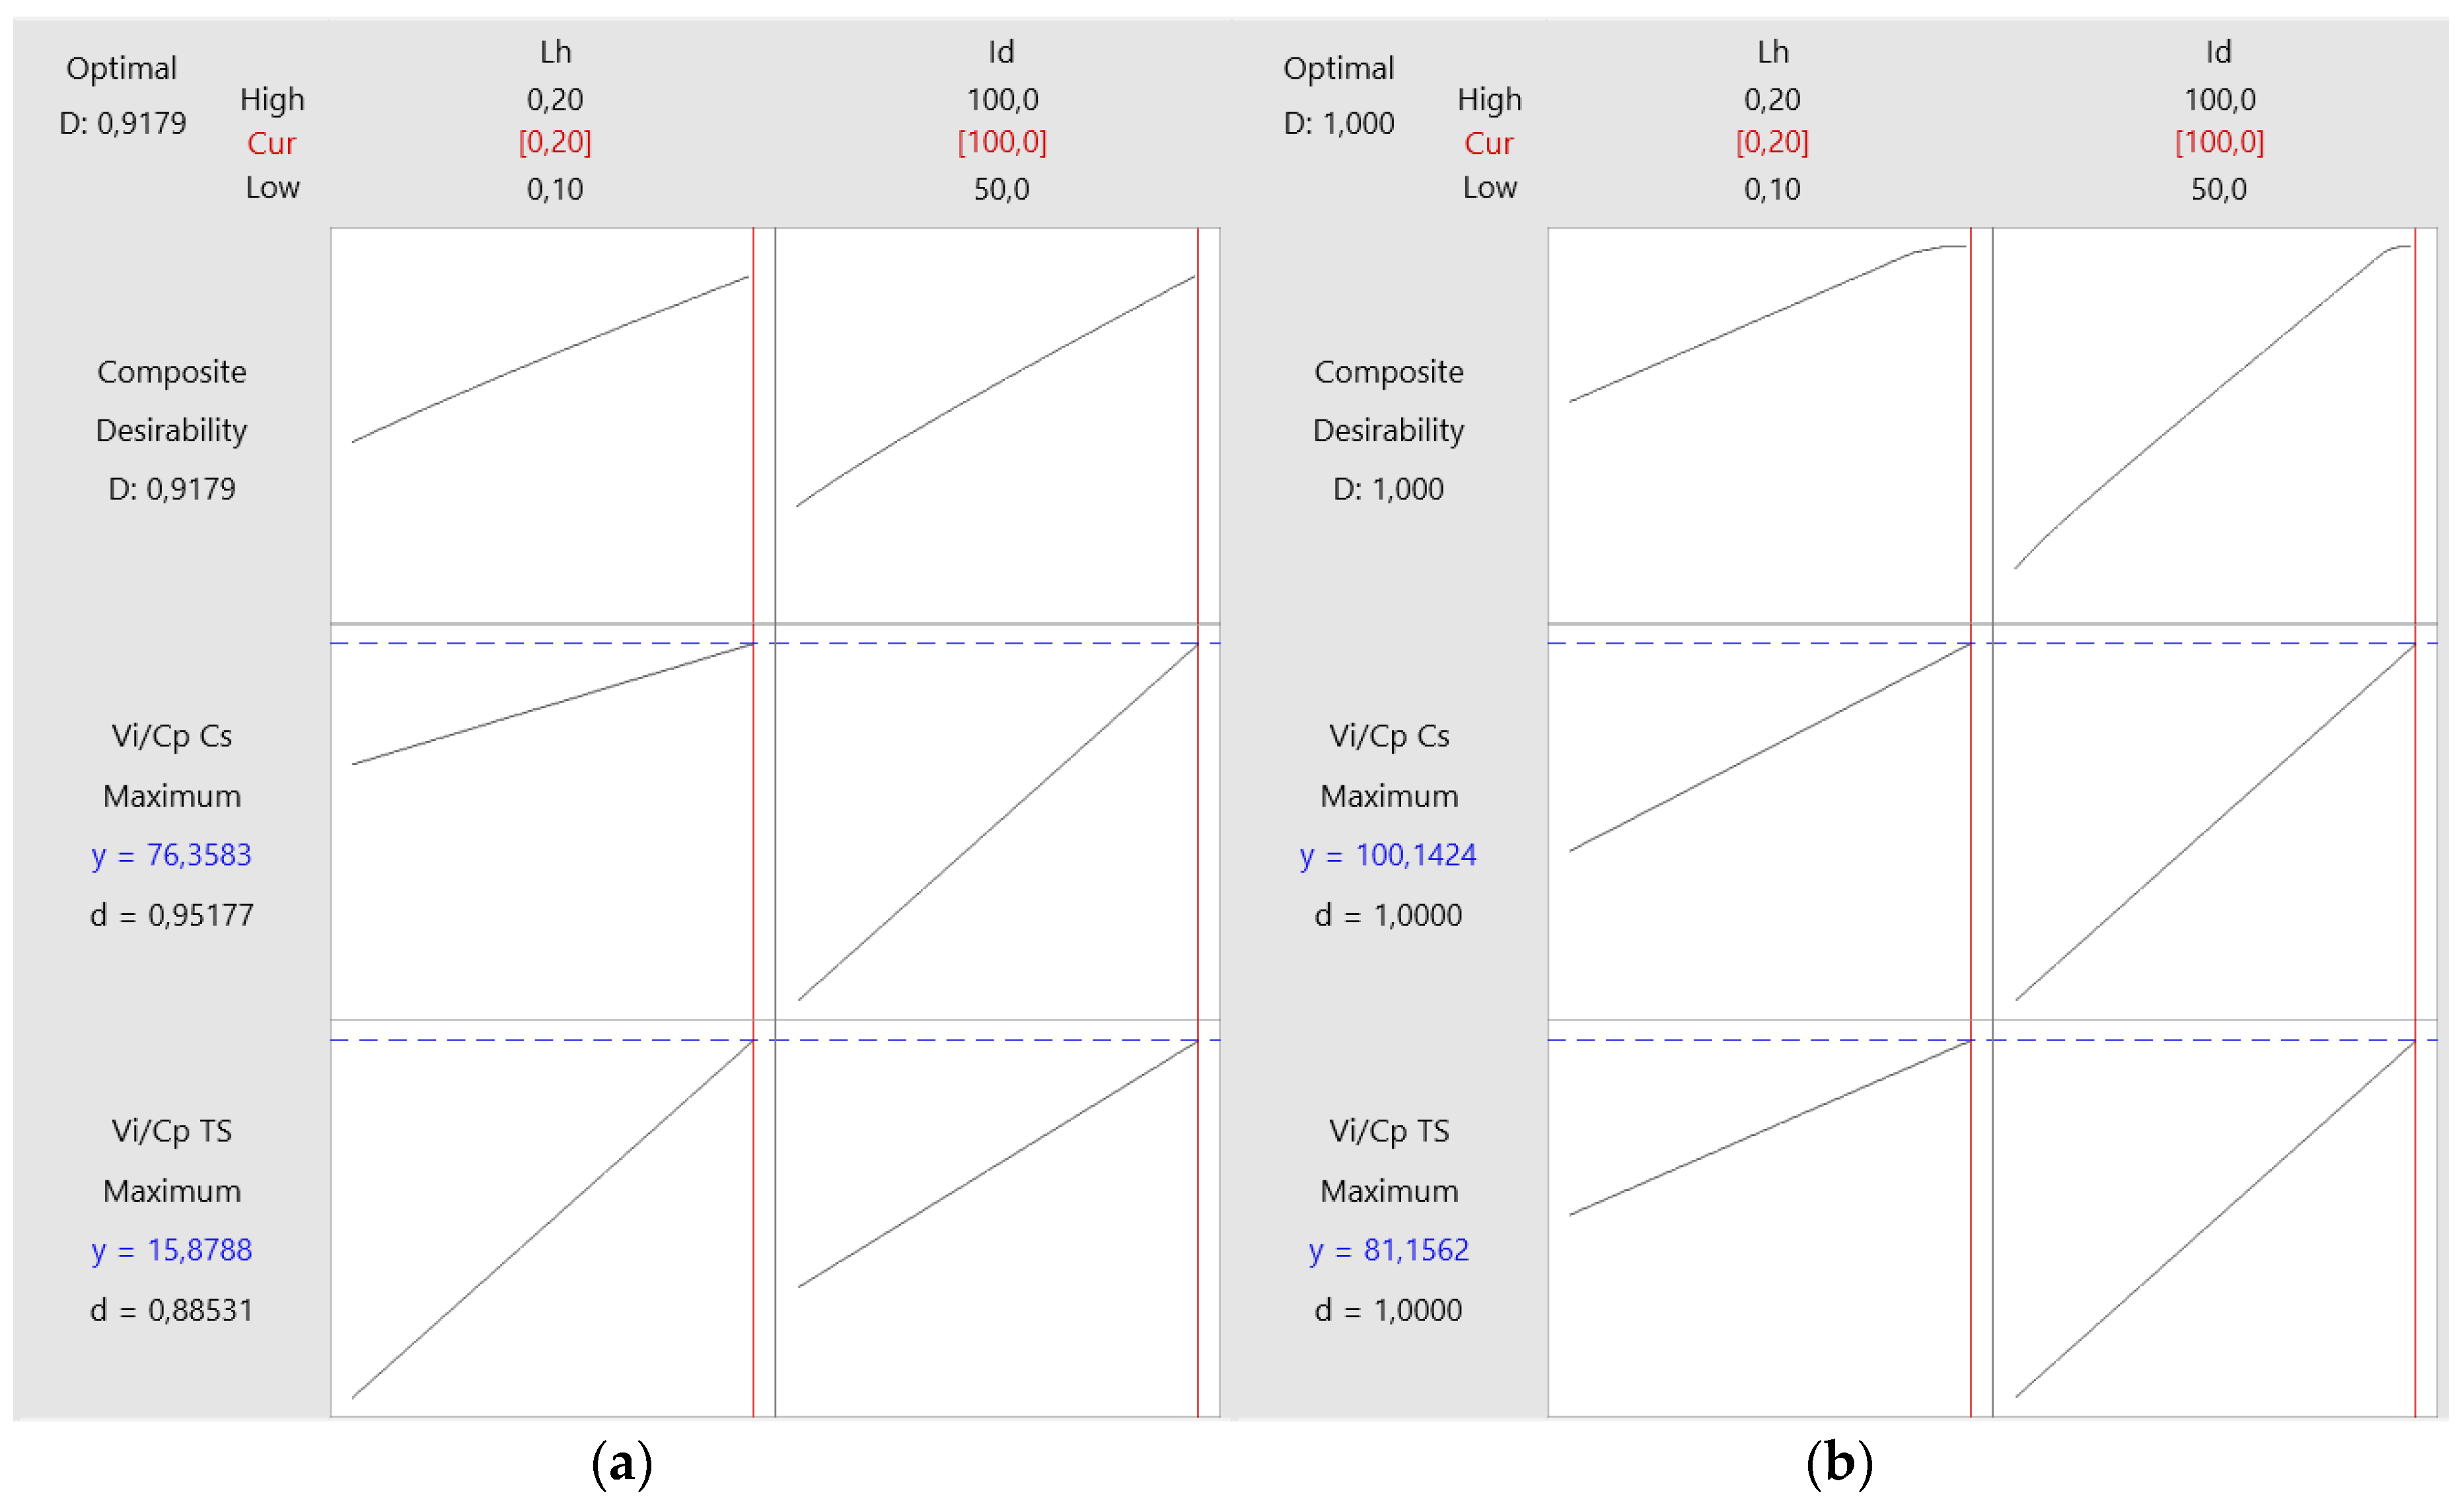
Figure 8 shows the plots of FDM parameter optimizations for the manufacture of PETG and ASA samples.
Analyzing Figure 8 we observe how each factor (column) influences the composite desirability response (row). The vertical solid red lines indicate the current setting of the factors, and the red numbers on each column indicate the current level of the factors. The blue horizontal dashed lines indicate the responses corresponding to the current factor settings, and the blue numbers indicate the response corresponding to the current factor settings.
According to Figure 8a, following the optimization process of the FDM parameters for PETG, the following optimal settings resulted: layer height (Lh) = 0.20 mm and infill density (Id) = 100%. Analyzing Figure 8b, we notice that following the optimization process of the FDM parameters for ASA, the following optimal settings resulted: layer height (Lh) = 0.20 mm and infill density (Id) = 100%. Increasing the layer height per pass (Lh) has a significant impact on print time, and this leads to lower power consumption, thus lower production costs. The decrease in the height of the layer deposited at a pass (Lh) has a direct impact on production costs, but also on maintenance costs, which increase considerably.

4. Conclusions

The paper presents the results of the technical-economical study regarding the optimization of FDM parameters for the manufacture of PETG and ASA parts. In this context, we have carried out a multi-objective optimization with the aim of finding the optimal FDM parameters (Lh - the height of the deposited layer in one pass and Id - the filling percentage) for the manufacture of PETG and ASA parts. Following the determination of the mechanical characteristics (tensile and compression) of the specimens manufactured by FDM from PETG and ASA, but also the determination of the production cost for each set of specimens, using the fundamental principle of value analysis by maximizing the Vi/Cp ratio, we achieved the technical-economical optimization of the FDM parameters.
The results of the ANOVA analysis show that the two FDM parameters considered (Lh - the height of the layer deposited in one pass and Id - the filling percentage) influence the results of the Vi/Cp ratios. For tensile specimens made of PETG, the parameter that significantly influences the results of the Vi/Cp ratios is Lh - the height of the layer deposited in one pass, and in the case of compression specimens made of PETG, the parameter that significantly influences the results of the Vi/Cp ratios is Id – the filling percentage.
In the case of specimens manufactured by FDM from ASA, the parameter that decisively influences the results of the Vi/Cp ratios of the tensile and compression specimens is Id – the filling percentage.
Using the results of the Vi/Cp ratios for the tensile and compression specimens made of PETG and ASA, we found the optimal FDM parameters: Lh = 0.20 mm and Id = 100%.
The results of the study have applicability for the efficient exploitation of the 3D printer for the manufacture of PETG and ASA parts by FDM.
We propose to extrapolate the study to other types of materials, but also to other types of mechanical tests.

Author Contributions

Conceptualization, D.G.Z., M.M. and D.V.I.; methodology, D.G.Z., M.M. and D.V.I.; validation, D.G.Z., M.M.; formal analysis, D.G.Z.; investigation, D.G.Z., M.M. and D.V.I.; resources, D.G.Z., M.M. and D.V.I.; writing—original draft preparation, D.V.I.; writing—review and editing, D.G.Z., M.M., D.V.I.; visualization D.G.Z., M.M. and D.V.I.; supervision, D.G.Z., M.M. All authors have read and agreed to the published version of the manuscript.

Funding

This research received no external funding.

Institutional Review Board Statement

Not applicable.

Informed Consent Statement

Not applicable.

Data Availability Statement

Data are contained within the article.

Conflicts of Interest

The authors declare no conflict of interest.

References

  1. Amaya-Rivas, J.L.; Perero, B.S.; Helguero, C.G.; Hurel, J.L.; Peralta, J.M.; Flores, F.A.; Alvarado, J.D. Future Trends of Additive Manufacturing in Medical Applications: An Overview. Heliyon 2024, 10, e26641. [Google Scholar] [CrossRef] [PubMed]
  2. Srivastava, M.; Rathee, S. Additive Manufacturing: Recent Trends, Applications and Future Outlooks. Progress in Additive Manufacturing 2021, 7. [Google Scholar] [CrossRef]
  3. D’Addona, D.; Raykar, S.; Singh, D.; Kramar, D. Multi Objective Optimization of Fused Deposition Modeling Process Parameters with Desirability Function. Procedia CIRP 2021, 99, 707–710. [Google Scholar] [CrossRef]
  4. Zisopol, D.; Tanase, M.; Portoaca, A. Innovative Strategies for Technical-Economical Optimization of FDM Production. Polymers 2023, 15, 3787. [Google Scholar] [CrossRef]
  5. Ramadan, S.; Altwarah, Q.; Abu-Shams, M.; Alkurdi, D. Optimizing Tensile Strength and Energy Consumption for FDM through Mixed-Integer Nonlinear Multi-Objective Optimization and Design of Experiments. Heliyon 2024, 10, e30164. [Google Scholar] [CrossRef] [PubMed]
  6. Le, L.; Rabsatt, M.A.; Eisazadeh, H.; Torabizadeh, M. Reducing Print Time While Minimizing Loss in Mechanical Properties in Consumer FDM Parts. International Journal of Lightweight Materials and Manufacture 2022, 5, 197–212. [Google Scholar] [CrossRef]
  7. Rahman, M.M.; Sultana, J.; Rayhan, S.; Ahmed, A. Optimization of FDM Manufacturing Parameters for the Compressive Behavior of Cubic Lattice Cores: An Experimental Approach by Taguchi Method. The International Journal of Advanced Manufacturing Technology 2023, 129, 1–15. [Google Scholar] [CrossRef]
  8. Kothandaraman, L.; Balasubramanian, N.K. Optimization of FDM Printing Parameters for Square Lattice Structures: Improving Mechanical Characteristics. Materials Today: Proceedings 2024. [CrossRef]
  9. Jaisingh Sheoran, A.; Kumar, H. Fused Deposition Modeling Process Parameters Optimization and Effect on Mechanical Properties and Part Quality: Review and Reflection on Present Research. Materials Today: Proceedings 2020, 21, 1659–1672. [Google Scholar] [CrossRef]
  10. Ghosh, M.; D’Souza, N.A. Improved Mechanical Performance in FDM Cellular Frame Structures through Partial Incorporation of Faces. Polymers 2024, 16, 1340. [Google Scholar] [CrossRef] [PubMed]
  11. Ben hadj Hassine, S.; Chatti, S.; Louhichi, B.; Seibi, A. Experimental Study of the Tensile Behavior of Structures Obtained by FDM 3D Printing Process. Polymers 2024, 16, 1562. [Google Scholar] [CrossRef] [PubMed]
  12. Zisopol, D.G.; Minescu, M.; Iacob, D.V. A Study on the Evaluation of the Compression Behavior of PLA Lattice Structures Manufactured by FDM. Engineering, Technology & Applied Science Research 2023, 13, 11801–11806. [Google Scholar] [CrossRef]
  13. Tagliaferri, V.; Trovalusci, F.; Guarino, S.; Venettacci, S. Environmental and Economic Analysis of FDM, SLS and MJF Additive Manufacturing Technologies. Materials (Basel, Switzerland) 2019, 12. [CrossRef]
  14. Ponticelli, G.S.; Venettacci, S.; Tagliaferri, F.; Guarino, S. Fused Deposition Modelling for Aeronautics: Techno-Economic and Environmental Assessment for Overhead Locker Supports Replacement. The International Journal of Advanced Manufacturing Technology 2023, 128. [Google Scholar] [CrossRef]
  15. Amithesh, S.; Shanmugasundaram, B.; Kamath, S.; Adhithyan, S.; Murugan, R. Analysis of Dimensional Quality in FDM Printed Nylon 6 Parts. Progress in Additive Manufacturing 2023, 9. [Google Scholar] [CrossRef]
  16. Ciornei, M.; Iacobici, R.; Savu, I.; Dalia, S. FDM 3D Printing Process - Risks and Environmental Aspects. Key Engineering Materials 2021, 890, 152–156. [Google Scholar] [CrossRef]
  17. Zhai, C.; Wang, J.; (Paul) Tu, Y.; Chang, G.; Ren, X.; Ding, C. Robust Optimization of 3D Printing Process Parameters Considering Process Stability and Production Efficiency. Additive Manufacturing 2023, 71, 103588. [Google Scholar] [CrossRef]
  18. Wei, H.; Tang, L.; Qin, H.; Wang, H.; Chen, C.; Li, Y.; Wang, C. Optimizing FDM 3D Printing Parameters for Improved Tensile Strength Using the Takagi–Sugeno Fuzzy Neural Network. Materials Today Communications 2024, 38, 108268. [Google Scholar] [CrossRef]
  19. Fountas, N.A.; Zaoutsos, S.; Chaidas, D.; Kechagias, J.D.; Vaxevanidis, N.M. Statistical Modelling and Optimization of Mechanical Properties for PLA and PLA/Wood FDM Materials. Materials Today: Proceedings 2023, 93, 824–830. [Google Scholar] [CrossRef]
  20. Ermergen, T.; Taylan, F. Investigation of DOE Model Analyses for Open Atmosphere Laser Polishing of Additively Manufactured Ti-6Al-4V Samples by Using ANOVA. Optics & Laser Technology 2024, 168, 109832. [Google Scholar] [CrossRef]
  21. Pratap Singh, D.; Kumar Dwivedi, V.; Agarwal, M. “Application of the DoE Approach to the Fabrication of Cast Al2O3-LM6 Composite Material and Evaluation of Its Mechanical and Microstructural Properties.” Materials Today: Proceedings 2023. [CrossRef]
  22. Singh, B.J.; Kalra, G. Mixture DoE: A Strategic Approach for Multi-Response Optimization of AA1100 Metal-Matrix Hybrid Composites. Materials Today: Proceedings 2022, 50, 1480–1495. [Google Scholar] [CrossRef]
  23. Nyabadza, A.; Mc Donough, L.M.; Manikandan, A.; Ray, A.B.; Plouze, A.; Muilwijk, C.; Freeland, B.; Vazquez, M.; Brabazon, D. Mechanical and Antibacterial Properties of FDM Additively Manufactured PLA Parts. Results in Engineering 2024, 21, 101744. [Google Scholar] [CrossRef]
  24. Fountas, N.A.; Papantoniou, I.; Kechagias, J.D.; Manolakos, D.E.; Vaxevanidis, N.M. Modeling and Optimization of Flexural Properties of FDM-Processed PET-G Specimens Using RSM and GWO Algorithm. Engineering Failure Analysis 2022, 138, 106340. [Google Scholar] [CrossRef]
  25. Sandhu, G.S.; Sandhu, K.S.; Boparai, K.S. Effect of Extrudate Geometry on Surface Finish of FDM Printed ABS Parts. Materials Today: Proceedings 2024. [CrossRef]
  26. Pratheesh Kumar, M.R.; Saravanakumar, K.; Arun Kumar, C.; Saravanakumar, R.; Abimanyu, B. Experimental Investigation of the Process Parameters and Print Orientation on the Dimensional Accuracy of Fused Deposition Modelling (FDM) Processed Carbon Fiber Reinforced ABS Polymer Parts. Materials Today: Proceedings 2024, 98, 166–173. [Google Scholar] [CrossRef]
  27. Camposeco-Negrete, C. Optimization of FDM Parameters for Improving Part Quality, Productivity and Sustainability of the Process Using Taguchi Methodology and Desirability Approach. Progress in Additive Manufacturing 2020, 5. [Google Scholar] [CrossRef]
  28. Jatti, V.; Sapre, M.; Jatti, A.; Khedkar, N.; Jatti, V. Mechanical Properties of 3D-Printed Components Using Fused Deposition Modeling: Optimization Using the Desirability Approach and Machine Learning Regressor. Applied System Innovation 2022, 5, 112. [Google Scholar] [CrossRef]
  29. Rivera-López, F.; Pavón, M.M.L.; Correa, E.C.; Molina, M.H. Effects of Nozzle Temperature on Mechanical Properties of Polylactic Acid Specimens Fabricated by Fused Deposition Modeling. Polymers 2024, 16, 1867. [Google Scholar] [CrossRef] [PubMed]
  30. Almuflih, A.S.; Abas, M.; Khan, I.; Noor, S. Parametric Optimization of FDM Process for PA12-CF Parts Using Integrated Response Surface Methodology, Grey Relational Analysis, and Grey Wolf Optimization. Polymers 2024, 16, 1508. [Google Scholar] [CrossRef] [PubMed]
  31. Van, C.N.; Hoang, A.L.; Long, C.D.; Hoang, D.N. Surface Roughness in Metal Material Extrusion 3D Printing: The Influence of Printing Orientation and the Development of a Predictive Model. Engineering, Technology & Applied Science Research 2023, 13, 11672–11676. [Google Scholar] [CrossRef]
  32. Belarbi, B.; Ghernaout, M.E.A.; Benabdallah, T. Implementation of a New Geometrical Qualification (DQ) Method for an Open Access Fused Filament Fabrication 3D Printer. Engineering, Technology & Applied Science Research 2019, 9, 4182–4187. [Google Scholar] [CrossRef]
  33. Park, H.S.; Tran, N.H.; Hoang, V.T.; Bui, V.H. Development of a Prediction System for 3D Printed Part Deformation. Engineering, Technology & Applied Science Research 2022, 12, 9450–9457. [Google Scholar] [CrossRef]
  34. Subramonian, S.; Kadirgama, K.; Al-Obaidi, A.S.M.; Salleh, M.S.M.; Vatesh, U.K.; Pujari, S.; Rao, D.; Ramasamy, D. Artificial Neural Network Performance Modeling and Evaluation of Additive Manufacturing 3D Printed Parts. Engineering, Technology & Applied Science Research 2023, 13, 11677–11684. [Google Scholar] [CrossRef]
  35. Anh, N.T.; Quynh, N.X.; Tung, T.T. Study on Topology Optimization Design for Additive Manufacturing. Engineering, Technology & Applied Science Research 2024, 14, 14437–14441. [Google Scholar] [CrossRef]
  36. Ziółkowski, M.; Dyl, T. Possible Applications of Additive Manufacturing Technologies in Shipbuilding: A Review. Machines 2020, 8, 84. [Google Scholar] [CrossRef]
  37. Srivastava, M.; Rathee, S. Additive Manufacturing: Recent Trends, Applications and Future Outlooks. Progress in Additive Manufacturing 2021, 7. [Google Scholar] [CrossRef]
  38. Kanishka, K.; Acherjee, B. Revolutionizing Manufacturing: A Comprehensive Overview of Additive Manufacturing Processes, Materials, Developments, and Challenges. Journal of Manufacturing Processes 2023, 107, 574–619. [Google Scholar] [CrossRef]
  39. Attaran, M. The Rise of 3-D Printing: The Advantages of Additive Manufacturing over Traditional Manufacturing. Business Horizons 2017, 60, 677–688. [Google Scholar] [CrossRef]
  40. Dusanapudi, S.; Krupakaran, R.L.; Srinivas, A.; Nikhil, K.S.; Vamshi, T. Optimization and Experimental Analysis of Mechanical Properties and Porosity on FDM Based 3D Printed ABS Sample. Materials Today: Proceedings 2023. [CrossRef]
  41. Zisopol, D.G.; Minescu, M.; Iacob, D.V. A Study on the Influence of FDM Parameters on the Compressive Behavior of PET-G Parts. Engineering, Technology & Applied Science Research 2024, 14, 13592–13597. [Google Scholar] [CrossRef]
  42. Zisopol, D.G.; Minescu, M.; Iacob, D.V. A Study on the influence of FDM parameters on the compressive behavior of ASA parts. Engineering, Technology & Applied Science Research 2024, (submitted).
  43. Zisopol, D.G.; Minescu, M.; Iacob, D.V. A Study on the Influence of FDM Parameters on the Tensile Behavior of Samples Made of PET-G. Engineering, Technology & Applied Science Research 2024, 14, 13487–13492. [Google Scholar] [CrossRef]
  44. Zisopol, D.G.; Minescu, M.; Iacob, D.V. A Study on the Influence of FDM Parameters on the Tensile Behavior of Samples made of ASA, Technology & Applied Science Research 2024, (preprint).
  45. Zisopol, D.G.; Minescu, M.; Iacob, D.V. A Theoretical-Experimental Study on the Influence of FDM Parameters on the Dimensions of Cylindrical Spur Gears Made of PLA. Engineering, Technology & Applied Science Research 2023, 13, 10471–10477. [Google Scholar] [CrossRef]
  46. Dev, S.; Srivastava, R. Experimental Investigation and Optimization of FDM Process Parameters for Material and Mechanical Strength. Materials Today: Proceedings 2020, 26, 1995–1999. [Google Scholar] [CrossRef]
  47. Iacob, D. V.; “Stadiul actual al cercetărilor în domeniul fabricației aditive”, Phd report, Mechanical Engineering Department, Petroleum- Gas University, Ploiești, România, May 2024.
  48. Zisopol, D.G. Ingineria valorii; Editura Universităt, ii Petrol-Gaze din Ploies, ti: Ploies¸ti, Romania, 2004; ISBN 973-7965-96-5.
  49. Zisopol, D.G.; Nae, I.; Portoaca, A.I.; Ramadan, I. A Theoretical and Experimental Research on the Influence of FDM Parameters on Tensile Strength and Hardness of Parts Made of Polylactic Acid. Eng. Technol. Appl. Sci. Res. 2021, 11, 7458–7463. [Google Scholar] [CrossRef]
  50. Zisopol, D.; Nae, I.; Portoaca, A. Compression Behavior of FFF Printed Parts Obtained by Varying Layer Height and Infill Percentage. Engineering, Technology and Applied Science Research 2022, 12, 9747–9751. [Google Scholar] [CrossRef]
  51. ASTM D638-14 Standard Test Method for Tensile Properties of Plastics.
  52. ISO 604:2002 Plastics: Determination of compressive properties. ISO, 2002.
  53. https://www.minitab.com/en-us/, (accessed June. 15, 2024).
  54. Eurostat Statistics Explained. Electricity Price Statistics. Available online: https://ec.europa.eu/eurostat/statistics-explained/index.php?title=Electricity_price_statistics, (accessed June. 15, 2024).
  55. https://3dkordo.eu/en/product-category/everfil (accessed June. 15, 2024).
  56. https://store.anycubic.com/products/anycubic-4max-pro-3d-printer (accessed June. 15, 2024).
  57. D. G. Zisopol, "The Place and Role of Value Analysis in the Restructuring of Production (Case Study)," Economic Insights - Trends and Challenges, vol. I, no. 4/2012, pp. 27–35, 2012.
  58. M. Minescu and D. G. Zisopol, Sudarea țevilor şi fitingurilor din polietilenă de înaltă densitate (HDPE Pipe & Fittings Welding). Ploiesti, Romania: UPG Ploieşti Publishing House, 2021.
  59. D. G. Zisopol and A. Dumitrescu, Ecotehnologie. Studii de caz. Romania: Editura Universității Petrol-Gaze din Ploiești, 2021.
  60. D. Zisopol, Tehnologii industriale și de construcții. Aplicații practice și studii de caz. Ploiesti, Romania: Publisher: Editura Universității din Ploiești, 2003.
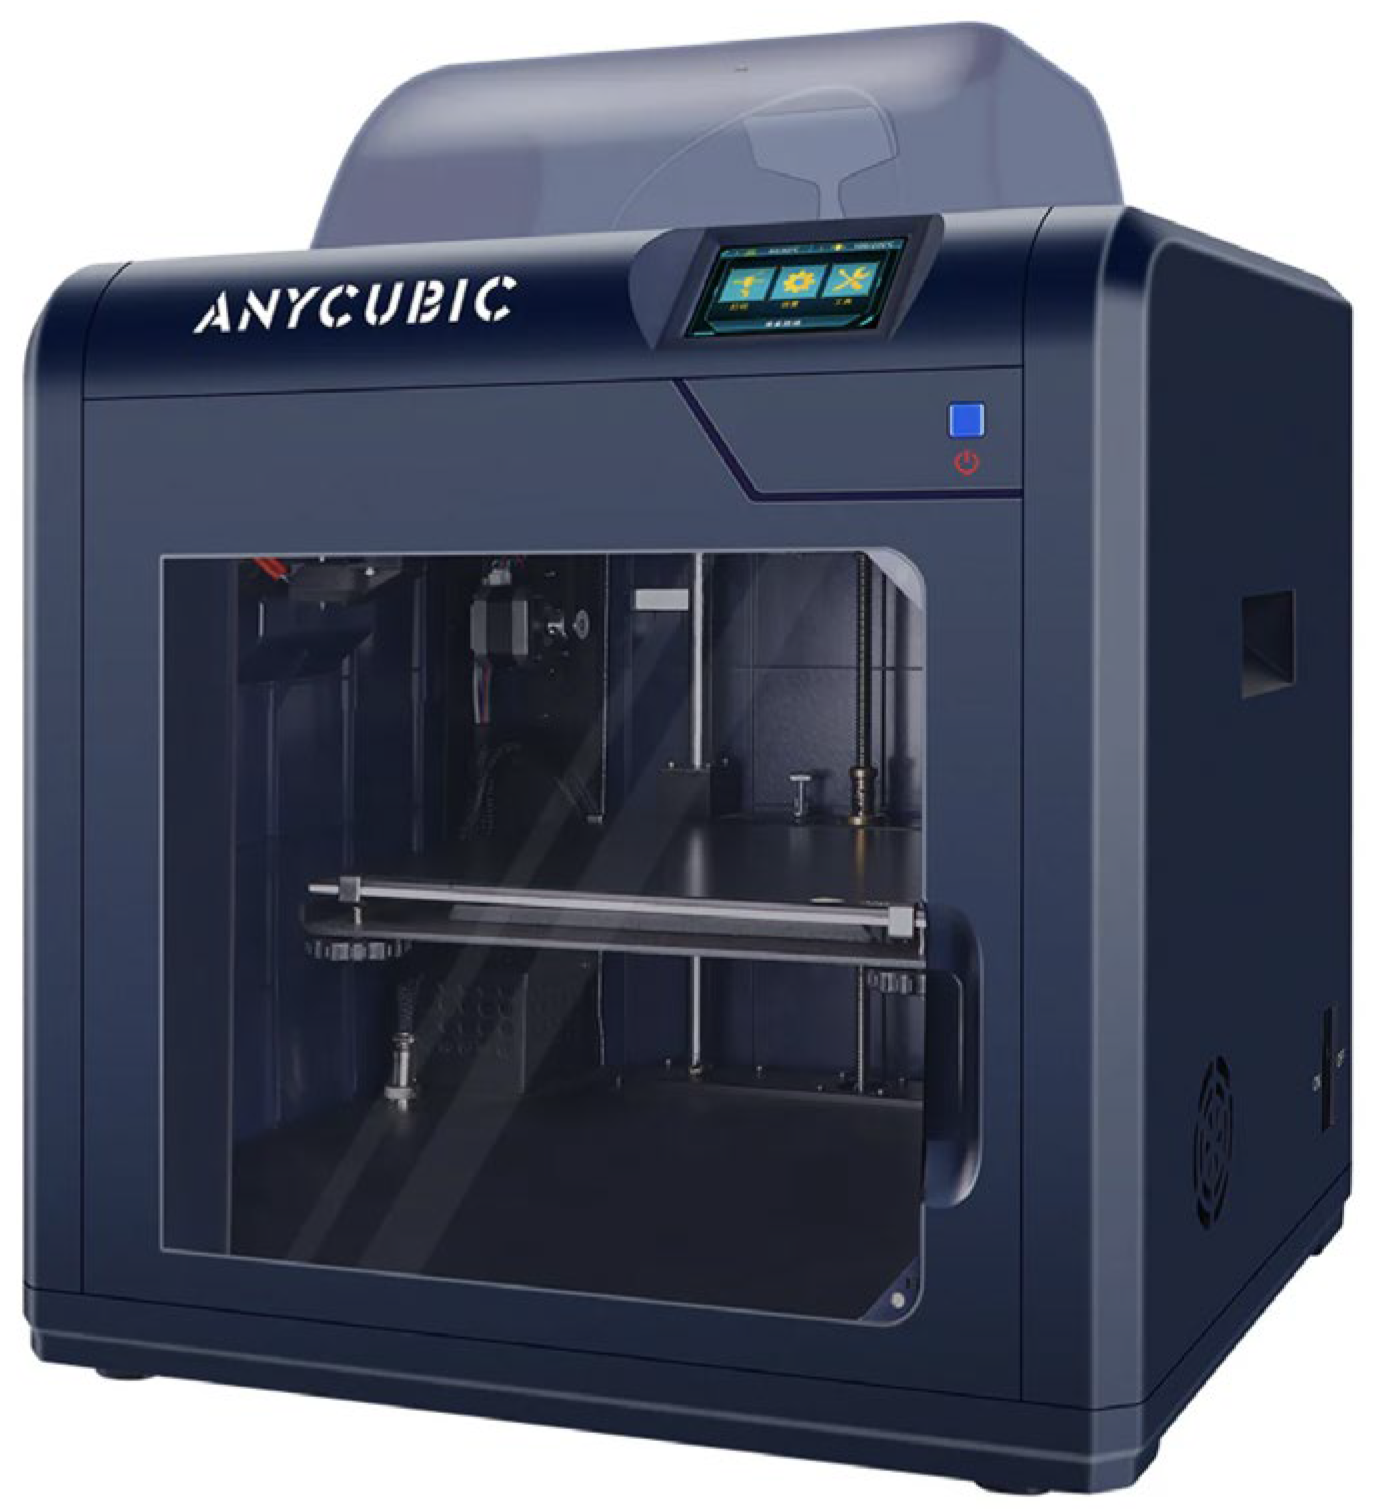
Figure 1. The 3D printer - Anycubic 4 Max Pro 2.0, used to manufacture tensile and compressive specimens from PETG and ASA through FDM, [47,56].
Preprints 111756 g001
Figure 2. Ratio determination Vi/Cp for tensile samples made from PETG and ASA.
Preprints 111756 g002
Figure 3. Main effects plots for tensile strength: a) PETG; b) ASA.
Preprints 111756 g003
Figure 4. Pareto charts for tensile strength: a) PETG; b) ASA.
Preprints 111756 g004
Figure 5. Ratio determination Vi/Cp for compressive samples made from PETG and ASA.
Preprints 111756 g005
Figure 6. Main effects plots for compressive strength: a) PETG; b) ASA.
Preprints 111756 g006
Figure 7. Pareto charts for compression strength: a) PETG; b) ASA.
Preprints 111756 g007
Figure 8. Optimisation plots for 3D printed materials: a) PETG; b) ASA.
Preprints 111756 g008
Table 1. The main additive manufacturing technologies, [47].
Technology name Draw Components Details
Stereolitograpgy,
(SL).
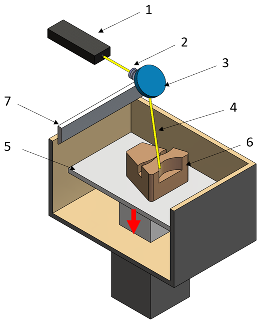
Preprints 111756 i001 1 - laser generator;
2 - optic system;
3 - galvanometric mirror;
4 - laser beam;
5 - construction platform;
6 - piece;
7 - blade.
Used materials:
photopolymers, ceramic materials.

Advantages:
+ high accuracy of parts;
+ high print speed.

Disadvantages:
- laborious post-processing of printed parts;
- the fragility of the parts.
Digital exposure of light,
(DEL).
Preprints 111756 i002 1 - digital projector;
2 - UV light;
3 - resin;
4 - piece;
5 - construction platform.
Materials used:
resins, photopolymers, wax-based polymers.

Advantages
+ the high quality of the surfaces;
+ high print speed.

Disadvantages:
- high cost of materials;
- the print volume is limited.
Layered manufacturing by laminating layers,
(LMLL).
Preprints 111756 i003 1 - driven roller;
2 - driving roller;
3 - construction platform;
4 - laser beam;
5 - laser generator;
6 - galvanometric mirror;
7 - heated roller.
Materials used:
paper, metals.

Advantages:
+ high accuracy of parts;
+ high stability of the structures.

Disadvantages:
- significant losses of material.
- laborious post-processing of printed objects.
Thermoplastic extrusion,
(TE).
Preprints 111756 i004 1 - winding with material;
2 - filament;
3 - extruder;
4 - extrusion nozzle;
5 - piece;
6 - construction platform.
Materials used:
thermoplastic materials.

Advantages:
+ simple technology;
+ low cost of materials and equipment.

Disadvantages:
- the poor quality of the surfaces of the parts;
- the printing speed is low.
Selective laser sinterising,
(SLS).
Preprints 111756 i005 1 - laser generator;
2 - laser beam;
3 - galvanometer
4 - construction platform; 5 - raw material container;
6 - blade.
Materials used:
thermoplastic, metallic, ceramic powders,.

Advantages:
+ the resistance of the parts is high;
+ good precision of parts.

Disadvantages:
- the quality of the surfaces is poor;
- the high cost of equipment and materials.
3D inkjet printing
(3DP).
Preprints 111756 i006 1 - scraper blade;
2 - enclosure with raw material;
3 - work platform; 4 - print head;
5 - binder tank;
6 - track.
Materials used:
powders (starch, plaster, plastic powders).

Advantages:
+ high printing speed;
+ reduced costs for materials and equipment.

Disadvantages:
- fragile parts;
- the quality of the surfaces is poor.
Selective laser melting,
(SLM).
Preprints 111756 i007 1 - laser generator;
2 - laser beam;
3 - galvanometer
4 - construction platform;
5 - raw material container;
6 - blade.
Materials used:
metal powders.

Advantages:
+ the use of high-performance materials;
+ the resistance of the parts is high.

Disadvantages:
- the high cost of equipment and materials;
- high time for cooling the parts.
Polyjet printing with photopolymers,
(PJP).
Preprints 111756 i008 1 - liquid polymer tanks;
2 - print head;
3 - construction platform;
4 - piece;
5 - piece support.
Materials used:
photopolymers.

Advantages:
+ good precision;
+ simple post-processing operations.

Disadvantages:
- weak resistance of the parts;
- the high cost of materials.
Table 2. FDM printing parameters used to manufacture tensile and compressive samples from PETG and ASA, [41,42,43,44].
Printing parameters PETG ASA
Part orientation, Po X-Y X-Y
Extruder temperature, Et
Platform temperature, Pt
Printing speed, Ps
Infill pattern, Ip
Layer height, Lh
Infill density, Id
Plate adhesion, Pa
250 °C
70 °C
30 mm/s
Grid
0.10/0.15/0.20 mm
50/75/100 %
Brim
240 °C
90 °C
30 mm/s
Grid
0.10/0.15/0.20 mm
50/75/100 %
Brim
Table 3. Characteristics of Everfil PETG and ASA filament, [55].
Materials Extruder temperature,
(°C)
Platform temperature,
(°C)
Density,
(g/cm3)
Tensile strength,
(MPa)
Charpy impact strength,
(kJ/m2)
PETG
ASA
220-250
230-245
70-90
85-100
1.27
1.08
50
50
179
33.5
Table 4. Testing conditions and samples dimensions for experimental investigation, [51,52].
Mechanical test Testing condition Sample dimensions
Tensile

- Barrus White 20 kN universal testing machine;
- speed 5 mm/min;
- ambient temperature 20 °C;
- humidity 40%.

Preprints 111756 i009
Compression

- Barrus White 20 kN universal testing machine;
- speed 10 mm/min;
- ambient temperature 20 °C
- humidity 40%

Preprints 111756 i010
Table 5. Cost calculation for PETG samples used for tensile testing.
Sample set Lh, (mm) Id, (%) C m a t , (Euro) C e n , (Euro) C p , (Euro)
1 0.10 100% 0.99 1.01 2.00
2 75% 0.86 0.69 1.55
3 50% 0.73 0.60 1.33
4 0.15 100% 0.99 0.63 1.63
5 75% 0.86 0.48 1.34
6 50% 0.73 0.43 1.16
7 0.20 100% 0.99 0.51 1.51
8 75% 0.86 0.35 1.22
9 50% 0.73 0.31 1.04
Table 6. Cost calculation for ASA samples used for tensile testing.
Sample set Lh, (mm) Id, (%) C m a t , (Euro) C e n , (Euro) C p , (Euro)
1 0.10 100% 1.04 1.01 2.05
2 75% 0.90 0.69 1.59
3 50% 0.76 0.60 1.36
4 0.15 100% 1.04 0.63 1.67
5 75% 0.90 0.48 1.38
6 50% 0.76 0.43 1.19
7 0.20 100% 1.04 0.51 1.55
8 75% 0.90 0.35 1.26
9 50% 0.76 0.31 1.07
Table 7. Ratio determination Vi/Cp for tensile samples made from PETG.
Sample set Ultimate tensile strength, (MPa) C p , (Euro) Vi/Cp
1 28.25 2.00 14.11
2 22.66 1.55 14.64
3 18.76 1.33 14.10
4 25.34 1.63 15.56
5 19.85 1.34 14.82
6 16.61 1.16 14.38
7 24.29 1.51 16.11
8 18.72 1.22 15.40
9 15.48 1.04 14.87
Table 8. Ratio determination Vi/Cp for tensile samples made from ASA.
Sample set Ultimate tensile strength, (MPa) C p , (Euro) Vi/Cp
1 43.24 2.05 21.12
2 26.01 1.59 16.39
3 22.69 1.36 16.63
4 40.13 1.67 23.98
5 23.46 1.38 17.01
6 20.87 1.19 17.56
7 39.87 1.55 25.66
8 21.46 1.26 17.09
9 18.82 1.07 17.51
Table 9. Cost calculation for PETG samples used for compressive testing.
Sample set Lh, (mm) Id, (%) C m a t , (Euro) C e n , (Euro) C p , (Euro)
1 0.10 100% 0.22 0.29 0.51
2 75% 0.22 0.19 0.41
3 50% 0.22 0.16 0.38
4 0.15 100% 0.22 0.20 0.42
5 75% 0.22 0.13 0.35
6 50% 0.22 0.11 0.33
7 0.20 100% 0.22 0.15 0.37
8 75% 0.22 0.10 0.32
9 50% 0.22 0.08 0.30
Table 10. Cost calculation for ASA samples used for compressive testing.
Sample set Lh, (mm) Id, (%) C m a t , (Euro) C e n , (Euro) C p , (Euro)
1 0.10 100% 0.23 0.29 0.52
2 75% 0.23 0.19 0.42
3 50% 0.23 0.16 0.39
4 0.15 100% 0.23 0.20 0.43
5 75% 0.23 0.13 0.36
6 50% 0.23 0.11 0.34
7 0.20 100% 0.23 0.15 0.38
8 75% 0.23 0.10 0.33
9 50% 0.23 0.08 0.31
Table 11. Ratio determination Vi/Cp for compressive samples made from PETG.
Sample set Compressive strength, (MPa) C p , (Euro) Vi/Cp
1 30.33 0.51 59.07
2 19.83 0.41 48.30
3 14.06 0.38 37.19
4 30.57 0.42 72.55
5 20.22 0.35 57.60
6 12.20 0.33 37.03
7 29.20 0.37 78.35
8 19.82 0.32 62.22
9 11.27 0.30 37.28
Table 12. Ratio determination Vi/Cp for compressive samples made from PETG.
Sample set Compressive strength, (MPa) C p , (Euro) Vi/Cp
1 38.04 0.52 72.65
2 28.58 0.42 67.94
3 16.42 0.39 42.30
4 34.43 0.43 79.78
5 25.85 0.36 71.59
6 15.04 0.34 44.32
7 37.68 0.38 98.45
8 28.54 0.33 86.86
9 16.45 0.31 52.66
Table 13. Optimization Goals for analyzed materials, (PETG and ASA).
Response, Goal Lower Target Weight Importance
Vi/Cp PETG ASA PETG ASA
Tensile, [MPa/Euro] Maximum 14.10 16.39 16.11 25.66 1 1
Compression, [MPa/Euro] 37.03 42.30 78.35 98.45
Table 14. Composite desirability.
Printing parameters Material
Layer height,
(mm)
Infill density,
(%)
PETG ASA
Composite desirability Composite desirability
0.10 100 0.453350 0.56643
75 0.168040 0.29452
50 0.000000 0.01430
0.15 100 0.696297 0.80768
75 0.405383 0.44291
50 0.066163 0.05602
100 0.917938 1.00000
0.20 75 0.615557 0.59118
50 0.275221 0.09752
Disclaimer/Publisher’s Note: The statements, opinions and data contained in all publications are solely those of the individual author(s) and contributor(s) and not of MDPI and/or the editor(s). MDPI and/or the editor(s) disclaim responsibility for any injury to people or property resulting from any ideas, methods, instructions or products referred to in the content.
Copyright: This open access article is published under a Creative Commons CC BY 4.0 license, which permit the free download, distribution, and reuse, provided that the author and preprint are cited in any reuse.
Alerts
Prerpints.org logo

Preprints.org is a free preprint server supported by MDPI in Basel, Switzerland.

Subscribe

© 2025 MDPI (Basel, Switzerland) unless otherwise stated