
Submitted:
10 July 2024
Posted:
11 July 2024
You are already at the latest version
Abstract
The study aims at evaluating the demand of forest bathing in the Northern Italy’s regions underlining the willingness to pay and the potential tourists’ habits and flows on attending alpine contexts. Through the submission of a questionnaire, the sample’s answers have been analyzed employing a stratified sampling methodology considering three different macro areas (Northwest regions, Northeast regions, and Friuli Venezia Giulia region). After analyzing the sample attitudes, the research approached the estimation section by calculating the flow as the number of potential forest bathing hikes per year and the willingness to pay trough the Contingent Valuation Method. The main results indicate that Forest Bathing activity in Northern Italy have a considerable monetary value and it is generally compared with positive feelings, particularly concerning well-being, and fascination factors.
Keywords:
Forest bathing demand
; Forest Ecosystem Services
; Tourists’ attitude
; Willingness To Pay
1. Introduction
The “Forest Bathing” (FB) or “taking in the forest atmosphere” emerged in Japan in the early 1980s as a physiological and psychological exercise called Shinrin-Yoku. The term was coined by Tomohide Akiyama, who was the director of the Japanese Ministry of Agriculture, Forestry and Fisheries [1]. Often involving a walk in a forest, this practice aims to integrate and harmonize humans with the forest environment [2]. Several medical-based studies underlined the different benefits acquired by the exposure to forest environments. In particular, the most frequently measured effects concern an improvement on the immune system function, on the cardiovascular system, on the respiratory system, on mental relaxation and an alleviation on depression and anxiety [3]. In order to spread the knowledge and awareness on the therapeutic benefits of attending forest environments, in Japan FB has been included as a national health program supported by the Forestry Agency. Although Japan has been the main promoter giving scientific relevance to the benefits of FB, in other states such as Germany and China, the beneficial effects of nature exposure are promoted since several decades [4,5]. Nowadays, the FB benefits are widely recognized, datum perceptible by the widespread presence of specialized guides and associations which promote and organize training programs. Accordingly, FB can be defined as an accessible and structured practice, becoming particularly suitable as a touristic activity related to the health tourism and the use of natural resources [6]. Parallelly, FB is a practice that through exposure to nature by the physical fitness and wellness benefits provides ecosystem services (ESs) bridging the gap between recreation-related ES and cultural values ES (aesthetics, spiritual value, and existence value) associated with nature [7]. In particular, the FB practice is included in the Cultural Ecosystem Services (CESs), considered as non-material and non-consumable psychophysical benefits which humans obtain from ecosystems. They are generally divided into two separate sets, one related to the recreational services and one to symbolic ones. Concerning the FB practice, it is included in the first set [8,9]. Accordingly, several studies are theorizing the evaluation of CESs adopting monetary and non-monetary methods. The monetary methods are strongly connected with purposes of conservation and protection of natural ecosystems and are based on the value humans associate to nature ecosystems. Several methods are employed to evaluate CESs, for instance through the cost required to obtain the same benefit from human-created devices, assimilated to similar activities which the payment of a ticket is required in touristic contexts, or associated with the travel cost [8,10]. Similarly, other general studies analyzed the characteristics of potential users from which emerges a propensity to pay for services related to recreational infrastructure or for the conservation of the natural environment [11].
Given the growing interest in FB in Italy, the aim of the research is to examine the potential market for FB in the northern Italian regions by evaluating the demand for such experiences and considering flow, behavior, and willingness to pay. Currently, no statistics or studies have estimated this demand over such a large area. This paper aims to estimate the potential tourist flow in terms of quantity and value.
From the methodological point of view, economists have devised numerous techniques for determining the value of goods whose market prices are either inaccurate indicators of their worth or entirely not-existent [12]. For this purpose, stated preference method was selected to assess the Willingness To Pay (WTP). The supply in going to be evaluated in a subsequent study through the analysis of sites, economic operators, and management costs.
The paper introduces to study area and economic valuation methodology to assess FB Forest Ecosystem Service (FES), provides the results by describing visitors attitude and estimating visitor flows and the benefit associated to FB activity. Discussion highlights the findings and their implications.
2. Materials and Methods
2.1. Study Area
The research endeavor sought to explore the attitudes towards FB among inhabitants residing within the northern regions of Italy. Particular attention was directed towards residents inhabiting three distinct macro areas: Lombardy, Piedmont, Aosta Valley and Liguria as Northwest Italy area; Veneto, Autonomous Province Trento and Autonomous Province Bolzano as Northeast Italy area; and the Friuli Venezia Giulia region. The Northeast area of Italy is the main study area of the project iNEST within the “Spoke 1” denominated “Ecosystems for Mountain Innovation” (Figure 1).
Accordingly, for greater understanding and for purposes of comparison, in addition to the Northeast and the Friuli Venezia Giulia region considered as an area in itself, the Northwestern Italy has been included as well in the study. The study area includes 97.870 km2 of land for approximately 20 million inhabitants, having 38 provinces, 4047 municipalities and four urban centers with more than 1 million inhabitants.
Employing a stratified sampling methodology, three separate samples were randomly drawn from the resident populations of the three distinct macro areas abovementioned.
The three panels do not offer a true probability sample; however, they allow for quotas to be established based on a variety of attributes. The three sub-samples were systematically stratified based on age (in a range of individuals aged over 18 and under 75 years), as well as by gender (male, female), thereby ensuring demographic diversity and representation within the population (Table 1).
2.2. Questionnaire Survey
A questionnaire was built and online underwent administration facilitated by a specialized statistical survey firm proficient in conducting online panel-based inquiries. The questionnaire’s duration was valuated within an 11-minute timeframe. The determination of the sample size allocated 384 respondents per sub-sample, ensuring a margin of error of 5% at a confidence level of 95%. Prior to full deployment, the questionnaire underwent validation through pilot testing with a subset of 50 panelists as suggested by many studies [13,14]. The survey spanned from December 2023 to January 2024, resulting in the collection of 1,218 completed questionnaires. Data analysis was performed using IBM SPSS Statistics version 29.0.2.0.
The questionnaire was divided into four thematic sections. The first part of the questionnaire was devoted to a topic that is not covered here (questions from D1 to D11). The second part focused on visits to forests in plains, hills, and mountains (questions from D12 to D16). Initially, the sample was surveyed about their forest visitation habits, followed by questions on the frequency of visits to forests in the three specified environments (plain, hill, and mountain). The visits were then quantified according to temporal criteria (over the past 5 years), geographic criteria (by region), and tourist type (day and vacation-related hikes). Finally, attitudes and preferences toward FB were investigated by asking interviewees to rate their level of agreement (on a scale from 0 to 10) with a series of statements describing FB experience. The third part analyzed the recreational value and perceived psychophysical well-being derived from forest use. The sample was introduced to FB through a brief description of the activity and was subsequently asked to state the importance of having places available for carrying out the discipline (questions from D17 to D22). Respondents were asked to indicate the number of hikes they would undertake in their own region to estimate potential domestic demand, and the number of hikes they would undertake in other northern Italian regions to also estimate outbound flows. Finally, the hypothetical market was constructed to estimate the WTP, including response options that allowed for the identification of protest responses. The final part of the questionnaire was structured to collect information useful for constructing the socio-economic profile of the sample (questions from D23 to D29). This included data on gender, age, residence (municipality and municipality size), educational level, professional position, economic activity sector, and income.
2.3. Economic Valuation Methodology
Given that FB is one of the FES that can be certified according to standards established by the Programme for the Endorsement of Forest Certification (PEFC ITA 1001-SE:2021 v.4) [15] and the Forest Stewardship Council’s Ecosystem Services Procedure (FSC-PRO-30-006 v.1-1) [16], the description of FB adopted in this paper adheres to the principles and criteria stipulated for FES certification by both standards. The PEFC standard, like other standards [17], is recognized at national level, while the FSC standard is recognized internationally. Both the PEFC and FSC standards categorize FB under the specification of recreational FES. Certification establishes the prerequisites for offering such a service. The PEFC principles and criteria were analyzed more specifically in this study, as it aims to investigate not only the behavior of northern Italian residents in general but also the demand for FB in Friuli Venezia Giulia, where PEFC certification is more widespread than FSC certification.
Methodologically, a variety of techniques are available for determining the value of goods whose market prices are either inaccurate indicators of their worth or entirely not-existent [12]. Economists estimate the value of these goods by analyzing individuals’ observable decisions. For the categories of FES under evaluation, both revealed and stated preference methods are applicable. Revealed preference methods analyze spending on ecosystem-related goods, such as travel costs or property prices in low-pollution areas. In contrast, stated preference methods estimate changes in individuals’ economic well-being based on their preferences due to marginal changes in ecosystem components. For goods traded in markets, the market price indicates the benefit derived from each unit. In both scenarios, people’s choices and trade-offs reflect their willingness to pay (WTP) for ES [7]. Stated preference methods, including the Contingent Valuation Method (CVM) and Discrete Choice experiments, are theoretically suitable for a broad array of ES goods and are generally the only feasible approach for estimating non-use values. A significant part of research on non-market valuation in FES has concentrated on estimating total economic value using the CVM [18].
According to its definition, FB combines outdoor activity with mental and physical wellbeing, encapsulated by two distinct ESs: “recreation-related” and “cultural values such as aesthetic, spiritual, and existence values” associated with nature, which are more challenging to quantify in monetary terms [19]. The literature on the economic analysis of FB is still in its early stages. There are very few studies available, and they mostly focus exclusively on one of the two ESs, rarely analysing them in conjunction. The Ecosystem Services Valuation Database (ESVD) [20] was explored to select appropriated reference studies and has shown evidence that research conducted so far has addressed only one of the two spheres constituting FB: recreation-related services or cultural values. The literature on recreation-related services is abundant, even when contextualized to the northern Italy area [21,22,23,24,25,26,27,28,29], while that on cultural values is scant. Regarding FES cultural values with focus on visual amenity services, in the literature the following factors have been considered: forest structure (i.e. tree species, forest structure, wood utilization) [30], environmental attributes (i.e. endemic orchid species, animals with scenic attraction, additional protection for endemic amphibians) [31], landscape contexts (e.g. mountain, hilly/rolling, peri-urban forests) and forest configurations [32,33], and the “sense of place” of different habitats [34]. The research conducted by Mourato et al. [35] was one of the first to address both recreational and cultural aspects in the provision of natural habitats. They recognized that environmental quality and proximity to natural amenities can enhance mental and physical health by promoting physical exercise in nature and exposure to natural environments. Their study estimated the economic value of human health impacts, both mortality and morbidity, using the WTP approach to avoid physical and mental disease. Similarly, Hermes et al. [29] indirectly assessed both recreation-related services and visual amenity services by evaluating the value associated with Special Protection Areas. They calculated the travel cost by correlating these results with the aesthetic quality of mapped landscapes in Germany, which represents the recreational ES capacity. Yao et al. [36] focused on the cultural value associated with rural large old trees. Busk et al. [37] conducted a comprehensive literature review on the economic evaluation of nature-based therapy interventions. Out of 849 potentially relevant papers, only three were selected for detailed analysis. The first study [38] employed a cost-benefit approach to assess the net present economic benefits per person resulting from reduced public health and service costs due to nature-based therapy for mental health conditions. The net present economic benefits was reported to range from £830 to 31,510 after one year, and from £6450 to £11,980 after ten years. The second study [39] evaluated mental well-being following interactions with nature, focusing on the costs associated to supervision. The estimated average costs of resource use within the past month were £95.74 and £67.23 for the care farms group. The third study, a non-peer-reviewed report by CJC Consulting [40], investigated the effects of various woodland activity (e.g., health walks and talks, tai chi, conservation activities, rhododendron clearance, bird box construction, bushcraft, fire lighting, and shelter building) on a group of adults with severe and enduring mental health problems. This economic evaluation was classified as a partial cost-utility analysis, which did not include an assessment of benefits.
Only recently and in parallel with the growing interest in FB, has research begun to address its economic valuation. In a 2021 study, Uyan [41] conducted a survey involving 60 users of the FB facility in Camp John Hay, Philippines. The survey revealed that respondents’ mean WTP value was USD 15. Paletto et al. [27] investigated the economic value of FB in a case study in northern Italy (specifically, the Parco del Respiro in Trentino-Alto Adige) using the Zonal Travel Cost Method. During the summer of 2022, 243 forest bathers were interviewed. The findings highlighted that an actively managed forest with an average to low amount of deadwood and clean open areas is the preferred scenario by users, whose consumer surplus amounted to EUR 35.80 per visit per person.
To estimate WTP, this study utilized the CVM [42]. This technique of stated preference constructs a hypothetical market to elicit expected behavior in response to a proposed change and to evaluate respondents’ reactions. A survey was constructed, part of which described the ES of interest to derive the Hicksian monetary measure of welfare, specifically the maximum WTP. The CVM survey followed established requirements: initially presenting the CV scenario, including the intervention’s goals, implementation details, and funding mechanisms, followed by outlining the status quo if the intervention were not implemented. Additionally, respondents were queried about their WTP for the ES in question, specifically whether they would pay to visit the forest for FB purposes. According to Hanemann’s model [43], respondents assess the difference in utility between paying a fee or increased amount for access versus having full income without access to the forest for FB. If the utility difference favors access, the respondent answers “Yes” and specifies the amount they are willing to pay, following an “Open-ended” CV format. These responses were used to calculate average WTP values, providing a statistical representation of FB’s economic valuation among the sample population. The WTP analysis also considered factors such as the frequency of forest visits, the perceived importance of the forest experience, and demographic characteristics, to understand the determinants of WTP and its variability across different subgroups.
The maximum WTP was estimated following Boyle [44] formula expressed by the WTP mean. The contribution of different socio-economic attributes (i.e. age, gender, income, occupation) to WTP was analysed through the multiple regression model equation:
where is the dependent variable (i.e. the WTP), is the vector of unknown parameters, is the set of independent variables, and is the random error. Multicollinearity among the independent variables through one-on-one correlation among independent variables and through variance inflation factors (VIF) was checked.
3. Results
The survey results contributed to provide a sufficiently detailed and statistically robust picture of the FB dynamics of residents in the regions of northern Italy, describing the sociodemographic profile of the sample and estimating the demand in terms of flows and the economic value attributed to the activity.
3.1. Sample Description
The 1,218 interviewees were segmented by age and gender within the three areas under investigation. The majority of respondents were from the 30-54 age group (Table 2).
Most participants resided in small villages (31.1% in the 1-10,000 inhabitants category) and towns (23.7% in the 10,001-30,000 category and 18.9% in the 30,001-100,000 category).
The educational level was relatively high, with 53.9% holding a high school diploma, 29.9% holding a bachelor’s degree, and 6.8% having a higher educational level (master’s and PhD). The largest employment category was employees (37.5%), followed by workers (17.1%), and freelancers (11.7%). The main employment sectors were “Other services to people and the third sector” (42.5%), “Public administration” (19.7% each) and “Trade, transport, telecommunication, credit, and business services” (19.2%). Regarding income, 72.7% of respondents had a net individual income below 45,000 EUR (17.5% up to 15,000 EUR, 38.5% from 15,001 to 30,000 EUR, and 16.7% from 30,001 to 45,000 EUR).
The Pearson’s correlation coefficient was calculated to identify relationships among socio-demographic variables, fruition habits, and perceptions. No statistically significant correlation were found, except for a week correlation between employment and economic sector (0.303**). Regards perceptions toward forest, a weak negative correlation was observed between the age class and the perception of discomfort in contact with nature (-0.240**) and the fear of forest (-0.256**).
3.2. Potential Demand of FB
To assess potential demand, the sample was introduced to FB in a series of steps. First, the study investigated the sample’s forest visitation habits. Next, participants’ perceptions were evaluated by having them express their preferences for a list of statements. Finally, the study assessed the flow and value of FB by analyzing only those participants who expressed an interest in FB.
3.3. Visitors’ Attitudes and Preferences toward Forest Frequentation and FB
Data were analysed considering the three sub-samples. The sub-samples are described processing from the specific (the FVG sub-sample) to the more general sub-samples represented by the Northeast and Northwest regions. The 65.2% of the FVG sample, the 76.0% of the Northeast and the 61.5% of the Northwest samples declared to visit forest with a higher preference toward mountain forest (Figure 2).
The following tables (Table 3, Table 4 and Table 5) show the tourist flows at the regional scale. In general, residents have a fruition behavior related to the local area, both in terms of day trip and hike during vacation. Over the last five-year period, the Autonomous Provinces of Trento and Bolzano recorded the highest numbers of both day trips and vacation trips, with 32.2 and 30.4 day trips and 8.8 vacation trips. Aosta Valley and Piedmont followed for day trips with 27.1 and 23.2, respectively, while Piedmont and Liguria trailed for vacation trips with 9.2 and 8.0, respectively. The most frequent tourists visiting the forests of Northern Italy for day trips originated from the Autonomous Province of Bolzano, Aosta Valley, and the Autonomous Province of Trento with five-years recorded frequencies of 37.2, 25.6, and 23.5 trips, respectively. For vacation hikes, the highest frequencies were observed among visitors from Liguria, Lombardy, Piedmont and the Autonomous Province of Bolzano, with 12.2, 9.8, 8.8, and 7.8 trips, respectively.
In terms of outbound tourism (Table 4), i.e. visits by residents of a region outside that region, the residents of two areas (Autonomous Provinces of Trento and Bolzano) were the most sensitive toward out-of-region day hikes, ranging from 89.4% to 78.4%, and the residents of three areas (Aosta Valley, Autonomous Province of Trento and Liguria) for vacation hikes, with percentages ranging from 100.0% to 70.8%.
In terms of inbound tourism (Table 5), defined as visits to a region by visitors who are not residents of that region, data from the selected sample of northern Italy residents indicated that five regions (Liguria, Aosta Valley, Friuli Venezia Giulia, Lombardy, and Piedmont) are predominantly characterized by domestic-regional tourism flows for day hikes. These flows, ranging from 84.0% to 75.0% of the day hikes, represented visits within a region by residents of that same region. The Pearson’s correlation coefficient was assessed to highlight relationship between attitudes and preferences with socioeconomic variables. A statistically significant strong negative correlation was identified between the number of day trips and vacation hikes in Friuli Venezia Giulia and the Northwest Italy sample (r=-0.720, p<0.01, and r=-0.371, p<0.01 respectively). Additionally, moderate positive correlation were observed in Lombardy and Piedmont for the number of day trips (r=-0.475, p<0.01, and -0.441, p<0.01 respectively). Conversely, the Autonomous Province of Trento, compared to other regions in northern Italy, had the lowest inbound tourism hike rate, at 7.8%. Regarding vacation hikes, Friuli Venezia Giulia and Liguria had domestic tourism rates of ranging from 55.6% to 46.7%, while Autonomous Province of Trento and Aosta Valley have the lowest rates, at 16.7.% and 0.0%, respectively. The data indicated that, in general, the origin of vacation hikes is more varied compared to day hikes. Specifically, over 80.0% of day hike arrivals originated from a single region other than the region of residence, whereas vacation hikes involved visitors from at least three additional regions beyond the region of residence.
According to the certification standard [15,16], FB was described to the interviewees based on the fourth principle and associated criteria, which determine the forest’s suitability for this activity. The fourth principle defines the suitability of place by considering their potential for certain health-promoting practices based on the Attention Rotation Theory (ART) [45], the Biophilia Theory (BT) [46], and the Stress Recovery Theory (SRT) [47,48]. The selected criteria assess place qualities that can be cognitively appreciated, utilizing the shortened Italian version of the Perceived Restorativeness Scale (PRS-11) [49], which is grounded in these theories. The PRS-11 measures an individual’s perception of four restorative factors assumed to be present to varying extent in the environment. These factors are:
- physical and/or psychological “Being-away” - feeling removed from one’s usual environment and daily routines;
- “Fascination” - being captivated by the aesthetic and archetypal characteristics of the place;
- “Coherence – sub criteria of Extent” - physical dimensions and contents of the place that do not seem to limit interest;
- “Scope - sub criteria of Compatibility” - finding full alignment with one’s expectations and ability to engage with the place.
Pasini et al. [49] added a fifth factor, which refers to the “Preference” for potential restorativeness. Table 6 presents the factors and the related statements submitted to the respondents, asking them to rate their degree of agreement/disagreement on a scale of 0 to 10. A one-way Anova was conducted to determine if there are any statistically significant differences among the means of three sub-samples. Statistically different means were detected for sentences 11, 15 and 16 as shown in Table 6. The sample demonstrated agreement on the positive feelings derived from immersion in the forest, particularly concerning well-being (statements 10 and 1) and fascination factors (statements 12, 9, and 1). Some statements were formulated negatively to highlight potentially negative aspects and stereotypes associated with the forest (statements 3, 13, 15, and 16). Overall, the sample assigned low scores to these statements, indicating disagreement with the negative perceptions of the forest. Although weak, a negative correlation was observed between age and the fear associated with the forest (“The forest environment scares me”) (r=-0.256, p<0.01), as well as with the aversion of engaging in recreational activities in the forest (“I would never frequent the forest for recreational activities”) (r=-0.240, p<0.01).
Finally, FB was introduced by providing its definition and describing the activities and the perceived intangible benefits, as follows:
“Forest Bathing is a practice where spending time in the midst of the forest and among trees brings benefits to our organism. Several studies have shown that immersing oneself in the forest and among trees while breathing deeply can lead to a reduction in stress, blood pressure, and heart rate, as well as an increase in the immune system.
Forest Bathing is a guided journey through the forest where activities are proposed to maximize the benefits of the practice. The most common activities in forest bathing include:
- Walking without exertion, strolling, and exploring the surrounding space;
- Pausing, relaxing, contemplating, and observing the surroundings and details of the place;
- Breathing deeply and doing breathing exercises;
- Sensing one’s own body through simple movements interacting with the environment and its components;
- Opening and awakening the senses.”
In response to the question, which asked about the importance attached to forests in which to carry out the activities thus described, the sample gave a high score, exceeding 80 percent agreement (high and moderate importance) in all three sub-samples (Figure 3).
3.4. Flows
After analyzing the sample attitudes, the research approached the estimation section. The flow was calculated as the number of potential forest bathing hikes per year, conducted both within the region of origin (D18: How many FB hikes per year would you carry out in your home region?) and in other regions of northern Italy (D19: How many FB hikes per year would you carry out in other regions of northern Italy?). First, outlier analysis was employed to remove extreme cases, with the analysis conducted with a 99% confidence interval. For in-region hikes, 109 cases were removed for an annual number of hikes greater than or equal to 20. For FB hikes in other regions of northern Italy, 67 cases were removed for an annual number of hikes greater than or equal to 12. Then, given that the sample was stratified by geographical area and age group, the average number of hikes in the three sub-samples was calculated based on age. Within the three subsamples, contingency tables were calculated showing the percentage of the sample carrying out the number of visits (0 to 19 for domestic flows and 0 to 11 for out-of-region flows) for each age group.
Domestic flow, defined as hikes conducted within the region of origin, was estimated to be 715,566 in Friuli Venezia Giulia (Table 7), 6,512,369 in Northeast Italy (excluding Friuli Venezia Giulia) (Table 8), and 9,736,382 in Northwest Italy (Table 9). The average annual FB hikes per inhabitant ranged from 0.3 to 1.2. Outbound flow, defined as hikes conducted by residents of a region outside that region, was estimated to be 371,849 in Friuli Venezia Giulia (Table 10), 4,184,120 in Northeast Italy (excluding Friuli Venezia Giulia) (Table 11), and 6,582,181 in Northwest Italy (Table 12). The average annual FB hikes per inhabitant ranged from 0.2 to 0.8.
3.5. Value
To assess potential demand in terms of value gained by the hike’s consumers, the sample was introduced to FB through the presentation of the following scenario:
“Maximizing the benefits of FB depends on the presence of a guide and the state of forest conservation. Managing the forest to facilitate FB activities involves management costs such as forest and undergrowth care, trail maintenance, and the setup of structures. If you were asked to pay an entrance fee to access forests where FB can be practiced, intended to cover the cost of the guide and management costs (forest and undergrowth care, trail maintenance, setup of structures) borne by the forest owner, would you be willing to pay the fee? If yes, what is the entrance fee you would be willing to pay for each of the FB hike mentioned in previous questions? Please indicate €/hike.”
Summary statistics, including measures of central tendency and dispersion, were used as a preliminary data analysis tool. The arithmetic mean, and median served as measures of central tendency, while standard deviation and variance were used to measure dispersion. Furthermore, to generalize findings to the population from which the representative sample was drawn and to determine statistically significant associations, relevant parametric and nonparametric tests were conducted. These tests assessed the correlation between independent and dependent variables, the significance of such correlations where they existed, and the nature or direction of these correlations. For inferential statistics, the Pearson’s correlation coefficient and Multiple linear regression were employed to determine the value and the measures of best fit.
The data were analysed by sub-sample, and the results are presented in Table 13. First, protest responses were detected [50], by investigating why respondents refused to pay (i.e. do not have a genuine WTP of zero). These responses were labeled as protests and removed. Then, outlier analysis was employed to remove extreme cases, with the analysis conducted with a 99% confidence interval. 63 were removed for a WTP per hike greater than or equal to 30. Afterwards, a one-way Anova was conducted to determine if there were any statistically significant differences among the means of three sub-samples. No statistically significant differences were found, thus a single value for WTP of 5.83 was assessed (Table 13). Generally, the 66.1% of respondents were willing to pay a positive amount for FB hike.
The correlation and association of the WTP with other variables was investigated. The Pearson’s correlation coefficient test and the Chi-squared test of association were applied. Although statistically significant, the correlations between variables describing respondents’ perceptions of the forest and their impacts are weak. The tests revealed some correlations with the two questions regarding the importance of forests for practicing (D17) and the number of hikes (D18, and D19). A weak positive statistically significant correlation with socio-economic characteristics was observed concerning income (Table 14). A statistical association was identified with the variable expressing the general predisposition to visit forest (D12) (Table 15).
We employed ordinary least squares (OLS) regression to estimate models in which the dependent variable was the WTP. Using the stepwise method, five models were estimated. The best fitting model is based on the predictors specified as follows: the importance of having forests in which to practice FB (D17), the income (D29), the number of FB excursions the respondent plan to conduct in the own region (D18), the educational level (D26) and the preference towards forest that are easily accessible (D16.f) (Table 16). However, the Multiple regression models were not statistically significant and explained only 9.4% of the variability (Table 17). Considering the low significance of the models, the mean WTP of € 5.83 was used to assess individuals’ value attribution to FB hike.
4. Discussion
The results of this study have contributed both to framing previous research conducted in North Italy [21,27,51] and to enriching the analysis of FB demand in areas outside the national context [41]. Specifically, this study aimed to evaluate the potential tourist demand for FB in Northern Italy by estimating the consumer surplus using the CVM to determine the WTP and visitor flow, both in quantitative terms and perceived well-being.
In the literature, CVM has been applied in numerous studies to estimate the monetary value of forest sites from a recreational perspective. However, among the approximately 170 economic evaluation of recreational activities within forest and woodland ecosystems using CVM, only two studies have applied CVM to FB evaluation [35,41], and one has applied the Travel Cost Method (TCM) [27]. The literature review was conducted by filtering the evaluation for individual ESs identified according to the CICES [19] and using the following categories: “characteristics of living systems that enable outdoor interactions, both active and passive”, that are “resonant in terms of culture”, “enable aesthetic experience”, and “having symbolic, sacred, or religious significance” [20]. The comparison with previous FB studies is therefore very limited, despite a well-developed literature on recreational activities in forests. This study is consequently one of the first devoted to FB activities.
The main results indicate that FB activity in Northern Italy have a considerable monetary value, assessed both in terms of flow, estimated as 0.8 FB hikes per year per inhabitant within the region of origin and 0.6 outside the region of origin, and in terms of economic value, estimated as 5.83 EUR per FB hike. Paletto’s study [27], conducted in the “Parco del Respiro,” a site in Trentino-Alto Adige (Italy) where FB can be practiced, applied the TCM and estimated the consumer surplus at 35.80 EUR per person per visit. Uyan’s study [41], conducted at “Camp John Hay,” a site in the Philippines where FB has been practiced for years, found a mean WTP of USD 15 (EUR 13.87) and a median of USD 10 (EUR 9.24). This value is lower than that found by Paletto et al. [27] due to intrinsic differences in the sites analyzed, spending power, GDP [52], and the methods adopted. WTP estimates are usually lower than the consumer surplus results of the TCM. While the intrinsic and socio-economic reasons are easily understandable, methodologically, WTP estimates are usually lower than TCM consumer surplus results [53]. Furthermore, the elicitation method adopted in the present study, i.e. the open ended format, generally produces underestimated consumer surplus values compared to the dichotomous choice format [54,55].
Regarding the perception and psycho-physical value assigned to FB, the study showed that the sample derived significant and positive feelings from forest immersion, particularly concerning well-being and fascination factors. Simultaneously, the sample expressed disagreements to statements negatively connoting the forest, deliberately constructed to highlight potentially negative aspects and stereotypes associated with the forest (e.g. “Contact with nature makes me uncomfortable”). The negative Pearson’s correlation coefficient between age and the fear associated with the forest confirmed the Nature-deficit Disorder Theory [56]. Additionally, it seemed that those who appreciate FB are not inclined to frequent forest for sporting activities. The sample agreed with statements such as “I would never frequent the forest for recreational activities”, and “I would never frequent the forest to engage in sports activities”. The perceived psycho-physical well-being benefit and the rejection of sports activities suggest, as hypothesized, that FB, not yet included in the CICES classification, cannot be classified under any of the existing categories, neither as recreational activities nor purely aesthetic value. Therefore, it is necessary to introduce a specific class for it.
These findings generally align with those of Russell et al. [57], who identified ten key constituents of well-being: physical health, mental health, spirituality, a sense of certainty and security, learning and capability, inspiration and fulfillment of imagination, sense of place, identity and autonomy, connectedness and belonging, and overall subjective wellbeing. Specifically, they corroborate the results of Paletto et al. [27] regarding the perception of Italian users and are confirmed by previous studies carried out in public gardens in both United States [58] and South Korea [59]. These studies have shown that tree species composition and forest management are two key variables influencing the site’s monetary value. Low amounts of deadwood, well-maintained paths, and clean, open areas are forest features preferred by visitors when enjoying recreation activities in general and FB in particular. Furthermore, Uyan’s findings [41] indicated that the primary reason for the WTP value among most respondents is the improvement of their health and psychological well-being. Respondents whose WTP value reason is promoting ecotourism provided low amounts because they want it to be accessible to many. Respondents with health conditions provided a significantly higher mean WTP than healthy individuals.
Finally, based on a comprehensive literature review of 129 potentially relevant articles, Doimo et al. [60] identified four main variables of the forest-well-being relationship: interaction, forest features (e.g., season, settings and management related), sensory dimension of the forest (visual: presence of light filtering through the leaves or landscape; olfactory: smell of moss and other plants; auditory: sound of leaves rustling in the wind or presence of a stream; tactile: sensation of different soil types underfoot; taste: fresh air), and individual traits and reactions (e.g., trait anxiety or stress levels, depressive tendency). A multi-country study assessed the mechanism of natural elements behind the impact of FB on well-being and identified that the natural elements perceived as contributing the most to well-being were sound-related elements [61]. Capturing the opinions and preferences of forest bathers, as undertaken in this and previous research [62], is crucial for managers, training organisations, and guides. This process aids in refining intervention delivery methods, maximizing well-being, and enhancing nature connection, thereby informing better selection and management of forest bathing sites.
5. Conclusions
Cultural ESs provided by nature and forests in particular thanks to FB activity, are pivotal to human well-being [25,59]. Literature across various disciplines has underscored the ways in which nature supports multiple dimensions of well-being, both tangible and intangible. Despite the myriad approaches to studying the relationship between human wellbeing and the environment, the consensus in the literature is that engagement with nature significantly enhances happiness and health. This research represents a preliminary analysis of the demand in the Northern Italy. Its natural follow up is an analysis of supply and economic impact in terms of creating local job opportunities (e.g., professional guides of forest bathing and accommodation for multi-day stays). However, since the evaluation was carried out in a hypothetical context, further investigation are required to estimate the economic value assigned to FB activity in real context and to detect forest bathers’ opinions and preferences which are important for managers to better address the choice of forest bathing sites.
Author Contributions
Conceptualization, F.V., I.B., V.D. and L.I.; methodology, F.V.; formal analysis, investigation, data curation and writing, F.V. and V.D.; review and editing, F.V., I.B., V.D. and L.I.; supervision and funding acquisition, I.B. All authors have read and agreed to the published version of the manuscript.
Funding
This study was funded by the European Union - NextGenerationEU, in the framework of the consortium iNEST - Interconnected Nord-Est Innovation Ecosystem (PNRR, Missione 4 Componente 2, Investimento 1.5 D.D. 1058 23/06/2022, ECS_00000043 – Spoke1, RT2, CUP I43C22000250006). The views and opinions expressed are solely those of the authors and do not necessarily reflect those of the European Union, nor can the European Union be held responsible for them.
Conflicts of Interest
The authors declare no conflicts of interest.
References
- Li, Qing. Shinrin-Yoku: The Art and Science of Forest Bathing; Publisher: Penguin UK, 2018; pp. 320.
- Miyazaki, Y. Shinrin-yoku: the Japanese way of forest bathing for health and relaxation. 1st ed.; Aster-Octopus Publishing Group Limited: London, UK, 2018; pp. 192.
- Hansen, M.M.; Jones, R; Tocchini, K. Shinrin-Yoku (Forest Bathing) and Nature Therapy: A State-of-the-Art Review. Environ. Res. Public Health. July 2017, 14, 851.
- Zhang, Z.; Ye, B. Forest Therapy in Germany, Japan and China: Proposal, Development Status, and Future Prospects. Forests 2022, 13, 1289. [CrossRef]
- Droli, M.; Sigura, M.; Vassallo, F.B.; Droli, G.; Iseppi, L. Evaluating Potential Respiratory Benefits of Forest-Based Experiences: A Regional Scale Approach. Forests 2022, 13-3, 387. [CrossRef]
- Farkic, J.; Isailovic, G.; Taylor, S. Forest bathing as a mindful tourism practice. Annals of Tourism Research Empirical Insights, 2021, 2, 100028. [CrossRef]
- Lazo Álvarez, A.C.; Ednie, A.; Gale-Detrich, T. Contributions of Nature Bathing to Resilience and Sustainability. In Tourism and Conservation-based Development in the Periphery. Natural and Social Sciences of Patagonia; Gale-Detrich, T., Ednie, A., Bosak, K., Eds; Springer: Cham, Switzerland, 2023; pp. 389–408. [CrossRef]
- Hirons, M.; Comberti, C.; Dunford, R. Valuing Cultural Ecosystem Services. Annu. Rev. Environ. Resour. 2016. 41, pp. 545-74.
- Prete, C.; Cozzi, M.; Viccaro, M.; Sijtsma, F.; Romano, S. Foreste e servizi ecosistemici culturali: mappatura su larga scala utilizzando un approccio partecipativo. L’Italia Forestale e Montana. 2020, 75, 3, pp. 119-136. [CrossRef]
- Cheng, X.; Van Damme, S.; Li, L.; Uyttenhove, P. Evaluation of cultural ecosystem services: A review of methods. Ecosystem Services. 2019, 37. [CrossRef]
- Gatto, P.; Vidale, E.; Secco, L.; Pettenella, D. Exploring the willingness to pay for forest ecosystem services by residents of the Veneto Region. Bio-Based and Applied Economics 2013, 3, 1, pp. 21-43. [CrossRef]
- Bateman, I.J.; Mace, G.M.; Fezzi, C.; Atkinson, G.; Turner, K. Economic Analysis for Ecosystem Service Assessments. Environ. Resource Econ. 2011, 48, pp. 177–218. [CrossRef]
- Bateman, I.J.; Turner, R.K. Valuation of the environment, methods and techniques: the contingent valuation method. In Sustainable Environmental Economics and Management. Principles and practice; Turner, R.K., Eds.; Belhaven Press: London, UK, 1993; pp. 120-191.
- Adamowicz, W.L. What’s it worth? An examination of historical trends and future directions in environmental valuation. Australian Journal of Agricultural and Resource Economics 2004, 48, 3, pp. 419-443.
- PEFC. Standard di certificazione dei Servizi Ecosistemici generati da boschi e piantagioni gestiti in maniera sostenibile Versione 0.4; PEFC. https://pefc.it/ (archived on 17th May 2024).
- FSC. Guidance for Demonstrating Ecosystem Services Impacts - FSC-GUI-30-006 V1-1 EN; FSC. https://connect.fsc.org/ (archived on 17th May 2024).
- Immich, G.; Robl, E. Development of Structural Criteria for the Certification and Designation of Recreational and Therapeutic Forests in Bavaria, Germany. Forests 2023, 14, 1273. [CrossRef]
- Binder, S; Haight, R.G.; Polasky, S.; Warziniack, T.; Mockrin, M.H.; Deal, R.L.; Arthaud, G. Assessment and valuation of forest ecosystem services: State of the science review; Gen. Tech. Rep. NRS-170; Newtown Square, PA: U.S. Department of Agriculture, Forest Service, Northern Research Station, USA, 2017; 47 p.
- Haines-Young, R. Common International Classification of Ecosystem Services (CICES) V5.2 and Guidance on the Application of the Revised Structure. Available online: www.cices.eu. 2023 (accessed on 31st May 2024).
- Brander, L.M.; de Groot, R; Guisado Goñi, V.; van’t Hoff, V.; Schägner, P.; Solomonides, S.; McVittie, A.; Eppink, F.; Sposato, M.; Do, L.; Ghermandi, A.; Sinclair, M. Ecosystem Services Valuation Database (ESVD). Foundation for Sustainable Development and Brander Environmental Economics. Available online: https://esvd.net Database Version APR2024V1.1, 2024 (accessed on 30th May 2024).
- Tempesta, T.; Visintin, F.; Marangon F. Ecotourism Demand in North-East Italy, Proceedings of the International Conference on “ Monitoring and Management of Visitor Flows in Recreational and Protected Areas”, Vienna, Austria, 30 January - 2 February 2002, 2002 pp. 373-379.
- Tempesta, T.; Thiene, M. The willingness to pay for the conservation of mountain landscape in Cortina D’Ampezzo (Italy). in Proceeding of 90th EAAE Seminar “Multifunctional Agriculture, policies and markets: understanding the critical linkages”. 2004, Rennes-France.
- Scarpa, R.; Thiene, M. Destination choice models for rock-climbing in the North-Eastern Alps: a latent-class approach based on intensity of preferences. Land Economics 2005, 81, 3, pp. 426-444. [CrossRef]
- Scarpa, R.; Thiene, M.; Tempesta, T. Latent class count models of total visitation demand: days out in the Eastern Alps. Environmental and Resource Economics 2007, 38, 4, pp. 447-460. [CrossRef]
- Thiene, M.; Scarpa, R. Hiking in the Alps: exploring substitution patterns of hiking destinations. Tourism Economics 2008 14, 2, pp. 263-282.
- Paletto, A.; Geitner, C.; Grilli, G.; Hastik, R.; Pastorella, F.; Rodrìguez Garcìa, L. Mapping the Value of Ecosystem Services: A Case Study from the Austrian Alps. 2015 Annals of forest research, 58, 1, pp. 157–175.
- Paletto, A.; Notaro, S.; Sergiacomi, C.; Di Mascio, F. The Economic Value of Forest Bathing: An Example Case of the Italian Alps. Forests 2024, 15, 543. [CrossRef]
- Hirons, M; Comberti, C.; Dunford, Valuing Cultural Ecosystem Services, R. Annu. Rev. Environ. Resour. 2016, 41, PP. 545-574.
- Hermes, J.; Albert., C.; von Haaren, C. Modelling flows of recreational ecosystem services in Germany. Leibniz Universität Hannover, Institute of Environmental Planning, Hannover, Germany. 2013, preprint.
- Müller, A.; Olschewski, R.; Unterberger, C.; Knoke, T. The valuation of forest ecosystem services as a tool for management planning – A choice experiment. Journal of Environmental management, 271. 2020. Scopus. [CrossRef]
- Cerda Jiménez, C.. Valuing biodiversity attributes and water supply using choice experiments: a case study of La Campana Peñuelas Biosphere Reserve, Chile. Environ Monit Assess, 185, pp. 253–266. 2013.
- Plieninger, T.; Bieling, C.; Ohnesorge, B.; Schaich, H.; Schleyer, C.; Wolff, F. Exploring futures of ecosystem services in cultural landscapes through participatory scenario development in the Swabian Alb, Germany. Ecol. Soc. 2013, pp. 18-39.
- Willis, K.G.; Garrod, G.; Scarpa, R.; Powe, N.; Lovett, A.; Bateman, I J.; Hanley, N.; Macmillan, D. Report to Forestry Commission. Social&Environmental Benefits of Forestry Phase 2: The social and enviromental benefits of forests in Great Britain. Centre for Research in Environmental Appraisal & Management University of Newcastle, Newcastle, UK. 2003, p. 34.
- Christie, M.; Hyde, T.; Cooper, R.; Fazey, I.; Dennis, P.; Warren, J.; Colombo S.; Hanley, N. Economic Valuation of the Benefits of Ecosystem Services delivered by the UK Biodiversity Action Plan. Defra Project: NE0112, Final Report, Institute of Biological, Environmental and Rural Sciences, Aberystwyth University, Aberystwyth, Ceredigion, Wales, 2011; p. 164.
- Mourato, S.; Atkinson, G.; Collins, M.; Gibbons S.; MacKerron, G.; Resende, G. Economic analysis of cultural services. UK NEA Economic Analysis Report (Final report). 2010 (Available online: http://uknea.unep-wcmc.org/LinkClick.aspx?fileticket=COKihFXhPpc%3D&tabid=82, accessed on 30th May 2024).
- Yao, N.; Gu, C.; Qi, J.; Shen, S.; Nan, B.;Wang, H. Protecting Rural Large Old Trees with Multi-Scale Strategies: Integrating Spatial Analysis and the Contingent Valuation Method (CVM) for Socio-Cultural Value Assessment. Forests 2024, 15, 18. [CrossRef]
- Busk, H.; Sidenius, U.; Kongstad, L.P.; Corazon, S.S.; Petersen, C.B.; Poulsen, D.V.; Nyed, P.K.; Stigsdotter, U.K. Economic Evaluation of Nature-Based Therapy Interventions—A Scoping Review. Challenges 2022, 13, 23. [CrossRef]
- Pretty, J.; Barton, J. Nature-Based Interventions and Mind–Body Interventions: Saving Public Health Costs Whilst Increasing Life Satisfaction and Happiness. Int. J. Environ. Res. Public Health 2020, 17, 7769. [CrossRef]
- Elsey, H.; Farragher, T.; Tubeuf, S.; Bragg, R.; Elings, M.; Brennan, C.; Gold, R.; Shickle, D.; Wickramasekera, N.; Richardson, Z.; et al. Assessing the impact of care farms on quality of life and offending: A pilot study among probation service users in England. BMJ Open 2018, 8, e019296. [CrossRef]
- CJC Consulting. Branching Out Economic Study Extension. 2016. Available online: https://forestry.gov.scot/images/corporate/pdf/branching-out-report-2016.pdf (accessed on 14 June 2024).
- Uyan, K.G.V. Estimation of Tourists’ Willingness to Pay Entrance Fees for a Forest Bathing Site in the Philippines. Journal of Management and Development Studies 2020, 9 (1), pp. 30-47.
- Mitchell, R.C.; Carson, R.T. Using Surveys to Value Public Goods: The Contingent Valuation Method. The Contingent Valuation Method, 1st ed.; Resources for the Future: Washington, DC, USA, 1989.
- Hanemann, W.M. Welfare evaluations in contingent valuation experiments with discrete responses. Am. J. Agric. Econ. 1984, 66, pp. 332–341. [CrossRef]
- Boyle, K.J. Contingent valuation in practice. In A primer on nonmarket valuation., 2nd ed.; Champ, P.A.; Boyle, K.J.; Brown, T.C., Eds.; Springer, Dordrecht, The Netherlands, 2017; pp. 83-131.
- Kaplan, R.; Kaplan, S. The Experience of Nature: A Psychological Perspective; Cambridge University Press: Cambridge, United Kingdom, 1989. ISBN 978-0-521-34139-4.
- Kellert, S.R. The Biological Basis for Human Values of Nature. In The Biophilia Hypothesis; Kellert, S.R., Wilson, E.O., Eds.; Island Press: Washington DC; pp. 42-69.
- Ulrich, R.S. Aesthetic and affective response to natural environment. In Human Behavior and Environment; Altman, I., Wohlwill, J., Eds.; Plenum Press: New York, 1983; Volume 6, pp. 85-125.
- Ulrich, R.S. Visual Landscapes and Psychological Well-being. Landscape Research 1979, 4, 17-23. [CrossRef]
- Pasini, M.; Berto, R.; Brondino, M.; Hall, R.; Ortner, C. How to Measure the Restorative Quality of Environments: The PRS-11. Procedia - Social and Behavioral Sciences 2014, 159, 293-297. [CrossRef]
- Frey, U.J.; Pirscher, F. Distinguishing protest responses in contingent valuation: A conceptualization of motivations and attitudes behind them. PLoS One. 2019 Jan, 8, 14(1):e0209872. [CrossRef] [PubMed] [PubMed Central]
- Doimo, I.; Masiero, M.; Gatto, P. Forest and Wellbeing: Bridging Medical and Forest Research for Effective Forest-Based Initiatives. Forests 2020, 11, 791. [CrossRef]
- Chaudhry, P.; Tewari, V.P. A Comparison between TCM and CVM in Assessing the Recreational Use Value of Urban Forestry, Commonwealth Forestry Association - The international forestry review, 2006, 8, 4, pp. 439-448.
- Mayor, K.; Scott, S.; Tol, R.S.J. Comparing the travel cost method and the contingent valuation method – An application of convergent validity theory to the recreational value of Irish forests. Dublin: Economic and Social Research Institute, 2007. 21 p. (ESRI Working Paper; 190).
- Hanley, N.D. Valuing rural recreation benefits: An empirical comparison of two approaches. Journal of Agricultural Economics 1989, 40, 3, pp. 361-374. [CrossRef]
- Cropper, M.L.; Oates, W.A. Environmental Economics: A Survey. Journal of economic Literature 1992, 30, pp. 675-740.
- Louv, R. Last Child in the Woods: Saving Our Children from Nature-deficit Disorder, 1st ed.; Algonquin Books: New York, USA, 2005; pp. 390.
- Russell, R.; Guerry, A.D.; Balvanera, P.; Gould, R.K.; Basurto, X.; et al. Humans and nature: how knowing and experiencing nature affect well-being. Annu. Rev. Environ. Resour. 2013, 38, pp. 473–502. [CrossRef]
- Sauerlender, J.P. Design of a Nature-Based Health Intervention: Self-Guided Forest Bathing for Public Gardens. Masters’s Thesis, University of Washington, Washington, DC, USA, 2021.
- Kil, N.; Stein, T.V.; Holland, S.M.; Kim, J.J.; Kim, J.; Petitte, S. The Role of Place Attachment in Recreation Experience and Outcome Preferences among Forest Bathers. J. Outdoor Recreat. Tour. 2021, 35, 100410. [CrossRef]
- Doimo, I.; Masiero, M.; Gatto, P. Forest and Wellbeing: Bridging Medical and Forest Research for Effective Forest-Based Initiatives. Forests 2020, 11, 791. [CrossRef]
- Subirana-Malaret, M.; Miró, A.; Camacho, A.; Gesse, A.; McEwan, K. A Multi-Country Study Assessing the Mechanisms of Natural Elements and Sociodemographics behind the Impact of Forest Bathing on Well-Being. Forests 2023, 14, 904. [CrossRef]
- Guardini, B.; Secco, L.; Moè, A.; Pazzaglia, F.; De Mas, G.; Vegetti, M.; Perrone, R.; Tilman, A.; Renzi, M.; Rapisarda, S. A Three-Day Forest-Bathing Retreat Enhances Positive Affect, Vitality, Optimism, and Gratitude: An Option for Green-Care Tourism in Italy? Forests 2023, 14, 1423. [CrossRef]
- Kotera, Y.; Richardson, M.; Sheffield, D. Effects of Shinrin-Yoku (Forest Bathing) and Nature Therapy on Mental Health: a Systematic Review and Meta-analysis. International Journal of Mental Health and Addiction. 2022, 20, PP. 337–361. [CrossRef]
Figure 1.
Study area.
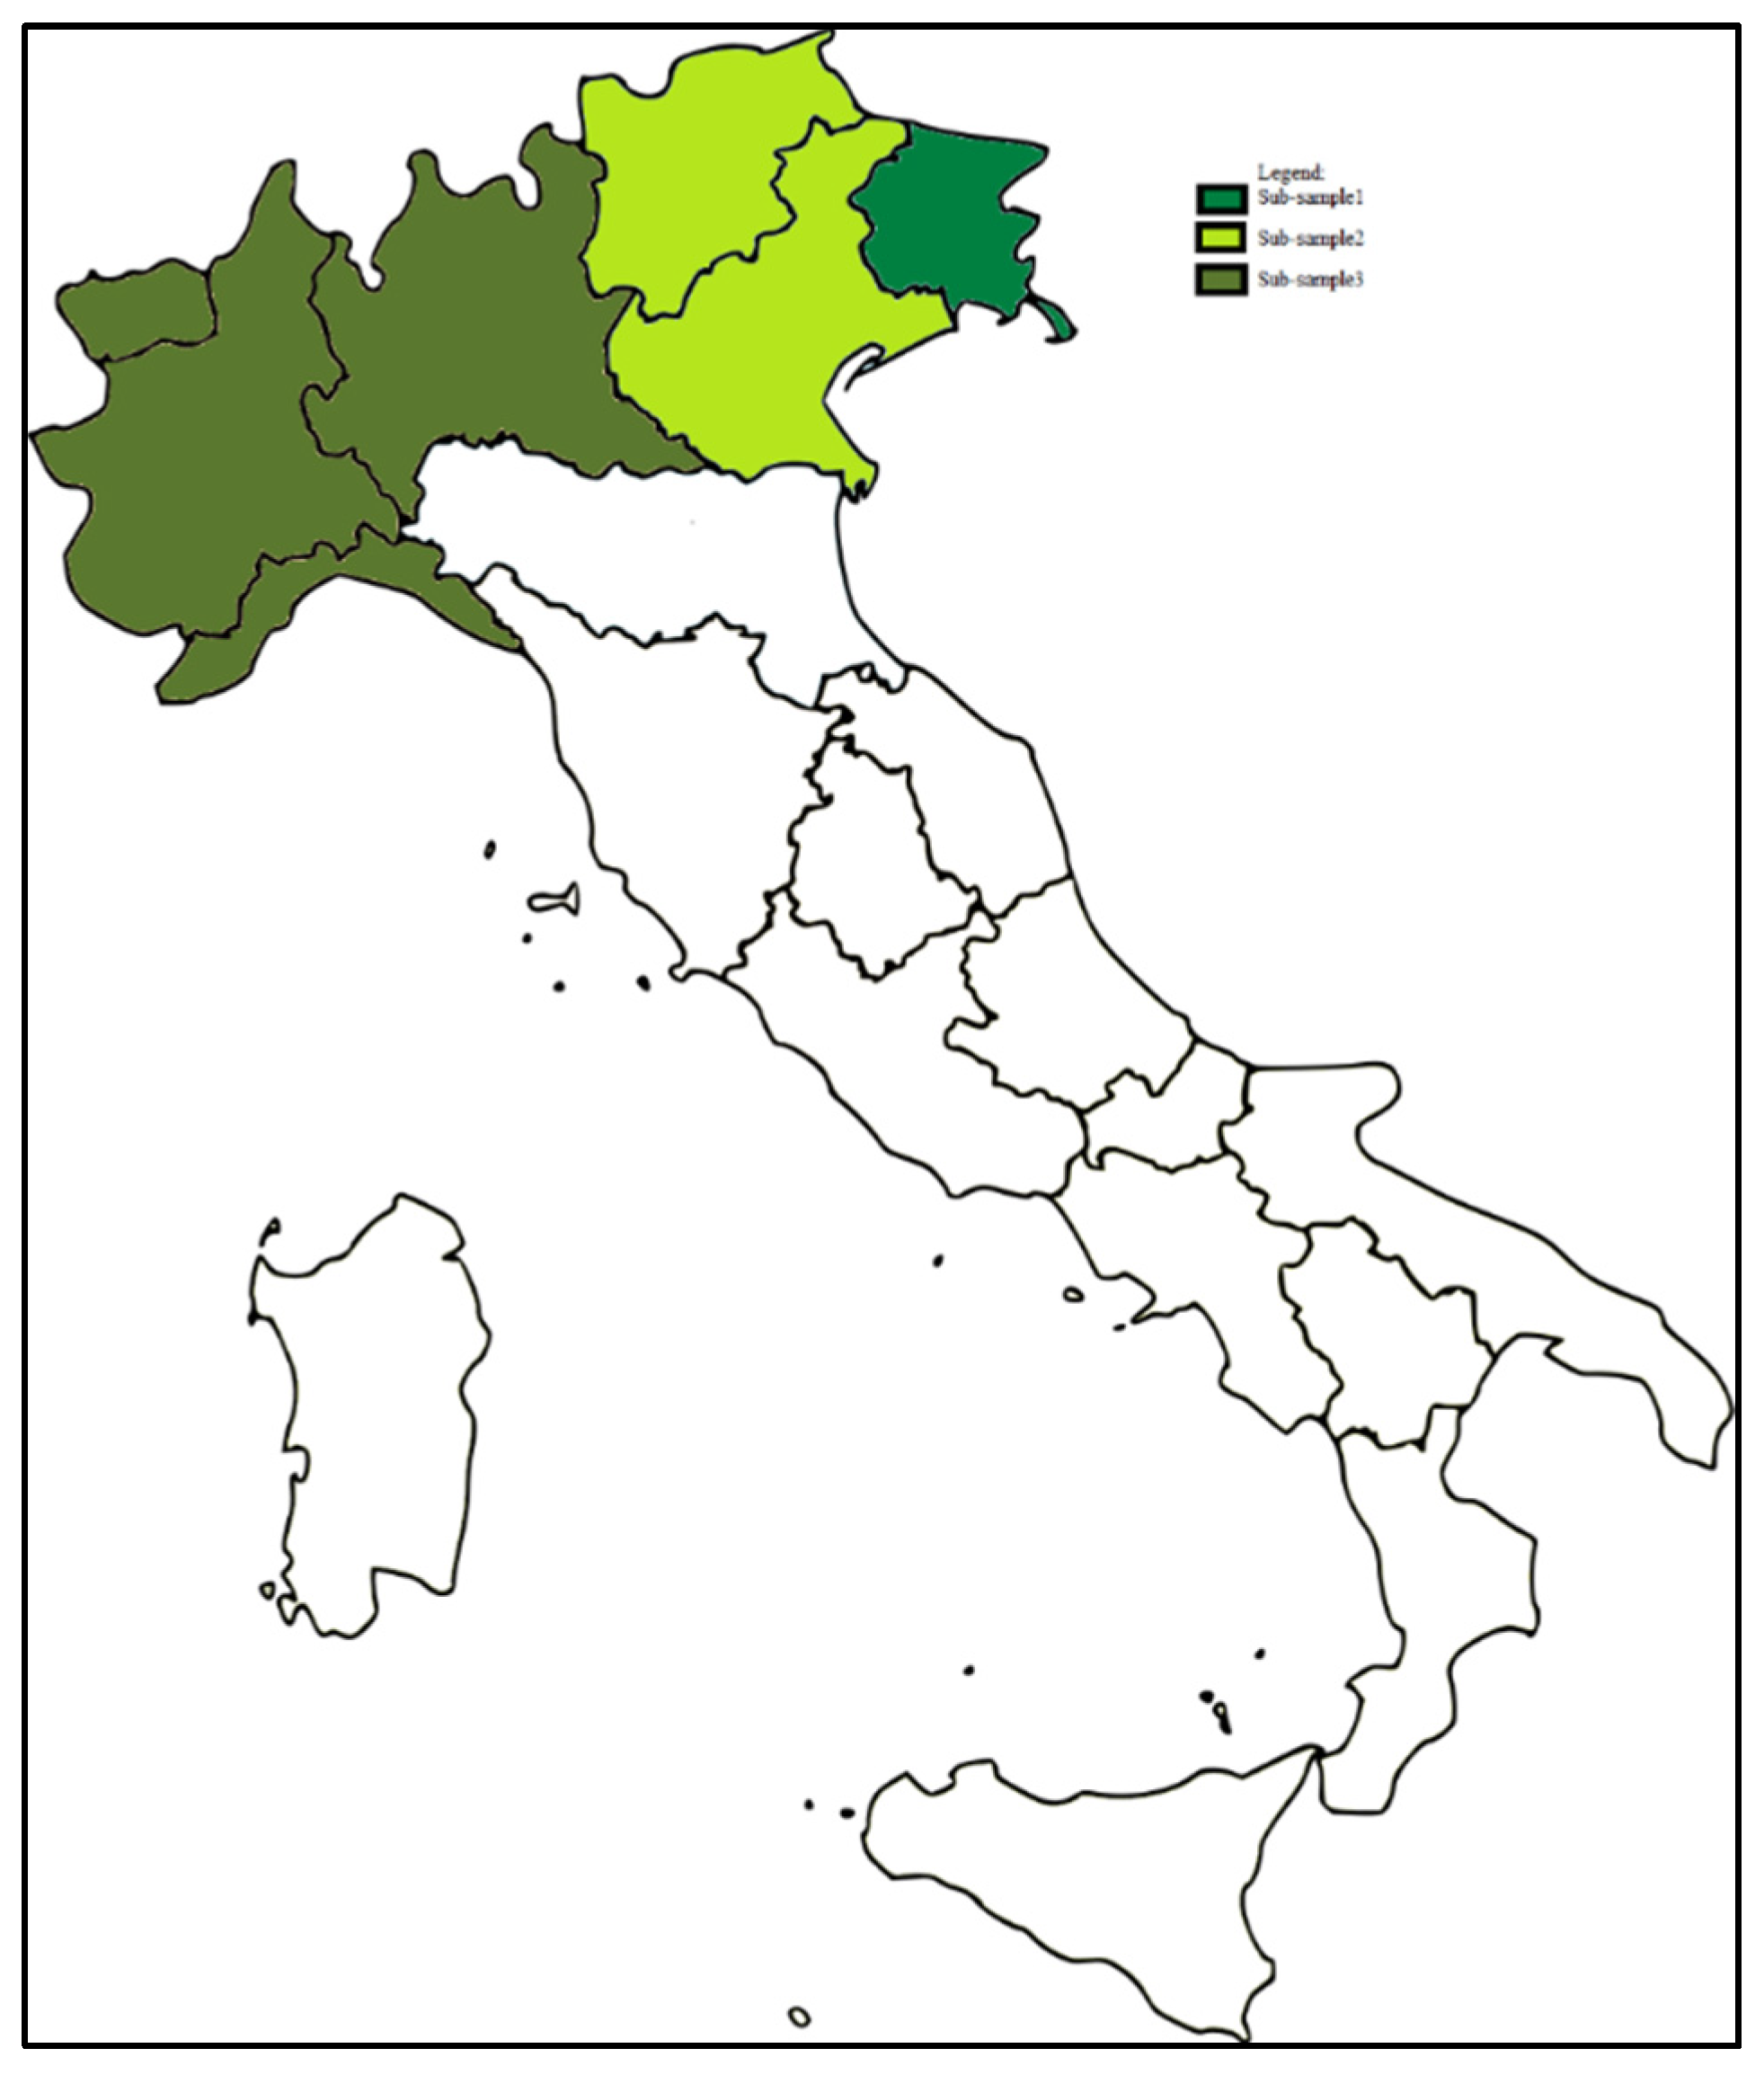
Figure 2.
Landforms types of frequented forest within the sub-samples.
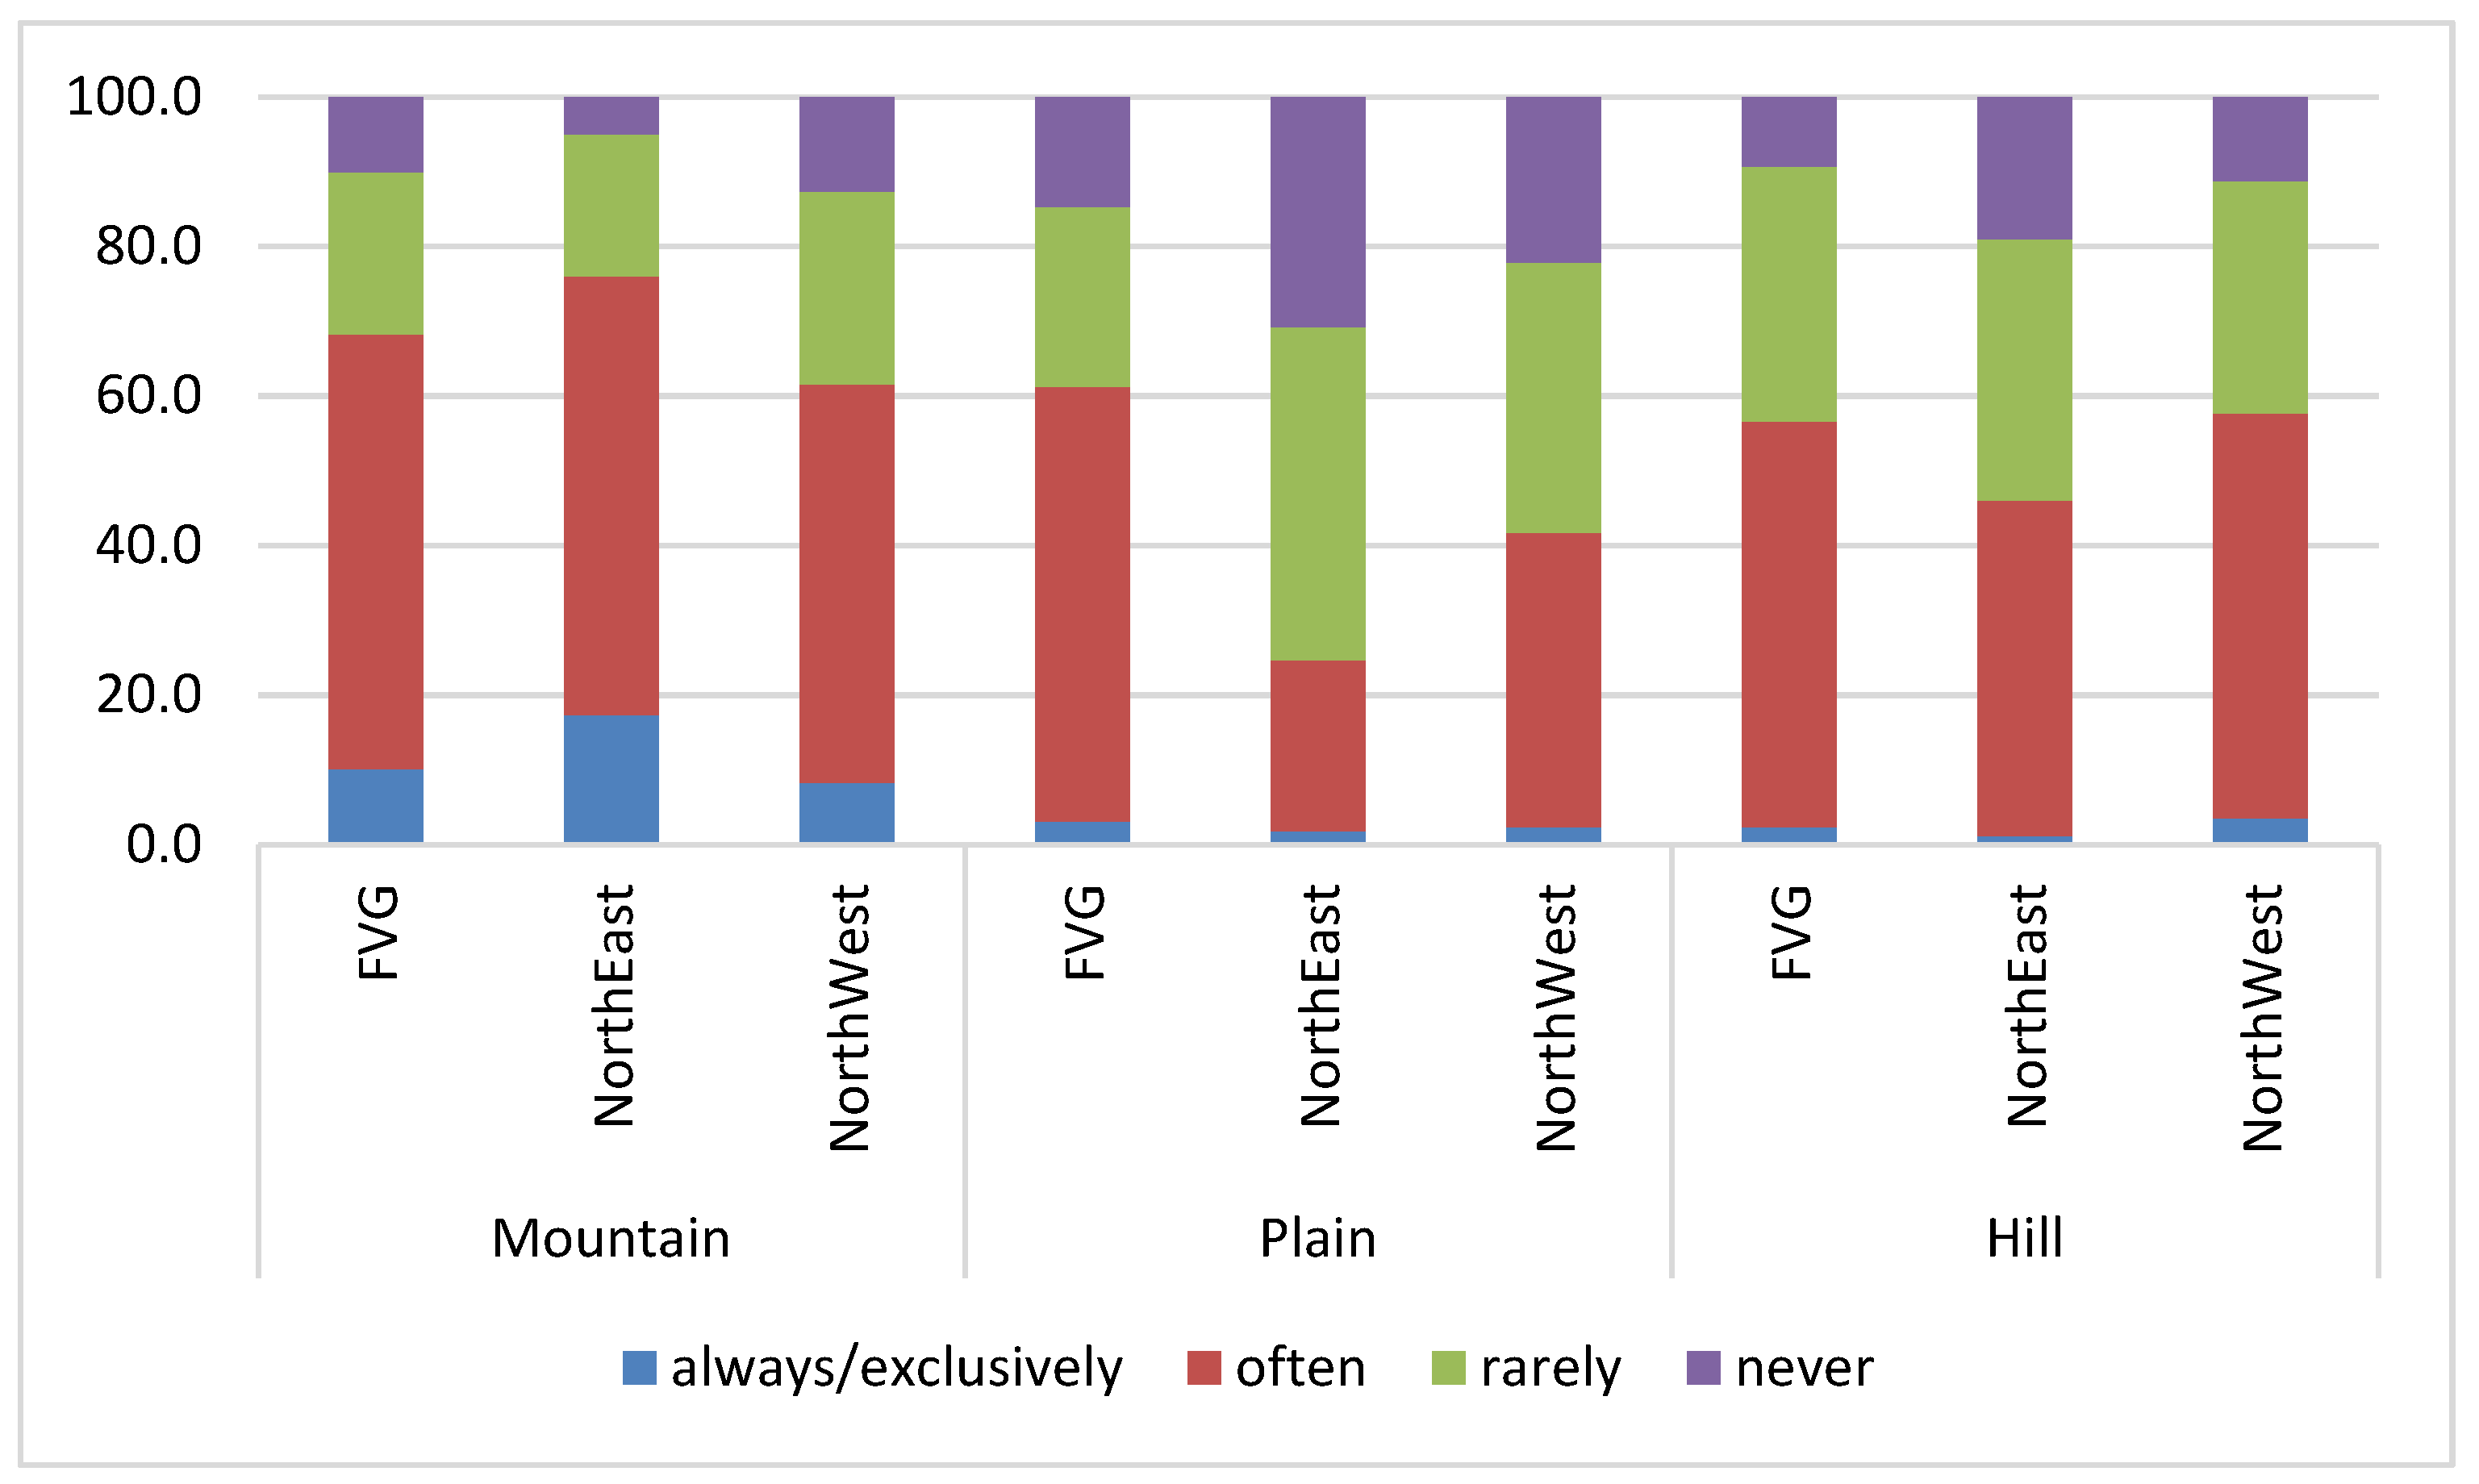
Figure 3.
Preference expressed toward the importance of having forests in which to practice FB.
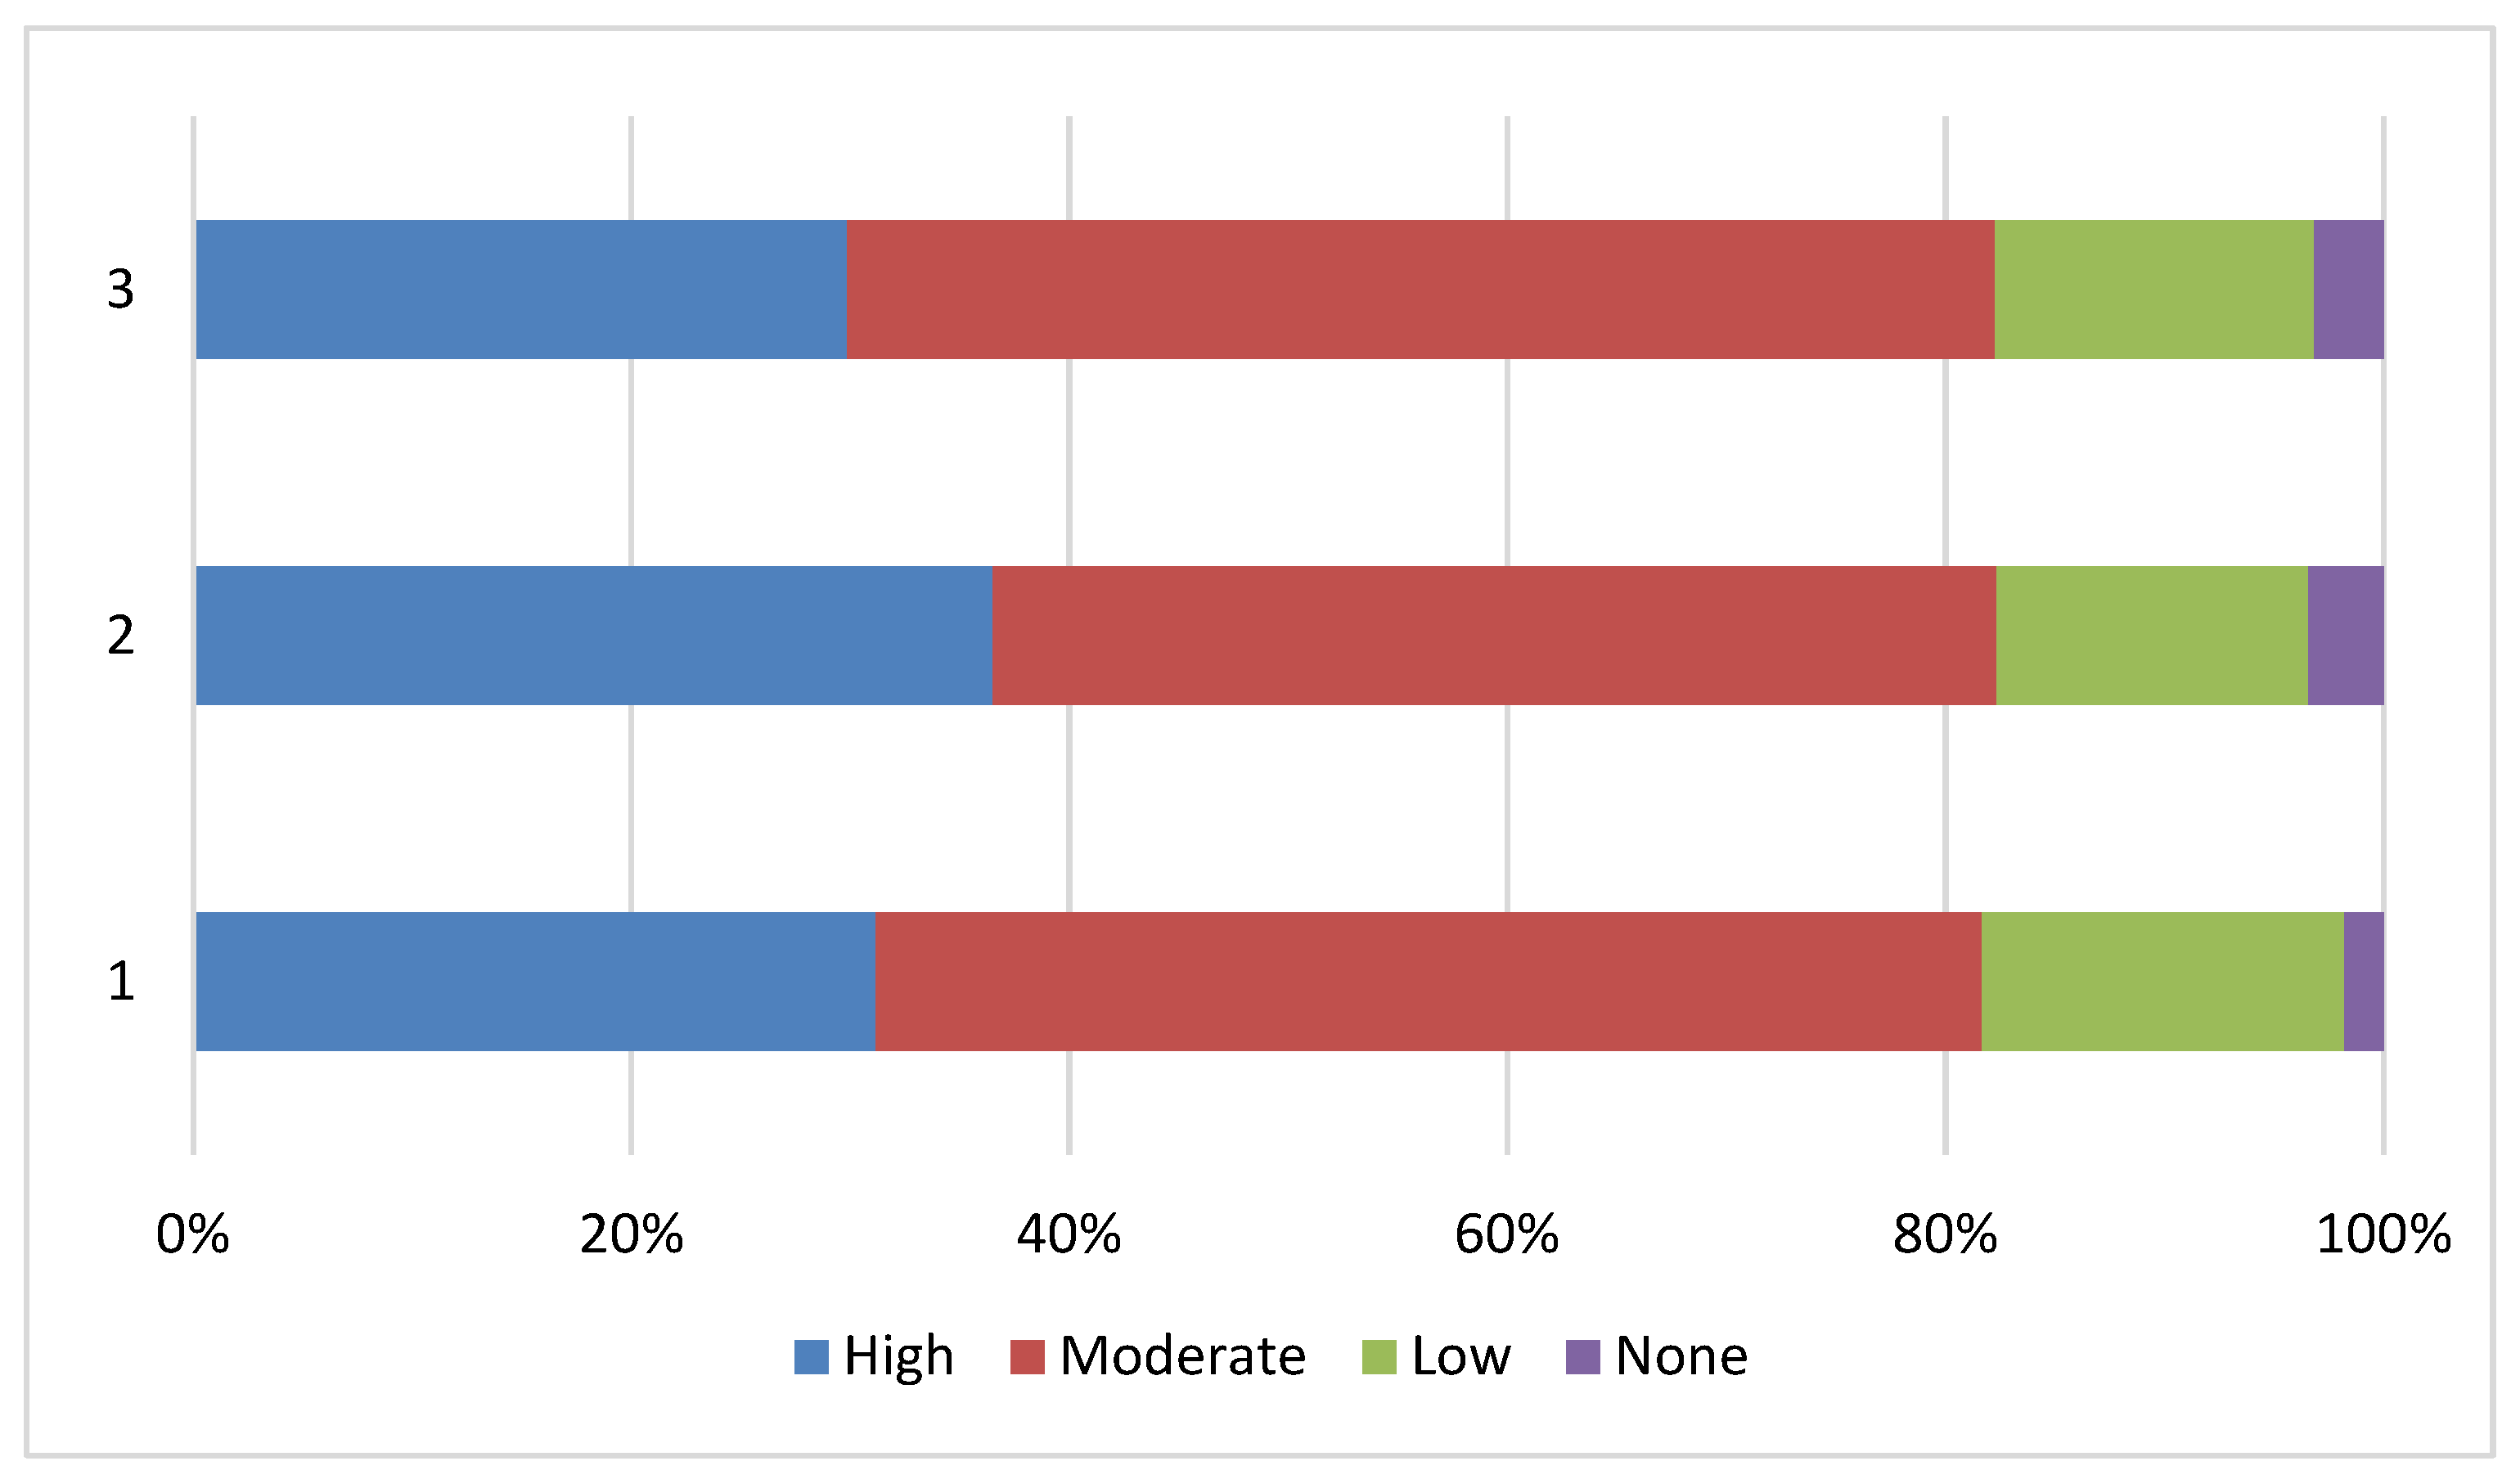

Table 1.
Resident population by age and gender within the three areas on January 1, 2024.
| Age | Friuli Venezia Giulia | Northeast Italy | Northwest Italy | ||||||
| Age group | Male | Female | Total | Male | Female | Total | Male | Female | Total |
| 18-29 | 71.555 | 63.938 | 135.493 | 654.931 | 596.745 | 1.251.676 | 990.159 | 899.476 | 1.889.635 |
| 30-44 | 98.638 | 93.584 | 192.222 | 898.698 | 875.065 | 1.773.763 | 1.387.730 | 1.339.275 | 2.727.005 |
| 45-54 | 92.950 | 93.050 | 186.000 | 818.063 | 817.527 | 1.635.590 | 1.244.076 | 1.237.603 | 2.481.679 |
| 55-64 | 94.781 | 97.102 | 191.883 | 800.253 | 820.943 | 1.621.196 | 1.218.002 | 1.252.829 | 2.470.831 |
| 65-75 | 76.082 | 85.878 | 161.960 | 618.563 | 684.335 | 1.302.898 | 959.493 | 1.072.036 | 2.031.529 |
| 434.006 | 433.552 | 867.558 | 3.790.508 | 3.794.615 | 7.585.123 | 5.799.460 | 5.801.219 | 11.600.679 | |
Table 2.
Sample composition by age and gender within the three areas.
| Age | Friuli Venezia Giulia | Northeast Italy | Northwest Italy | Sample composition | ||||||||
| Group | Male | Female | Total | Male | Female | Total | Male | Female | Total | Male | Female | Total |
| 18-29 | 32 | 38 | 70 | 31 | 38 | 69 | 45 | 26 | 71 | 8,9% | 8,4% | 17,2% |
| 30-44 | 51 | 67 | 118 | 55 | 55 | 110 | 42 | 23 | 65 | 12,2% | 11,9% | 24,1% |
| 45-54 | 51 | 52 | 103 | 47 | 49 | 96 | 42 | 33 | 75 | 11,5% | 11,0% | 22,5% |
| 55-64 | 34 | 29 | 63 | 34 | 46 | 80 | 58 | 55 | 113 | 10,3% | 10,7% | 21,0% |
| 65-75 | 29 | 15 | 44 | 33 | 20 | 53 | 39 | 49 | 88 | 8,3% | 6,9% | 15,2% |
| 197 | 201 | 398 | 200 | 208 | 408 | 226 | 186 | 412 | 51,1% | 48,9% | 100,0% | |
Table 3.
Number of hikes during day trip (DT) and vacation (V) conducted in forests visited during the past 5 years in northern Italian regions divided by sub-sample.
Table 3.
Number of hikes during day trip (DT) and vacation (V) conducted in forests visited during the past 5 years in northern Italian regions divided by sub-sample.
| Sub-sample of destination | |||||||||||||||||||||
| Sub-sample 1 | Sub-sample 2 | Sub-sample 3 | |||||||||||||||||||
| Friuli VG | Veneto | Aut.Prov. Trento | Aut.Prov. Bolzano | Lombardy | Piedmont | Aosta Valley | Liguria | Total | |||||||||||||
| Sub-sample of origin | DT | V | DT | V | DT | V | DT | V | DT | V | DT | V | DT | V | DT | V | DT | V | |||
| Sub-sample 1 | Friuli VG | 12.0 | 2.7 | 1.9 | 1.0 | 0.7 | 0.7 | 0.6 | 0.9 | 0.5 | 0.6 | 0.2 | 0.3 | 0.3 | 0.2 | 0.2 | 0.2 | 16.3 | 6.5 | ||
| Sub-sample 2 | Veneto | 1.3 | 0.7 | 8.8 | 2.9 | 2.3 | 1.4 | 1.7 | 1.2 | 0.5 | 0.4 | 0.2 | 0.2 | 0.4 | 0.2 | 0.2 | 0.2 | 15.4 | 7.3 | ||
| Aut.Prov. Trento | 1.4 | 0.7 | 0.9 | 1.1 | 2.4 | 1.3 | 18.1 | 1.9 | 0.3 | 0.3 | 0.1 | 0.2 | 0.1 | 0.2 | 0.2 | 0.6 | 23.5 | 6.3 | |||
| Aut.Prov. Bolzano | 0.7 | 0.6 | 2.2 | 0.9 | 25.0 | 2.9 | 8.1 | 2.4 | 0.7 | 0.4 | 0.2 | 0.3 | 0.1 | 0.2 | 0.1 | 0.0 | 37.2 | 7.8 | |||
| Sub-sample 3 | Lombardy | 0.5 | 0.6 | 0.9 | 0.8 | 1.0 | 1.8 | 0.6 | 1.2 | 10.1 | 2.9 | 1.2 | 0.8 | 0.8 | 0.9 | 0.7 | 0.8 | 15.8 | 9.8 | ||
| Piedmont | 0.1 | 0.1 | 0.1 | 0.2 | 0.2 | 0.2 | 0.4 | 0.4 | 0.9 | 0.4 | 13.9 | 3.7 | 3.3 | 1.9 | 1.7 | 1.9 | 20.6 | 8.8 | |||
| Aosta Valley | 0.1 | 0.1 | 0.0 | 0.1 | 0.0 | 0.0 | 0.0 | 0.0 | 0.0 | 0.3 | 4.1 | 0.6 | 21.3 | 0.0 | 0.1 | 0.6 | 25.6 | 1.8 | |||
| Liguria | 0.1 | 0.2 | 0.3 | 0.3 | 0.7 | 0.5 | 0.9 | 0.7 | 0.9 | 2.6 | 3.2 | 3.1 | 0.8 | 1.1 | 10.7 | 3.7 | 17.7 | 12.2 | |||
| Total | 16.3 | 5.6 | 15.1 | 7.4 | 32.2 | 8.8 | 30.4 | 8.8 | 13.8 | 7.7 | 23.2 | 9.2 | 27.1 | 4.8 | 14.0 | 8.0 | |||||
Table 4.
Outbound tourism - percentage of hikes during day trip (DT) and vacation (V) conducted in forests visited during the past 5 years in northern Italian regions divided by sub-sample.
Table 4.
Outbound tourism - percentage of hikes during day trip (DT) and vacation (V) conducted in forests visited during the past 5 years in northern Italian regions divided by sub-sample.
| Sub-sample of destination | |||||||||||||||||||||
| Sub-sample 1 | Sub-sample 2 | Sub-sample 3 | |||||||||||||||||||
| Friuli VG | Veneto | Aut.Prov. Trento | Aut.Prov. Bolzano | Lombardy | Piedmont | Aosta Valley | Liguria | Total | |||||||||||||
| Sub-sample of origin | DT | V | DT | V | DT | V | DT | V | DT | V | DT | V | DT | V | DT | V | DT | V | |||
| Sub-sample 1 | Friuli VG | 72.7 | 38.5 | 12.1 | 15.4 | 3.0 | 7.7 | 3.0 | 15.4 | 3.0 | 7.7 | 0.0 | 7.7 | 3.0 | 0.0 | 0.0 | 0.0 | 100.0 | 100.0 | ||
| Sub-sample 2 | Veneto | 9.7 | 6.7 | 58.1 | 40.0 | 16.1 | 20.0 | 9.7 | 13.3 | 3.2 | 6.7 | 0.0 | 0.0 | 3.2 | 0.0 | 0.0 | 0.0 | 100.0 | 100.0 | ||
| Aut.Prov. Trento | 6.4 | 7.7 | 4.3 | 15.4 | 10.6 | 23.1 | 76.6 | 30.8 | 2.1 | 7.7 | 0.0 | 0.0 | 0.0 | 0.0 | 0.0 | 7.7 | 100.0 | 100.0 | |||
| Aut.Prov. Bolzano | 1.4 | 6.3 | 5.4 | 12.5 | 67.6 | 37.5 | 21.6 | 31.3 | 1.4 | 6.3 | 0.0 | 6.3 | 0.0 | 0.0 | 0.0 | 0.0 | 100.0 | 100.0 | |||
| Sub-sample 3 | Lombardy | 3.1 | 5.0 | 6.3 | 10.0 | 6.3 | 20.0 | 3.1 | 10.0 | 62.5 | 30.0 | 6.3 | 10.0 | 6.3 | 10.0 | 3.1 | 10.0 | 100.0 | 100.0 | ||
| Piedmont | 0.0 | 0.0 | 0.0 | 0.0 | 0.0 | 0.0 | 2.4 | 5.6 | 4.9 | 5.6 | 68.3 | 38.9 | 17.1 | 22.2 | 7.3 | 22.2 | 100.0 | 100.0 | |||
| Aosta Valley | 0.0 | 0.0 | 0.0 | 0.0 | 0.0 | 0.0 | 0.0 | 0.0 | 0.0 | 25.0 | 15.7 | 25.0 | 84.3 | 0.0 | 0.0 | 25.0 | 100.0 | 100.0 | |||
| Liguria | 0.0 | 0.0 | 2.9 | 4.2 | 2.9 | 4.2 | 5.7 | 4.2 | 5.7 | 20.8 | 17.1 | 25.0 | 5.7 | 8.3 | 60.0 | 29.2 | 100.0 | 100.0 | |||
Table 5.
Inbound tourism flow - percentage of hikes during day trip (DT) and vacation (V) conducted in forests visited during the past 5 years in northern Italian regions divided by sub-sample.
Table 5.
Inbound tourism flow - percentage of hikes during day trip (DT) and vacation (V) conducted in forests visited during the past 5 years in northern Italian regions divided by sub-sample.
| Sub-sample of destination | |||||||||||||||||||
| Sub-sample 1 | Sub-sample 2 | Sub-sample 3 | |||||||||||||||||
| Friuli VG | Veneto | Aut.Prov. Trento | Aut.Prov. Bolzano | Lombardy | Piedmont | Aosta Valley | Liguria | ||||||||||||
| Sub-sample of origin | DT | V | DT | V | DT | V | DT | V | DT | V | DT | V | DT | V | DT | V | |||
| Sub-sample 1 | Friuli VG | 75.0 | 55.6 | 12.9 | 13.3 | 1.6 | 5.6 | 1.7 | 11.8 | 3.6 | 5.9 | 0.0 | 5.6 | 1.8 | 0.0 | 0.0 | 0.0 | ||
| Sub-sample 2 | Veneto | 9.4 | 11.1 | 58.1 | 40.0 | 7.8 | 16.7 | 5.0 | 11.8 | 3.6 | 5.9 | 0.0 | 0.0 | 1.8 | 0.0 | 0.0 | 0.0 | ||
| Aut.Prov. Trento | 9.4 | 11.1 | 6.5 | 13.3 | 7.8 | 16.7 | 60.0 | 23.5 | 3.6 | 5.9 | 0.0 | 0.0 | 0.0 | 0.0 | 0.0 | 6.7 | |||
| Aut.Prov. Bolzano | 3.1 | 11.1 | 12.9 | 13.3 | 78.1 | 33.3 | 26.7 | 29.4 | 3.6 | 5.9 | 0.0 | 5.6 | 0.0 | 0.0 | 0.0 | 0.0 | |||
| Sub-sample 3 | Lombardy | 3.1 | 11.1 | 6.5 | 13.3 | 3.1 | 22.2 | 1.7 | 11.8 | 71.4 | 35.3 | 4.5 | 11.1 | 3.6 | 25.0 | 4.0 | 13.3 | ||
| Piedmont | 0.0 | 0.0 | 0.0 | 0.0 | 0.0 | 0.0 | 1.7 | 5.9 | 7.1 | 5.9 | 63.6 | 38.9 | 12.5 | 50.0 | 12.0 | 26.7 | |||
| Aosta Valley | 0.0 | 0.0 | 0.0 | 0.0 | 0.0 | 0.0 | 0.0 | 0.0 | 0.0 | 5.9 | 18.2 | 5.6 | 76.8 | 0.0 | 0.0 | 6.7 | |||
| Liguria | 0.0 | 0.0 | 3.2 | 6.7 | 1.6 | 5.6 | 3.3 | 5.9 | 7.1 | 29.4 | 13.6 | 33.3 | 3.6 | 25.0 | 84.0 | 46.7 | |||
| Total | 100.0 | 100.0 | 100.0 | 100.0 | 100.0 | 100.0 | 100.0 | 100.0 | 100.0 | 100.0 | 100.0 | 100.0 | 100.0 | 100.0 | 100.0 | 100.0 | |||
Table 6.
Statements describing FB factors and average feelings perceived.
| FB factor | n. | Statement | Mean |
| Well-being | 1 | I frequent the forests because the air is healthy | 8,0 |
| Fascination | 2 | I like forests that can be explored | 7,7 |
| Well-being | 3 | The forest environment scares me | 2,7 |
| Being away | 4 | I really like to immerse myself in the forests because it is a refuge from daily worries | 7,1 |
| Coherence | 5 | I like forests where there are diverse trees (in species, height and age) and the undergrowth is rich but does not obstruct the view | 7,6 |
| Well-being | 6 | I only like forests that are easily accessible (e.g., availability of parking, no gates and/or obstacles) | 5,7 |
| Well-being | 7 | I like to walk in the forests without exerting myself | 6,9 |
| Being away | 8 | I frequent the forests because I have little contact with nature in my daily life | 6,3 |
| Fascination | 9 | I like the forest when there are several interesting things that attract my attention (e.g., streams, rocks, cliffs, old trees) | 7,8 |
| Well-being | 10 | Immersing myself in the forests creates positive emotion for me | 8,2 |
| Coherence | 11 | I like to frequent the forest when there is a clear order in the physical layout of the place | 5.9, 5.4, 5.7* |
| Fascination | 12 | I like the forests because it is an environment that fascinates me | 7,9 |
| Scope | 13 | I would never frequent the forest for recreational activities | 3,0 |
| Well-being | 14 | I frequent the forests for health reasons (e.g., I activate metabolism, improve mood and sleep quality) | 6,5 |
| Well-being | 15 | Contact with nature makes me uncomfortable | 1.9, 1.4, 1.7* |
| Scope | 16 | I would never frequent the forest to engage in sports activities | 3.2, 2.6, 3.0 |
| * the means refer to Sub-sample 1, 2, and 3 respectively | |||
Table 7.
Percentage, total and average hikes conducted within the region of origin-Friuli Venezia Giulia by age of group.
Table 7.
Percentage, total and average hikes conducted within the region of origin-Friuli Venezia Giulia by age of group.
| Friuli Venezia Giulia | |||||||||||||||||||||
| Age group | Annual FB hikes | Inhabitants | Hikes | ||||||||||||||||||
| 0 | 1 | 2 | 3 | 4 | 5 | 6 | 7 | 8 | 9 | 10 | 11 | 12 | 13 | 14 | 15 | 16 | Total | 01.01.2024 | Total | Average | |
| 18-29 | 2.5% | 2.8% | 2.8% | 4.7% | 1.4% | 2.2% | 0.0% | 0.0% | 0.3% | 0.0% | 0.8% | 0.0% | 1.1% | 0.0% | 0.0% | 0.0% | 0.0% | 18.7% | 135,493 | 85,674 | 0.6 |
| 30-44 | 1.9% | 4.7% | 7.2% | 4.5% | 1.9% | 5.3% | 0.6% | 0.0% | 1.4% | 0.0% | 1.7% | 0.0% | 1.9% | 0.0% | 0.0% | 0.0% | 0.0% | 31.2% | 192,222 | 233,451 | 1.2 |
| 45-54 | 2.5% | 3.3% | 3.9% | 1.9% | 2.5% | 4.2% | 1.1% | 0.6% | 0.6% | 0.0% | 1.9% | 0.0% | 1.4% | 0.0% | 0.3% | 0.6% | 0.3% | 25.1% | 186,000 | 215,532 | 1.2 |
| 55-64 | 1.4% | 2.5% | 1.7% | 0.8% | 1.7% | 2.2% | 0.6% | 0.3% | 0.8% | 0.0% | 2.8% | 0.0% | 0.3% | 0.0% | 0.0% | 0.0% | 0.0% | 15.0% | 191,883 | 133,089 | 0.7 |
| 65-74 | 2.5% | 1.4% | 2.8% | 0.8% | 0.6% | 0.6% | 0.0% | 0.0% | 0.0% | 0.0% | 0.8% | 0.0% | 0.6% | 0.0% | 0.0% | 0.0% | 0.0% | 10.0% | 161,960 | 47,821 | 0.3 |
| 10.9% | 14.8% | 18.4% | 12.8% | 8.1% | 14.5% | 2.2% | 0.8% | 3.1% | 0.0% | 8.1% | 0.0% | 5.3% | 0.0% | 0.3% | 0.6% | 0.3% | 100.0% | 867,558 | 715,566 | 0.8 | |
Table 8.
Percentage, total and average hikes conducted within the region of origin-Northeast Italy by age of group.
Table 8.
Percentage, total and average hikes conducted within the region of origin-Northeast Italy by age of group.
| Northeast Italy | |||||||||||||||||||||
| Age group | Annual FB hikes | Inhabitants | Hikes | ||||||||||||||||||
| 0 | 1 | 2 | 3 | 4 | 5 | 6 | 7 | 8 | 9 | 10 | 11 | 12 | 13 | 14 | 15 | 16 | Total | 01.01.2024 | Total | Average | |
| 18-29 | 1.3% | 4.0% | 4.0% | 1.9% | 0.3% | 3.2% | 1.1% | 0.0% | 0.0% | 0.0% | 1.1% | 0.0% | 0.3% | 0.0% | 0.0% | 0.0% | 0.0% | 17.2% | 1,251,676 | 693,132 | 0.6 |
| 30-44 | 3.2% | 4.8% | 3.2% | 3.2% | 2.4% | 3.2% | 1.1% | 0.0% | 1.6% | 0.3% | 2.2% | 0.0% | 1.3% | 0.0% | 0.0% | 1.1% | 0.0% | 27.7% | 1,773,763 | 2,169,522 | 1.2 |
| 45-54 | 1.6% | 3.8% | 4.6% | 1.3% | 2.2% | 4.3% | 0.0% | 0.0% | 0.5% | 0.3% | 3.2% | 0.0% | 0.8% | 0.0% | 0.0% | 0.0% | 0.0% | 22.6% | 1,635,590 | 1,565,242 | 1.0 |
| 55-64 | 3.0% | 1.3% | 3.2% | 2.7% | 0.5% | 3.8% | 0.8% | 0.8% | 0.8% | 0.0% | 2.7% | 0.0% | 0.5% | 0.0% | 0.0% | 0.0% | 0.0% | 20.2% | 1,621,196 | 1,412,009 | 0.9 |
| 65-74 | 1.3% | 1.1% | 3.2% | 1.1% | 0.8% | 1.1% | 1.1% | 0.0% | 0.8% | 0.0% | 1.6% | 0.0% | 0.3% | 0.0% | 0.0% | 0.0% | 0.0% | 12.4% | 1,302,898 | 672,463 | 0.5 |
| 10.5% | 15.1% | 18.3% | 10.2% | 6.2% | 15.6% | 4.0% | 0.8% | 3.8% | 0.5% | 10.8% | 0.0% | 3.2% | 0.0% | 0.0% | 1.1% | 0.0% | 100.0% | 7,585,123 | 6,512,369 | 0.9 | |
Table 9.
Percentage, total and average hikes conducted within the region of origin-Northwest Italy by age of group.
Table 9.
Percentage, total and average hikes conducted within the region of origin-Northwest Italy by age of group.
| Northwest Italy | |||||||||||||||||||||
| Age group | Annual FB hikes | Inhabitants | Hikes | ||||||||||||||||||
| 0 | 1 | 2 | 3 | 4 | 5 | 6 | 7 | 8 | 9 | 10 | 11 | 12 | 13 | 14 | 15 | 16 | Total | 01.01.2024 | Total | Average | |
| 18-29 | 1.6% | 2.6% | 3.4% | 3.2% | 0.5% | 1.6% | 0.8% | 0.5% | 0.5% | 0.0% | 1.6% | 0.0% | 1.3% | 0.0% | 0.0% | 0.3% | 0.0% | 18.0% | 1,889,635 | 1,464,717 | 0.8 |
| 30-44 | 1.3% | 2.4% | 3.2% | 1.6% | 1.6% | 1.9% | 0.3% | 0.0% | 0.3% | 0.0% | 2.9% | 0.0% | 0.0% | 0.0% | 0.0% | 0.0% | 0.0% | 15.3% | 2,727,005 | 1,688,146 | 0.6 |
| 45-54 | 2.1% | 2.4% | 2.6% | 2.4% | 1.1% | 3.4% | 1.3% | 0.3% | 0.5% | 0.3% | 0.3% | 0.0% | 0.8% | 0.0% | 0.0% | 0.3% | 0.0% | 17.7% | 2,481,679 | 1,706,975 | 0.7 |
| 55-64 | 3.7% | 3.2% | 4.8% | 2.1% | 2.6% | 4.2% | 1.3% | 0.3% | 0.0% | 0.3% | 2.9% | 0.0% | 1.1% | 0.0% | 0.0% | 0.8% | 0.0% | 27.2% | 2,470,831 | 2,882,636 | 1.2 |
| 65-74 | 3.2% | 0.8% | 3.7% | 2.4% | 2.6% | 2.1% | 1.3% | 0.5% | 0.8% | 0.3% | 3.2% | 0.0% | 0.8% | 0.0% | 0.0% | 0.0% | 0.0% | 21.7% | 2,031,529 | 1,993,908 | 1.0 |
| 11.9% | 11.4% | 17.7% | 11.6% | 8.5% | 13.2% | 5.0% | 1.6% | 2.1% | 0.8% | 10.8% | 0.0% | 4.0% | 0.0% | 0.0% | 1.3% | 0.0% | 100.0% | 11,600,679 | 9,736,382 | 0.8 | |
Table 10.
Percentage, total and average hikes conducted out of the region of origin-Friuli Venezia Giulia by age of group.
Table 10.
Percentage, total and average hikes conducted out of the region of origin-Friuli Venezia Giulia by age of group.
| Friuli Venezia Giulia | ||||||||||||||||
| Age group | Annual FB hikes | Inhabitants | Hikes | |||||||||||||
| 0 | 1 | 2 | 3 | 4 | 5 | 6 | 7 | 8 | 9 | 10 | 11 | Total | 01.01.2024 | Total | Average | |
| 18-29 | 5.4% | 2.2% | 4.6% | 3.0% | 0.5% | 1.3% | 0.3% | 0.5% | 0.0% | 0.0% | 17.8% | 135,493 | 47,477 | 0.4 | ||
| 30-44 | 8.4% | 8.9% | 4.9% | 2.7% | 0.8% | 2.7% | 0.5% | 0.3% | 0.0% | 1.1% | 30.2% | 192,222 | 114,504 | 0.6 | ||
| 45-54 | 8.1% | 6.2% | 4.0% | 1.3% | 1.1% | 2.2% | 0.3% | 0.0% | 0.3% | 2.2% | 25.6% | 186,000 | 109,795 | 0.6 | ||
| 55-64 | 5.7% | 3.5% | 1.3% | 1.3% | 0.5% | 1.6% | 0.3% | 0.0% | 0.0% | 1.6% | 15.9% | 191,883 | 73,443 | 0.4 | ||
| 65-74 | 5.7% | 1.3% | 0.8% | 1.3% | 0.0% | 0.8% | 0.0% | 0.0% | 0.0% | 0.5% | 10.5% | 161,960 | 26,630 | 0.2 | ||
| 33.2% | 22.1% | 15.6% | 9.7% | 3.0% | 8.6% | 1.3% | 0.0% | 0.8% | 0.3% | 5.4% | 0.0% | 100.0% | 867,558 | 371,849 | 0.4 | |
Table 11.
Percentage, total and average hikes conducted out of the region of origin-Northeast Italy by age of group.
Table 11.
Percentage, total and average hikes conducted out of the region of origin-Northeast Italy by age of group.
| Northeast Italy | |||||||||||||||||
| Age group | Annual FB hikes | Inhabitants | Hikes | ||||||||||||||
| 0 | 1 | 2 | 3 | 4 | 5 | 6 | 7 | 8 | 9 | 10 | 11 | Total | 01.01.2024 | Total | Average | ||
| 18-29 | 3.9% | 3.9% | 3.4% | 2.6% | 0.0% | 1.0% | 0.5% | 0.5% | 0.3% | 1.3% | 17.4% | 1,251,676 | 568,944 | 0.5 | |||
| 30-44 | 5.5% | 6.0% | 7.0% | 2.1% | 1.0% | 2.3% | 0.5% | 0.0% | 0.0% | 2.3% | 26.8% | 1,773,763 | 1,216,295 | 0.7 | |||
| 45-54 | 4.9% | 6.5% | 3.4% | 2.3% | 1.0% | 1.3% | 0.5% | 0.3% | 0.0% | 2.3% | 22.6% | 1,635,590 | 968,609 | 0.6 | |||
| 55-64 | 6.0% | 2.1% | 3.4% | 3.6% | 0.3% | 2.3% | 0.5% | 0.0% | 0.3% | 1.3% | 19.7% | 1,621,196 | 821,125 | 0.5 | |||
| 65-74 | 3.4% | 1.6% | 3.4% | 1.0% | 0.3% | 0.5% | 0.3% | 0.0% | 0.5% | 2.6% | 13.5% | 1,302,898 | 609,147 | 0.5 | |||
| 23.6% | 20.0% | 20.5% | 11.7% | 2.6% | 7.5% | 2.3% | 0.8% | 1.0% | 0.0% | 9.9% | 0.0% | 100.0% | 7,585,123 | 4,184,120 | 0.6 | ||
Table 12.
Percentage, total and average hikes conducted out of the region of origin-Northwest Italy by age of group.
Table 12.
Percentage, total and average hikes conducted out of the region of origin-Northwest Italy by age of group.
| Northwest Italy | ||||||||||||||||||
| Age | Annual FB hikes | Inhabitants | Hikes | |||||||||||||||
| group | 0 | 1 | 2 | 3 | 4 | 5 | 6 | 7 | 8 | 9 | 10 | 11 | Total | 01.01.2024 | Total | Average | ||
| 18-29 | 2.8% | 1.8% | 6.3% | 2.3% | 1.0% | 2.0% | 0.3% | 0.0% | 0.8% | 0.0% | 0.0% | 17.2% | 1,889,635 | 813,261 | 0.4 | |||
| 30-44 | 4.3% | 2.5% | 1.8% | 1.8% | 1.0% | 1.8% | 0.3% | 0.0% | 0.0% | 0.0% | 2.8% | 16.2% | 2,727,005 | 1,463,608 | 0.5 | |||
| 45-54 | 4.3% | 4.3% | 2.0% | 1.0% | 1.0% | 1.5% | 1.0% | 0.0% | 0.0% | 0.3% | 2.0% | 17.5% | 2,481,679 | 1,281,677 | 0.5 | |||
| 55-64 | 5.8% | 4.1% | 7.8% | 1.8% | 1.5% | 2.3% | 1.0% | 0.5% | 0.0% | 0.5% | 2.3% | 27.6% | 2,470,831 | 1,964,154 | 0.8 | |||
| 65-74 | 6.3% | 2.8% | 6.6% | 0.8% | 1.3% | 1.0% | 0.5% | 0.3% | 0.5% | 0.3% | 1.3% | 21.5% | 2,031,529 | 1,059,481 | 0.5 | |||
| 23.5% | 15.4% | 24.6% | 7.6% | 5.8% | 8.6% | 3.0% | 0.8% | 1.3% | 1.0% | 8.4% | 0.0% | 100.0% | 11,600,679 | 6,582,181 | 0.6 | |||
Table 13.
WTP per FB hike.
| WTP per hike | Unit of measurement | Sample |
| Mean | € | 5.83 |
| Median | € | 5.00 |
| Standard deviation | € | 5.97 |
| 25th percentile | € | 0.00 |
| 50th percentile | € | 5.00 |
| 75th percentile | € | 10.00 |
| Willing to pay | % | 66.1 |
Table 14.
Linear correlation with WTP – Pearson’s correlation coefficient test.
| Question code | Question text | Sample | Sub-sample 1 | Sub-sample 2 | Sub-sample 3 | |
| D14.2 | Frequence of visinting plain forest | -.077* | -.125* | |||
| D14.3 | Frequence of visinting hill forest | -.096** | -.123* | |||
| D15.a.3 | N. of daily hikes in Trentino | .115* | ||||
| D15.a.6 | N. of daily hikes in Piedmont | .111* | ||||
| D15.b.3 | N. of vacation hikes in Trentino | .118* | ||||
| D15.b.6 | N. of vacation hikes in Piedmont | .119* | .161** | |||
| D16.a | I frequent the forest because the air is healthy | .091** | .114* | |||
| D16.b | I like forest that can be explored | .121** | .139* | .124* | ||
| D16.d | I really like to immerse myself in the forest because it is a refuge from daily worries | .104** | .112* | .123* | ||
| D16.e | I like forest where there are diverse trees (in species, height, and age) and the undergrowth is rich but does not obstruct the view | .067* | ||||
| D16.f | I only like forest that are easily accessible (e.g., availability of parking, no gates and/or obstacles) | .088** | ||||
| D16.i | I like the forest when there are several interesting things that attract my attention (e.g., streams, rocks, cliffs, old trees) | |||||
| D16.j | Immersing myself in the forest creates positive emotions for me | .088** | .123* | |||
| D16.k | I like to frequent the forest when there is a clear order in the physical layout of the place | .078* | .112* | .113* | ||
| D16.l | I like the forest because it is an environment that fascinates me | .112** | .125* | .122* | ||
| D16.n | I frequent the forest for health reasons (e.g., I activate metabolism, improve mood and sleep quality) | .133** | .151** | .157** | ||
| D17 | For you, how important is it to have forests in which to practice FB? | .244** | .271** | .220** | .246** | |
| D18 | How many hikes per year of FB would you conduct in your home region? | .176** | .230** | .212** | ||
| D19 | How many FB hikes per year would you conduct in other regions of northern Italy? | .148** | .151** | .123** | .182** | |
| D29 | Income | .146** | .127* | .142** | .163** | |
|
** Correlation is significant at the 0.01 level * Correlation is significant at the 0.05 level |
||||||
Table 15.
Association with WTP – Chi-squared test.
| Question code | Question text | Sample | Sub-sample 1 | Sub-sample 2 | Sub-sample 3 |
| D12 | Do you visit forests? | 0.007 | 0.148 | 0.104 | 0.175 |
Table 16.
Results of multiple linear regression models.
| Model | Unstandardized coefficient | Standardized coefficient | t | Sign. | 95.0% Confidence interval for B | Collinearity statistics | ||||
| B | Std. Err. | Beta | Lower bound | B | Std. Err. | Beta | ||||
| 1 | (Constant) | 0.047 | 0.860 | 0.055 | 0.956 | -1.640 | 1.734 | |||
| D17 | 1.875 | 0.263 | 0.225 | 7.118 | 0.000 | 1.358 | 2.392 | 1.000 | 1.000 | |
| 2 | (Constant) | -0.883 | 0.878 | -1.005 | 0.315 | -2.606 | 0.840 | |||
| D17 | 1.803 | 0.262 | 0.216 | 6.895 | 0.000 | 1.290 | 2.316 | 0.996 | 1.004 | |
| D29 | 0.579 | 0.133 | 0.136 | 4.358 | 0.000 | 0.318 | 0.840 | 0.996 | 1.004 | |
| 3 | (Constant) | -1.521 | 0.886 | -1.716 | 0.086 | -3.261 | 0.218 | |||
| D17 | 2.145 | 0.274 | 0.257 | 7.837 | 0.000 | 1.608 | 2.683 | 0.895 | 1.117 | |
| D29 | 0.604 | 0.132 | 0.142 | 4.571 | 0.000 | 0.344 | 0.863 | 0.994 | 1.006 | |
| D18 | -0.065 | 0.017 | -0.129 | -3.934 | 0.000 | -0.098 | -0.033 | 0.895 | 1.117 | |
| 4 | (Constant) | 0.492 | 1.198 | 0.411 | 0.681 | -1.859 | 2.844 | |||
| D17 | 2.158 | 0.273 | 0.258 | 7.902 | 0.000 | 1.622 | 2.693 | 0.895 | 1.117 | |
| D29 | 0.658 | 0.134 | 0.155 | 4.929 | 0.000 | 0.396 | 0.920 | 0.967 | 1.034 | |
| D18 | -0.066 | 0.017 | -0.130 | -3.982 | 0.000 | -0.098 | -0.033 | 0.895 | 1.117 | |
| D26 | -0.643 | 0.258 | -0.078 | -2.489 | 0.013 | -1.150 | -0.136 | 0.973 | 1.028 | |
| 5 | (Constant) | -0.393 | 1.262 | -0.312 | 0.755 | -2.869 | 2.083 | |||
| D17 | 2.132 | 0.273 | 0.255 | 7.817 | 0.000 | 1.597 | 2.667 | 0.893 | 1.119 | |
| D29 | 0.651 | 0.133 | 0.153 | 4.881 | 0.000 | 0.389 | 0.912 | 0.967 | 1.035 | |
| D18 | -0.060 | 0.017 | -0.120 | -3.630 | 0.000 | -0.093 | -0.028 | 0.876 | 1.141 | |
| D26 | -0.627 | 0.258 | -0.076 | -2.428 | 0.015 | -1.133 | -0.120 | 0.972 | 1.029 | |
| D16_f | 0.155 | 0.070 | 0.069 | 2.207 | 0.028 | 0.017 | 0.293 | 0.978 | 1.022 | |
Table 17.
Regression statistics of the multiple linear regression models.
| Model | R | R-Squared | Adj R-Squared | Std. errore of the estimate |
| 1 | .225 | 0.050 | 0.049 | 5.86103 |
| 2 | .263 | 0.069 | 0.067 | 5.80654 |
| 3 | .290 | 0.084 | 0.081 | 5.76294 |
| 4 | .300 | 0.090 | 0.086 | 5.74728 |
| 5 | .307 | 0.094 | 0.090 | 5.73562 |
Disclaimer/Publisher’s Note: The statements, opinions and data contained in all publications are solely those of the individual author(s) and contributor(s) and not of MDPI and/or the editor(s). MDPI and/or the editor(s) disclaim responsibility for any injury to people or property resulting from any ideas, methods, instructions or products referred to in the content. |
© 2024 by the authors. Licensee MDPI, Basel, Switzerland. This article is an open access article distributed under the terms and conditions of the Creative Commons Attribution (CC BY) license (http://creativecommons.org/licenses/by/4.0/).
Copyright: This open access article is published under a Creative Commons CC BY 4.0 license, which permit the free download, distribution, and reuse, provided that the author and preprint are cited in any reuse.


