Submitted:
10 July 2024
Posted:
11 July 2024
You are already at the latest version
Abstract
Keywords:
1. Introduction
2. Materials and Methods
3.1. Accident Modelling
3.2. Interactions between Traffic Parameters, Accidents and Air Quality
3. Results and Discussion
3.1. Accident Trends
3.2. Accident Modelling
3.3. Pinheiros Marginal Case Study
3.2. Study Comparison and Research Needs
4. Conclusions
Supplementary Materials
Author Contributions
Funding
Institutional Review Board Statement
Informed Consent Statement
Data Availability Statement
Acknowledgments
Conflicts of Interest
References
- IRTAD. Research Report. Speed and Crash Risk. OECD/ITF. Available at: https://www.itf-oecd.org/speed-crash-risk (Access: June 2022), 2018.
- AASHTO. American Association of State Highway and Transportation Officials. The green book: A Policy on Geometric Design of Highways and Streets; Washington, AASHTO, 2018.
- WHO. Resolution adopted by the General Assembly. 64/255: Improving global road safety. Available at: https://digitallibrary.un.org/record/684031 (Access: October 2020), 2010.
- WHO. Resolution adopted by the General Assembly. 74/299: Improving global road safety. Available at: https://undocs.org/en/A/RES/74/299 (Access: January 2021), 2020. 20 January.
- Cohen, A.J.; Brauer, M.; Burnett, R.; Anderson, H.R.; Frostad, J.; Estep, K.; Balakrishnan, K.; Brunekreef, B.; Dandona, L.; Dandona, R.; et al. Estimates and 25-year trends of the global burden of disease attributable to ambient air pollution: an analysis of data from the Global Burden of Diseases Study 2015. Lancet 2017, 389, 1907–1918. [Google Scholar] [CrossRef]
- Landrigan, P.J.; Fuller, R.; Acosta, N.J.R.; Adeyi, O.; Arnold, R.; Basu, N. (Nil); Baldé, A. B.; Bertollini, R.; Bose-O’Reilly, S.; Boufford, J.I.; et al. The Lancet Commission on pollution and health. Lancet 2018, 391, 462–512. [Google Scholar] [CrossRef]
- lcaraz Carrillo de Albornoz, V.; Molina Millán, J.; Lara Galera, A.; Muñoz Medina, B. Road speed limit matters – Are politicians doing the right thing? Socioecon. Plann. Sci. 2022, 79. [CrossRef]
- Hosseinlou, M.H.; Kheyrabadi, S.A.; Zolfaghari, A. Determining optimal speed limits in traffic networks. IATSS Res. 2015, 39, 36–41. [Google Scholar] [CrossRef]
- Aarts, L.; Van Schagen, I. Driving speed and the risk of road crashes: A review. Accid. Anal. Prev. 2006, 38, 215–224. [Google Scholar] [CrossRef]
- Kröyer, H.R.G.; Jonsson, T.; Várhelyi, A. Relative fatality risk curve to describe the effect of change in the impact speed on fatality risk of pedestrians struck by a motor vehicle. Accid. Anal. Prev. 2014, 62, 143–152. [Google Scholar] [CrossRef]
- Elvik, R.; Vadeby, A.; Hels, T.; van Schagen, I. Updated estimates of the relationship between speed and road safety at the aggregate and individual levels. Accid. Anal. Prev. 2019, 123, 114–122. [Google Scholar] [CrossRef]
- Doecke, S.D.; Kloeden, C.N.; Dutschke, J.K.; Baldock, M.R.J. Safe speed limits for a safe system: The relationship between speed limit and fatal crash rate for different crash types. Traffic Inj. Prev. 2018, 19, 404–408. [Google Scholar] [CrossRef]
- Cooper, P.J. The relationship between speeding behaviour (as measured by violation convictions) and crash involvement. J. Safety Res. 1997, 28, 83–95. [Google Scholar] [CrossRef]
- WHO. Global status report on road safety 2018. Geneva: World Health Organization; 2018. Licence: CC BYNC-SA 3.0 IGO. Available at: https://www.who.int/publications/i/item/9789241565684. Access: April 2020. 2018.
- CET. Companhia de Engenharia de Tráfego. Redução de velocidades máximas nas Marginais Tietê e Pinheiros: nota técnica 247; São Paulo: CET-SP; 2016; 3p. Available at: http://www.cetsp.com.br/media/494782/nt-247-2.pdf (Access: October 2021), 2016; 3p. [Google Scholar]
- Leitão, P. de A. ; Bezerra, I.M.P.; Santos, E.F. de S.; Ribeiro, S. de L.; Takasu, J.M.; Carlesso, J.S.; Campos, M.F.; de Abreu, L.C. Mortality due to traffic accidents, before and after the reduction of the average speed of motor vehicles in the city of São Paulo, Brazil, from 2010 to 2016. J. Hum. Growth Dev. 2019, 29, 83–92. [Google Scholar] [CrossRef]
- CETESB. Relatório de qualidade do ar no Estado de São Paulo, 2021. Available at: https://cetesb.sp.gov.br/ar/publicacoes-relatorios/ (Access: October 2022), 202.
- CET. Companhia de Engenharia de Tráfego (CET). Acidentes de trânsito: relatório anual; São Paulo: CET-SP, 2020. 69 p. Available at: http://www.cetsp.com.br/media/1143350/RelatorioAnual2020.pdf (Access: June 2021), 2020. [Google Scholar]
- CET. Companhia de Engenharia de Tráfego (CET). Acidentes de trânsito: relatório anual; São Paulo: CET-SP, 2017. 69 p. Available at: http://www.cetsp.com.br/media/646657/relatorioanualacidentestransito-2017.pdf (Access: October 2021), 2017. [Google Scholar]
- Ang, A.; Christensen, P.; Vieira, R. Should congested cities reduce their speed limits? Evidence from São Paulo, Brazil. J. Public Econ. 2020, 184, 104155. [Google Scholar] [CrossRef]
- Bel, G.; Rosell, J. Effects of the 80km/h and variable speed limits on air pollution in the metropolitan area of Barcelona. Transp. Res. Part D Transp. Environ. 2013, 23, 90–97. [Google Scholar] [CrossRef]
- CET. Companhia de Engenharia de Tráfego (CET). Acidentes de trânsito: relatório anual. São Paulo; São Paulo: CET-SP, 2015, 2016, 2017, 2018, 2019. 76 p. Available at: http://www.cetsp.com.br/media/490098/relatorioanualacidentestransito2015.pdf (Access: October 2021), 2015, 2016, 2017, 2018, 2019.
- CET. Novas velocidades regulamentadas nas vias Marginais Tietê e Pinheiros e ações para melhoria na segurança viária: nota técnica 253; São Paulo: CET-SP; 2017; 34 p. Available at: http://www.cetsp.com.br/media/539932/nt-253-novas-velocidades-nas-marginais.pdf (Access: November 2021), 2017b.
- DER. Departamento de Estradas de Rodagem do Estado de São Paulo. Manual Básico de estradas e rodovias vicinais. Volume 1: Planejamento, projeto, construção e operação; São Paulo: DER-SP. Available at: http://www.der.sp.gov.br/WebSite/Documentos/RodoviasVicinais.aspx (Access: October 2022), 2012. [Google Scholar]
- Charlton, S.G.; Starkey, N.J. Transitions within a safe road system. Accid. Anal. Prev. 2018, 121, 250–257. [Google Scholar] [CrossRef] [PubMed]
- Silvano, A.P.; Bang, K.L. Impact of speed limits and road characteristics on free-flow speed in urban areas. J. Transp. Eng. 2016, 142. [Google Scholar] [CrossRef]
- Castillo-Manzano, J.I.; Castro-Nuño, M.; López-Valpuesta, L.; Vassallo, F. V. The complex relationship between increases to speed limits and traffic fatalities: Evidence from a meta-analysis. Saf. Sci. 2019, 111, 287–297. [Google Scholar] [CrossRef]
- Choudhary, P.; Imprialou, M.; Velaga, N.R.; Choudhary, A. Impacts of speed variations on freeway crashes by severity and vehicle type. Accid. Anal. Prev. 2018, 121, 213–222. [Google Scholar] [CrossRef] [PubMed]
- Elvik, R. A before-after study of the effects on safety of environmental speed limits in the city of Oslo, Norway. Saf. Sci. 2013, 55, 10–16. [Google Scholar] [CrossRef]
- Naik, B.; Tung, L.W.; Zhao, S.; Khattak, A.J. Weather impacts on single-vehicle truck crash injury severity. J. Safety Res. 2016, 58, 57–65. [Google Scholar] [CrossRef]
- Vorko-Jović, A.; Kern, J.; Biloglav, Z. Risk factors in urban road traffic accidents. J. Safety Res. 2006, 37, 93–98. [Google Scholar] [CrossRef]
- METRO-SP. Pesquisa Origem e Destino 1967, 1977, 1987, 1997, 2007, 2017: Região Metropolitana de São Paulo–Síntese das informações da Pesquisa Domiciliar Governo do Estado de São Paulo, Secretaria dos Transportes Metropolitanos, São Paulo, 2019.
- Pérez-Martínez, P.J.; Magalhães, T.; Maciel, I.; de Miranda, R.M.; Kumar, P. Effects of the COVID-19 Pandemic on the Air Quality of the Metropolitan Region of São Paulo: Analysis Based on Satellite Data, Monitoring Stations and Records of Annual Average Daily Traffic Volumes on the Main Access Roads to the City. Atmosphere (Basel). 2022, 13. [Google Scholar] [CrossRef]
- Artíñano, B.; Salvador, P.; Alonso, D.G.; Querol, X.; Alastuey, A. Influence of traffic on the PM10 and PM2.5 urban aerosol fractions in Madrid (Spain). Sci. Total Environ. 2004, 334–335, 111–123. [CrossRef]
- Chan, T.C.; Pai, C.W.; Wu, C.C.; Hsu, J.C.; Chen, R.J.; Chiu, W.T.; Lam, C. Association of Air Pollution and Weather Factors with Traffic Injury Severity: A Study in Taiwan. Int. J. Environ. Res. Public Health 2022, 19, 1–15. [Google Scholar] [CrossRef] [PubMed]
- Chen, Y.; Schleicher, N.; Chen, Y.; Chai, F.; Norra, S. The influence of governmental mitigation measures on contamination characteristics of PM2. 5 in Beijing. Sci. Total Environ. 2014, 490, 647–658. [Google Scholar] [CrossRef] [PubMed]
- Cheng, N.; Zhang, D.; Li, Y.; Xie, X.; Chen, Z.; Meng, F.; Gao, B.; He, B. Spatio-temporal variations of PM2. 5 concentrations and the evaluation of emission reduction measures during two red air pollution alerts in Beijing. Sci. Rep. 2017, 7, 1–12. [Google Scholar] [CrossRef]
- Dastoorpoor, M.; Idani, E.; Khanjani, N.; Goudarzi, G. Relationship Between Air Pollution, Weather, Traffic, and Traffic-Related Mortality. 2016, 21, 1–7. [CrossRef]
- Giovanis, E. The relationship between teleworking, traffic and air pollution. Atmos. Pollut. Res. 2018, 9, 1–14. [Google Scholar] [CrossRef]
- Hahm, Y.; Yoon, H. The impact of air pollution alert services on respiratory diseases: Generalized additive modeling study in South Korea. Environ. Res. Lett. 2021, 16. [Google Scholar] [CrossRef]
- Khan, J.; Kakosimos, K.; Jensen, S.S.; Hertel, O.; Sørensen, M.; Gulliver, J.; Ketzel, M. The spatial relationship between traffic-related air pollution and noise in two Danish cities: Implications for health-related studies. Sci. Total Environ. 2020, 726. [Google Scholar] [CrossRef]
- Perez-Martinez, P.J.; Miranda, R.M. Temporal distribution of air quality related to meteorology and road traffic in Madrid. Environ. Monit. Assess. 2015, 187. [Google Scholar] [CrossRef]
- Pérez, N.; Pey, J.; Cusack, M.; Reche, C.; Querol, X.; Alastuey, A.; Viana, M. Variability of particle number, black carbon, and PM10, PM2. 5, and PM1 Levels and Speciation: Influence of road traffic emissions on urban air quality. Aerosol Sci. Technol. 2010, 44, 487–499. [Google Scholar] [CrossRef]
- Islam, M.T.; El-Basyouny, K.; Ibrahim, S.E. The impact of lowered residential speed limits on vehicle speed behavior. Saf. Sci. 2014, 62, 483–494. [Google Scholar] [CrossRef]
- Tong, R.; Liu, J.; Wang, W.; Fang, Y. Health effects of PM2. 5 emissions from on-road vehicles during weekdays and weekends in Beijing, China. Atmos. Environ. 2020, 223, 117258. [Google Scholar] [CrossRef]
- Yuval; Flicstein, B. ; Broday, D.M. The impact of a forced reduction in traffic volumes on urban air pollution. Atmos. Environ. 2008, 42, 428–440. [CrossRef]
- Zhang, H.; Wang, S.; Hao, J.; Wang, X.; Wang, S.; Chai, F.; Li, M. Air pollution and control action in Beijing. J. Clean. Prod. 2016, 112, 1519–1527. [Google Scholar] [CrossRef]
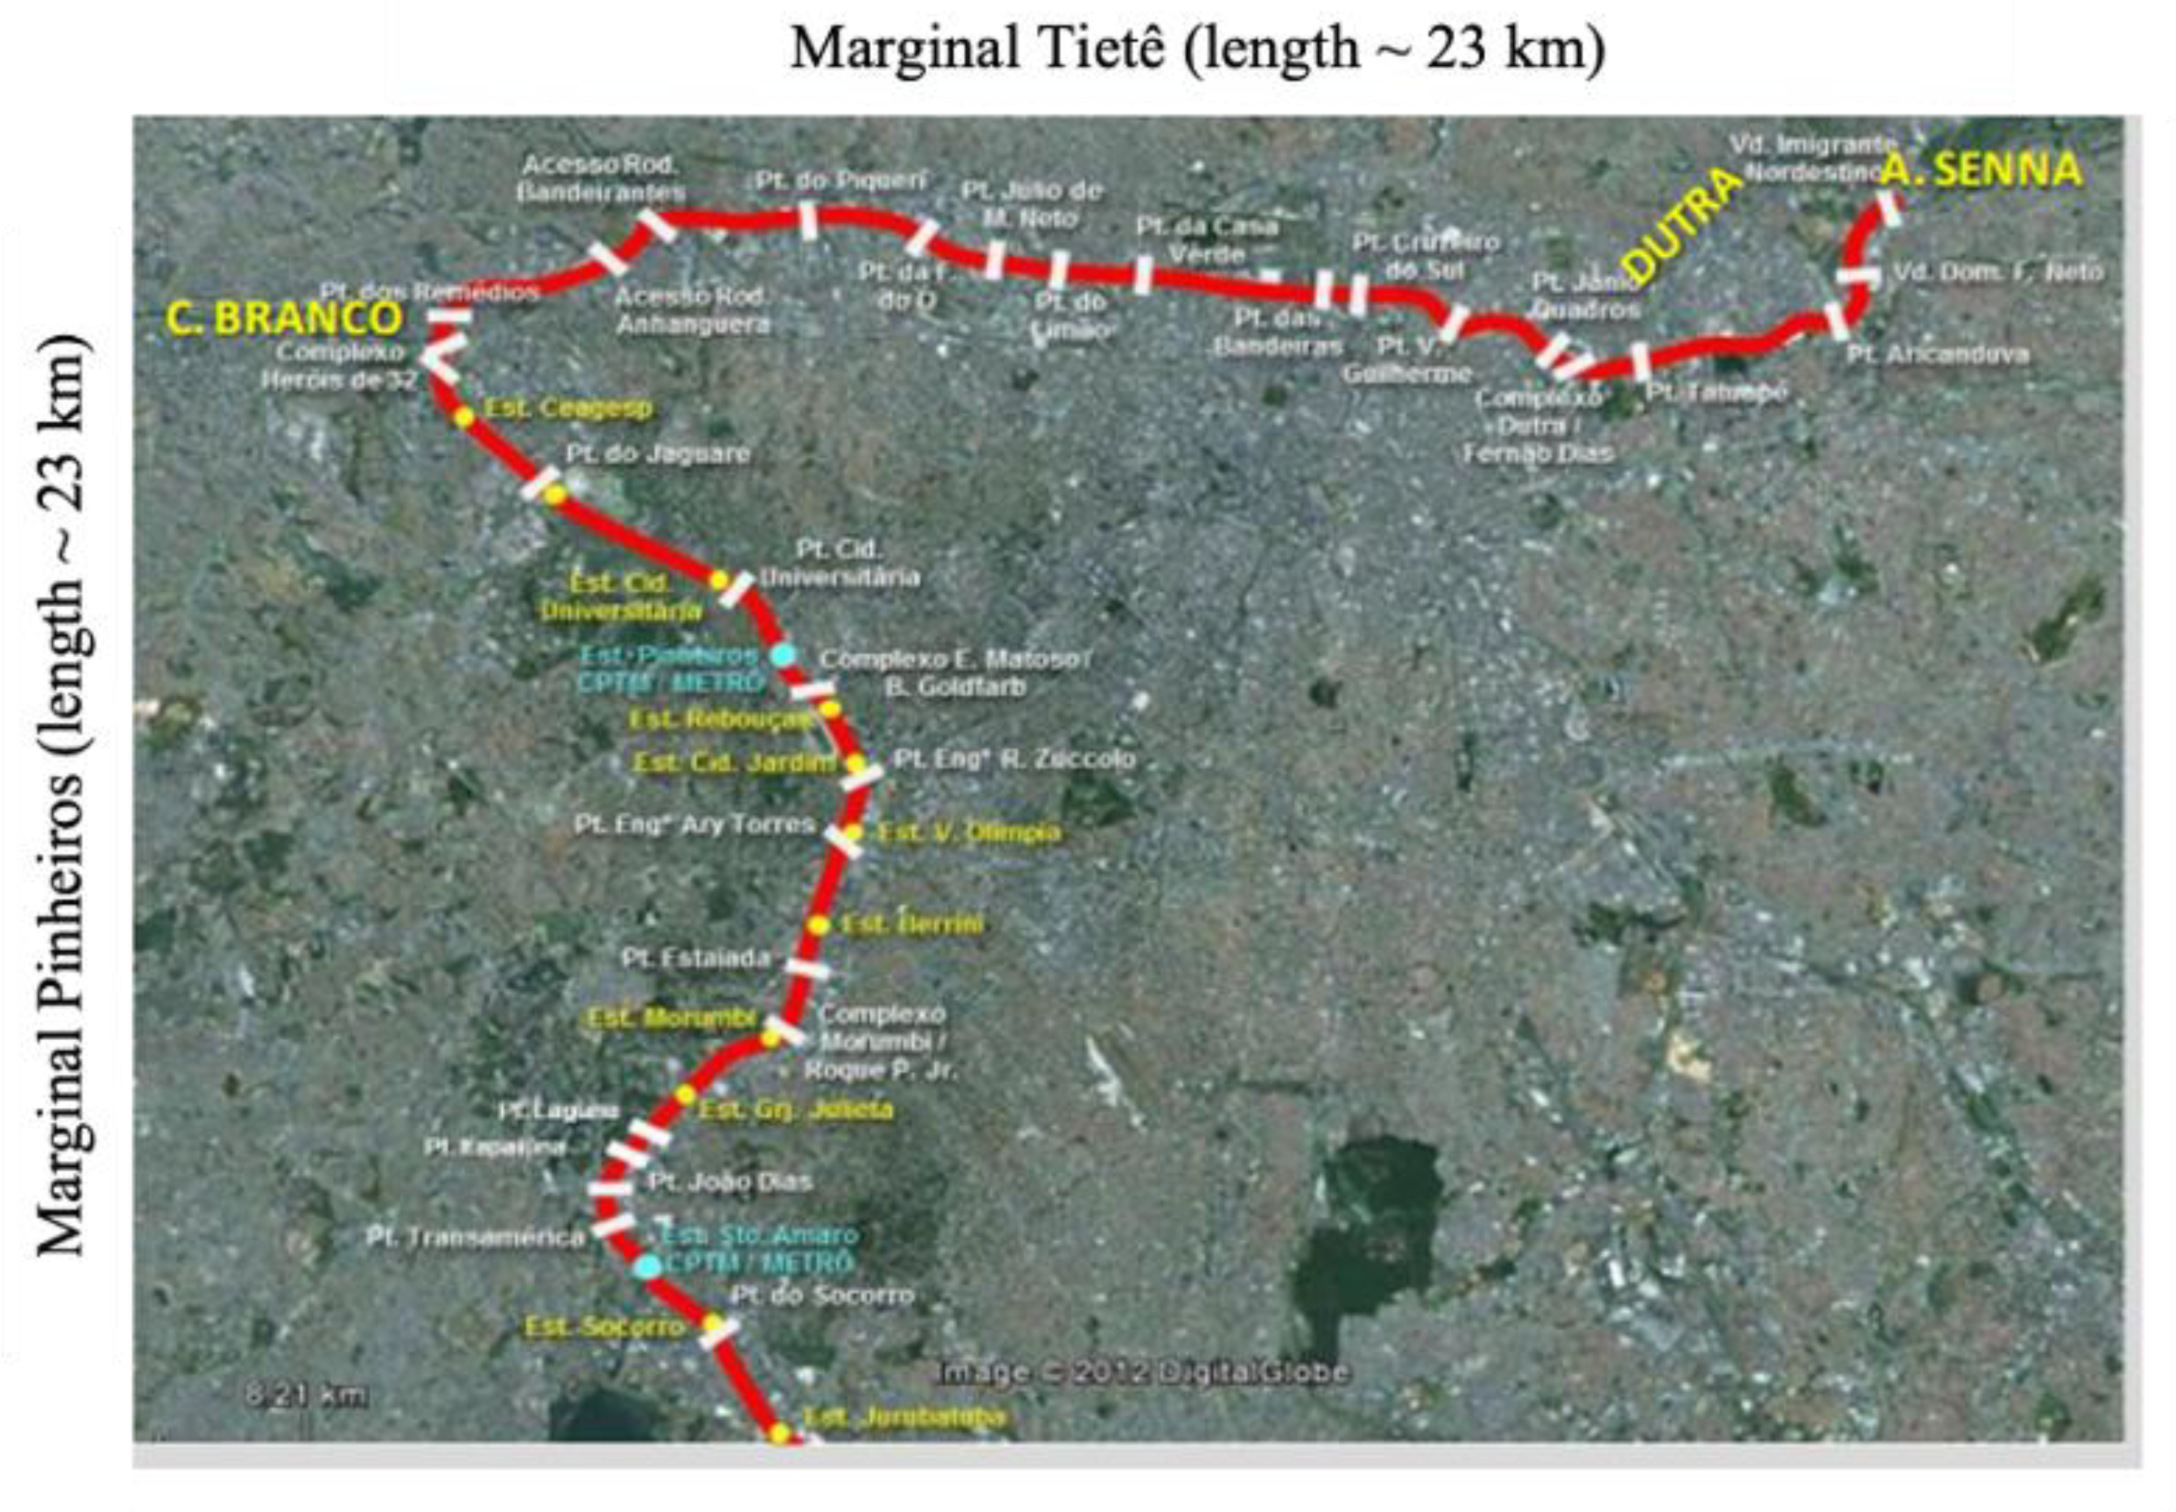
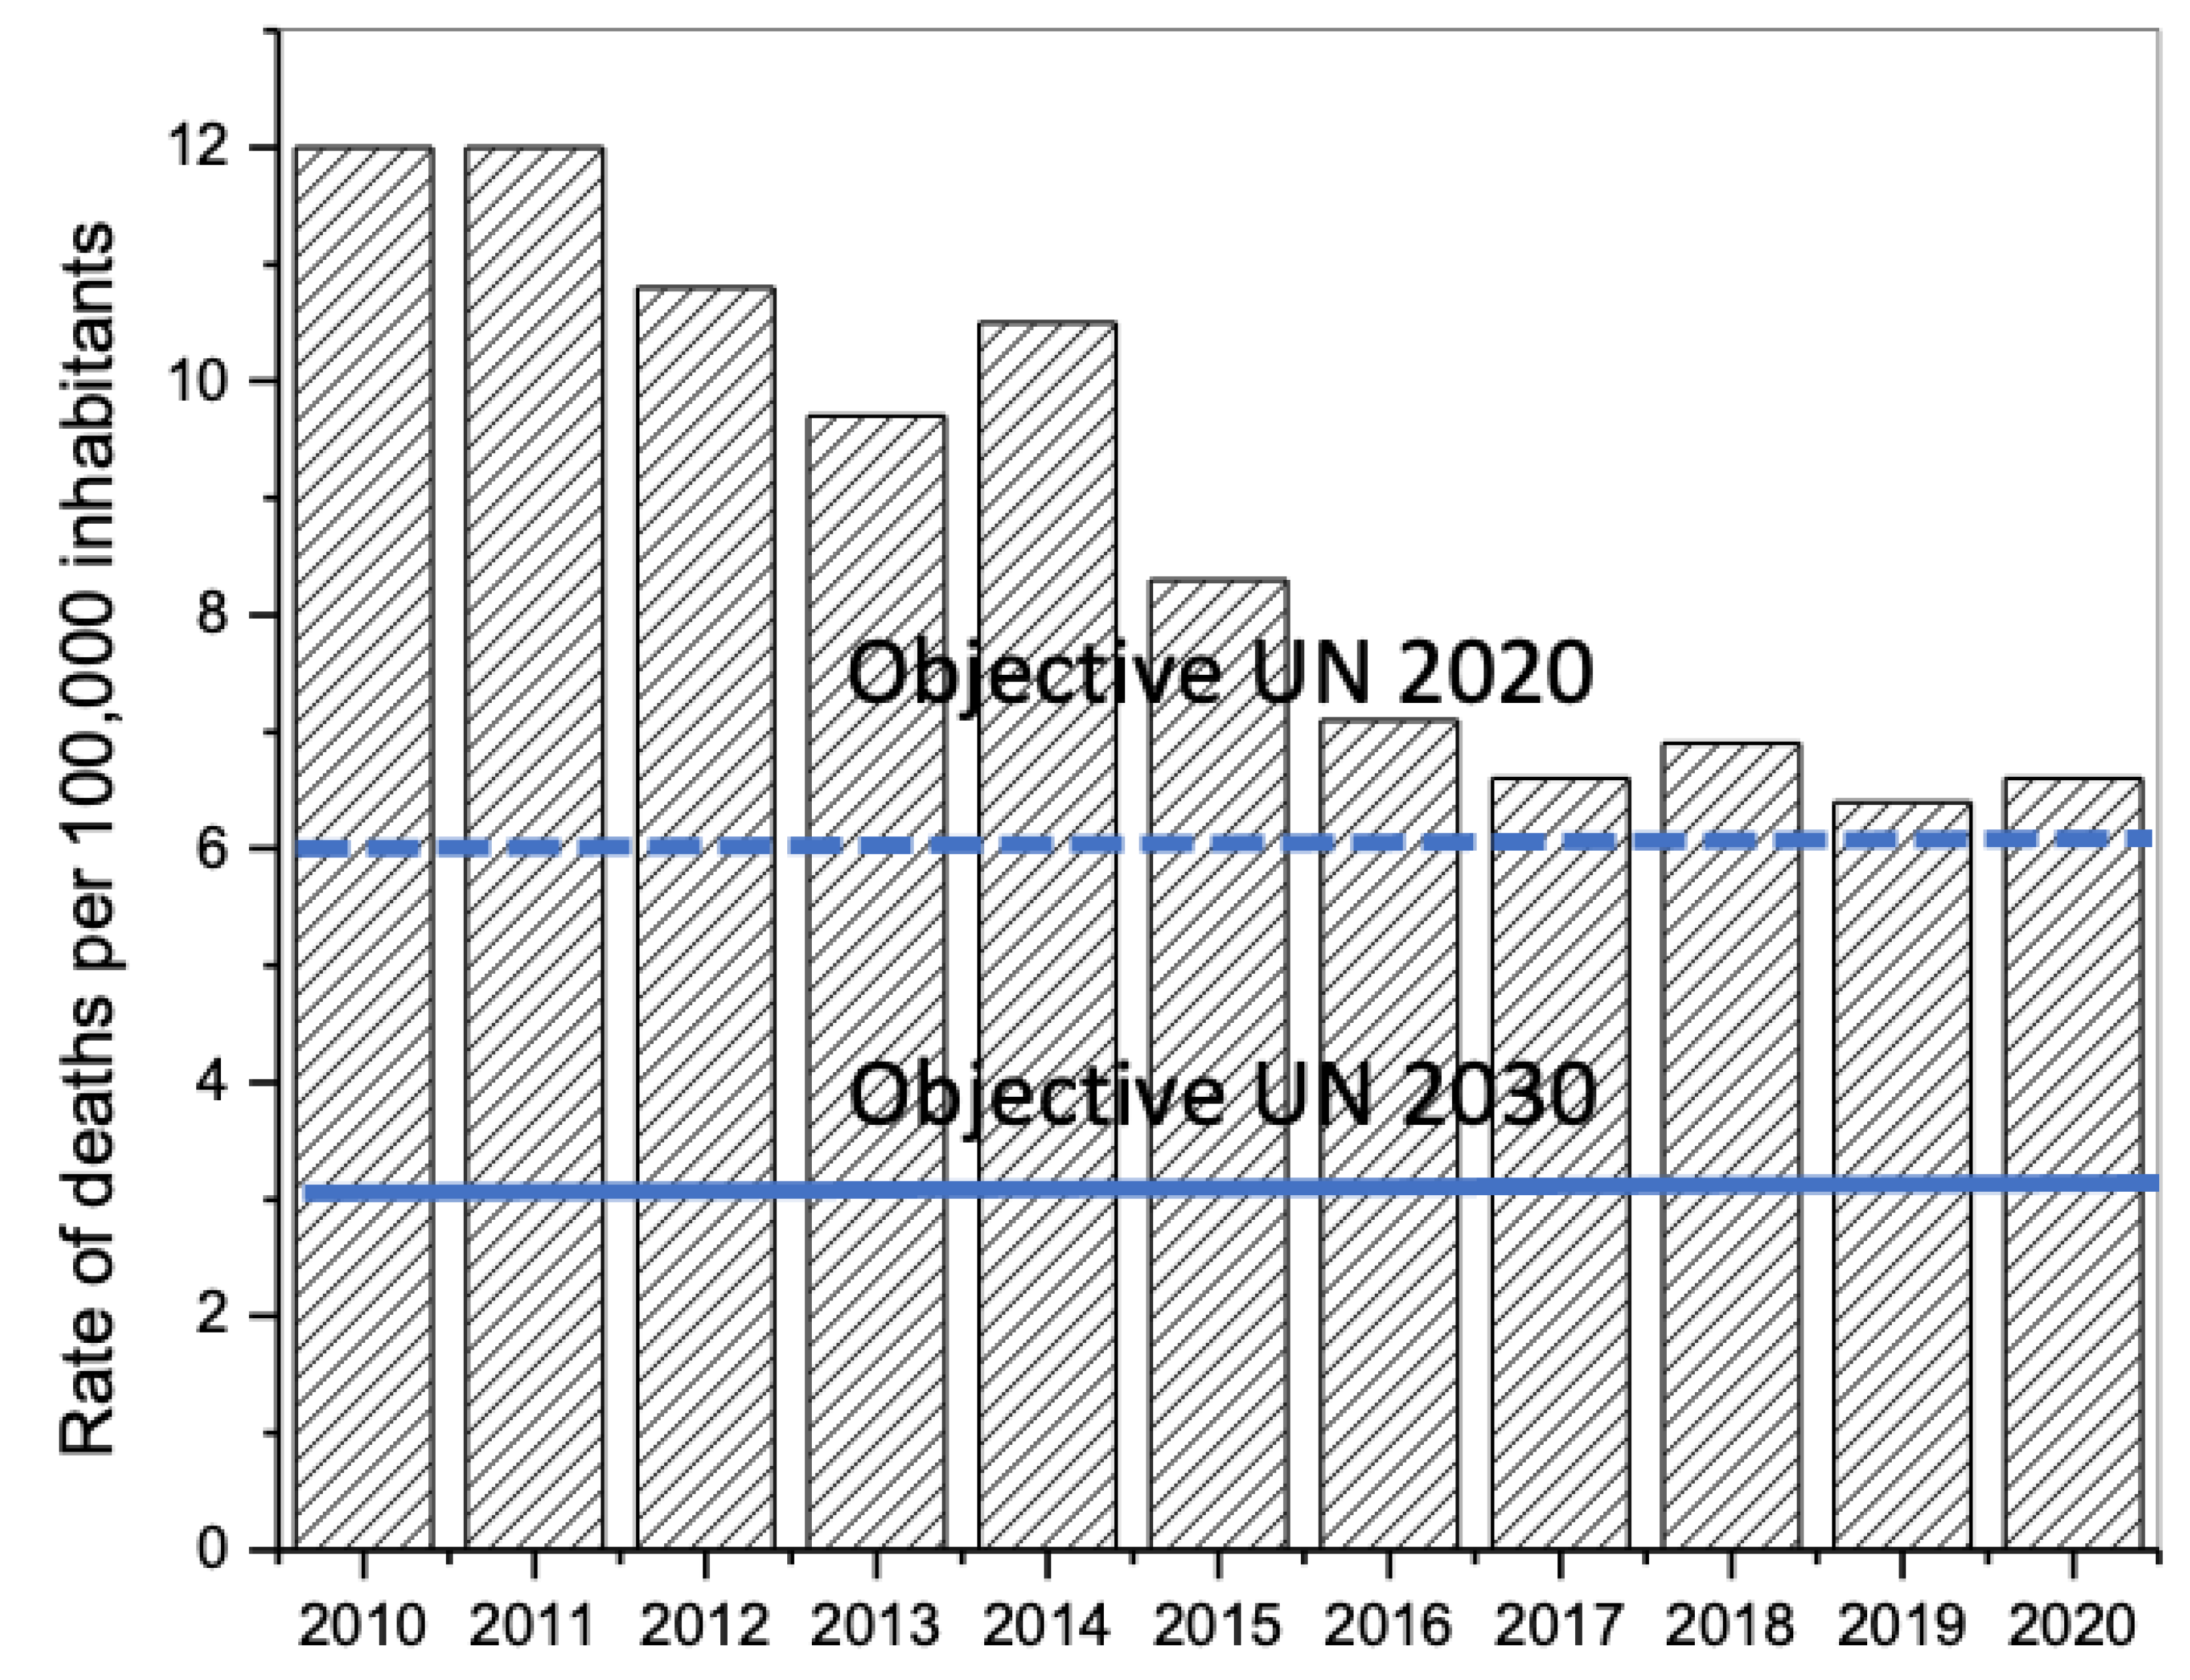
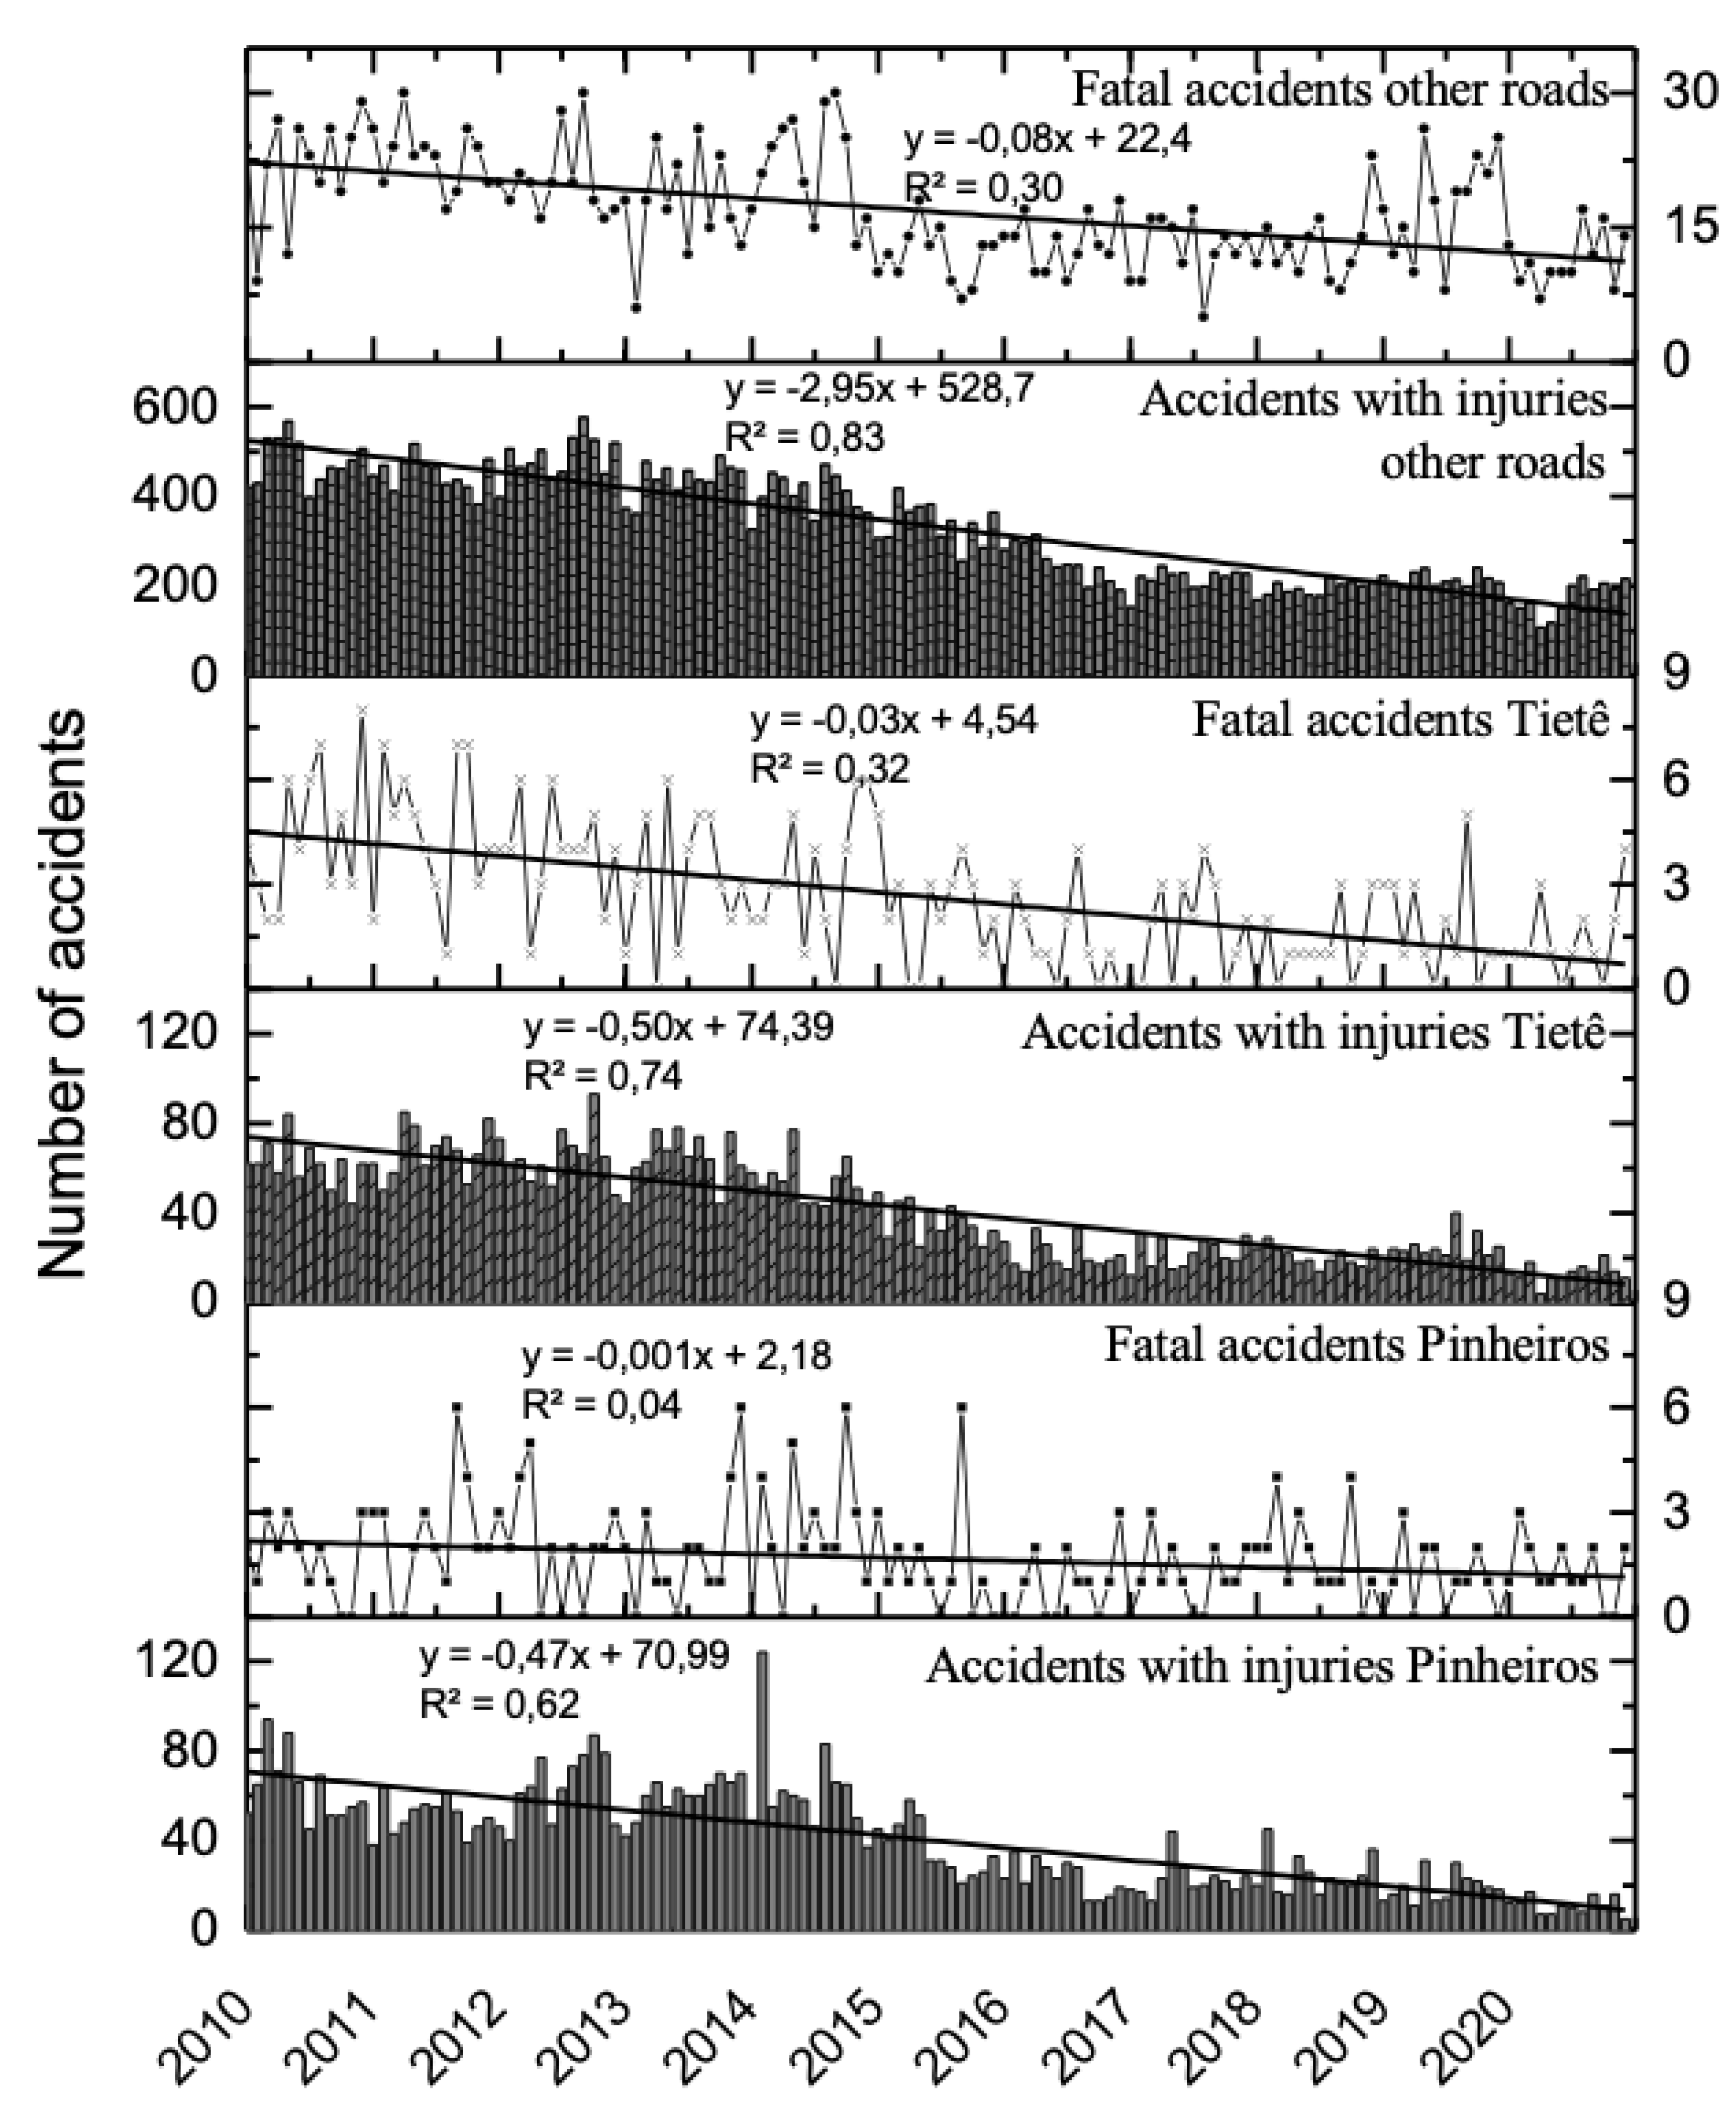
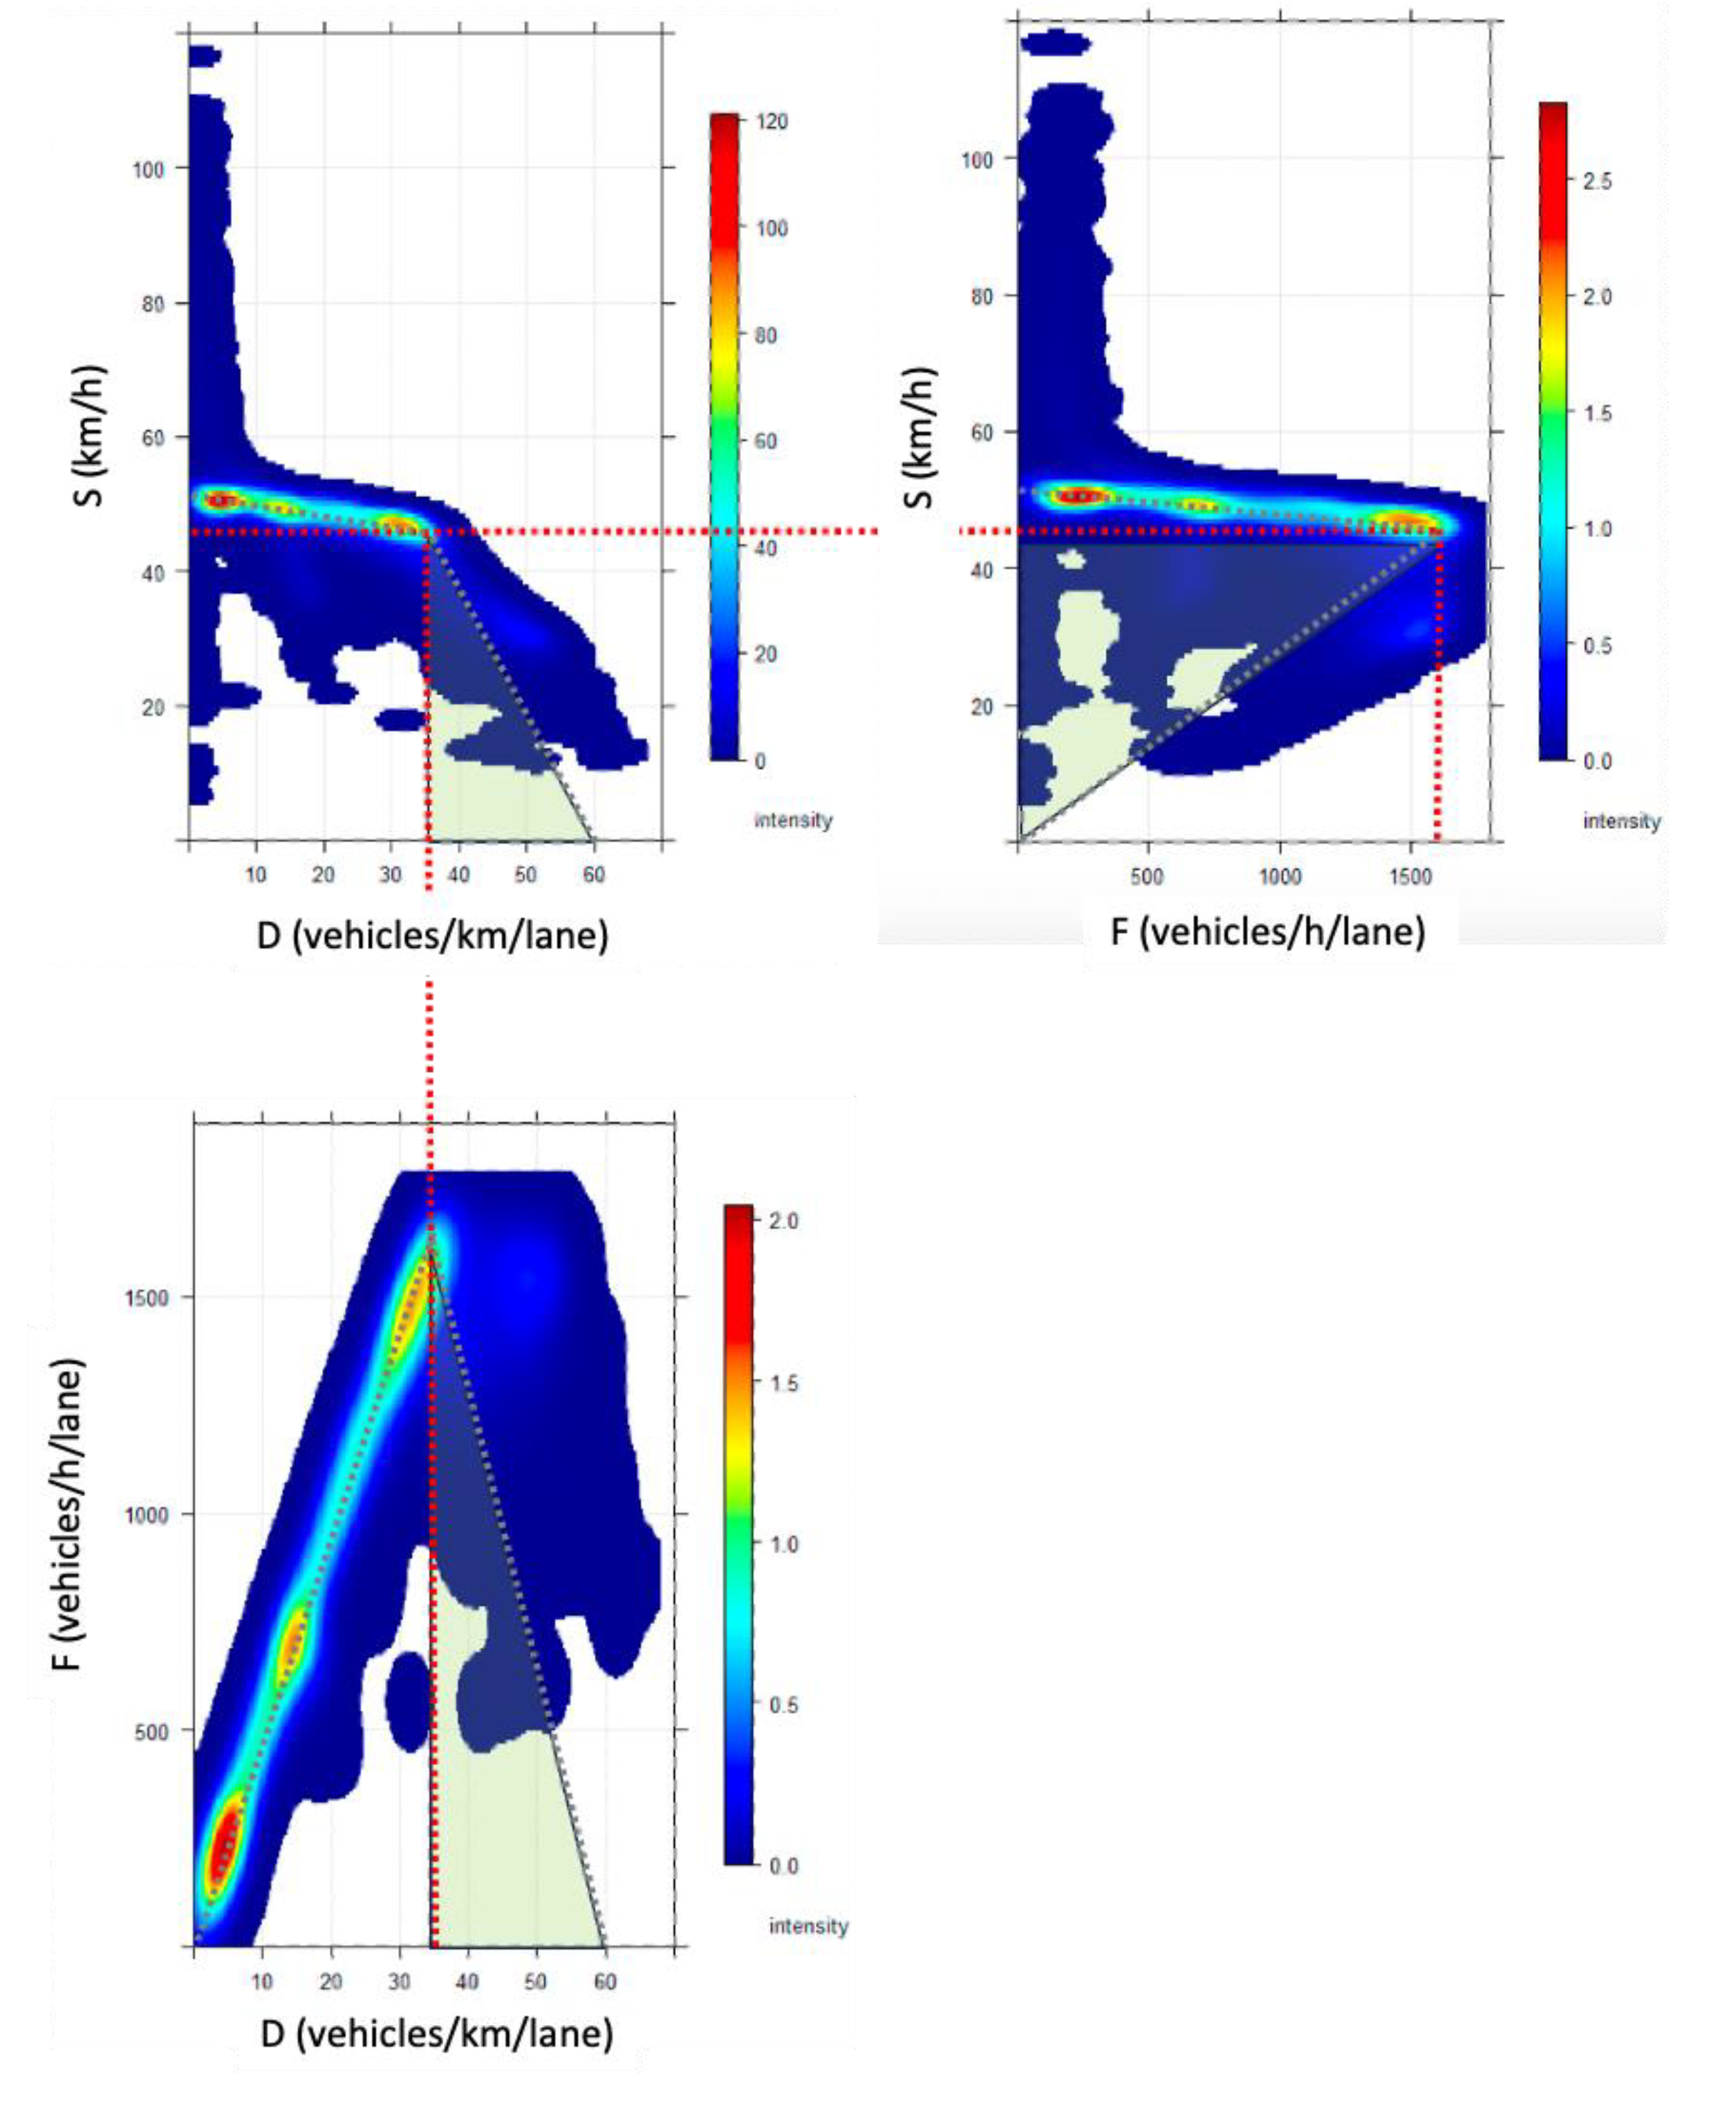
| Lane types | Light duty vehicles | Heavy duty vehicles | Light duty vehicles | Heavy duty vehicles | Light duty vehicles | Heavy duty vehicles |
|---|---|---|---|---|---|---|
| Until 07/19/2015 | From 07/20/2015 to 01/24/2017 | Since 01/25/2017 | ||||
| FT1 | 90 km/h | 70 km/h | 70 km/h | 60 km/h | 90 km/h | 60 km/h |
| C2 | 70 km/h | 70 km/h | 60 km/h | 60 km/h | 70 km/h | 60 km/h |
| A3 | 70 km/h | 70 km/h | 50 km/h | 50 km/h | 60 km/h | 60-50 km/h |
| Year | Mean fatalities (±sd)1 | Sum of fatalities2 | Difference in fatalities (%)3 |
Mean injuries (±sd)1 | Sum of injuries2 | Difference in injuries (%)3 |
|---|---|---|---|---|---|---|
| Pinheiros marginal | ||||||
| 2010 | 0.03±0.18 | 20 | _ | 1.22±0.56 | 764 | _ |
| 2011 | 0.06±0.28 | 28 | 40.00 | 1.21±0.58 | 607 | -20.55 |
| 2012 | 0.04±0.20 | 25 | -10.71 | 1.21±0.58 | 762 | 25.54 |
| 2013 | 0.04±0.19 | 23 | -8.00 | 1.18±0.50 | 725 | -4.86 |
| 2014 | 0.05±0.23 | 30 | 30.43 | 1.21±1.80 | 755 | 4.13 |
| 2015 | 0.05±0.23 | 18 | -40.00 | 1.15±0.56 | 435 | -42.38 |
| 2016 | 0.04±0.20 | 11 | -38.89 | 1.11±0.45 | 281 | -35.40 |
| 2017 | 0.06±0.24 | 14 | 27.27 | 1.19±0.63 | 270 | -3.91 |
| 2018 | 0.09±0.33 | 22 | 57.14 | 1.21±1.08 | 297 | 10.00 |
| 2019 | 0.06±0.24 | 13 | -40.91 | 1.12±0.62 | 230 | -22.56 |
| 2020 | 0.13±0.34 | 16 | 23.08 | 1.09±0.67 | 132 | -42.61 |
| Total | 220 | 5,258 | ||||
| Tiete marginal | ||||||
| 2010 | 0.08±0.30 | 53 | _ | 1.19±0.69 | 744 | _ |
| 2011 | 0.08±0.29 | 54 | 1.89 | 1.25±0.92 | 808 | 8.60 |
| 2012 | 0.07±0.27 | 47 | -12.96 | 1.19±0.71 | 785 | -2.85 |
| 2013 | 0.06±0.26 | 38 | -19.15 | 1.18±0.64 | 774 | -1.40 |
| 2014 | 0.07±0.26 | 38 | 0.00 | 1.16±0.64 | 645 | -16.67 |
| 2015 | 0.07±0.29 | 28 | -26.32 | 1.15±0.60 | 441 | -31.63 |
| 2016 | 0.07±0.27 | 15 | -46.43 | 1.19±0.72 | 259 | -41.27 |
| 2017 | 0.09±0.32 | 20 | 33.33 | 1.12±0.87 | 264 | 1.93 |
| 2018 | 0.06±0.24 | 14 | -30.00 | 1.12±0.54 | 250 | -5.30 |
| 2019 | 0.08±0.28 | 21 | 50.00 | 1.17±0.68 | 297 | 18.80 |
| 2020 | 0.12±0.32 | 17 | -19.05 | 1.07±0.68 | 158 | -46.80 |
| Total | 345 | 5,425 | ||||
| Other forty roads | ||||||
| 2010 | 0.06±0.26 | 262 | _ | 1.30±0.93 | 5750 | _ |
| 2011 | 0.06±0.27 | 276 | 5.34 | 1.26±0.85 | 5415 | -5.83 |
| 2012 | 0.05±0.24 | 244 | -11.59 | 1.26±0.83 | 5846 | 7.96 |
| 2013 | 0.05±0.22 | 211 | -13.52 | 1.21±0.70 | 5270 | -9.85 |
| 2014 | 0.06±0.27 | 263 | 24.64 | 1.20±0.83 | 4870 | -7.59 |
| 2015 | 0.04±0.20 | 142 | -46.00 | 1.19±0.67 | 4070 | -16.43 |
| 2016 | 0.06±0.25 | 160 | 12.68 | 1.17±0.67 | 3035 | -25.43 |
| 2017 | 0.07±0.27 | 150 | -6.25 | 1.20±0.70 | 2598 | -14.40 |
| 2018 | 0.08±0.28 | 155 | 3.33 | 1.17±0.65 | 2348 | -9.62 |
| 2019 | 0.09±0.32 | 213 | 37.41 | 1.14±0.68 | 2595 | 10.52 |
| 2020 | 0.08±0.29 | 137 | -64.32 | 1.22±0.73 | 2088 | -19.54 |
| Total | 2,213 | 43,885 | ||||
| Var (Uni.) |
Injuries (#/month) | Fatalities (#/month) |
Var (Uni.) |
Injuries (#/month) | Fatalities (#/month) |
Var (Uni.) |
Injuries (#/month) |
Fatalities (#/month) |
|---|---|---|---|---|---|---|---|---|
| Pinheiros marginal | Tietê marginal | Other roads | ||||||
| Speed reduction policy 2 | Speed reduction policy 2 | Speed reduction policy 2 | ||||||
| -14.1±5.7* | -0.5±0.7 | -5.7±4.4 | -0.1±0.8 | -43.4±22.7* | -2.5±2.8 | |||
| Time trend | Time trend | Time trend | ||||||
| 2010 | 52.7±4.6* | 0.3±0.6 | 2010 | 48.8±3.6* | 3.0±0.6* | 2010 | 261.8±27.0* | 7.9±3.3* |
| 2011 | 39.6±4.6* | 1.0±0.6 | 2011 | 54.2±3.6* | 3.1±0.6* | 2011 | 233.9±27.0* | 9.1±3.3* |
| 2012 | 52.5±4.6* | 0.7±0.6 | 2012 | 52.2±3.6* | 2.5±0.6* | 2012 | 269.8±27.0* | 6.4±3.3 |
| 2013 | 49.4±4.6* | 0.6±0.6 | 2013 | 51.3±3.6* | 1.7±0.6* | 2013 | 221.8±27.0* | 3.6±3.3 |
| 2014 | 51.9±4.6* | 1.2±0.6* | 2014 | 40.6±3.6* | 1.8±0.6* | 2014 | 188.5±27.0* | 8.0±3.3* |
| 2015 | 32.3±5.4* | 0.4±0.7 | 2015 | 25.9±4.0* | 0.9±0.7 | 2015 | 136.3±21.1* | -1.3±2.6 |
| 2016 | 26.5±7.3* | 0.1±0.9 | 2016 | 14.1±5.7* | -0.1±1.0 | 2016 | 78.9±14.7* | 1.9±1.8 |
| 2017 | 12.7±4.6* | -0.1±0.6 | 2017 | 9.3±3.6* | 0.3±0.7 | 2017 | 42.5±14.7* | 1.1±1.8 |
| 2018 | 13.7±4.6* | 0.5±0.6 | 2018 | 7.7±3.6* | -0.2±0.6 | 2018 | 21.7±14.7 | 1.5±1.8 |
| 2019 | 8.2±4.6 | -0.3±0.6 | 2019 | 11.6±3.6* | 0.3±0.6 | 2019 | 42.2±14.7* | 6.3±1.8* |
| 2020 | - | - | 2020 | - | - | 2020 | - | - |
| Regression 3 | Regression 3 | Regression 3 | ||||||
| R2 | 0.79 | - | R2 | 0.84 | - | R2 | 0.92 | - |
| Mean | 34.8 | 1.5 | Mean | 39.0 | 2.6 | Mean | 331.8 | 16.7 |
| Ref. | Transport policy study/ measures and highlights |
Time span | Speed reduction | Traffic variation |
Accident variation | Pollution variation | Pollutant type |
|---|---|---|---|---|---|---|---|
| [7] | Speed reduction and pollution in Madrid (Spain) |
2011-2017 | from 120 to 110 km/h in rural roads | -15% | -20% | -18% | Fuel consumption and CO |
| from 90 to 70km/h in urban roads |
-20% | ||||||
| [9] | Speed reduction policy on crash accidents |
2006 | from 60 to 46 km/h in urban roads |
-60% | |||
| from 100 to 76 km/h in rural roads |
-20% | ||||||
| [20] | Speed reduction policy on crash accidents |
2015-2016 | from 90 to 70km/h | -22% | -23% | PM2.5 | |
| -35% | CO | ||||||
| [34] | Influence of traffic on PM in Madrid |
1999-2001 | -30% | -20% | PM2.5-PM10 | ||
| [21] | Speed reduction policy in Barcelona |
2008-2009 | from 100-120 to 80km/h | -6% | -7% | -5.6% | PM10 |
| -2.5% | NOX | ||||||
| [27] | Relationship between speed and traffic fatalities in US |
1987-1995 | from 100 to 85 km/h rural interstate roads | no traffic variation | -21% | ||
| [35] | Weather, air pollution and traffic accidents in Taipei (Taiwan) |
2018 | -28% | -13% | PM2.5 | ||
| [36] | Mitigation measures, PM2.5 in Beijing (Olympics) |
2007-2011 | -50% | -16% | PM2.5 | ||
| [37] | Emission reduction measures during red air pollution alert in Beijing (China) |
2015 | emission reduction measures and traffic restrictions | -28% | -15% | PM2.5 | |
| [28] | Impact of speed variations on freeway crashes in UK |
2017 | from 80 to 60km/h | -10% | -8% | ||
| -25% | -20% | ||||||
| [13] | Relationship between speeding and crashes in British Columbia (Canada) |
1985-1990 | speed reduction from maximum speed limits | -22% | -31% | ||
| -37% | |||||||
| [38] | Weather effect on air pollution and traffic in Khuzestan State (Iran) |
2008-2015 | _ | -65.4% | -25% | NOX | |
| _ | -5.0% | -25% | NO2 | ||||
| [12] | Optimal speed limits to reduce car accidents in Australia | 2000-2014 | from 80 to 50km/h from 110 to 80 km/h |
-38% -27% |
-90% -64% |
_ | |
| [11] | Speed reduction policy and Metanalyses in Oslo (Norway) |
2004-2005 | from 80 to 60km/h from 90 to 40 km/h |
-25% -56% |
-67% -94% |
||
| [39] | Teleworking effects on Switzerland cities |
2002-2013 |
-3% | -3% | NO2 | ||
| -3% | -4% | CO | |||||
| [40] | Air pollution alerts and respiratory diseases in South Korea | 2015-2019 | -8% | PM2.5 | |||
| [8] | Speed optimization to reduce road accidents and pollution in Shiraz (Iran) | 2011 | from 82 to 72km/h | -10% | -4% | Several pollutants | |
| [41] | Traffic related pollution in Danish cities (Copenhagen/Roskilde) | 2005 | from 80 to 40 km/h | -36% | -19% | NO2 | |
| -6% | dB | ||||||
| [10] | Accident analyses worldwide | 2009-2011 | from 70 to 50 km/h | -25% | -62% | ||
| from 40 to 36 km/h | -15% | -30% | |||||
| [42] | Weather effect on air pollution and traffic in Madrid (Spain) |
2006 | -27% | -6% | PM10 | ||
| [33] | Traffic and pollution relationships in São Paulo (Brazil) during COVID-19 lockdown |
2019-2020 | -39% | -15% | PM2.5 | ||
| -39% | -23% | CO | |||||
| -39% | -15% | NO2 | |||||
| [43] | Influence of road traffic emissions on air quality in Barcelona (Spain) | 1999-2007 | -14% | -42% | PM1 | ||
| [26] | Speed reduction effect on car accident in Sweden | 2014-2015 | from 50 to 40 km/h | -4% | -11% | ||
| [44] | Reduction of residential speed limits and traffic behavior in Edmonton (Canada) | 2004-2009 | from 50 to 40 km/h | -9% | -14% | ||
| [45] | Health effects for PM2.5 emission reductions in Beijing | 2017 | -26% | -32% | PM2.5 | ||
| [46] | War conflict, reduction in traffic volumes and urban pollution in Israel | 2005-2006 | traffic reduction due to socioeconomic conditions | -40% | -38.5 | NO2 | |
| [31] | Risk factors in urban accidents in Zagreb (Croatia) | 1999-2000 | increase from upper speed limits | _ | 65% | ||
| [47] | Air pollution in Beijing | 1998-2013 | -37% | PM10 | |||
| This study | Reduction of speed limits at marginal roads in São Paulo | 2015-2019 | from 90 to 70 km/h |
-7% |
-27% | -24% | NOX |
Disclaimer/Publisher’s Note: The statements, opinions and data contained in all publications are solely those of the individual author(s) and contributor(s) and not of MDPI and/or the editor(s). MDPI and/or the editor(s) disclaim responsibility for any injury to people or property resulting from any ideas, methods, instructions or products referred to in the content. |
© 2024 by the authors. Licensee MDPI, Basel, Switzerland. This article is an open access article distributed under the terms and conditions of the Creative Commons Attribution (CC BY) license (http://creativecommons.org/licenses/by/4.0/).


