, and the laser acted at a distance of 550 mm from the propeller. The experimental results indicate that the wake dissipation time of the propeller in a strong density-stratified water environment is approximately 800s. Following the stabilization of the wake field density, the laser spot position is observed to be stable at 0.341 mm, with a corresponding refractive index change of . The wake dissipation time of the propeller in a linear density-stratified water environment is approximately 750 s. Once the wake field density has reached a stable state, the laser spot position is found to be 0.441mm, corresponding to a refractive index change of . These experimental results are found to be in general agreement with the simulation results of the propeller wake field. A comparison of the experimental device-based wake measurements with the CTD-based wake measurements reveals a consistent trend.
1. Introduction
The study of underwater vehicle wake detection is of significant importance within the field of target detection, localisation and tracking of underwater vehicles [
1]. For an extended period, traditional acoustic detection technology has been the primary method employed to detect underwater vehicles [
2,
3]. Nevertheless, the advancement of noise reduction technology for underwater vehicles has resulted in a significant reduction in the self-noise of these vehicles, which is now nearly indistinguishable from the background noise of the ocean [
4,
5,
6]. Consequently, traditional sonar equipment is no longer capable of detecting underwater vehicles. This suggests that the straightforward utilisation of acoustic detection of underwater vehicles is no longer sufficient to meet the demand for underwater vehicle detection. In order to enhance the efficacy of underwater vehicle detection, non-acoustic detection technology has increasingly become a focal point of investigation.
Among the numerous non-acoustic methodologies for the detection of submerged vehicles, though there are some promising non-acoustic techniques such as magnetic anomaly detection [
7], LIDAR [
8,
9], bioluminescence detection [
10] etc for the same purpose, they have some inherent limitations which restrict their use for detection over a wide area and from a large distance [
11]. The flow field generated by an underwater vehicle can serve as a valuable source of information for the development of underwater vehicle detection techniques, given its prolonged duration and extensive extension distance in density-stratified fluids [
12,
13,
14]. Biologists have discovered that marine animals possess the most well-documented underwater wake detection system, with fin-footed animals such as seals, sea lions, and walruses demonstrating the capacity to detect underwater propagating disturbances through their facial antennae [
15,
16,
17]. In 1998, Dehnhardt G et al. employed a trained seal to investigate the capacity to detect minute underwater disturbances in the absence of any non-contact sensory cues. This study revealed that a minimum fluid velocity of 245 μm/s could be detected in the range of 10-100 Hz [
18]. In 2016, Eberhardt, WC et al. proposed a bionic detection system based on underwater vehicle wake characteristics based on the capacitive inductive principle [
19]. It is found that the bionic whiskers can give signals of the travelling path direction of the underwater vehicle model, but the tracking trajectory has some deviations. In 1880, Dvorak initially proposed an optical system that was deemed suitable for observing changes in fluid density flow. The fundamental principle is that the point light source is collimated through the wake field, which is a consequence of the fluid density gradient changes. This results in the deflection of the collimated light, which in turn gives rise to spatial variations in light intensity, with bright and dark areas on the screen [
11]. In 2000, Dalziel SB et al. employed a line-mode synthetic rippling method utilising digital recording to generate a virtual mask in front of a camera, thereby enabling the measurement of the density gradient variation of the flow field in the wake of an underwater vehicle [
20]. In 2004, Elsinga GE et al. used a standard Z-type parabolic mirror rippler to make quantitative measurements of the flow field [
21]. In 2012, Hargather MJ et al. incorporated calibration means and data analysis and processing software into a detection method based on that employed by Elsinga GE. The resulting experiments demonstrated that the sensitivity for detecting refractive indices induced by underwater vehicles was 10
-5 RIU [
22]. In 2016, Ben-Gida H et al. performed wake field imaging detection experiments on an underwater vehicle model using particle image velocimetry (PIV) [
23]. In 2000, Stella A et al. used laser Doppler velocimetry (LDV) to probe the wake field of an underwater vehicle propeller model [
24]. In 2017, Paik, BG et al. conducted cavitation tests on the propeller of an underwater vehicle using LDV in a large vacuolar water cylinder at KRISO. The test results demonstrated a high degree of correlation between the measured propeller wake and the CFD calculations [
25]. In 2013, Tatavarti R. et al. constructed an underwater vehicle wake flow field detection system based on the principle of laser deflection. This was mounted on an oceanographic research vessel and placed at a depth of 42 m underwater, with the aim of monitoring the A74 ocean acoustic research vessel. The system was successfully employed to detect the flow field in its wake, and the detection system has a sensitivity of 10
-6 RIU for refractive index detection due to wake turbulence [
26].
Nevertheless, the shading technique is only capable of establishing the presence or absence of a wake flow, yet it is unable to ascertain the direction of light deflection [
11]. The shadow detection technique can only determine whether there is a wake stream or not, but cannot determine the direction of light deflection and the sensitivity is low. The density gradient of the wake stream can be known by the shadow detection technique, and the detection sensitivity of the shadow system is limited by the amount of knife cut due to the blockage of the cutter to determine the direction of vertical movement of the light. Particle image velocimetry relies on tracer particles and is therefore only suitable for small-area system detection. Laser Doppler velocimetry has a large deviation in wake detection because of the signal drift during the long detection time [
27]. In the laser deflection detection technique, the output current of the photodiode is processed by the beam position and power measurement system, so as to obtain the change of laser intensity and deflection related to the nature of the medium wake field, and the corresponding detection system has been applied to test experiments, and has successfully detected the detection target at 8 kilometers through the wake current [
26]. A comparative analysis of non-acoustic detection methods reveals that the laser deflection principle exhibits superior sensitivity and stability in the detection of underwater vehicle wakes.
In light of the necessity for an underwater vehicle wake detection method that is capable of accurately identifying the position of the vehicle in question, we propose a position-sensitive detector-based approach that utilises the laser deflection principle. A theoretical model has been developed which describes the relationship between the displacement of a laser spot and the gradient change of the refractive index in the wake field of an underwater vehicle. This model is based on the principle of laser beam deflection. Based on this optical detection method, an experimental apparatus for the detection of the wake current field of underwater vehicles was constructed. Since propellers are the propellers of modern ships and underwater vehicles [
28,
29,
30], propellers are chosen as the power source of the target wake flow. In the design of the experimental setup, a three-bladed propeller with a diameter of 39mm was selected, the water tank size was
, and the laser acted at a distance of 550mm from the propeller. The sensitivity of the refractive index gradient measurement of the wake field based on the parameters of this propeller wake measurement device has been calculated to be
. The experimental results show that: the experimental results demonstrate that in a strong density-stratified water environment, the detection signal of the propeller wake field persists for approximately 800 seconds. As the wake field power attenuates continuously, the wake field density gradually stabilises, with the final laser spot position stabilising at 0.341mm. This corresponds to a change in the refractive index of the flow field of
. In a linear density-stratified water environment, the detection signal of the propeller wake field lasts approximately 750 seconds. As the wake field power is attenuated continuously, the wake field density gradually stabilises, with the final laser spot position stabilising at 0.441mm. This corresponds to a change in the refractive index of the flow field of
. The signal characteristics of the propeller wake field, as measured by the PSD-based experimental setup for underwater propeller wake measurement, are found to be essentially consistent with those of the corresponding simulation results. A comparison of the experimental device-based wake measurements with the CTD-based wake measurements reveals a consistent trend.
2. Principle of the Underwater Vehicle Wake Detection
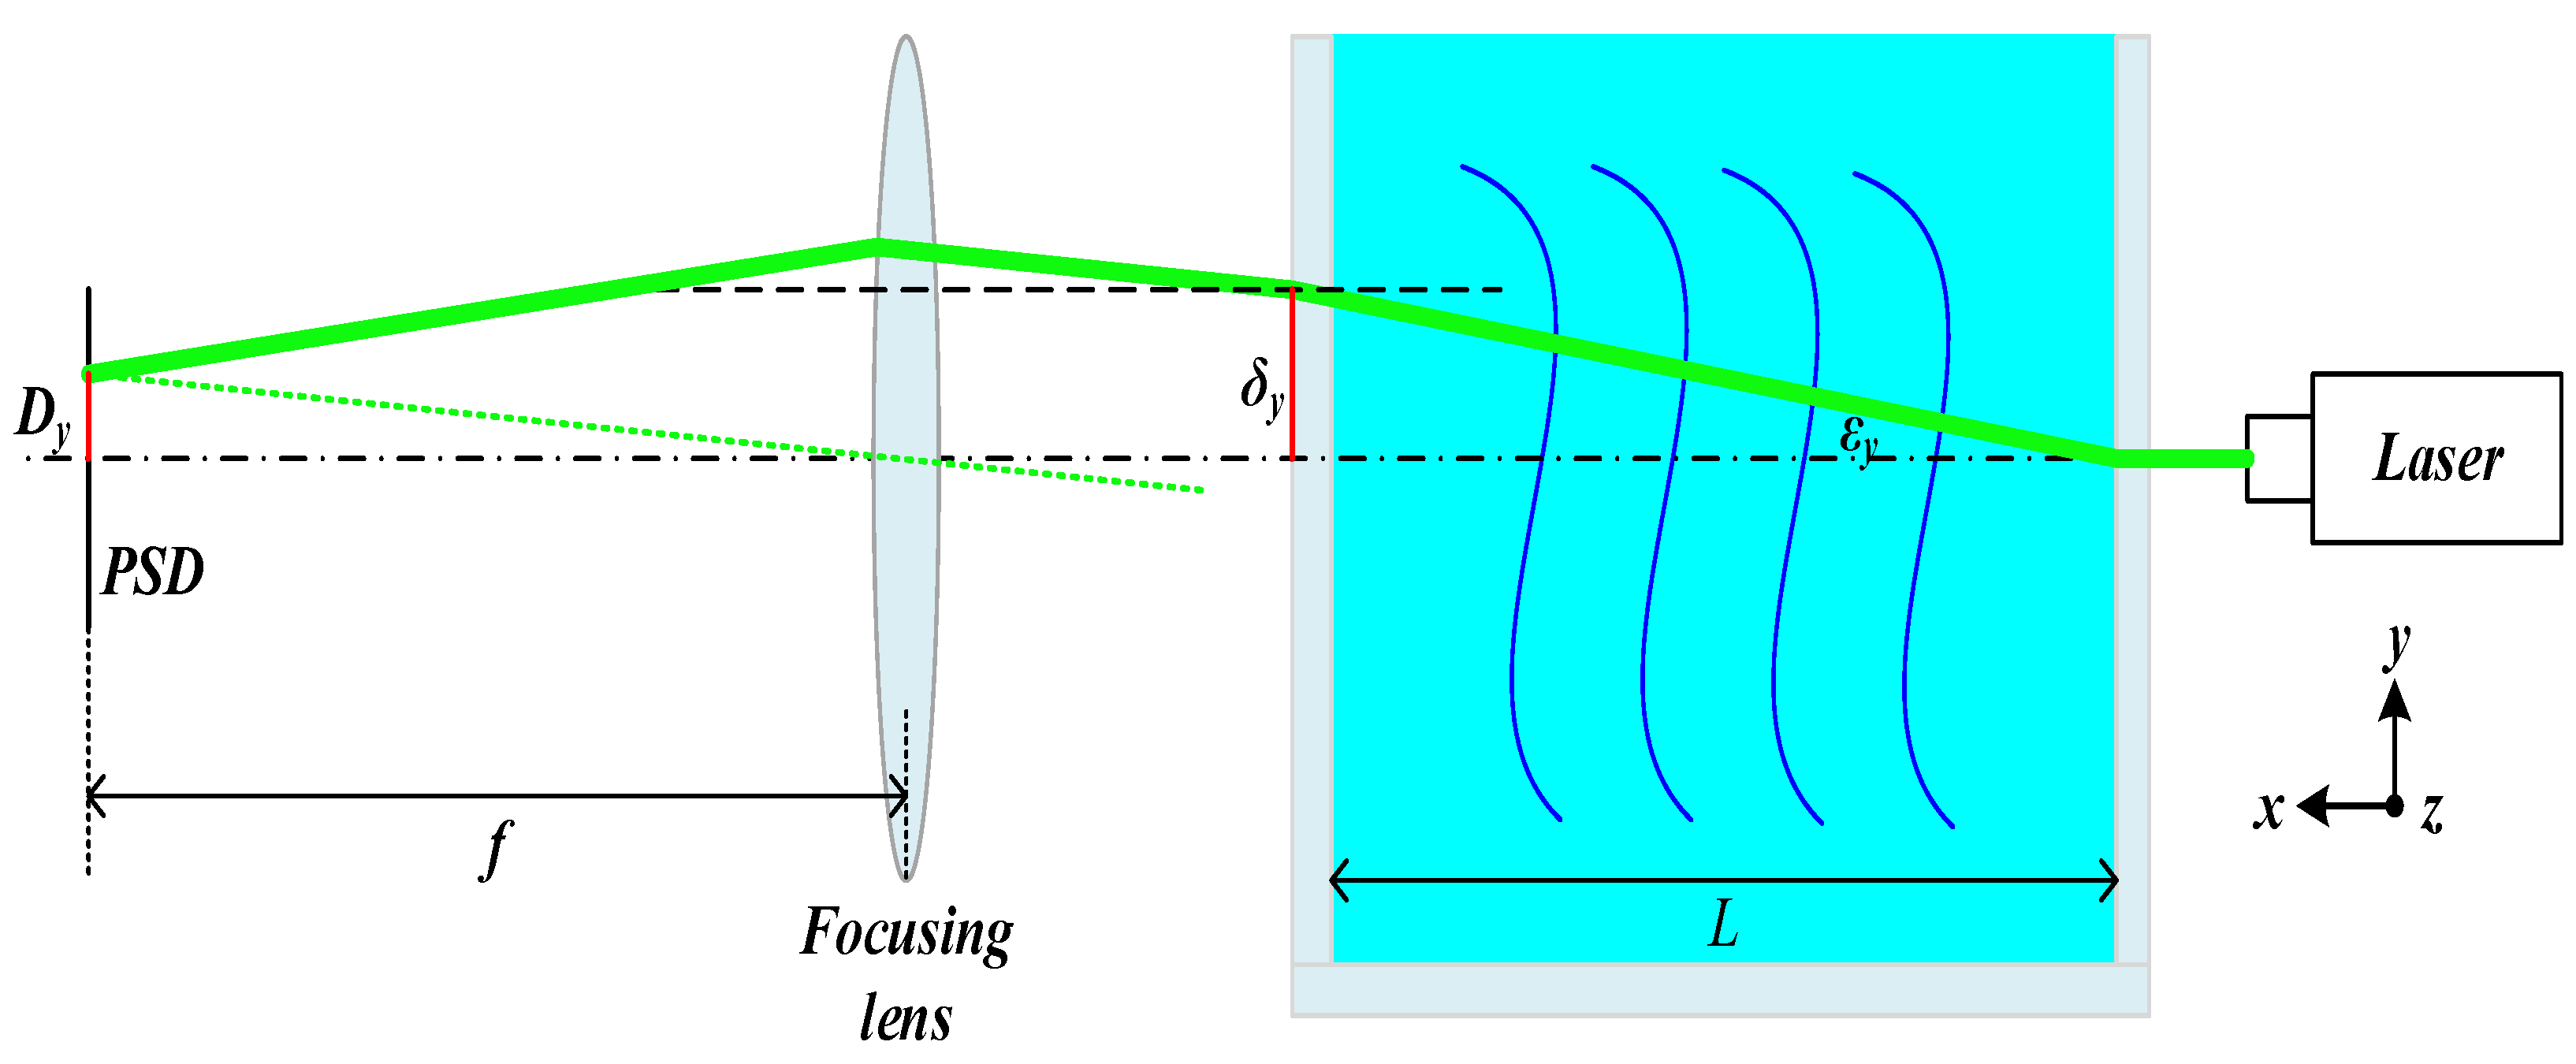
The principle underlying underwater vehicle wake detection is that of laser beam deflection, as illustrated in the schematic diagram presented in
Figure 1. The laser beam is incident vertically upon the glass water cylinder, subsequently reaching the designated area for the detection of underwater vehicle wakes. The propeller disturbance caused by the refractive index gradient change for the wake field results in a laser and wake field interaction, which is manifested as a deflection phenomenon. Subsequently, the laser traverses the glass water cylinder and is focused to a point on the photosensitive surface of the PSD via a focusing lens. Consequently, the position coordinates of the laser spot following the perturbation of the wake field were obtained utilising the PSD.
In light of the existence of a refractive index gradient in the
y,
z direction of the flow field, it can be expressed as follows [
10]:
where
x is the direction of light propagation,
n is the refractive index, and the curvature of the refracted light
and
are represented by the gradient of the refractive index
and
of the underwater vehicle wake.
In the underwater vehicle wake current field detection area, the angle of deflection of the light ray in the direction of
y axes and
z axes is obtained by integrating Equation (1) and (2), as follows:
where the
is the angle of deflection of the light ray in the direction of
y axis and
is the gradient of the refractive index in the
y axis direction, the
is the angle of deflection of the light ray in the direction of
z axis and
is the gradient of the refractive index in the
z axis direction.
Since the deflection angle is small and the distance of the laser through the flow field is
L, there is the following relationship:
where
n0 is the refractive index of underwater vehicle wake field before perturbation.
Therefore, the gradient of the refractive index in the
y axis direction is expressed as follows:
The same reasoning can be applied:
where the
is the displacement of the light ray in the direction of
y axis, and the
is the displacement of the light ray in the direction of
z axis.
Refraction occurs when the laser light passes from the flow field through the glass on the wall of the water tank, which satisfies the law of refraction, so the refractive index gradient with respect to the position
and
on the photosensitive surface of the PSD is expressed as:
where the
f is the focal length of the focusing lens.
3. Experimental Setup
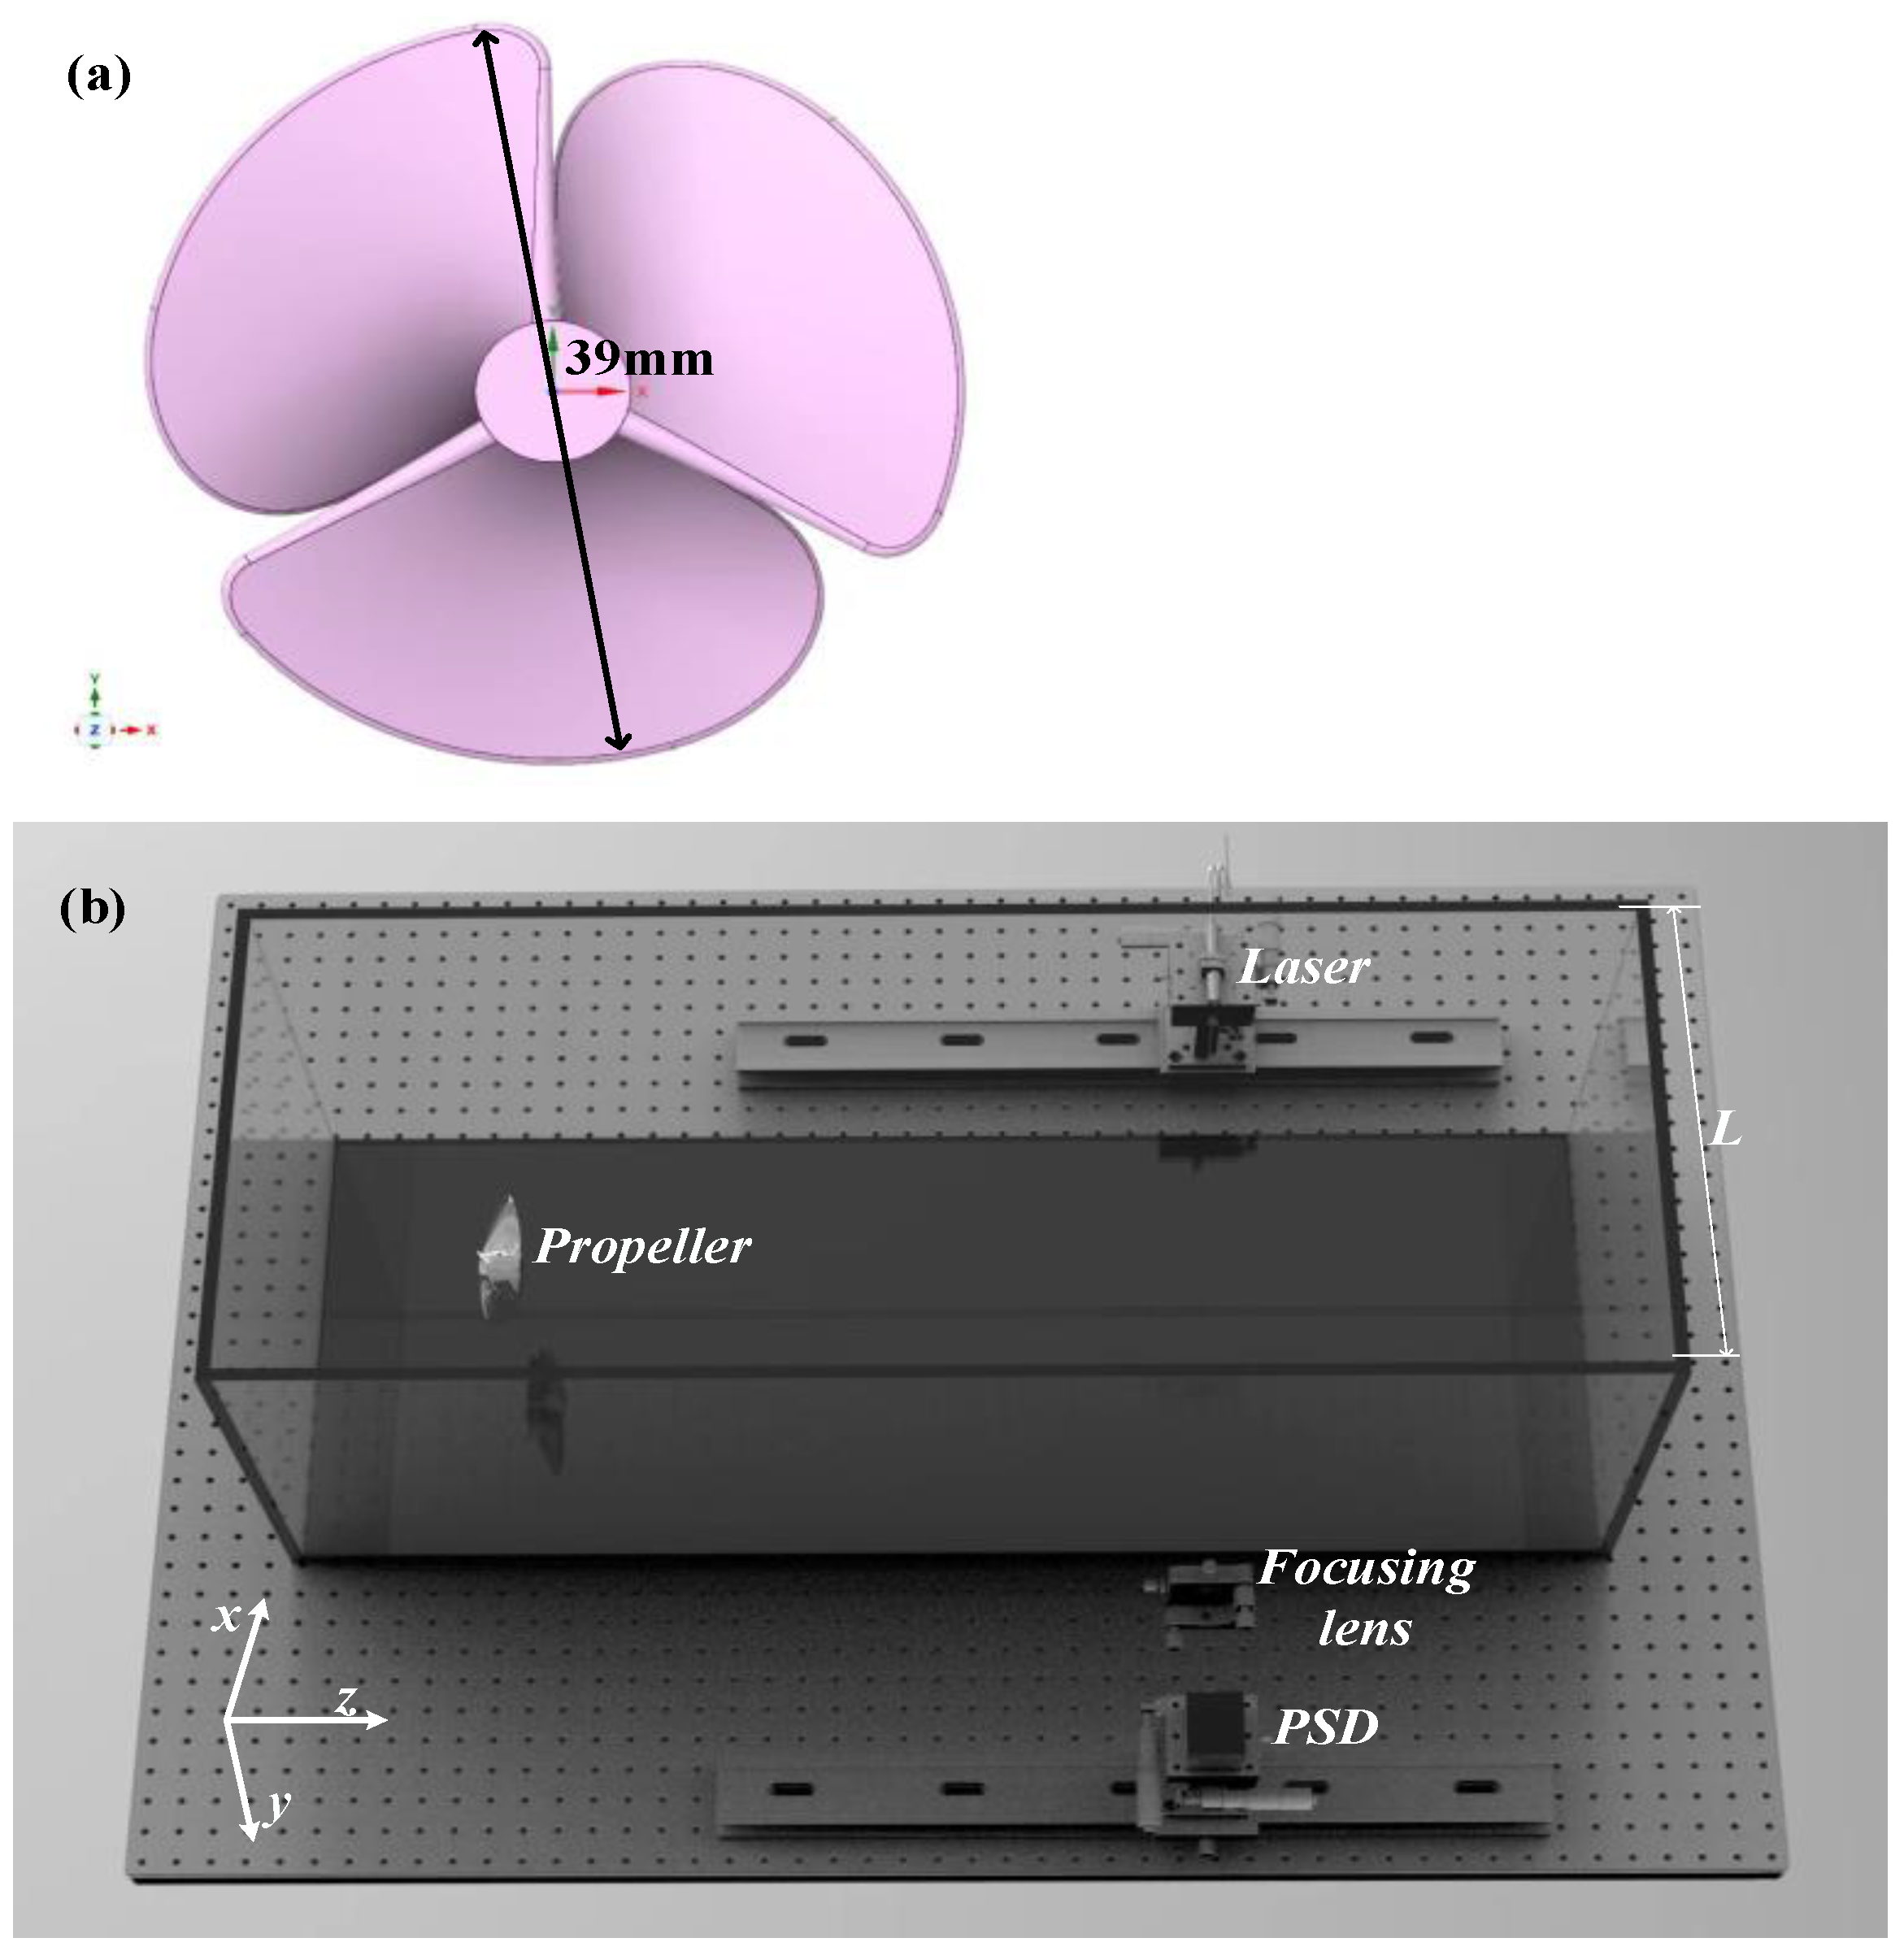
The propeller wake detection experimental setup is shown in
Figure 2. A three-bladed propeller with a diameter of 39 mm was selected for the experiment, and the structure of the propeller is illustrated in
Figure 2 (a). And the propeller speed is 110 revolutions per second. The configuration of the experimental setup for propeller wake detection is illustrated in
Figure 2 (b).
In the experiment, In order to reduce the impact of the propeller wake field by the glass water tank wall, the selection of glass water tank for flow field detection experiments, the glass water tank wall flatness is good, and the laser incident and outgoing wake field of the two glass parallel to each other. The propeller is positioned at a distance of 115mm from the bottom surface of the glass tank and 150mm from the left wall surface of the glass tank, with the centre of the propeller located at this point. In order to minimise the absorption and scattering effects of seawater on the detection light source, a green collimated laser with a centre wavelength of 532 nm was employed as the detection light source in the wake field detection device. The laser beam is directed vertically into the wake field at a distance of 500 mm from the propeller, at the same height as the centre of the propeller. After interacting with the propeller wake field, the laser is focused onto the PSD photosensitive surface by a lens with a focal length of 300 mm. The dimensions of the PSD’s photosensitive area are , and the position measurement resolution is approximately 1 μm. To ensure the positional resolution of the PSD, in front of the light-sensitive surface of the PSD, the narrow-band light filter, with the same peak wavelength and a bandwidth of 0.9 nm, is used to filter out the stray light, except for the 532 nm measurement light. And it is imperative that the PSD photosensitive surface remains parallel to the laser outgoing surface of the glass water tank. The sensitivity of the refractive index gradient measurement of the wake field based on the parameters of this propeller wake measurement device has been calculated to be according to the theoretical equations (9) and (10).
4. Simulation Analysis
The propeller wake is simulated and analysed based on the propeller wake measurement experimental setup described above. The centre of the propeller is taken as the symmetry axis, and two cross sections in different directions, transverse (xz-plane) and longitudinal (yz-plane), are selected for the purpose of analysing the spatial evolution law of the propeller wake flow field.
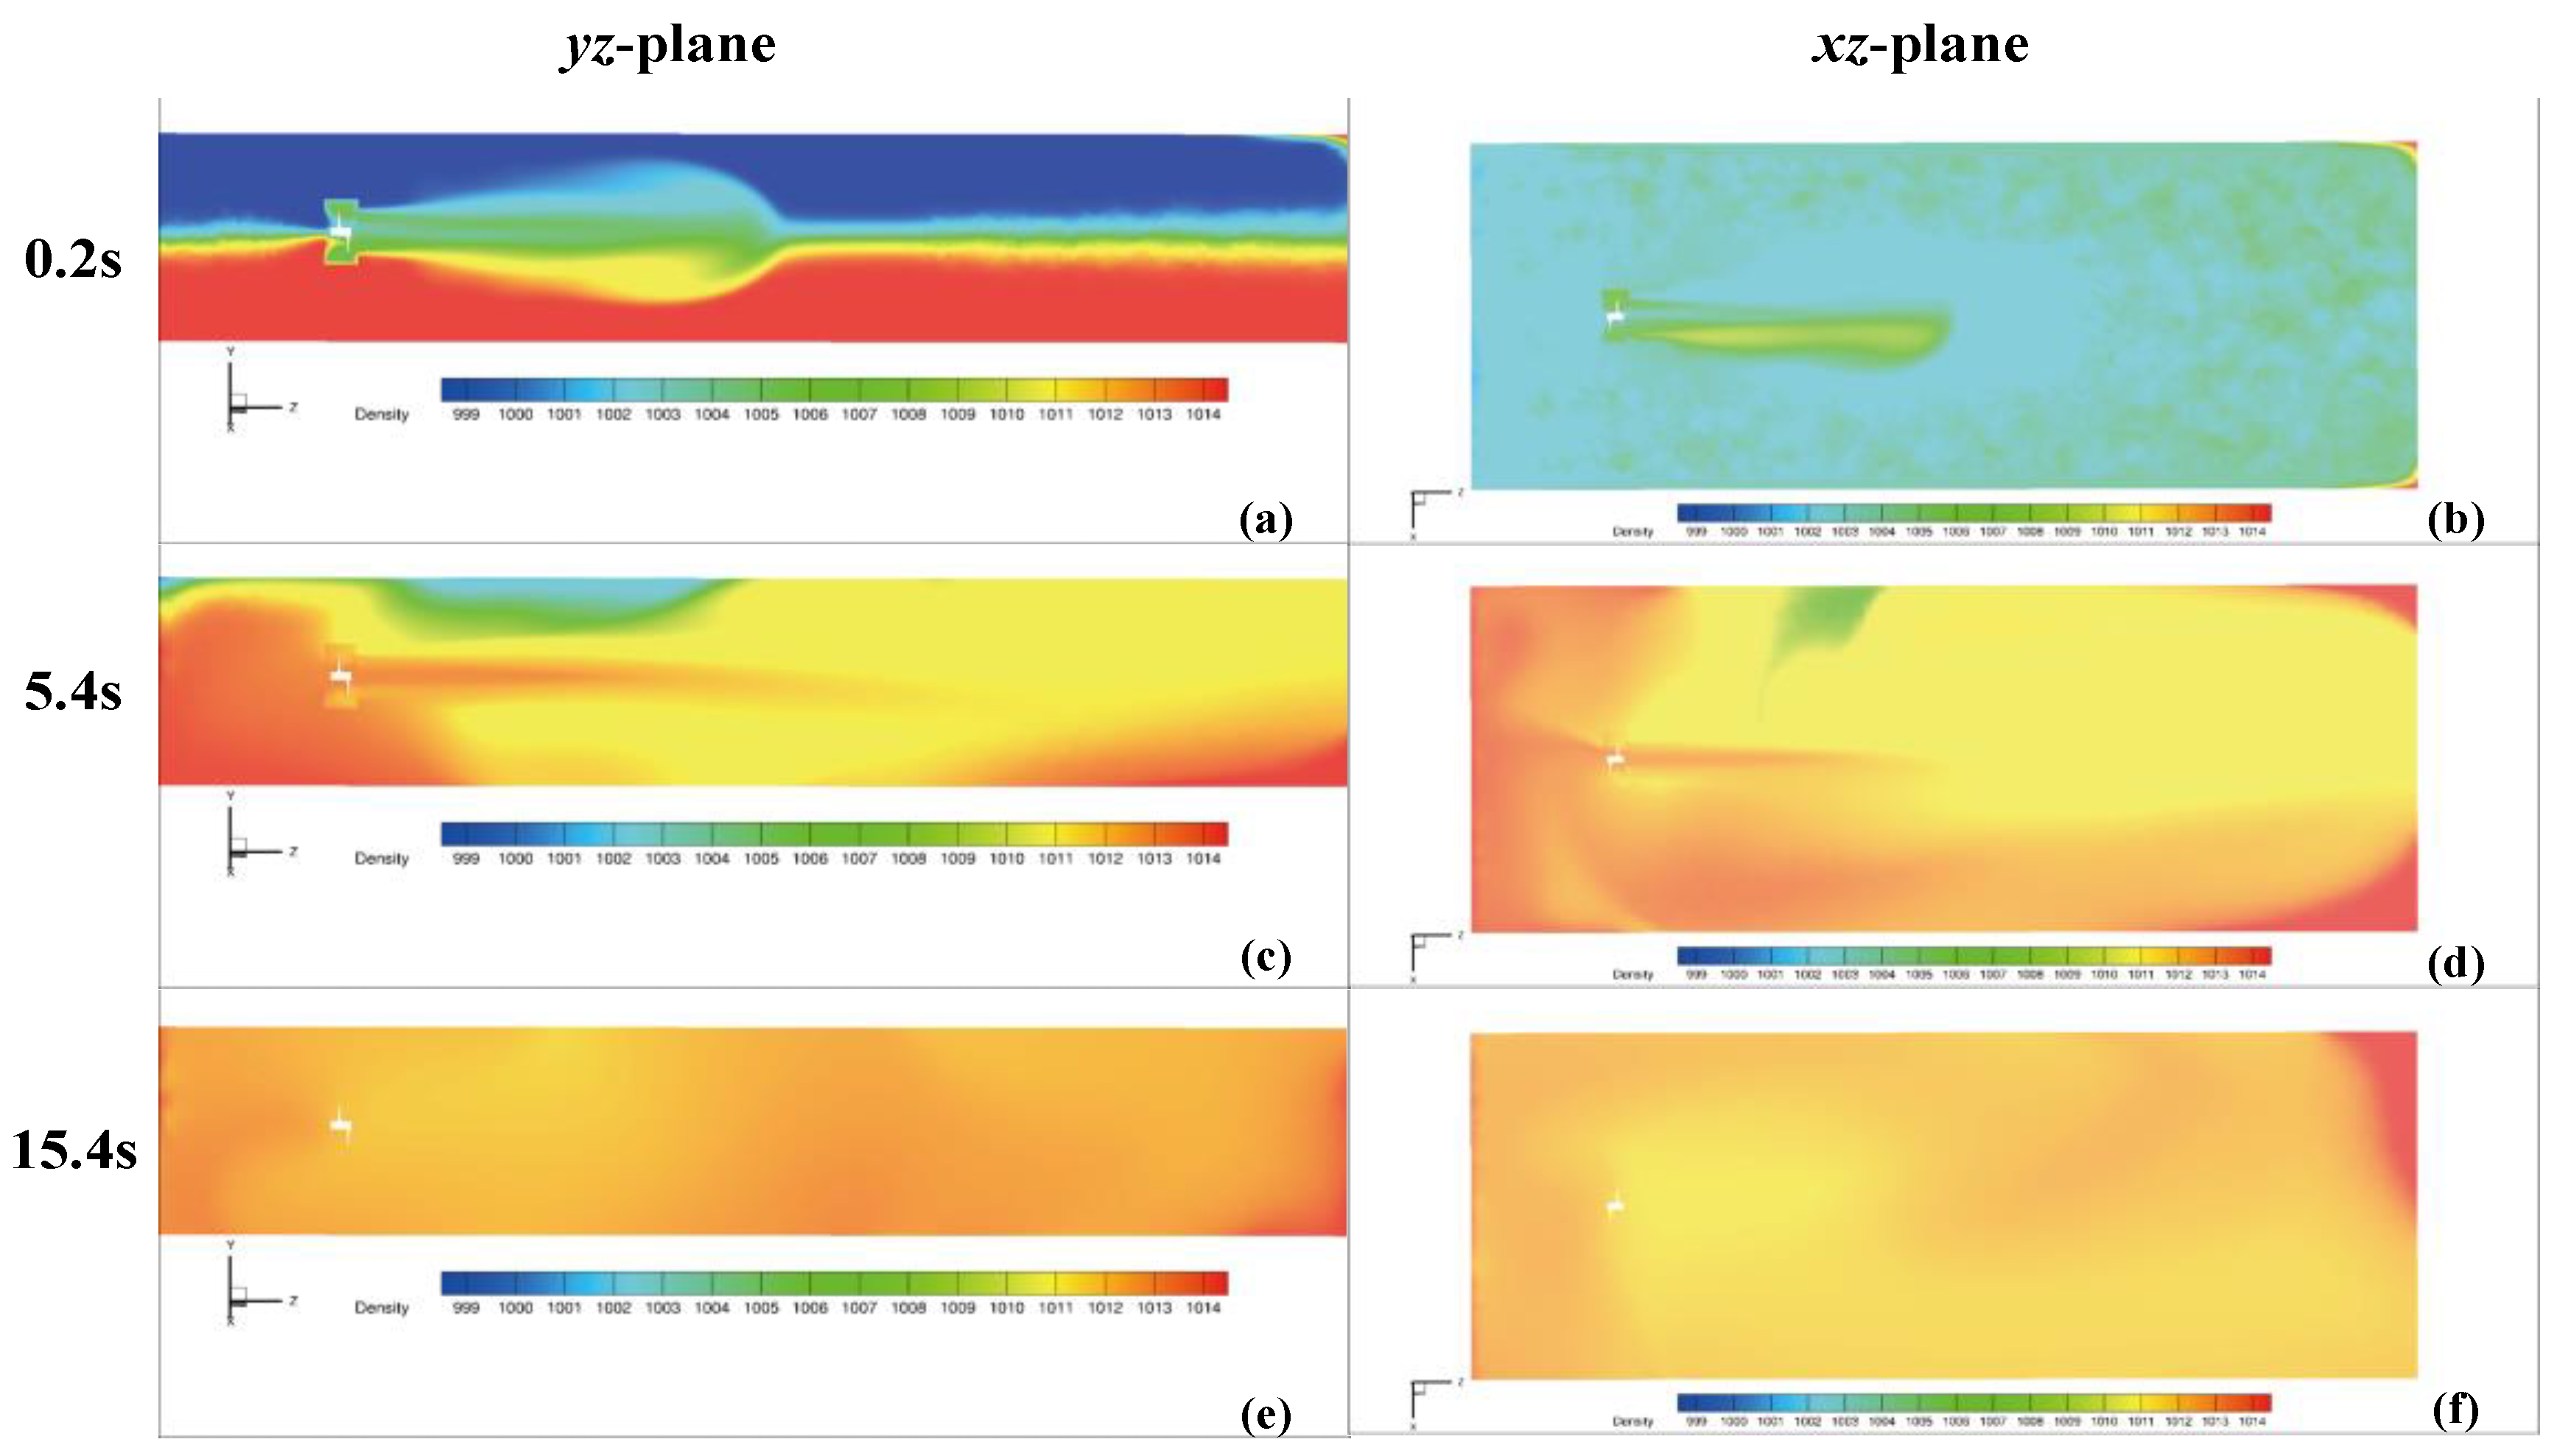
The results of the propeller wake simulation at strong density stratification are shown in
Figure 3. During the wake field simulation, a water depth of 230 mm was set, and the depth of 115 mm represented a strong density-stratified interface, which was consistent with the height of the propeller centre. The upper layer is composed of pure water with a density of 1000 kg/m
3, while the lower layer is seawater with a salinity of approximately 20 PSU and a density of 1014 kg/m
3. The relationship between the refractive index and the density of a propeller wake is given by the Gladstone-Dale Equation,
n=1+
κρ, where,
n is the optical refractive index,
ρ the density of the fluid and
κ is a constant coefficient which is a function of the laser wavelength and the fluid characteristics [
26]. This is indicative of a refractive index of approximately 1.34 RIU for the upper layer of pure water and 1.34476 RIU for the lower layer of brine. The optical refractive index is linearly related to fluid density.
Figure 3(a) illustrates the density distribution of the wake field in the
yz-plane following 0.2 s of propeller rotation. The wake is propelled to a distance of 380 mm from the propeller, with the density within the wake field ranging from 1002 kg/m
3 to 1011 kg/m
3. The corresponding refractive indices are approximately 1.34068 RIU to 1.34374 RIU.
Figure 3(b) illustrates the density distribution of the wake field in the
xz-plane following 0.2 s of propeller rotation. The density within the wake field is observed to range from 1008 kg/m
3 to 1010 kg/m
3. The corresponding refractive indices are approximately 1.34272 RIU to 1.3434 RIU. The propeller rotates for 5s and then stops rotating. Figures 3(c) and 3(d) illustrate the density distributions of the wake field in the
yz and
xz-plane, respectively, following a 5.4 s rotation of the propeller. The density within the wake field ranges from 1011 kg/m
3 to 1013 kg/m
3. The corresponding refractive indices are approximately 1.34374 RIU to 1.34442 RIU. Figures 3(e) and 3(f) show the density distributions of the wake field in the
yz and
xz-plane, respectively, after the propeller rotates for 15.4 s. The density within the wake field ranges from 1011 kg/m
3 to 1012 kg/m
3. The corresponding refractive indices are approximately 1.34374 RIU to 1.34408 RIU. The simulation of the propeller wake field in the case of strong density stratification reveals that when the propeller stops rotating, the density distribution range of the wake field gradually becomes smaller. This indicates that the density of the propeller wake field is gradually becoming uniform and stable.
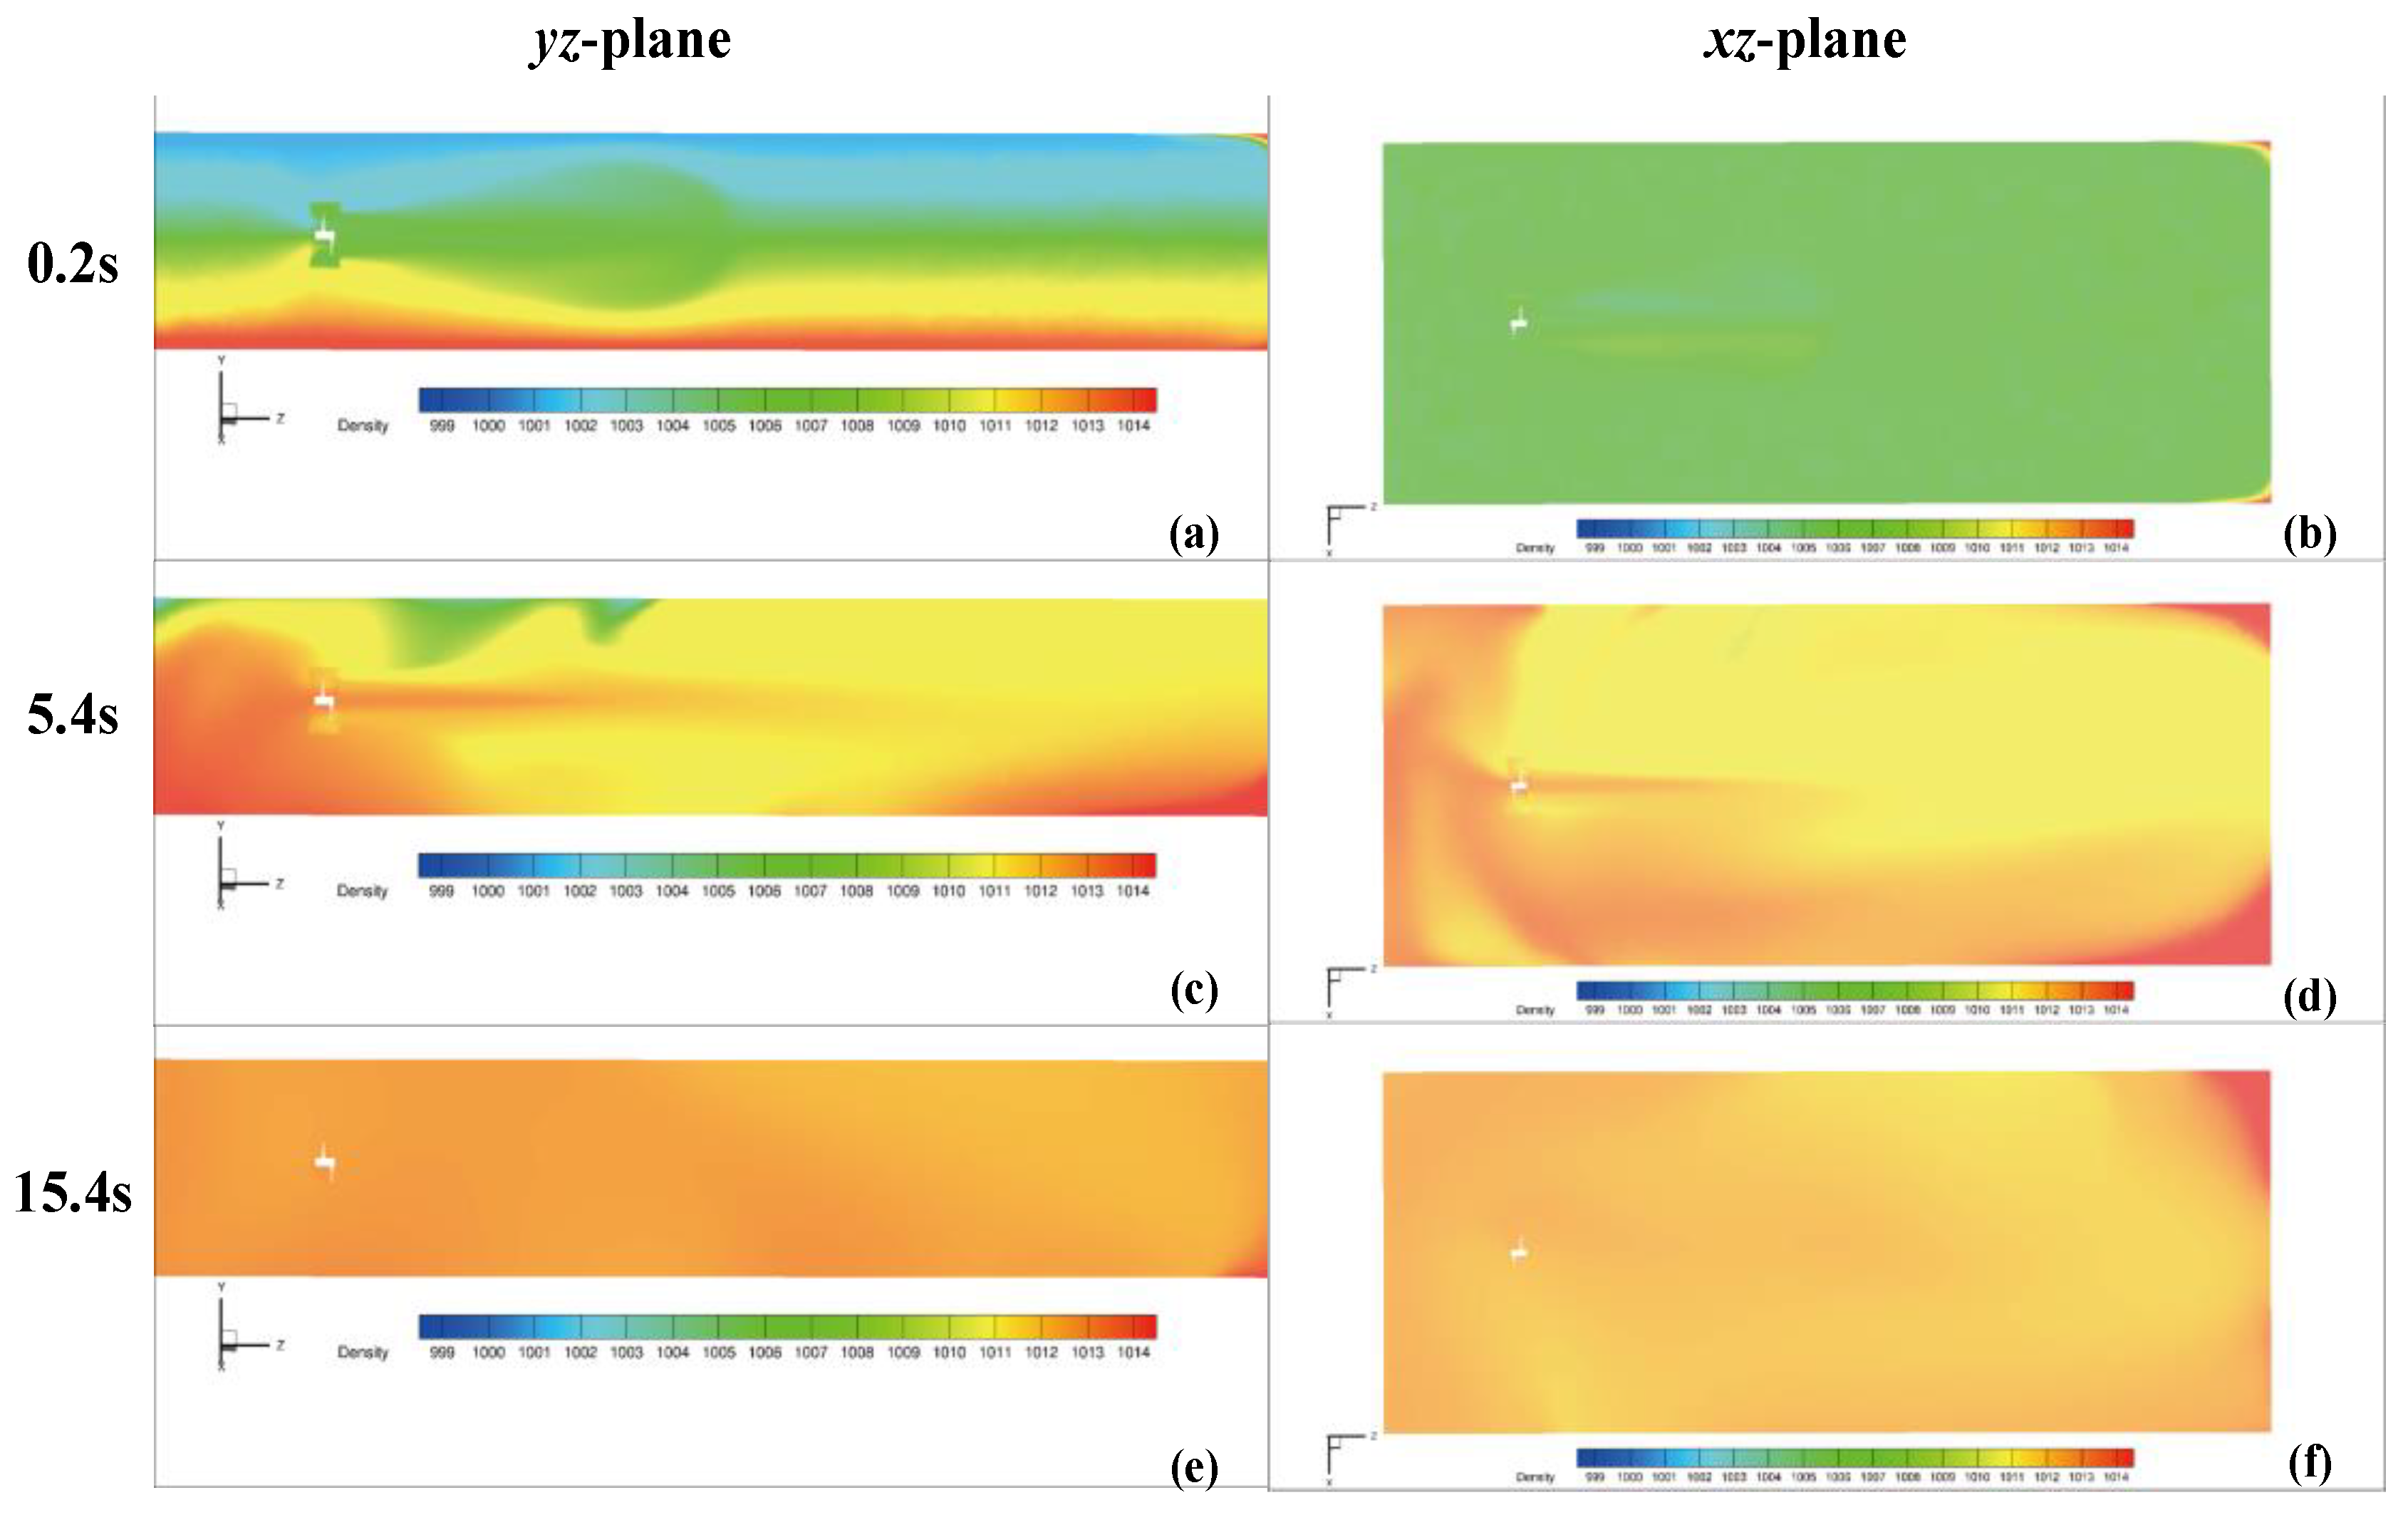
The results of the propeller wake simulation under conditions of linear density stratification are presented in
Figure 4. During the wake field simulation, a water depth of 230 mm was set, and the density distribution varies linearly with depth. The density of the top water layer is 1001 kg/m
3 and the density of the bottom water layer is 1014 kg/m
3. The corresponding refractive indices of the top water layer is 1.34034 RIU and the refractive indices of the bottom water layer is 1.34476 RIU.
Figure 4(a) illustrates the density distribution of the wake field in the
yz-plane following 0.2 s of propeller rotation. The wake is propelled to a distance of 380 mm from the propeller, with the density within the wake field ranging from 1004 kg/m
3 to 1009 kg/m
3. The corresponding refractive indices are approximately 1.34136 RIU to 1.34306 RIU.
Figure 4(b) illustrates the density distribution of the wake field in the
xz-plane following 0.2 s of propeller rotation. The density within the wake field is observed to range from 1007 kg/m³ to 1009 kg/m³. The corresponding refractive indices are approximately 1.34238 RIU to 1.34306 RIU. The propeller rotates for 5s and then stops rotating. Figures 4(c) and 4(d) illustrate the density distributions of the wake field in the
yz and
xz-plane, respectively, following a 5.4 s rotation of the propeller. The density within the wake field ranges from 1011 kg/m
3 to 1013 kg/m
3. The corresponding refractive indices are approximately 1.343374 RIU to 1.34442 RIU. Figures 4(e) and 4(f) show the density distributions of the wake field in the
yz and
xz-plane, respectively, after the propeller rotates for 15.4 s. The density within the wake field ranges from 1012 kg/m
3 to 1013 kg/m
3. The corresponding refractive indices are approximately 1.34408 RIU to 1.34442 RIU. The simulation of the propeller wake field in the case of linear density stratification reveals that when the propeller stops rotating, the density distribution range of the wake field gradually becomes smaller. This indicates that the density of the propeller wake field is gradually becoming uniform and stable.
In comparison to the strong density stratification case, the density distribution range of the propeller wake field is 4 kg/m³ smaller in the linear density case when the propeller is rotating. However, when the density tends to be uniform and stable, the density range of the wake field remains largely unchanged.
5. Results and Discussion
5.1. Results of Propeller Wake Measurements Conducted in a Strong Density Stratification Water Environment
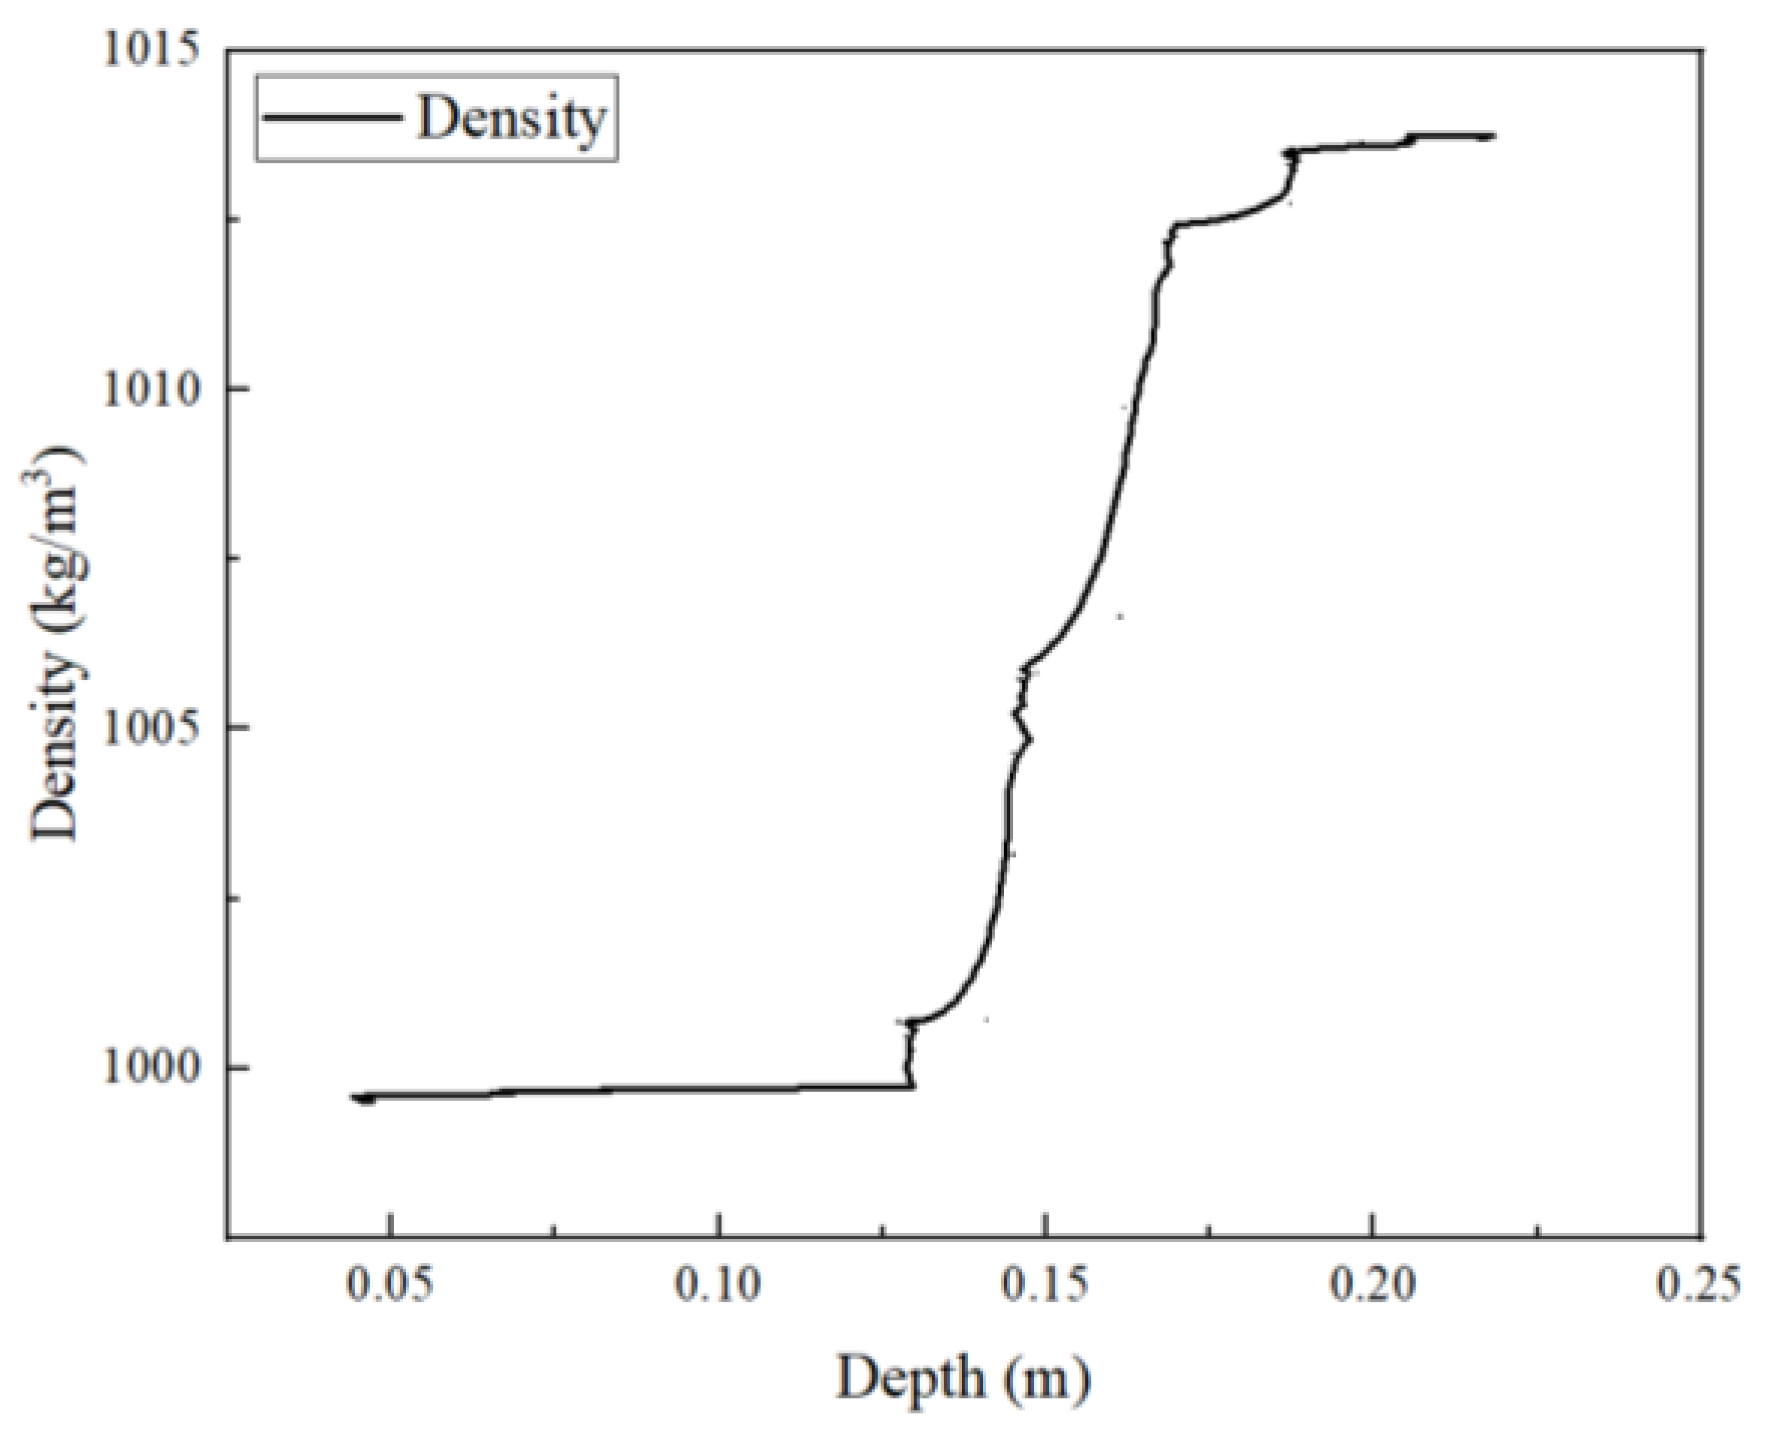
In the experiment, the propeller was fixed in a strongly density-stratified water environment, with the centre of the propeller maintained at the same height as the strongly density-stratified interface. Conductivity measurements were taken using a CTD (conductivity–temperature–depth) to determine the conductivity change of the water environment at different underwater depths, and the resulting density profiles were calculated. The resulting density change curve with depth change is shown in
Figure 5. The upper water layer has a density of approximately 1000 kg/m
3, while the lower salted water layer has a density of approximately 1014 kg/m
3. The corresponding refractive indices of the top water layer is approximately 1.34 RIU and the refractive indices of the bottom water layer is approximately 1.34476 RIU.
The sampling frequency of the experimental setup was set to 10 kHz, and prior to the collection of laser spot position data, it is necessary to calibrate the laser spot position to the zero point of the PSD photosensitive surface. The results of propeller wake measurements conducted in a strong density stratification water environment are presented in
Figure 6(a). The ambient signal was acquired for a period of 60 s prior to the commencement of propeller rotation. The propeller rotates at a rate of 110 revolutions per second for a period of 5 s, after which it ceases to rotate. A total of 1800 s of signals were acquired for the experiment. Following cessation of propeller rotation, the laser spot position undergoes a significant change for approximately 360 s. The maximum displacement of the laser spot is 4.689 mm. As the wake field dynamics decrease, the wake density stabilises after 800 ds following cessation of propeller rotation and the position of the laser spot remains constant. The position of the laser spot is stabilised at 0.341 mm. The sensitivity of the propeller wake measurement device in terms of refractive index measurement was taken into account, this displacement corresponds to a refractive index change of
caused by the propeller wake flow field in the detection zone. The laser spot position signal generated by the propeller wake exhibits a decreasing amplitude over time. This phenomenon can be observed as the laser spot displacement gradually diminishes as the propeller wake dissipates.
Figure 6(b) illustrates the background position signal, the laser position signal induced by 5 s of propeller rotation, and the laser position signal 25 s after the propeller stops rotating. These signals were measured in the propeller wake for a strongly stratified water environment. The alteration in the laser position signal resulting from the propeller wake is largely in accordance with the simulation outcomes pertaining to the wake field.
Figure 6(c) illustrates the density signal generated by the propeller wake flow, as obtained through CTD measurement. The trend of the density change in the wake field is found to be essentially concordant with the trend of the wake measurement results obtained by means of a PSD-based propeller wake measurement device.
5.2. Results of Propeller Wake Measurements Conducted in a Linear Density Stratification Water Environment
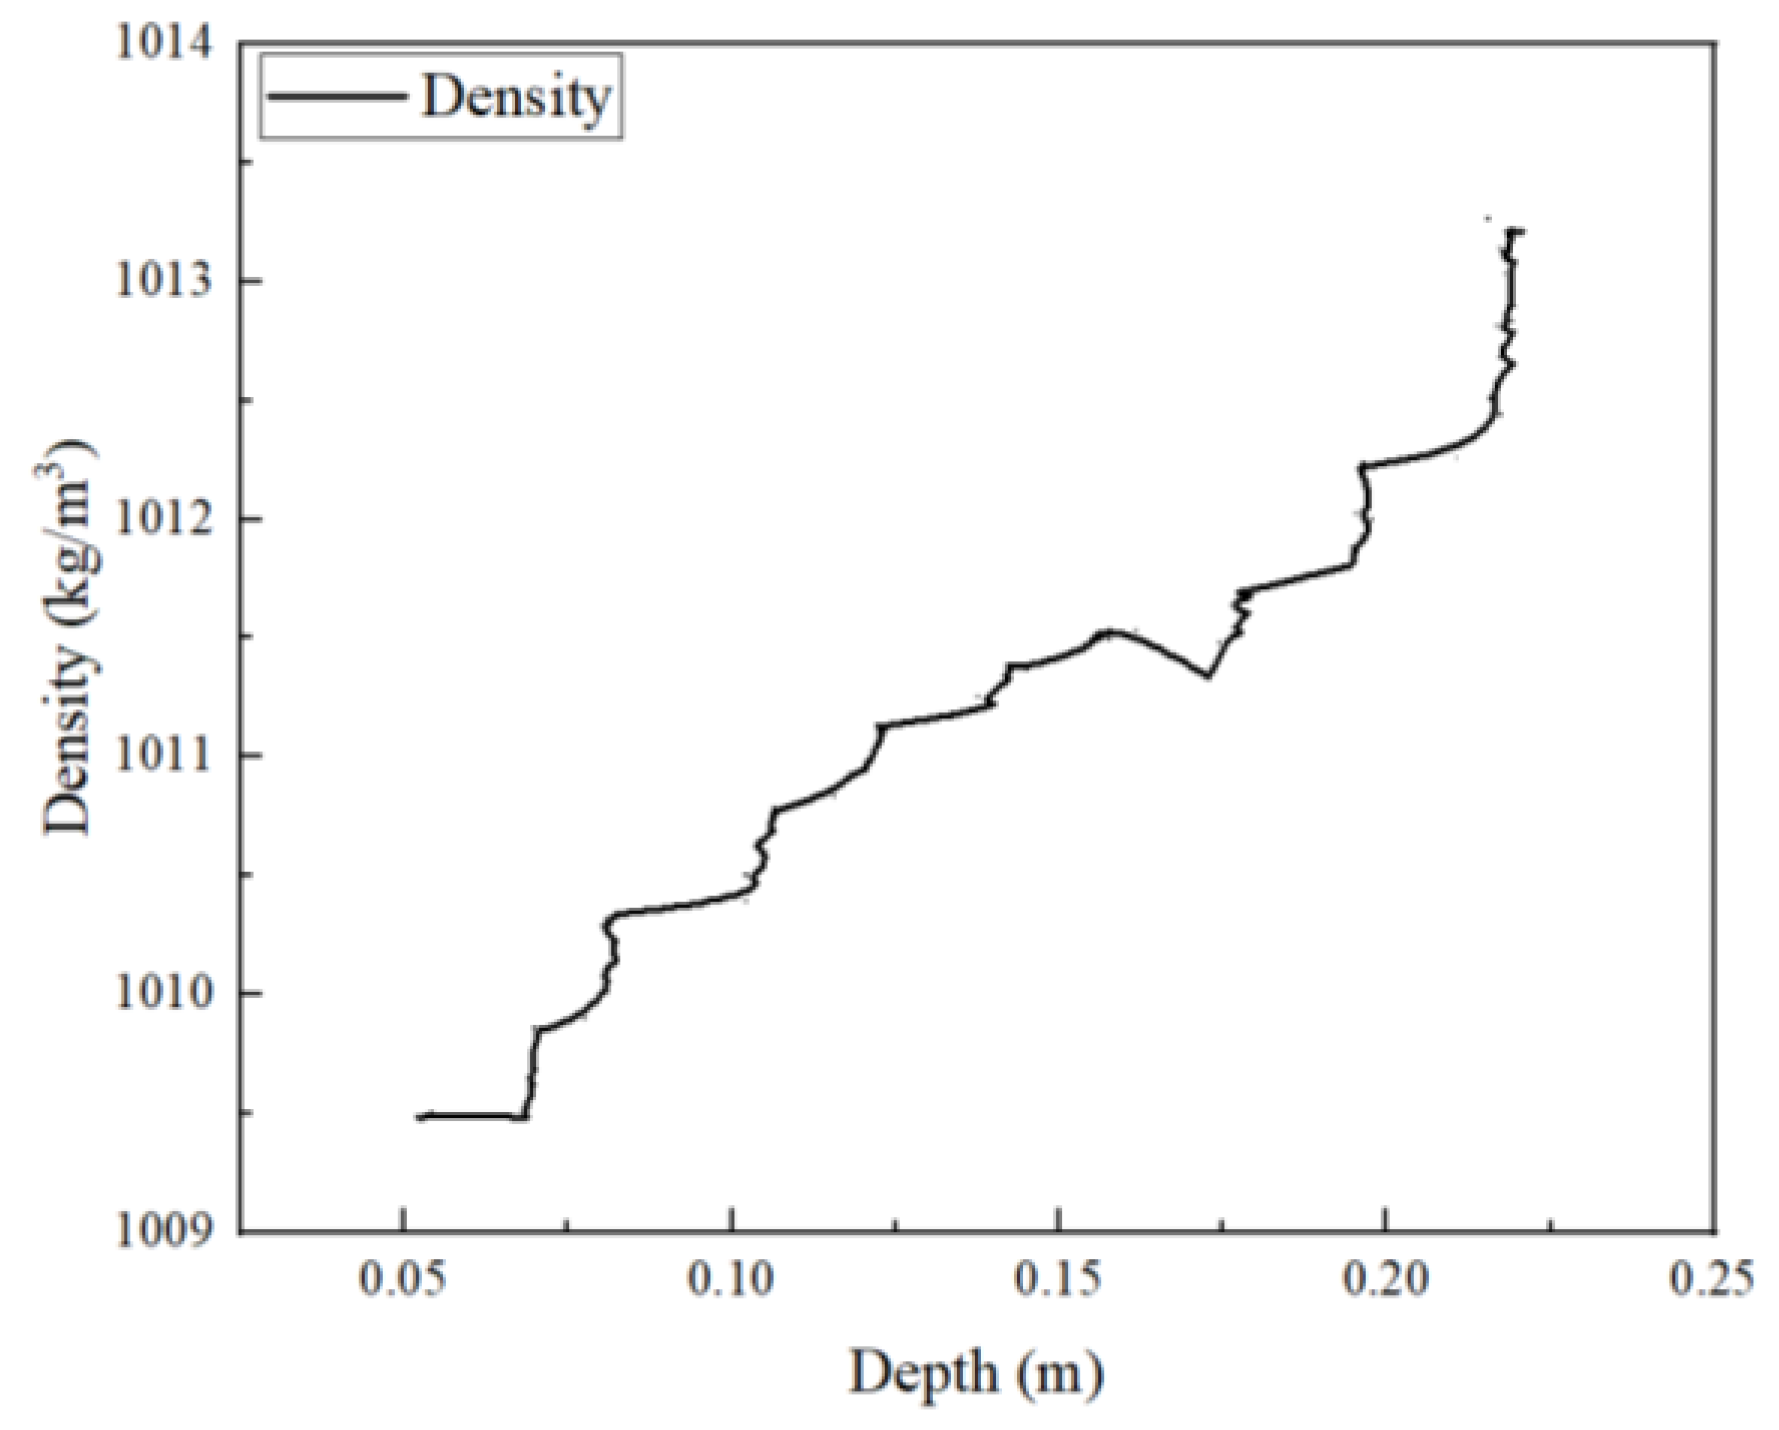
In the experiment, the propeller was fixed in a linear density-stratified water environment. Conductivity measurements were taken using a CTD to determine the conductivity change of the water environment at different underwater depths, and the resulting density profiles were calculated. The resulting density change curve with depth change is shown in
Figure 7. The upper water layer has a density of approximately 1009.5 kg/m
3, while the lower salted water layer has a density of approximately 1013.4 kg/m
3. The corresponding refractive indices of the top water layer is approximately 1.34323 RIU and the refractive indices of the bottom water layer is approximately 1.344556 RIU. The density varies linearly with depth underwater.
The sampling frequency of the experimental setup was set to 10 kHz, and prior to the collection of laser spot position data, it is necessary to calibrate the laser spot position to the zero point of the PSD photosensitive surface. The results of propeller wake measurements conducted in a linear density stratification water environment are presented in
Figure 8(a). The ambient signal was acquired for a period of 60 s prior to the commencement of propeller rotation. The propeller rotates at a rate of 110 revolutions per second for a period of 5 s, after which it ceases to rotate. A total of 1800 s of signals were acquired for the experiment. Following cessation of propeller rotation, the laser spot position undergoes a significant change for approximately 240 s. The maximum displacement of the laser spot is 1.673 mm. As the wake field dynamics decrease, the wake density stabilises after 750 s following cessation of propeller rotation and the position of the laser spot remains constant. The position of the laser spot is stabilised at 0.441 mm, which corresponds to a refractive index change of
caused by the propeller wake flow field in the detection zone. The laser spot position signal generated by the propeller wake exhibits a decreasing amplitude over time. This phenomenon can be observed as the laser spot displacement gradually diminishes as the propeller wake dissipates.
Figure 8(b) illustrates the background position signal, the laser position signal induced by 5 s of propeller rotation, and the laser position signal 25 s after the propeller stops rotating. These signals were measured in the propeller wake for a strongly stratified water environment. The alteration in the laser position signal resulting from the propeller wake is largely in accordance with the simulation outcomes pertaining to the wake field.
Figure 8(c) illustrates the density signal generated by the propeller wake flow, as obtained through CTD measurement. The trend of the density change in the wake field is found to be essentially concordant with the trend of the wake measurement results obtained by means of a PSD-based propeller wake measurement device.
5.3. Discussion
Comparing the propeller wake signal characteristics in the two water environments of strong density stratification and linear density stratification, the duration of the propeller wake field dynamics in the case of strong density stratification is about 50 s longer than that in the case of linear density stratification, and the time of drastic change of the laser spot position caused by the propeller wake field is about 120 s longer than that in the case of linear density stratification. The maximum displacement of the laser spot caused by the propeller wake in the case of strong density stratification is larger than that in the case of linear density stratification by 3.016 mm, but the refractive index change in the case of linear density stratification is larger than that in the case of strong density stratification by . Therefore, the signal characteristics of the propeller wake field measured by the PSD-based experimental setup of underwater propeller wake measurement are basically the same as those of the simulation results of the propeller wake field. And a comparison of the experimental device-based wake measurements with the CTD-based wake measurements reveals a consistent trend.
6. Conclusions
In this paper, we propose a position-sensitive detector-based approach that utilises the laser deflection principle. A theoretical model has been developed which describes the relationship between the displacement of a laser spot and the gradient change of the refractive index in the wake field of an underwater vehicle. This model is based on the principle of laser beam deflection. Based on this optical detection method, an experimental apparatus for the detection of the wake current field of underwater vehicles was constructed. Since propellers are the propellers of modern ships and underwater vehicles, propellers are chosen as the power source of the target wake flow. In the design of the experimental setup, a three-bladed propeller with a diameter of 39mm was selected, the water tank size was 980mm×380mm×380mm, and the laser acted at a distance of 550mm from the propeller. The density distribution characteristics of the wake field of the propeller were simulated and analysed in accordance with the relevant parameters of the experimental apparatus. This was done in two cases of strong density stratification and linear density stratification. In order to conduct the experiments and wake field simulations, the propeller was set to rotate at 110 revolutions per second for a period of five seconds, after which it was stopped. The experimental results demonstrate that in a strong density-stratified water environment, the detection signal of the propeller wake field persists for approximately 800 seconds. As the wake field power attenuates continuously, the wake field density gradually stabilises, with the final laser spot position stabilising at 0.341mm. This corresponds to a change in the refractive index of the flow field of . In a linear density-stratified water environment, the detection signal of the propeller wake field lasts approximately 750 seconds. As the wake field power is attenuated continuously, the wake field density gradually stabilises, with the final laser spot position stabilising at 0.441mm. This corresponds to a change in the refractive index of the flow field of . The signal characteristics of the propeller wake field, as measured by the PSD-based experimental setup for underwater propeller wake measurement, are found to be essentially consistent with those of the corresponding simulation results, and the observed trend in experimental device-based wake measurements is consistent with the corresponding trend in CTD-based wake measurements.
In future research, we will refine the parameters of the wake field measurement device to create an in-situ detection system, enabling the in-situ detection of wake fields of ships and underwater vehicles. Consequently, the positioning and tracking of ships and underwater vehicles can be achieved.
Author Contributions
Conceptualization, G.Z.; validation, G.Z.; formal analysis, G.Z. and Q.L.; investigation, L.L.; resources, G.Z. and H.W.; writing—original draft, G.Z.; supervision, X.C. and Y.Z.; project administration, L.L.; funding acquisition, Y.Z. All authors have read and agreed to the published version of the manuscript..
Funding
This research received no external funding.
Institutional Review Board Statement
Not applicable.
Informed Consent Statement
Not applicable.
Data Availability Statement
Data are contained within the article.
Conflicts of Interest
The authors declare no conflicts of interest.
References
- Zong, S.G.; Zhang, X.; Duan, Z.K.; Yang, S.P.; Chen, B. Research on Laser Dual-Mode Fusion Detection Method of Ship Wake Bubbles. Appl Sci-Basel 2024, 14, 3695. [Google Scholar] [CrossRef]
- Higley, P.D. A Low-Cost Acoustic Positioning System for Small Manned Submarines. IEEE J Oceanic Eng 1983, 8, 113–115. [Google Scholar] [CrossRef]
- Kumar, S.; Chinthaginjala, R.; Anbazhagan, R.; Nyangaresi, V.O.; Pau, G. Submarine Acoustic Target Strength Modeling at High-Frequency Asymptotic Scattering. IEEE Access 2024, 12, 4859–4870. [Google Scholar] [CrossRef]
- Kim, H.M.; Hong, S.Y.; Kwon, H.W.; Song, J.H.; Jeon, J.J.; Jung, W.J. Numerical simulation of submarines with anechoic coatings for acoustic target strength reduction. Nav Eng J 2012, 124, 49–58. [Google Scholar]
- Zhou, S.L.; Fang, Z. Optimization Design of Acoustic Performance of Underwater Anechoic Coatings. Acoust Aust 2022, 50, 297–313. [Google Scholar] [CrossRef]
- Lan, C.F.; Yu, Z.L.; Chen, H.; Zhang, L.; Zhang, M. Research on Underwater Collaborative Detection Method Based on Complex Marine Environment. IEEE Access 2024, 12, 3464–3475. [Google Scholar] [CrossRef]
- Huang, B.; Liu, Z.Y.; Xu, Y.J.; Ding, Q.C.; Pan, M.C.; Hu, J.F.; Zhang, Q. Characteristics of Magnetic Fields Induced by the Wake of an Underwater Vehicle. Appl Sci-Basel 2022, 12, 7964. [Google Scholar] [CrossRef]
- Sitefanick, T. The nonacoustic detection of submarines. Sci Am 1988, 258, 41. [Google Scholar] [CrossRef]
- Jiang, Y.N.; Yang, Z.Y.; Li, K.; Liu, T. Pre-Processing of Simulated Synthetic Aperture Radar Image Scenes Using Polarimetric Enhancement for Improved Ship Wake Detection. Remote Sensing 2024, 16, 658. [Google Scholar] [CrossRef]
- Tatavarti, R.; Ananth, P.N.; Rajasree, A.K.; Vidyalal, V.; Radhakrishnan, P.; Nampoori, V.P.N.; Vallabhan, C.P.G. Internal waves-a novel measurement technique. Curr Sci India 1995, 69, 678–684. [Google Scholar]
- Swain, S.K.; Trinath, K. Tatavarti. Non-Acoustic Detection of Moving Submerged Bodies in Ocean. International journal of innovative research and development 2012, 1, 361–372. [Google Scholar]
- Voropayev, S.I.; McEachern, G.B.; Fernando, H.J.S.; Boyer, D.L. Large vortex structures behind a maneuvering body in stratified fluids. Phys Fluids 1999, 11, 1682–1684. [Google Scholar] [CrossRef]
- Voropayev, S.I.; Smirnov, S.A. Vortex streets generated by a moving momentum source in a stratified fluid. Phys Fluids 2003, 15, 618–624. [Google Scholar] [CrossRef]
- Bentley, J.P.; Mudd, J.W. Vortex shedding mechanisms in single and dual bluff bodies. Flow Meas Instrum 2003, 14, 23–31. [Google Scholar] [CrossRef]
- Schulte-Pelkum, N.; Wieskotten, S.; Hanke, W.; Dehnhardt, G.; Mauck, B. Tracking of biogenic hydrodynamic trails in harbour seals (Phoca vitulina). J Exp Biol 2007, 210, 781–787. [Google Scholar] [CrossRef] [PubMed]
- Gläser, N.; Wieskotten, S.; Otter, C.; Dehnhardt, G.; Hanke, W. Hydrodynamic trail following in a California sea lion (Zalophus californianus). J Comp Physiol A 2011, 197, 141–151. [Google Scholar] [CrossRef]
- Hanke, W.; Wieskotten, S.; Marshall, C.; Dehnhardt, G. Hydrodynamic perception in true seals (Phocidae) and eared seals (Otariidae). J Comp Physiol A 2013, 199, 421–440. [Google Scholar] [CrossRef]
- Dehnhardt, G.; Mauck, B.; Bleckmann, H. Seal whiskers detect water movements. Nature 1998, 394, 235–236. [Google Scholar] [CrossRef]
- Eberhardt, W.C.; Wakefield, B.F.; Murphy, C.T.; Casey, C.; Shakhsheer, Y.; Calhoun, B.H.; Reichmuth, C. Development of an artificial sensor for hydrodynamic detection inspired by a seal's whisker array. Bioinspir Biomim 2016, 11, 056011. [Google Scholar] [CrossRef]
- Dalziel, S.B.; Hughes, G.O.; Sutherland, B.R. Whole-field density measurements by 'synthetic schlieren'. Exp Fluids 2000, 28, 322–335. [Google Scholar] [CrossRef]
- Elsinga, G.E.; van Oudheusden, B.W.; Scarano, F.; Watt, D.W. Assessment and application of quantitative schlieren methods: Calibrated color schlieren and background oriented schlieren. Exp Fluids 2004, 36, 309–325. [Google Scholar] [CrossRef]
- Hargather, M.J.; Settles, G.S. A comparison of three quantitative schlieren techniques. Opt Laser Eng 2012, 50, 8–17. [Google Scholar] [CrossRef]
- Ben-Gida, H.; Liberzon, A.; Gurka, R. A stratified wake of a hydrofoil accelerating from rest. Exp Therm Fluid Sci 2016, 70, 366–380. [Google Scholar] [CrossRef]
- Stella, A.; Guj, G.; Di Felice, F. Propeller wake flowfield analysis by means of LDV phase sampling techniques. Exp Fluids 2000, 28, 1–10. [Google Scholar] [CrossRef]
- Paik, B.G.; Ahn, J.W.; HanShin, S.; Park, Y.H.; Kim, K.; Cheon, H.G. Development of LDV (Laser Doppler Velocimetry) for Measuring Three Dimensional Hull Wake of Ship Model in Large Cavitation Tunnel. Journal of the Society of Naval Architects of Korea 2017, 54, 515–521. [Google Scholar] [CrossRef]
- Tatavarti, R.; Sanjaya, K.S.; Trinath, K.; Arulmozhivarman, P. Evolution of Non Acoustic Detection Systems. Institute of Defence Scientists and Technologists Journal 2013. [Google Scholar]
- Zhang, S.W.; Li, L.Y.; Liu, Y.L.; Zhou, Y. Drift Error Compensation Algorithm for Heterodyne Optical Seawater Refractive Index Monitoring of Unstable Signals. Sensors 2023, 23, 8460. [Google Scholar] [CrossRef] [PubMed]
- Wang, L.Z.; Guo, C.Y.; Su, Y.M.; Wu, T.C. A numerical study on the correlation between the evolution of propeller trailing vortex wake and skew of propellers. Int J Nav Arch Ocean 2018, 10, 212–224. [Google Scholar] [CrossRef]
- Wang, L.Z.; Guo, C.Y.; Xu, P.; Su, Y.M. Analysis of the performance of an oscillating propeller in cavitating flow. Ocean Eng 2018, 164, 23–39. [Google Scholar] [CrossRef]
- Wang, L.Z.; Guo, C.Y.; Xu, P.; Su, Y.M. Analysis of the wake dynamics of a propeller operating before a rudder. Ocean Eng 2019, 188, 106250. [Google Scholar] [CrossRef]
|
Disclaimer/Publisher’s Note: The statements, opinions and data contained in all publications are solely those of the individual author(s) and contributor(s) and not of MDPI and/or the editor(s). MDPI and/or the editor(s) disclaim responsibility for any injury to people or property resulting from any ideas, methods, instructions or products referred to in the content. |
© 2024 by the authors. Licensee MDPI, Basel, Switzerland. This article is an open access article distributed under the terms and conditions of the Creative Commons Attribution (CC BY) license (http://creativecommons.org/licenses/by/4.0/).
