1. Introduction
Lost foam shell casting combines the advantages of foam lost foam casting and investment casting, aligning with modern casting concepts such as “clean casting,” “green casting,” and “environmental casting.” This method is recognized as a green casting technology for the 21st century [
1,
2,
3,
4]. The lost foam shell casting process involves preheating foam to liquefy and discharge it, achieving shell casting without foam residues. This prevents issues like slag inclusion, surface wrinkling, and carbon increment [
5,
6], making it ideal for high-demand low-carbon steel and stainless-steel castings.
While investment casting is an advanced near-net-shape forming process, it encounters challenges with larger components due to high costs and mold shell thickness limitations. For large castings, the costs of mold making and the required shell thickness often exceed feasible limits, restricting its application [
7,
8,
9,
10,
11]. In contrast, lost foam shell casting uses specialized coatings to form shells, making it suitable for producing large, complex low-carbon steel and stainless-steel parts [
12,
13]. This green, energy-efficient process holds significant potential.
Research and production practices have identified coating quality as a crucial factor affecting product quality under consistent smelting and pouring conditions. Previous studies have investigated the rheological properties of coatings for magnesium alloy casting and the impact of shear thinning on coating performance [
14,
15,
16], as well as the effect of viscosity on titanium alloy casting quality. Additional research has focused on how sodium bentonite content influences coating viscosity and brushing performance [
17,
18]. The application of orthogonal design, machine learning, and neural network learning has significantly improved coating quality [
19,
20,
21].
For effective brushing, coatings must possess adequate viscosity to maintain the requisite thickness. However, excessive viscosity can hinder coating flow [
22,
23]. Optimal coating viscosity should be low during brushing to enhance flowability, then quickly increase to prevent runoff and ensure uniform shell thickness. These requirements are directly linked to the apparent viscosity and rheological properties of the coating. Most coatings require thorough mixing before use and may need standing time during production, both of which alter the coating’s properties [
24,
25,
26,
27,
28].
Typically, the application of a cast coating involves a process of stirring. To obtain effective performance, it is essential to understand the effects of mixing and standing times on viscosity and rheological properties. This study analyzes the effects of mixing and standing times on the viscosity and rheological properties of lost foam shell casting coatings, aiming to provide technical support and theoretical reference for their proper use.
2. Experimental Procedure
The coating used in this study consists of powders and a liquid component, mixed in precise proportions and thoroughly stirred before application. The powder component primarily comprises Al₂O₃ and SiO₂ as refractory fillers, with an average particle size ranging from 300 to 800 μm. Additionally, small quantities of iron oxide powder, sodium bentonite, and sodium carboxymethyl cellulose are included. The liquid component is a water-based solution containing latex and SN thickener, with a pH value of 8-9 and a density of 1.2 g/cm³.
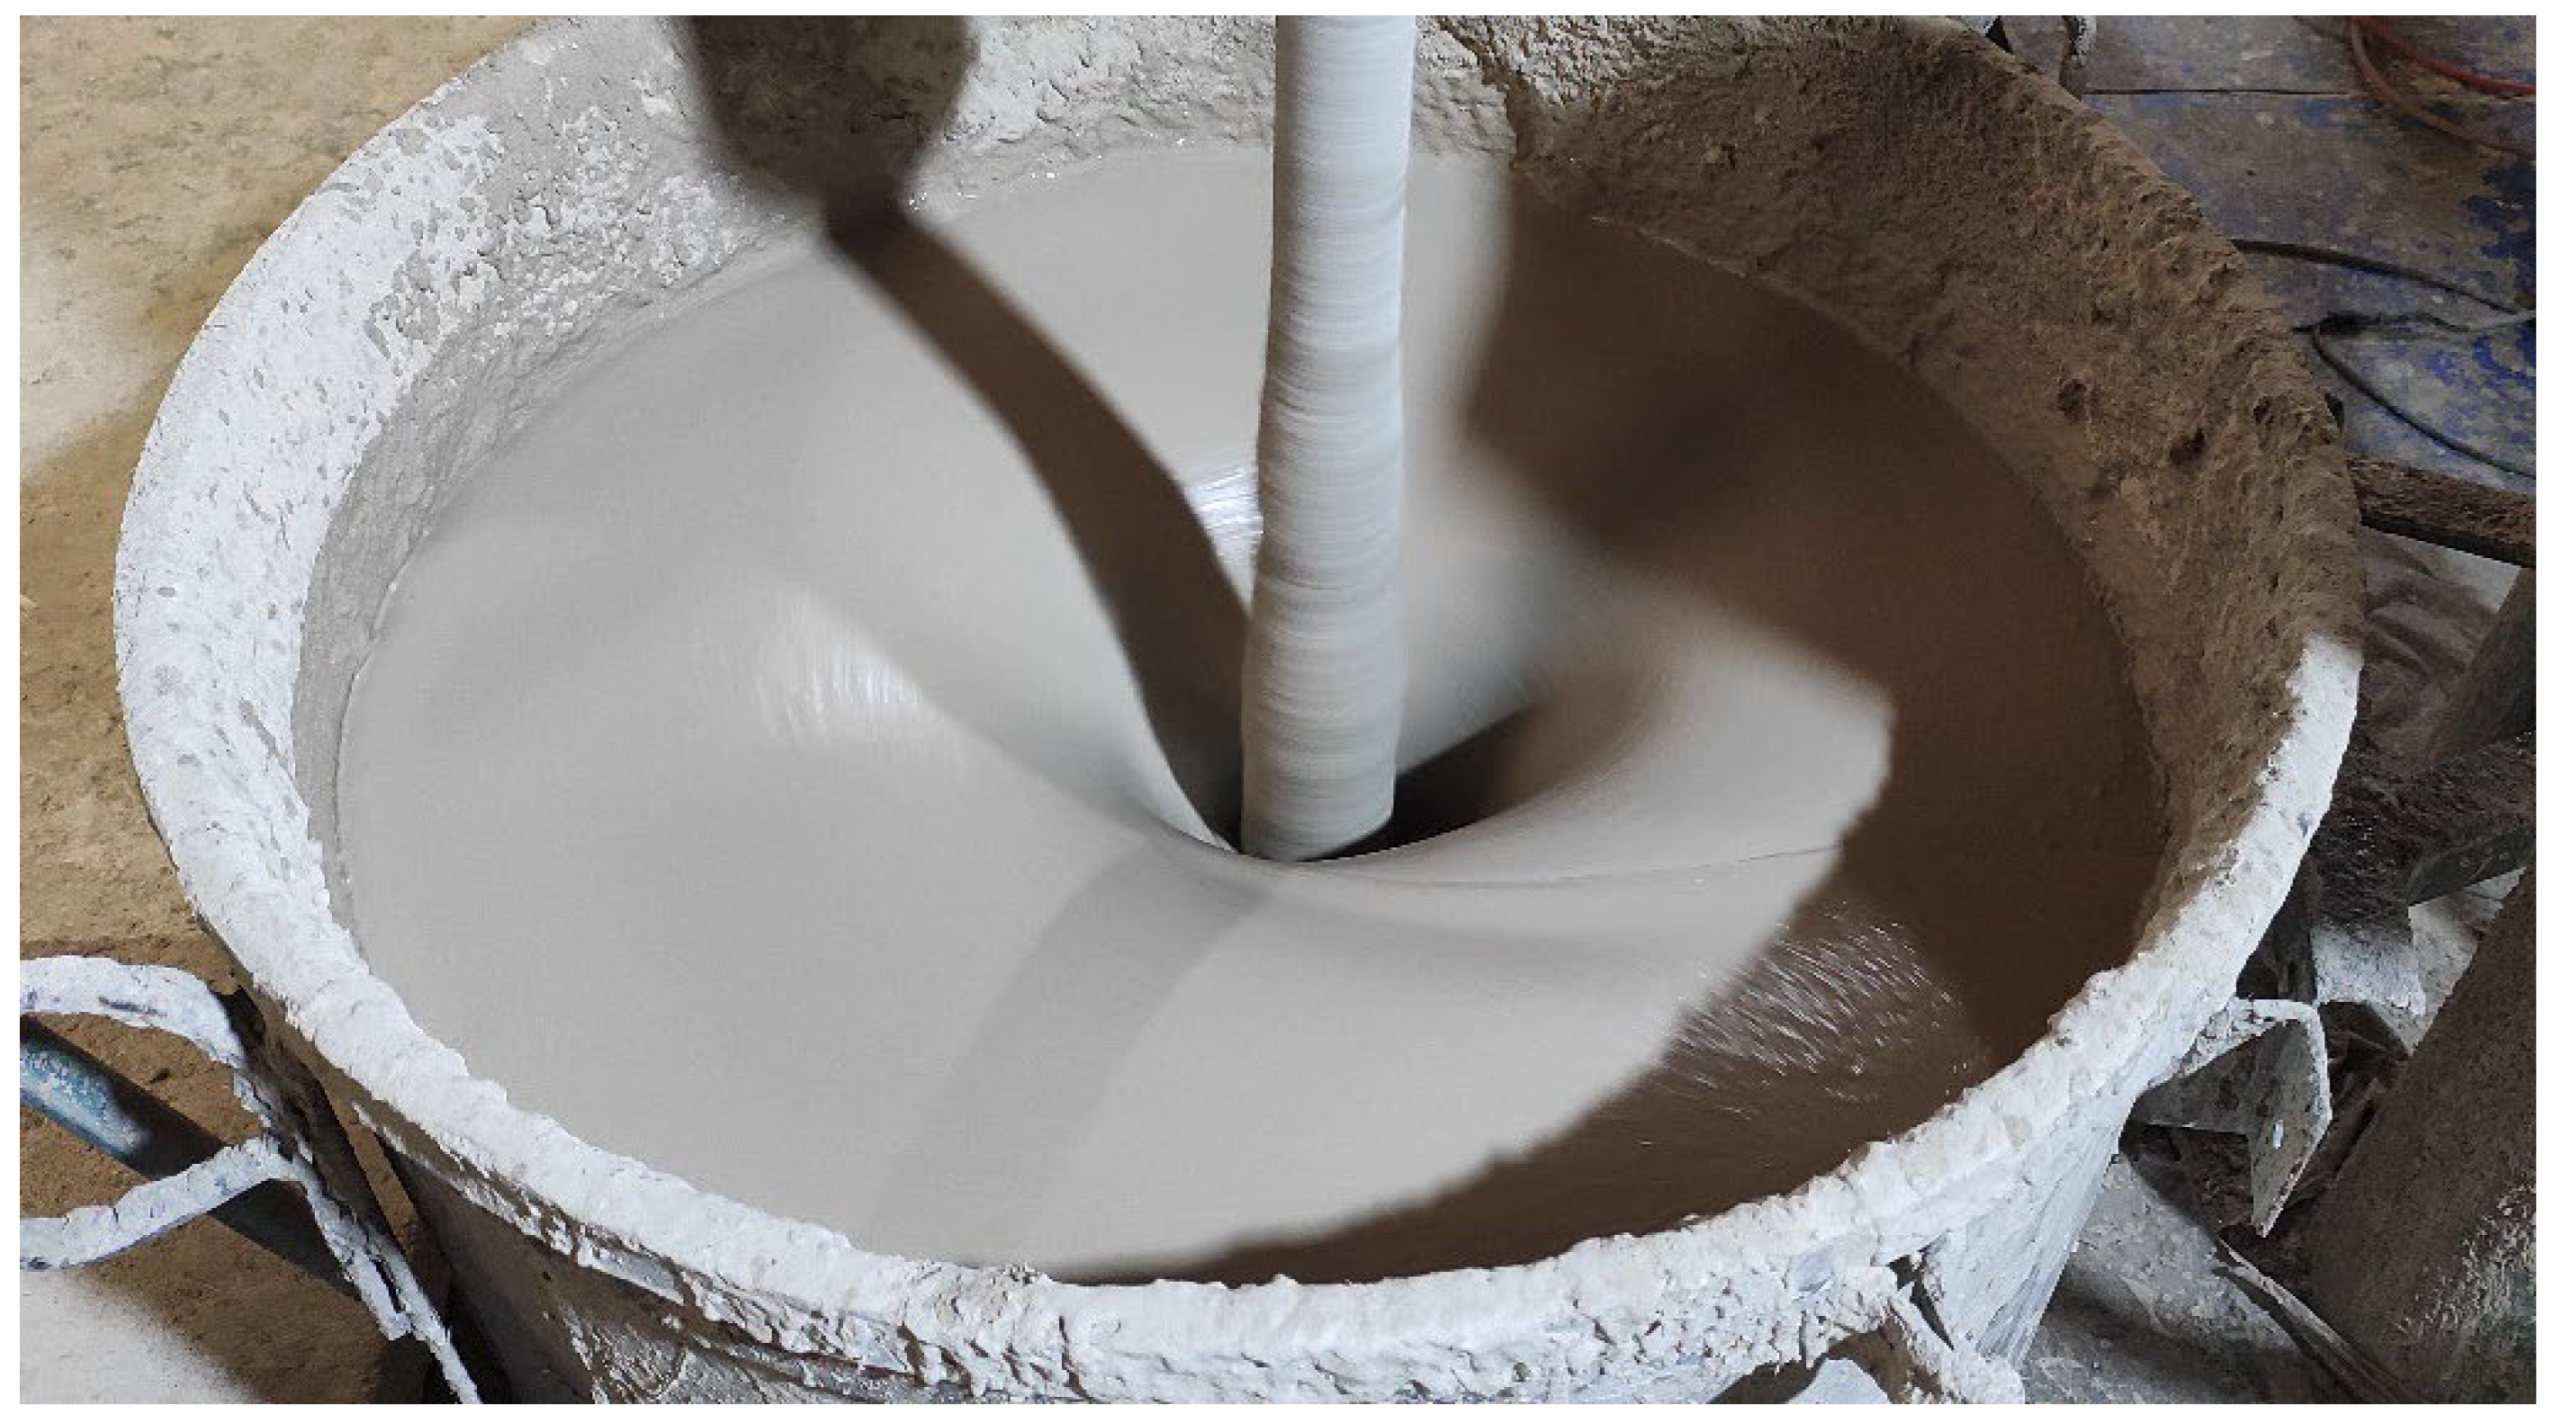
Initially, 140 kg of the liquid component is poured into the mixer, followed by the gradual addition of 250 kg of the powder component, maintaining a mixing speed of 800 rpm, as illustrated in
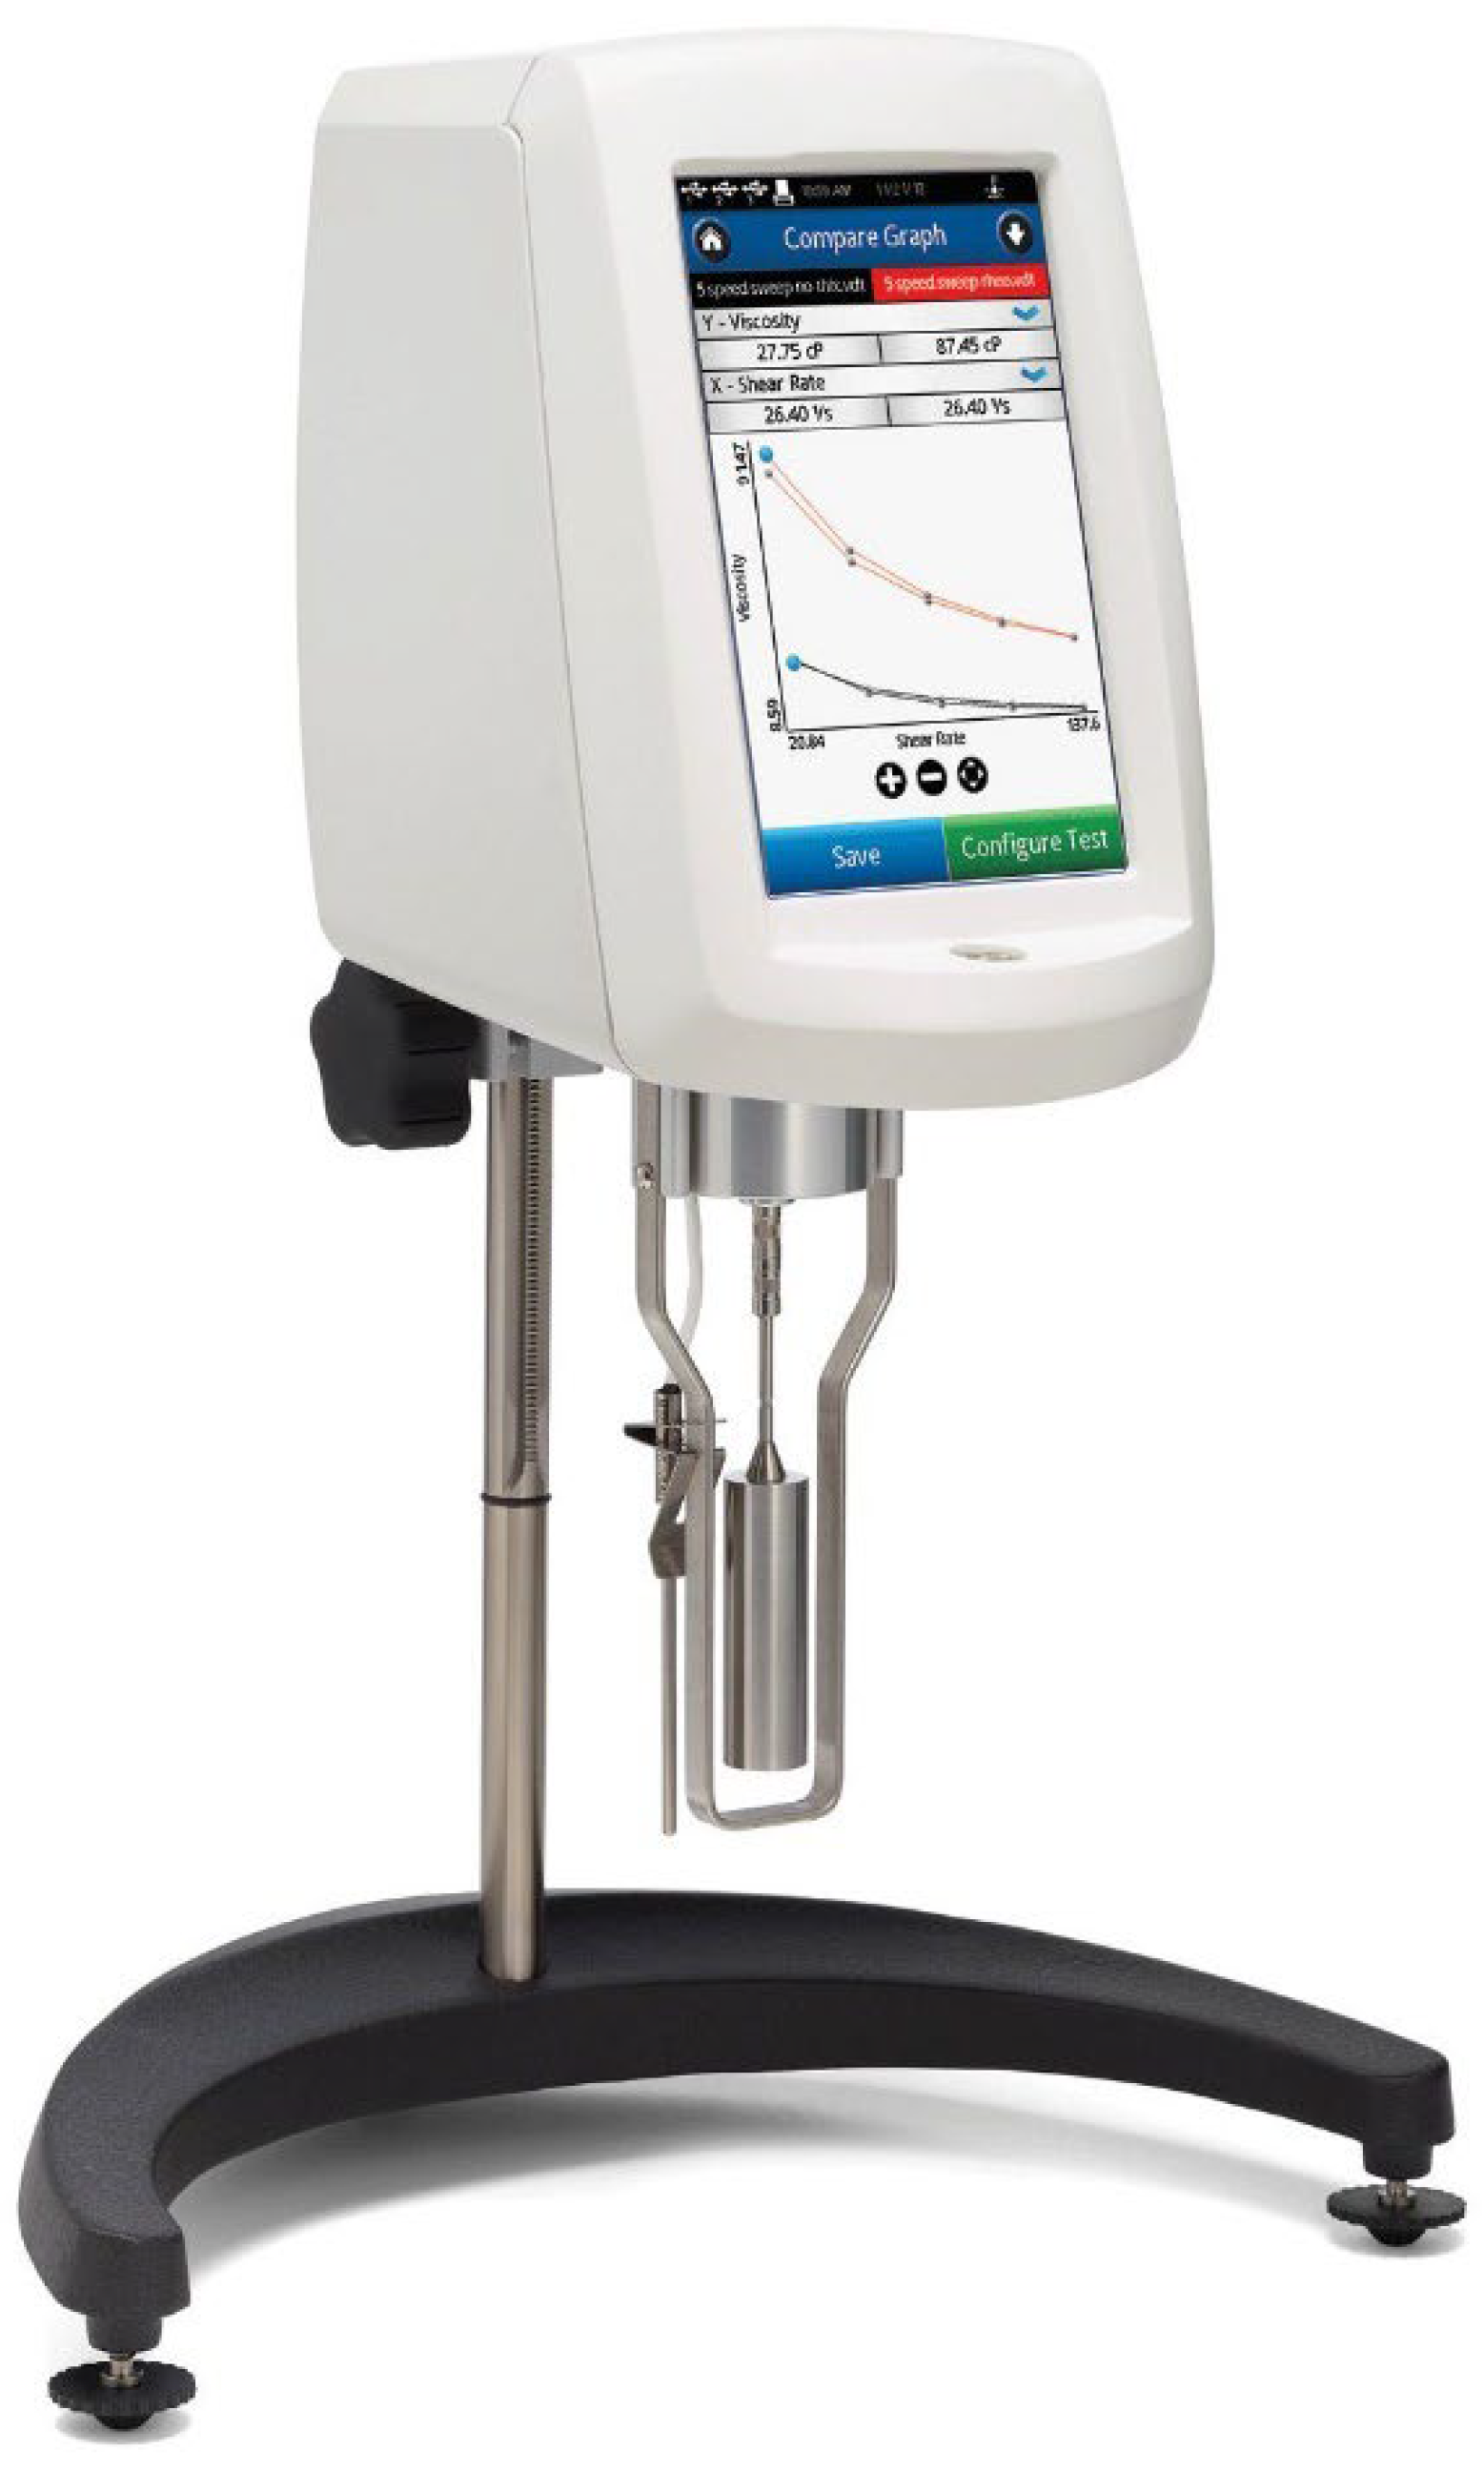
Figure 1. During the mixing process, 500 ml samples are taken at regular intervals to measure viscosity, rheological curves, and shear thinning ratio using an LVDV-2T viscometer with a No. 3 rotor at rotational speeds of 6, 12, 30, and 60 rpm, as depicted in
Figure 2. After 60 minutes of mixing, an 800 ml sample is allowed to stand. Measurements are taken at regular intervals during the standing process, with all experiments conducted at an ambient temperature of 18°C.
3. Results and Analysis
3.1. Effect of Mixing Time on the Coating
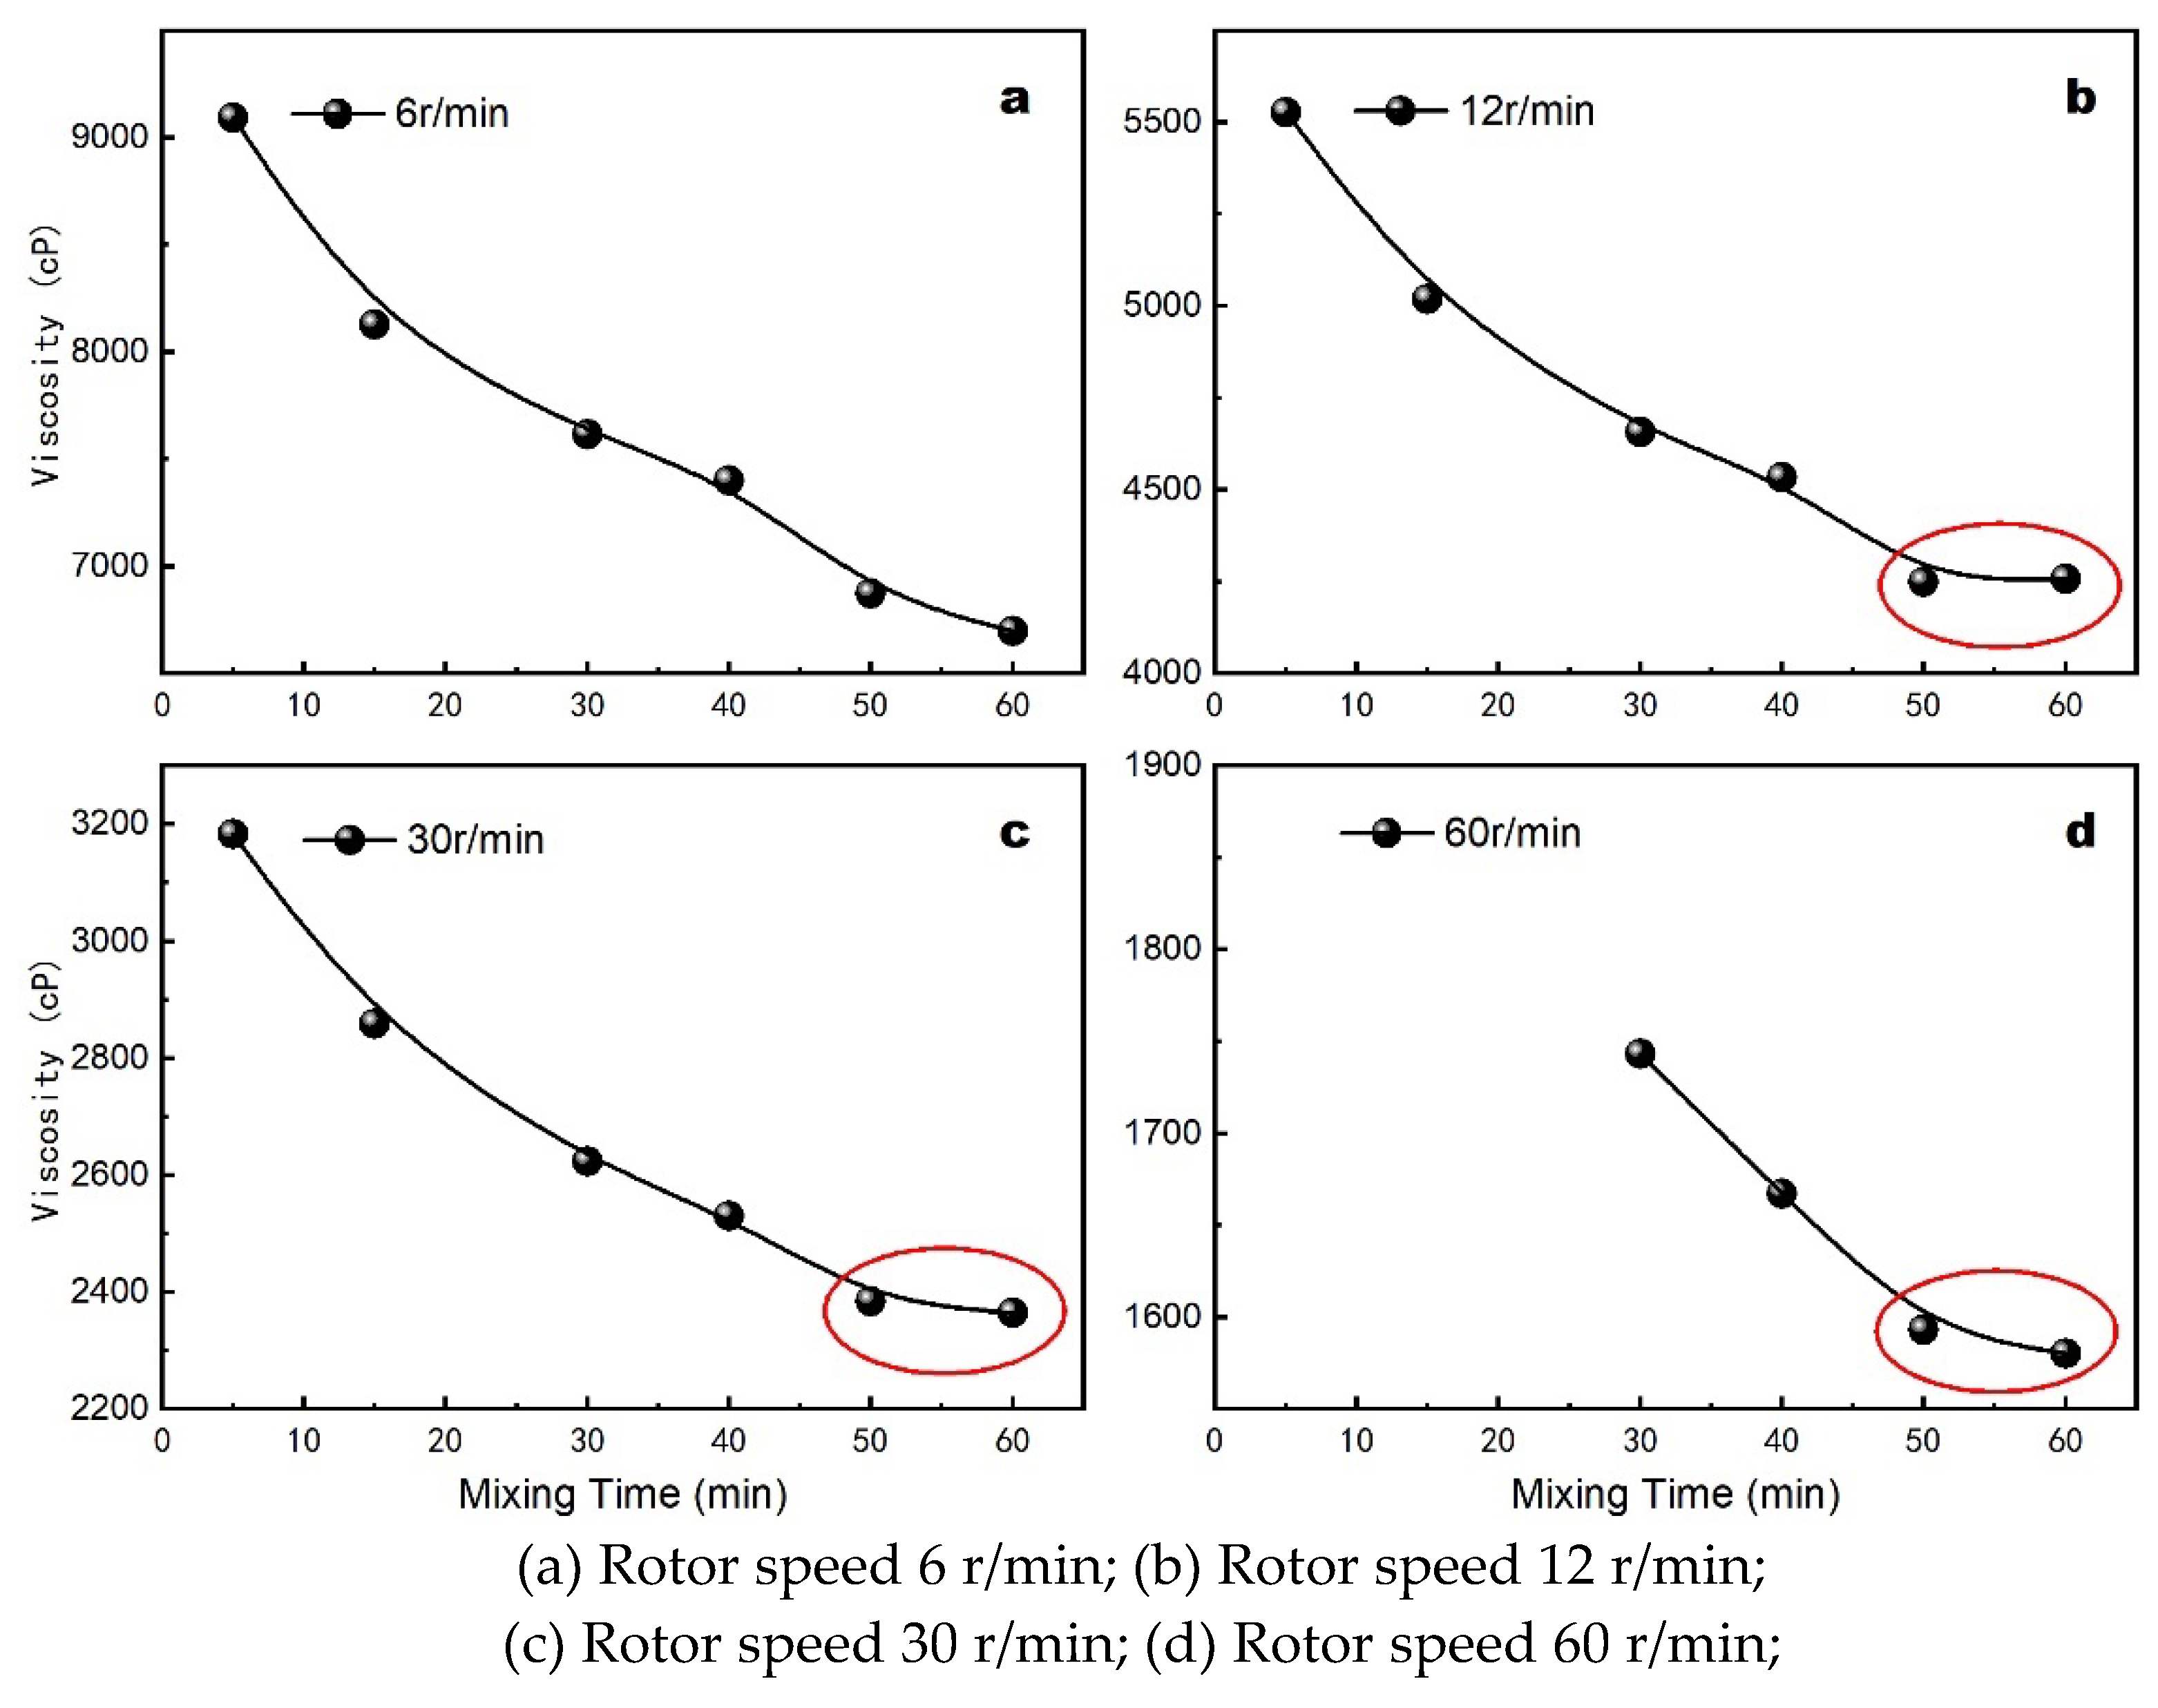
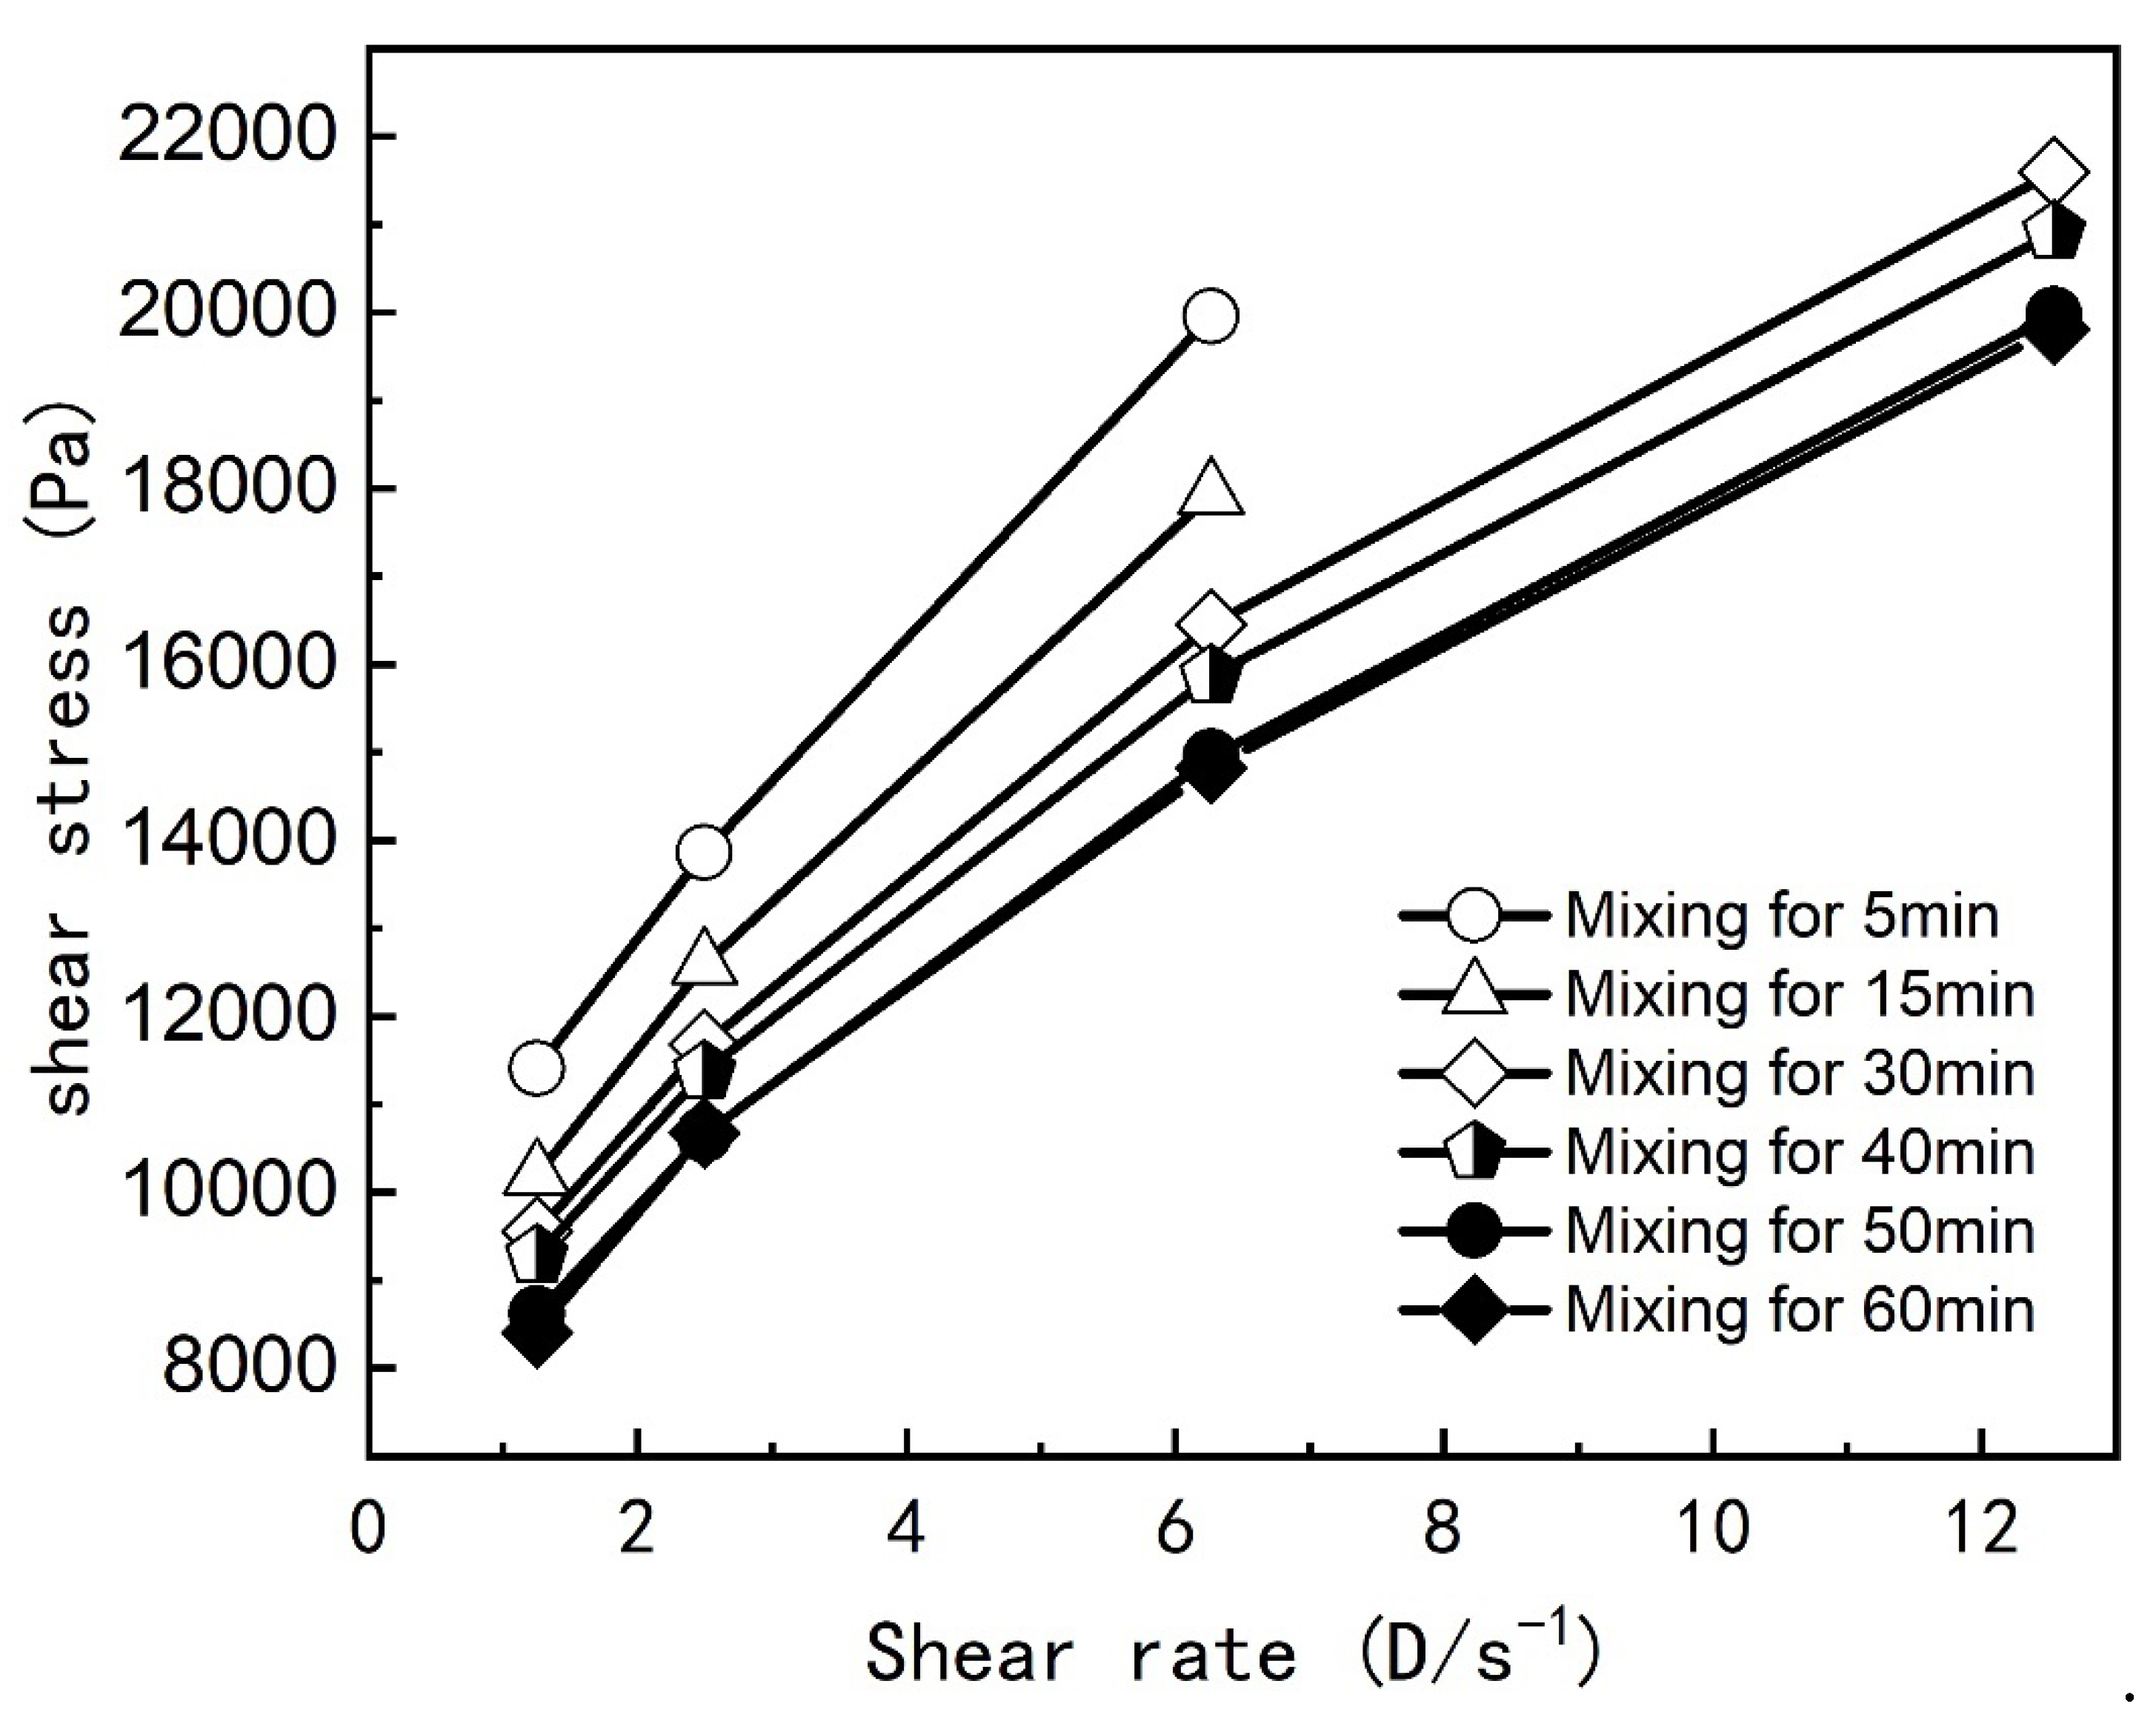
It is well-established that two non-Newtonian liquids with identical apparent viscosities can exhibit different flow curves. To accurately assess the impact of mixing time on the apparent properties of the lost foam shell casting coating, a No. 3 rotor was used at various rotational speeds. The effect of mixing time on the coating’s apparent viscosity is depicted in
Figure 3, while the impact on the rheological curve is shown in
Figure 4.
Under different rotor speeds, viscosity rapidly decreases with increased mixing time during the initial period and stabilizes after 50 minutes. The rheological curve (
Figure 4) indicates that the properties stabilize with further mixing up to 60 minutes, consistent with viscosity trends. This suggests that a minimum mixing time of 50 minutes is required for thorough mixing and wetting of the components.
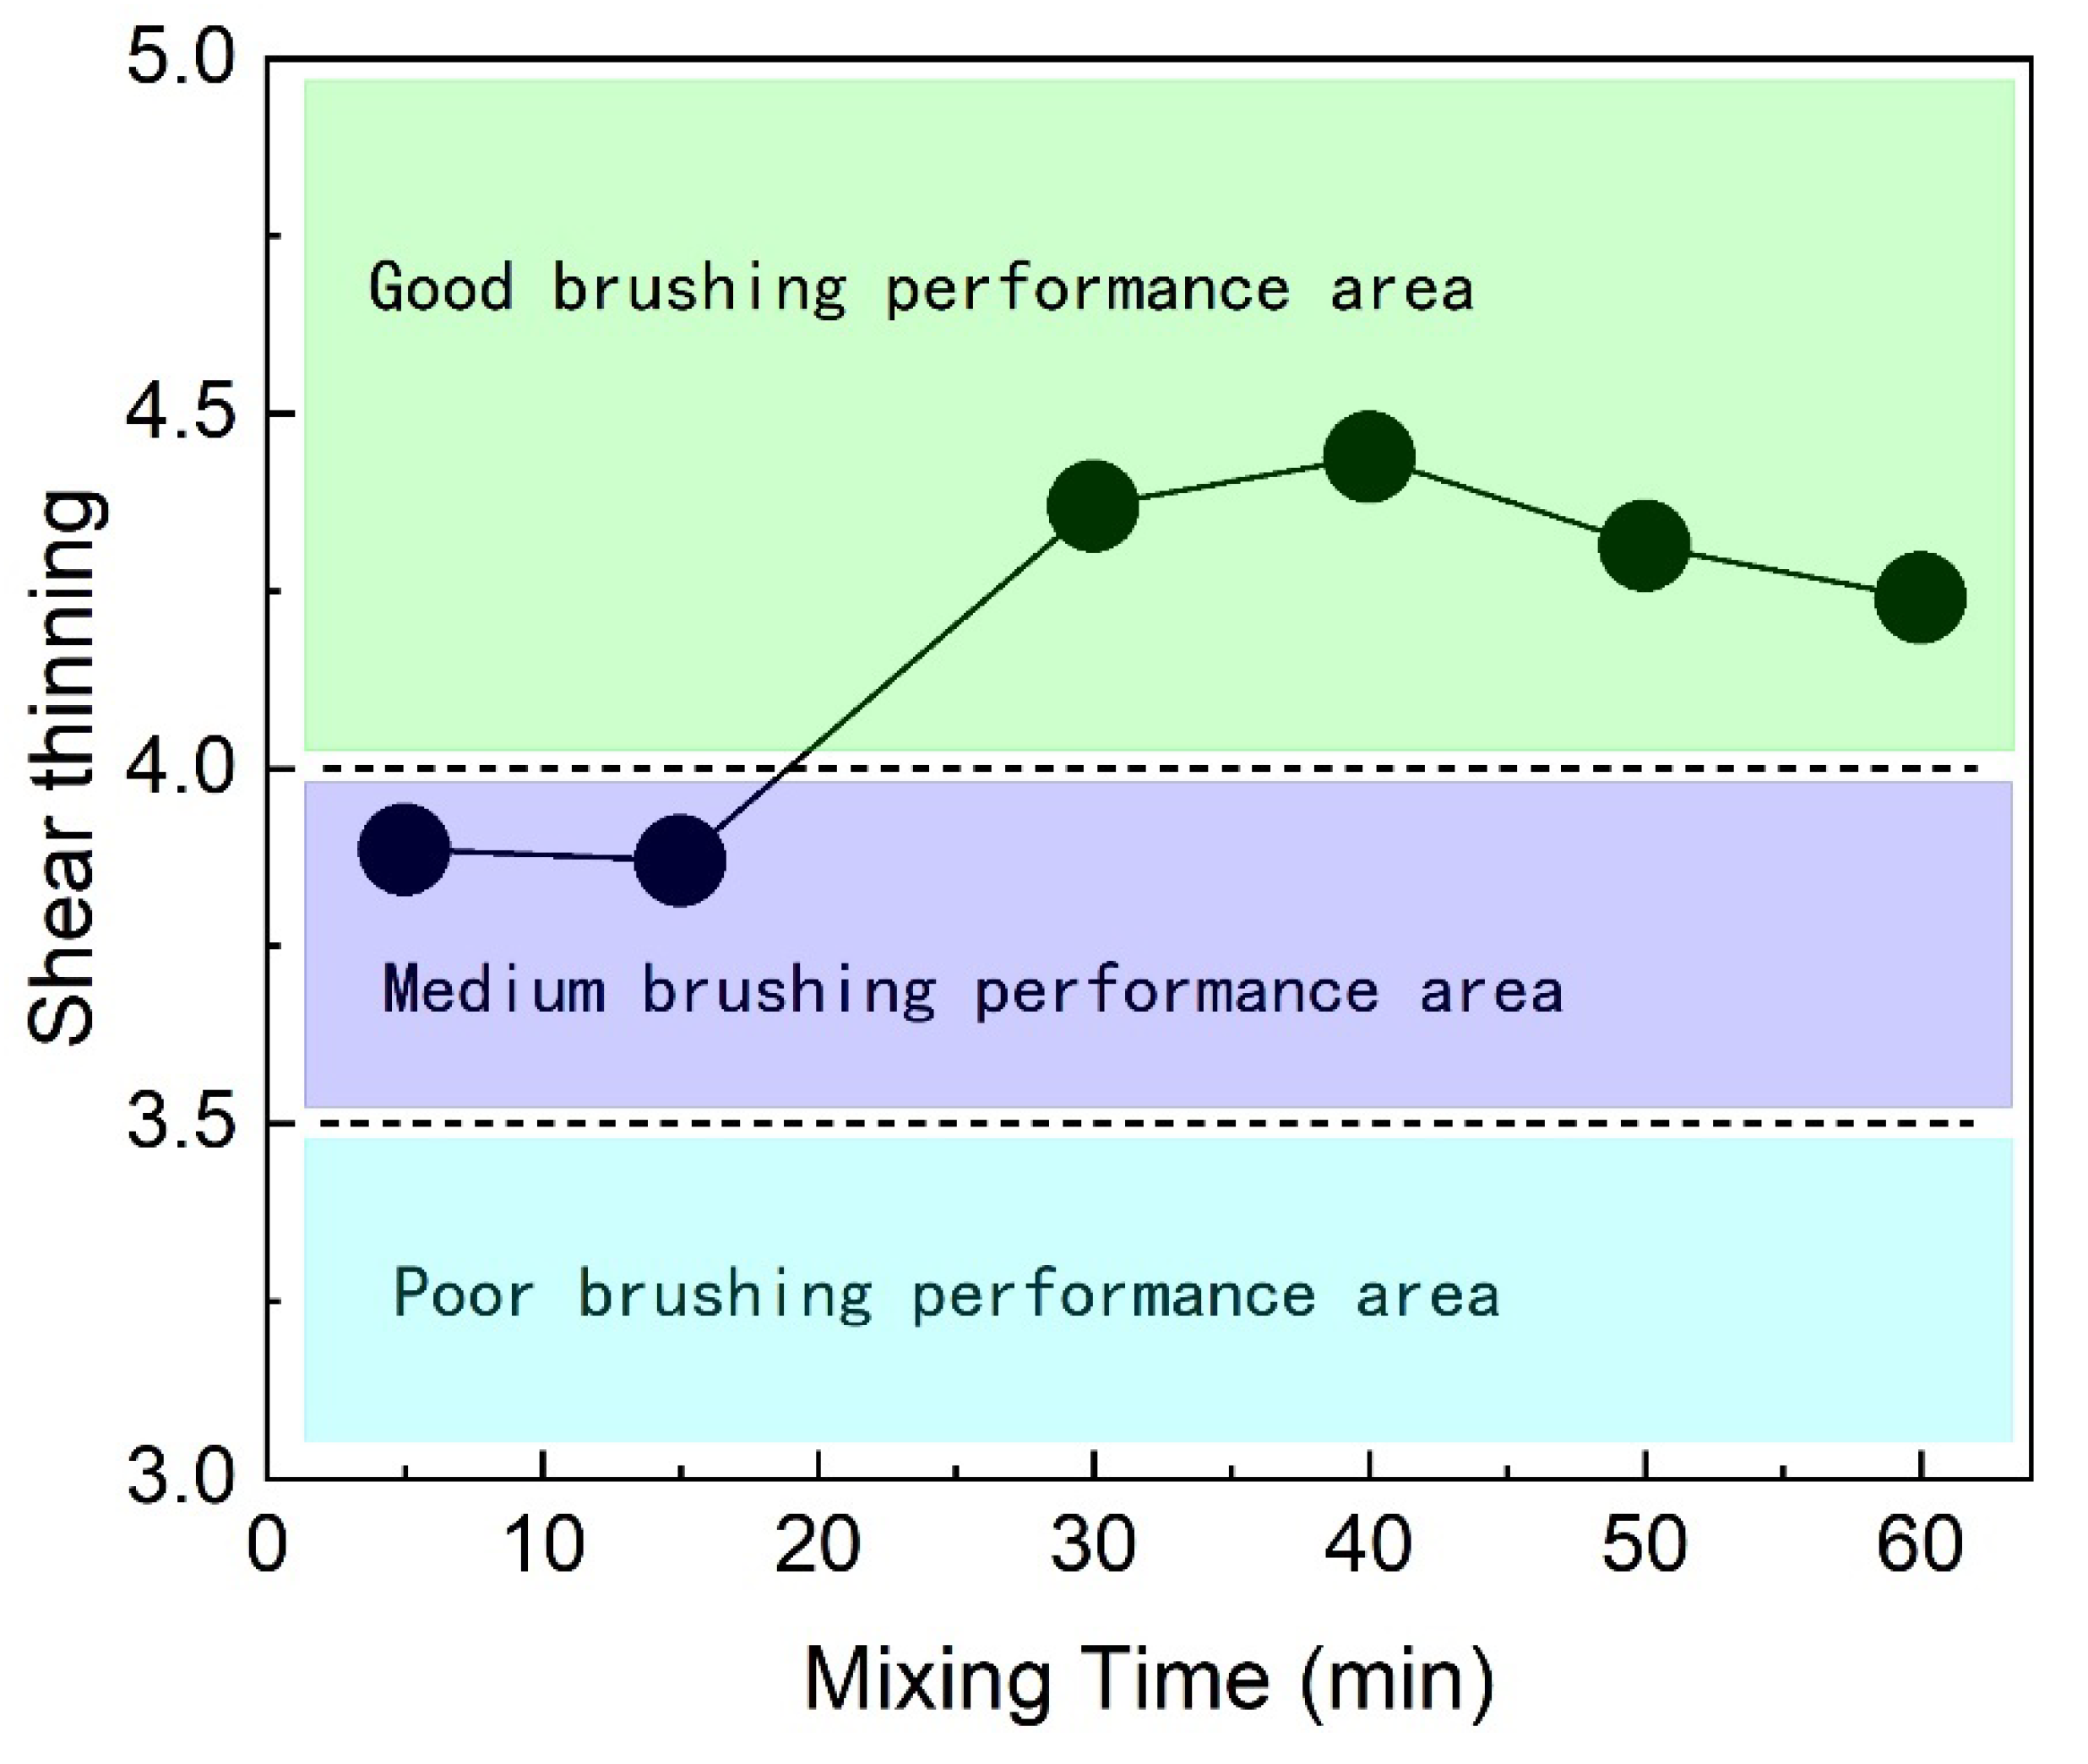
Shear thinning is a crucial indicator of coating performance during brushing. The shear thinning ratio of the coating increases with mixing time, as shown in
Figure 5.
Shear thinning, crucial for brushing performance, increases with mixing time, as illustrated in
Figure 5. As mixing time increases, the shear thinning ratio gradually rises, reaching a peak at 40 minutes. Beyond 50 minutes of mixing, the ratio slightly decreases, fluctuating between 4.2 and 4.3. A higher shear thinning ratio indicates better brushing performance. Practical production and research confirm that a shear thinning ratio below 3.5 results in poor brushing performance, while a ratio above 4.0 indicates good performance. In this study, the coating, after thorough mixing, achieves a shear thinning ratio above 4.2, demonstrating excellent brushing performance.
3.2. Effect of Standing Time on the Coating
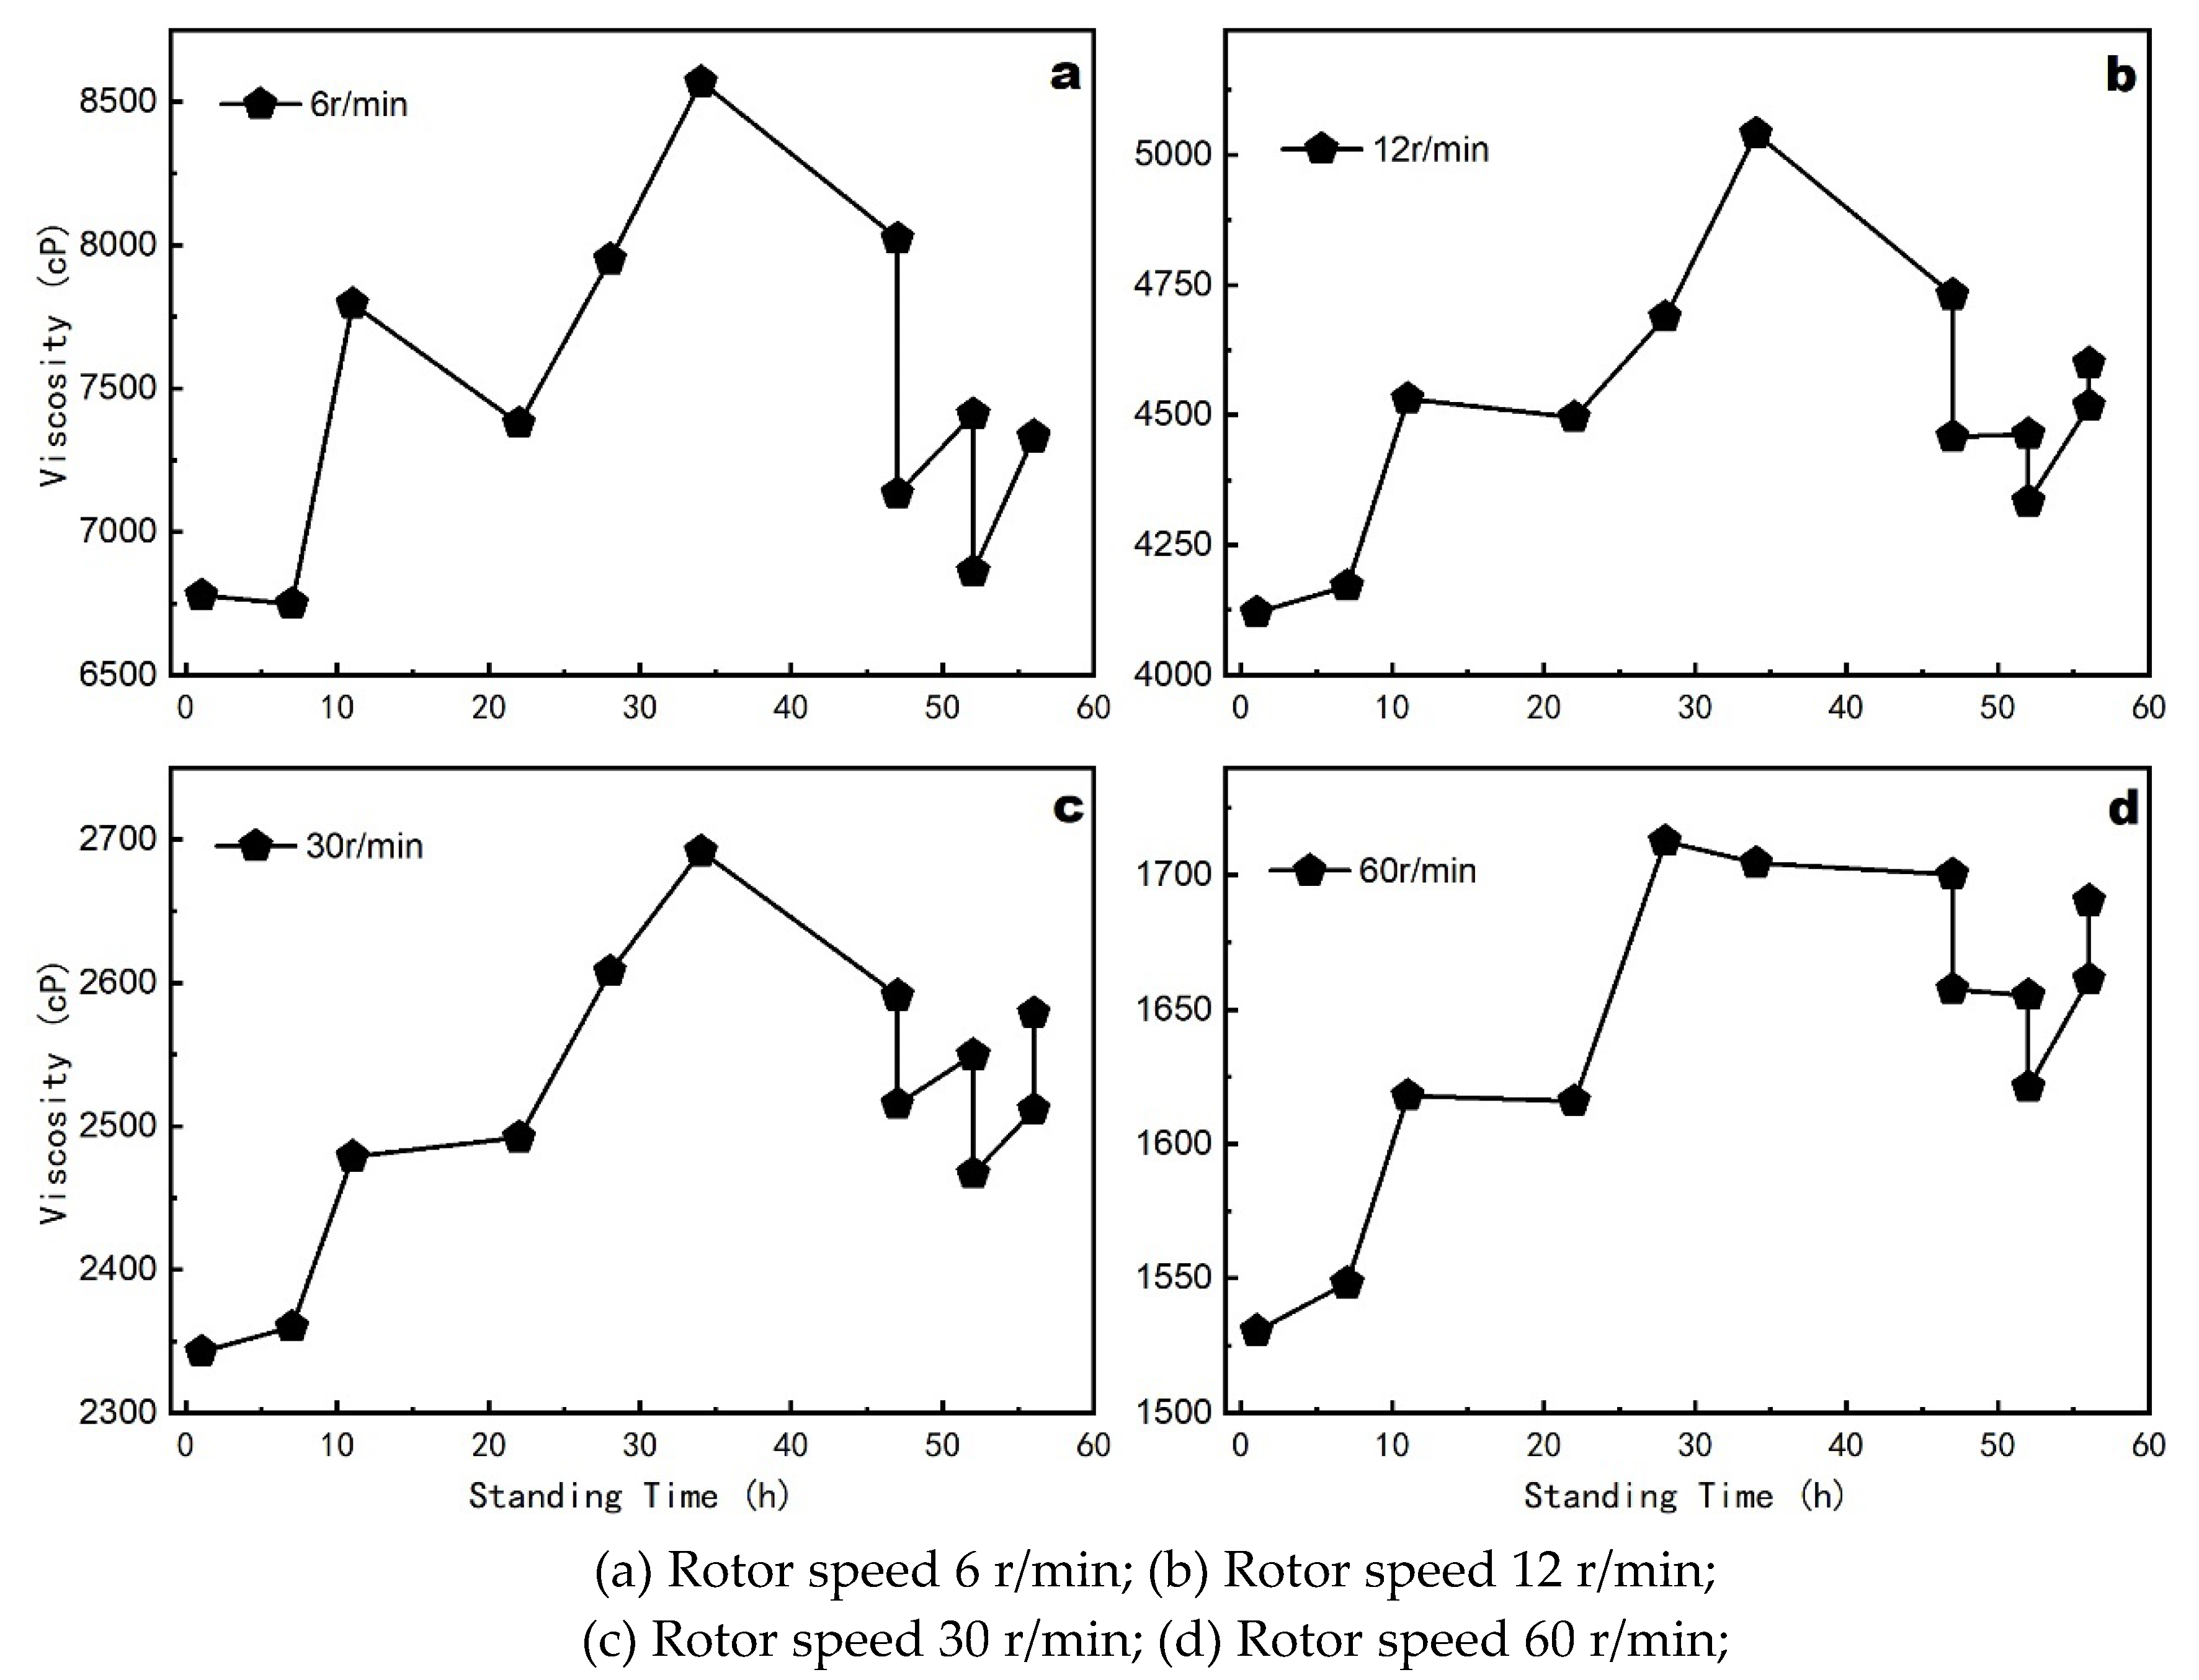
In practical production, freshly prepared coatings are ideally used immediately, but they often stand for some time before application. Understanding the changes in coating properties during this standing period is essential for maintaining optimal performance. The change in viscosity with standing time is shown in
Figure 6.
Viscosity exhibits a slight increase within the first 7 hours of standing, which can be attributed to the gradual settling and interaction of particles. After 20 hours, the viscosity rises rapidly, reaching its peak around 35 hours. This increase is likely due to the ongoing interaction and structural rearrangement of the coating components. However, beyond 40 hours, viscosity begins to decrease due to sedimentation and partial degradation of the coating components. These changes indicate that the optimal standing time should be controlled within 40 hours to prevent deterioration in coating performance.
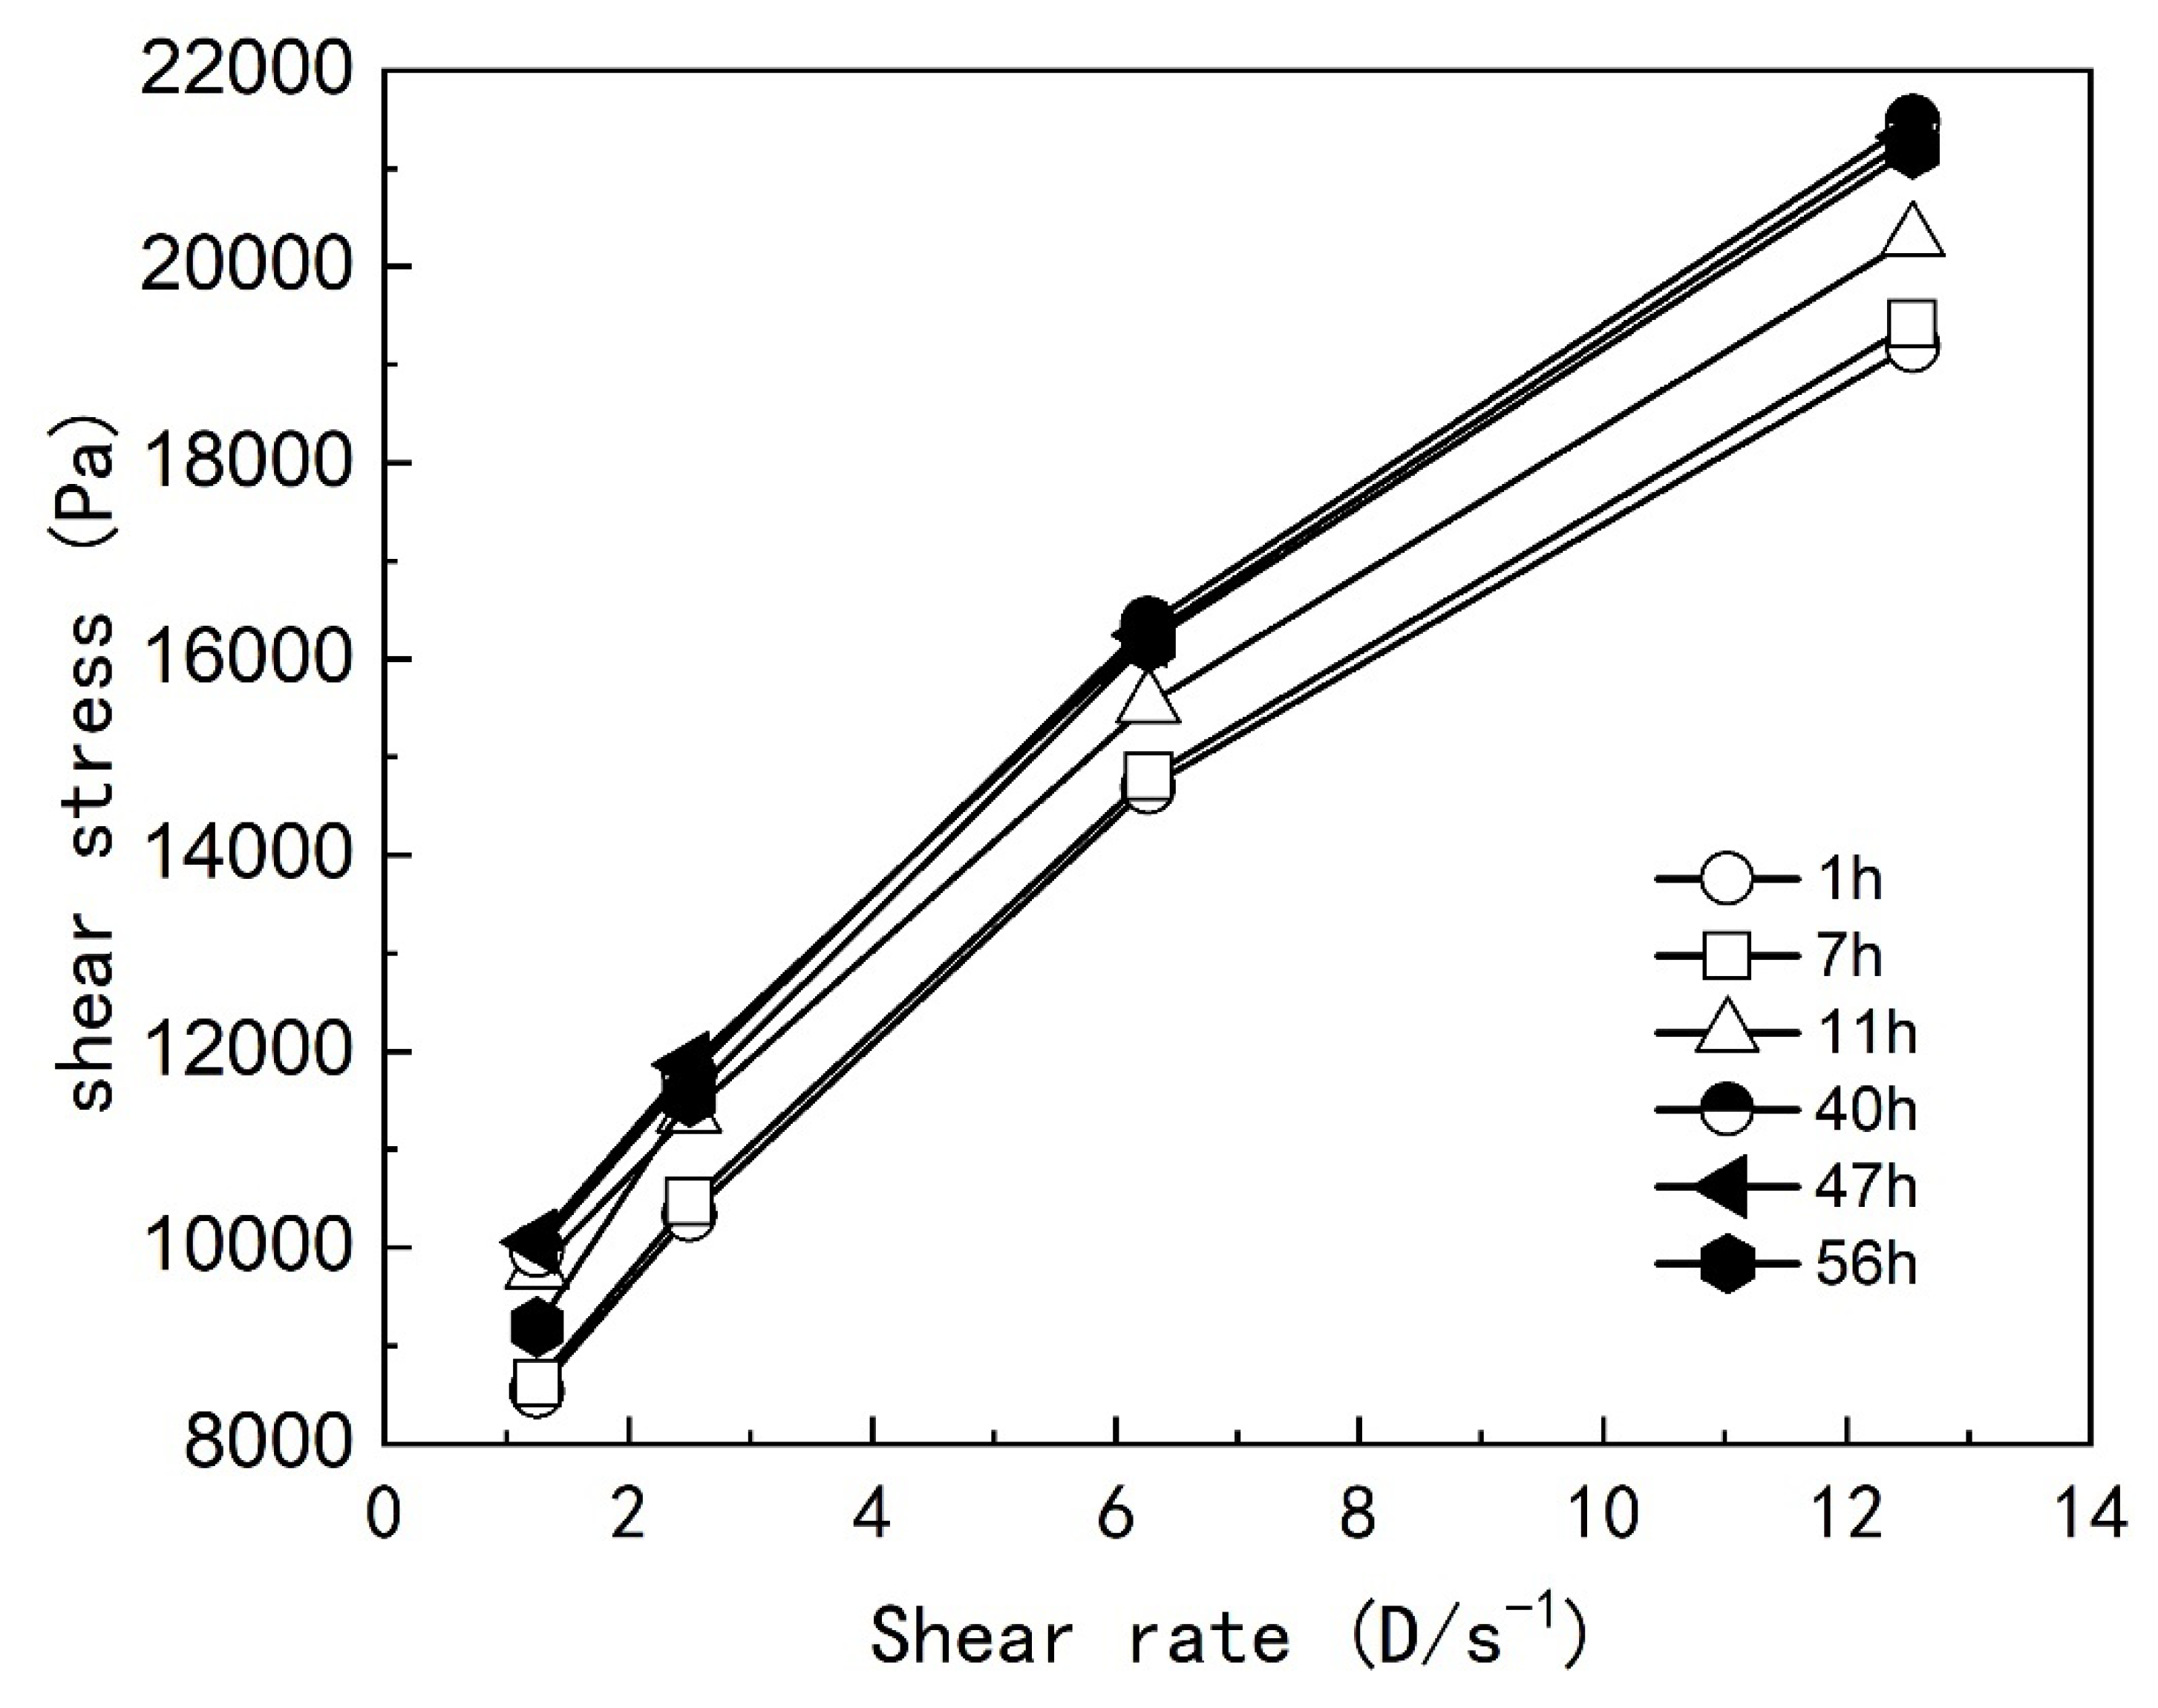
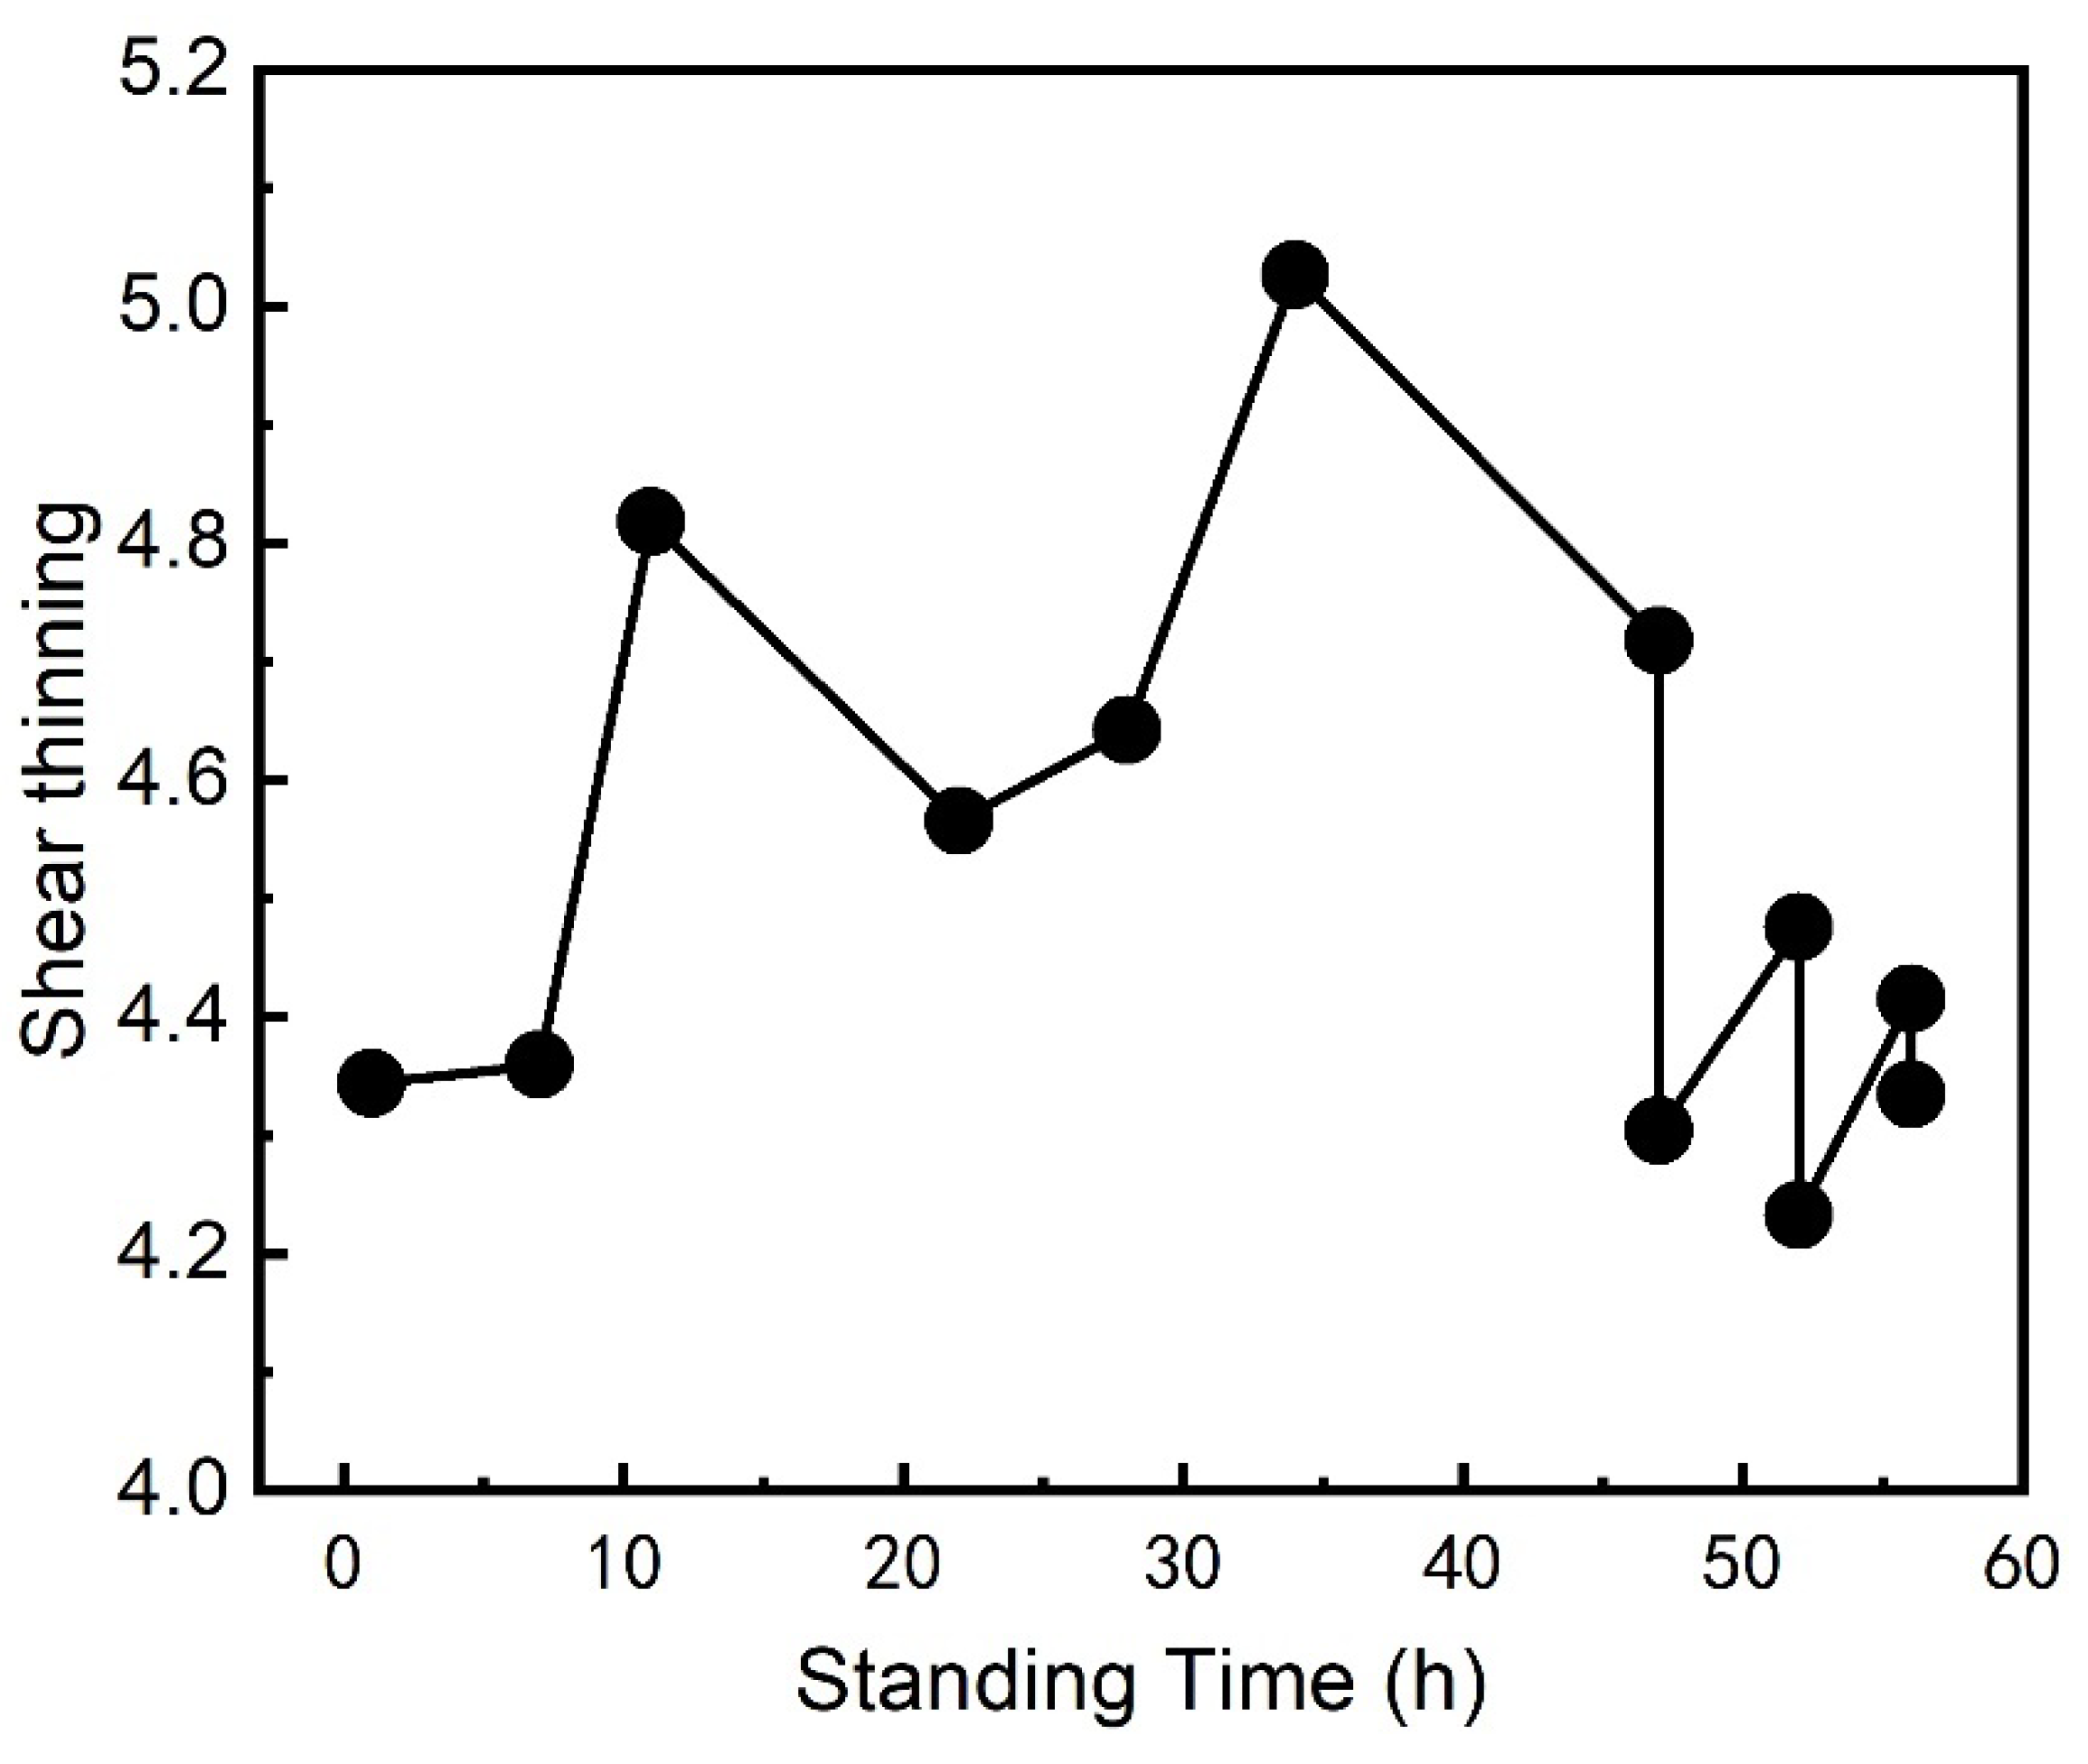
The rheological curve (
Figure 7) and shear thinning ratio (
Figure 8) trends align with the changes in viscosity, confirming that the standing time significantly influences the coating’s rheological properties. The shear thinning ratio increases with standing time up to a certain point, enhancing brushing performance, but decreases beyond 40 hours, which correlates with the observed drop in viscosity. This further validates that the standing time should be limited to 40 hours to maintain optimal performance.
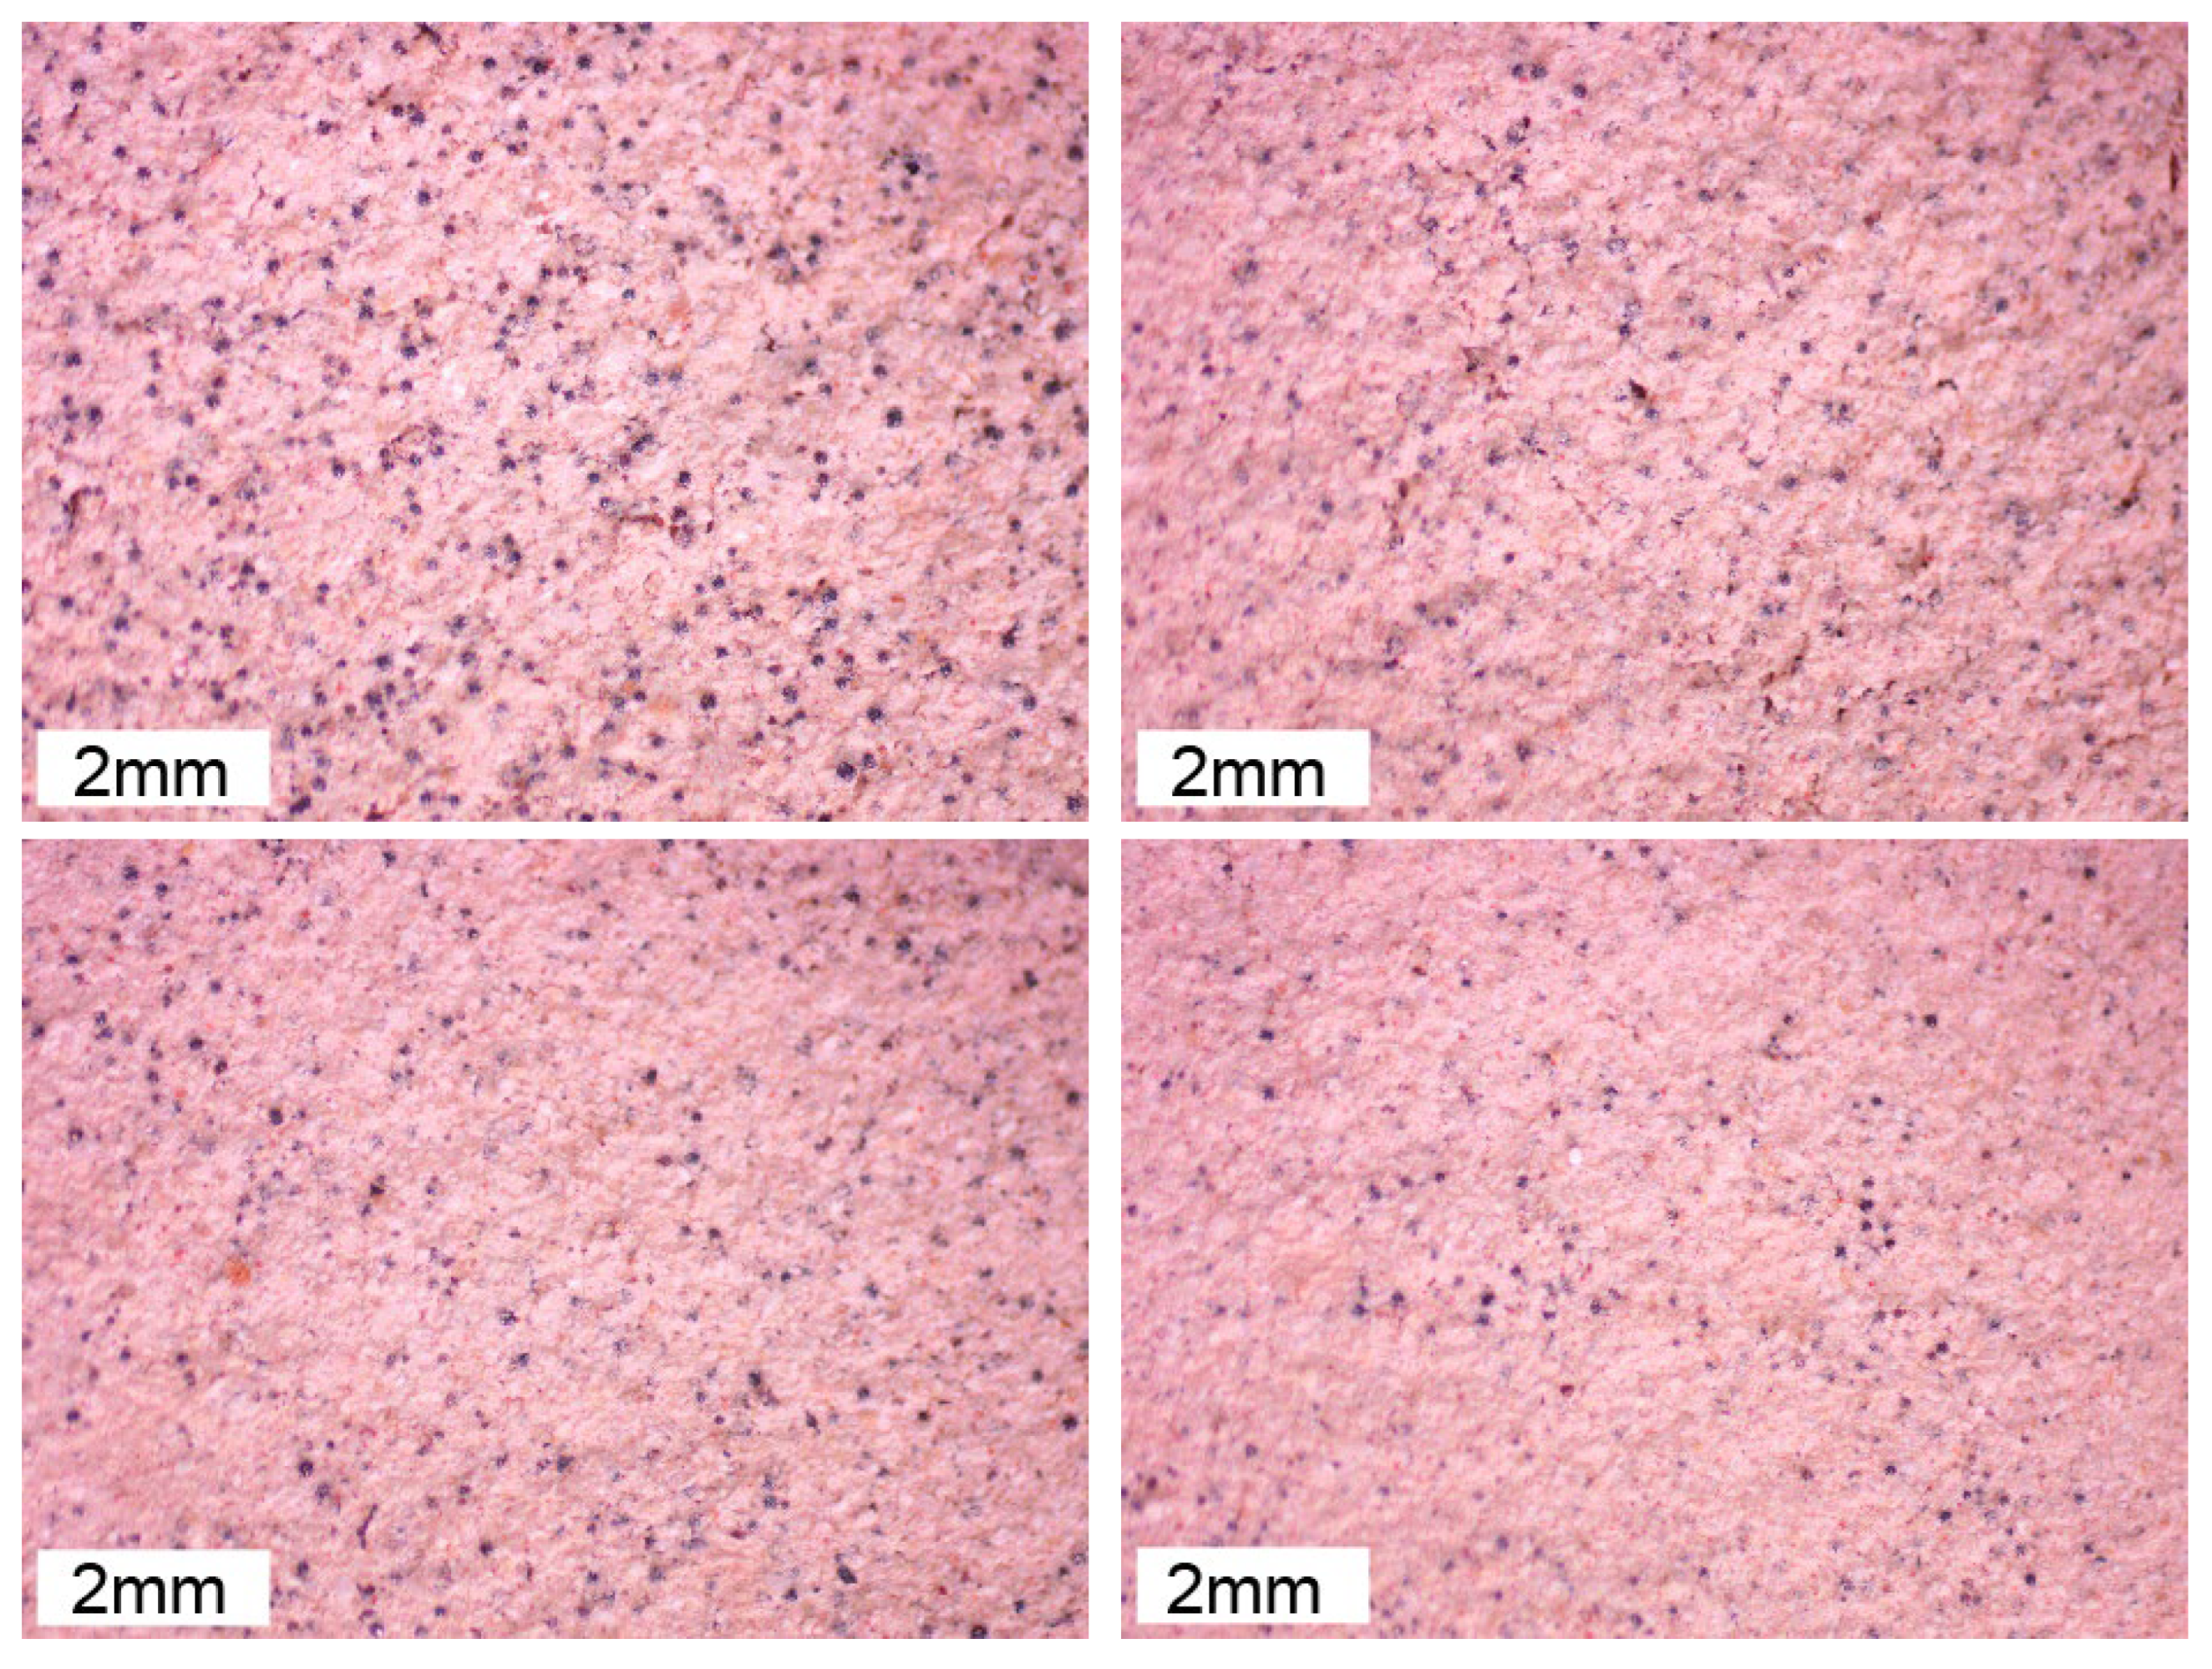
The influence of standing time on the surface state of the coating was observed, as shown in
Figure 9.
Observations of the surface state of the coating (
Figure 9) reveal that particle distribution remains uniform within the first 48 hours. However, beyond this period, significant deterioration occurs, negatively impacting the coating’s performance. Uniform particle distribution is crucial for maintaining the coating’s structural integrity and application quality. In conclusion, to ensure the best performance of lost foam shell casting coatings, it is critical to use the coating within 40 hours of preparation. This timeframe balances the benefits of increased viscosity and improved brushing performance with the risks of sedimentation and component degradation.
3.3. Discussion of Coating Performance Changes
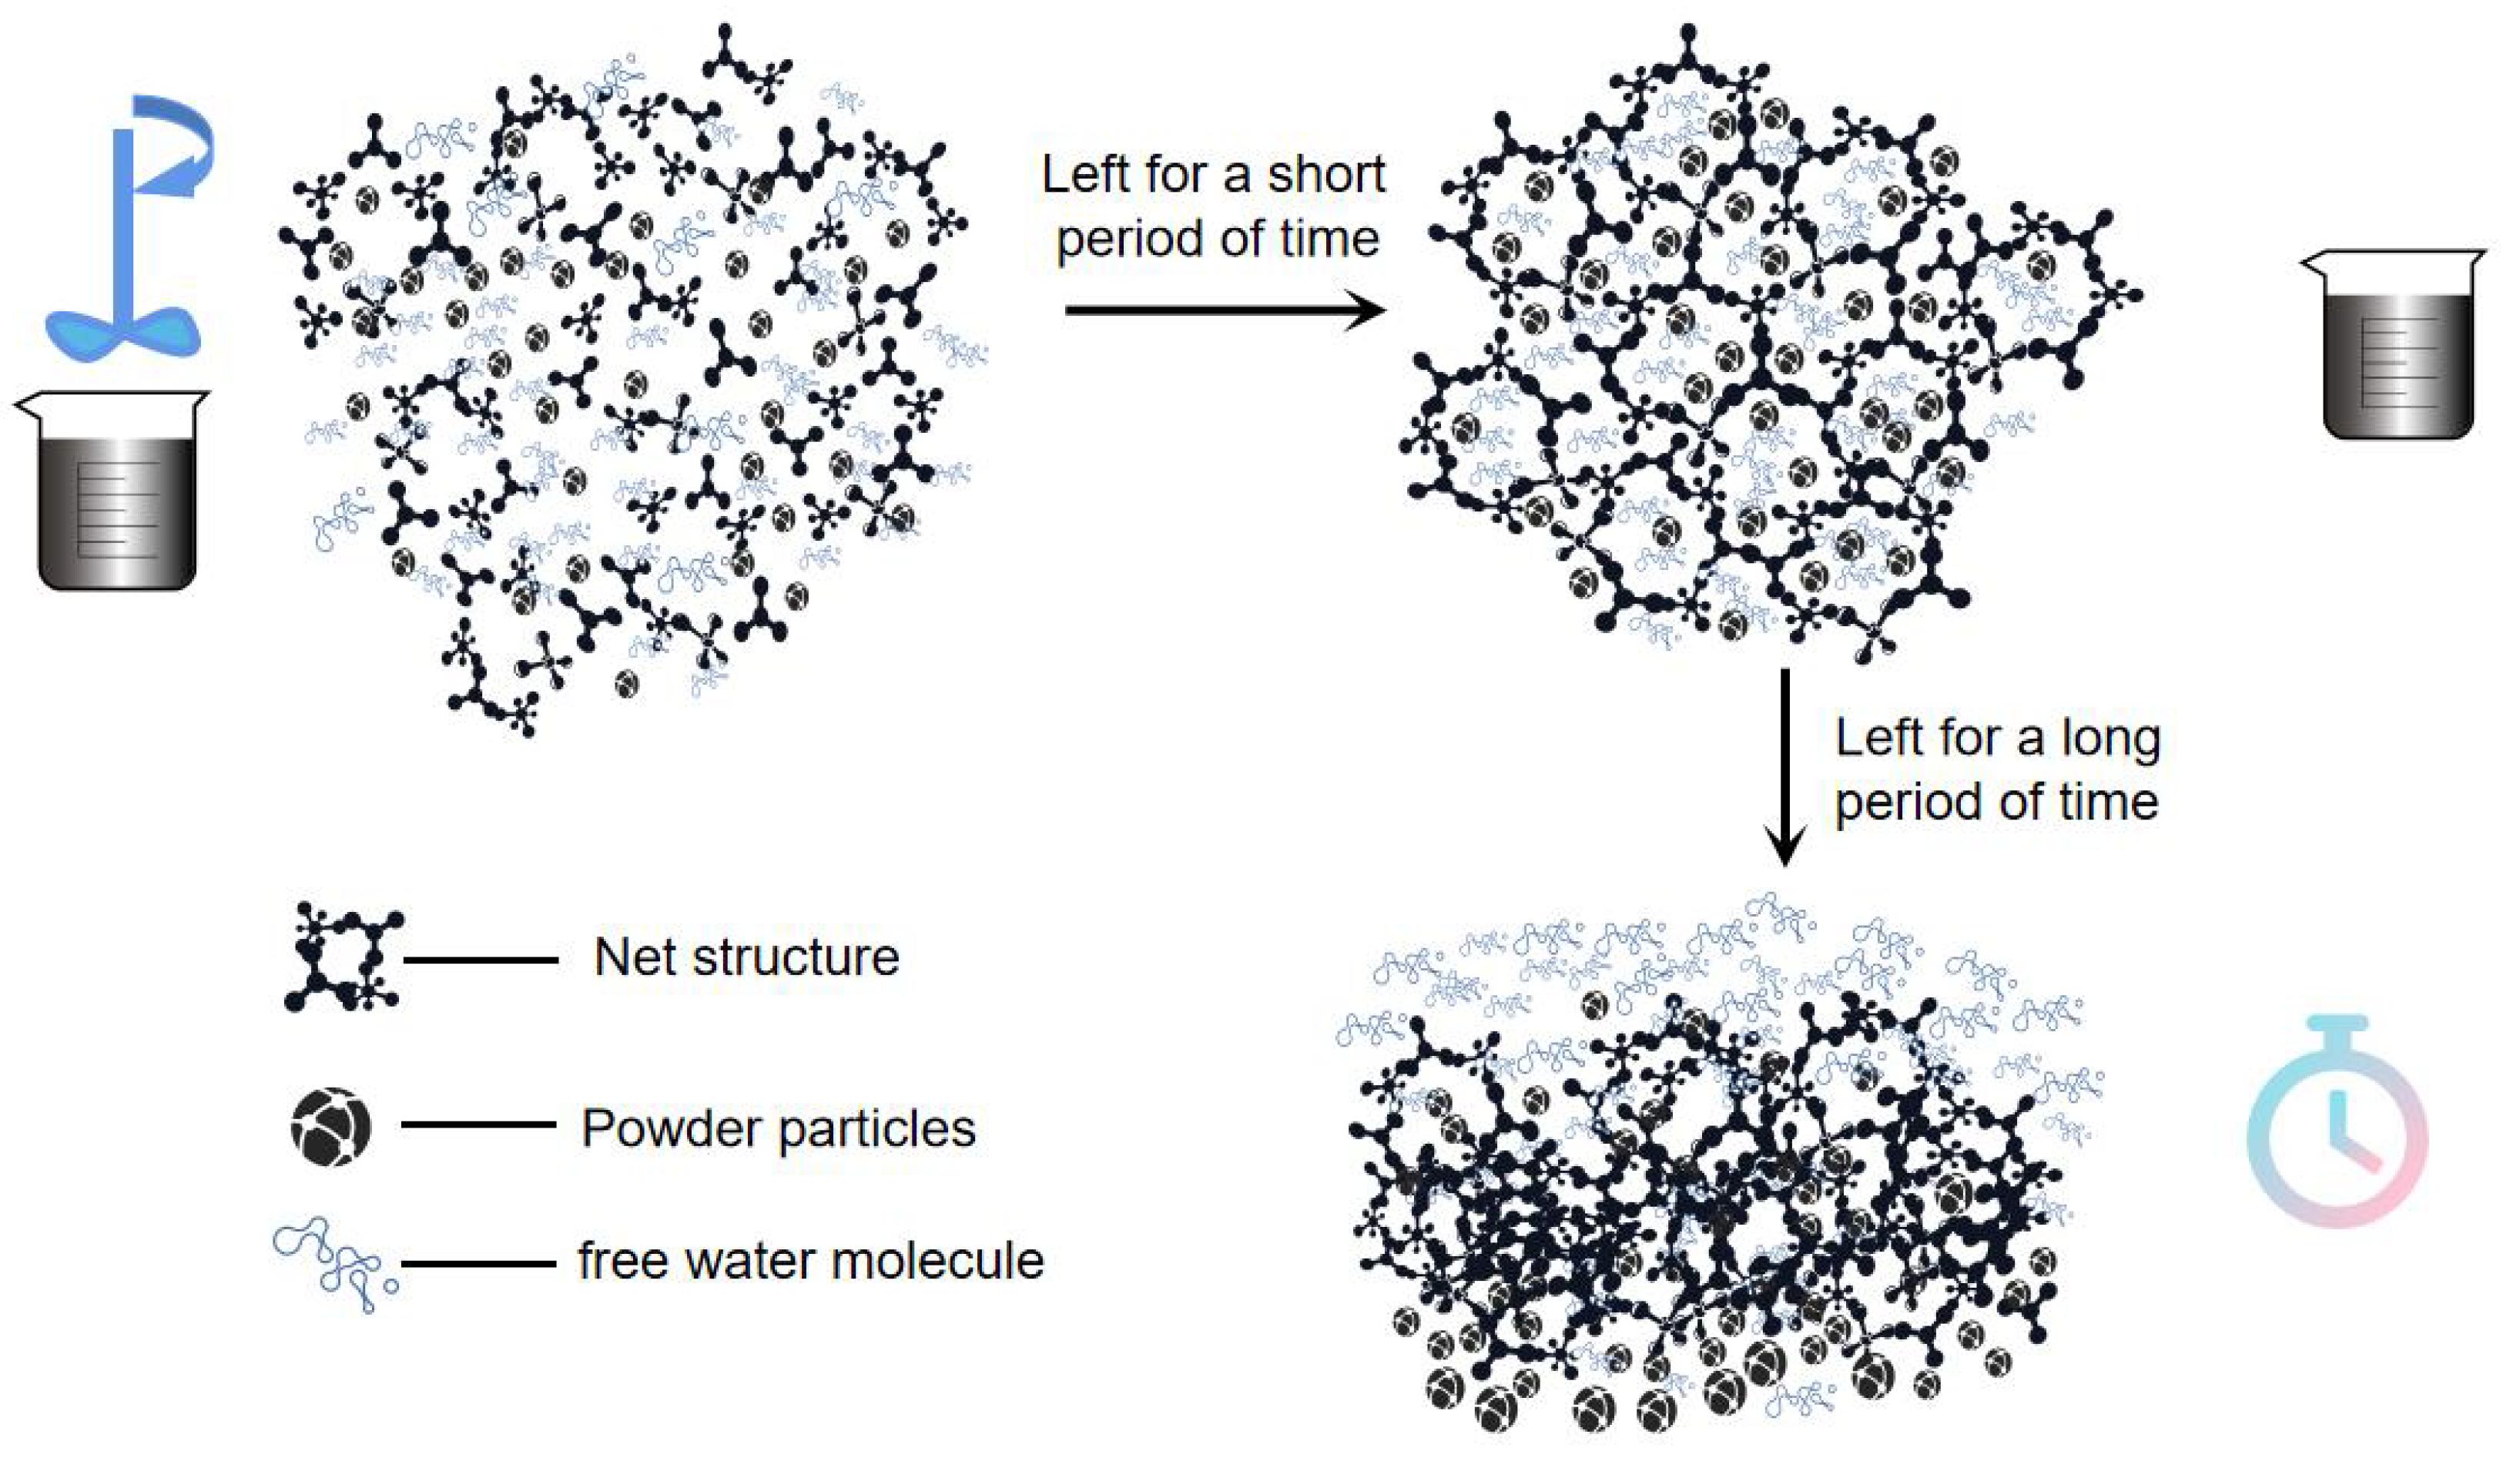
Uneven distribution and changes in viscosity emphasize the necessity of adhering to optimal standing times for lost foam shell casting coatings. Prolonged standing beyond 48 hours adversely affects the flow properties and compromises the coating’s ability to form a consistent shell. The results show that viscosity decreases with increasing mixing time, eventually stabilizing. Initially, viscosity increases with standing time but begins to decrease after extended standing periods, which can be attributed to structural changes occurring during both mixing and standing as shown in
Figure 10.
The viscosity of the coating is composed of structural and plastic viscosity. Plastic viscosity is primarily determined by intermolecular forces and internal friction within the liquid. In contrast, structural viscosity arises from specific internal structures within the coating, such as particle networks and agglomerates. Changes in viscosity observed during mixing and standing are mainly due to alterations in structural viscosity. During thorough mixing, these network structures are disrupted, leading to a reduction in structural viscosity. This viscosity then stabilizes after sufficient mixing time, as the coating components are uniformly distributed.
During the standing period, the disrupted network structures gradually reform, leading to an increase in viscosity. This reformation continues until sedimentation and partial degradation of the coating components occur after prolonged standing, causing a subsequent decrease in viscosity. This indicates that while initial standing can enhance the coating’s properties by allowing structural reformation, excessive standing leads to negative effects such as sedimentation and component degradation.
Therefore, controlling both mixing and standing times is crucial for optimizing the performance of lost foam shell casting coatings. Ensuring thorough mixing for at least 50 minutes disrupts and redistributes the network structures, while limiting the standing time to within 40 hours prevents sedimentation and maintains optimal viscosity and structural integrity. By adhering to these guidelines, manufacturers can achieve consistent coating performance and high-quality castings.
4. Conclusion
This study systematically investigated the effects of mixing and standing times on the viscosity and rheological properties of coatings used in lost foam shell casting. The key findings can be summarized as follows:
(1) The viscosity of the coating decreases with increasing mixing time, eventually stabilizing after 50 minutes. This stabilization is attributed to the thorough mixing and uniform breakdown of the network structures within the coating, leading to a minimal structural viscosity and a stable overall viscosity.
(2) After mixing, the viscosity of the coating initially increases with standing time due to the reformation of network structures that trap free water, thereby raising the structural viscosity. However, after 40 hours, the viscosity begins to decrease, likely due to the sedimentation of particles and the degradation of active components within the coating. This suggests that the optimal standing time for the coating should be controlled within 40 hours to maintain its performance.
(3)The study highlights the critical balance between mixing and standing times to optimize the coating’s viscosity and rheological properties. Adequate mixing ensures a homogeneous slurry with stable viscosity, while controlled standing time prevents excessive increases in viscosity that could hinder application performance.
Acknowledgments
The authors gratefully acknowledge the financial support from the Kunlun Talent Project of Qinghai Province.
Declaration of competing interest
The authors declare that there are no known competing financial interests or personal relationships that could have appeared to influence the work reported in this paper.
References
- Suyitno, R.K. Effect of Pattern Coating Thickness on Surface Roughness and Porosity of Nodular Cast Iron (FCD) 450 Using Lost Foam Casting Method. 2020.
- Sun, C.; Cao, Z. Effects of the Wettability Between the Coating and the Liquid EPS on the Filling Process of Lost Foam Casting. International Journal of Metalcasting 2023, 18, 1318–1328. [Google Scholar] [CrossRef]
- Karimian, M.; Ourdjini, A.; Idris, M.H.; et al. Effect of pattern coating thickness on characteristics of lost foam AlSiCu alloy casting. Transactions of Nonferrous Metals Society of China 2012, 22, 2092–2097. [Google Scholar] [CrossRef]
- Deev, V.; Prusov, E.; Ponomareva, K. Effect of Superheat Melt Treatment on Microstructure and Mechanical Properties of Aluminum Alloys Produced by Lost Foam Casting. Solid State Phenomena 2018, 284, 593–597. [Google Scholar] [CrossRef]
- Chekmyshev, K.E.; Ovcharenko, P.G. Numerical simulation of bimetallic casting cooling during the process of lost foam casting. Journal of Crystal Growth 2019, 527, 125243. [Google Scholar] [CrossRef]
- Karimian, M.; Idris, M.H.; Ourdjini, A.; et al. Effect of flask vibration time on casting integrity, Surface Penetration and Coating Inclusion in lost foam casting of Al-Si Alloy. European Journal of Pharmacology 2011, 1315, 633–638. [Google Scholar]
- Sun, C.; Cao, Z. Effects of the Wettability Between the Coating and the Liquid EPS on the Filling Process of Lost Foam Casting. International Journal of Metalcasting 2023, 18, 1318–1328. [Google Scholar] [CrossRef]
- Romazanov, Z.; Silayeva, O.; Tatieva, M.L.M.P.A. The feasibility study for the creation of production based on technology of lost-foam casting. Metalurgija 2023, 62, 103–106. [Google Scholar]
- Qiao, F.L.; Yin, Y.M.; Zhi, X.H. Study on the Casting Process of the Large-Scale High-Chromium Cast Iron Impeller. Advanced Materials Research, 2010; 139-141, 622–625. [Google Scholar]
- Su, Y.; Li, D.; Zhang, X. Optimising hardenability of high chromium white cast iron. China foundry 2006, 3, 284–287. [Google Scholar]
- Yoo, S.M.; Cho, Y.S.; Lee, C.C.; et al. Optimization of casting conditions for heat and abrasion resistant large grey iron castings. China Foundry 2007, 4, 124–127. [Google Scholar]
- Sands, M.; Shivkumar, S. Influence of coating thickness and sand fineness on mold filling in the lost foam casting process. Journal of Materials Science 2003, 38, 667–673. [Google Scholar] [CrossRef]
- Shi, T.; Guo, Z.; Gao, L. Wear-Resistant Coatings Prepared by Combination of SHS and Lost Foam Casting. Materials science forum 2013, 749, 595–599. [Google Scholar] [CrossRef]
- Yang, S.H.; Du, X.M. The Lost Foam Casting Simulation of the Gray Cast Iron Linner. Advanced Materials Research, 2013; 834-836, 1580–1583. [Google Scholar]
- Johnson, C.K.; Penumadu, D.; Murshed, M. Methods for Measuring Rheological Properties of Lost Foam Coatings. Transactions of the American Foundry Society 2005, 113. [Google Scholar]
- Ovcharenko, P.G.; Kuz’Minykh, E.V.; Lad’Yanov, V.I. Interaction of a Nonstick Corundum Coating with Iron–Carbon Melts under Lost-Foam Casting Conditions. Russian Metallurgy 2020, 2020, 115–120. [Google Scholar] [CrossRef]
- Zhang, L.; He, H.Q.; Kwek, W.R.; et al. Fabrication and Characterization of Anode-Supported Tubular Solid-Oxide Fuel Cells by Slip Casting and Dip Coating Techniques. Journal of the American Ceramic Society 2010, 92, 302–310. [Google Scholar] [CrossRef]
- Kerber, F.; Zienert, T.; Neumann, M.; et al. Insulating refractories based on rice husk ashes functionalized by flame-sprayed alumina coatings for steel ingot casting. Journal of the European Ceramic Society 2024, 44, 7296–7309. [Google Scholar] [CrossRef]
- Nayak, R.K.; Sadarang, J. Development of A356 Alloy Green Sand Mold Casting Process Using Narmada Riverbed Sand in India: Design of Experiment and Optimization. International Journal of Metalcasting 2022, 17, 1296–1307. [Google Scholar] [CrossRef]
- Song, X.; Baghoolizadeh, M.; Alizadeh, A.; et al. Utilizing machine learning algorithms for prediction of the rheological behavior of ZnO (50%)-MWCNTs (50%)/ Ethylene glycol (20%)-water (80%) nano-refrigerant. International Communications in Heat and Mass Transfer 2024, 156. [Google Scholar] [CrossRef]
- Del Giudice, F.; Barnes, C. Rapid Temperature-Dependent Rheological Measurements of Non-Newtonian Solutions Using a Machine-Learning Aided Microfluidic Rheometer. Analytical chemistry 2022, 94. [Google Scholar] [CrossRef]
- Bertolo, R.V.; Martins, M.C.A.; Plepis, V.G.; Junior, A.M. , Stanislau. Rheological study of the incorporation of grape seed extract in chitosan and gelatin coatings. Journal of Applied Polymer Science 2021, 138. [Google Scholar]
- Kimura, H.; Kosemura, T.; Ando, C. Temperature Control Design for Coating Fluid Circulatory Systems. Journal of Quality Engineering Society 2015, 23, 41–46. [Google Scholar]
- Chen, X.; Penumadu, D. Characterizing microstructure of refractory porous materials. Journal of Materials Science 2006, 41, 3403–3415. [Google Scholar] [CrossRef]
- Shirzadi Javid, A.A.; Ghoddousi, P.; Aghajani, S.; et al. Investigating the Effects of Mixing Time and Mixing Speed on Rheological Properties, Workability, and Mechanical Properties of Self-Consolidating Concretes. International Journal of Civil Engineering 2021, 19. [Google Scholar] [CrossRef]
- Vyas, A.V.; Pandya, M.P.; Sutaria, M.P. Effect of mixing proportion and mixing time on primary slurry retention and surface roughness of investment casting shells. IOP Conference Series Materials Science and Engineering 2020, 872, 012094. [Google Scholar] [CrossRef]
- Bambauer, R.A.; Lee, T.; Delong, T. Effect of Continuous Mixing on Viscosity and Permeability of an Iron Lost Foam Coating: A Joint Study. Transactions of the American Foundrymens Society 1996, 104, 329–333. [Google Scholar]
- Alter, H. The gelation of plastisols: An automatic method for the determination of plastisol temperature-rheology characteristics. Journal of Applied Polymer Science 2003, 2, 312–317. [Google Scholar] [CrossRef]
|
Disclaimer/Publisher’s Note: The statements, opinions and data contained in all publications are solely those of the individual author(s) and contributor(s) and not of MDPI and/or the editor(s). MDPI and/or the editor(s) disclaim responsibility for any injury to people or property resulting from any ideas, methods, instructions or products referred to in the content. |
© 2024 by the authors. Licensee MDPI, Basel, Switzerland. This article is an open access article distributed under the terms and conditions of the Creative Commons Attribution (CC BY) license (http://creativecommons.org/licenses/by/4.0/).
