Preprint
Article

Life Cycle Assessment and Prediction of Plug-in Hybrid Electric Vehicles Considering Different Vehicle Working Conditions and Battery Degradation Scenarios

Altmetrics

Downloads

144

Views

56

Comments

0

A peer-reviewed article of this preprint also exists.

Submitted:

12 July 2024

Posted:

13 July 2024

You are already at the latest version

Alerts
Abstract
This study establishes life cycle assessment model to quantitively evaluate and predict material resource consumption, fossil energy consumption and environmental emissions of plug-in hybrid electric vehicles (PHEVs) by employing the GaBi software. the envi-ronmental impact of different vehicle working conditions, power battery degradation scenarios and mileage scenarios on the operation and use stage of PHEV, BEV and HEV is distinguished. The findings indicate that under urban, highway, and aggressive driving conditions, PHEVs' life cycle material resource and fossil fuel consumption exceed that of BEVs but are less than HEVs. Battery degradation leads to increased material resource consumption, energy use, and environmental emissions for both PHEVs and BEVs, en-vironmental emission of BEVs are more sensitive than those of PHEVs to the impact of power battery degradation. Among different-mileage scenarios, PHEVs demonstrate the least sensitivity to increased mileage regarding life cycle material resource consumption, with the smallest increase. Future projections for 2025 and 2035 suggest life cycle GWP of HEV, PHEV and BEV in 2035 is 1.21×10⁴, 1.12×10⁴ and 1.01×10⁴ kg CO2-eq respectively, which is decreased by 48.7%, 30.9% and 36.1% compared with those in 2025. The out-comes of this study are intended to bolster data support for the manufacturing and de-velopment of PHEV, BEV and HEV under different scenarios and offer insights into the growth and technological progression of the automotive sector.
Keywords: 
Subject: Engineering  -   Automotive Engineering

1. Introduction

Amidst growing public concern over energy and environmental challenges, nations across the globe are fervently crafting and unveiling strategies for energy development aimed at fostering a balance between economic progress and environmental preservation. China has enacted policies to escalate the research and development efforts for new energy vehicles to alleviate the adverse impacts of automobiles on energy consumption and environmental sustainability. It explicitly aims for new and clean energy-powered modes of transport to constitute about 40% of all new additions by 2030. Within this context, plug-in hybrid electric vehicles (PHEVs), as a subset of energy-efficient and new energy vehicles, have emerged as a favored mode of transport. Nonetheless, assessing their comparative advantage regarding resource utilization and environmental impact over other new energy vehicle models necessitates further scientific inquiry.
In recent years, numerous domestic and international scholars have embarked on research regarding the life cycle and environmental benefit assessment of new energy vehicles in the domain of energy-saving and emission-reduction assessment for passenger cars. Nordelöf et al. [1] employed a literature review methodology to study the environmental impacts across the life cycle of hybrid electric vehicles (HEVs), PHEVs, and battery electric vehicles (BEVs), offering suggestions for establishing life cycle assessment (LCA) standards. García et al. [2] conducted a numerical assessment of vehicle models such as internal combustion engines vehicles (ICEV) and HEVs across the real driving cycles of the world’s six major automotive markets, assessing the degree of electrification best suited for minimizing lifecycle emissions and costs in each country. Zackrisson et al. [3] investigated design optimization of lithium-ion batteries for PHEVs using the LCA approach. Bauer et al. [4] proposed a comparative life cycle assessment model based on a novel integrated vehicle simulation framework, considering consistency in vehicle parameter settings and projections for future technological advancements. Miotti et al. [5] performed an environmental and cost assessment of fuel cell systems for fuel cell vehicles using LCA. Ambrose [6] explored the environmental impacts of using lithium batteries through life cycle assessment modeling. Shimizu et al. [7] assessed the impact of new technologies on specific regions using life cycle assessment and regional energy simulation models, considering a wide range of environmental and social indicators. Liang et al. [8] developed a life cycle energy consumption and gas emission assessment model for PHEVs based on Chinese national conditions, presenting data on energy consumption, conventional gas emissions, and greenhouse gas emissions throughout the PHEV life cycle. Fu et al. [9] established a data inventory for vehicle models such as HEVs and BEVs. They conducted a quantitative prediction and assessment of their life cycle carbon emissions, including a sensitivity analysis and discussion on the carbon emission factors of the Chinese electricity grid mix and different hydrogen production methods. Qiao et al. [10] compared the life cycle carbon emissions of the production and manufacturing processes of ICEV and BEVs in China from different components, materials, and energy consumption perspectives. Wu et al. [11] found that optimizing the Chinese electricity grid mix and expanding the scale of cogeneration could reduce the life cycle carbon emissions of BEVs compared to ICEV by 13.4% by 2020. Shi et al. [12] conducted a life cycle assessment for ICEV and BEVs for both the vehicle life cycle and fuel life cycle, and analyzed the emission reduction potential under different policies through scenario analysis. Chen et al. [13] constructed a life cycle assessment model for hydrogen fuel-cell vehicle fuel cycles and four hydrogen production schemes, selecting the Toyota Mirai for study and using GaBi software for the calculating the results. Andersson et al. [14], Yang et al. [15], and Yuksel et al. [16] found that the life cycle carbon emissions of PHEVs and HEVs are lower than those of ICEV under the influence of factors such as electricity grid, driving conditions, and different biofuels, but PM2.5 and SO2 emissions are higher than those of traditional fuel vehicles. Stefan Bickert et al. [17] analyzed the impact of carbon emissions from ICEVs and BEVs on the environment and economy. Hooftman et al. [18] used LCA to compare the power systems of PHEVs, BEVs, and HEVs. Sen et al. [19] applied a hybrid input-output and lifecycle sustainability assessment technique, considering 20 macro-level environmental and economic indicators to quantify the environmental impact of connected and autonomous heavy trucks. Usai et al. [20] conducted a life cycle assessment and predictive analysis of fuel cell power systems. Benitez et al. [21] focused on the inventory analysis of carbon fibers in hydrogen storage tanks and conducted a life cycle analysis of hydrogen fuel cell vehicles. Requia et al. [22] conducted a life cycle assessment for eight different cities in Canada, finding that the city’s electricity gird has a significant impact on the lifecycle carbon dioxide emissions of PHEVs. De Souza et al. [23] assessed the environmental benefits of ICEV, PHEVs, and BEVs using different fuels throughout their life cycles. Han et al. [24] studied the life cycle costs and greenhouse gas emissions of HEVs and BEVs, finding that BEVs currently cannot compete with HEVs in cost-effectiveness but can reduce greenhouse gas emissions. Held et al. [25] studied the lifecycle carbon emissions and environmental benefits of vehicles under different driving conditions. Shafique et al. [26] investigated the lifecycle environmental impacts in 10 countries under different electricity grid mix, showing that a cleaner electricity grid mix can reduce greenhouse gas emissions. Bhosale et al. [27] conducted a lifecycle environmental benefit assessment of electric vehicles in India, considering geographical locations and regional energy mix. The results indicated that BEVs are more environmentally friendly, and switching to cleaner energy sources will further reduce environmental impacts. Burton et al. [28] used 2019 U.S. grid data to evaluate the lifecycle emissions of BEVs, PHEVs, and HEVs. Their study showed that compared to hybrid vehicles, BEVs reduce vehicle emissions rates and, in many cases, have higher greenhouse gas emissions. Currently, hybrid powertrain technology is the best way to reduce emissions from the transportation sector. Wong et al. [29] assessed the lifecycle carbon footprint of BEVs, PHEVs, and fuel cell vehicles (FCVs), finding that the fuel cycle contributes significantly to the carbon footprint of passenger cars. Peng et al. [30] considering grid mix and vehicle efficiency, evaluated the lifecycle greenhouse gas emissions of BEVs, PHEVs, and ICEVs under real driving conditions. The study showed that, compared to global ICEVs, BEVs currently perform well in greenhouse gas emission reduction. Cai et al. [31] used a lifecycle assessment method to compare and evaluate ICEVs, BEVs, and PHEVs based on the 2020 electricity grid mix in Beijing. The results indicated that BEVs are the best solution for reducing urban air pollution. Yu et al. [32] conducted lifecycle carbon emissions of new energy passenger vehicles based on the 2018-2020 China Motor Vehicle Traffic Accident Liability Insurance Database. The results showed that PHEVs have a longer average lifespan than BEVs, but BEVs have lower lifecycle carbon emissions than PHEVs. Chen et al. [33] measured energy consumption and emissions of PHEVs and BEVs under real urban and highway driving conditions, finding that PHEVs have higher standard lifecycle carbon dioxide emissions than BEVs. Karabasoglu et al. [34] compared the potential of HEVs, PHEVs, and BEVs to reduce operating costs and lifecycle greenhouse gas emissions under various scenarios and simulated conditions.
In summary, scholars had explored and evaluated the mineral and fossil energy consumption, environmental emissions of PHEV and other alternative energy vehicles. Meanwhile, the inventories compilation, life cycle assessment model establishment and crucial parameter analysis had been studied and developed. However, the relationship between environment impact of PHEV, BEV and HEV and vehicle working conditions and power battery degradation is uncertain and eager to distinguish. In addition, the effect of different mileage combined with private car and taxi driving scenarios on environment emission and energy consumption have not been fully revealed. Therefore, this study quantitively evaluates and predicts material resource consumption, fossil energy consumption and environmental emissions of PHEVs using life cycle assessment. Additionally, the environmental impact of different vehicle working conditions, power battery degradation scenarios and mileage scenarios on the operation and use stage of PHEV, BEV and HEV is distinguished The outcomes of this study are intended to bolster data support for the manufacturing and development of PHEVs, BEV and HEV under different scenarios and offer insights into the growth and technological progression of the automotive sector.

2. Life Cycle Assessment Model for PHEVs

Based on the research foundation of the author team [9,13,35,36,37], this study employs the life cycle assessment (LCA) method to construct a mathematical assessment model for material resource consumption, fossil energy consumption, and environmental emissions. This model evaluates the resource consumption and environmental benefits of PHEVs throughout their life cycle.

2.1. Assessment Objectives

In this paper, we conduct a life cycle assessment of PHEVs, explicitly focusing on the Toyota Corolla Levin as a representative model. The key parameters of PHEVs are shown in Table 1. The maximum engine power refers only to the power delivered by the internal combustion engine to the motor.

2.2. System Boundary and Functional Unit

The goal of this study is to quantitatively assess and predict the environmental impacts of PHEV and to quantitatively identity the effect of different vehicle working conditions, power battery degradation and milage on environment difference for PHEV, BEV and HEV. The system boundary of this study is shown in Figure 1. The inputs of system boundary include fossil energy and mineral resources. Fossil energy and mineral resources consumption throughout life cycle, which are represented using the values of Abiotic Depletion (element) (ADP(e), in Sb-eq, unit: kg), Abiotic depletion (fossil) (ADP(f), in MJ), characterized by the values of crude oil, hard coal, natural gas and steel, aluminum, copper et al. respectively. The outputs of system boundary include CO2, CO, SO2, NOx, PM et al. Those emissions are converted and characterized to acidification potential (AP, in SO2-eq, unit: kg), eutrophication potential (EP, in Phosphate-eq, unit: kg), human toxicity potential (HTP, in DCB-eq, unit: kg), photochemical ozone creation potential (POCP, in ethene-eq, unit: kg), ozone depletion potential (ODP, in CFC-eq, unit: kg), and global warming potential (GWP, in CO2-eq, unit: kg) representing carbon emissions using CML 2001 method.
As Figure 1 shows, this study includes three main parts: life cycle assessment of PHEV, scenario simulation in operation and use stage, life cycle prediction assessment. The life cycle of a PHEV comprises four stages: raw material acquisition, manufacturing and assembly, operation and use, and scrap recycling, not including product transport. Meanwhile, the life cycle PHEV includes vehicle life cycle and fuel life cycle. Vehicle life cycle includes vehicle raw material acquisition, vehicle component manufacturing and assembly, vehicle scrap recycling. Fuel life cycle includes fuel extraction, fuel production, fuel refining and fuel use. In detail, electricity grid mix is composed of coal-fire power, wind power, hydroelectric power, photovoltaic power and nuclear power electricity. In the second parts, scenario simulation in operation and use stage mainly considers the effect of different vehicle working conditions, power battery degradation and milage on environment difference for PHEV, BEV and HEV. In the third parts, life cycle prediction assessment mainly considers the fuel consumption economy, body lightweight and electricity grid composition proportion change and assesses the life cycle mineral and fossil energy consumption and environmental emission of PHEV, HEV and BEV in 2025, 2030 and 2035.
The functional unit refers to the quantified product function or performance characteristics. This study considers the average driving distance during the actual use of the vehicle. To evaluate and predict the life cycle PHEV, the 150,000 km is chosen as the functional unit. To compare the environmental impact of PHEV, BEV and HEV during operation and use stage, the vehicle driving for 1 year is chosen as the functional unit.

2.3. Mathematical Assessment Model

2.3.1. Material Resource Consumption Assessment Model

Material resource consumption refers to utilizing metallic and non-metallic materials, corresponding to metallic and non-metallic minerals, throughout the vehicle’s life cycle. The consumption is quantified using the material resource consumption indicator (ADP(e)) from the CML2001 assessment system [38]. The material resource consumption matrix for the PHEV’s entire life cycle is depicted in Formula 1:
F LCA = F mat + F man + F use + F rec
Fmat represents the material resource consumption matrix for the raw material acquisition stage, Fman represents the material resource consumption matrix for the manufacturing and assembly stage, Fuse represents the material resource consumption matrix for the operation and use stage, and Frec represents the material resource consumption matrix for the scrap recycling stage.
The material resource consumption matrix for the raw material acquisition stage is shown in Formula 2:
F mat = k [ ( m i j ) k × n ( f 0 i j ) n × t ]
mij represents the mass (in kg) of the j-th type of vehicle material contained in the i-th component of the vehicle, where k is the number of components in the vehicle and n is the number of vehicle materials. f0ij represents the amount (in kg) of the j -th material resource required to produce one unit of the i -th type of vehicle material, where t is the number of material resources.
The material resource consumption matrix for the manufacturing and assembly stage is shown in Formula 3:
F man = k [ ( e 2 i j ) k × r ( f 1 i j ) r × t ]
e2ij represents the amount of the j -th type of secondary energy (in MJ/kg) required for the manufacturing process of the i -th component of the vehicle, where r is the number of types of secondary energy. f1ij represents the amount (in kg/MJ) of the j -th material resource required to produce one unit of the i -th type of secondary energy.
The material resource consumption matrix for the operation and use stage is shown in Formula 4:
F use = Q 1 × L / 100 / η ( f 11 j ) 1 × t
Q1 represents the energy consumption per 100 kilometers for the vehicle, either in kWh/(100 km) for electric vehicles or kg/(100 km) for gasoline vehicles. L represents the total life cycle driving distance in kilometers. η represents the energy conversion efficiency of the vehicle. f11j represents the amount (in kg/MJ) of the j -th type of material resource required to produce one unit of energy.
The scrap recycling stage considers the recycling of steel, cast iron, aluminum, copper, lithium metal, and non-metallic materials such as rubber and plastic. Let ξ1, ξ2, ξ3, ξ4, ξ5, ξ6, and ξ7 represent the recycling rates of steel, cast iron, aluminum, copper, lithium metal, rubber, and plastic, respectively. The material resource consumption matrix for the scrap recycling stage is shown in Formula 5:
F rec = k ( m i j ξ j ) k × 7 ( e 3 i j ) 7 × r ( f 1 i j ) r × t ( f 0 i j ) 7 × t
e3ij represents the amount of the j -th type of secondary energy (in MJ/kg) required for the recycling process of one unit of material i.

2.3.2. Fossil Energy Consumption Assessment Model

Fossil energy is consumed throughout the vehicle’s life cycle. Based on the energy consumption characteristics in the vehicle’s life cycle, the consumed energy is divided into primary and secondary energy. Primary energy includes coal, petroleum, and natural gas, while secondary energy includes electricity, gasoline, and diesel. The material resource consumption quantity (ADP(e)) from the CML2001 assessment system represents material resource consumption. The fossil energy consumption matrix for the PHEV’s entire life cycle is shown in Formula 6:
E LCA = E mat + E man + E use + E rec
Emat represents the fossil energy consumption matrix for the raw material acquisition stage, Eman represents the fossil energy consumption matrix for the manufacturing and assembly stage, Euse represents the fossil energy consumption matrix for the operation and use stage, and Erec represents the fossil energy consumption matrix for the scrap recycling stage.
The fossil energy consumption matrix for the raw material acquisition stage is shown in Formula 7:
E mat = k [ ( m i j ) k × n ( e 0 i j ) n × u ]
e0ij represents the amount of the j-th type of primary energy (in MJ/kg) required to produce one unit of the i-th type of vehicle material, where u is the number of types of primary energy.
The fossil energy consumption matrix for the manufacturing and assembly stage is shown in Formula 8:
E man = k [ ( e 2 i j ) k × r ( e 1 i j ) r × u ]
e1ij represents the amount of the j -th type of primary energy (in MJ/MJ) required to produce one unit of the i -th type of secondary energy.
The fossil energy consumption matrix for the operation and use stage is shown in Formula 9:
E use = Q 1 × L / 100 / η ( e 11 j ) 1 × u
e11j represents the amount of the j -th type of primary energy (in MJ/MJ) required to produce one unit of gasoline or electricity.
The fossil energy consumption matrix for scrap recycling stage is shown in Formula 10:
E rec = k ( m i j ξ j ) k × 7 [ ( e 3 i j ) 7 × r ( e 1 i j ) r × u ( e 0 i j ) 7 × u ]

2.3.3. Environmental Emissions Assessment Model

Environmental emissions refer to pollutants and carbon dioxide emissions generated by vehicles throughout the four stages of their life cycle: raw material acquisition, manufacturing and assembly, operation and use, and scrap recycling. These emissions include carbon oxide gases, sulfur-containing gases, nitrogen-containing gases, etc. The environmental emissions are represented using six assessment indicators from the CML2001 assessment system: Global Warming Potential (GWP), Acidification Potential (AP), Eutrophication Potential (EP), Human Toxicity Potential (HTP), Ozone Depletion Potential (ODP), and Photochemical Ozone Creation Potential (POCP). The matrix for environmental emissions over the PHEV’s life cycle is shown in Formula 11:
P LCA = P mat + P man + P use + P rec
Pmat represents the pollution emissions matrix for the raw material acquisition stage, Pman represents the pollution emissions matrix for the manufacturing and assembly stage, Puse represents the pollution emissions matrix for the operation and use stage, and Prec represents the pollution emissions matrix for the scrap recycling stage.
The environmental emissions assessment matrix for the raw material acquisition stage is shown in Formula 12:
P mat = k [ ( m i j ) k × n ( p 0 i j ) n × s ]
p0ij represents the amount of the j-th type of environmental emissions equivalent (in kg/kg) emitted per unit production of the i-th type of vehicle material, where s is the number of types of environmental emissions.
The environmental emissions assessment matrix for the manufacturing and assembly stage is shown in Formula 13:
P man = k [ ( e 2 i j ) k × r ( p 1 i j ) r × s ]
p1ij represents the amount of the j-th type of environmental emissions equivalent (in kg/MJ) emitted per unit production of the i-th type of secondary energy.
The environmental emissions assessment matrix for the operation and use stage is shown in Formula 14:
P use = Q 1 × L / 100 / η ( p 11 j ) 1 × s
p11j represents the amount of the j-th type of environmental emissions equivalent (in kg/MJ) emitted per unit production of gasoline or electricity.
The pollution emissions matrix for the scrap recycling stage is shown in Formula 15:
P rec = k ( m i j ξ j ) k × 5 [ ( e 3 i j ) 5 × r ( p 1 i j ) r × s ( e 0 i j ) 5 × s ]

2.4. Inventory

The inventories of the raw material acquisition, manufacturing and assembly, operation and use, scrap recycling stage of PHEV are investigated and analyzed.

2.4.1. Raw Material Acquisition Stage

In this study, PHEV is divided into nine parts for modeling: engine, generator, lead-acid battery, motor, main reducer, lithium battery, body, chassis and fluid. Some materials or parts that have little impact on the assessment results are replaced or omitted. The main materials and quality of each component are shown in the Table 2.

2.4.2. Manufacturing and Assembly Stage

The electricity grid mix of this paper selects the electricity grid mix of China in current state, in which coal power accounts for 71%, hydropower for 15%, photovoltaic power generation for 2%, nuclear power for 3%, wind power for 4% and other methods for 5%. The manufacturing energy consumption and heat consumption of each component refer to the literature [36,37]. By calculation, the total fossil energy consumption of manufacturing and assembly stage is 20781.91MJ, and the total thermal energy consumption is 5443.08MJ.

2.4.3. Operation and Use Stage

In the PHEV operation and use phase, the energy consumption generated by vehicle operation and the material consumption generated by component replacement are mainly considered. Toyota PHEV in pure gasoline consumption is 4.3L/100km, pure electricity consumption is 14.42kWh/100km. It is assumed that the use of the gasoline and electricity consumption ratio of 1: 1 when the vehicles are used for daily travel. Therefore, Toyota Rayon PHEV driving 100km needs to consume 2.15 L gasoline and 7.21kWh of electricity. The replacement of vehicle parts during operation and use is shown in Table 3.

2.4.4. Scrap Recycling Stage

The main metal materials are considered in the vehicle traditional component recovery, including the steel, aluminum, cast iron, copper, lithium metal, and non-metallic materials such as rubber and plastic. The data of recycling process, rate and energy consumption of those metal material come from literature [13,35]. The data of lithium battery recovery come from literature [12,15].

3. Assessment Result Analysis for PHEVs

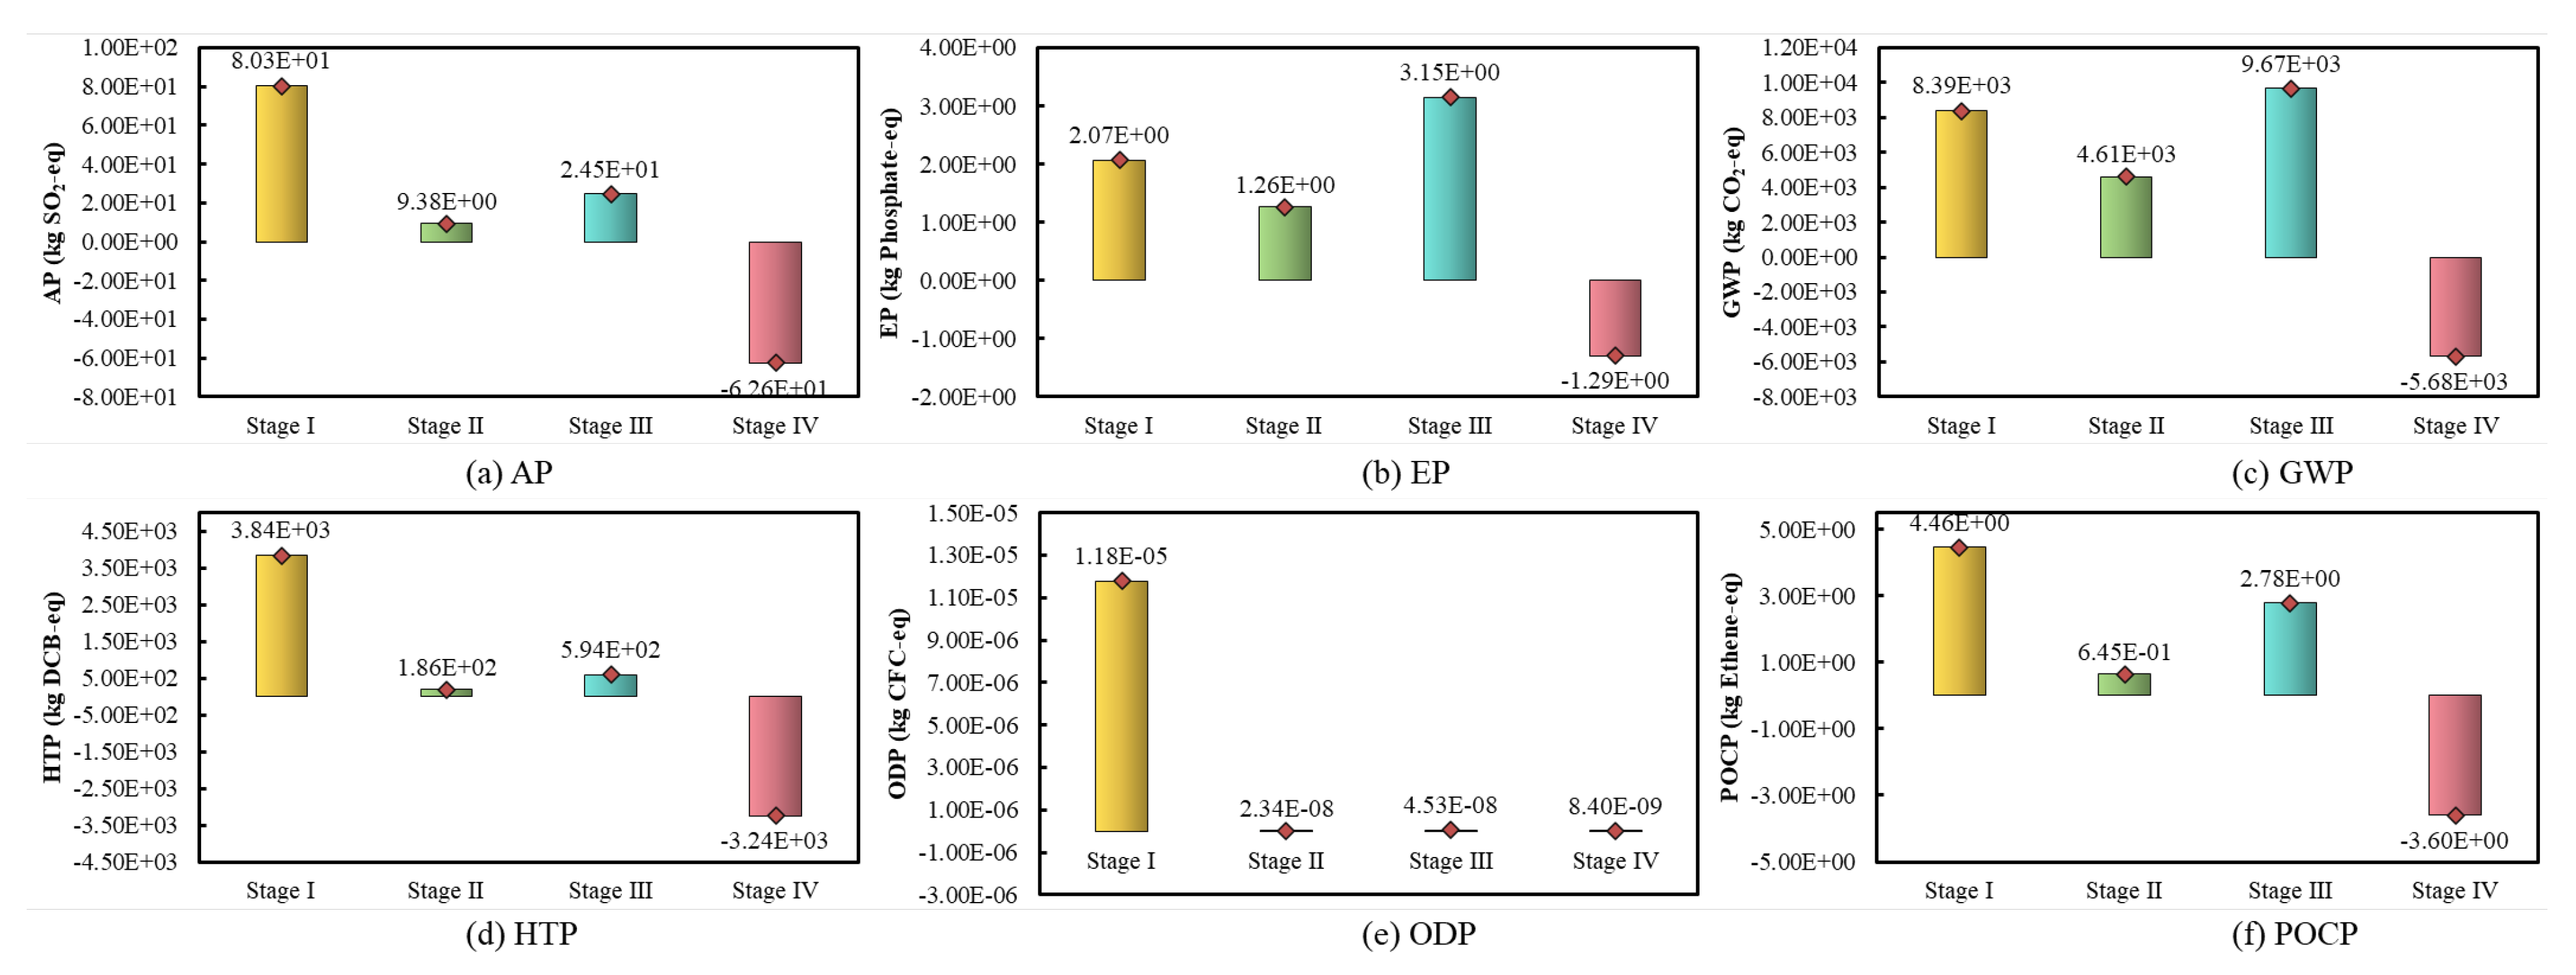
Characterization results of PHEV in each stage is shown as Table 4. Comparison of material resource consumption and fossil energy consumption of PHEV in each stage is shown as Figure 2. Comparison of environmental Emissions of PHEV in each stage is shown as Figure 3.
As shown in Figure 2(a), it can be seen that PHEV has the highest material resource consumption in the raw material acquisition stage, mainly due to the large amount of copper, aluminum, steel, and other mineral resources needed in the materials of components such as the vehicle’s power battery, main reducer, body, and chassis. The material resource consumption in the manufacturing and assembly stages and the operation and use stage is relatively low, mainly because the vehicle consumes less material during manufacturing and assembly, mainly due to the energy consumption for assembling the various components of the vehicle. During the operation and use stage, the consumption of materials is mainly due to replacing vehicle components to maintain regular operation. In the scrap recycling stage, recycling the primary metal and non-metal materials in the vehicle body positively impacts material resource consumption, significantly saving material resources.
As shown in Figure 2(b), it can be seen that the fossil energy consumption of PHEV is the highest in the operation and use stage, accounting for 70.99% of the total, mainly because PHEV requires a large amount of gasoline and electric energy during this stage. On the one hand, the vehicle generates a large amount of direct energy consumption of fossil energy such as gasoline during use. On the other hand, the main reason is that coal-fired power generation accounts for the primary method of electricity source structure in China, which indirectly leads to fossil energy consumption. Secondly, the fossil energy consumption of PHEV in the raw material acquisition stage is significantly lower than that in the operation and use stage, mainly because the fossil energy consumption generated by the vehicle in the raw material acquisition stage mainly comes from the production of vehicle raw materials such as steel plates, which consumes far less energy than the energy consumed by the vehicle running 150,000 kilometers. In the scrap recycling stage, the recycling of the main metal and non-metal materials in the vehicle body saves a large amount of fossil energy consumed in producing these metal and non-metal materials, thus positively impacting fossil energy consumption and saving fossil energy.
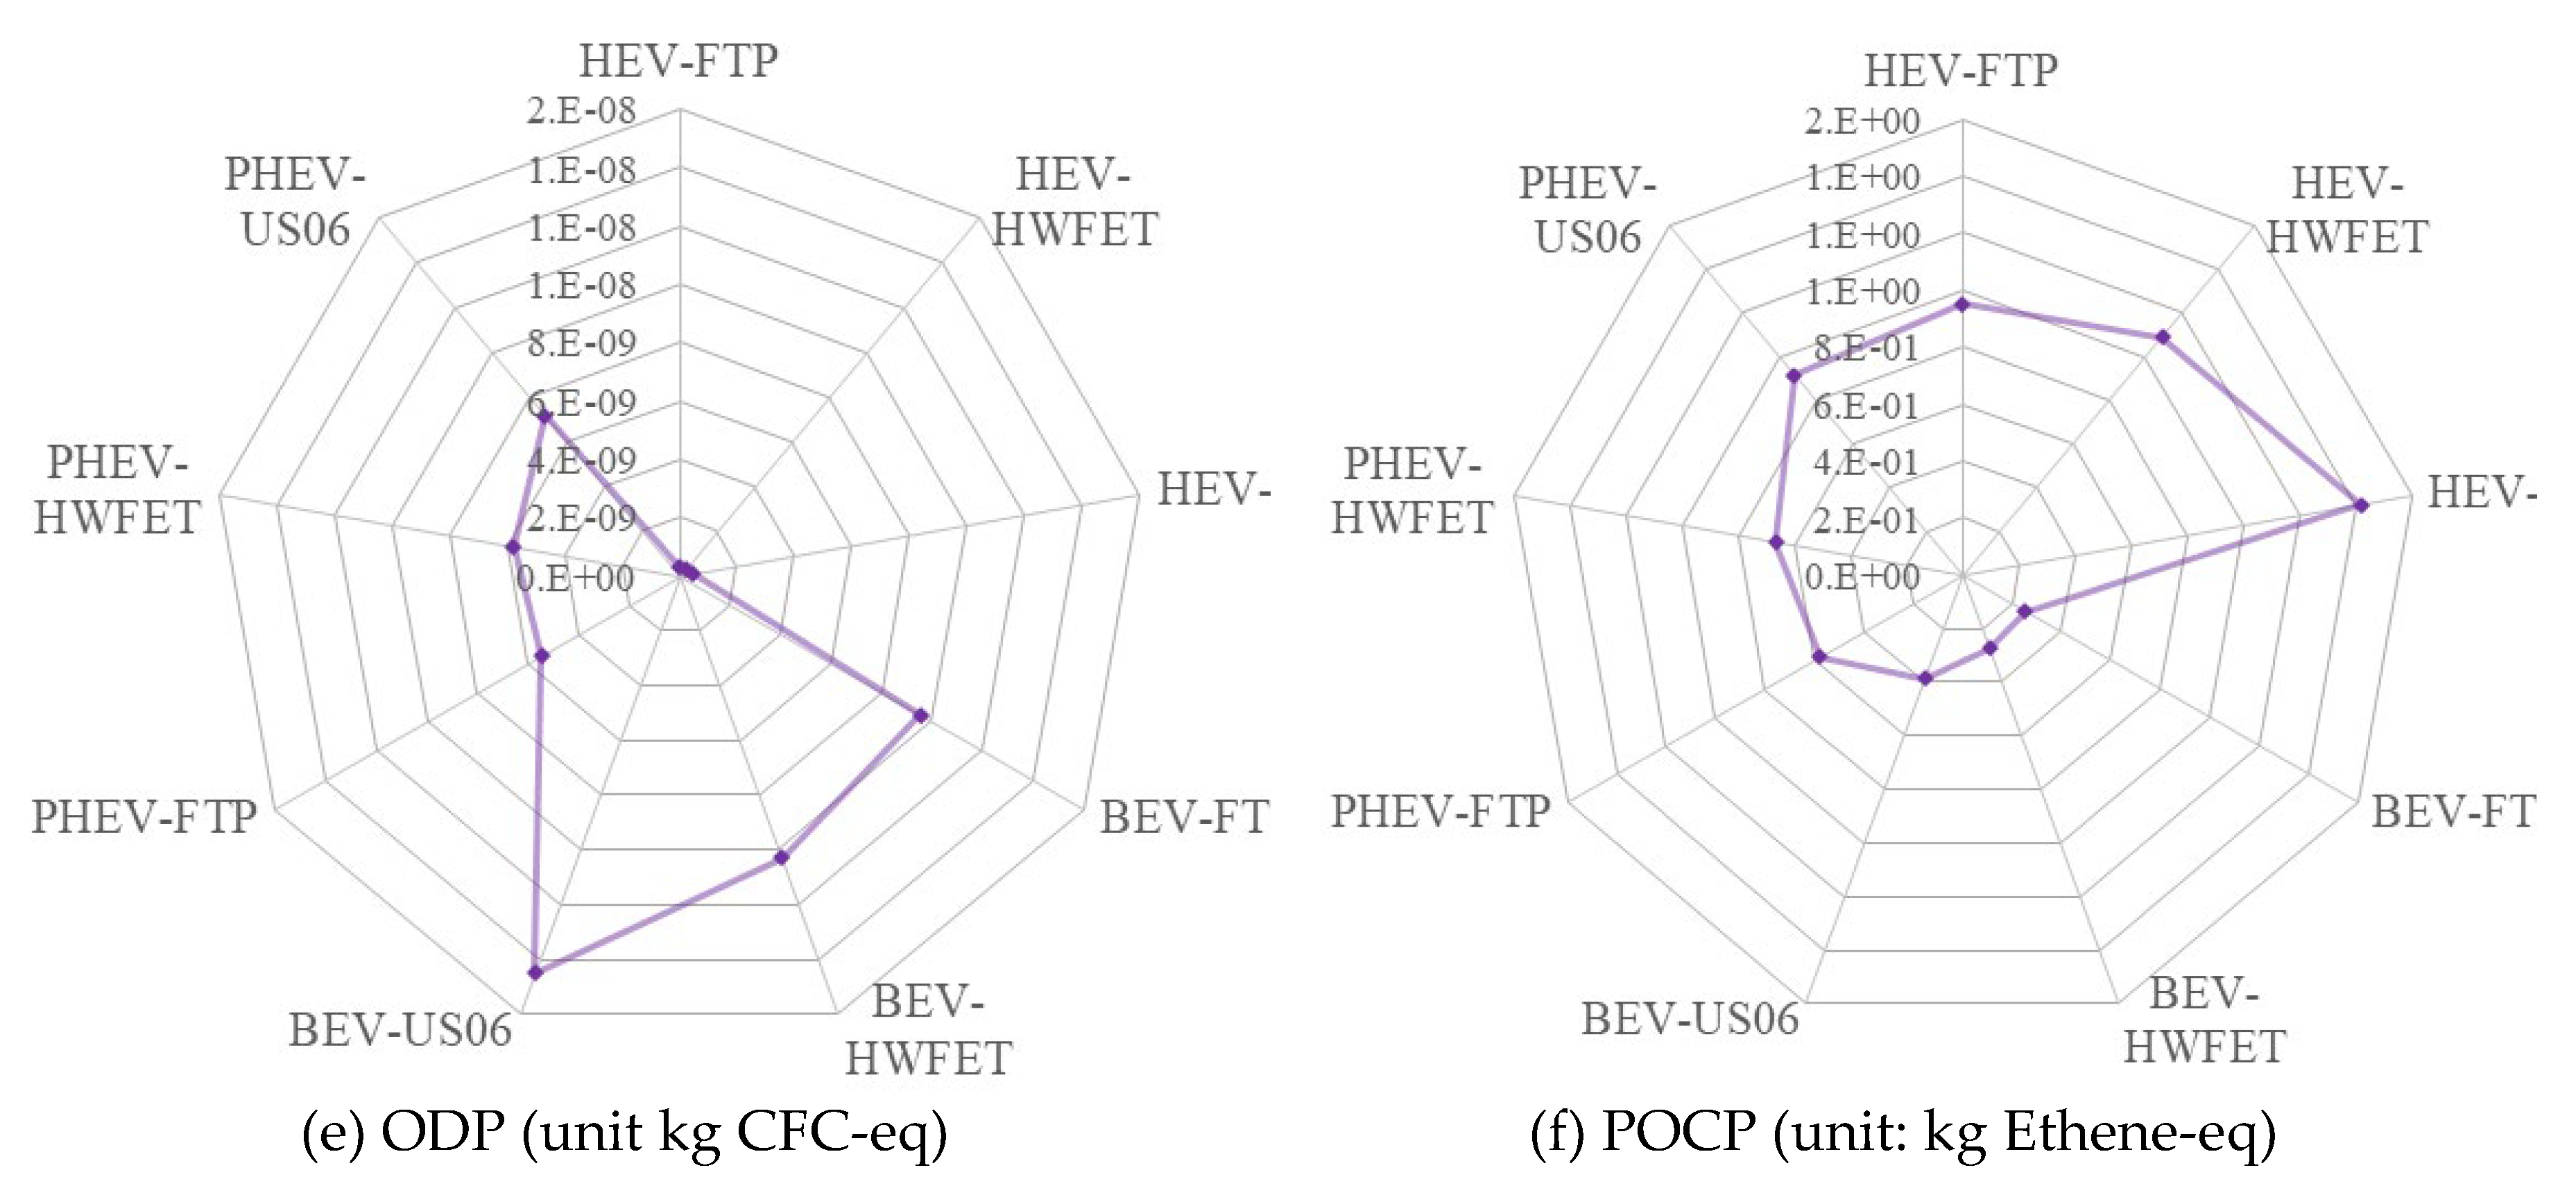
Figure 3 shows that PHEV has the highest values for AP, HTP, ODP, and POCP environmental emission indicators in the raw material acquisition stage. This is mainly because the raw material acquisition stage involves large resource consumption and the generation of a large amount of waste, which significantly impacts AP, HTP, ODP, and POCP. PHEV has the highest values for EP and GWP environmental emission indicators in the operation and use stage. This is mainly due to the high fossil energy consumption during this stage, which significantly impacts EP and GWP. In the scrap recycling stage, PHEV positively impacts environmental emissions, leading to emission reduction.

4. Analysis and Discussion of Environmental Benefits in Different Scenarios

PHEVs can operate in three modes during the vehicle’s usage phase: electric motor drive, engine drive, or a combination of both. The overall environmental performance of a PHEV during its usage phase depends mainly on critical factors such as driving mode, battery degradation, and driving distance. Therefore, this study analyzes the full lifecycle environmental benefits of the vehicle’s usage phase by examining key factors, including driving conditions, battery degradation, and driving distance.

4.1. Vehicle Model Specification

The battery in HEVs is designed to increase the efficiency of gasoline combustion without the necessity for plugging in for power. Unlike BEVs, which are exclusively driven by electrical energy, PHEVs operate using gasoline and electric power. These three types of drivetrains, including those in ICEVs, feature the ability to recover energy through regenerative braking. This study compares HEVs and BEVs within the same class, delineated by wheelbase length, to enhance the clarity of the analysis of critical lifecycle aspects during the use phase of PHEVs. The fundamental parameters of the vehicles compared are shown in Table 5.

4.2. Different Working Conditions Scenario Analysis

Vehicles’ fuel economy and emissions are influenced by driving behavior, including daily driving distance and driving conditions. Official fuel economy ratings, or vehicle cycle conditions, are determined under standardized test and driving conditions, known as the drive cycle method. This approach is the most scientific experimental method for assessing vehicle or engine emission states. However, vehicle emissions invariably deviate from the standard fuel and electricity consumption rates in real-world applications. Therefore, this paper integrates lifecycle assessment with the drive cycle method to evaluate the environmental benefits of different driving modes of PHEVs under various working conditions.

4.2.1. Construction of Vehicle Working Conditions Scenario

This article employs the FTP (Federal Test Procedure for urban driving conditions) and HWFET (Highway Fuel Economy Testing) cycles to evaluate vehicles’ full lifecycle environmental benefits. Additionally, due to the potential for rapid depletion of battery charge under improper usage, this study also considers the aggressive driving condition within the EPA’s (Environmental Protection Agency) test cycles, known as US06, which involves high acceleration and engine load situations. The characteristics of the three driving conditions for the vehicles are shown in Table 6.
The operation of PHEVs can be categorized into two phases: the Charge Depleting (CD) mode and the Charge Sustaining (CS) mode. Each phase has three operational modes: Electric Vehicle Drive, Hybrid Drive, and Engine Drive. During the CD phase, the EV drive mode predominates with the battery well-charged, shifting to hybrid power only under high power demands. Switches between EV drive and Engine Drive also occur at medium to high speeds in low-load conditions, where the engine operates in its most efficient RPM range. In the CS phase, the electrical energy is not directly sourced from the grid but generated through the engine’s conversion of mechanical energy output. Hence, the efficiency of both fuel and electric consumption must be considered. Optimizing the fuel economy of the power system involves a trade-off between Engine Drive and Hybrid Drive, depending on the State of Charge (SOC) of the vehicle’s battery, which indicates the available charge remaining, typically expressed as a percentage. Changes in driving mode affect the vehicle’s All Electric Range (AER), the calculation of which is shown in Equation 16.
S A E R = Z k η C D
In this expression, Z quantifies the battery’s available charge as a percentage (%). ηCD is the vehicle’s energy consumption efficiency under Charge Depleting (CD) mode, calculated as kilometers per kilowatt-hour (km/kWh). CBAT accounts for the number of individual batteries in the battery assembly, VBAT represents the nominal battery voltage, and KBAT measures the battery capacity in ampere-hours (Ah). The term k refers to the total energy capacity of the battery in kilowatt-hours (kWh), with its calculation presented in Equation 17.
k = C B A T V B A T K B A T 1000
This study assumes a default constant power loss of 0.3 kW for all vehicles due to electrical loads. For HEVs, the initial SOC and target SOC are set at 60%. For PHEVs and BEVs, in the CD mode, the initial SOC is set at 90%, and the target SOC is set at 30%, while in the CS phase, both the initial and target SOC are set at 30%. The efficiency and AER for each vehicle in each driving cycle are shown in Table 7.
Based on the literature review and data verification, referencing the “Survey on the Actual Operation of Electric Vehicles in China,” it is noted that the driving range of rental cars and public buses significantly exceeds the average. Rental cars have an average daily driving distance of up to 232 km, while public buses travel an average of 165 km daily. On the other hand, private cars have an average daily driving distance of approximately 65 km, with a total monthly driving parameter of 23 days per month. Therefore, this study evaluates the environmental benefits of the three vehicle types throughout the lifecycle based on the annual driving distance of 17,940 km for private cars. For the sake of comprehensive lifecycle assessment, it is assumed that under the FTP and HWFET driving cycles, the vehicle operates in the CD phase using pure electric drive mode when the SOC fluctuates within the battery swing window. The vehicle enters the CS phase using engine drive mode when the battery charge approaches the target SOC. In the case of the US06 driving cycle, the vehicle switches to hybrid drive mode during the CS phase. The electrical energy and gasoline consumption for each vehicle type over one year under different driving conditions are shown in Table 8.

4.2.2. Assessment Results and Analysis

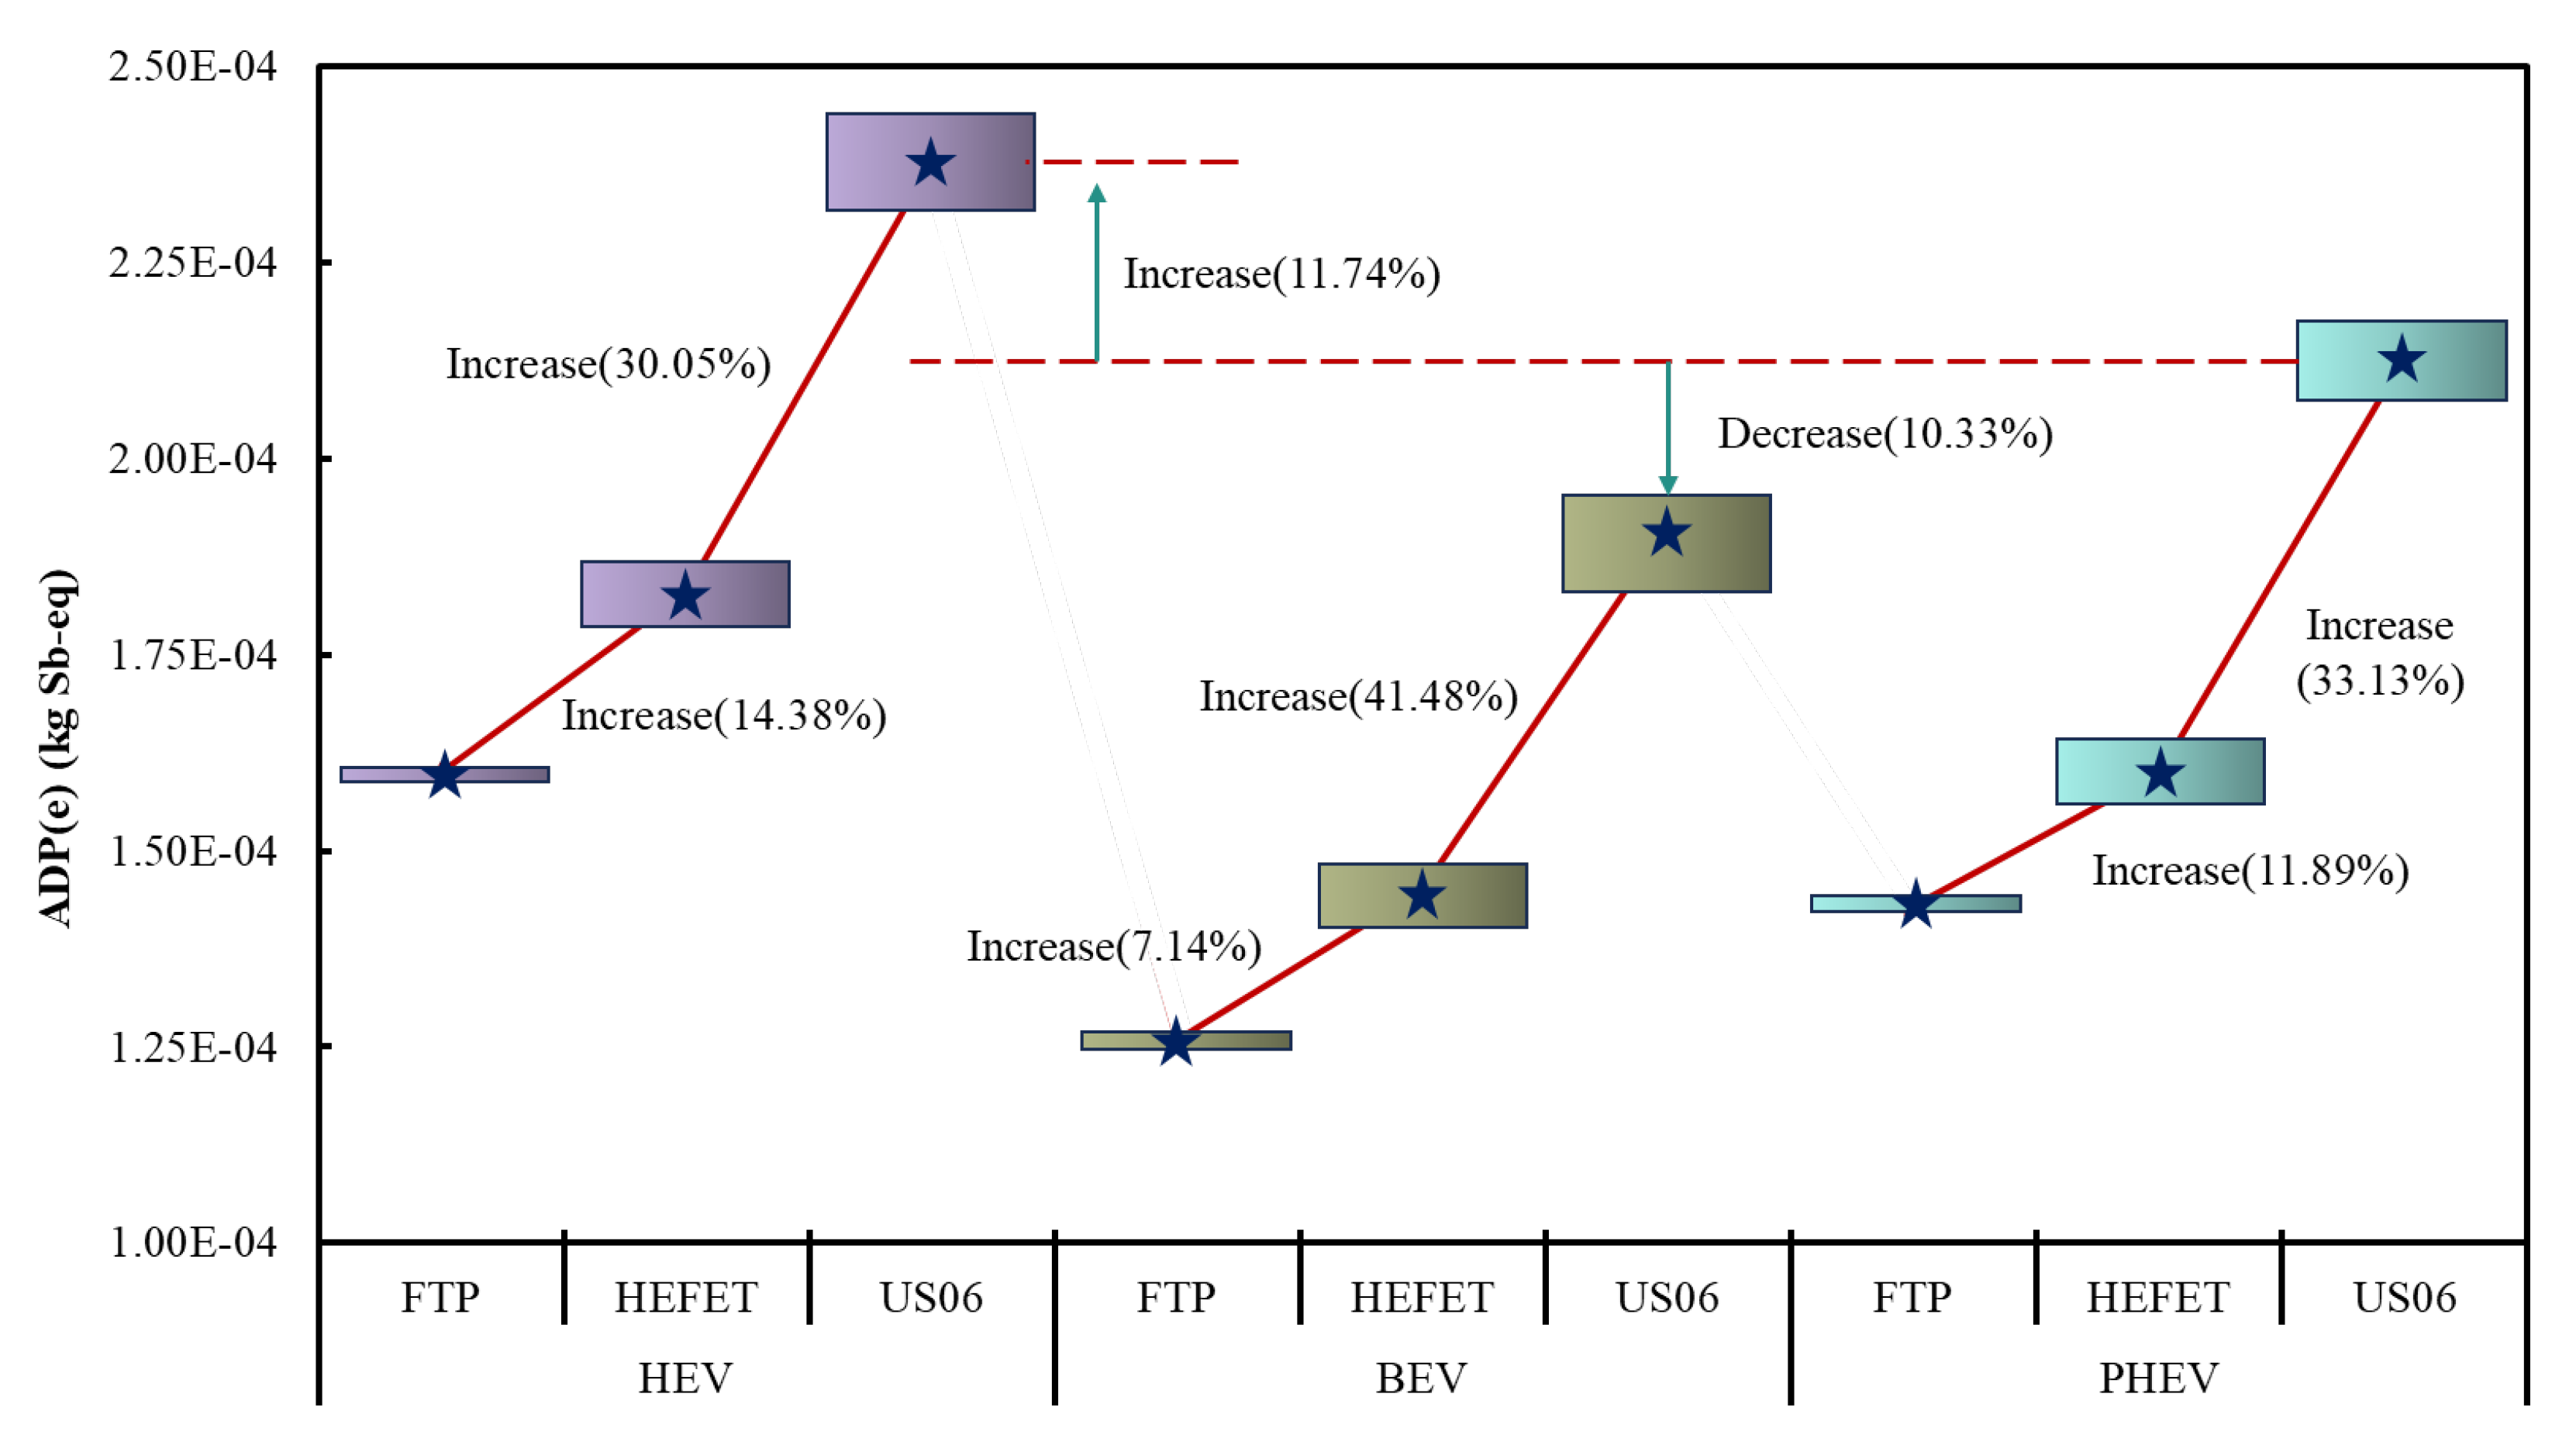
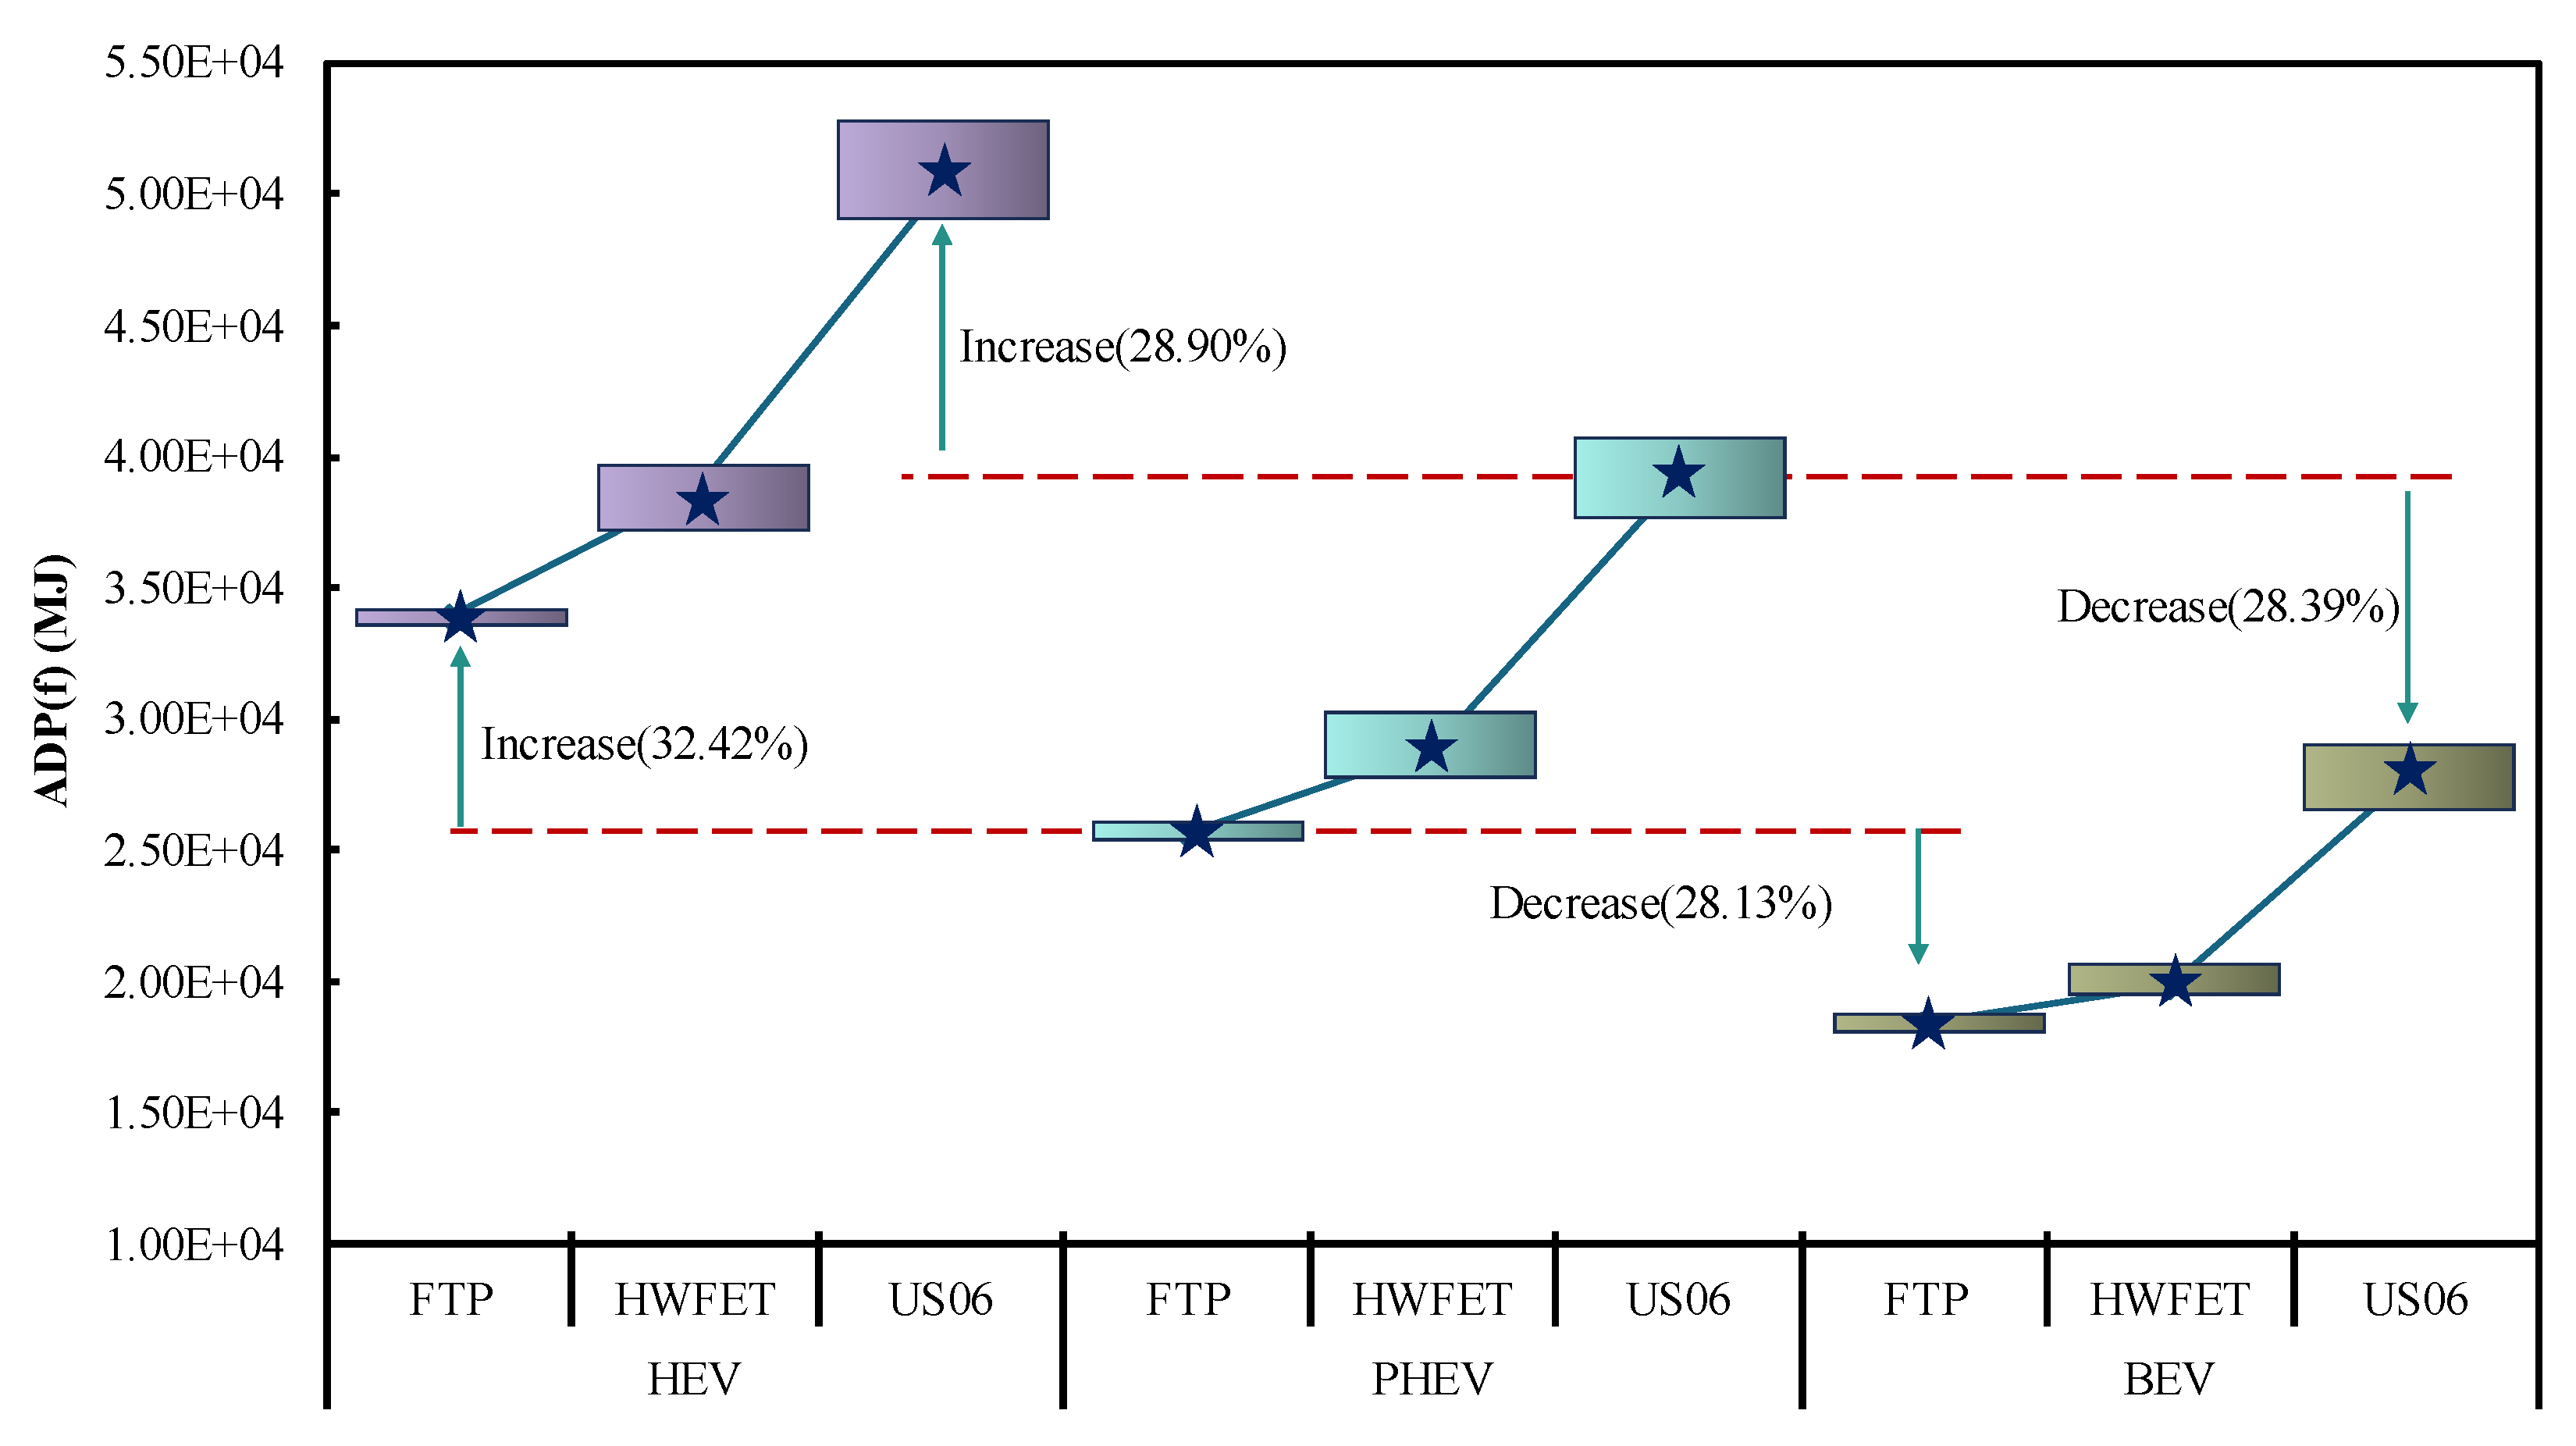
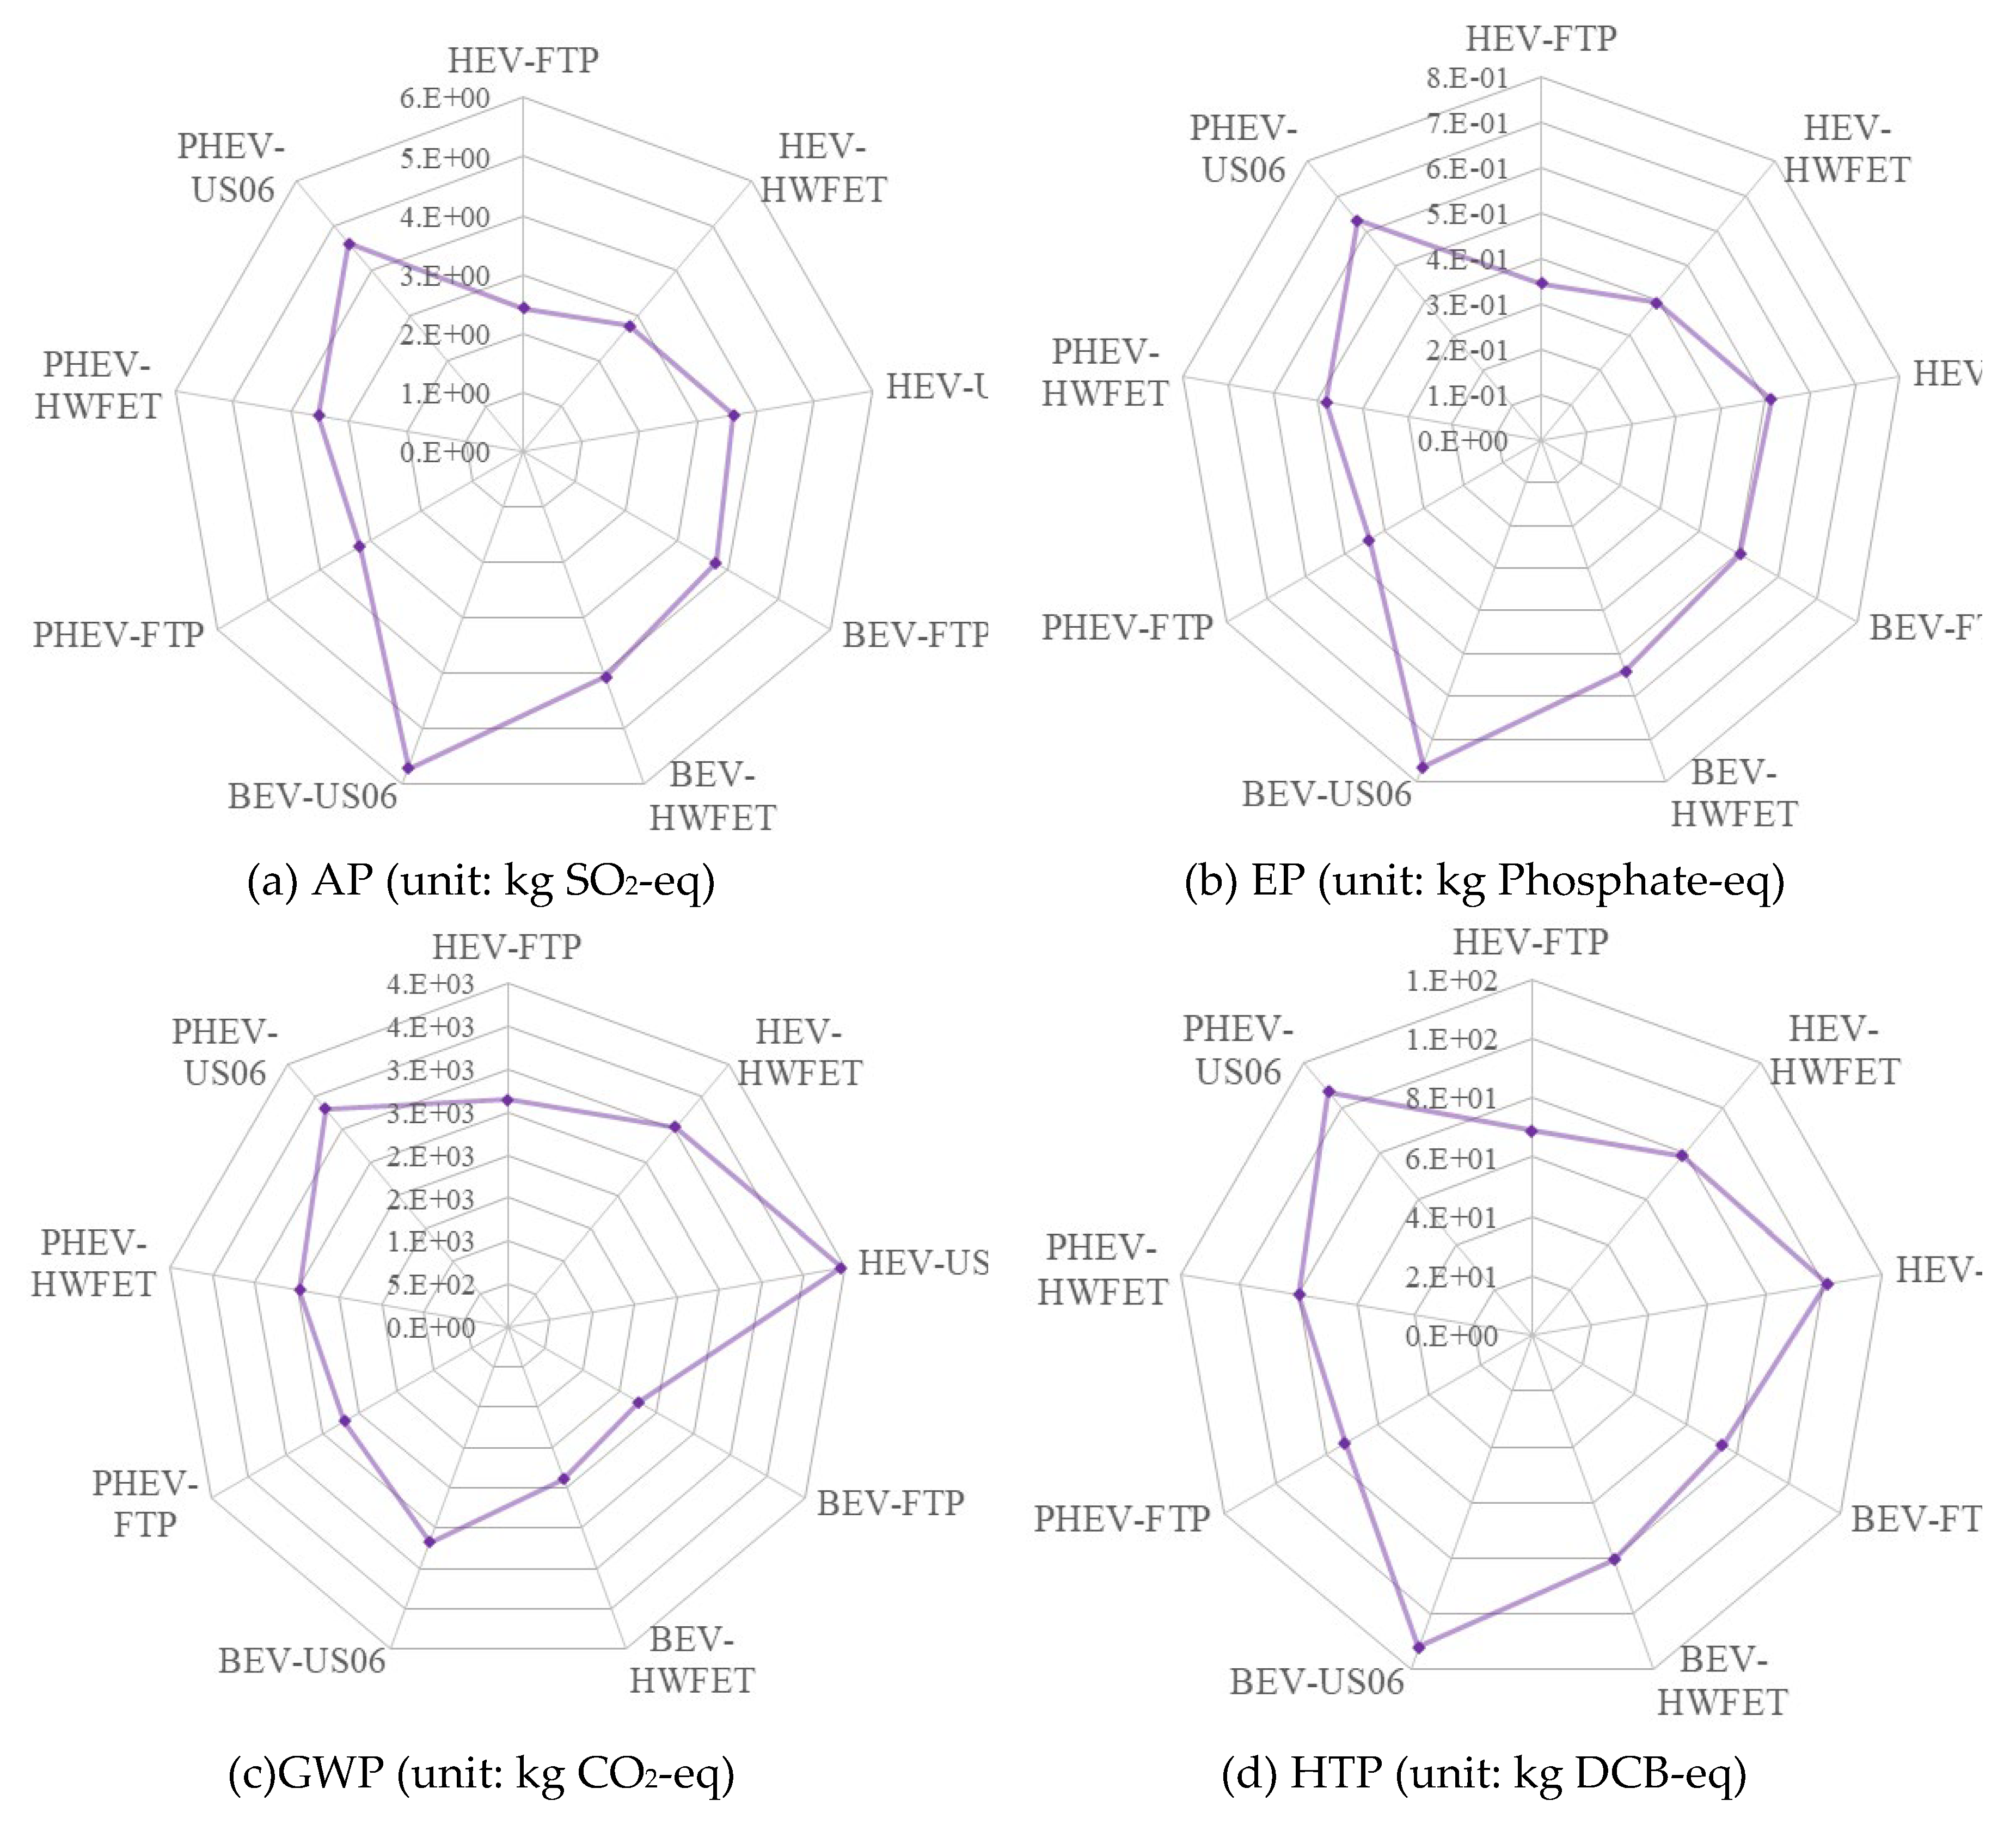
Based on the vehicle working conditions and the data on electrical energy and gasoline consumption for PHEV, HEV and BEV when driving for 1 year, about 17940 km, a life cycle assessment model was constructed in the GaBi platform to calculate the output results. Material resource consumption of HEV, BEV and PHEV under three working conditions when driving for 1 year is shown in Figure 4. Fossil energy consumption of HEV, BEV and PHEV under three working conditions when driving for 1 year is shown in Figure 5. Environmental emissions of HEV, BEV and PHEV under three working conditions when driving for 1 year is shown in Figure 6.
As shown in Figure 4, the material resource consumption during the operation and use phase of three vehicle types under the same working conditions follows the sequence from highest to lowest: HEV, PHEV, and BEV. Taking the US06 driving condition as an example, in this scenario, the material resource consumption of BEVs is 10.33% lower than that of PHEVs, while HEVs exhibit a material resource consumption that is 11.74% higher than PHEVs. The primary reason for this distribution is that, within the same driving cycle scenario, HEVs rely solely on gasoline propulsion, whereas PHEVs and BEVs utilize electrical energy as part of their drive mechanisms. This difference is attributed to the higher material resource consumption associated with gasoline usage compared to electrical energy consumption. For the same vehicle type across different driving cycles, the sequence of material resource consumption from highest to lowest is US06, HWFET, and FTP. This pattern is largely due to the energy recuperation capabilities of all three vehicle types, where the number of braking events is reduced at higher speeds, resulting in increased motor load and consequently higher material resource consumption in high-speed conditions compared to urban driving scenarios. Additionally, BEVs experience a significant increase in material resource consumption under aggressive driving conditions, with HEVs showing the smallest increase among the three vehicle types. The primary reason is that electric vehicles employ a single-speed reduction gear, necessitating the electric motor to operate at high intensity under high-speed and high-load conditions, leading to continuous high-power output from the power battery. This increase in energy consumption per hundred kilometers translates to increased material resource consumption. However, since electrical energy consumes fewer materials than gasoline, BEVs still have lower material resource consumption under aggressive driving conditions compared to HEVs. Hence, it can be concluded that as the proportion of electric propulsion increases and the proportion of fuel decreases, the material resource consumption during the vehicle operation and use phase is expected to decrease gradually.
As shown in Figure 5, the consumption of fossil energy during the operation and use phase of three vehicle types, under identical driving cycle conditions, follows the descending order of HEV, PHEV, and BEV. In the FTP driving condition, the fossil energy consumption of BEVs is 28.13% lower than that of PHEVs, whereas HEVs exhibit a 32.42% higher consumption than PHEVs. Similarly, in the US06 condition, BEVs consume 28.39% less fossil energy than PHEVs, and HEVs consume 28.90% more than PHEVs. Across different driving cycles, the fossil energy consumption for the same vehicle type decreases in the order of US06, HWFET, and FTP. Under aggressive driving conditions, all three vehicle types show a significant increase in either fuel or electrical energy consumption, with HEVs experiencing the most pronounced increase. This is primarily because gasoline has a greater impact on fossil energy consumption than electricity. Consequently, it can be concluded that with an increase in the proportion of electric propulsion and a decrease in the fuel proportion, there will be a gradual decrease in fossil energy consumption during the vehicle’s operation and use phase.
As shown in Figure 6, during the operation and use phase of HEVs, BEVs, and PHEVs, environmental impact potentials follow a consistent pattern: they are highest under US06 conditions, followed by HWFET, and lowest under FTP conditions. Among six categories of environmental impacts, BEVs only show lower GWP and POCP compared to HEVs and PHEVs. For the other four categories, BEVs have the highest adverse environmental impacts. This is primarily due to the substantial consumption of electricity by PHEVs and BEVs, with the current electricity mix being heavily reliant on coal-fired power generation, which emits significant amounts of sulfides, nitrogen oxides, and particulates, thereby increasing acidification potential, eutrophication potential, and human toxicity potential. The increase in ozone depletion potential is mainly attributed to photovoltaic electricity generation. Thus, the use of electricity to some extent elevates the ozone depletion potential.

4.3. Power Battery Degradation Scenario Analysis

The electric range of PHEVs decreases as the power battery degrades, affecting the vehicle’s lifespan, cost, and emissions. Therefore, this paper discusses the lifecycle environmental benefits of PHEVs during the operation and use phase under power battery degradation.

4.3.1. Construction of Power Battery Degradation Scenario

The degradation of power battery capacity can be divided into two main categories based on recoverability: capacity degradation caused by low temperatures, which gradually recovers as the temperature rises, and irreversible lifespan degradation. In this paper, without considering the degradation of power battery capacity caused by temperature, the degradation of power battery is modeled as a function of energy consumption [42]. The power battery’s energy consumption wDRV (unit: kWh) during the driving distance s is shown in Formula 18.
w D R V ( s ) = μ C D s E + μ C S s G
In the formula, μCD and μCS represent the energy consumption per kilometer in CD and CS modes, respectively (kWh/km). sE is the average distance driven by electric power, and sG is the average distance driven by gasoline. The energy consumption during charging, wCHG (unit: kWh), is shown in Formula 19.
w C H G ( s ) = s E ( η C D η B ) 1
In the formula, ηCD is the fuel efficiency in CD mode, ηB is the battery charging efficiency, set to 95%. The calculation method for relative battery capacity degradation is shown in Formula 20.
r p ( s ) = α D R V w D R V + α C H G w C H G k
In the formula, αDRV = 3.46×10⁻⁵ and αCHG = 3.46×10⁻⁵ are the relative battery capacity degradation coefficients. This paper assumes that the battery reaches its end of life when the battery’s state of health reaches 80% of the original/initial battery capacity, with an average battery life of T ( ) BAT (unit: years) as shown in Formula 21.
T B A T = k ( 1 Z ) ( α D R V ( μ C D s E + μ C S s G ) + α C H G s E ( η C D η B ) 1 ) D
In the formula, D represents one year, which has 365 days. This section ignores the degradation effects of nickel-metal hydride batteries in HEVs because HEVs have very low sensitivity to battery capacity degradation. The all-electric range of HEVs is almost zero. Therefore, this model is only applicable to scenarios involving lithium-ion battery degradation.
The paper sets the driving cycle of the vehicle to the FTP. The lifecycle environmental benefits of BEVs and PHEVs during the operation and use phase without considering battery capacity degradation are used as the control group, denoted as Scenario 1. Scenarios 2 and 3 consider the operation and use phase lifecycle environmental benefits when battery capacity degradation reaches 90% and 85%, respectively. To ensure comparability, the driving distance for all three scenarios is set to the mileage for one year, which is 17,940 kilometers. It is assumed that when the battery capacity degrades to 90% and 85%, the energy conversion efficiency during the CD phase is 85% and 70%, respectively. The degradation of power batteries in PHEVs does not affect the efficiency of gasoline combustion. The increase in energy consumption due to power battery degradation in different scenarios is shown in Table 9.

4.3.2. Assessment Results and Analysis

Based on the power battery degradation scenarios outlined earlier, the results of the lifecycle material-resource consumption assessment for BEVs and PHEVs under three different power battery degradation scenarios, driving for one year in urban conditions, are shown in Table 10.
Table 10 shows that when the power battery degrades to 90%, the material resource consumption during the operation and use phase increases by 26.43% for BEVs and 15.39% for PHEVs compared to the no degradation. When the power battery degrades to 85%, the material resource consumption during the operation and use phase increases by 51.43% for BEVs and 29.37% for PHEVs compared with no degradation. Power battery degradation significantly impacts BEVs’ lifecycle material resource consumption, with BEVs relying solely on the electric drive being the most sensitive to the increase in material resource consumption caused by power battery degradation.
Table 10 shows that when the power battery degrades to 90%, the fossil energy consumption during the operation and use phase increases by 26.83% for BEVs and 19.34% for PHEVs compared to the no degradation. When the power battery degrades to 85%, the fossil energy consumption during the operation and use phase increases by 72.68% for BEVs and 36.21% for PHEVs compared to the no degradation. In this scenario, BEVs surpass PHEVs in fossil energy consumption. It can be concluded that power battery degradation significantly impacts the lifecycle fossil energy consumption of electric vehicles, with BEVs relying solely on the electric drive being the most sensitive to the increase in fossil energy consumption caused by power battery degradation.
Table 10 shows that the AP, EP, GWP, HTP, ODP and POCP of BEVs are more sensitive than those of PHEV to the impact of power battery degradation. When the power battery degrades to 85%, the AP, EP, GWP, HTP, ODP and POCP of BEV increases by 72.62%, 72.55%,72.45%, 72.12%, 72.64%, 72.54% respectively compared to the no degradation. And those of PHEV increases by 17.75%, 18.50%, 32.24%, 23.40%, 1.12%,50.61% respectively compared to the no degradation.

4.4. Mileage Scenario Analysis

Vehicle mileage includes daily mileage and total mileage. Vehicle mileage is an important factor in assessing the actual benefits of electric vehicles, including BEVs and PHEVs. This paper uses a lifecycle assessment method, combined with sensitivity analyses of vehicle working conditions and power battery degradation, to evaluate the lifecycle environmental benefits of PHEVs, focusing on critical factors such as mileage during the operation and use phase.

4.4.1. Construction of Mileage Scenario Analysis

To analyze the impact of daily driving distance and vehicle all-electric range on the lifecycle environmental benefits of vehicles, we refer to the “Investigation of the Actual Operation of Electric Vehicles in China” and select two vehicle usage scenarios: private cars with an average daily driving distance of 65 km (Scenario 1) and taxis with an average daily driving distance of 232 km (Scenario 2). For vehicles with a specific all-electric range, the driving distance for charging intervals in CD mode (SCD) and CS mode (SCS) can be calculated using Formula 22 and Formula 23.
S C D ( s ) = s i f s s A E R s A E R i f s s A E R
S C S ( s ) = 0 i f s s A E R s s A E R i f s s A E R
Since HEVs are less sensitive to battery degradation, we will only consider the increase in energy consumption per 100 kilometers due to aging and increased wear of vehicle components as mileage increases. We will assume that for every 10,000 kilometers driven, there is a 1% increase in energy consumption per 100 kilometers [43]. The total mileage is set at 150,000 kilometers. To further study the impact of mileage on the lifecycle environmental benefits during the operation and use phase of vehicles, we will discuss the lifecycle environmental benefits of different mileages (10,000 km, 50,000 km, 100,000 km, 150,000 km) under Scenarios 1 and 2. Since only the vehicle’s total mileage affects the energy consumption per 100 kilometers for HEVs and BEVs, the gasoline consumption for HEV Scenarios 1 and 2 will be the same under the same mileage. When the PHEV’s all-electric range exceeds the daily driving distance, electric power will drive the vehicle. When the daily driving distance exceeds the all-electric range, the PHEV will be set to CD mode, with an initial SOC of 90% and a target SOC of 30%. The construction of mileage scenarios for the PHEV, BEV and HEV are shown as Table 11.
To make the assessment results comparable, we will normalize the energy consumption for each stage and compare the energy consumption per 100 kilometers for the lifecycle environmental benefits assessment. Therefore, the average energy consumption per 100 kilometers for the three vehicle types at different mileage stages is shown in Table 12.

4.4.2. Assessment Results and Analysis

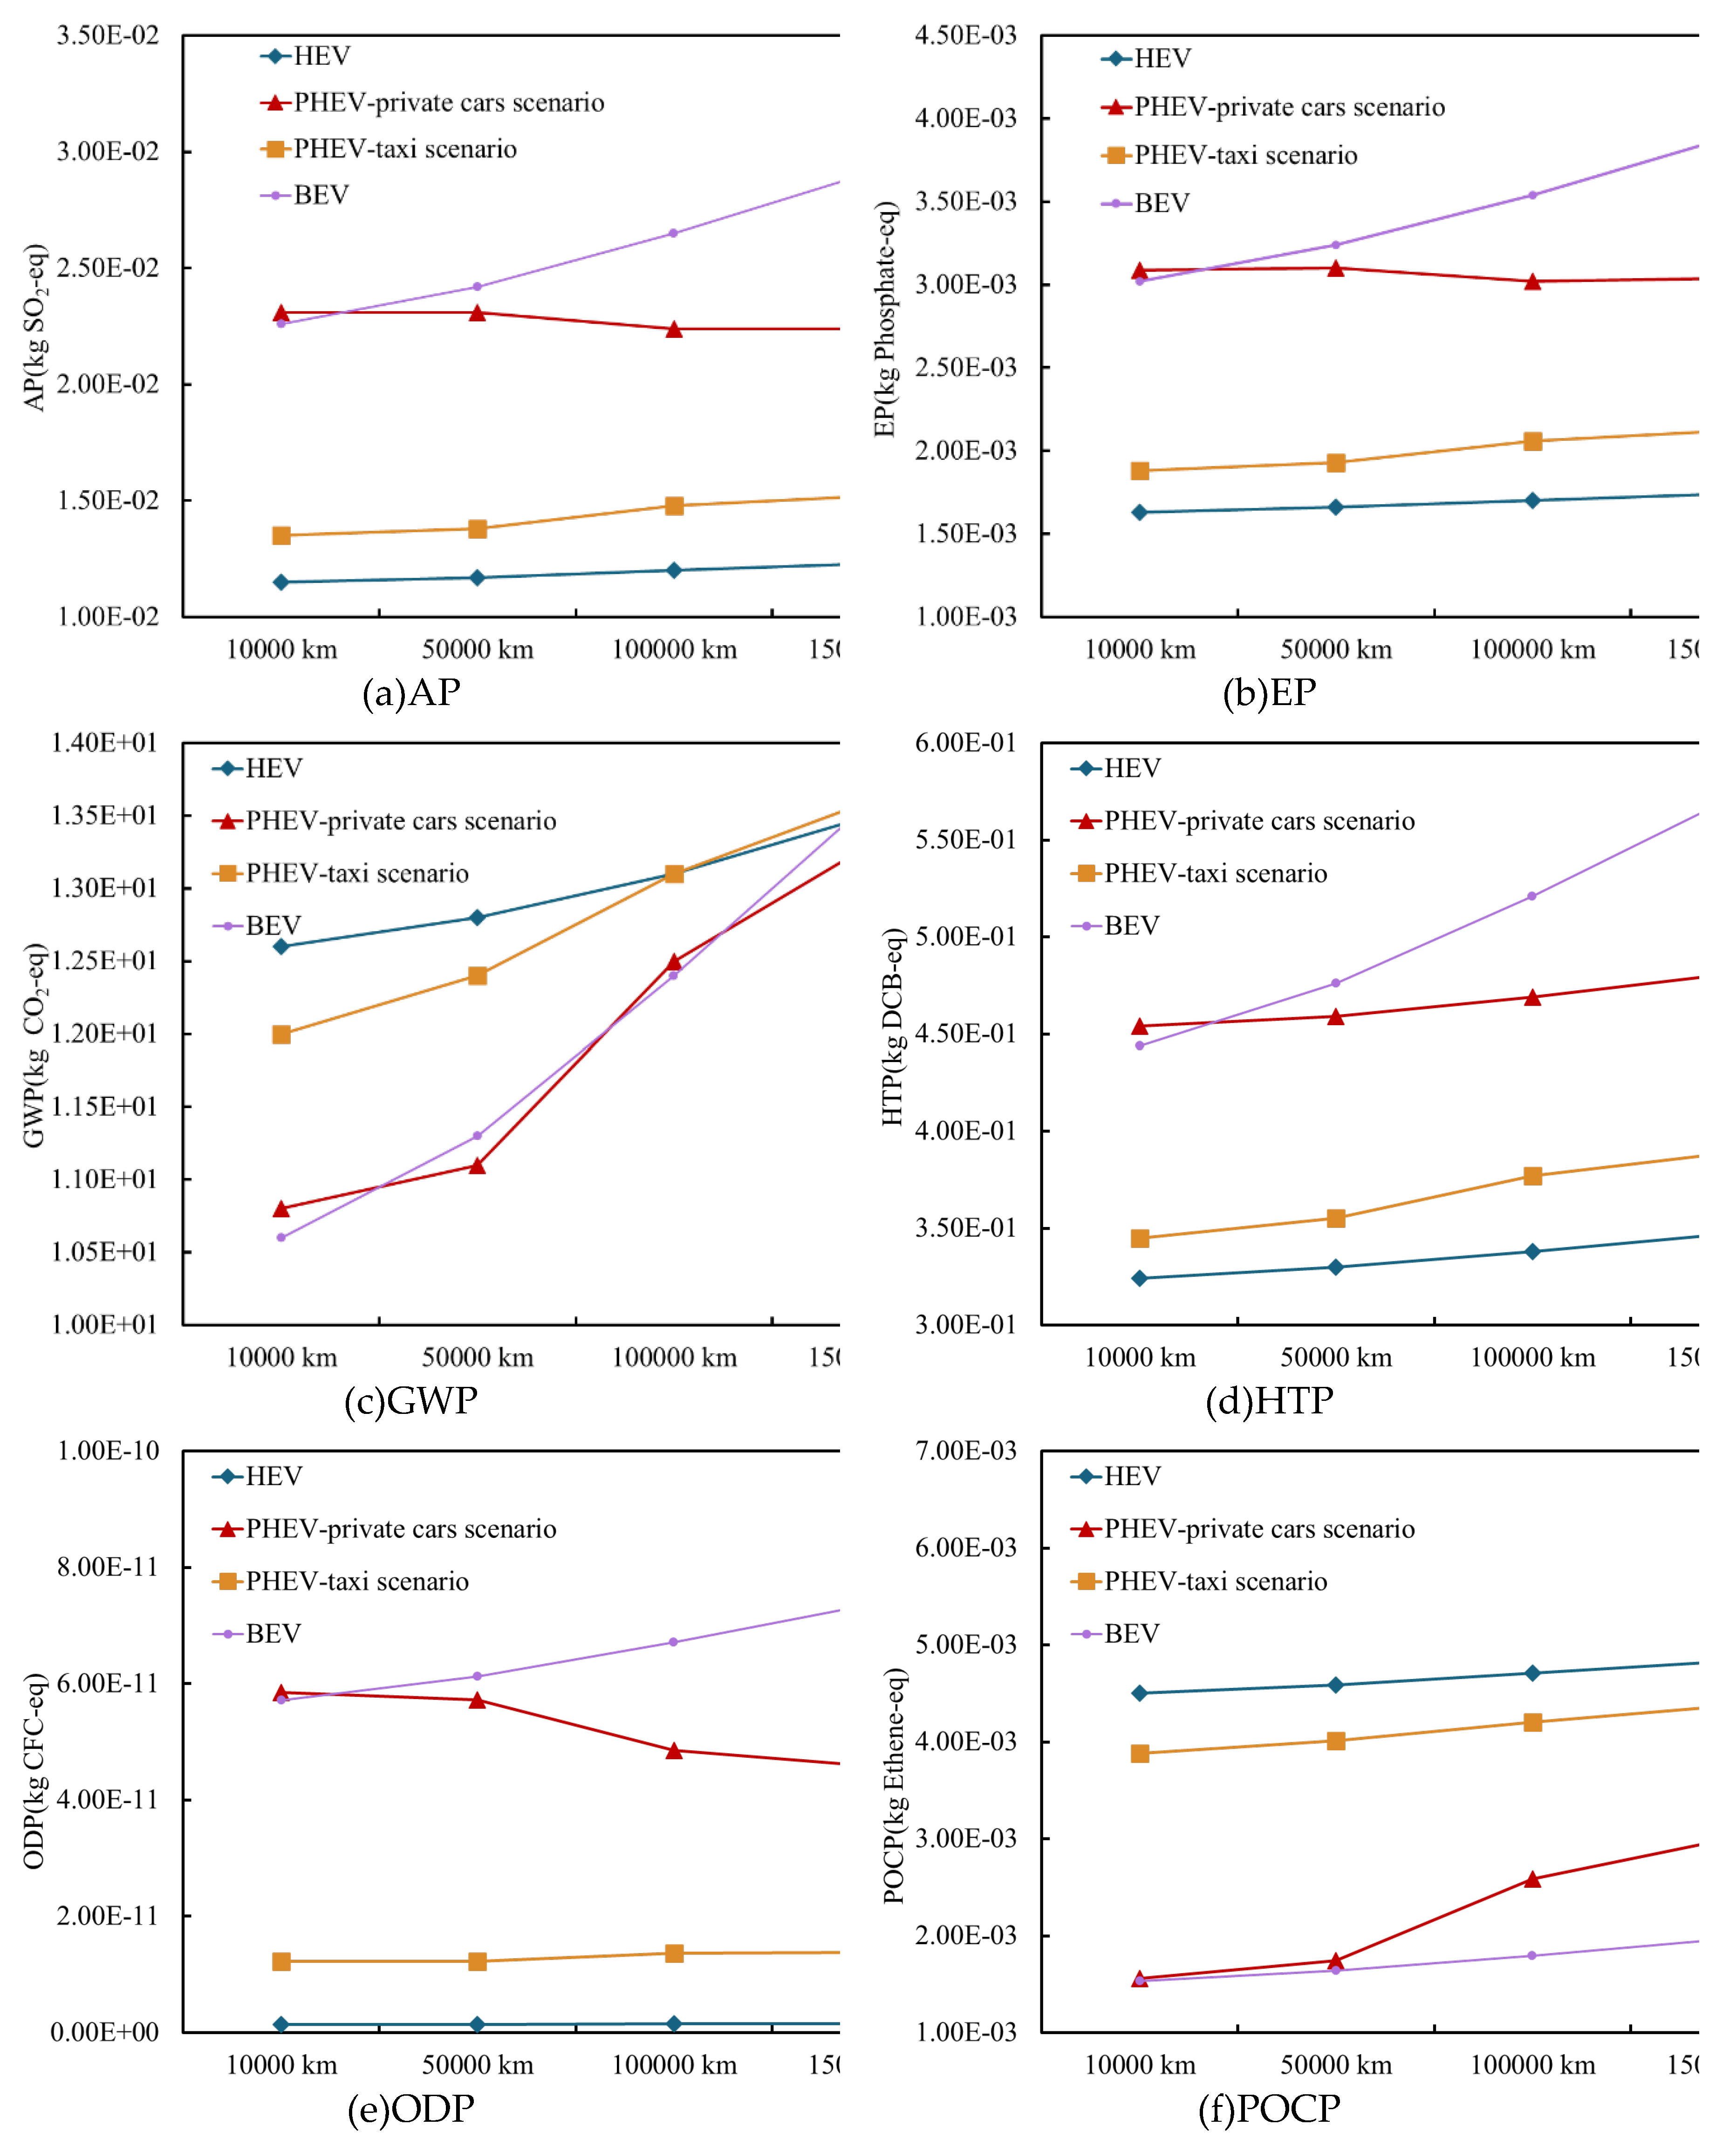
Material resource assessment results per 100 km for the HEV, PHEV and BEV under different mileage scenarios are shown in Table 13. Fossil energy consumption assessment results per 100 km for the HEV, PHEV and BEV under different mileage scenarios are shown in Table 14. AP, EP, GWP, HTP, ODP and POCP assessment results per 100 km for the HEV, PHEV and BEV under different mileage scenarios is shown in Figure 7.
From Table 13, the consumption of material resources per hundred kilometers increases with the mileage of the vehicle. At a cumulative mileage of 10,000 kilometers, PHEVs exhibit the lowest average material consumption per hundred kilometers in a taxi scenario, followed by HEVs, with the highest consumption observed in PHEVs within a private car scenario. This discrepancy is primarily due to the higher material resource consumption associated with electrical energy compared to gasoline. At a total mileage of just 10,000 kilometers, where PHEVs in private car scenarios operate solely on electric power, their material consumption is the highest due to their greater electricity consumption per hundred kilometers compared to BEVs. When the vehicle’s mileage exceeds 50,000 kilometers, BEVs show the largest increase in material consumption per hundred kilometers, attributed to power battery degradation, thus leading in material consumption. This is followed by PHEVs in private car scenarios, which consume a significant amount of electricity, with HEVs, powered solely by gasoline combustion, exhibiting the lowest material consumption. Therefore, opting for HEVs or selecting PHEVs for taxi scenarios over BEVs can be more beneficial in reducing material resource consumption during the operation and use phase of the vehicle.
From Table 14, it is evident that as vehicle mileage increases, the average fossil fuel consumption during the operation and use phase per hundred kilometers also increases. For HEVs, the rise in mileage results in a significant increase in per hundred kilometers fuel consumption. A comparison of the fossil fuel consumption during the operation and use phase of PHEVs between Scenario 1 and Scenario 2 reveals that at every mileage stage, PHEVs in the private car scenario, where less fuel is used, have lower fossil fuel consumption during the operation and use phase than those in the taxi scenario, where more fuel is used. Additionally, the fossil fuel consumption during the operation and use phase of BEVs is consistently lower than that of HEVs and PHEVs at all mileage stages. Consequently, opting for BEVs or selecting PHEVs for private car scenarios over HEVs proves more effective in reducing fossil fuel consumption during the operation and use phase of vehicles.
As shown in Figure 7, with the increase of mileage of vehicle, the assessment results of each environmental impact indicators increase. For AP, EP, HTP and ODP, the results of BEV and private car scenario of PHEV are higher than HEV and taxi scenario of PHEV. Since PHEV only uses electricity to meet the daily travel demand at the stage of 10,000 km, and PHEV electricity consumption is higher than BEV, so at this time PHEV of four types environmental indicators are higher than BEV, after the cumulative mileage of 50,000 km and above, the impact of power battery degradation is greater, PHEV needs to use gasoline to provide additional power, electricity consumption is less than BEV. Therefore, the assessment results of the four types of BEV environmental indicators are higher than PHEV at 50,000 km and above. For GWP and POCP, the results of HEV and taxi scenario of PHEV are higher than those BEV and private car scenario of PHEV. The main reason is that the use and combustion of gasoline will produce a lot of greenhouse gas emissions, resulting in the rise of GWP and POCP.

5. Prediction Assessment for 2025,2030 and 2035

This study aims to build a predictive model for the lifecycle of vehicles and develop scenarios for the year 2035. By doing so, we will obtain predictive results for PHEVs, BEVs, and HEVs for 2035 and analyze these results.

5.1. Prediction Scenarios

Based on the key technological trends for PHEVs and referencing reports such as “Energy Conservation and New Energy Technology Roadmap 2.0” and “Research on China’s 2030 Energy and Power Development Plan and 2060 Outlook,” we have selected key factors such as fuel consumption per 100 kilometers, vehicle lightweighting, and power structure to construct predictive scenarios for 2035. The predictive scenarios for the three vehicle types are shown in Table 15.
Based on the “Research on China’s 2030 Energy and Power Development Plan and 2060 Outlook” and other studies such as Yang Yang’s research [30], the current sources of electricity in China are as follows: coal-fired power accounts for 71%, hydropower for 15%, nuclear power for 3%, photovoltaic power for 2%, wind power for 4%, and other forms of power generation for 5%. It is projected that by 2030, coal-fired power will account for 52%, hydropower for 13%, nuclear power for 5%, photovoltaic power for 15%, wind power for 12%, and other forms of power generation for 3%. By 2035, it is expected that coal-fired power will account for 40%, hydropower for 12%, nuclear power for 9%, photovoltaic power for 18%, wind power for 19%, and other forms of power generation for 2%.

5.2. Predictive Results and Analysis

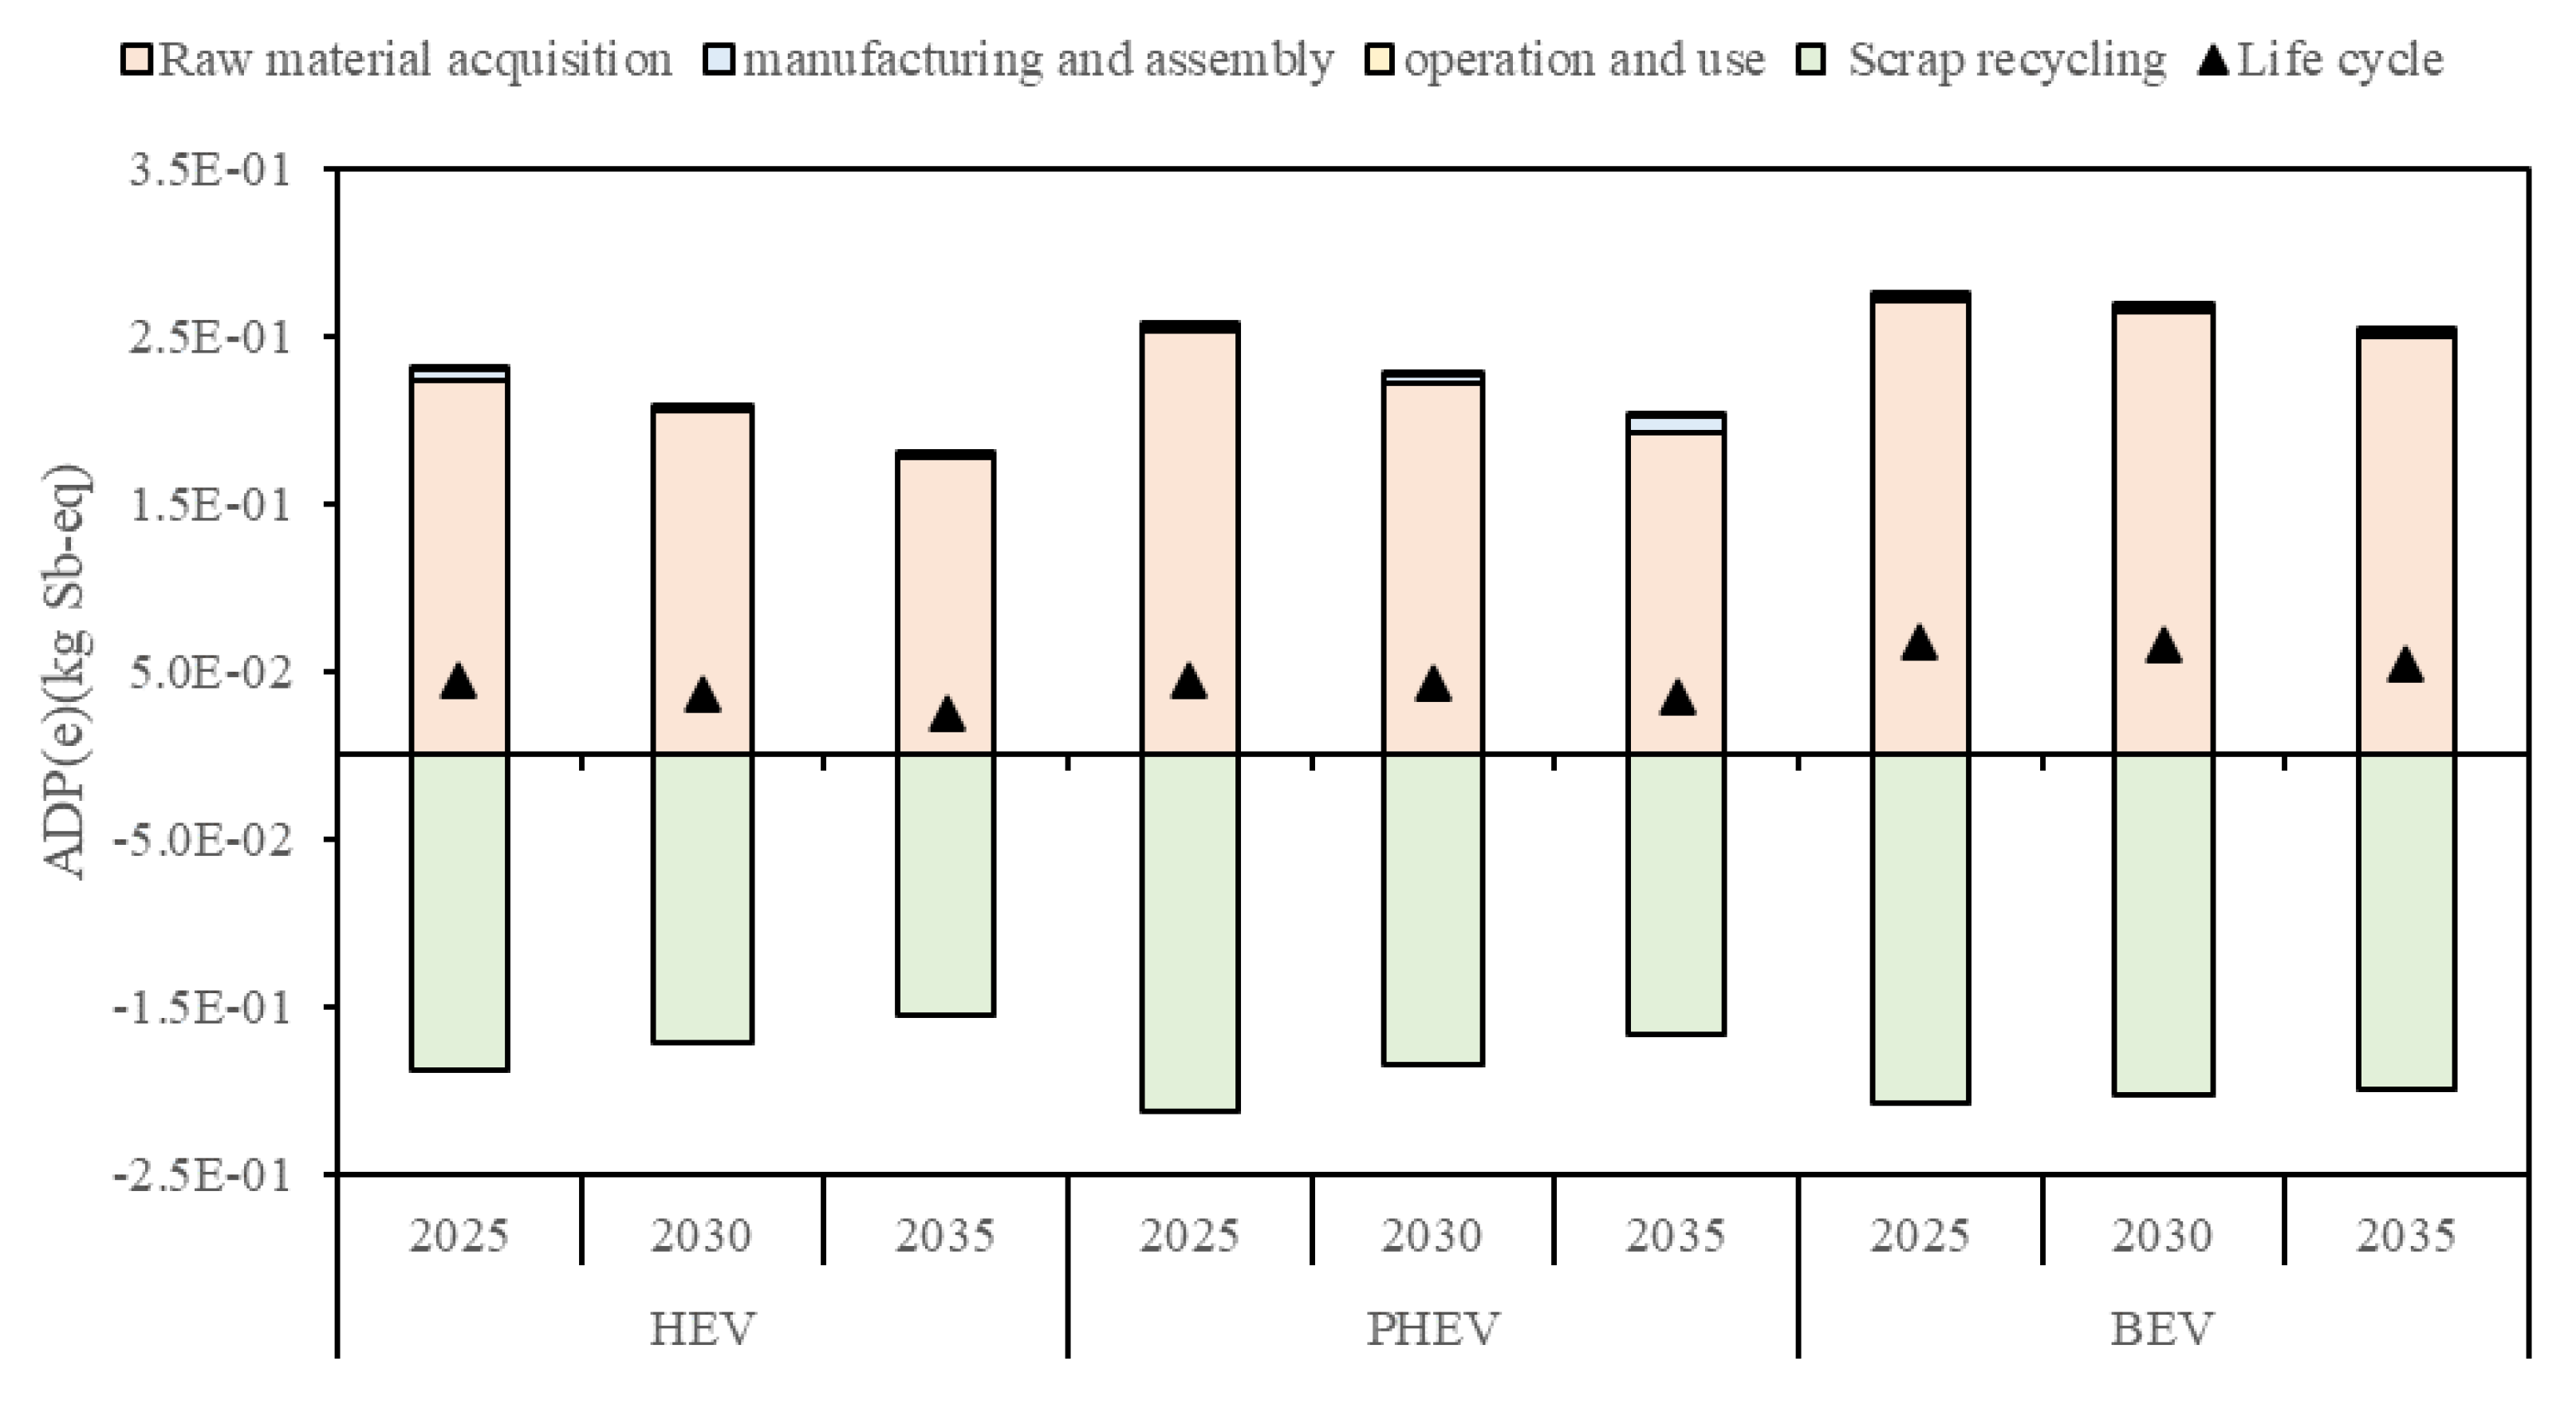
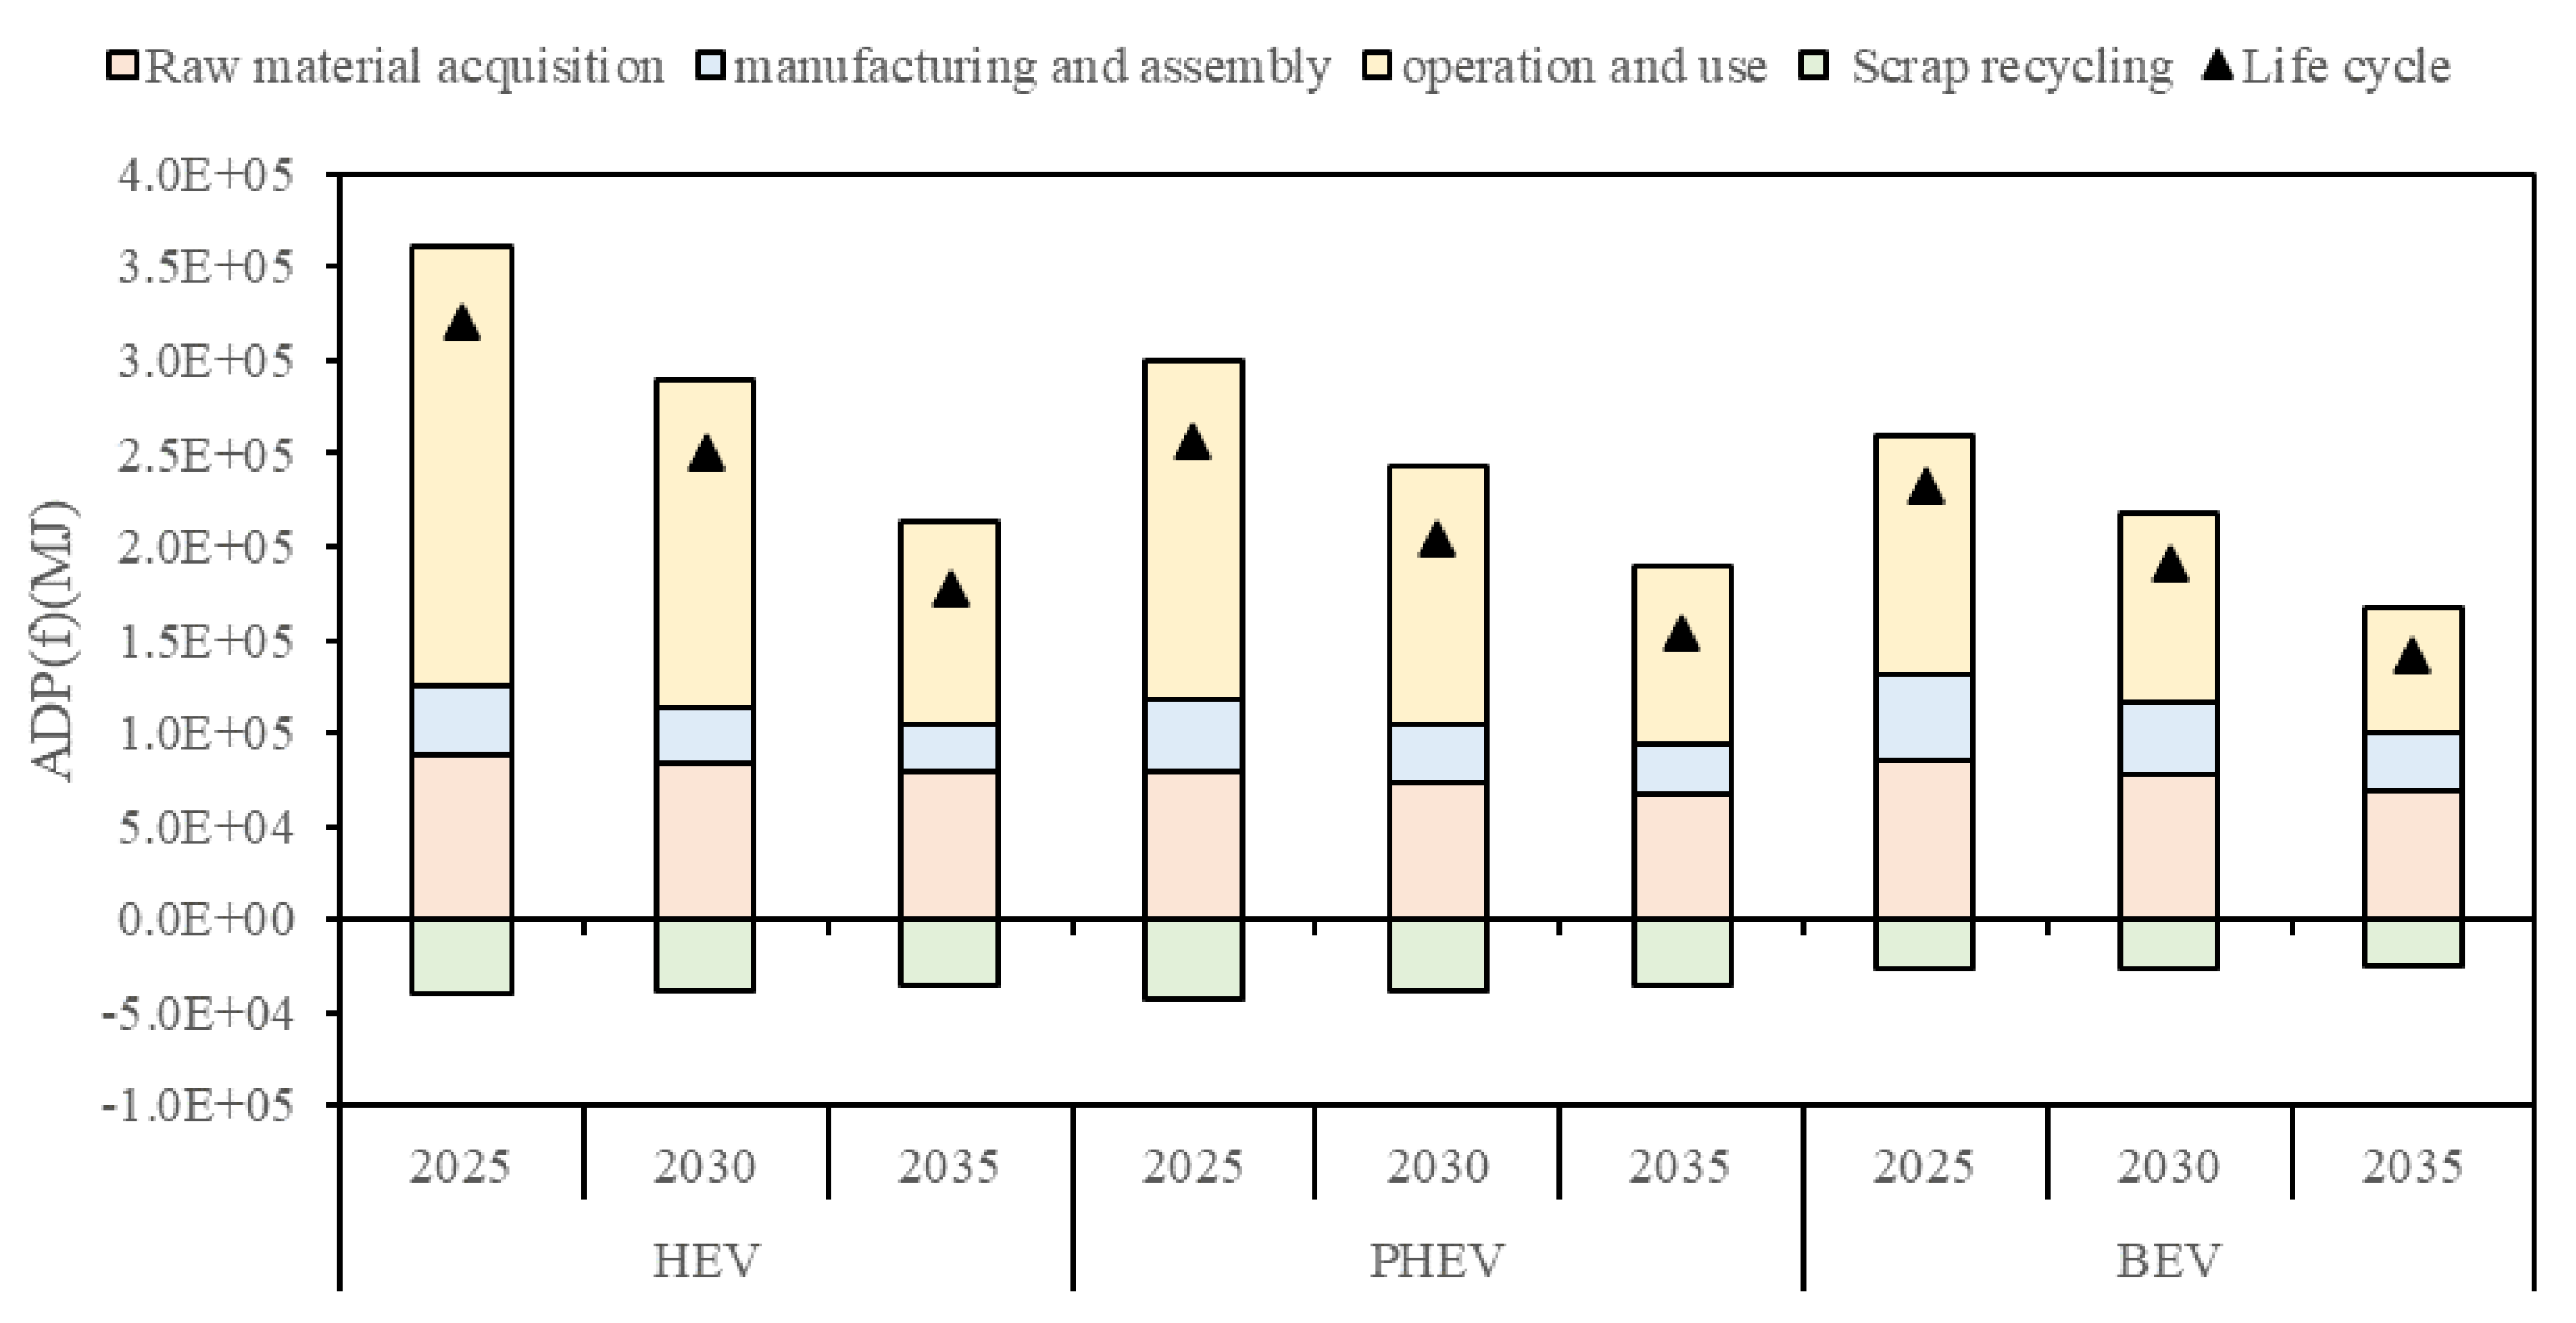
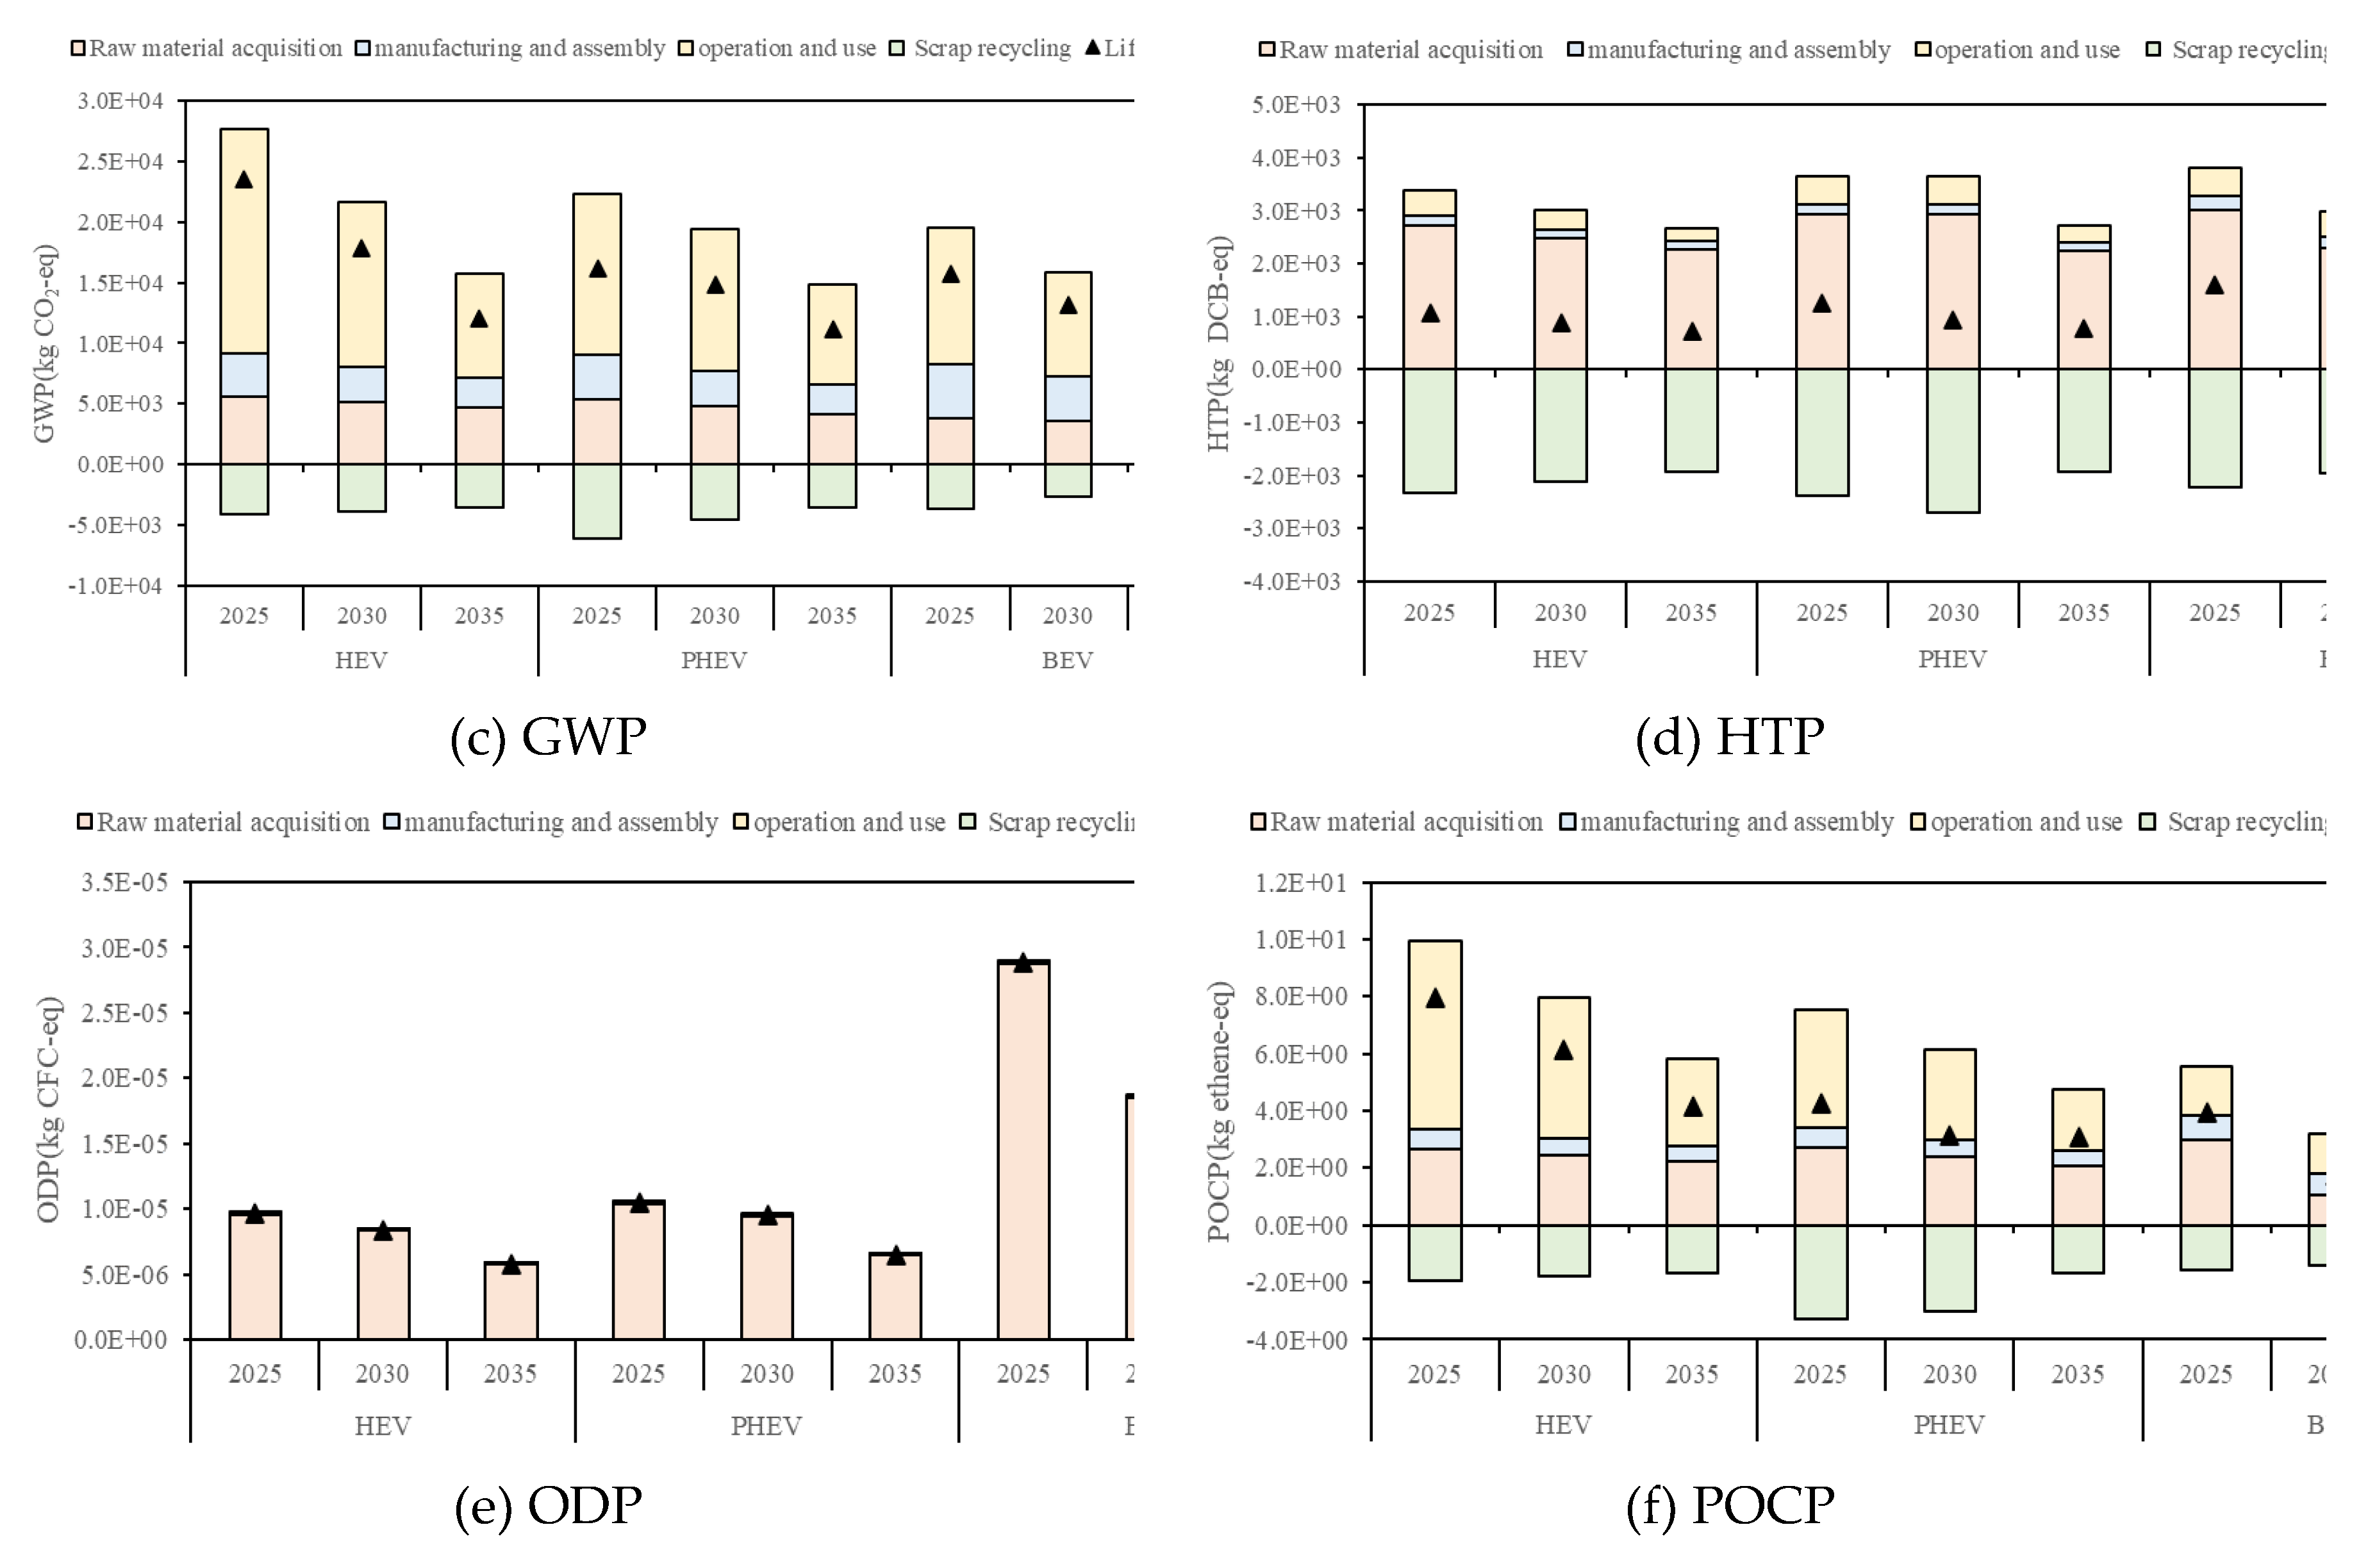
A GaBi model for lifecycle prediction and assessment was developed based on the constructed predictive assessment model and scenarios. The computational analysis yielded the lifecycle predictive assessment results for HEVs, PHEVs, and BEVs for 2025, 2030, and 2035. Life cycle material resource consumption of HEV, BEV and PHEV for 2025, 2030 and 2035. is shown in Figure 8. Life cycle fossil energy consumption of HEV, BEV and PHEV for 2025, 2030 and 2035 is shown in Figure 9. Life cycle AP, EP, GWP, HTP, ODP and POCP of HEV, BEV and PHEV for 2025, 2030 and 2035 is shown as in Figure 10.
As shown in Figure 8, in the future, with the advancement of vehicle lightweighting technology, the electrification of power structures, and the improvement of vehicle energy consumption per hundred kilometers, the material resource consumption of the three types of vehicles throughout their lifecycle gradually decreases. BEVs have the highest material resource consumption, followed by PHEVs, while HEVs have the lowest. The main reason is that the large-capacity batteries in BEVs require higher amounts of metals such as lithium and copper during production compared to other vehicle components. The use of lithium, copper, and other metals results in substantial material resource consumption. By 2035, PHEVs are projected to have a 35.99% lower material resource consumption than BEVs and a 26.42% higher material resource consumption than HEVs. The material resource consumption of all three types of vehicles throughout their lifecycle is highest in the raw material acquisition stage. The reduction in material resource consumption in the raw material acquisition stage is the main reason for the gradual decrease in material resource consumption throughout the lifecycle of the three types of vehicles. In the scenario settings for predictions, vehicle lightweighting technologies were primarily considered during the vehicle’s raw material acquisition stage. Therefore, it can be concluded that HEVs are the most favorable type of vehicle for reducing the material consumption throughout the entire lifecycle. For BEVs and PHEVs, reducing the use of lithium, copper, and other metals in the vehicle body, as well as improving vehicle lightweighting technologies, can effectively reduce the material resource consumption throughout the vehicle’s lifecycle.
As shown in Figure 9, it is evident that in the future, with advancements in vehicle lightweighting technology and the transition towards cleaner power structures, coupled with the improvement in vehicle energy consumption per hundred kilometers, the fossil fuel consumption throughout the lifecycle of the three vehicle types gradually decreases. The order of fossil fuel consumption from highest to lowest among the three types of vehicles is HEV, PHEV, and BEV. This hierarchy arises primarily because HEVs rely on gasoline for propulsion during their operation and use phase, which consumes significantly more fossil fuel compared to electricity. By 2035, PHEVs are projected to have 7.79% higher fossil fuel consumption than BEVs and 13.48% lower consumption than HEVs. The operation and use phase accounts for the highest proportion of fossil fuel consumption throughout the lifecycle of all three vehicle types. The reduction in fossil fuel consumption during the operation and use phase is the primary reason for the gradual decrease in fossil fuel consumption throughout the lifecycle of the three vehicle types. When constructing scenarios for the operation and use phase prediction, the enhancement of vehicle energy consumption per hundred kilometers was primarily considered, with additional consideration given to the cleanliness of power structures for PHEVs and BEVs. The reduction in fossil fuel consumption for HEVs is significantly greater than that for PHEVs and BEVs. Therefore, it can be concluded that BEVs are the most advantageous vehicle type for reducing fossil fuel consumption in the future. Lowering the energy consumption per hundred kilometers of gasoline vehicles can also effectively reduce the lifecycle fossil fuel consumption of vehicles. However, there is limited room for reducing energy consumption per hundred kilometers, highlighting the necessity of promoting new energy vehicles as the path to reducing the lifecycle fossil fuel consumption of vehicles.
As shown in Figure 10(a), life cycle AP of HEV, PHEV and BEV in 2035 is 2.43, 2.81 and 4.21 kg SO2-eq respectively, which is decreased by 35.9%, 30.3% and 24.0% compared with those in 2025. As shown in Figure 10(b), life cycle EP of HEV, PHEV and BEV in 2035 is 2.48, 2.75 and 3.76 kg Phosphate-eq respectively, which is decreased by 41.4%, 37.6% and 39.3% compared with those in 2025. As shown in Figure 10(c), life cycle GWP of HEV, PHEV and BEV in 2035 is 1.21×10⁴, 1.12×10⁴ and 1.01×10⁴ kg CO2-eq respectively, which is decreased by 48.7%, 30.9% and 36.1% compared with those in 2025. As shown in Figure 10(d)-(e), life cycle HTP, ODP and POCP of HEV, PHEV and BEV show similar reduction tendency with AP, EP and GWP. Therefore, the electricity grid optimization, vehicle lightweight technology and fuel consumption economy improvement contribute to the environmental emission reduction.

6. Conclusions

This study employs a life cycle assessment method to evaluate PHEVs’ material resource consumption, fossil energy consumption, and environmental emissions. It compares and analyzes PHEVs with BEVs and HEVs under different scenarios, obtaining the following conclusions:
Under different working conditions, the lifecycle material resource consumption and fossil energy consumption of PHEVs during the operation and use phase are higher than those of BEVs but lower than those of HEVs. During the operation and use phase, the lifecycle of material resource consumption and fossil energy consumption increases in urban driving, highway driving, and aggressive driving scenarios. The proportion of environmental emissions during the operation and use phase of PHEVs among the total emissions of the three vehicle types does not change significantly. PHEVs and BEVs effectively reduce carbon emissions during the operation and use phase of the vehicles.
Under different power battery degradation scenarios, battery degradation significantly impacts material resource consumption and fossil energy consumption during the operation and use phase of electric vehicles. BEVs rely solely on electric power and are the most sensitive to material resource consumption and fossil energy consumption caused by battery degradation. Battery degradation increases the negative environmental impact of PHEVs and BEVs, but BEVs are more sensitive to battery depletion, resulting in a larger negative environmental impact.
Through simulation of scenarios involving cumulative vehicle mileage and application contexts, it was found that as vehicle mileage increases, both resource consumption and environmental negative impacts also increase. After the cumulative mileage of vehicles reaches 50,000 kilometers or more, the resource consumption and environmental negative impacts of BEVs and PHEVs in private car scenarios are higher than those of HEVs and PHEVs in taxi scenarios.
In the life cycle prediction study for 2030 and 2035, with the advancement of future vehicle lightweighting technologies and cleaner power structures, the total lifecycle material resource consumption and fossil energy consumption of PHEVs gradually decrease. life cycle GWP of HEV, PHEV and BEV in 2035 is 1.21×10⁴, 1.12×10⁴ and 1.01×10⁴ kg CO2-eq respectively, which is decreased by 48.7%, 30.9% and 36.1% compared with those in 2025.

Author Contributions

Conceptualization, Y.Z.; Methodology and Software, C.Z.; Validation and Formal analysis, Z.C.; Investigation, Resources and Supervision, Y.C. All authors have read and agreed to the published version of the manuscript.

Funding

This research was funded by the National Key R & D Program ‘Intergovernmental International Science and Technology Innovation Cooperation ‘key project (2021YFE0192900), the National Natural Science Foundation of China Youth Project (52306068).

Data Availability Statement

Data sharing not applicable.

Conflicts of Interest

The authors declare no conflict of interest.

Abbreviations

ADP(e) Abiotic depletion (element)
ADP(f) Abiotic depletion (fossil)
AER All electric range
AP Acidification potential
BEV Battery electrical vehicle
CD Charge depleting
CS Charge sustaining
EP Eutrophication potential
EPA Environmental protection agency
FCV Fuel cell vehicles
FTP Federal Test Procedure
GWP Global warming potential
HEV Hybrid electric vehicles
HTP Human toxicity potential
HWFET Highway fuel economy testing
ICEV Internal combustion engine vehicles
LCA Life cycle assessment
NCM Lithium-ion nickel-cobalt-manganese
ODP Ozone depletion potential
PHEV Plug-in hybrid electric vehicles
POCP Photochemical ozone creation potential
PVDF Polyvinylidene fluoride

References

  1. Nordelöf A, Messagie M, Tillman A M, et al. Environmental impacts of hybrid, plug-in hybrid, and battery electric vehicles—what can we learn from life cycle assessment[J]. The International Journal of Life Cycle Assessment, 2014, 19: 1866-1890.
  2. García A, Monsalve-Serrano J, Martinez-Boggio S, et al. Techno-Economic Assessment of Vehicle Electrification in the Six Largest Global Automotive Markets[J]. Energy Conversion and Management, 2022, 270: 116273.
  3. Zackrisson M, Avellán L, Orlenius J. Life cycle assessment of lithium-ion batteries for plug-in hybrid electric vehicles–Critical issues[J]. Journal of Cleaner Production, 2010, 18(15): 1519-1529.
  4. Bauer C, Hofer J, Althaus H, et al. The Environmental Performance of Current and Future Passenger Vehicles: Life Cycle Assessment Based on a Novel Scenario Analysis Framework[J]. Applied Energy, 2015, 157: 871-883.
  5. ehicles[J]. The International Journal of Life Cycle Assessment, 2015, 22(1): 94-110.
  6. Ambrose H. Understanding the Future of Lithium: Part 2, Temporally and Spatially Resolved Life-Cycle Assessment Modeling[J]. Journal of Industrial Ecolocy, 2020, 24: 88-89.
  7. Shimizu T, Ihara M, Kikuchi Y. A Region-Specific Environmental Analysis of Technology Implementation of Hydrogen Energy in Japan Based on Life Cycle Assessment[J]. Journal of Industrial Ecolocy, 2020, 28: 217-233.
  8. LIANG L, FU G Z. Comparative Analysis of Life Cycle Energy Consumption and Emissions of Plug-in Hybrid Electric Vehicles with Different Power Systems[J]. Shanghai Automobile, 2016, (3): 45-50.
  9. FU P, LAN L B, CHEN Y, et al., Life Cycle Carbon Emission Prediction and Assessment of Energy-Saving and New Energy Vehicles for 2035[J]. Environmental Science, 2023, 44(4): 2365-2374.
  10. Qiao Q Y, Zhao F Q, Liu Z W, et al. Cradle-to-Gate Greenhouse Gas Emissions of Battery Electric and Internal Combustion Engine Vehicles in China[J]. Applied Energy, 2017, 204: 1399-1411.
  11. Wu Z, Wang M, Zheng J, et al. Life Cycle Greenhouse Gas Emission Reduction Potential of Battery Electric Vehicle[J]. Journal of Cleaner Production, 2018, 190: 462-470.
  12. Shi S, Zhang H, Yang W, et al. A Life-Cycle Assessment of Battery Electric and Internal Combustion Engine Vehicles: A Case in Hebei Province, China[J]. Journal of Cleaner Production, 2019, 228: 606-618. [CrossRef]
  13. CHEN Y S, DING Z S, WANG W J, et al. Life Cycle Assessment and Scenario Simulation of Different Hydrogen Production Schemes for Hydrogen Fuel Cell Vehicles[J]. China Journal of Highway and Transport, 2019, 32(5): 172-180.
  14. Andersson Ö, Börjesson P. The Greenhouse Gas Emissions of An Electrified Vehicle Combined with Renewable Fuels: Life Cycle Assessment and Policy Implications[J]. Applied Energy, 2021, 289: 116621.
  15. Yang L, Yu B, Yang B, et al. Life Cycle Environmental Assessment of Electric and Internal Combustion Engine Vehicles In China[J]. Journal of Cleaner Production, 2021, 285: 124899.
  16. Yuksel T, Tamayao M A M, Hendrickson C, et al. Effect of Regional Grid Mix, Driving Patterns and Climate on the Comparative Carbon Footprint of Gasoline and Plug-In Electric Vehicles in the United States[J]. Environmental Research Letters, 2016, 11(4): 044007.
  17. Stefan Bickert, Achim Kampker, Dennis Greger. Developments of CO2-Emissions and Costs for Small Electric and Combustion Engine Vehicles in Germany[J]. Transportation Research Part D, 2015, 36: 138-151.
  18. Hooftman N, Messagie M, Joint F, et al. In-Life Range Modularity for Electric Vehicles: The Environmental Impact of A Range-Extender Trailer System[J]. Applied Sciences, 2018, 8(7): 1016.
  19. Sen B, Kucukvar M, Onat N C, et al. Life Cycle Sustainability Assessment of Autonomous Heavy-Duty Trucks[J]. Journal of Industrial Ecology, 2020, 24(1): 149-164.
  20. Usai L, Hung C, Vasquez F, et al. Life Cycle Assessment of Fuel Cell Systems for Light Duty Vehicles, Current State-of-the-Art and Future Impacts[J]. Journal of Cleaner Production, 2021, 280: 125086-125097. [CrossRef]
  21. Benitez A, Wulf C, Palmenaer A, et al. Ecological Assessment of Fuel Cell Electric Vehicles with Special Focus on Type Iv Carbon Fiber Hydrogen Tank[J]. Journal of Cleaner Production, 2021, 278: 123277-123289.
  22. Requia W J, Adams M D, Arain A, et al. Carbon dioxide emissions of plug-in hybrid electric vehicles: A life-cycle analysis in eight Canadian cities[J]. Renewable and Sustainable Energy Reviews, 2017, 78: 1390-1396.
  23. De Souza L L P, Lora E E S, Palacio J C E, et al. Comparative environmental life cycle assessment of conventional vehicles with different fuel options, plug-in hybrid and electric vehicles for a sustainable transportation system in Brazil[J]. Journal of cleaner production, 2018, 203: 444-468.
  24. Han H, Xiang C, Zongwei L, et al. Electric Vehicles for Greenhouse Gas Reduction in China: A Cost-Effectiveness Analysis[J]. Transportation Research Part D, 2017, 56: 68-84.
  25. Held M, Schücking M. Utilization effects on battery electric vehicle life-cycle assessment: A case-driven analysis of two commercial mobility applications[J]. Transportation Research Part D: Transport and Environment, 2019, 75:87-105.
  26. Shafique M, Luo X. Environmental life cycle assessment of battery electric vehicles from the current and future energy mix perspective[J]. Journal of Environmental Management, 2022, 303, 114050.
  27. Bhosale A, Mastud S. Comparative environmental impact assessment of battery electric vehicles and conventional vehicles: a case study of India[J]. International Journal of Engineering 2023, 36(5): 965-978.
  28. Burton T, Powers S, Burns C, et al. A data-driven greenhouse gas emission rate analysis for vehicle comparisons[J]. SAE International Journal of Electrified Vehicles, 2022, 12(1): 91-127.
  29. Wong E Y C, Ho D C K, So S, et al. Life cycle assessment of electric vehicles and hydrogen fuel cell vehicles using the greet model—A comparative study[J]. Sustainability, 2021, 13(9): 4872.
  30. Peng T, Ou X, Yan X. Development and application of an electric vehicle life-cycle energy consumption and greenhouse gas emissions analysis model[J]. Chemical Engineering Research and Design, 2018, 131: 699-708.
  31. Cai Y, Applegate S, Yue W, et al. A hybrid life cycle and multi-criteria decision analysis approach for identifying sustainable development strategies of Beijing’s taxi fleet[J]. Energy Policy, 2017, 100: 314-325.
  32. Yu R, Cong L, Hui Y, et al. Life cycle CO2 emissions for the new energy vehicles in China drawing on the reshaped survival pattern[J]. Science of the Total Environment, 2022, 826: 154102.
  33. Chen Y, Hu K, Zhao J, et al. In-Use Energy and CO2 Emissions Impact of a Plug-in Hybrid and Battery Electric Vehicle Based on Real-World Driving[J]. International Journal of Environmental Science and Technology, 2018, 15: 1001-1008.
  34. Karabasoglu O, Michalek J. Influence of Driving Patterns on Life Cycle Cost and Emissions of Hybrid and Plug-in Electric Vehicle Powertrains[J]. Energy policy, 2013, 60: 445-461.
  35. Chen Y, Lan L, Hao Z, et al. Cradle-grave energy consumption, greenhouse gas and acidification emissions in current and future fuel cell vehicles: Study based on five hydrogen production methods in China[J]. Energy Reports, 2022, 8: 7931-7944.
  36. Chen Y S, Lan L B, Hao Z, et al. Life Cycle Assessment and Key Parameter Comparison of Hydrogen Fuel Cell Vehicles Power Systems[J]. Environmental Science, 2022, 43(8): 4402-4412. (in Chinese).
  37. Fu P, Lan L B, Chen Y, et al. Life cycle prediction assessment of energy saving and new energy vehicles for 2035[J]. Environmental Science, 2023, 44(4): 2365-2374.
  38. Ding Z C, Chen Y S, Liu J H. Comparative Life Cycle Assessment of Fuel Cell Vehicles and Plug-in Hybrid Electric Vehicles [C] // Proceedings of the 2018 National Academic Annual Conference on “Environmental Engineering” (Vol.1). School of Automotive Engineering, Chang ‘an University, 2018: 5.
  39. YANG Y. Research on the Green Assessment of Life Cycle Assessment of Urban Traffic and Its Multi-Scenario Simulation Prediction[D]. Chang’an University, 2021.
  40. YANG S. Research on Energy Management Strategy of Hybrid Electric Vehicle Based on Working Condition Recognition[D]. Jilin University, 2023.
  41. REN C L, LIU H J. Study on Energy Management Control Strategy of Plug-In Parallel Hybrid Electric Vehicle Based on Dynamic Planning[J]. Journal of Hefei University of Technology (Natural Science Edition), 2021, 44 (09): 1157-1164.
  42. Peterson S B, Apt J, Whitacre J F. Lithium-ion battery cell degradation resulting from realistic vehicle and vehicle-to-grid utilization[J]. Journal of Power Sources, 2010, 195(8): 2385-2392.
  43. Li X Y, Liao Y M, Zhang Y H, et al. Life cycle assessment of passenger car body considering the influence of vehicle type difference [J]. Journal of Environmental Science, 2024,44 (1): 462-476.
  44. Guinée J B. Handbook on life cycle assessment: operational guide to the ISO standards[M]. Springer Science & Business Media, 2002.
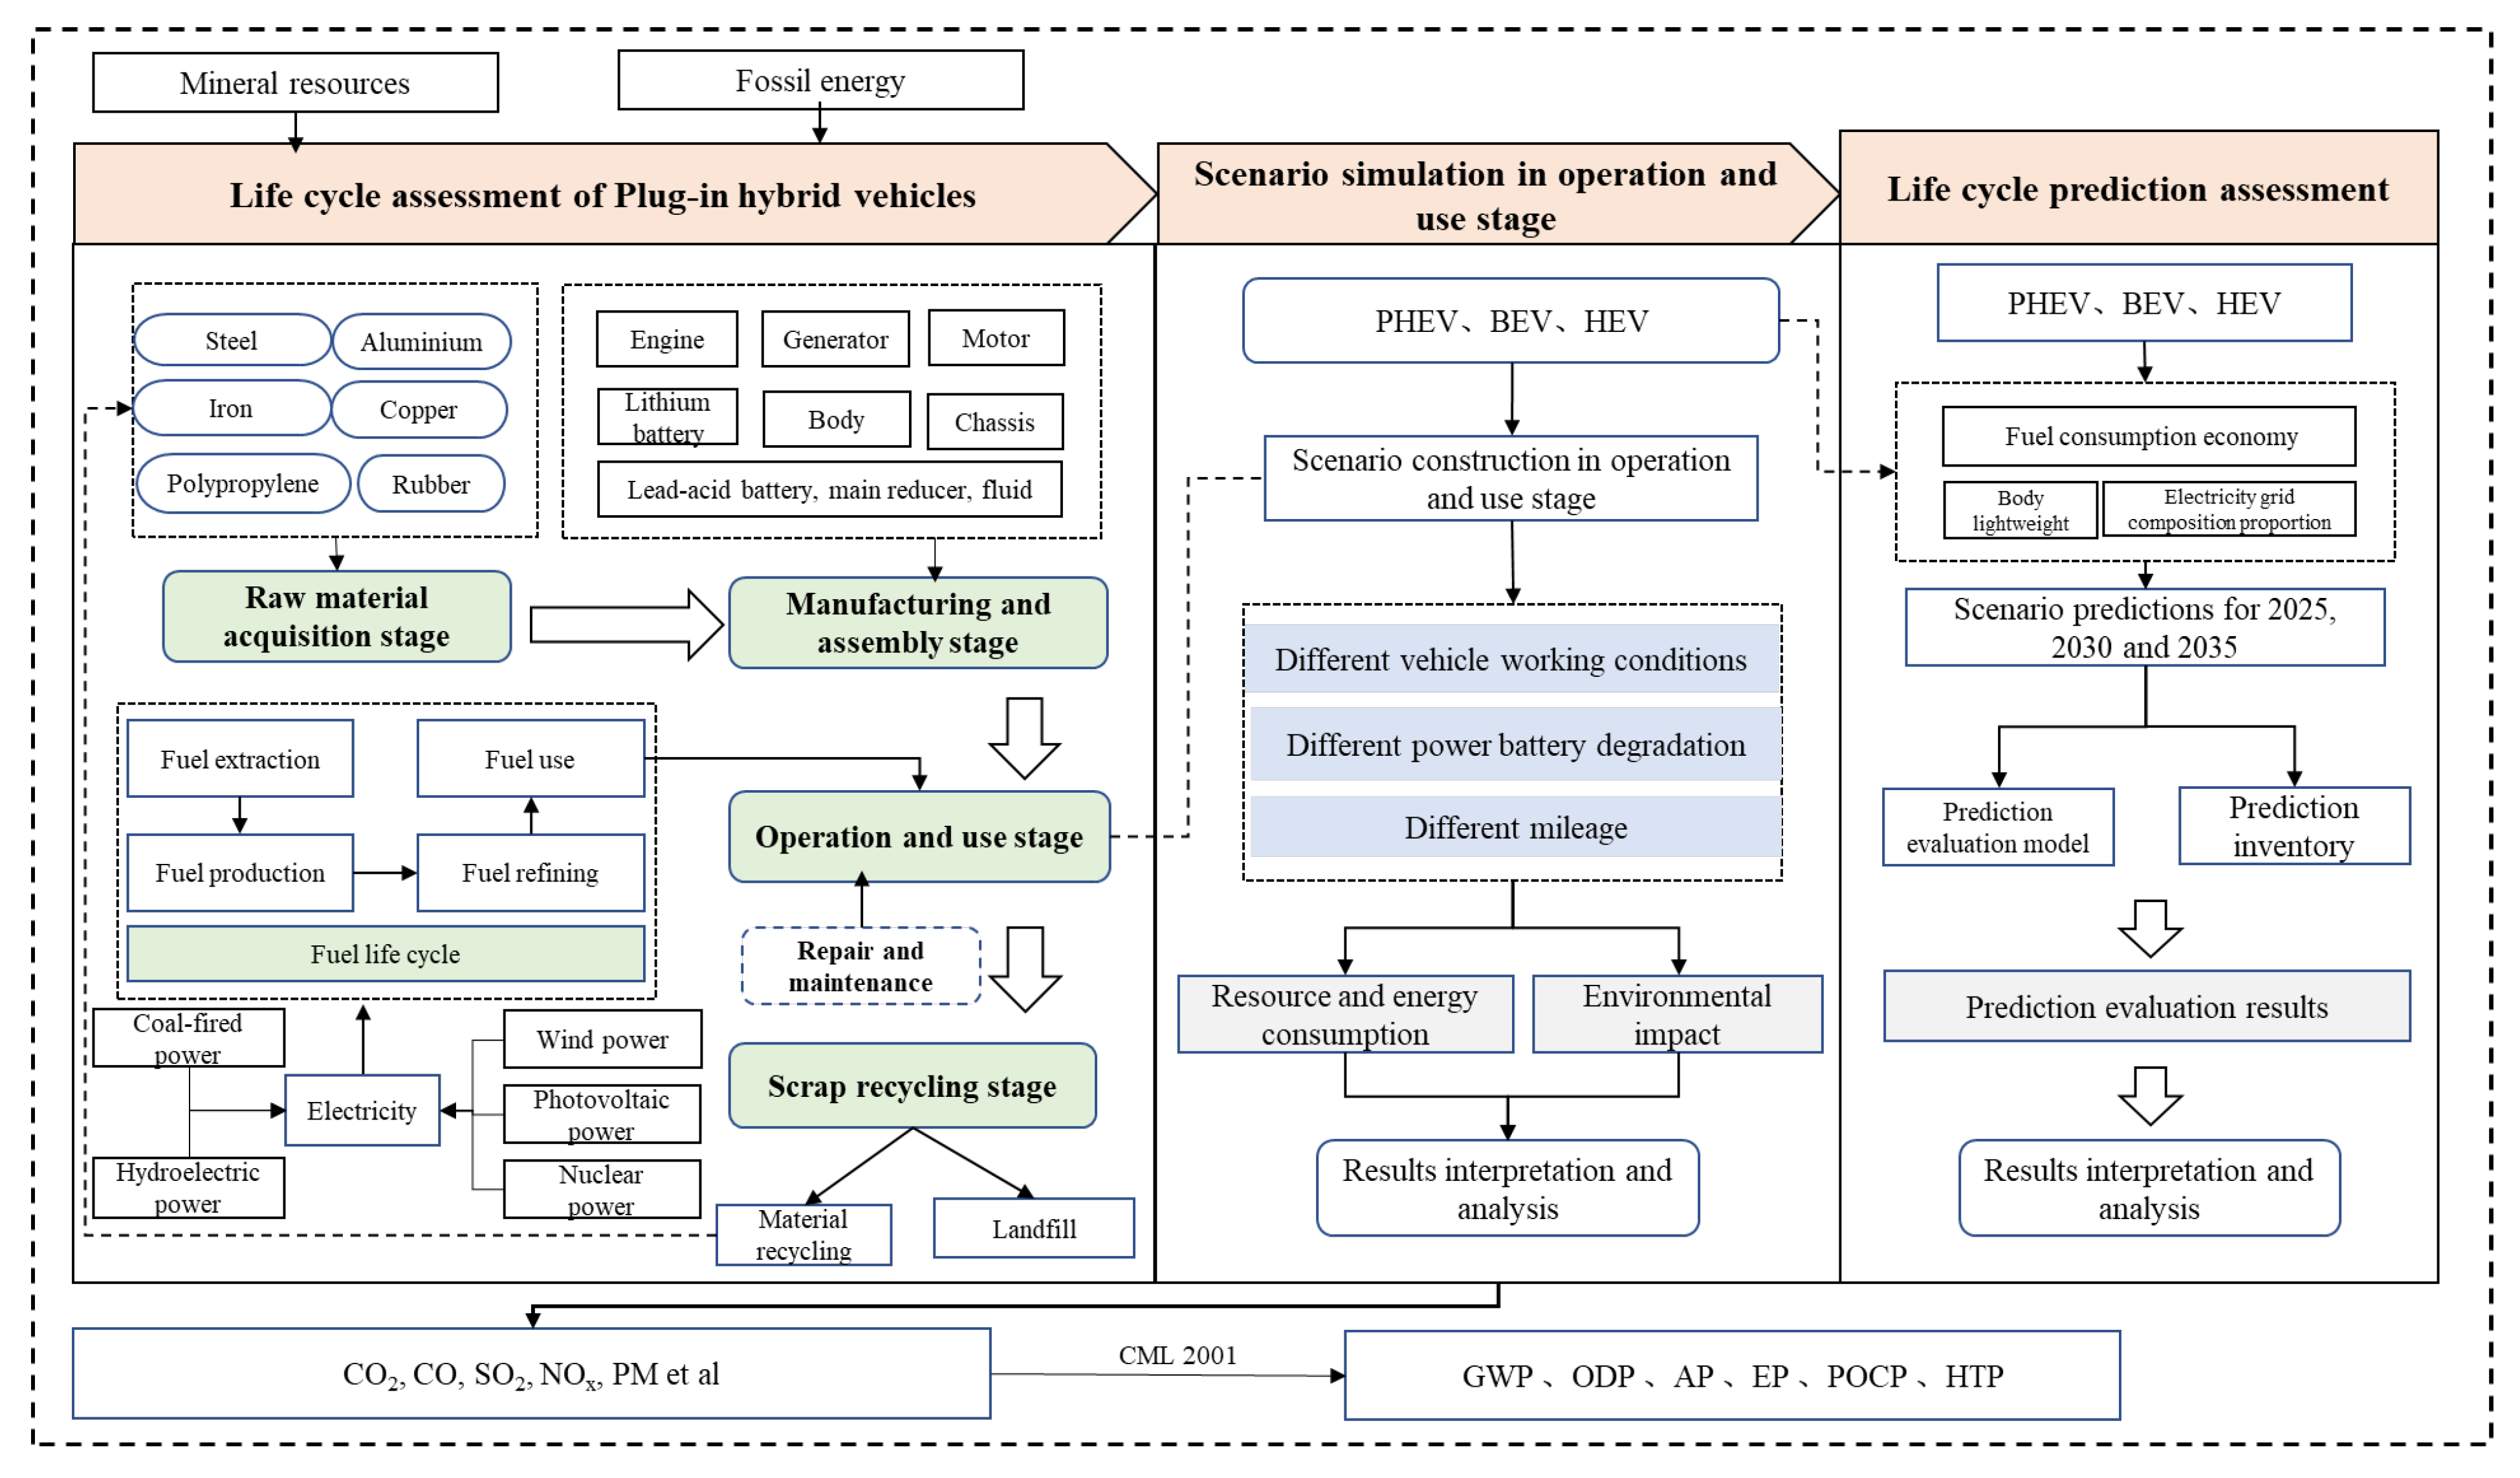
Figure 1. System Boundary Diagram.
Preprints 111987 g001
Figure 2. Comparison of Material Resource Consumption and Fossil Energy Consumption of PHEV in Each Stage. Stage I: raw material acquisition, Stage II: manufacturing and assembly, Stage III: operation and use, Stage IV: Scrap recycling.
Preprints 111987 g002
Figure 3. Comparison of Environmental Emissions of PHEV in Each Stage.
Preprints 111987 g003
Figure 4. Material resource consumption of HEV, BEV and PHEV under three working conditions when driving for 1 year.
Preprints 111987 g004
Figure 5. Fossil energy consumption of HEV, BEV and PHEV under three working conditions when driving for 1 year.
Preprints 111987 g005
Figure 6. Environmental emissions of HEV, BEV and PHEV under three working conditions when driving for 1 year.
Preprints 111987 g006aPreprints 111987 g006b
Figure 7. AP, EP, GWP, HTP, ODP and POCP Assessment Results per 100 km for the HEV, PHEV and BEV under Different Mileage Scenarios.
Preprints 111987 g007
Figure 8. Life Cycle Material Resource Consumption of HEV, BEV and PHEV for 2025, 2030 and 2035.
Preprints 111987 g008
Figure 9. Life Cycle Fossil Energy Consumption of HEV, BEV and PHEV for 2025, 2030 and 2035.
Preprints 111987 g009
Figure 10. Life Cycle AP, EP, GWP, HTP, ODP and POCP of HEV, BEV and PHEV for 2025, 2030 and 2035.
Preprints 111987 g010aPreprints 111987 g010b
Table 1. The Key Parameters of PHEVs.
Key Parameters Values Unit
vehicle dimensions (length × width × height) 4645×1775×1480 mm
curb weight 1540 kg
engine displacement 1.8 L
maximum engine power 73 kW
maximum engine torque 142 N·m
battery capacity 10.5 kWh
electric range 72 km
nominal electricity consumption 14.42 kWh/100km
nominal fuel consumption (fuel feed) 4.3 L/100km
nominal fuel consumption 1.3 L/100km
battery type Lithium-ion battery \
Table 2. The Main Materials and Quality of PHEV Components [9,13,35].
Component Material Value (kg) Component Material Value (kg)
Engine Steel 26.2 Lithium battery NCM 33.8
Aluminum 78.6 Aluminum 23.6
Cast iron 131.0 PVDF 2.8
Copper 2.6 Graphite 22.0
Rubber 11.8 Copper 13.7
Plastic 11.8 Polypropylene 3.9
Generator Steel 11.6 Steel 1.8
Aluminum 11.6 Fiberglass 0.4
Copper 8.8 Polyethylene 0.4
Lead-acid battery Lead 11.6 LiPF6 2.3
Sulfuric acid 1.4 Ethylene carbonate 6.5
Polypropylene 1.1 Dimethyl carbonate 6.5
Fiberglass 0.4 Transistor 0.6
Water 2.5 Resistor 0.6
Motor Steel 11.6 Ethylene glycol 1.1
Aluminum 11.6
Copper 8.8
Main reducer Steel 57.6 Fluid Lubricating fluid 0.9
Aluminum 19.0 Braking fluid 1.0
Copper 18.1 Cooling fluid 8.0
Plastic 0.2 Windshield washer fluid 3.0
Organics 0.2 Additive 15.1
Body Steel 432.1 Chassis Steel 266.7
Aluminum 5.0 Cast iron 20.4
Magnesium 0.6 Aluminum 3.2
Fiberglass 41.5 Copper 7.5
Plastic 109.4 Plastic 10.7
Copper 12.0 Rubber 13.6
Others 28.3 Carbon black 1.9
Table 3. Replacement of Components in Operation and Use Stage.
Replacement component Replacement cycle (km) Replacement number Mass (kg)
Tire 75000 1 76.9
Lubricating fluid 6250 23 20.7
Braking fluid 40000 3 3
Cooling fluid 55500 2 16
Windshield washer fluid 12500 11 33
Table 4. Characterization Results of PHEV in Each Stage.
Unit Life Cycle Raw Material Acquisition Manufacturing and Assembly Operation and Use Scrap Recycling
ADP(e) kg Sb-eq 4.82E-02 2.62E-01 3.23E-04 1.21E-03 -2.16E-01
ADP(f) MJ 2.93E+05 8.21E+04 5.00E+04 2.08E+05 -4.67E+04
AP kg SO2-eq 5.15E+01 8.03E+01 9.38E+00 2.45E+01 -6.26E+01
EP kg Phosphate-eq 5.20E+00 2.07E+00 1.26E+00 3.15E+00 -1.29E+00
GWP kg CO2-eq 1.70E+04 8.39E+03 4.61E+03 9.67E+03 -5.68E+03
HTP kg DCB-eq 1.38E+03 3.84E+03 1.86E+02 5.94E+02 -3.24E+03
ODP kg CFC-eq 1.19E-05 1.18E-05 2.34E-08 4.53E-08 8.40E-09
POCP kg Ethene-eq 4.28E+00 4.46E+00 6.45E-01 2.78E+00 -3.60E+00
Table 5. Vehicle specification of PHEV, HEV and BEV [39].
Name Unit PHEV HEV BEV
Curb quality kg 1540.0 1650.0 1650.0
Engine displacement L 1.8 2.5 \
Power battery capacity kWh 10.5 1.3 57.0
Engine maximum power kW 73.0 131.0 \
Motor maximum power kW \ \ 100.0
gasoline consumption economy L·(100km)-1 4.3 4.4 \
Electricity consumption economy kWh·(100km)-1 14.42 \ 14.10
Battery type \ Lithium-ion nickel-cobalt-manganese battery Ni-MH battery Lithium iron phosphate battery
Table 6. Characteristics of Three Kinds of Vehicle Working Conditions [34].
Name Unit FTP HWFET US06
Maximum speed km/h 90 97 129
Average speed km/h 32 77 77
Maximum acceleration m/s2 1.48 1.43 3.78
Driving distance km 17 16 13
Driving time min 31 12.5 10
Brake times \ 23 0 4
Idle time % 18 0 7
Engine start-up 20 30 30
Table 7. The Power Consumption and All-Electric Endurance Mileage of The Three Vehicles in Each Driving Cycle [34,40,41].
Name Unit FTP HWFET US06
HEVs gasoline consumption L·(100km)-1 5.17 5.91 7.69
PHEVs electricity consumption kWh·(100km)-1 14.88 15.67 19.43
PHEVs gasoline consumption L·(100km)-1 4.67 5.52 7.83
PHEVs AER km 70.56 67.00 54.04
BEVs power consumption kWh·(100km)-1 14.20 14.60 20.86
BEVs AER km 427.74 290.42 273.22
Table 8. The Electric Energy and Gasoline Consumed by The Three Models for One Year under Different Working Conditions.
Name Energy source Unit FTP HWFET US06
HEV gasoline L 927.50 1060.25 1379.59
PHEV gasoline L 292.07 345.23 489.70
electricity kWh 1738.85 1831.17 2270.56
BEV electricity kWh 2407.55 2619.24 3742.28
Table 9. Increased Energy Consumption Due to Power Battery Degradation.
Name Scenario AER (km) Rate of Increase in Energy Consumption (%) Energy Consumption per 100 km (kWh/(100 km))
BEV No degradation (scenario 1) 390.42 0 14.60
Degrate to 90% (scenario 2) 309.10 26.30 18.44
Degrate to 85% (scenario 3) 226.31 72.53 25.19
PHEV No degradation (scenario 1) 70.56 0 14.88
Degrate to 90% (scenario 2) 53.98 30.71 19.45
Degrate to 85% (scenario 3) 39.51 78.63 26.58
Table 10. Material resource consumption, fossil energy consumption, environmental emissions of HEV, BEV under three Power Battery Degradation when Driving for 1 year.
Vehicle Type Scenario ADP(e)
(kg Sb-eq)
ADP(f)
(MJ)
AP
(kg SO2-eq)
EP
(kg Phosphate-eq)
GWP
(kg CO2-eq)
HTP
(kg DCB-eq)
ODP
(kg CFC-eq)
POCP
(kg ethene-eq)
BEV No degradation (scenario 1) 1.40E-04 2.05E+04 4.20E+00 5.61E-01 1.96E+03 8.25E+01 1.06E-08 2.84E-01
Degrate to 90%
(scenario 2)
1.77E-04 2.60E+04 5.30E+00 7.09E-01 2.48E+03 1.04E+02 1.34E-08 3.59E-01
Degrate to 85%
(scenario 3)
2.42E-04 3.54E+04 7.25E+00 9.68E-01 3.38E+03 1.42E+02 1.83E-08 4.90E-01
PHEV No degradation (scenario 1) 1.43E-04 2.43E+04 3.55E+00 4.81E-01 2.14E+03 7.65E+01 7.15E-09 4.88E-01
Degrate to 90%
(scenario 2)
1.65E-04 2.90E+04 3.89E+00 5.29E-01 2.50E+03 8.60E+01 7.19E-09 6.20E-01
Degrate to 85%
(scenario 3)
1.85E-04 3.31E+04 4.18E+00 5.70E-01 2.83E+03 9.44E+01 7.23E-09 7.35E-01
Table 11. Construction of Mileage Scenarios for the PHEV, BEV and HEV.
Mileage Scenario HEV/ gasoline PHEV/ gasoline PHEV/ electricity BEV/ electricity
10000 km Private car (scenario 1) 440.0 L \ 1442.0 kWh 1410.0 kWh
Taxi (scenario 2) 349.0 L 271.5 kWh
50000 km Private car (scenario 1) 2244.4 L 185.4 L 7047.1 kWh 7560.7 kWh
Taxi (scenario 2) 1807.5 L 1357.7 kWh
100000 km Private car (scenario 1) 4603.3 L 1272.2 L 11893.5 kWh 16540.9 kWh
Taxi (scenario 2) 3771.2 L 3075.3 kWh
150000 km Private car (scenario 1) 7082.5 2616.9 L 16739.7 kWh 27206.5 kWh
Taxi (scenario 2) 5891.8 L 4613.0 kWh
Table 12. Average Energy Consumption per 100 km for the HEV, PHEV and BEV under Different Mileage Scenarios.
Mileage Scenario HEV/ gasoline
(L/100km)
PHEV/ gasoline
(L/100km)
PHEV/ power
(kWh/100km)
BEV/ power
(kWh/100km)
10000 km Private car (scenario 1) 4.40 \ 14.42 14.10
Taxi (scenario 2) 3.49 2.72
50000 km Private car (scenario 1) 4.49 0.21 14.09 15.12
Taxi (scenario 2) 3.62 2.72
100000 km Private car (scenario 1) 4.60 1.27 11.89 16.54
Taxi (scenario 2) 3.77 3.08
150000 km Private car (scenario 1) 4.72 1.74 11.16 18.14
Taxi (scenario 2) 3.93 3.08
Table 13. Material Resource Assessment Results per 100 km for the HEV, PHEV and BEV under Different Mileage Scenarios (unit: kg Sb-eq).
Mileage Scenario HEV PHEV BEV
10000 km Private car (scenario 1) 7.50E-07 7.71E-07 7.54E-07
Taxi (scenario 2) 7.46E-07
50000 km Private car (scenario 1) 7.66E-07 7.90E-07 8.09E-07
Taxi (scenario 2) 7.69E-07
100000 km Private car (scenario 1) 7.84E-07 8.54E-07 8.84E-07
Taxi (scenario 2) 8.14E-07
150000 km Private car (scenario 1) 8.05E-07 8.96E-07 9.70E-07
Taxi (scenario 2) 8.41E-07
Table 14. Fossil Energy Consumption Assessment Results per 100 km for the HEV, PHEV and BEV under Different Mileage Scenarios (unit: MJ).
Mileage Scenario HEV PHEV BEV
10000 km Private car (scenario 1) 1.58E+02 1.13E+02 1.11E+02
Taxi (scenario 2) 1.49E+02
50000 km Private car (scenario 1) 1.61E+02 1.18E+02 1.19E+02
Taxi (scenario 2) 1.53E+02
100000 km Private car (scenario 1) 1.65E+02 1.40E+02 1.30E+02
Taxi (scenario 2) 1.62E+02
150000 km Private car (scenario 1) 1.70E+02 1.51E+02 1.42E+02
Taxi (scenario 2) 1.68E+02
Table 15. Predictive Scenarios for the Three Vehicle Types.
Name Year Energy Consumption of 100 km(kWh) Fuel Consumption of 100 km(L) Curb weight (kg)
PHEV 2025 13.0 4.3 1309.0
2030 12.50 3.2 1155.0
2035 12.00 2.0 1001.0
HEV 2025 \ 4.3 1485.0
2030 \ 3.2 1353.0
2035 \ 2.0 1237.5
BEV 2025 13.00 \ 1402.5
2030 12.50 \ 1237.5
2035 12.00 \ 1072.5
Disclaimer/Publisher’s Note: The statements, opinions and data contained in all publications are solely those of the individual author(s) and contributor(s) and not of MDPI and/or the editor(s). MDPI and/or the editor(s) disclaim responsibility for any injury to people or property resulting from any ideas, methods, instructions or products referred to in the content.
Copyright: This open access article is published under a Creative Commons CC BY 4.0 license, which permit the free download, distribution, and reuse, provided that the author and preprint are cited in any reuse.
Prerpints.org logo

Preprints.org is a free preprint server supported by MDPI in Basel, Switzerland.

Subscribe

© 2024 MDPI (Basel, Switzerland) unless otherwise stated