Submitted:
11 July 2024
Posted:
15 July 2024
You are already at the latest version
Abstract
Keywords:
1. Introduction
2. Materials and Methods
2.1. Study Population
2.2. Data Assessments/Sources
2.3. Outcome
2.4. Data Analysis
3. Results
3.1. Study Population
3.2. Logistic Regression Analysis of Risk Factors
3.3. Survival Analysis
4. Discussion
5. Conclusions
Author Contributions
Funding
Institutional Review Board Statement
Informed Consent Statement
Data Availability Statement
Acknowledgments
Conflicts of Interest
References
- Siegel, R.L., et al., Cancer statistics, 2023. CA Cancer J Clin, 2023. 73(1): p. 17-48.
- Goldstraw, P., et al., The IASLC Lung Cancer Staging Project: Proposals for Revision of the TNM Stage Groupings in the Forthcoming (Eighth) Edition of the TNM Classification for Lung Cancer. J Thorac Oncol, 2016. 11(1): p. 39-51. [CrossRef]
- Liang, W., et al., Expert consensus on neoadjuvant immunotherapy for non-small cell lung cancer. Transl Lung Cancer Res, 2020. 9(6): p. 2696-2715. [CrossRef]
- Kalvapudi, S., et al., Neoadjuvant therapy in non-small cell lung cancer: basis, promise, and challenges. Front Oncol, 2023. 13: p. 1286104. [CrossRef]
- Blumenthal, G.M., et al., Current Status and Future Perspectives on Neoadjuvant Therapy in Lung Cancer. J Thorac Oncol, 2018. 13(12): p. 1818-1831. [CrossRef]
- Liu, X., et al., Current status and future perspectives on immunotherapy in neoadjuvant therapy of resectable non-small cell lung cancer. Asia Pac J Clin Oncol, 2022. 18(4): p. 335-343. [CrossRef]
- Xu, Z., et al., Adjuvant and neo-adjuvant immunotherapy in resectable non-small cell lung cancer (NSCLC): Current status and perspectives. Cancer Innov, 2023. 2(1): p. 65-78. [CrossRef]
- Junker, K., et al., Grading of tumor regression in non-small cell lung cancer : morphology and prognosis. Chest, 2001. 120(5): p. 1584-91.
- Zens, P., et al., A prognostic score for non-small cell lung cancer resected after neoadjuvant therapy in comparison with the tumor-node-metastases classification and major pathological response. Mod Pathol, 2021. 34(7): p. 1333-1344. [CrossRef]
- Goldstraw, P., et al., The IASLC Lung Cancer Staging Project: proposals for the revision of the TNM stage groupings in the forthcoming (seventh) edition of the TNM Classification of malignant tumours. J Thorac Oncol, 2007. 2(8): p. 706-14. [CrossRef]
- Travis, W.D., et al., The 2015 World Health Organization Classification of Lung Tumors: Impact of Genetic, Clinical and Radiologic Advances Since the 2004 Classification. J Thorac Oncol, 2015. 10(9): p. 1243-1260.
- Travis, W.D., et al., IASLC Multidisciplinary Recommendations for Pathologic Assessment of Lung Cancer Resection Specimens After Neoadjuvant Therapy. J Thorac Oncol, 2020. 15(5): p. 709-740. [CrossRef]
- Gilligan, D., et al., Preoperative chemotherapy in patients with resectable non-small cell lung cancer: results of the MRC LU22/NVALT 2/EORTC 08012 multicentre randomised trial and update of systematic review. Lancet, 2007. 369(9577): p. 1929-37.
- Eberhardt, W.E., et al., Phase III Study of Surgery Versus Definitive Concurrent Chemoradiotherapy Boost in Patients With Resectable Stage IIIA(N2) and Selected IIIB Non-Small-Cell Lung Cancer After Induction Chemotherapy and Concurrent Chemoradiotherapy (ESPATUE). J Clin Oncol, 2015. 33(35): p. 4194-201. [CrossRef]
- Albain, K.S., et al., Radiotherapy plus chemotherapy with or without surgical resection for stage III non-small-cell lung cancer: a phase III randomised controlled trial. Lancet, 2009. 374(9687): p. 379-86. [CrossRef]
- Schreiner, W., et al., Pathologic complete response after induction therapy-the role of surgery in stage IIIA/B locally advanced non-small cell lung cancer. J Thorac Dis, 2018. 10(5): p. 2795-2803. [CrossRef]
- Tanahashi, M., et al., Role of fluorodeoxyglucose-positron emission tomography in predicting the pathological response and prognosis after neoadjuvant chemoradiotherapy for locally advanced non-small-cell lung cancer. Interact Cardiovasc Thorac Surg, 2022. 35(2). [CrossRef]
- Agrawal, V., et al., Radiologic-pathologic correlation of response to chemoradiation in resectable locally advanced NSCLC. Lung Cancer, 2016. 102: p. 1-8. [CrossRef]
- Cerfolio, R.J., et al., Repeat FDG-PET after neoadjuvant therapy is a predictor of pathologic response in patients with non-small cell lung cancer. Ann Thorac Surg, 2004. 78(6): p. 1903-9; discussion 1909. [CrossRef]
- Pottgen, C., et al., Value of 18F-fluoro-2-deoxy-D-glucose-positron emission tomography/computed tomography in non-small-cell lung cancer for prediction of pathologic response and times to relapse after neoadjuvant chemoradiotherapy. Clin Cancer Res, 2006. 12(1): p. 97-106. [CrossRef]
- Coroller, T.P., et al., Radiomic-Based Pathological Response Prediction from Primary Tumors and Lymph Nodes in NSCLC. J Thorac Oncol, 2017. 12(3): p. 467-476. [CrossRef]
- Pilotto, S., et al., Risk Stratification Model for Resected Squamous-Cell Lung Cancer Patients According to Clinical and Pathological Factors. J Thorac Oncol, 2015. 10(9): p. 1341-1348. [CrossRef]
- Forde, P.M., et al., Neoadjuvant Nivolumab plus Chemotherapy in Resectable Lung Cancer. N Engl J Med, 2022. 386(21): p. 1973-1985. [CrossRef]
- Wakelee, H., et al., Perioperative Pembrolizumab for Early-Stage Non-Small-Cell Lung Cancer. N Engl J Med, 2023. 389(6): p. 491-503. [CrossRef]
- Remark, R., et al., Immune contexture and histological response after neoadjuvant chemotherapy predict clinical outcome of lung cancer patients. Oncoimmunology, 2016. 5(12): p. e1255394. [CrossRef]
- Betticher, D.C., et al., Prognostic factors affecting long-term outcomes in patients with resected stage IIIA pN2 non-small-cell lung cancer: 5-year follow-up of a phase II study. Br J Cancer, 2006. 94(8): p. 1099-106. [CrossRef]


| Patient demographics at study entry | LUAD n=58 |
SQCA n=37 |
P-value |
|---|---|---|---|
|
Age (median, quartiles [1st; 3rd]) years Age > 65 (n, %) Age > 70 (n, %) Age > 80 (n, %) |
60.73 [54.5; 69.0] 21/58 (36.2 %) 11/58 (19.0 %) 0/58 (0 %) |
65.6 [60.5; 70.3] 21/37 (56.8 %) 10/37 (27.0 %) 0/37 (0 %) |
0.0687 0.0492 0.3558 |
|
Sex (n, %) Female Male |
27/58 (46.6 %) 31/58 (53.4 %) |
5/37 (13.5 %) 32/37 (86.5 %) |
0.0009 |
|
BMI (median, quartiles [1st; 3rd]) BMI < 18.5 kg/m2 (n, %) BMI > 18.5, < 25 kg/m2 (n, %) BMI > 25, < 30 kg/m2 (n, %) BMI > 30 kg/m2 (n, %) |
25.3 [23.0; 27.2] 0/58 (0 %) 25/58 (43.1 %) 29/58 (50.0 %) 4/58 (6.9 %) |
23.8 [21.8; 26.6] 0/37 (0 %) 24/37 (64.9 %) 10/37 (27.0 %) 3/37 (8.1 %) |
0.1842 0.0385 0.0264 1.0000 |
|
Pack years (median, quartiles [1st; 3rd]) Never smokers (n, %) Current smokers (n, %) Ex-smokers (n, %) |
30.0 [4.25; 45.0] PY 10/58 (17.2 %) 32/58 (55.2 %) 16/58 (27.6 %) |
40.0 [22.5; 52.5] PY 3/37 (8.1 %) 18/37 (48.6 %) 16/37 (43.2 %) |
0.0288 0.2066 0.5346 0.1143 |
| Alcohol (n, %) |
10/58 (17.2 %) |
6/37 (16.2 %) |
0.8964 |
|
Comorbidities (n, %) Respiratory Cardiovascular Renal Liver Neurological/ psychiatric Diabetes mellitus Non-pulmonary malignancies |
21/58 (36.2 %) 9/58 (15.5 %) 2/58 (3.4 %) 3/57 (5.3 %) 8/58 (13.8 %) 5/58 (8.6 %) 12/58 (20.7 %) |
18/37 (48.6 %) 2/37 (5.4 %) 3/37 (8.1 %) 3/37 (8.1 %) 3/37 (8.1 %) 7/37 (18.9 %) 4/37 (10.8 %) |
0.4546 0.1331 0.3744 0.6769 0.3984 0.1407 0.2096 |
|
Lung function parameters (median, quartiles [1st; 3rd]) FVC (absolute values, L) FEV1 (absolute values, L) DLCO (absolute values, L) |
3.18 [2.76-3.79] 2.25 [1.97-2.92] 5.29 [4.23-6.25] |
3.37 [2.84-4.19] 2.24 [1.64-3.07] 4.40 [3.31-6.05] |
0.2476 0.4897 0.0393 |
|
Lung function parameters (median, quartiles [1st; 3rd]) FVC (predicted, %) FEV1 (predicted, %) DLCO (predicted, %) FEV1/ FVC(%) |
82.50 [72.75-98.00] 80.50 [67.00-90.25] 62.50 [50.50-70.50] 95.00 [87.00-102.00] |
79.00 [71.50-91.00] 69.00 [55.50-85.00] 48.00 [42.00-62.00] 88.00 [78.00-95.00] |
0.2903 0.0103 0.0023 0.0014 |
| Parameters preoperatively (median, quartiles [1st; 3rd]) |
LUAD n=58 |
SQCA n=37 |
P-value |
|---|---|---|---|
|
Blood counts Leukocytes (/nL) Erythrocytes (/pL) Hemoglobin (g/dL) Thrombocytes (/nL) Clinical chemistry CRP (mg/dL) Creatinine (mg/dL) Albumin (g/dL) LDH (IU/L) |
6.15 [4.58; 7.30] 3.74 [3.48; 3.91] 11.9 [11.10; 12.43] 240.5 [204.0; 288.25] 0.20 [0.10; 0.60] 0.90 [0.78; 1.00] 4.27 [3.90; 4.46] 200.0 [169.8; 244.0] |
5.60 [4.35; 7.90] 3.56 [3.33; 4.01] 11.6 [10.85; 12.60] 221.0 [198.5; 268.5] 0.50 [0.10; 1.30] 1.0 [0.80; 1.10] 4.00 [3.60; 4.35] 188.0 [174.0; 211.0] |
0.7923 0.7688 0.8396 0.3046 0.0206 0.1304 0.0281 0.2323 |
| Tumor characteristics | LUAD n=58 |
SQCA n=37 |
P-value |
|---|---|---|---|
|
Tumor side (n, %) Left Right |
27/58 (46.6 %) 31/58 (53.4 %) |
16/37 (43.2 %) 21/37 (56.8 %) |
0.7521 |
|
Tumor localization (n, %) Left upper lobe Left lower lobe Right upper lobe middle lobe Right lower lobe |
17/58 (29.3 %) 10/58 (17.2 %) 22/58 (37.9 %) 2/58 (3.4 %) 7/58 (12.1 %) |
13/37 (35.1 %) 3/37 (8.11 %) 11/37 (29.7 %) 2/37 (5.4 %) 8/37(21.6 %) |
0.5515 0.2066 0.3521 0.6432 0.2131 |
|
TNM7 classification (n, %) cT1 cT2 cT3 cT4 Lymph node involvement (n, %) cN0 cN1 cN2 cN3 |
11/58 (19.0 %) 10/58 (17.2 %) 14/58 (24.1 %) 23/58 (39.7 %) 9/58 (15.5 %) 11/58 (19.0 %) 35/58 (60.3 %) 3/58 (5.2 %) |
0/37 (0 %) 4/37 (10.8 %) 9/37 (24.3 %) 24/37 (64.9 %) 4/37 (10.8 %) 7/37 (18.9 %) 22/37 (59.5 %) 4/37 (10.8 %) |
0.0048 0.3886 0.9830 0.0166 0.5151 0.9955 0.9315 0.3050 |
| Pleura visceralis infiltration (n, %) |
21/58 (36.2 %) |
4/37 (10.8 %) |
0.0061 |
|
TNM7 classification (n, %) yT0 yT1 yT2 yT3 yT4 Lymph node involvement (n, %) yN0 yN1 yN2 yN3 |
10/58 (17.2 %) 20/58 (34.5 %) 11/58 (19.0 %) 9/58 (15.5 %) 8/58 (13.8 %) 34/58 (58.6 %) 6/58 (10.3 %) 17/58 (29.3 %) 1/58 (1.7 %) |
22/37 (59.5 %) 10/37 (27.0 %) 2/37 (5.4 %) 2/37 (5.4 %) 1/37 (2.7 %) 33/37 (89.2 %) 4/37 (10.8 %) 0/37 (0 %) 0/37 (0 %) |
<0.0001 0.4459 0.0608 0.1331 0.0719 0.0014 0.9425 0.0003 0.4220 |
| Features of the surgical procedures | LUAD n=58 |
SQCA n=37 |
P-value |
|---|---|---|---|
|
Resection side (n, %) Left Right |
27/58 (46.6 %) 31/58 (53.4 %) |
16/37 (43.2 %) 21/37 (56.8 %) |
0.7521 |
|
Surgical approach (n, %) Open (thoracotomy) Minimally invasive (VATS) Conversion to open |
50/58 (86.2 %) 5/58 (8.6 %) 3/58 (5.2 %) |
35/37 (94.6%) 2/37 (5.4%) 0/37 (0.0%) |
0.1939 0.7017 0.2791 |
|
Resection extent (n, %) Lobectomy Multilobar -Bilobectomy -Pneumonectomy |
50/58 (86.2 %) 4/58 (6.9 %) 4/58 (6.9 %) |
25/37 (67.6%) 4/37 (10.8%) 8/37 (21.6%) |
0.0298 0.7071 0.0351 |
|
Topographical resection (n, %) Sleeve resection Thoracic wall |
11/58 (19.0 %) 4/58 (6.9 %) |
9/37 (24.3%) 2/37 (5.4%) |
0.5321 1.000 |
| Surgery time (median, quartiles [1st; 3rd]) (minutes) |
213.0 [171.5; 262.5] |
216.0 [165.5;275.0] |
0.6333 |
|
Neoadjuvant therapy Chemotherapy Chemo- and Immunotherapy Radiation therapy Chemo- and Radiation therapy Chemo-, Immuno, and Radiation therapy |
14/58 (24.1 %) 5/58 (8.6 %) 0/58 (0.0 %) 34/58 (58.6 %) 5/58 (8.6 %) |
4/37 (10.8 %) 2/37 (5.4 %) 1/37 (2.7 %) 30/37 (81.1 %) 0/37 (0.0 %) |
0.1060 0.7017 0.3895 0.0228 0.1527 |
|
Adjuvant therapy Chemotherapy Immunotherapy Chemo- and Immunotherapy Radiation therapy Chemo-, Immuno, and Radiation therapy |
1/57 (1.8 %) 9/57 (15.8 %) 0/57 (0.0 %) 8/57 (14.0 %) 1/57 (1.8 %) |
0/36 (0.0 %) 0/36 (0.0 %) 1/36 (2.8 %) 1/36 (2.8 %) 1/36 (2.8 %) |
1.0000 0.0121 0.3871 0.0737 1.0000 |
|
Length of stay (median, quartiles [1st; 3rd]) (days) In-hospital stay ICU stay ICU > 3 days (n, %) ICU > 7 days (n, %) Readmission within 30 days (n, %) |
11.0 [8.0; 14.0] 1.0 [1.0; 2.0] 10/58 (17.2 %) 3/58 (5.2 %) 4/58 (6.9 %) |
13.0 [9.5; 24.5] 3.0 [1.0; 5.0] 12/37 (32.4%) 4/37 (10.8%) 4/37 (10.8%) |
0.0458 0.0039 0.0870 0.4255 0.7071 |
| Primary Tumor relapse or metastasis (n, %) |
31/57 (54.4 %) |
8/36 (22.2%) |
0.0022 |
|
Mortality (n, %) During maximal follow-up Within 30 days postoperatively |
25/58 (43.1 %) 2/58 (3.5 %) |
21/37 (56.8%) 2/37 (5.4%) |
0.5041 1.0000 |
|
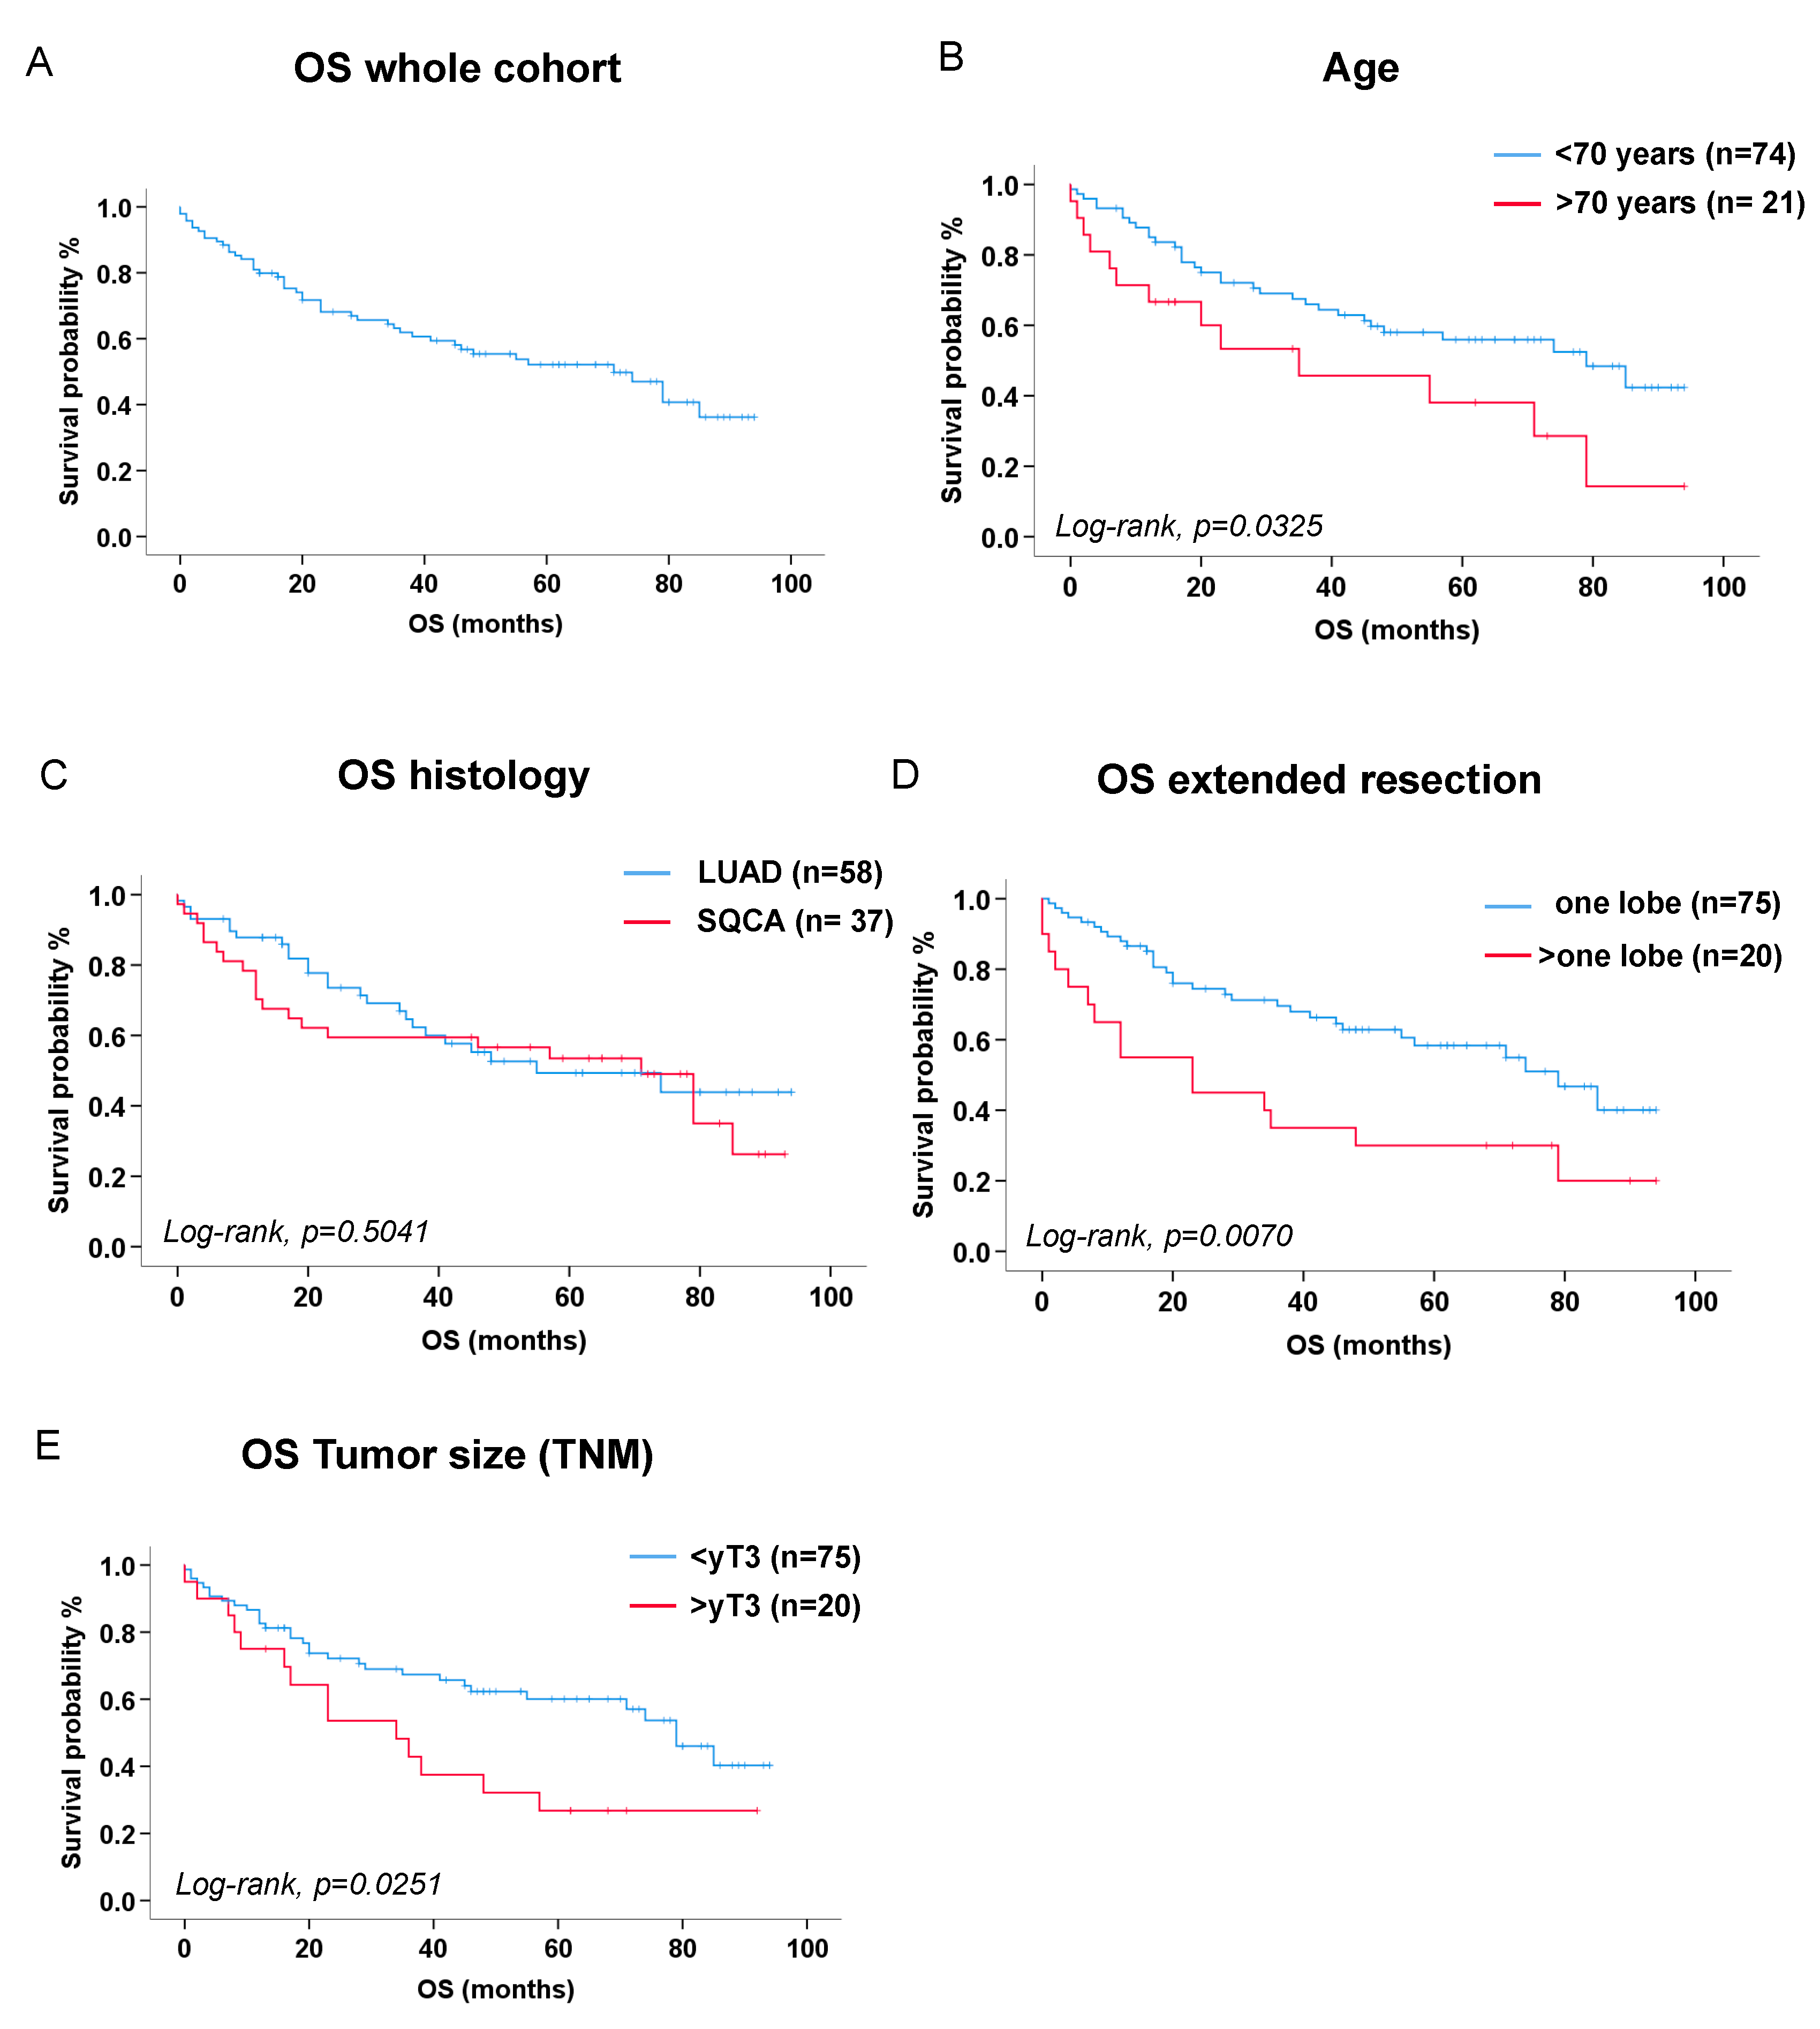
Overall survival (estimate [lower bound; upper bound], months) |
55.00 [17.06; 92.94] |
71.00 [44.89; 97.11] |
0.5041 |
| Characterization of Tumor regression score | LUAD n=58 |
SQCA n=37 |
P-value |
|---|---|---|---|
|
TNM7 classification (n, %) yT0 yT1 yT2 yT3 yT4 Lymph node involvement (n, %) yN0 yN1 yN2 yN3 |
10/58 (17.2 %) 20/58 (34.5 %) 11/58 (19.0 %) 9/58 (15.5 %) 8/58 (13.8 %) 34/58 (58.6 %) 6/58 (10.3 %) 17/58 (29.3 %) 1/58 (1.7 %) |
22/37 (59.5%) 10/37 (27.0%) 2/37 (5.4%) 2/37 (5.4%) 1/37 (2.7%) 33/37 (89.2%) 4/37 (10.8%) 0/37 (0.0%) 0/37 (0.0%) |
<0.0001 0.4459 0.0608 0.1331 0.0719 0.0014 0.9425 0.0003 1.0000 |
|
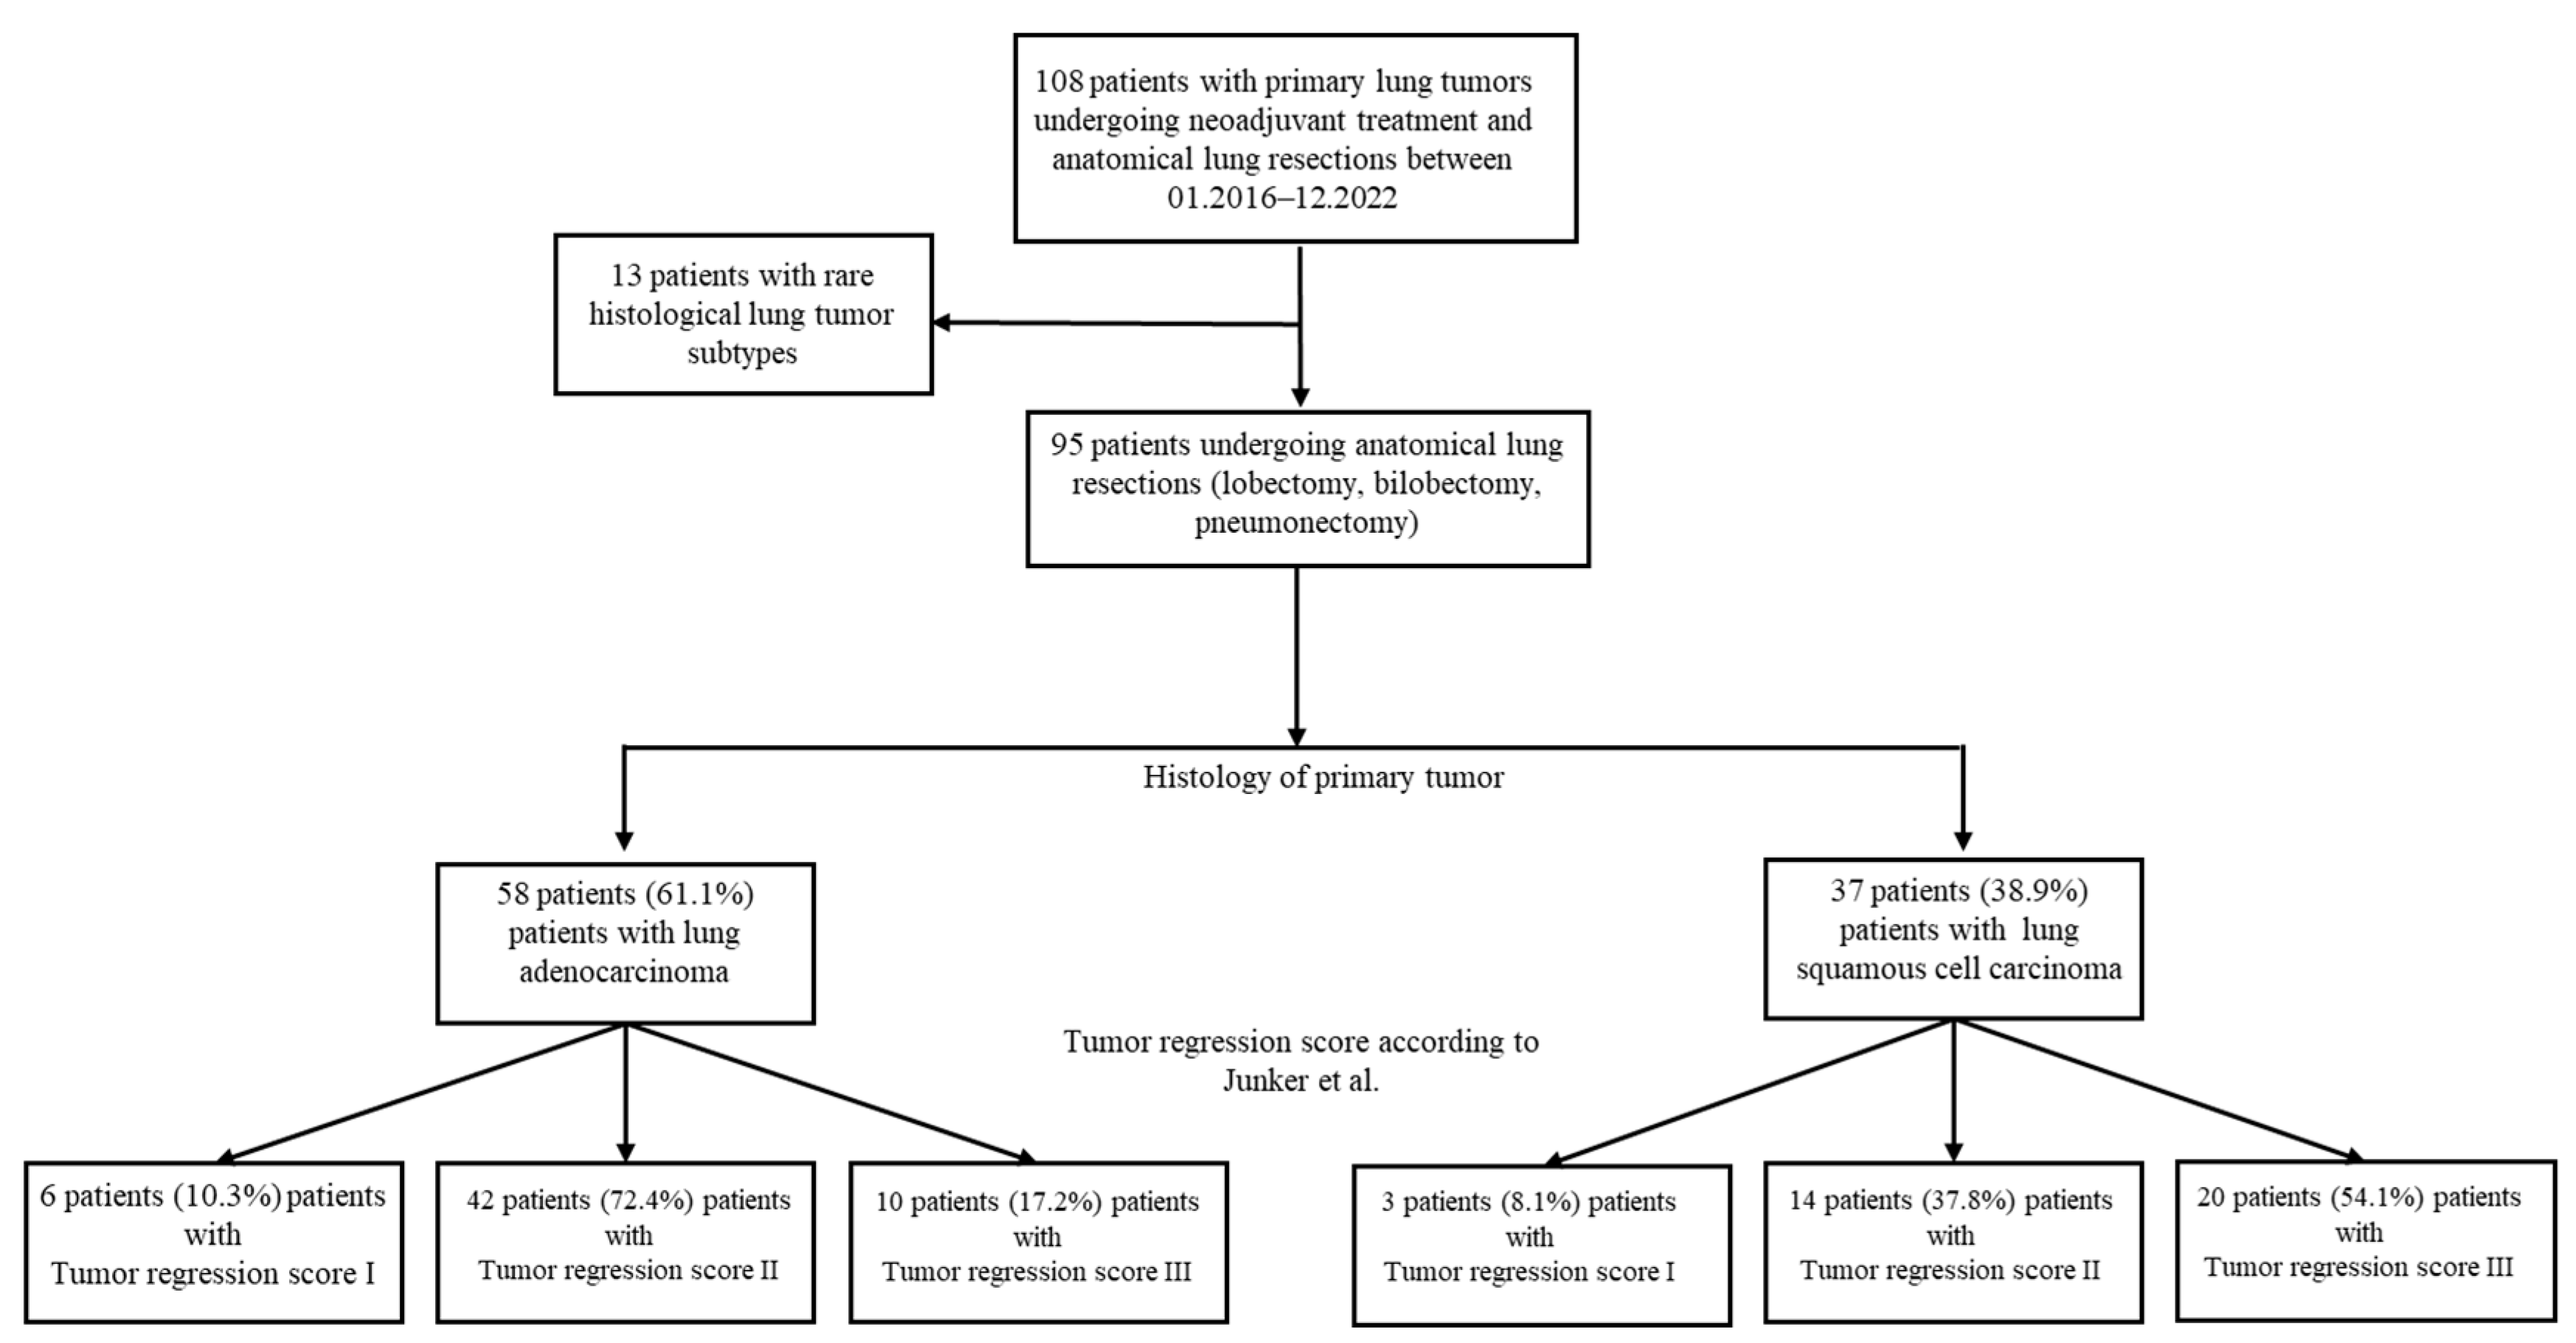
Tumor Regression Score (Junker et al) (n, %) TRG_I (> 95% vital tumor cells) TRG_IIa (> 10% vital tumor cells) TRG_IIb (< 10% vital tumor cells) TRG_III (no vital tumor cells) |
6/58 (10.3 %) 27/58 (46.6 %) 15/58 (25.9 %) 10/58 (17.2 %) |
3/37 (8.1%) 5/37 (13.5%) 9/37 (24.3%) 20/37 (54.1%) |
0.7166 0.0009 0.8664 0.0002 |
|
Tumor size in CT (median, quartiles [1st; 3rd]) (cm) Before neoadjuvant treatment After neoadjuvant treatment before surgery Delta (before-after) neoadjuvant treatment before surgery (absolute) Delta (before-after) neoadjuvant treatment before surgery (relative) Lymph node size in CT (median, quartiles [1st; 3rd]) (cm) Before neoadjuvant treatment |
3.95 [2.40; 6.68] 2.55 [1.50; 4.60] 1.15 [0.55; 2.50] 30.73 [14.95; 53.55] 1.60 [1.20; 2.03] |
5.50 [3.60; 6.35] 3.30 [1.85; 4.35] 1.70 [0.60; 3.10] 32.14 [14.17; 51.05] 1.60 [1.00; 2.20] |
0.2105 0.3758 0.4248 0.8397 0.9299 |
| Covariates for tumor regression | Exp(B) [95% CI] | P-value |
|---|---|---|
| Intraoperative histology (LUAD vs SQCA) | 6.88 [2.40-19.77] | 0.0003 |
| Lymph node size in preoperative PET > 1.7cm | 3.13 [1.11-8.83] | 0.0310 |
| Absolute Delta tumor size post neoadjuvant Therapy > 2.6cm | 3.76 [1.20-11.81] | 0.0233 |
| Covariates for tumor regression | Exp(B) [95% CI] | P-value |
|---|---|---|
| Intraoperative histology (LUAD vs SQCA) | 6.81 [2.34-19.77] | 0.0004 |
| Lymph node size in preoperative PET > 1.7cm | 3.86 [1.35-11.10] | 0.0119 |
| Relative delta (tumor size post neoadjuvant Therapy) > 30% | 4.54 [1.49-13.84] | 0.0079 |
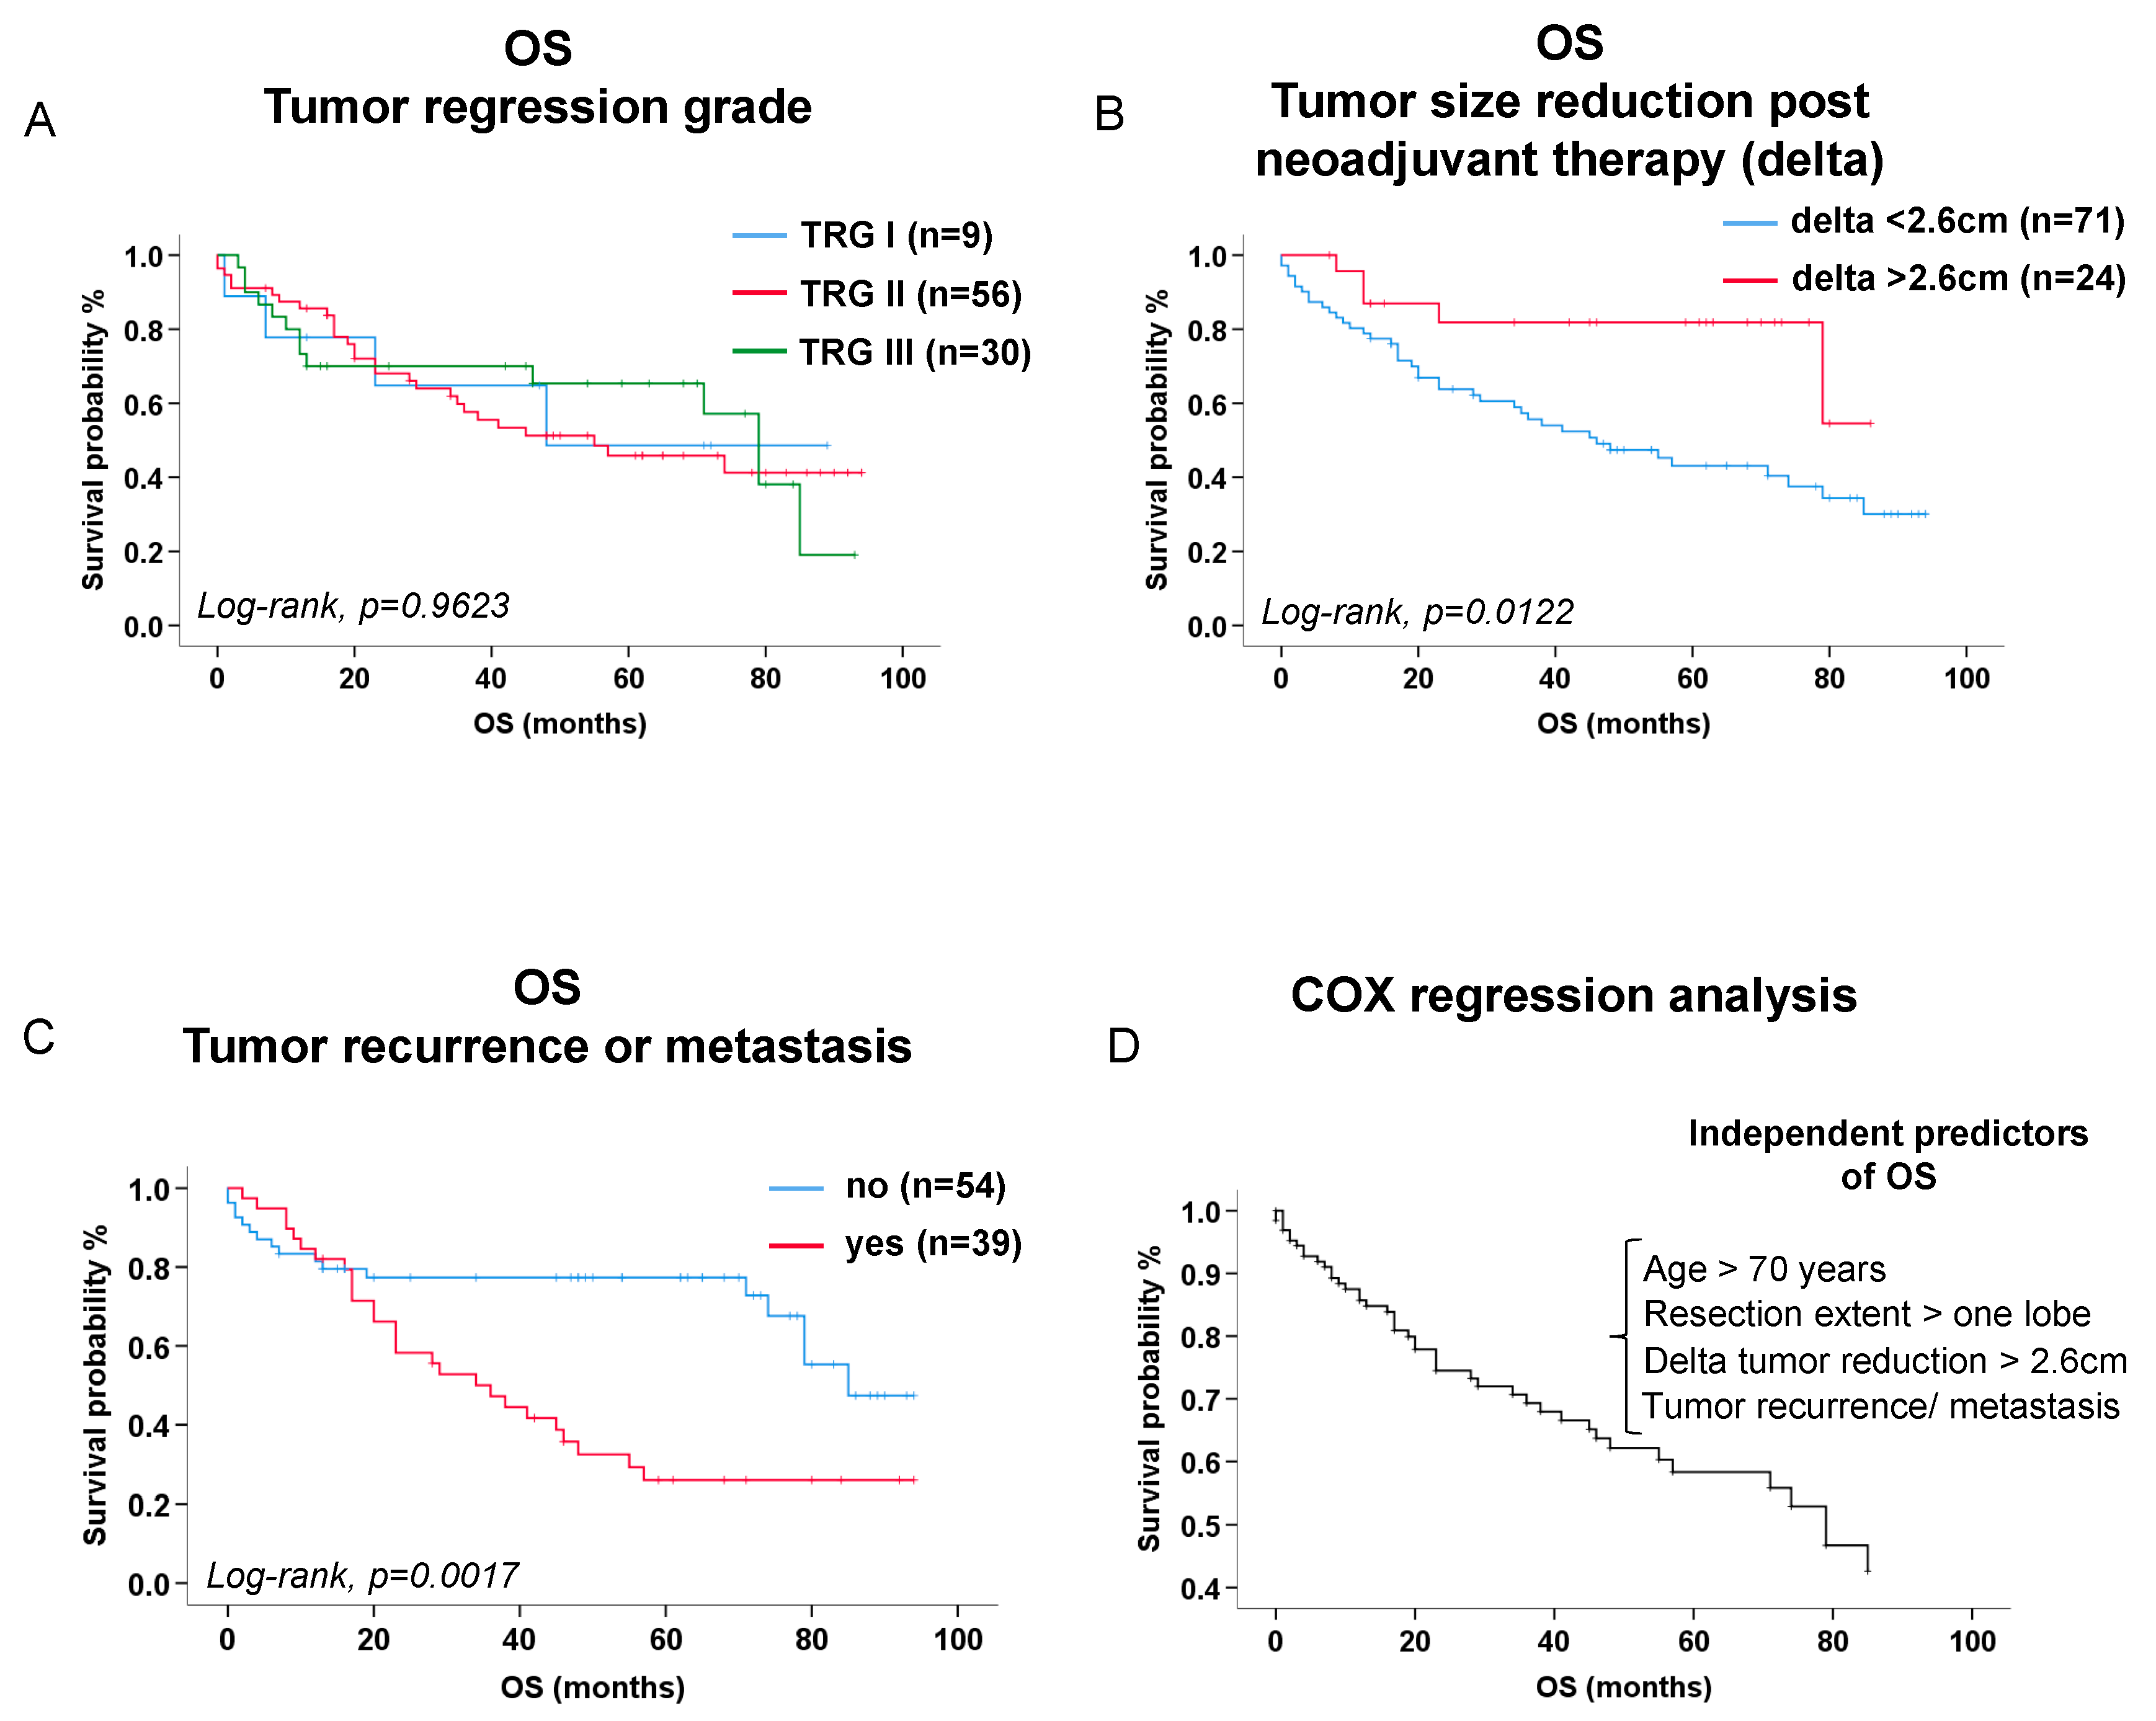
| Independent predictors of overall survival | Exp(B) [95% CI] | P-value |
|---|---|---|
| Age (>70 years) | 2.70 [1.37-5.36] | p=0.0043 |
| Extended resections (>one lobe) | 2.11 [1.10-4.08] | p=0.0257 |
| Absolute tumor size reduction >2.6 cm after neoadjuvant therapy (absolute delta) | 3.82 [1.33-10.92] | p=0.0126 |
| Tumor recurrence or metastasis during follow-up | 2.41 [1.27-4.54] | p=0.0068 |
Disclaimer/Publisher’s Note: The statements, opinions and data contained in all publications are solely those of the individual author(s) and contributor(s) and not of MDPI and/or the editor(s). MDPI and/or the editor(s) disclaim responsibility for any injury to people or property resulting from any ideas, methods, instructions or products referred to in the content. |
© 2024 by the authors. Licensee MDPI, Basel, Switzerland. This article is an open access article distributed under the terms and conditions of the Creative Commons Attribution (CC BY) license (http://creativecommons.org/licenses/by/4.0/).


