1. Introduction
Radiotherapy remains one of the main treatments for various tumors, and bone injury is a common side effect of radiotherapy. Radioactive bone injuries present as pathological fractures, deformities, or even osteonecrosis. The probability of pathological fracture increased by 2%~6% after pelvic tissue irradiation (Baxter et al., 2005). The main cause of the symptoms of bone damage is osteopenia, including decreased bone mineral density and decreased osteocalcin. Clinical data suggested that ionizing radiation (IR) led to a decrease of 8~23% in bone tissue (Hopewell, 2003). Tumor invasion and pathological fractures caused by radiotherapy seriously affect the quality of life of patients after treatment.
IR directly and indirectly causes tissue and organ damage during medical diagnosis and treatment (Soriano et al., 2019). High-energy rays act on living organisms, excessive reactive oxygen species (ROS) was produced by ionization of oxygen molecules and water molecules and resulted to oxidative stress chain reaction, and caused damage to neighboring cells and tissues through certain signaling pathways. Random reactions of biological molecules, including DNA and protein (Shim et al., 2013), of which DNA is the target molecule of IR, the injury-induced DNA damage response (DDR) activates several closely related signal transduction pathways, and these pathways form a tight response mechanism, including cell cycle checkpoints (Santivasi et al., 2014) and cell apoptosis (Lee et al., 2021), and then causes a series of biological effects. Data from both in vitro and in vivo studies suggested that IR can affect bone formation by killing or damaging osteoblasts and reduced bone density which is thought to be the long-term responses after damage to osteoblasts, especially reducing osteoblast proliferation and differentiation (Zhang et al., 2018).
Currently, there are few studies on radiation-induced bone injury, the molecular mechanisms by which ionizing radiation affects the differentiation and function of osteoblast cells remain unknown. Therefore, this study aims to establish a radiation induced osteoblast injury model, to screen and identify relevant factors involved in radiation injury of osteoblast through RNA-seq, so as to provide basic data for the protection and repair of radioactive bone injury.
2. Materials and methods
2.1. Cell Culture and Osteoblast Differentiation Induction
The osteoblasts MC3T3-E1 cells were purchased from Hycyte biology (China) and were cultured in a complete medium containing α-minimum essential medium (α-MEM, Gibco, USA), fetal bovine serum (FBS, Gibco, USA), and 1% penicillin/streptomycin (p/s, Solarbio) at 37°C in a humidified atmosphere of 5% CO2. The osteoblast differentiation medium contained 10 mM β-glycerophosphate (Sigma, USA), 50 μg/mL ascorbic acid (Sigma, USA), 10 nmol dexamethasone (Sigma, USA), 10% FBS, and 1% p/s in an α-MEM medium.
2.2. CCK-8 Assay
CCK-8 kit (Saintbio, China) was used to detect cell proliferation. MC3T3-E1 cells (5×10³ cells/well) were seeded in 96-well plates in quintuplicate with a complete medium. Subsequently, a total dose of 0, 2, 4, 6, 8 Gy (2.22 Gy/min) X ray radiation were administered to cells using PXI X-RAD (American). 24, 48, 72 h after radiation, the cells were incubated with 10 μL CCK-8 reagent to assess cell viability using absorbance detected by a microplate reader (BioTek, USA) at 450 nm wavelength.
2.3. Clonogenic Assay
Clonogenic formation assay was performed after X ray radiation of gradient dose to evaluate the proliferative ability of MC3T3-E1 cells. MC3T3-E1 cells (800 cells/well) in logarithmic growth phase were cultured in 6-well plates with a complete medium for 24h. Cultured another 10 days after X-ray radiation of 0, 2, 4, 6, 8Gy, cells were fixed with crystal violet and colonies were counted.
2.4. Cell Cycle Assay
MC3T3-E1 cells (5×10⁵ cells/well) were seeded in 6-well plates in quintuplicate with a complete medium for 24h. After treated with gradient dose X-ray radiation, cells were digested with 0.25% Trypsin Then, the cells were added anhydrous ethanol to fix for two hours at 4℃, followed by the incubation of propidium lodide (PI) in a dark environment at room temperature for 30min to detect the distribution of cell cycle using flow cytometry.
2.5. Cell Apoptosis Assay
Cell culture and preliminary treatment methods as described above. After multiple washing and centrifugation of cells, cells were dissolved in binding buffer. Then, cells were incubated with propidium lodide (PI) and Annexinv-FITC for 15min respectively following by the manufacturer’s instructions of Annexin V-FITC/PI Apoptosis Kit in dark environment. Finally, these already processed cells were detect by flow cytometry to analyze the apoptosis of cells.
2.6. Alkaline Phosphatase (ALP) Staining and Quantification
Alkaline phosphatase staining was used to evaluate the mineralization capacity and transformation degree of MC3T3-E1 cells. MC3T3-E1 cells (5×10⁵ cells/well) were cultured in 6-well plates overnight. After X-ray radiation of 0, 2, 4, 6, 8 Gy doses, cells were cultured with the osteoblast differentiation medium in equal volume for 7 days and changed culture medium every 2 days. Differentiated osteoblasts were fixed with 4% polyoxymethylene for 15 min, then incubated in dark at room temperature for 3 h with a mixture of 5-bromo-4-chloro-3-indolyl-phosphate (BCIP) and nitro-blue tetrazolium (NBT) reagents (Beyotime, China) and the stained osteoblasts cells was observed and photographed by microscope.
ALP activity assay kit (Beyotime, China) and BCA protein assay kit (Beyotime, China) was used to quantitatively analyze the activity of ALP. Differentiated osteoblasts were lysised and the ALP activity and protein content was assessed using a microplate reader (BioTek, USA) at wavelengths of 520 and 595 nm, respectively, the ralative activaty of ALP was adjusted by the protein concentration. Data analysis was conducted by GraphPad Prism 8.0 (San Diego, USA).
2.7. Alizarin Red Staining (ARS)
Alizarin red S (Sigma, USA) was used to determined extracellular matrix mineralization capacity of MC3T3-E1 cells by detecting formed mineralized nodes which were chelated with calcium ions. MC3T3-E1 cells (5×10⁵ cells/well) were seeded in 6-well plates in quintuplicate with a complete medium overnight. 80% confluenced cells were administered to a total dose of 0, 2, 4, 6, 8 Gy (2.22 Gy/min) X ray radiation and cultured for 21 days with the osteoblast differentiation medium. The osteoblast cells were fixed with 4% paraformaldehyde for 15 min, followed by the staining of 500 μL of 1% ARS (pH 4.2) solution for 30 min. Finally, the stained osteoblasts cells was observed and photographed by microscope. After that, these stained calcium nodules of osteoblasts cells were incubated with 10% cetylpyridinium chloride (Sigma, USA) and quantization by the absorbance at 562nm wavelength through a microplate reader (BioTek, USA).
2.7. Immunofluorescence (IF)
Immunofluorescence of γ-H2AX and 53BP1 was used to detect DNA damage and repair reaction. MC3T3-E1 cells were cultured on Lab-Tek culture slides in 6-well plates in a complete medium. Before immunostaining , cells were administered with a total dose of 0, 2, 4, 6, 8 Gy (2.22 Gy/min) X ray radiation. 3h after radiation, cells were fixed and permeabilized with 4% paraformaldehyde and 0.5% TritonX-100 for 15min and blocked in 5% BSA for 1h at 37℃. The γ-H2AX was detected by mouse anti-γH2AX monoclonal antibody (CST, USA) and 53BP1 was detected by rabbit anti-53BP1 monoclonal antibody (CST, USA) at 4℃ for one night. Subsequently, cells were incubated with FITC-conjugated goat anti-mouse secondary antibody and rhodamine-conjugated goat anti-rabbit secondary antibody for 1h at room temperature away from light. The cell nuclear was counterstained with DAPI for 20min. The images was observed under a Fluorescence Microscope.
2.8. Quantitative Real-Time PCR Analysis (RT-qPCR)
After functionally graded radiation, MC3T3-E1 cells were lysed using TRIzol reagent (Invitrogen, USA), the total RNA was extracted by chloroform and isopropanol. After washed by 75% ethanol, total RNA was dissolved in RNase-Free water up to 20μL,the concentration of RNA was determined by microplate reader (BioTek, USA) using absorbance wavelength at 260nm. The reverse transcriptional reaction and construction of real-time PCR system were performed by Evo M-MLV RT Mix Kit (Takara, Japan) with gDNA clean for RT-qPCR following the manufacturer’s instructions. The primer sequences used in this experiment are shown in
Table 1.
The RT-qPCR reaction steps were contained 1 cycle of 95℃ for 3 min, 40 cycles of 95℃ for 15 sec and 59℃ for 10 sec. β-actin was used as internal control gene and the relative expression levels of interested genes were calculated by the 2− ΔΔCT method.
2.9. Western Blot Analysis
All of the irradiated cell samples were extracted using Western and IP Cell lysis Buffer containing 1% protease inhibitor and phosphatase inhibitor to get total protein. In order to evaluate the levels of differentially expressied proteins, western blot was used to separate extracted total proteins by 8% sodium dodecyl sulfate-polyacrylamide gel electrophoresis (SDS-PAGE). PVDF membrane was used to transfer the separated proteins after protein gel electrophoresis and it was blocked by 10% nonfat milk powder in TBST for 1h. The membrane was incubated overnight at 4℃by primary antibodies specific to Phosphorylated-AKT (Proteintech, China), Phosphorylated-ERK1/2 (Proteintech, China), CyclinB (HUABIO, China), BAX (HUABIO, China), BCL2 (HUABIO, China), OPN (Wanleibio, China), RUNX2 (Wanleibio, China), Collagen1(Proteintech China), Cdkn1α(Abways, China), MDM2 (Proteintech China), GCLC(Abways, China), NOTCH1(Abways, China), STAG1 (UpingBio, China), β-actin (BBI, China) and HRP-conjugated secondary antibody (BBI, China) for 1h at room temperature. The aimed protein signals were detected and captured by ChemiDoc-It610 Imaging System (America, UVP) using high sensitivity ECL Kit (Beyotime, China). Quantitative analysis of grayscale values was performed by GenoSens Analysis (Clinx Science Instruments, China), and β-actin was used as control.
2.10. RNA Sequencing and Bioinformatics Analysis
This section of RNA sequencing data was provided by BGI·Tech(China,Shenzhen) and the specific steps are as follows. The group of 8Gy X-ray radiation and control group were set up with three samples in each group. Total RNA was purified by RNeasy spin column with 500 μL Buffer PRE for three times, purified RNA was dissolved in 35 μL RNase-free water and collected. Took small volume of RNA sample and added Oligo-dT Primer, performed RNA denaturation using Instrument for PCR. SMART amplification was used to synthesize cDNA and performed a quality control of cDNA enriched in reverse transcription reaction to construct a RNA-Seq library. Subsequently, cDNA of PCR products were denatured into single strand and obtained single stranded circular DNA through DNA cyclization reaction. Single stranded circular DNA molecules were replicated to form a DNA nanosphere (DNB) containing multiple copies. The obtained DNBs would be added to DNA microarray chip to perform sequencing through Combinatorial Probe-Anchor Synthesis (cPAS). The raw data obtained from sequencing was removed low-quality reads using SOAPnuke (v1.5.6), followed by Dr.Tom (
https://biosys.bgi.com) to perform differential expression gene analysis, pathway and gene functional annotation, visualization of identified genes through bioinformatics analysis.
2.11. Statistical Analysis
All statistical analyses were performed by GraphPad Prism 8.0 software (San Diego, USA), and the data were presented as mean ± standard error. Differences were compared using unpaired Student’s t-tests for two groups or one-way ANOVA for multiple groups. P-value < 0.05 was considered statistically significant. (∗P < 0.05; ∗∗P < 0.01).
3. Results
3.1. The Effect of the Radiation on the Proliferation of the MC3T3-E1 Cells
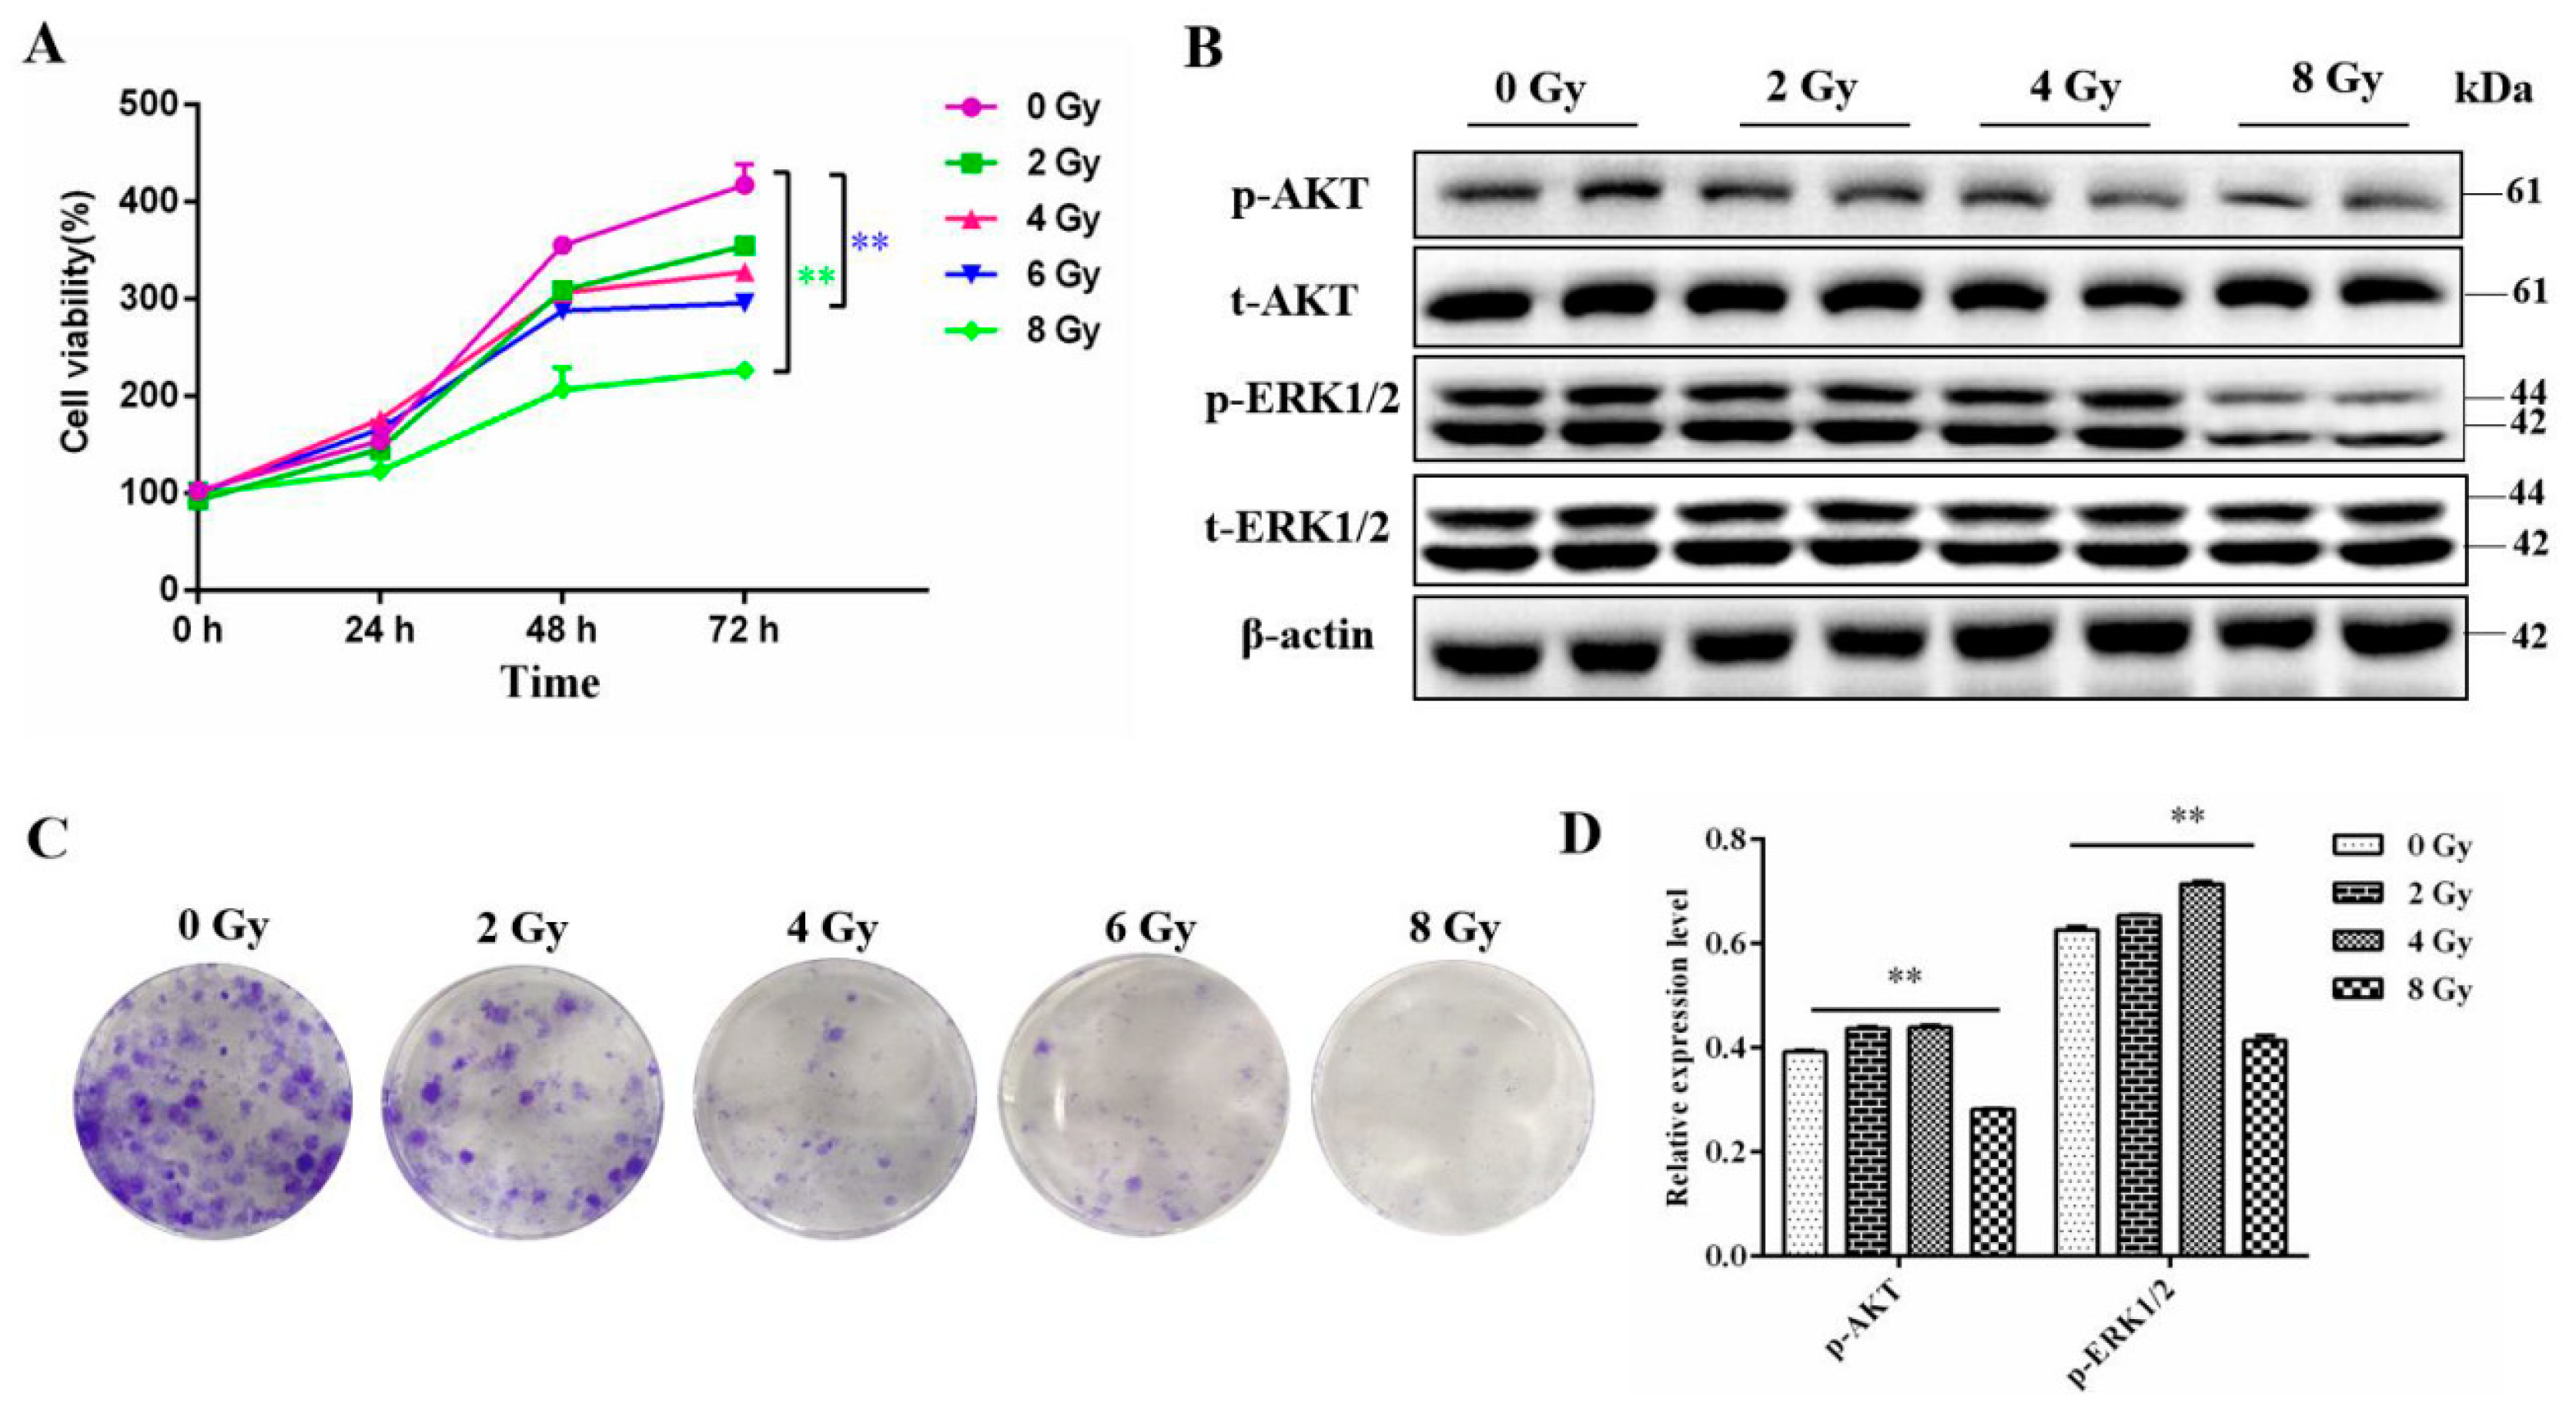
We first measured the proliferation ability of MC3T3-E1 cells after gradient dose irradiation using cck-8 assay. The results showed that the proliferation ability of cells was markely inhibited after 6 Gy or 8 Gy (
P<0.01) irradiation and the most significant decrease was observed in 72 h (
Figure 1A). Similarly, the clonogenic formation assay also showed that as the radiation dose increased, the proliferation ability of MC3T3-E1 cells gradually decreased (
Figure 1B). Meanwhile, available data had reported that PI3K-AKT and ERK signaling pathways have the function to pro-proliferation of osteoblasts (Zhang etal., 2022; Wang et al., 2021). Western Blot analysis shown that the expression level of phosphorylated AKT and ERK proteins were significantly downregulated after 8 Gy radiation (
Figure 1C,D).
3.2. The Effect of the Radiation on the Cell Cycle of the MC3T3-E1 Cells
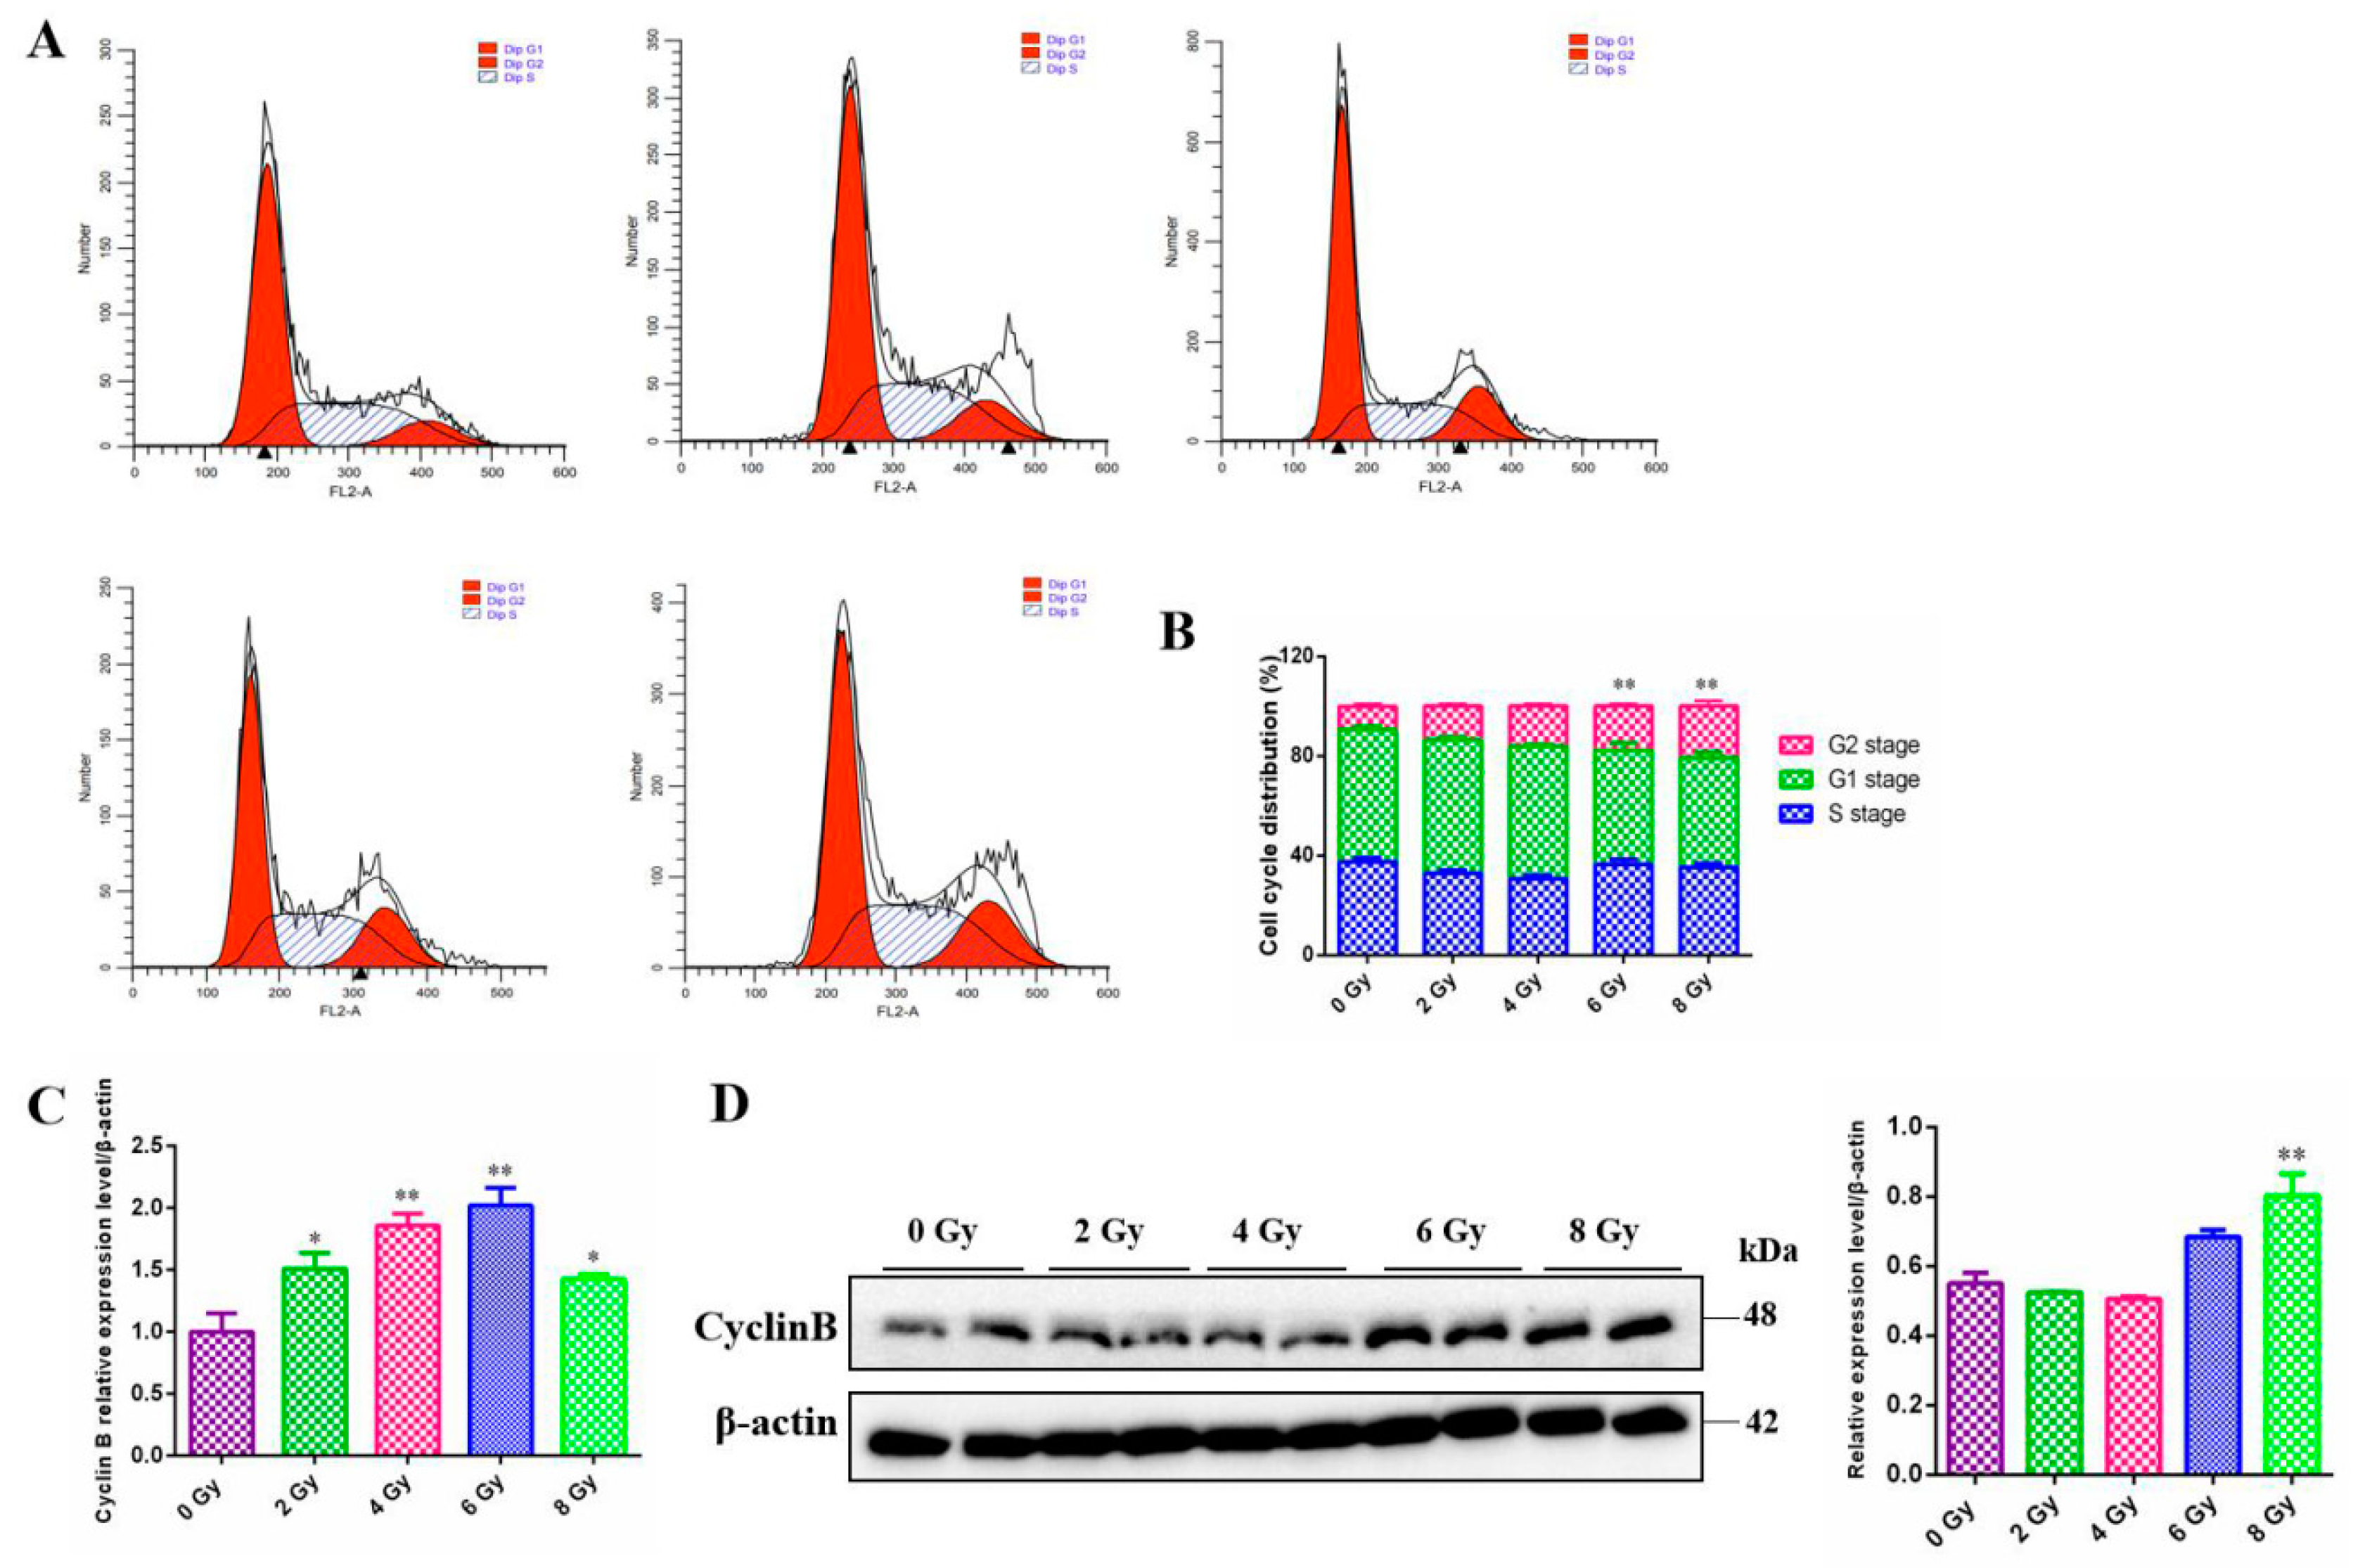
The majority of experiments have shown that irradiation lead to cell cycle modification, finally resulting in division delay of mitosis progress in a dose-dependent manner. However, the form of cell cycle arrest varies between cells. Thus, the cell-cycle distribution of MC3T3-E1 cells exposed to radiation was examined by means of flow cytometry. There was an significant increase in the proportion of MC3T3-E1 cells in the G2 phase after the 6 Gy or 8 Gy irradiation compared to the 0 Gy group (
P<0.01) , while the cells in G1 and S phase did not change significantly (
Figure 2A,B). To confirm the G2/M phase arrest had occurred, we further monitored the G2/M checkpoint-associated protein and found that there existed an enhancement of cyclin B expression at certain dose both at mRNA (
P<0.05) (
Figure 2C) and protein levels compared to the 0 Gy group (
P<0.05) (
Figure 2D ).
3.3. The Effect of the Radiation on the Cell Apoptosis of the MC3T3-E1 Cells
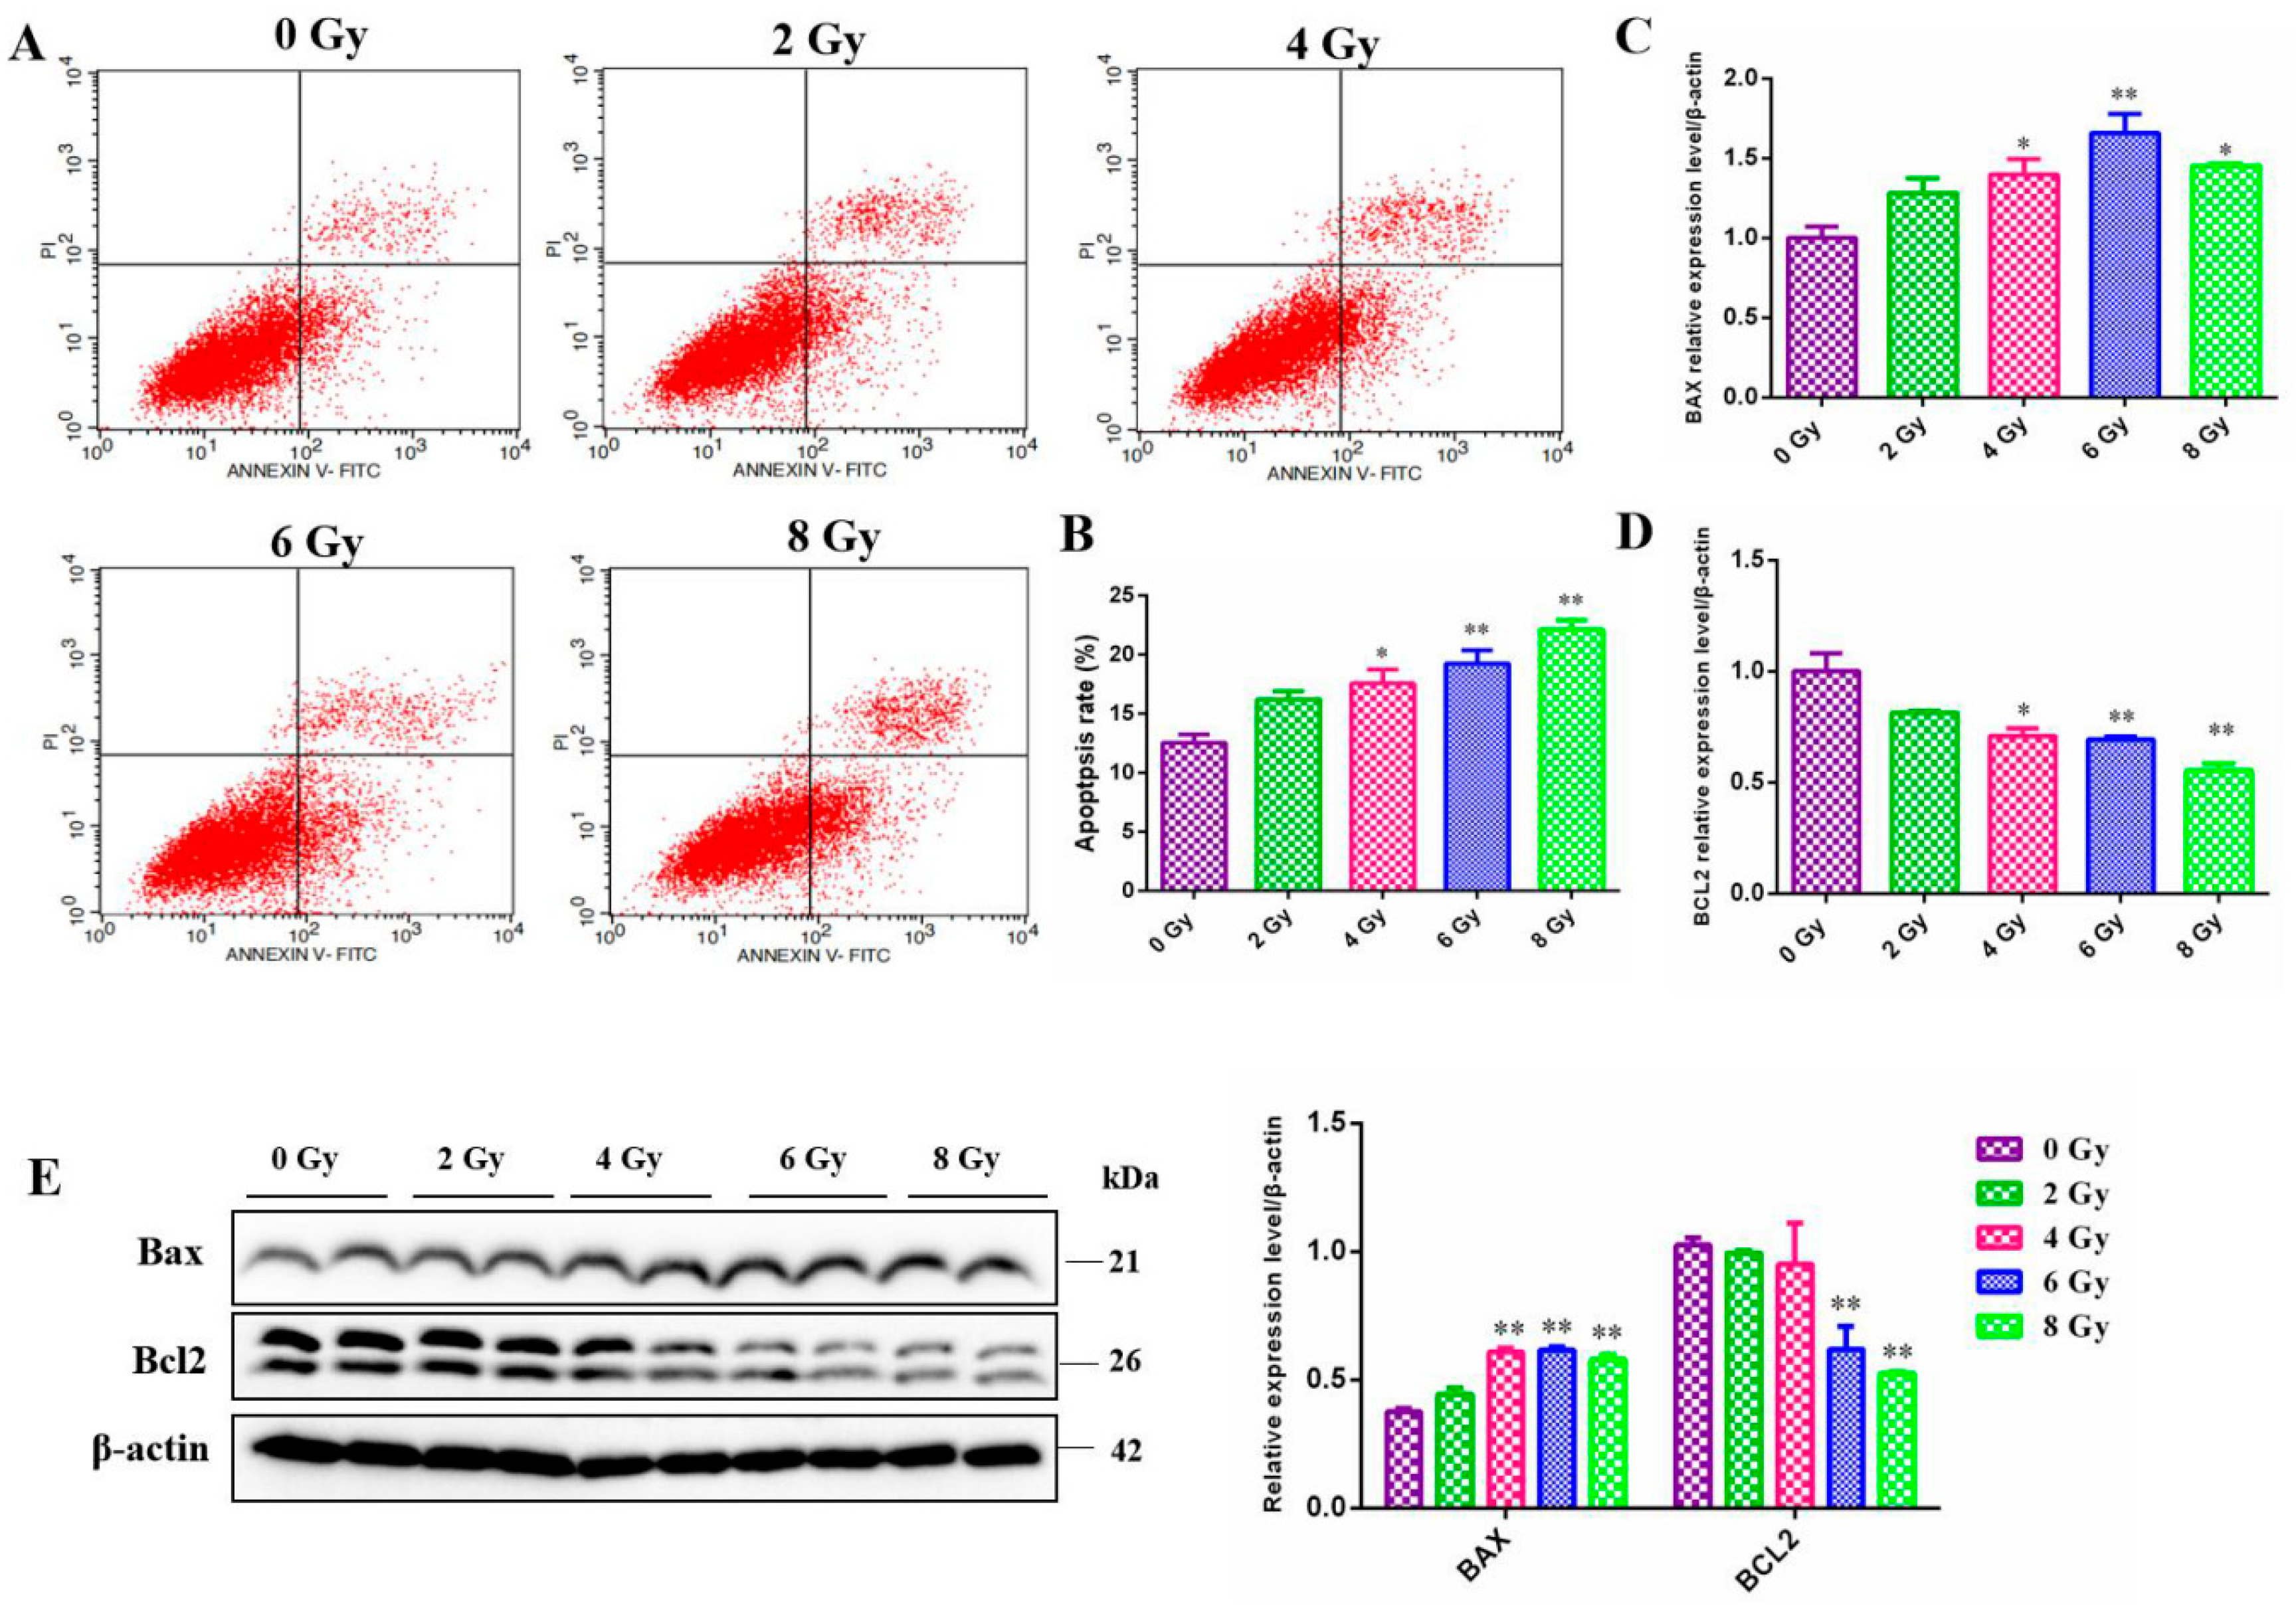
Apoptosis is an actively genetically-directed programmed cell death process. It is initiated by certain signals that govern the removal of dying or harmful cells and apoptosis-associated genes are expressed in an orderly manner during this process. In our experiments, we analyzed irradiated MC3T3-E1 cells using flow cytometry to determine the relationship between apoptosis and irradiation dose. As expected, radiation exposed to MC3T3-E1 cells led to a gradual increase of the ratio of apoptotic cells in a dose-dependent manner (
Figure 3A,B). This is fundamentally the same apoptosis state as that exhibited by other cells we have previously studied. After that, we also found that ionizing radiation significantly promoted the expression of intracellular pro-apoptosis proteins Bax (
P<0.05) (
Figure 3C,E) and decreased the expression of apoptosis-inhibited gene BCL2 (
P<0.05) (
Figure 3C,E) as determined by RT-qPCR and western blot analysis.
3.4. The Effect of the Radiation on the Cell Development of the MC3T3-E1 Cells
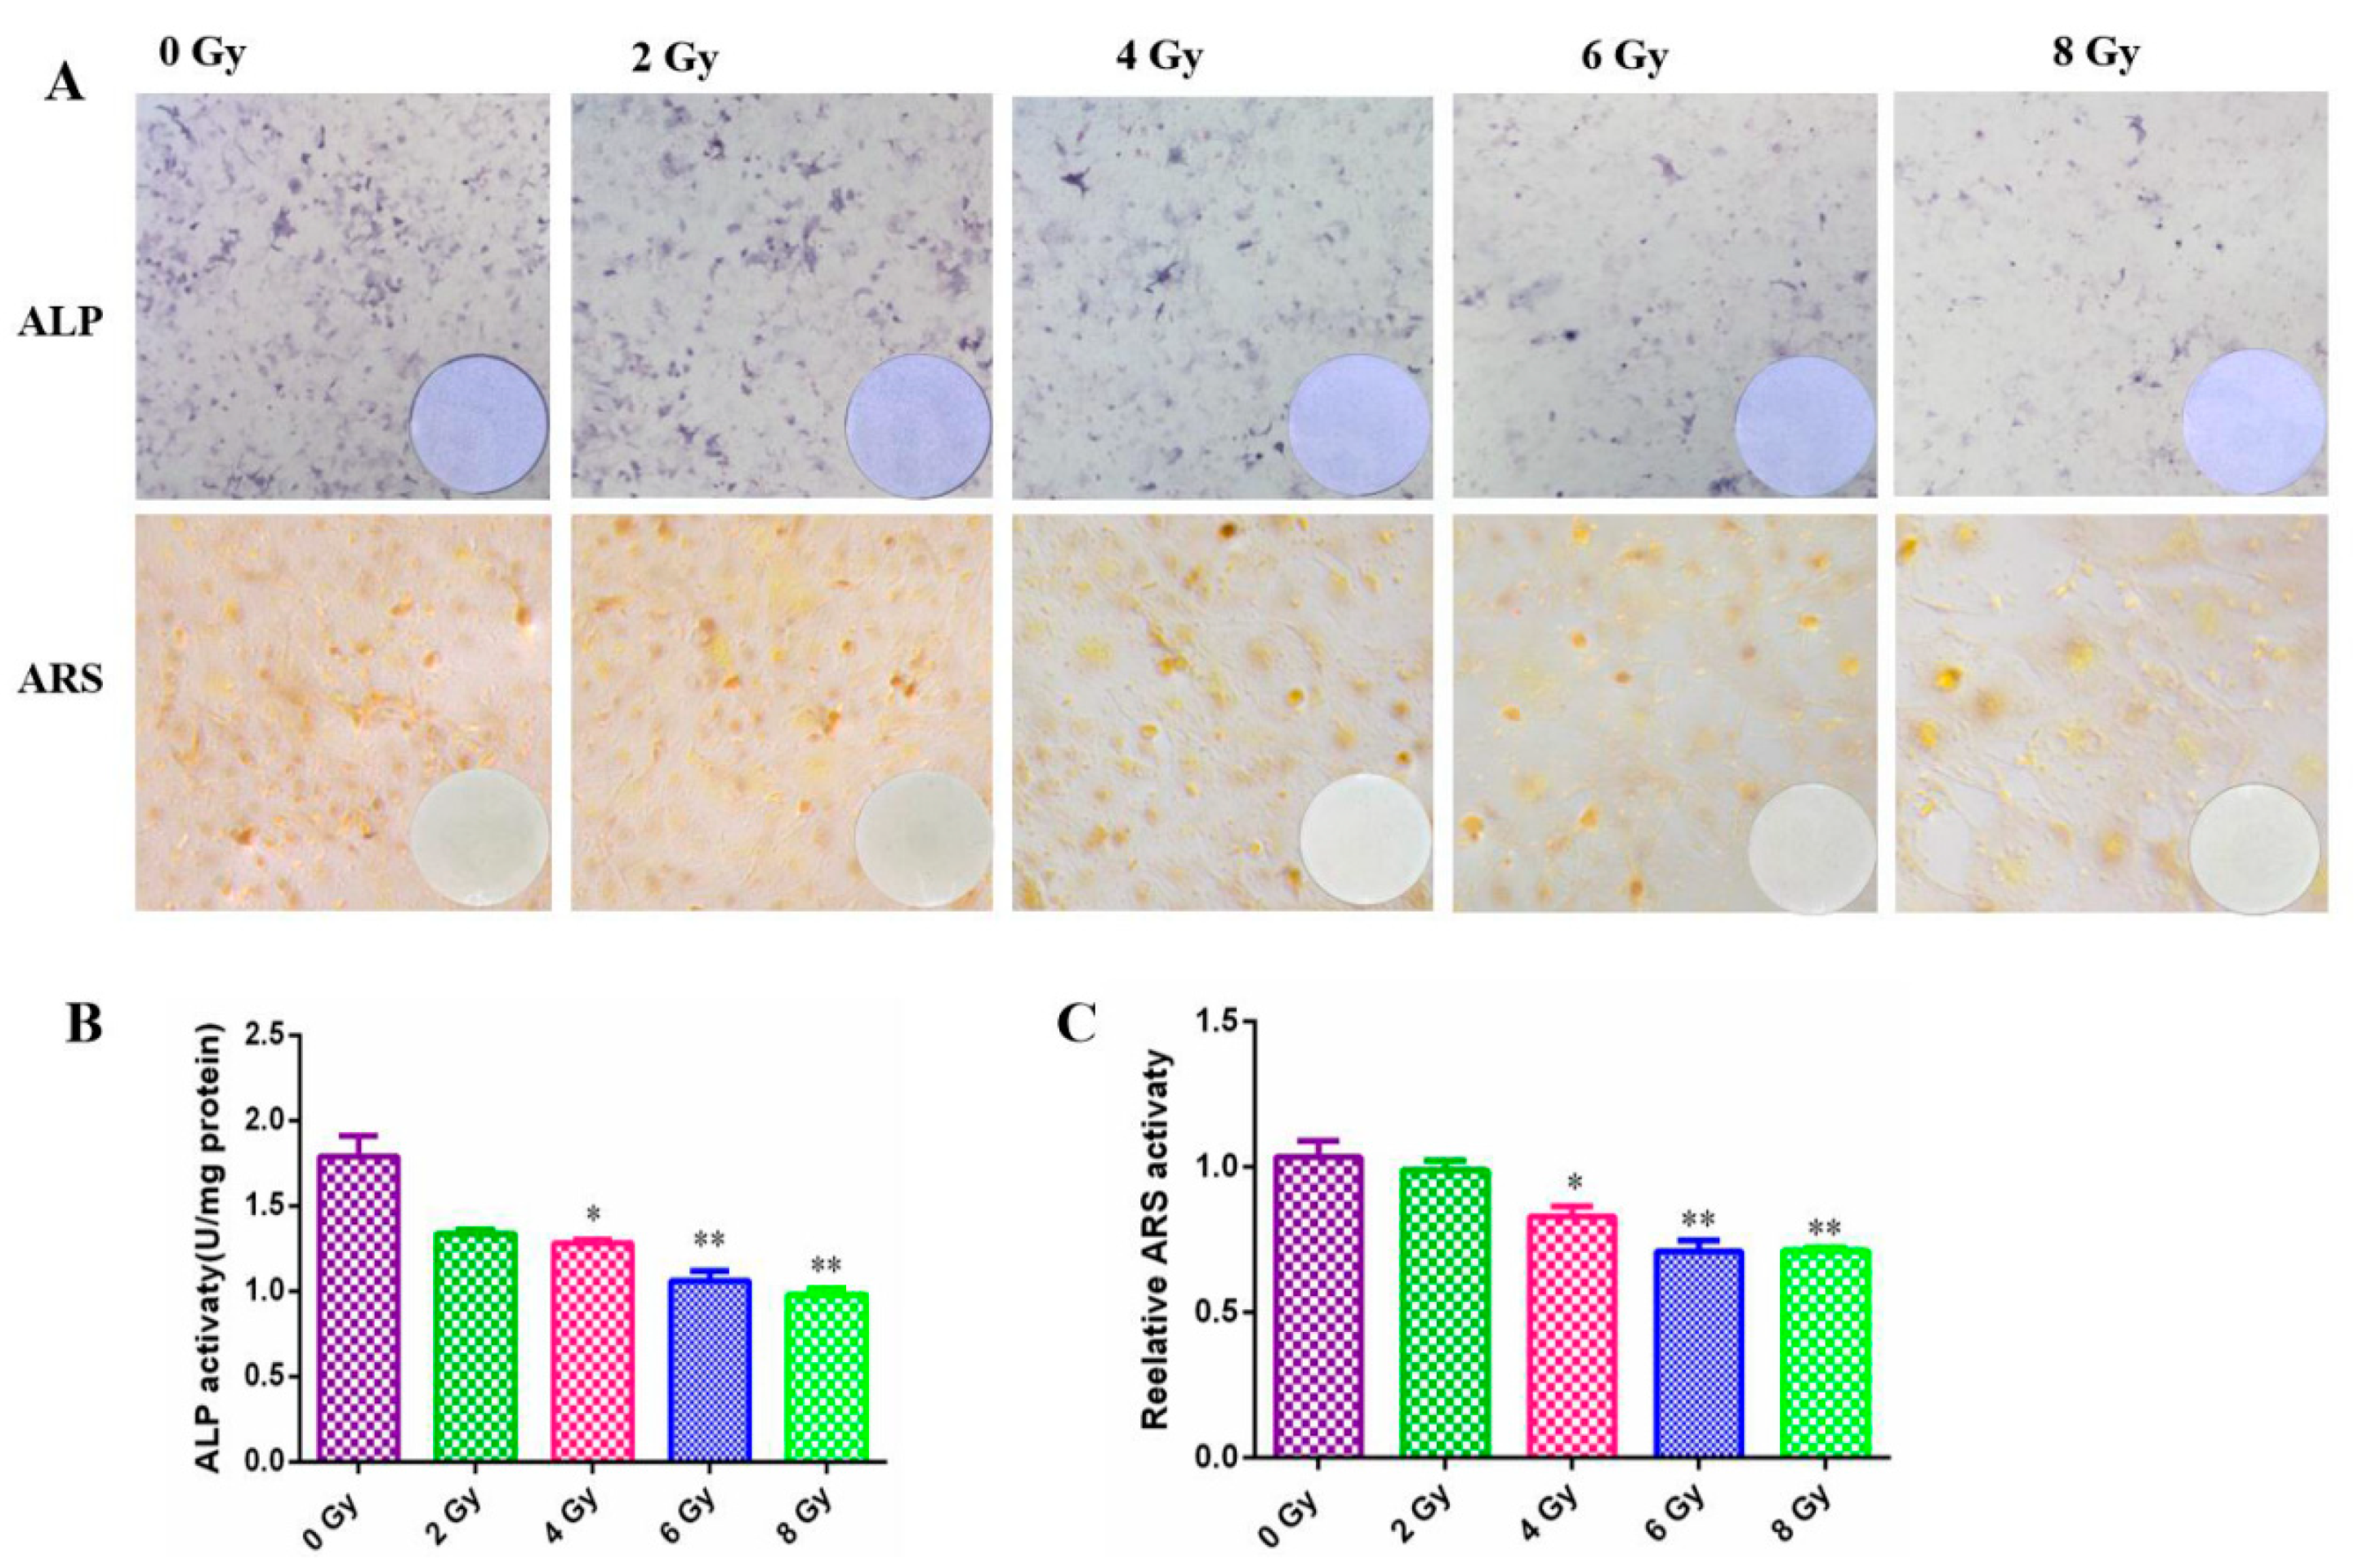
Osteoblasts are the main functional cells for bone formation, responsible for the synthesis, secretion, and mineralization of bone matrix. Osteoblasts are rich in ALP, which can reflect the differentiation ability of MC3T3-E1 cells. In irradiated cells, the ranges stained with ALP were clearly reduced in a dose-dependent manner (
Figure 4A) and it was found that the degree of reduction after high dose radiation was extremely significant through statistical analysis (
P<0.05) (
Figure 4B). The number of mineralization nodes chelated with calcium ion after ARS staining which reflected the mineralization ability of MC3T3-E1 cells was apparently reduced after gradient dose irradiation (
Figure 4A), which also confirmed by the quantization analysis (
Figure 4C).
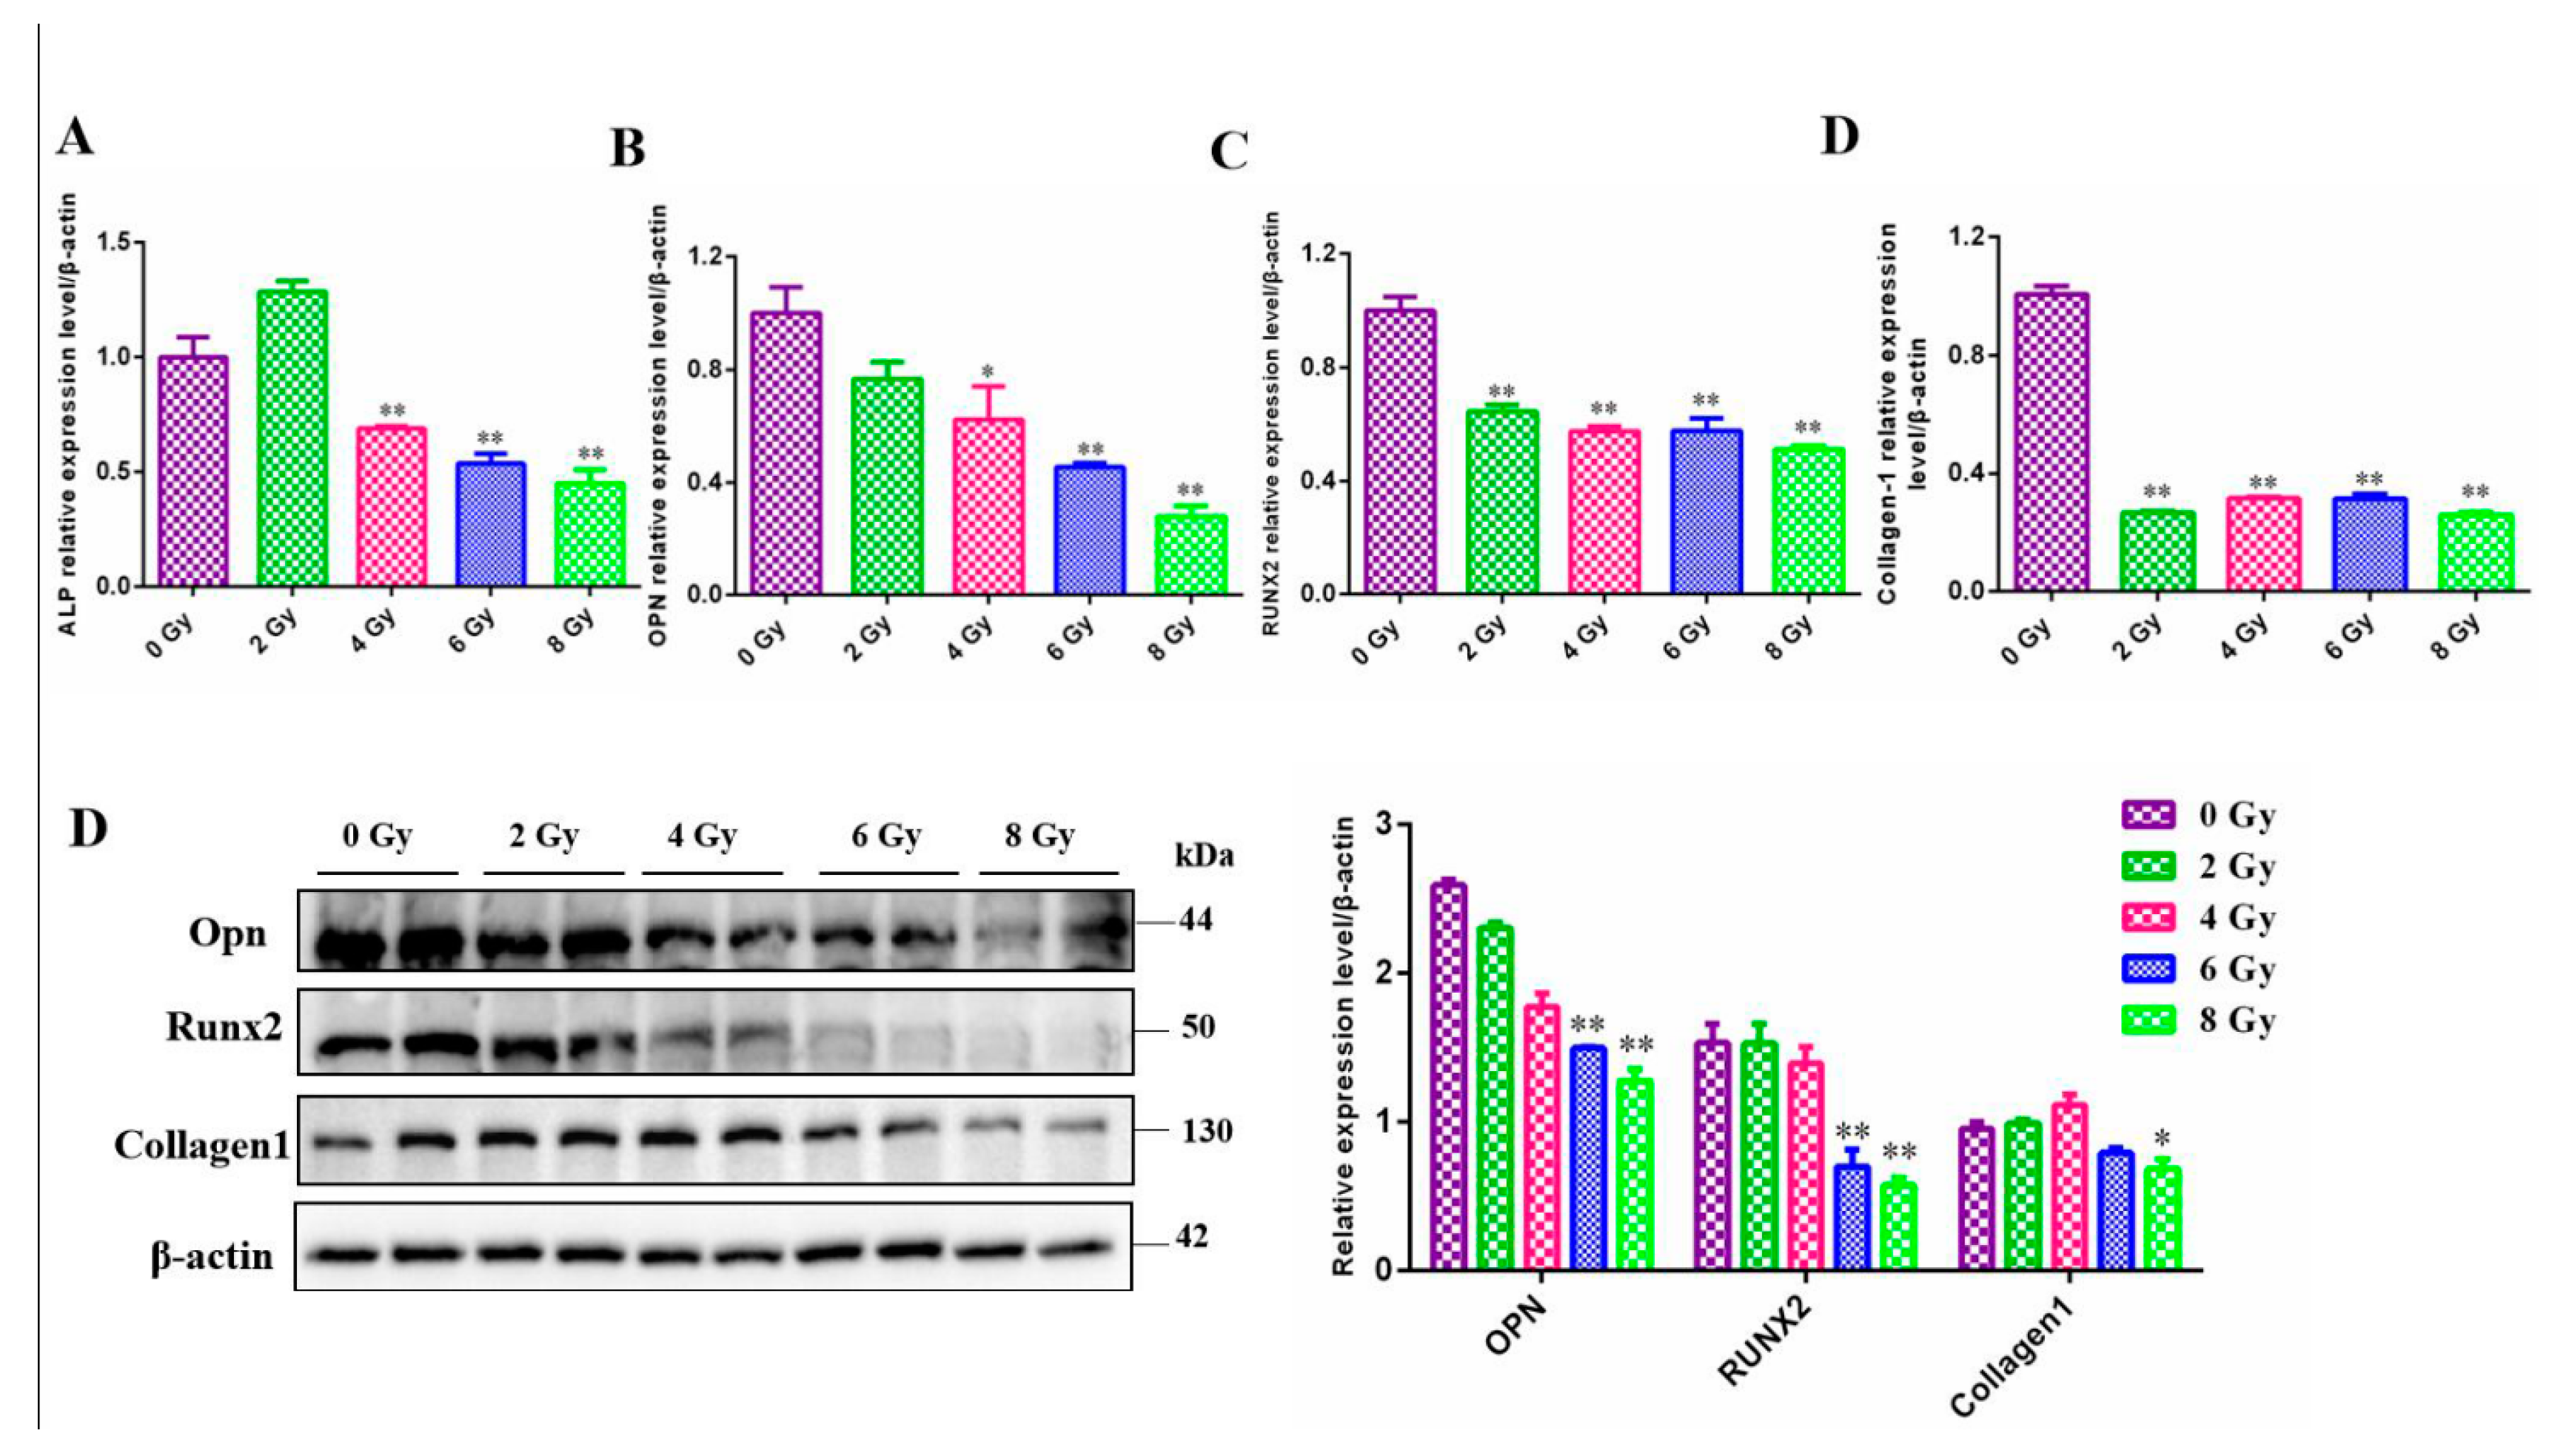
To conduct further research on the development of MC3T3-E1 cells after radiation, we detected the mRNA or protein expression levels of 4 common intracellular factors that were thought to be associated with osteoblast differentiation and mineralization. Consistent with the result of ALP staining, intracellular ALP was also reduced at the transcriptional level. In parallel, the genes Runx2, Opn, Collagen1 affecting the development of MC3T3-E1 cells, whether at the protein levels or at the mRNA levels were decreased significantly after exposure to ionizing radiation(
Figure 5) (
P<0.05).
3.5. Screening of the Potentials Molecules Involved in the Radiation Induced Osteoblast Damage
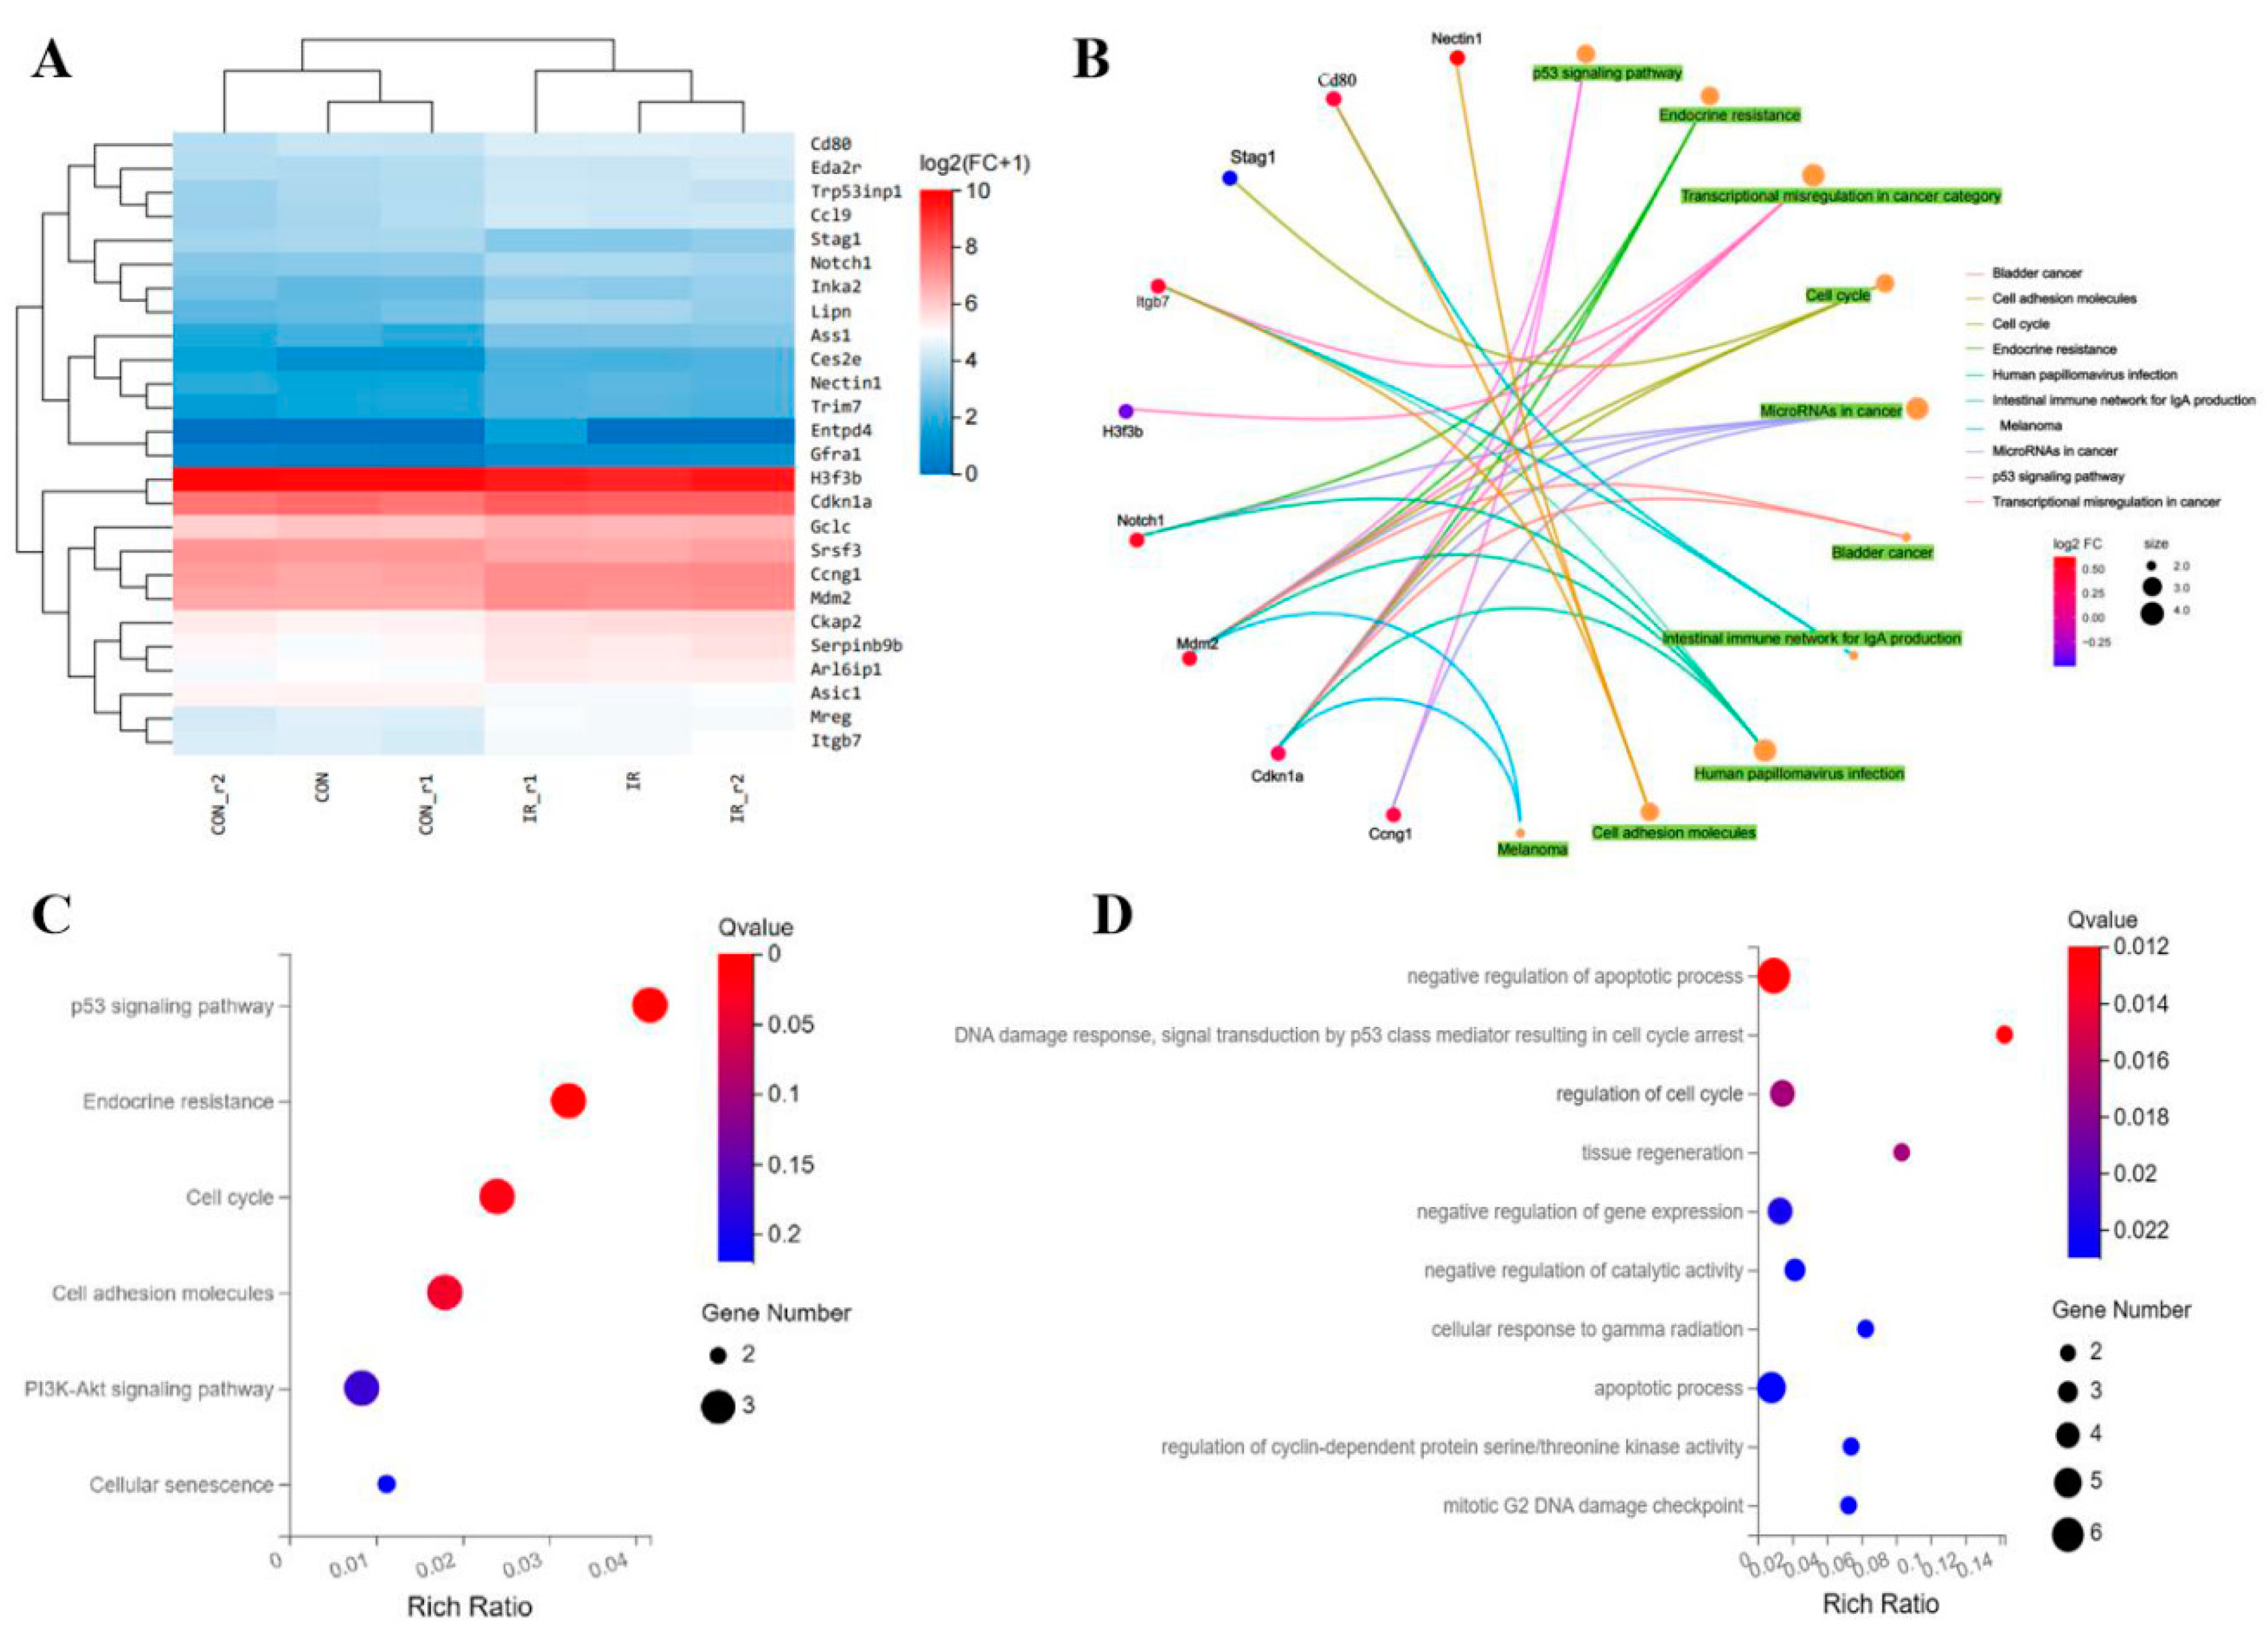
The RNA sequencing based on high-throughtput technology was used to obtain a whole mRNA expression information after treated by 8Gy radiation on MC3T3-E1 cells. According to the sequencing results of BGI·Tech, we identified 26 differentially expressed genes in MC3T3-E1 cells after 8Gy radiation. Among these genes, 22 genes were upregulated while 4 genes were downregulated (
Figure 6A). The differentially expressed genes were performed GO category analysis of Biological Progress (BP) and indicated that the differentially expressed genes were mainly involved in DNA damage reaction and repair, apoptotic progress and cell cycle regulation, especially G
2/M arrest (
Figure 6C). Meanwhile, we further used the different expressed genes to enrich the KEGG pathways. The results of identified KEGG pathways indicated that these genes were participated in several main pathway including PI3K-AKT signaling pathway, p53 signaling pathway and signaling pathway involved in cell cycle and cell senescence (
Figure 6D). Then, we displayed the signaling pathways enriched by some major differentially expressed genes through KEGG CENT plots, these genes of
MDM2, NOTCH1, CDKN1A, CCNG,
ITGB7 had performed most of biological functions (
Figure 6B). These annotation information provided a quantity of reference to understand the latent molecules and potential signaling pathways involved in osteoblast damage after radiation.
3.6. Validation of Potentials Molecules Involved in the Radiation Induced Osteoblast Damage
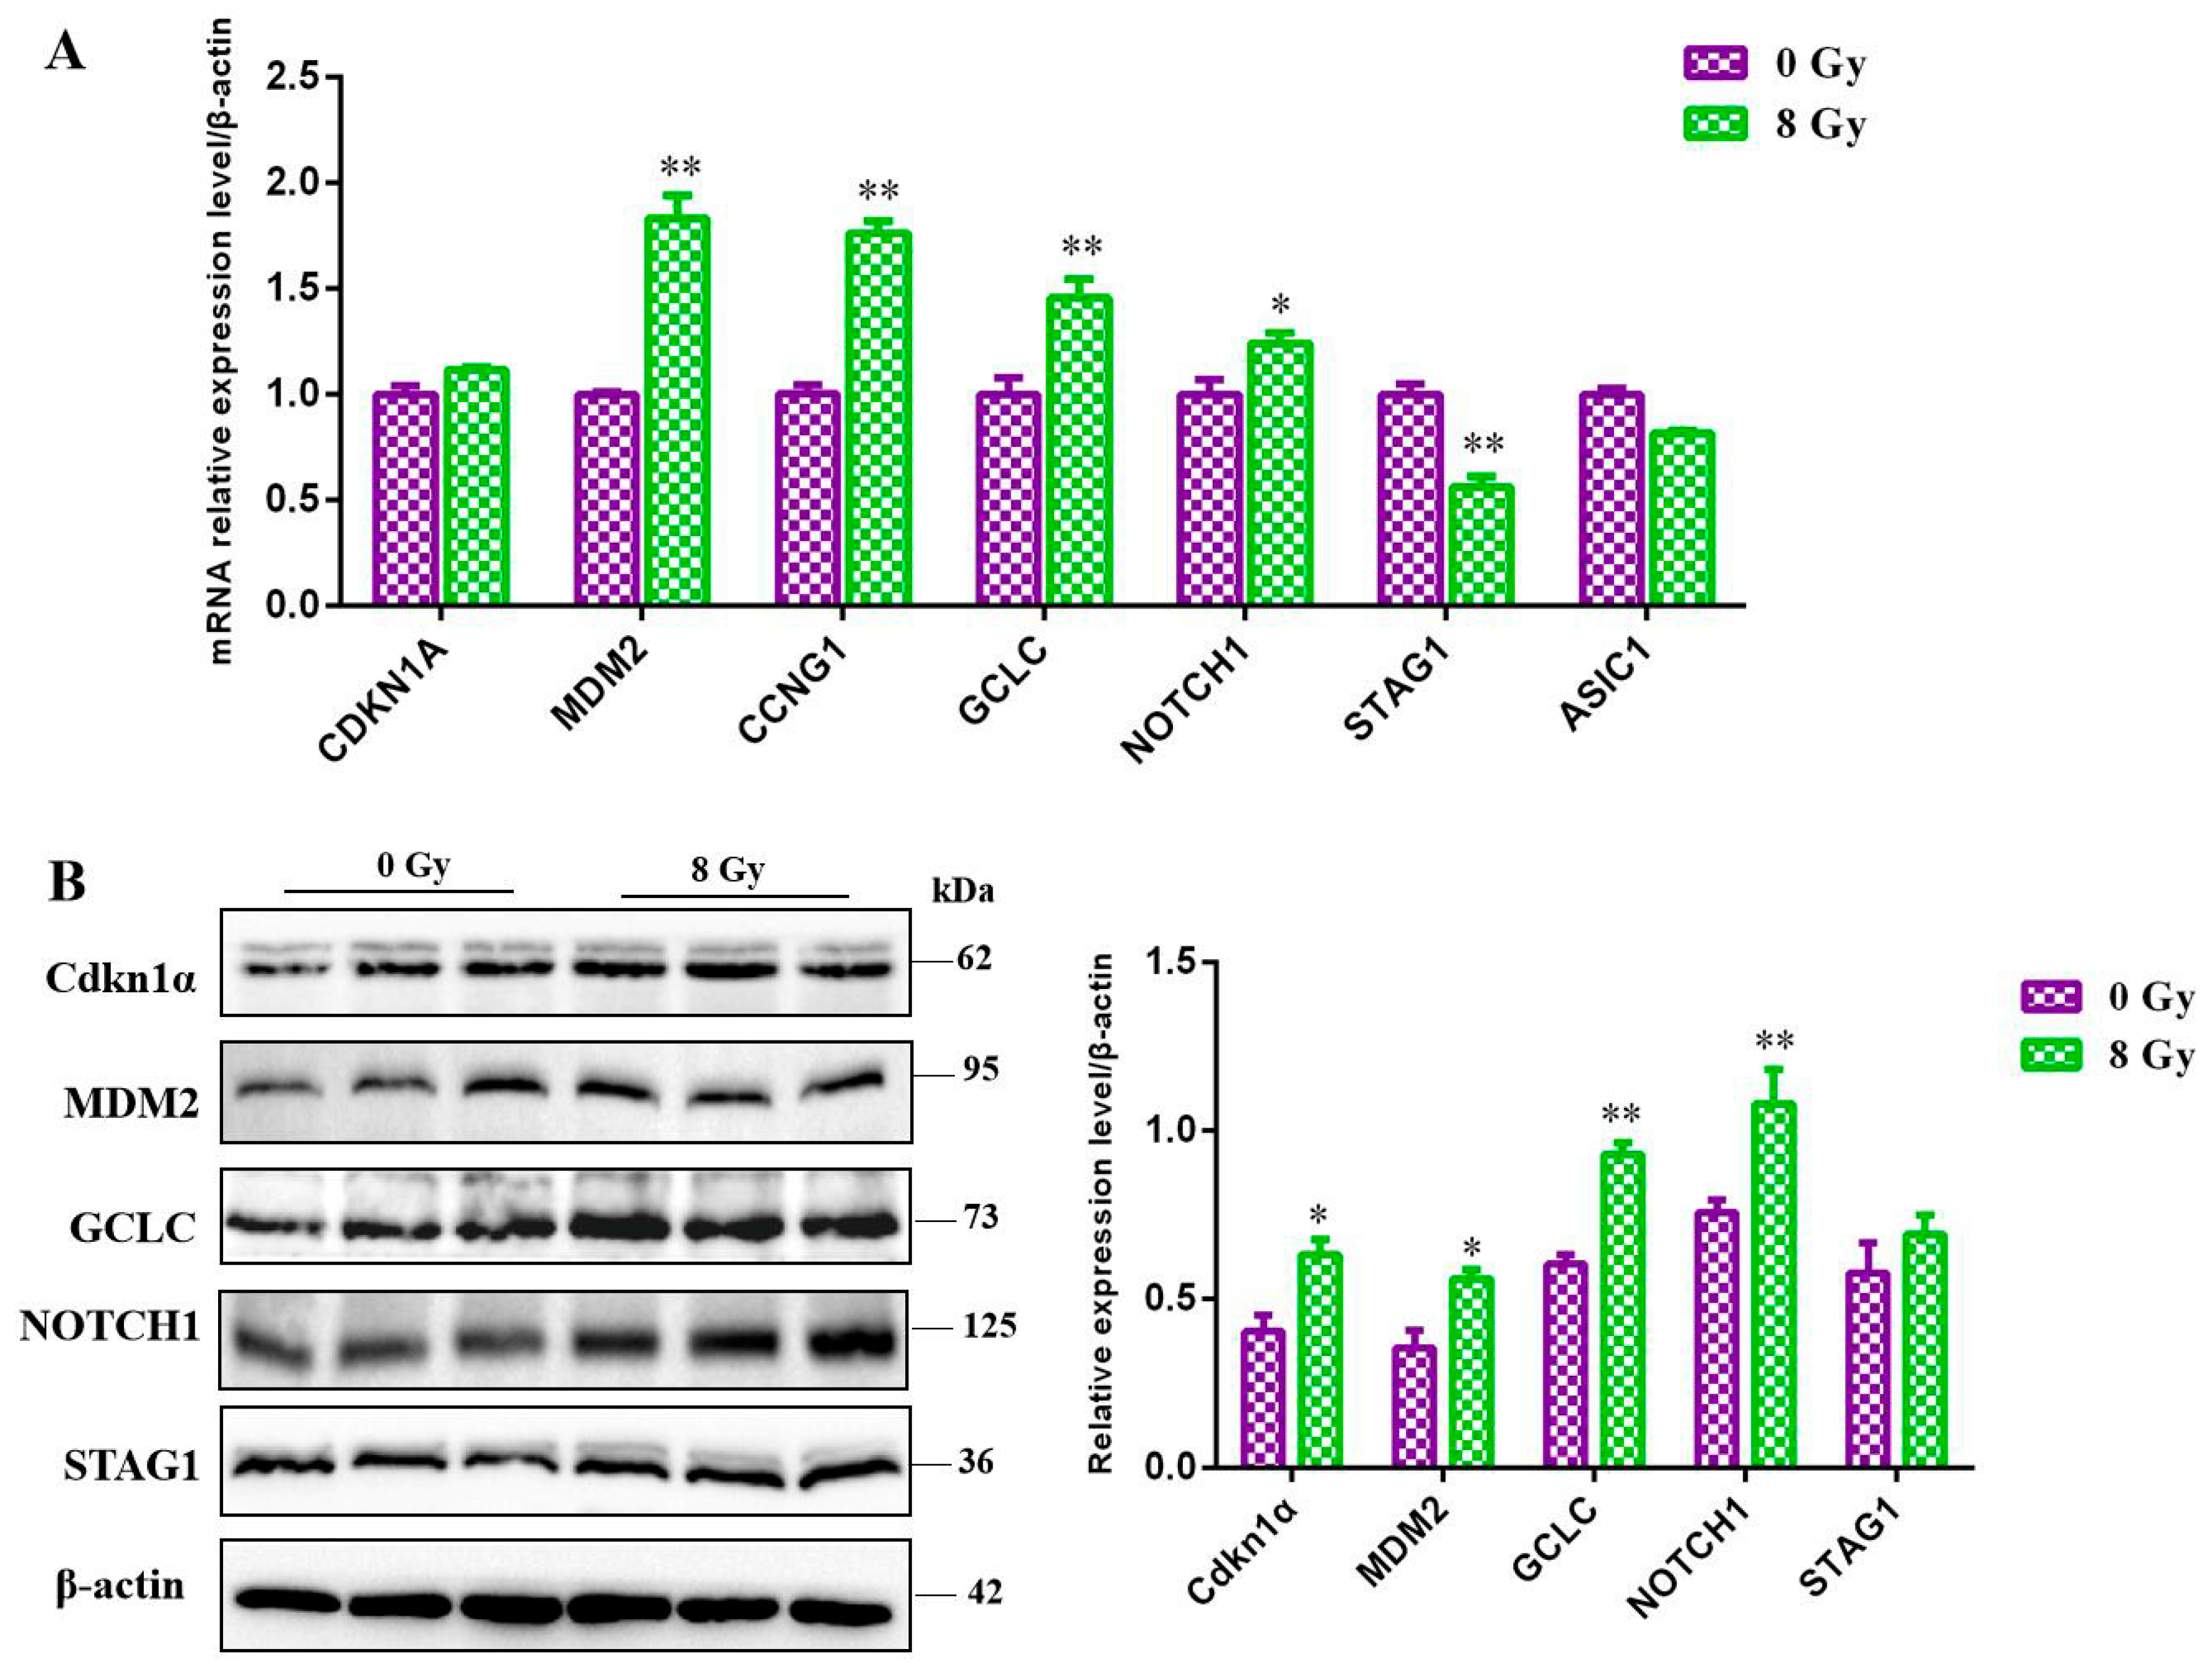
Considering the cellular effects of ionizing radiation and the biological functions we enriched through the RNA-seq, the expression level of the key molecules MDM2, NOTCH1, CDKN1A, CCNG, GCLC, STAG1 and
ASIC1 were detected by RT-qPCR and western blot, and the results showed that after 8 Gy irradiation, the RNA level of
MDM2, NOTCH1, CCNG and
GCLC were all significant upregulated (
P<0.05) and that of the Stag1 was downregulated (
Figure 7A), the protein level of CDKN1A, MDM2, NOTCH1 and
GCLC were upregulated and the Stag1 was decreased (
Figure 7B). The above results confirmed our sequencing results basically
3.7. Confirmation of the DNA Damage of Radiation on MC3T3-E1 Cells
The toxic effects of ionizing radiation can lead to multiple types of DNA damage including DNA strand breakage and DNA cross-linking, but DNA double strand break (DSB) is generally considered the most severe. DSB induces a rapid formation of damage leisons which contain the phosphorylated form of the H
2AX (γ-H
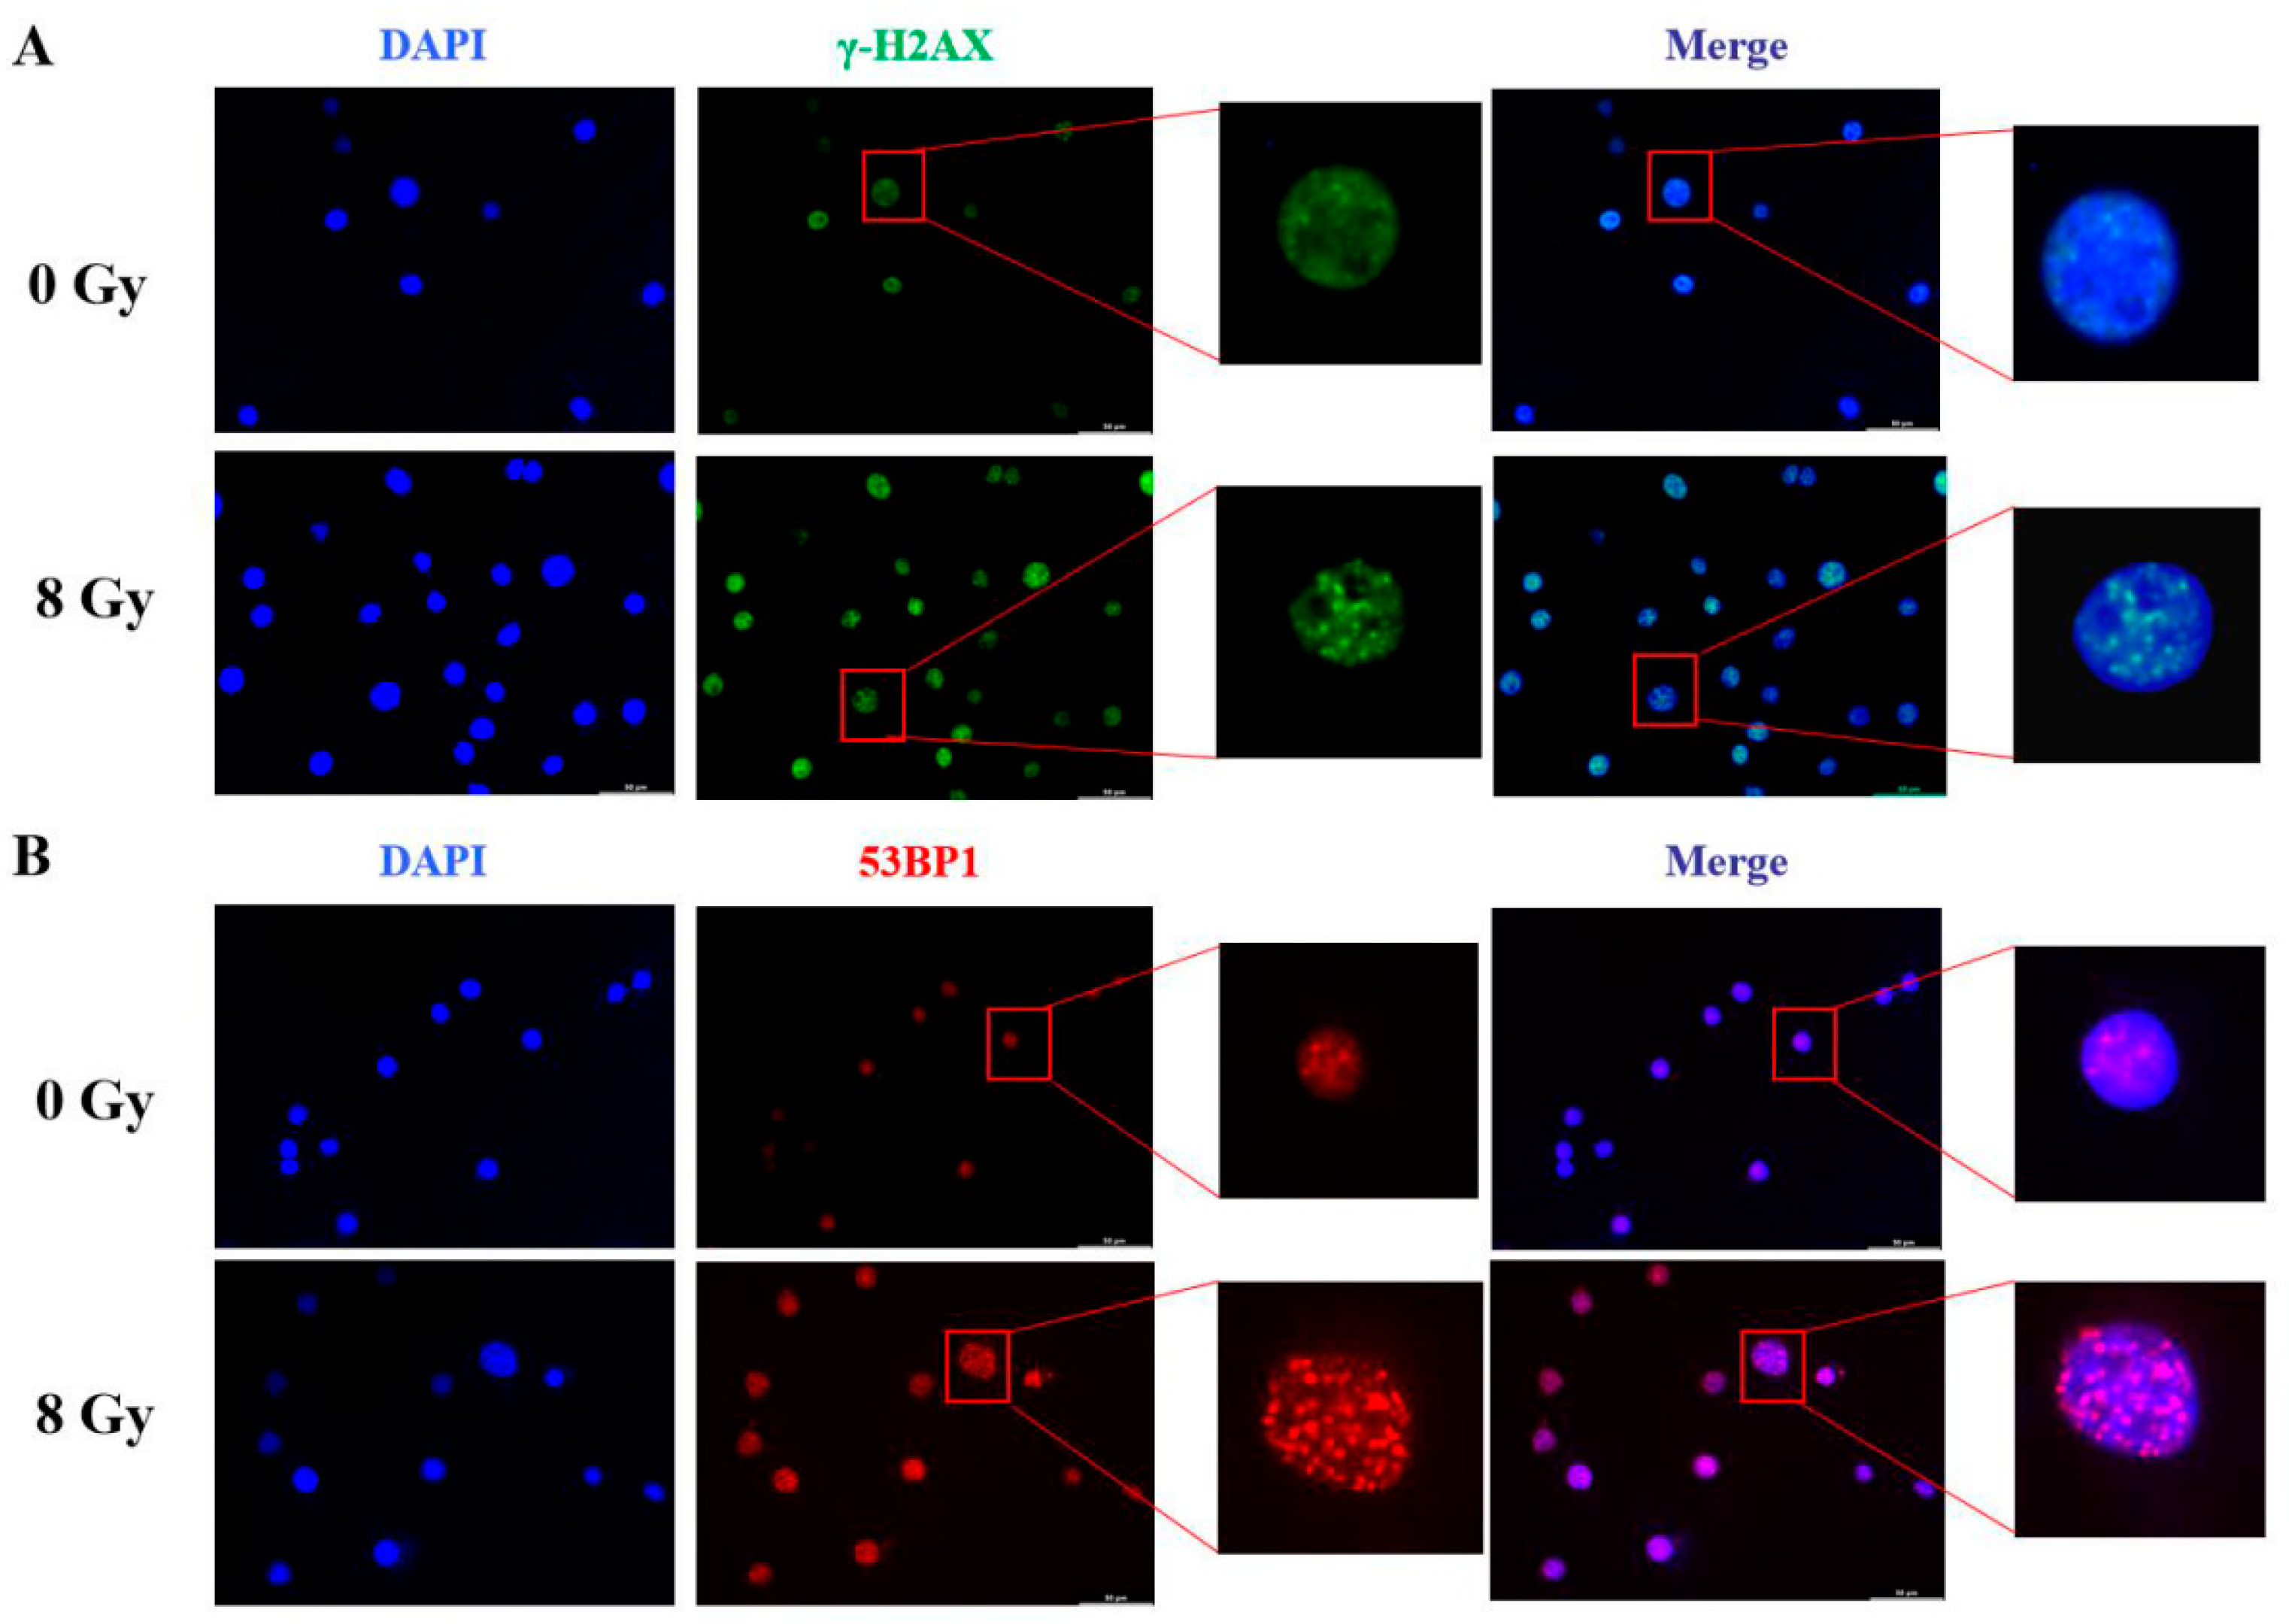
2AX) and recruits many relevant factors such as 53BP1 for DNA damage repair. Therefore, we used immunofluorescence to detect γ-H
2AX comprised damage foci and 53BP1 comprised repair foci. Three hours after irradiation of MC3T3-E1 cells at 8 Gy, we had observed extremely significant γ-H
2AX damage signals (
Figure 8A). Perhaps due to physical injure during cells treated progress, the unirradiated MC3T3-E1 also detected few γ-H
2AX signals. At the same time, immunofluorescence staining analysis also showed that the cells exhibited high-levels of DNA damage repair foci signals of 53BP1 after irradiation compared to the control (
Figure 8B).
4. Discussion
Radiotherapy is still one of the major treatments for tumors and is accompanied by adverse late effects ineluctably, including its damage to the bone within the radiation field (Karali et al., 2023), which leads to a spectrum of bone changes from mild osteopenia to osteoradionecrosis with an increased risk of fractures particularly in patients receiving radiotherapy in the pelvic region (Uezono et al., 2013; Chan et al., 2016). Understanding the mechanisms behind these adverse effects of radiation on bone and identifying effective therapeutic target for such bone disorders is imperative to improve the quality of life for these patients.
Preclinical and cell culture studies indicate that radiation impacts bone formation by decreasing the number of osteoblasts, arresting their cell cycle progression, altering their differentiation ability, and sensitizing them toward apoptosis signals (Dudziak et al., 2000; Gal et al., 2000; Matsumura et al., 1996; Szymczyk et al., 2004). Currently, no systematic study on ionizing radiation-induced osteoblast injury has been reported. Therefore, in this study, the optimal IR damage dose was firstly determined by establishing a radiation-induced osteoblast injury model to measuring cell proliferation, cell cycle, cell apoptosis and further cell differentiation and mineralization abilities. According to our experimental results, when 4 Gy ionizing radiation was used to damage osteoblasts, the cell survival and cell differentiation ability were significantly inhibited, and the apoptosis rate was increased significantly, after 6 Gy and 8 Gy treatment, the G2 phase of the cell cycle also showed a significant impact. Synthetically considering the influence on the survival and development ability of osteoblasts, as well as the related genes (p-AKT, p-ERK1/2, cyclinB, BAX, BCL2, ALP, OPN, RUNX2, Collagen1) expression level changes, we chose 8 Gy dose (2.22 Gy/min) as the radiation condition for osteoblasts injury.
Then we screened 26 differentially expressed genes after the RNA-sequencing of the 8 Gy-irradiated MC3T3-E1 cells, which were considered as the key factors involved in radiation damage to osteoblast cells. Further, the differentially expressed genes were performed GO category analysis and KEGG enrichment, suggested these genes were mainly involved in DNA damage and repair, cell apoptotic progress and cell cycle regulation, meanwhile, participated in several main pathway including PI3K-AKT signaling pathway, p53 signaling pathway and signaling pathway involved in cell cycle and cell senescence. Behind this, the genes of MDM2, NOTCH1, CDKN1A, CCNG, GCLC, ITGB7, STAG1 and ASIC1 had performed most of biological functions. We focused on verifying the differential expression of the upregulated genes MDM2, NOTCH1, CDKN1A, CCNG, GCLC and the downregulated genes STAG1 and ASIC1 according to the NCBI annotation, and found that the expression of MDM2, NOTCH1, CDKN1A and GCLC were indeed upregulated after IR treatment, suggesting the key roles in the response of the IR. Among which, the MDM2 is an intracellular molecule with diverse biological functions. It was first described to limit p53-mediated cell cycle arrest and apoptosis, hence, generated a rationale for being a potential therapeutic target in cancer therapy (Nayak et al., 2018; Bhatia et al., 2023; Wang et al., 2024). With the insight into it, MDM2 is also required for organ development and tissue homeostasis since unopposed p53 activation leads to p53-overactivation-dependent cell death (Gannon et al., 2011; Molitoris et al., 2009; Hagemann et al., 2013; Fledderus et al., 2013). In addition, many studies have indicated that MDM2 related to the radiation sensitivity of tumor cells, the expression of MDM2 is induced in response to DNA damage, high levels of Mdm2 protein are thought to shorten the length of the cell cycle arrest established by p53 in the radiation response (Alimova et al., 2022; Cai et al., 2023, Perry, 2004). It is known that radiation can induce Notch1 activation in breast CSCs (Lagadec et al., 2013). A study had reported the changes in Notch signaling following radiation, however they did not obtain a strong relation between the upregulation of Notch1 expression and suppression of osteoblast differentiation (Yang et al., 2013), which maybe attribute to the lower radiation dose. CDKN1A, also named p21, a critical gene in cell cycle regulation. Study has confirmed the radiation inhibits cell proliferation through cell cycle arrest by enhancing p21 expression (Kim et al., 2004), which was consistent with our results. GCLC, an antioxidant enzyme, was demonstrated to facilitate radioresistance via modulating the cellular ROS levels (You et al., 2022), which is a common cell response of the IR. For the PI3K-AKT signaling pathway enriched, we have verified in the cell proliferation related genes. The above genes and pathways validated provide a deep understand of the latent molecules involved in osteoblast damage after radiation to us.
Moreover, DNA damage and repair actions were the basic effects of the radiation, meanwhile regarding on our sequencing results, the DNA damage and repair were detected in our study, and the immunofluorenscence staining results suggested that IR could induce DNA damage in MC3T3-E1 cells and the osteoblasts might mobilize relevant cytokines to regulate the repair response after DNA damage caused by ionizing radiation.
In conclusion, we demonstrate that IR damaged MC3T3-E1 cells by inhibiting cell proliferation, impacting cell cycle process, inducing cell apoptosis and affecting the osteoblasts differentiation, which maybe due to the DNA damage at the cellular level, and the differential expression of the key genes (MDM2, NOTCH1, CDKN1A and GCLC ) maybe the intrinsic factor in molecular perspective.
Author Contributions
Jiguo Lin: Conceptualization, Methodology, Visualization and Writing-original draft. Gang Zhao: Supervision. Chang Liu and Jialu Zhang: Methodology. Jie Feng and Luping Wang: Visualization. Chaonan Sun: Data curation. Yannan Shen: Validation and Visualization. Yunyun Cheng: Project administration, Funding acquisition and Writing-review & editing.
Funding
This work was supported by the Science and Technology Research and Planning Project of the Education Department of Jilin Province (JJKH20231240KJ), the 8th young science and technology talents lift project of Jilin Province (QT202426), the Bethune Project of Jilin University (2024B39) and the College Students “Innovation and Entrepreneurship Training (Innovation Training)” Program of Jilin University (202310183271, 202310183276).
Data Availability Statement
Data are contained within the article or its Supplementary Materials. Data, analytic methods, and study materials can be made available to other researchers by requesting their usage for other studies by the corresponding author.
Conflicts of Interest
We declare that we have no financial and personal relationships with other people or organizations that can inappropriately influence our work, there is no professional or other personal interest of any nature or kind in any product, service and/or company that could be construed as influencing the position presented in the manuscript entitled.
Abbreviations
IR: Ionizing radiation; ROS: Reactive oxygen species; DDR: DNA damage response; PI: Propidium lodide; ALP: Alkaline phosphatase; ARS: Alizarin red staining; SDS-PAGE: sodium dodecyl sulfate-polyacrylamide gel electrophoresis.
References
- Alimova, I.; Wang, D.; Danis, E.; Pierce, A.; Donson, A.; Serkova, N.; Madhavan, K.; Lakshmanachetty, S.; Balakrishnan, I.; Foreman, N.K.; Mitra, S.; Venkataraman, S.; Vibhakar, R. Targeting the TP53/MDM2 axis enhances radiation sensitivity in atypical teratoid rhabdoid tumors. Int J Oncol. 2022, 60, 32. [Google Scholar] [CrossRef] [PubMed]
- Baxter NN, Habermann EB, Tepper JE, et al. Risk of pelvic fractures in older women following pelvic irradiation. JAMA, 2005, 294, 2587–2593.
- Bhatia, N.; Khator, R.; Kulkarni, S.; Singh, Y.; Kumar, P.; Thareja, S. Recent Advancements in the Discovery of MDM2/MDM2-p53 Interaction Inhibitors for the Treatment of Cancer. Curr Med Chem. 2023, 30, 3668–3701. [Google Scholar] [CrossRef]
- Cai LH, Chen XY, Qian W, Liu CC, Yuan LJ, Zhang L, Nie C, Liu Z, Li Y, Li T, Liu MH. DDB2 and MDM2 genes are promising markers for radiation diagnosis and estimation of radiation dose independent of trauma and burns. Funct Integr Genomics. 2023, 23, 294. [Google Scholar] [CrossRef] [PubMed]
- Chan, S.; Rowbottom, L.; McDonald, R.; David, E.; Chung, H.; Yee, A.; Turner, A.; Chow, E. Pelvic insufficiency fractures in women following radiation treatment: a case series. Ann Palliat Med. 2016, 5, 233–237. [Google Scholar] [CrossRef] [PubMed]
- Dudziak, M.E.; Saadeh, P.B.; Mehrara, B.J.; Steinbrech, D.S.; Greenwald, J.A.; Gittes, G.K.; Longaker, M.T. The effects of ionizing radiation on osteoblast-like cells in vitro. Plast. Reconstr. Surg. 2000, 106, 1049–1061. [Google Scholar] [CrossRef] [PubMed]
- Fledderus, J.O.; Goldschmeding, R. Nrf2 implicated as a novel therapeutic target for renal regeneration after acute kidney injury. Nephrol Dial Transplant. 2013, 28, 1969–1971. [Google Scholar] [CrossRef] [PubMed]
- Gal, T.J.; Munoz-Antonia, T.; Muro-Cacho, C.A.; Klotch, D.W. Radiation effects on osteoblasts in vitro: a potential role in osteoradionecrosis. Arch. Otolaryngol. Head Neck Surg. 2000, 126, 1124–1128. [Google Scholar] [CrossRef] [PubMed]
- Gannon, H.S.; Donehower, L.A.; Lyle, S.; Jones, S.N. Mdm2-p53 signaling regulates epidermal stem cell senescence and premature aging phenotypes in mouse skin. Dev Biol. 2011, 353, 1–9. [Google Scholar] [CrossRef]
- Hagemann, J.H.; Thomasova, D.; Mulay, S.R.; Anders, H.J. Nrf2 signalling promotes ex vivo tubular epithelial cell survival and regeneration via murine double minute (MDM)-2. Nephrol Dial Transplant. 2013, 28, 2028–37. [Google Scholar] [CrossRef]
- Hopewell, J.W. Radiation-therapy effects on bone density. Med Pediatr Oncol, 2003, 41, 208–211. [Google Scholar] [CrossRef]
- Karali, A.; Dall'Ara, E.; Zekonyte, J.; Kao, A.P.; Blunn, G.; Tozzi, G. Effect of radiation-induced damage of trabecular bone tissue evaluated using indentation and digital volume correlation. J Mech Behav Biomed Mater. 2023, 138, 105636. [Google Scholar] [CrossRef]
- Kim, H.S.; Cho, H.J.; Cho, H.J.; Park, S.J.; Park, K.W.; Chae, I.H.; Oh, B.H.; Park, Y.B.; Lee, M.M. The essential role of p21 in radiation-induced cell cycle arrest of vascular smooth muscle cell. J Mol Cell Cardiol. 2004, 37, 871–80. [Google Scholar] [CrossRef] [PubMed]
- Lagadec, C.; Vlashi, E.; Alhiyari, Y.; Phillips, T.M.; Bochkur Dratver, M.; Pajonk, F. Radiation-induced notch signaling in breast cancer stem cells. Int. J. Radiat. Oncol. Biol. Phys. 2013, 87, 609–618. [Google Scholar] [CrossRef] [PubMed]
- Lee SH, Cho WJ, Najy AJ, Saliganan AD, Pham T, Rakowski J, Loughery B, Ji CH, Sakr W, Kim S, Kato I, Chung WK, Kim HE, Kwon YT, Kim HC. p62/SQSTM1-induced caspase-8 aggresomes are essential for ionizing radiation-mediated apoptosis. Cell Death Dis. 2021, 12, 997. [Google Scholar] [CrossRef] [PubMed]
- Matsumura, S.; Jikko, A.; Hiranuma, H.; Deguchi, A.; Fuchihata, H. Effect of x-ray irradiation on proliferation and differentiation of osteoblast. Calcif. Tissue Int. 1996, 59, 307–308. [Google Scholar] [CrossRef]
- Molitoris BA, Dagher PC, Sandoval RM, Campos SB, Ashush H, Fridman E, Brafman A, Faerman A, Atkinson SJ, Thompson JD, Kalinski H, Skaliter R, Erlich S, Feinstein E. siRNA targeted to p53 attenuates ischemic and cisplatin-induced acute kidney injury. J Am Soc Nephrol. 2009, 20, 1754–1764. [Google Scholar] [CrossRef]
- Nayak SK, Khatik GL, Narang R, Monga V, Chopra HK. p53-Mdm2 Interaction Inhibitors as Novel Nongenotoxic Anticancer Agents. Curr Cancer Drug Targets. 2018, 18, 749–772. [Google Scholar] [CrossRef]
- Perry, M.E. Mdm2 in the response to radiation. Mol Cancer Res. 2004, 2, 9–19. [Google Scholar] [CrossRef]
- Santivasi, W.L.; Xia, F. Ionizing radiation-induced DNA damage, response, and repair. Antioxid Redox Signal. 2014, 21, 251–9. [Google Scholar] [CrossRef]
- Soriano JL, Calpena AC, Souto EB, et al. Therapy for prevention and treatment of skin ionizing radiation damage: a review. Int J Radiat Biol, 2019, 95, 537–553. [Google Scholar] [CrossRef]
- Shim, M.S.; Xia, Y. A reactive oxygen species (ROS)-responsive polymer for safe, efficient, and targeted gene delivery in cancer cells. Angew Chem Int Ed Eng, 2013, 52, 6926–6929. [Google Scholar] [CrossRef]
- Szymczyk, K.H.; Shapiro, I.M.; Adams, C.S. Ionizing radiation sensitizes bone cells to apoptosis. Bone. 2004, 34, 148–156. [Google Scholar] [CrossRef]
- Uezono, H.; Tsujino, K.; Moriki, K.; Nagano, F.; Ota, Y.; Sasaki, R.; Soejima, T. Pelvic insufficiency fracture after definitive radiotherapy for uterine cervical cancer: retrospective analysis of risk factors. J. Radiat. Res. 2013, 54, 1102–1109. [Google Scholar] [CrossRef]
- Wang, C.; Liu, S.; Li, J.; Cheng, Y.; Wang, Z.; Feng, T.; Lu, G.; Wang, S.; Song, J.; Xia, P.; Hao, L. Biological Functions of Let-7e-5p in Promoting the Differentiation of MC3T3-E1 Cells. Front Cell Dev Biol. 2021; 9, 671170. [Google Scholar]
- Wang W, Albadari N, Du Y, Fowler JF, Sang HT, Xian W, McKeon F, Li W, Zhou J, Zhang R. MDM2 Inhibitors for Cancer Therapy: The Past, Present, and Future. Pharmacol Rev. 2024, 76, 414–453. [Google Scholar] [CrossRef] [PubMed]
- Yang, B.; Tang, Q.; Post, J.; Zhou, H.; Huang, X.B.; Zhang, X.D.; Wang, Q.; Sun, Y.M.; Fan, F.Y. Effect of radiation on the Notch signaling pathway in osteoblasts. Int J Mol Med. 2013, 31, 698–706. [Google Scholar] [CrossRef]
- You GR, Chang JT, Li YL, Huang CW, Tsai YL, Fan KH, Kang CJ, Huang SF, Chang PH, Cheng AJ. MYH9 Facilitates Cell Invasion and Radioresistance in Head and Neck Cancer via Modulation of Cellular ROS Levels by Activating the MAPK-Nrf2-GCLC Pathway. Cells. 2022, 11, 2855. [Google Scholar] [CrossRef]
- Zhang J, Qiu X, Xi K, et al. Therapeutic ionizing radiation induced bone loss: a review of in vivo and in vitro findings. Connect Tissue Res. 2018, 59, 509–522. [Google Scholar] [CrossRef] [PubMed]
- Zhang, Y.; Jiang, T.; Ni, S.; Liu, W.; Luo, P.; Hao, S.; Wang, P.; Guo, L. Effects of Estrogen on Proliferation and Apoptosis of Osteoblasts through Regulating GPER/AKT Pathway. Cell Mol Biol (Noisy-le-grand). 2022, 68, 124–129. [Google Scholar] [CrossRef] [PubMed]
Figure 1.
Effect of different doses ionizing radiation on the cell survival of the MC3T3-E1 cells. A. The cell viability of the MC3T3-E1 cells 24, 48 and 72h after 0, 2, 4, 6, 8 Gy IR treatment detected by CCK8 assay. B. The clonogenic formation ability of the MC3T3-E1 cells after 0, 2, 4, 6, 8 Gy IR treatment detected by crystal violet staining. C.The cell proliferation related genes p-AKT and p-ERK1/2 expression changes detected by western blot assay. D. The quantification of the western blot bands in C.
Figure 2.
Effect of different doses ionizing radiation on the cell cycle distribution of the MC3T3-E1 cells. A. The cell cycle detection of the MC3T3-E1 cells 24 h after 0, 2, 4, 6, 8 Gy IR treatment by flow cytometry. B. The cell cycle distribution analysis after 0, 2, 4, 6, 8 Gy IR treatment. C.The cyclin B gene mRNA level changes after 0, 2, 4, 6, 8 Gy IR treatment by RT-qPCR assay. D. The cyclin B gene protein level changes after 0, 2, 4, 6, 8 Gy IR treatment by western blot assay.
Figure 3.
Effect of different doses ionizing radiation on the cell apoptosis of the MC3T3-E1 cells. A. The cell apoptosis of the MC3T3-E1 cells 24 h after 0, 2, 4, 6, 8 Gy IR treatment by flow cytometry. B. The cell apoptosis rate after 0, 2, 4, 6, 8 Gy IR treatment. C. The BAX gene mRNA level changes after 0, 2, 4, 6, 8 Gy IR treatment by RT-qPCR assay. D. The BCL2 gene mRNA level changes after 0, 2, 4, 6, 8 Gy IR treatment by RT-qPCR assay. E. The BAX and BCL2 protein level changes after 0, 2, 4, 6, 8 Gy IR treatment by western blot assay.
Figure 4.
Effect of different doses ionizing radiation on the cell differentiation and mineralization abilities of the MC3T3-E1 cells. A. Representative images of the MC3T3-E1 cell differentiation detected by ALP staining and the mineralization detected by ARS staining after 0, 2, 4, 6, 8 Gy IR treatment. B. Quantitative analysis of the ALP activity. C. Quantitative analysis of the ARS activity using 10% cetylpyridinium chloride. .
Figure 5.
Cell differentiation and mineralization related genes detection of the MC3T3-E1 cells after different doses ionizing radiation. A. The ALP gene mRNA level changes after 0, 2, 4, 6, 8 Gy IR treatment by RT-qPCR assay. B. The OPN gene mRNA level changes after 0, 2, 4, 6, 8 Gy IR treatment. C. The RUNX2 gene mRNA level changes after 0, 2, 4, 6, 8 Gy IR treatment. D. The Collagen 1 gene mRNA level changes after 0, 2, 4, 6, 8 Gy IR treatment. E. The OPN, RUNX2, Collagnen1 protein level changes after 0, 2, 4, 6, 8 Gy IR treatment.
Figure 6.
Analysis of the RNA-sequencing results between the 8 Gy treatment(IR) and Control group (CON) MC3T3-E1 cells. A. Heatmap of the differentially expressed genes in MC3T3-E1 cells after 8Gy radiation. B. PPI network of differential genes. C. Pathway analysis of differential genes arranged into functional groups by GO enrichment. D. Genes differentially expressed were selected for gene ontology analysis.
Figure 7.
Validation of potentials molecules after 8 Gy ionizing radiation. A. Differential genes (CDKN1A, MDM2, CCNG, GCLC, NOTCH1, STAG1 and ASIC1) validation by RT-qPCR assay. B. The differential genes were further validated by western blot asssay.
Figure 7.
Validation of potentials molecules after 8 Gy ionizing radiation. A. Differential genes (CDKN1A, MDM2, CCNG, GCLC, NOTCH1, STAG1 and ASIC1) validation by RT-qPCR assay. B. The differential genes were further validated by western blot asssay.
Figure 8.
DNA damage and repair of MC3T3-E1 cells detection by immunofluorescence after 8 Gy ionizing radiation. A. The DNA damage foci detected by the immunofluorescence of γ-H2AX. B. The DNA damage repair detected by the immunofluorescence of 53BP1.
Figure 8.
DNA damage and repair of MC3T3-E1 cells detection by immunofluorescence after 8 Gy ionizing radiation. A. The DNA damage foci detected by the immunofluorescence of γ-H2AX. B. The DNA damage repair detected by the immunofluorescence of 53BP1.
Table 1.
Primers for RT-qPCR assays for detecting the expression of target genes.
Table 1.
Primers for RT-qPCR assays for detecting the expression of target genes.
| Primers |
GenBank accession NO. |
Sequences(5´→3´) |
Positions in
Gene* |
Annealing temperature (°C) |
PCR product (bp) |
| Cyclin B |
NM_172301.3 |
F: CTCAGGGTCACTAGGAACACGA |
91-112 |
59 |
156 |
| R: TTCGCTGACTTTATTACCAATGTC |
223-246 |
| BAX |
NM_001411994 |
F: ATTGGAGATGAACTGGACAGCA |
293-314 |
59 |
54 |
| R: CACGTCAGCAATCATCCTCTG |
326-346 |
| BCL2 |
NM_009741 |
F: CTGTGGATGACTGAGTACCTGAAC |
1924-1947 |
59 |
134 |
| R: GTCTTCAGAGACAGCCAGGAGA |
2036-2057 |
| OPN |
NM_001204201 |
F: ACACTTTCACTCCAATCGTCC |
541-561 |
59 |
240 |
| R: TGCCCTTTCCGTTGTTGTCC |
761-780 |
| RUNX2 |
NM_009820.6 |
F: GAGGGACTATGGCGTCAAACA |
201-221 |
59 |
70 |
| R: GGATCCCAAAAGAAGCTTTGC |
250-270 |
| ALP |
NM_001287172 |
F: TGTGCCAGAGAAAGAGAGAGACC |
333-355 |
59 |
112 |
| R: GATGACATTCTTGGCTACATTGGT |
421-444 |
| CDKN1A |
NM_001111099.2 |
F: TGGTGGAGACCTGATGATACC |
10-30 |
59 |
145 |
| R: ACATCACCAGGATTGGACATG |
134-154 |
| GCLC |
NM_010295.2 |
F: ATGTCTGAGTTCAACACTGTGGA |
615-637 |
59 |
143 |
| R: CTGTGTTCTGGCAGTGTGAATC |
736-757 |
| MDM2 |
NM_010786.5 |
F: CAGCAGCACATTGTGTATTGTTC |
437-459 |
59 |
134 |
| R: GAGTCTTGCTGACTTACAGCCAC |
548-570 |
| NOTCH1 |
NM_008714.3 |
F: CCTGCTCACTCTCACAGAGTACA |
618-640 |
59 |
144 |
| R: CAGCGACAGATGTATGAAGACTC |
739-761 |
| CCNG1 |
NM_009831.3 |
F: TGTGAATTTACTGGACAGATTCTTGT |
442-467 |
59 |
163 |
| R: CGTGAACCTATACTGACTTATTCGG |
580-604 |
| STAG1 |
NM_009282.5 |
F: GAATAGCTTCTCCAGCAATGATTAC |
241-265 |
59 |
84 |
| R: CAGCATCAGAGTGGGCAGTAGT |
303-324 |
| Asic1 |
NM_009597.2 |
F: TGATTGTGAAACCCGTTACCT |
1464-1484 |
59 |
171 |
| R: AGGTTGCAGGGCATCTCAC |
1616-1634 |
| β-actin |
NM_007393.5 |
F: TTCCAGCCTTCCTTCTTGG |
893-911 |
59 |
104 |
| R: TTGGCATAGAGGTCTTTACGG |
976-996 |
|
Disclaimer/Publisher’s Note: The statements, opinions and data contained in all publications are solely those of the individual author(s) and contributor(s) and not of MDPI and/or the editor(s). MDPI and/or the editor(s) disclaim responsibility for any injury to people or property resulting from any ideas, methods, instructions or products referred to in the content. |
© 2024 by the authors. Licensee MDPI, Basel, Switzerland. This article is an open access article distributed under the terms and conditions of the Creative Commons Attribution (CC BY) license (https://creativecommons.org/licenses/by/4.0/).
