Preprint
Article

Predictive Analysis of Osteoarthritis and Chronic Pancreatitis Comorbidity: Complications and Risk Factors

Altmetrics

Downloads

127

Views

47

Comments

0

Submitted:

12 July 2024

Posted:

15 July 2024

You are already at the latest version

Alerts
Abstract
Osteoarthritis and chronic pancreatitis comorbidity are insufficiently studied, and the reciprocal impact of these conditions remains poorly understood. This study aimed to investigate potential predictors for the development of osteoarthritis and chronic pancreatitis comorbidity, as well as complications associated with this comorbidity. A cohort of 150 patients was categorized into three groups: a control group (n=30), patients with osteoarthritis (n=68), and patients with comorbid osteoarthritis and chronic pancreatitis (n=52). Potential predictors for comorbidity development and associated complications were explored. The study revealed that concurrent osteoarthritis and chronic pancreatitis exacerbate each other's progression and contribute to malnutrition. Body Mass Index (BMI) emerged as a potential predictor for chronic pancreatitis development in osteoarthritis patients. In osteoarthritis patients, fecal elastase-1 levels were identified as potential predictors for exocrine pancreatic insufficiency. Factors such as WOMAC total score, fecal elastase-1, C-reactive protein (CRP), ferritin, retinol, tocopherol, 25-hydroxy vitamin D3, and BMI were found to influence comorbidity development between osteoarthritis and chronic pancreatitis. Additionally, Gastrointestinal Symptom Rating Scale-Diarrhea Syndrome (GSRS-DS), Gastrointestinal Symptom Rating Scale-Constipation syndrome (GSRS-CS), Qualitative Assessment of the Symptoms and Impact of Pancreatic Exocrine Insufficiency domain A (PEI-Q-A), retinol, tocopherol, and iron were identified as potential predictors for exocrine pancreatic insufficiency in osteoarthritis patients. In conclusion, the comorbidity of osteoarthritis and chronic pancreatitis exacerbates disease progression and complications, necessitating further investigation.
Keywords: 
Subject: Medicine and Pharmacology  -   Clinical Medicine

1. Introduction

Osteoarthritis (OA) affects approximately 27% of individuals aged over 45 years at peripheral synovial joints such as knees, hips, hands, and feet, representing the most prevalent form of arthritis [1]. OA affects more than 500 million individuals worldwide, representing approximately 7% of the global population, with a higher prevalence among women; the condition imposes significant economic burdens on individuals, healthcare systems, and broader socioeconomic structures [2]. It significantly contributes to chronic joint pain and disability in older adults, and its prevalence is expected to escalate in the forthcoming decades due to global population aging and the increasing prevalence of obesity—two major risk factors for OA [1,3]. Currently, OA does not have disease-modifying therapies available, and treatment primarily consists of analgesics, physical therapies, and surgical interventions when indicated. The aging demographic has led to extended lifespans without a commensurate improvement in health span, contributing to an increasing incidence of multimorbidity and the attendant challenges of managing complex treatments, disability, and frailty [4]. Chronic pain represents a substantial personal and societal burden worldwide, with osteoarthritis (OA) standing prominently among the conditions contributing to this burden, exacerbated by its increasing prevalence in an aging global population. Beyond its physical ramifications, chronic pain adversely impacts patients' psychological well-being. However, current pharmacological interventions aimed at slowing OA progression are inadequate, and existing therapies for pain relief often yield unsatisfactory results. Persistent low-grade inflammation in OA is widely acknowledged as a significant catalyst for joint damage, manifesting locally in synovial tissues and influenced systemically by various factors, both modifiable and non-modifiable [5]. Recent studies have highlighted the involvement of neuroinflammatory processes in the peripheral nervous system, spinal cord, and supraspinal brain areas in the development of chronic pain and mood disorders associated with OA, suggesting promising targets for novel therapeutic interventions addressing these mechanisms [6].
OA frequently occurs alongside multiple chronic conditions, termed multimorbidity, and necessitates the use of multiple medications, thereby introducing intricate complexities in treatment management and healthcare coordination [7]. OA exerts a broad influence encompassing osteoporosis, sarcopenia, cardiovascular diseases, diabetes mellitus, neurological disorders, mental health, and cancer, interconnected through shared inflammatory mechanisms, genetic predispositions, and lifestyle factors. Recognizing and addressing these associations presents opportunities to optimize patient care and alleviate the burden of associated diseases, underscoring the need for a holistic approach to managing OA and its complications [8].
Chronic pancreatitis (CP) is a multifactorial disease characterized by repeated bouts of pancreatic inflammation and fibrosis, resulting in progressive dysfunction of both exocrine and endocrine pancreatic functions. Clinical manifestations include chronic abdominal pain, diminished quality of life, impaired digestion and nutrient absorption, development of diabetes mellitus, and an increased susceptibility to pancreatic adenocarcinoma [9]. CP exhibits a variable prevalence estimated between 30 to 100 cases per 100,000 individuals, though underreporting is likely due to challenges in data collection and patient compliance. The condition shows a predominance in males, with ratios ranging from 1.05:1 to 5:1, and is strongly linked to alcoholism, though other factors such as genetic predispositions, autoimmune disorders, congenital anomalies, trauma, and environmental toxins are also implicated in its etiology [10]. Clinical manifestations of CP include pancreatic insufficiency, steatorrhea, weight loss, and the progression to pancreatogenic diabetes (Type 3c diabetes), with the severity and frequency of these complications closely tied to the extent of pancreatic damage [11]. CP leads to dysbiosis, culminating in complications such as malnutrition, sarcopenia, osteopathy, and heightened risks of infections, thromboembolic events, and mortality. Additionally, individuals with this condition are at increased risk for psychiatric disorders and pancreatic cancer [12]. The incidence and prevalence of chronic pancreatitis are increasing, and no definitive cure currently exists. Diagnosis involves using novel diagnostic algorithms; definitive diagnosis relies on imaging criteria alone, while probable diagnosis requires clinical and imaging criteria, with criteria for early diagnosis still under debate and needing validation in clinical trials. Management necessitates an interdisciplinary approach involving primary care, gastroenterology, surgery, radiology, pain management, and nutrition therapy, with regular annual evaluations to monitor causal risk factors, symptom control, and complications like malnutrition and diabetes, emphasizing referral to specialized centers for poorly controlled symptoms or risk of deterioration. [13,14,15]. Managing pain in CP remains challenging, often leaving patients with inadequate relief that significantly impairs their daily functioning [16]. Currently, there are no existing pain assessment tools for CP that encompass all pertinent aspects of pain [17]. The most common comorbid conditions associated with CP include diabetes mellitus, malnutrition, osteoporosis, pancreatic exocrine insufficiency, pancreatic pseudocysts, bile duct obstruction, pancreatic cancer, psychiatric disorders, and musculoskeletal disorders [18,19,20,21].
The OA and CP comorbidity has not been adequately studied, and the mutual influence of these conditions is poorly understood. Existing research does not provide sufficient data on the interactions and shared pathophysiological mechanisms of OA and CP. Therefore, further investigation is essential to clarify the reciprocal effects of these diseases and to develop more effective treatment approaches.

2. Materials and Methods

2.1. Sample Collection

Participants for this study were enrolled from the Ternopil City Communal Institution "Center for Primary Medical and Sanitary Care" between 2019 and 2023. The research adhered to the fundamental principles outlined in the Council of Europe's Convention on Human Rights and Biomedicine, and was conducted in accordance with the ethical guidelines specified in the World Medical Association's Declaration of Helsinki regarding medical research involving human subjects, including subsequent revisions. Furthermore, it complied with Ministry of Health of Ukraine Order No. 690 dated September 23, 2009. All participants provided informed consent prior to their involvement in the study. Approval for the study was obtained from the Bioethics Committee of I. Horbachevsky Ternopil National Medical University, Ministry of Health of Ukraine (Protocol No. 75, November 1, 2023).
The study cohort consisted of individuals of Ukrainian ethnicity with European ancestry, ranging in age from 27 to 71 years. Criteria for inclusion of patients in the study comprised individuals of both genders; confirmed diagnosis of hip and knee osteoarthritis (based on the International Classification of Diseases, 10th Revision codes M16, M17); and confirmed diagnosis of CP (based on the International Classification of Diseases, 10th Revision code K86). Exclusion criteria for the study included: Zollinger-Ellison syndrome, Shwachman syndrome, Johanson-Blizzard syndrome, Clark-Hedvild syndrome, history of pancreatic resection, pancreatic tumors, large pancreatic cysts, subcompensated and decompensated type II diabetes mellitus, type I diabetes mellitus, stomach malignant tumors, post-gastrectomy status, stomach and duodenum peptic ulcer, dumping syndrome, post-cholecystectomy status, gallstone disease, malignant liver tumors, viral hepatitis, liver cirrhosis, cystic fibrosis, non-specific ulcerative colitis, Crohn's disease, celiac disease, decompensated heart-lung diseases, thyroid gland pathology, arrhythmias, stage II-III hypertension, unstable ischemic heart disease, acute myocardial infarction, recent major surgery within the last month, use of systemic glucocorticosteroids, stage III-V chronic kidney disease, pregnancy, severe exhaustion, tendency to bleed, suspicion of malignant tumors, psychiatric and behavioral disorders, infectious and parasitic diseases, congenital anomalies and chromosomal disorders, and refusal to participate in the study.
The diagnosis of OA was established according to the "Clinical Protocol for Providing Medical Care to Patients with Osteoarthritis," approved by the Order of the Ministry of Health of Ukraine "On Approval of Protocols for Providing Medical Care in the Specialty 'Rheumatology'" dated October 12, 2006, No. 676, and based on the diagnostic criteria of the Osteoarthritis Research Society International (OARSI, 2019), the American College of Rheumatology (ACR, 2020), and the European League Against Rheumatism (EULAR, 2022). Joint examination included inspection, palpation, objective assessment of pain at rest and movement. Radiological stages of OA were assessed according to the classification by J.H. Kellgren and J.S. Lawrence.
The diagnosis of CP was verified according to standardized protocols for the diagnosis and treatment of digestive diseases (based on the universally accepted classification in Ukraine proposed by the Research Institute of the National Academy of Medical Sciences of Ukraine) according to the "Unified Clinical Protocol of Primary, Secondary (Specialized) Medical Care and Medical Rehabilitation of Patients with Chronic Pancreatitis," approved by the Order of the Ministry of Health of Ukraine No. 638 dated September 10, 2014, and No. 1204 dated July 4, 2023 and based on the diagnostic criteria of the American Gastroenterological Association (AGA, 2023), European Association for the Study of the Liver (EASL, 2012), European Society for Gastrointestinal Endoscopy and Nutrition (EAGEN, 2012), European Pancreatic Club (EPC, 2017).

2.2. Laboratory and Clinical Data

In evaluating the joint status among individuals afflicted with OA, the WOMAC index (Western Ontario and McMaster Universities Osteoarthritis Index) was a pivotal assessment tool. Comprising 24 inquiries, this instrument captures dimensions of pain (5 items), stiffness (2 items), and function (17 items). Each query offers respondents five graded options ranging from 0 to 4, where 0 signifies an absence of symptoms and 4 denotes the highest intensity of symptoms. Patients evaluated the severity of each symptom based on this predefined scale. The WOMAC index score aggregates responses across all items, subsequently undergoing adjustment through a scaling coefficient.
Meanwhile, to appraise the severity of OA in the study cohort, researchers employed the Lequesne algofunctional index. This self-administered questionnaire is structured into three domains: assessing pain or discomfort, gauging maximal walking distance, and evaluating daily activities.
To evaluate pain, range of motion, and functional impairment in affected joints, it was employed the Visual Analog Scale (VAS). This instrument adopts the format of a 100 mm linear graphical ruler, allowing patients to mark a position along the continuum from 0 to 100. The modified version of the scale includes an initial smiling face against a green background to signify an absence of pain. Using a gradual color gradient from yellow to red and a transformation of facial expression from smiling to frowning, patients indicate on the scale the severity of pain experienced in the affected joint during periods of rest and movement, as well as the presence of inflammation and limitations in joint function. Each unit along the scale corresponds to 1 mm.
For the assessment of fecal α-elastase levels, enzyme-linked immunosorbent assay (ELISA) employing standard proprietary kits was employed.
The colorimetric method was used to determine the level of bilirubin. Alanine aminotransferase (ALT) and aspartate aminotransferase (AST) levels were assessed using the Reitman-Frankel method. Gamma-glutamyl transferase (GGT) and alkaline phosphatase levels were measured using the kinetic colorimetric detection method.
The PEI-Q (Qualitative Assessment of the Symptoms and Impact of Pancreatic Exocrine Insufficiency) questionnaire was employed to evaluate Exocrine Pancreatic Insufficiency (EPI). Comprising 18 questions organized into three domains—abdominal symptoms, bowel movement symptoms, and impact—the questionnaire utilized a scoring system where each item was rated from 0 to 4 according to the patient's selected response. The total symptom score and the total summary score were calculated as the mean value across respective sections, providing a comprehensive assessment of the severity and impact of EPI symptoms on patients' daily lives.
The Gastrointestinal Symptom Rating Scale (GSRS) questionnaire was employed to assess gastrointestinal symptoms. The GSRS consists of 15 items categorized into five scales: abdominal pain (AP), indigestion syndrome (IS), diarrheal syndrome (DS), constipation syndrome (CS), and gastroesophageal reflux syndrome (RS). Each item was evaluated using a 7-point scale, where lower scores denoted milder symptomatology and higher scores indicated more severe gastrointestinal manifestations.
Retinol, tocopherol, thiamine, and pyridoxin levels were quantified using spectrophotometric methods and respective assay systems. 25-hydroxyvitamin D (25-OHD) levels were determined using enzyme-linked immunosorbent assay (ELISA) kits specific for 25-OHD.
The body mass index (BMI) was computed using the formula:
BMI = M / H²
where M denotes body weight measured in kilograms, and H represents height measured in meters. A BMI falling between 18.5 and 24.9 was considered within the normal range.
The concentrations of red blood cells (RBC), white blood cells (WBC), and hemoglobin were assessed using an automated hematology analyzer. Serum ferritin levels were quantitatively assessed using the Ferritin Audit Diagnostics reagent kit and an enzyme-linked immunosorbent assay (ELISA) method.
Transferrin levels in serum were quantified using an automated assay method employing Transferin Audit Diagnostics reagents and an enzyme-linked immunosorbent assay (ELISA) method.
The concentration of C-reactive protein (CRP) was assessed using the latex turbidimetric method.

2.3. Statistical Analysis

Patient demographics and clinical data underwent thorough evaluation and were reported using descriptive statistics. The Shapiro-Wilk test was used to assess the normality of the data distribution. Because the data were not normally distributed, medians and interquartile ranges were computed for all variables. A statistical significance level (p) of less than 0.05 was employed for hypothesis testing.
The Mann-Whitney U test was applied to assess differences between two independent groups. For comparisons involving three or more groups, the Kruskal-Wallis test was employed. Subsequently, Dunn’s multiple comparison test was performed to evaluate pairwise differences between groups in post hoc analysis.
Spearman's rank correlation coefficient was computed to examine the associations among continuous variables as part of a correlation matrix analysis.
The diagnostic significance of predictors for the presence of comorbidity between osteoarthritis and CP, as well as the development of exocrine pancreatic insufficiency in osteoarthritis, was evaluated using ROC curves (Receiver Operating Characteristic). This analysis included the calculation of ROC metrics such as the Area Under the ROC Curve (AUC) with a 95% confidence interval (CI), the Youden index (J), associated cutoff point, sensitivity (Se), and specificity (Sp).
Binary logistic regression was employed to identify potential predictors associated with the development of exocrine pancreatic insufficiency in osteoarthritis patients.
Principal component analysis (PCA) was conducted to identify factors related to the comorbidity of osteoarthritis and CP.
Statistical analyses were conducted using commercially available software packages, including IBM SPSS Statistics (version 25).

3. Results

3.1. Comparing Group Expression

The study included 150 patients, who were divided based on the type of pathology being studied and the presence of comorbidities. The control group consisted of 30 practically healthy patients who did not have chronic musculoskeletal and digestive diseases (53.3% male; median age 43 years, IQR 40–50 years). The second group included 68 patients with osteoarthritis (55.9% male; median age 45 years, IQR 38.75–51.25 years). The third group included 52 patients with comorbid OA and CP (53.8% male; median age 44 years, IQR 38–51 years). All three groups had no statistical differences in age (p = 0.7736) and gender (p = 0.9349). There was also no statistical difference found between the duration of OA in the second (median seven years, IQR 5–9 years) and third groups (median eight years, IQR 6–9 years) (p = 0.069). The initial demographic characteristics showed no statistically significant differences between the three groups.
The next stage of the study was to compare the indicators of OA course in a group of patients with OA and in conditions of comorbidity of OA and CP. No significant difference in the Kellgren-Lawrence grade of OA was observed between the group of patients with OA and the group of patients with the comorbidity of OA and CP (p = 0.1437). It was established that the WOMAC indices for pain (p < 0.001), stiffness (p = 0.02), function (p < 0.001), and total (p < 0.001) were higher in the group of patients with comorbidity of OA and CP compared to the group of patients with OA. In the examination of the Lequesne Algofunctional Index, it was noted that this measure exhibited greater values in the cohort of patients experiencing comorbidity compared to those with OA alone (p < 0.001). Furthermore, it was observed that the presence of both OA and CP led to elevated scores in various indices, including VAS assessments for joint pain, movement, inflammation, and joint dysfunction, in comparison to the group solely diagnosed with OA (p < 0.001) (Table 1).
Examination of fecal elastase-1 levels revealed significant differences among the patient groups studied (p < 0.001). Levels of fecal elastase-1 were found to be lower compared to the control group (p < 0.001). Additionally, patients with comorbid OA and CP showed a decrease in fecal elastase-1 levels compared to those with OA alone (p < 0.001) (Table 2).
No significant differences were observed in the levels of total bilirubin (p = 0.1767), direct bilirubin (p = 0.1767), indirect bilirubin (p = 0.6505), ALT (p = 0.0787), AST (p = 0.1886), GGT (p = 0.7773), and alkaline phosphatase (p = 0.0633) among the groups under study.
The PEI-Q scale indicators analysis detected abdominal and bowel movement symptoms among patients with OA as per the questionnaire; nevertheless, the overall symptom score did not surpass 0.6 points. Furthermore, PEI-Q scores were higher in patients with comorbid OA and CP compared to those with OA alone (p < 0.001) (Table 2).
The presence of gastrointestinal symptoms was established in the group of patients with OA according to the GSRS questionnaire scales. However, the levels of indicators on all scales of the GSRS questionnaire were higher in patients with comorbidity of OA and CP compared to the group of patients with OA (p < 0.001). The highest level of scores in both groups of patients was on the abdominal pain scale of the GSRS questionnaire (Table 2).
Examination of fat-soluble vitamins retinol, tocopherol, and 25(OH) vitamin D3 levels revealed significant differences among all studied groups (p < 0.001). Patients with OA exhibited lower levels of these fat-soluble vitamins compared to the control group (p < 0.001). Furthermore, a reduction in the levels of all examined vitamins was noted in patients with comorbid OA and CP compared to those with OA alone (p < 0.001) (Table 3). The study found no significant differences in the levels of thiamine (p = 0.6889) and pyridoxin (p = 0.1408) among the groups.
Upon analysis of BMI, varying levels of this parameter were identified across all investigated groups (p < 0.001). The OA group had the highest BMI (p < 0.001). In the cohort with comorbid OA and CP, BMI was lower than in the OA group (p < 0.001) but higher compared to the control group (p < 0.001) (Table 3).
The study revealed no significant differences in the levels of RBC (p = 0.0688), WBC (p = 0.065), and hemoglobin (p = 0.3282) across the groups.
Differences in iron and ferritin levels were observed across all studied groups (p < 0.001). Patients with OA exhibited lower levels of iron and ferritin compared to the control group (p < 0.001). Furthermore, those with comorbid OA and CP showed lower indicator levels than those with the OA group (p < 0.001). Diverse levels of transferrin were also identified among all examined groups (p < 0.001). The highest transferrin levels were observed in the group of patients diagnosed with OA and CP (p < 0.001). Patients with OA showed lower levels of this biomarker compared to the comorbidity group, yet higher levels compared to the control group (p < 0.001) (Table 3).
Analysis of CRP levels revealed distinct variations among all investigated groups (p < 0.001). The highest levels of CRP were detected in the group of patients with comorbid OA and CP (p < 0.001). Within the CP group alone, CRP levels were lower compared to the comorbidity group (p < 0.001) but higher compared to the control group (p < 0.001) (Table 3).

3.2. Correlation Analysis of Data in Patients with OA and OA+CP

This section examines the correlations between various clinical parameters in OA patients without CP. The analysis utilized Spearman’s rank correlation coefficient (r) to evaluate the strength and direction of these associations (Figure 1).
The OA duration demonstrated positive and negative correlations with multiple parameters. These correlations encompassed WOMAC total score (r = 0.37, p = 0.002), Lequesne Algofunctional Index (r = 0.39, p = 0.0009), VAS joint pain (r = 0.45, p = 0.0001), fecal elastase-1 (r = -0.71, p < 0.001), PEI-Q (r = 0.29, p = 0.016), retinol (r = -0.68, p < 0.001), tocopherol (r = -0.49, p < 0.001), CRP (r = 0.37, p = 0.002).
The WOMAC total score exhibited positive correlations with Lequesne Algofunctional Index (r = 0.38, p = 0.002), VAS joint pain (r = 0.59, p < 0.001), PEI-Q (r = 0.44, p = 0.0002), CRP (r = 0.30, p = 0.012).
The Lequesne Algofunctional Index showed positive correlations with retinol (r = -0.32, p = 0.007) and CRP (r = 0.32, p = 0.007).
The VAS joint pain displayed positive and negative correlations with fecal elastase-1 (r = -0.30, p = 0.011), PEI-Q (r = 0.42, p = 0.0003), retinol (r = -0.39, p = 0.0003).
The fecal elastase-1 exhibited positive and negative correlations with PEI-Q (r = -0.35, p = 0.0039), retinol (r = 0.51, p < 0.001), and CRP (r = -0.39, p = 0.001).
The PEI-Q showed a negative correlation with retinol (r = -0.31, p = 0.009).
The retinol demonstrated positive and negative correlations with tocopherol (r = 0.67, p < 0.001), CRP (r = -0.32, p = 0.007).
The following section investigates the correlations between diverse clinical parameters in OA patients with CP. Spearman’s rank correlation coefficient (r) was employed to assess the magnitude and direction of these relationships (Figure 2).
The duration of OA exhibited both positive and negative correlations with various parameters. These correlations included the WOMAC total score (r = 0.57, p < 0.001), Lequesne Algofunctional Index (r = 0.47, p = 0.0005), VAS joint pain (r = 0.46, p = 0.0005), fecal elastase-1 (r = -0.28, p = 0.04), PEI-Q (r = 0.78, p < 0.001), retinol (r = -0.54, p < 0.001), tocopherol (r = -0.70, p < 0.001).
The WOMAC total score displayed positive and negative correlations with Lequesne Algofunctional Index (r = 0.36, p = 0.008), VAS joint pain (r = 0.65, p < 0.001), fecal elastase-1 (r = -0.48, p = 0.0004), PEI-Q (r = 0.62, p < 0.001), retinol (r = -0.62, p < 0.001), tocopherol (r = -0.32, p = 0.019) and CRP (r = -0.43, p = 0.001).
The Lequesne Algofunctional Index showed positive and negative correlations with VAS joint pain (r = 0.32, p = 0.022), fecal elastase-1 (r = -0.39, p = 0.004), PEI-Q (r = 0.44, p = 0.0009).
The VAS joint pain exhibited positive and negative correlations with fecal elastase-1 (r = -0.49, p = 0.0003), PEI-Q (r = 0.37, p = 0.007), retinol (r = -0.62, p < 0.001), tocopherol (r = -0.31, p = 0.025) and CRP (r = -0.65, p < 0.001).
The fecal elastase-1 demonstrated positive and negative correlations with PEI-Q (r = -0.37, p = 0.006), retinol (r = 0.32, p = 0.02), CRP (r = 0.36, p = 0.0098).
The PEI-Q showed negative correlations with retinol (r = -0.59, p < 0.001) and tocopherol (r = -0.64, p < 0.001).
The retinol exhibited positive correlations with tocopherol (r = 0.49, p = 0.0003) and CRP (r = 0.45, p = 0.00008).

3.3. Predictors Analysis of OA and CP comorbidity and EPI
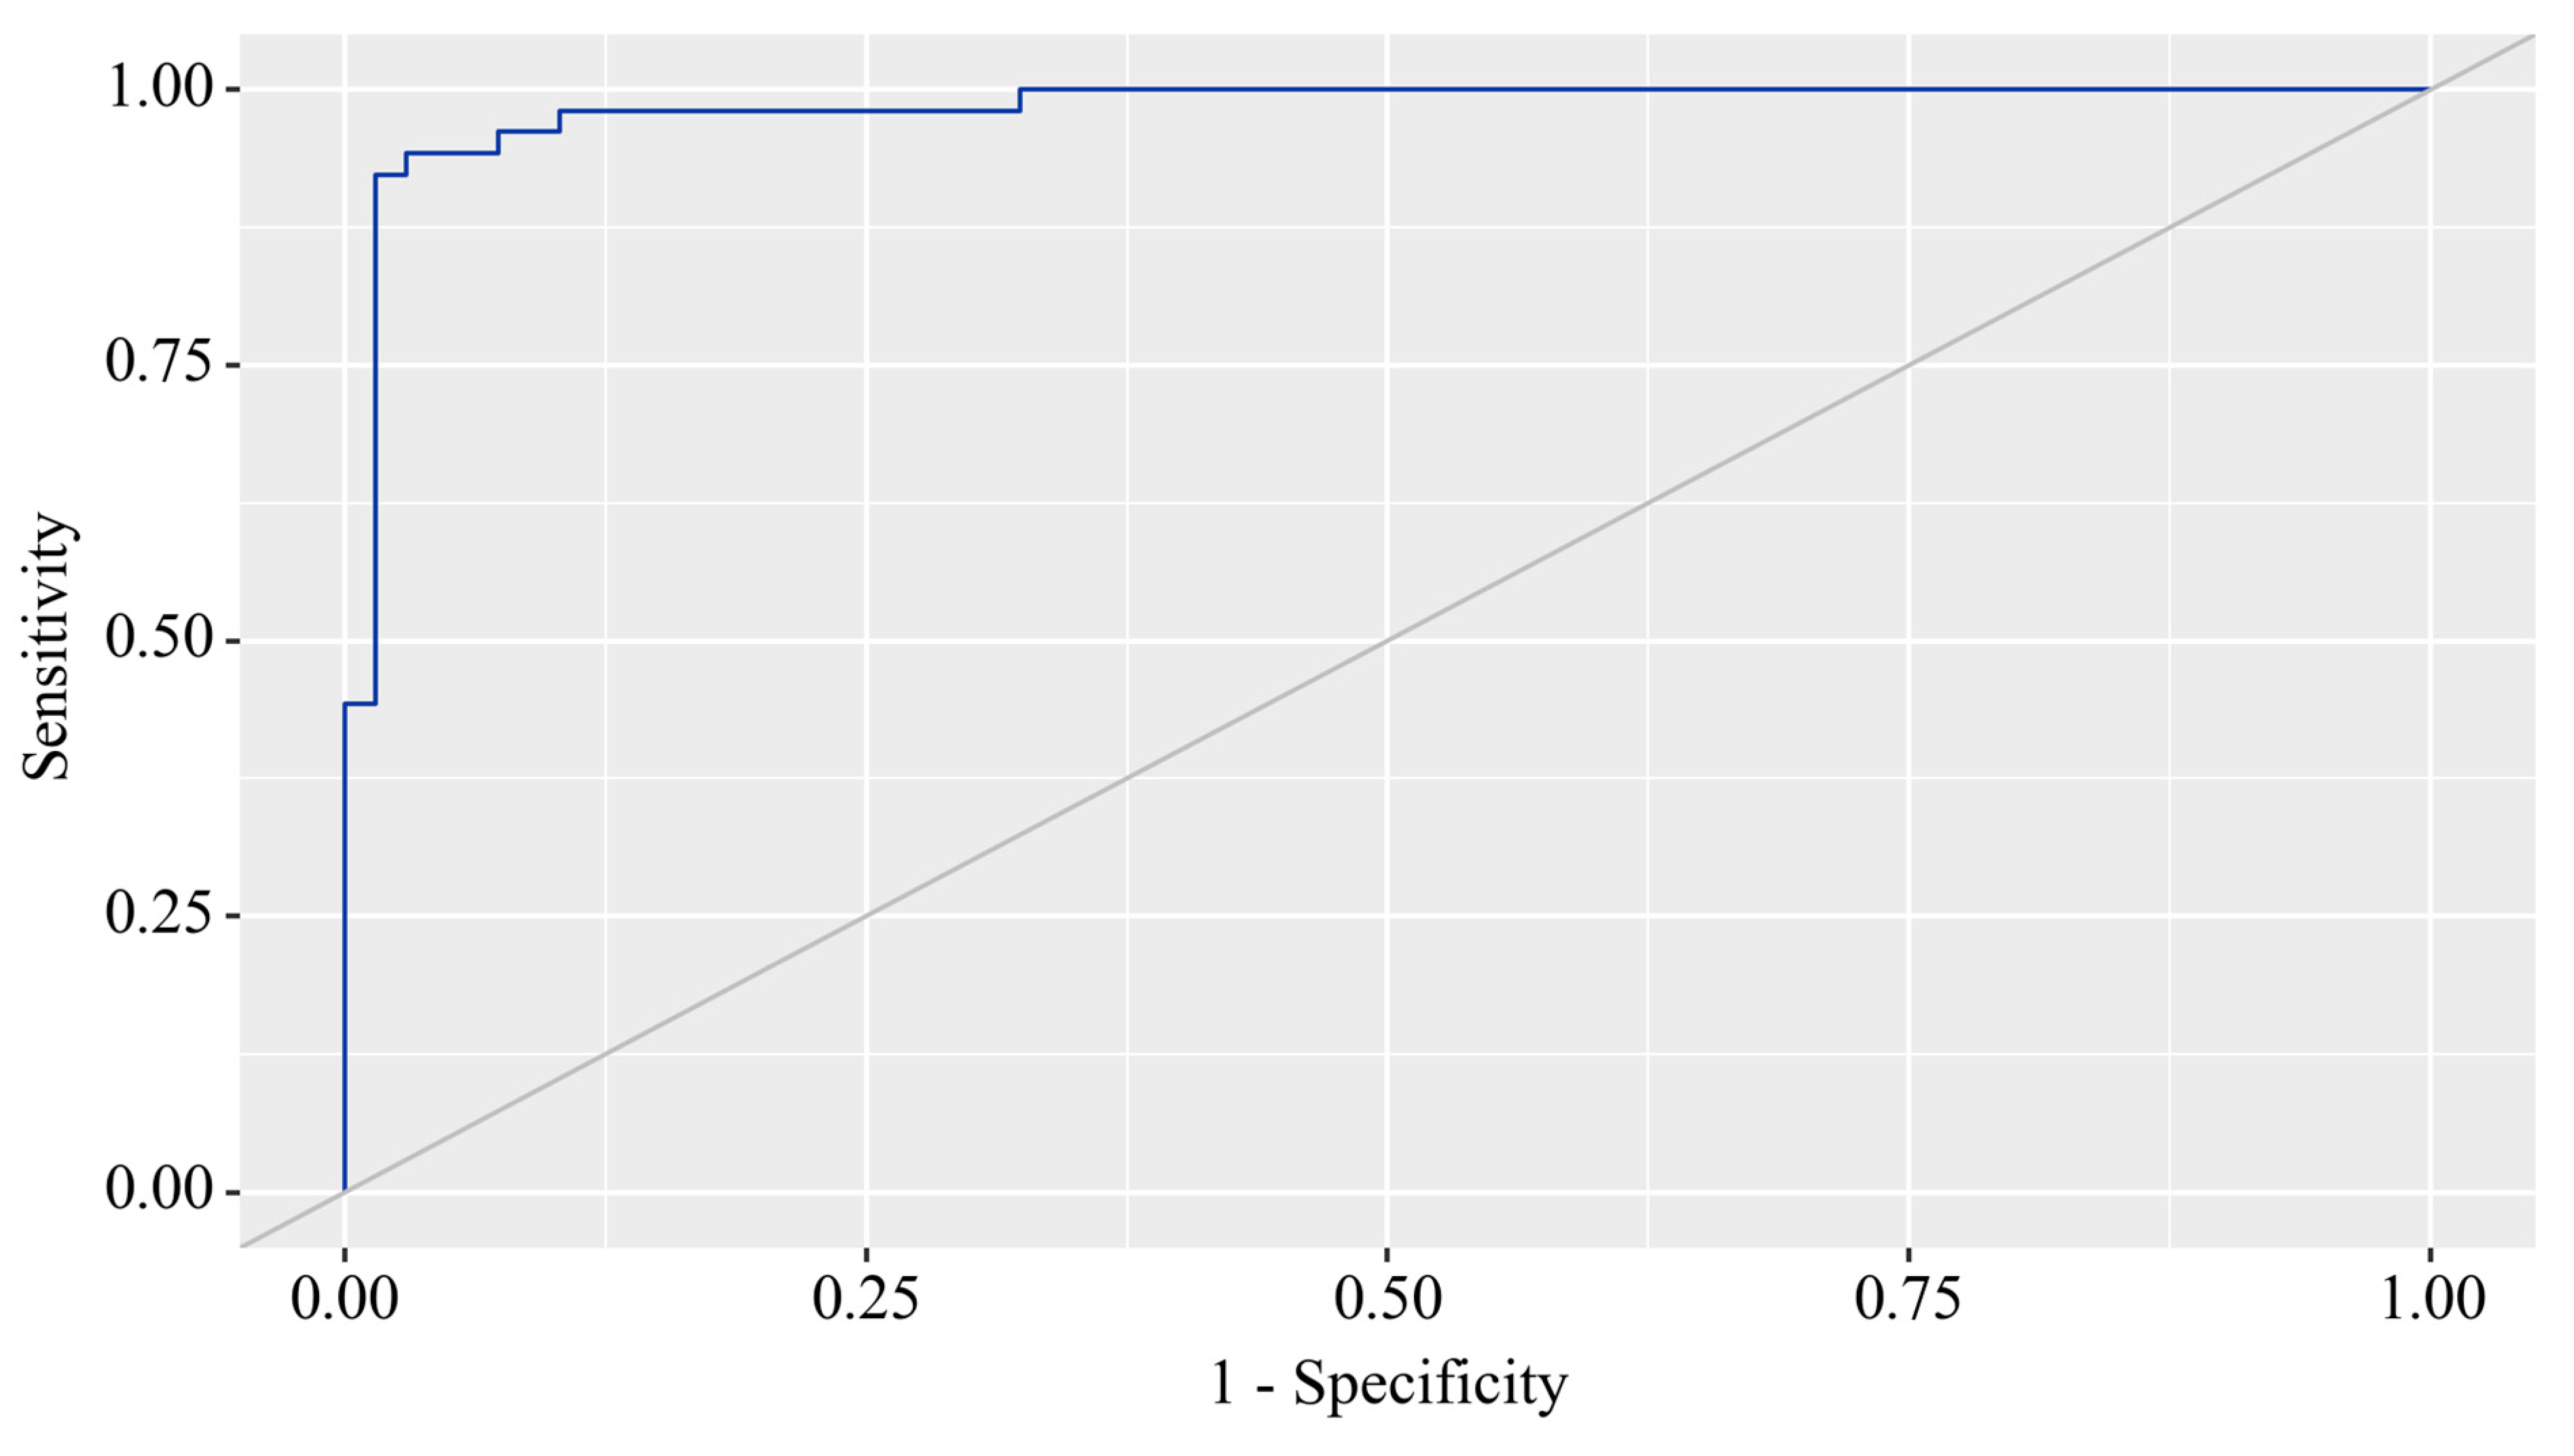
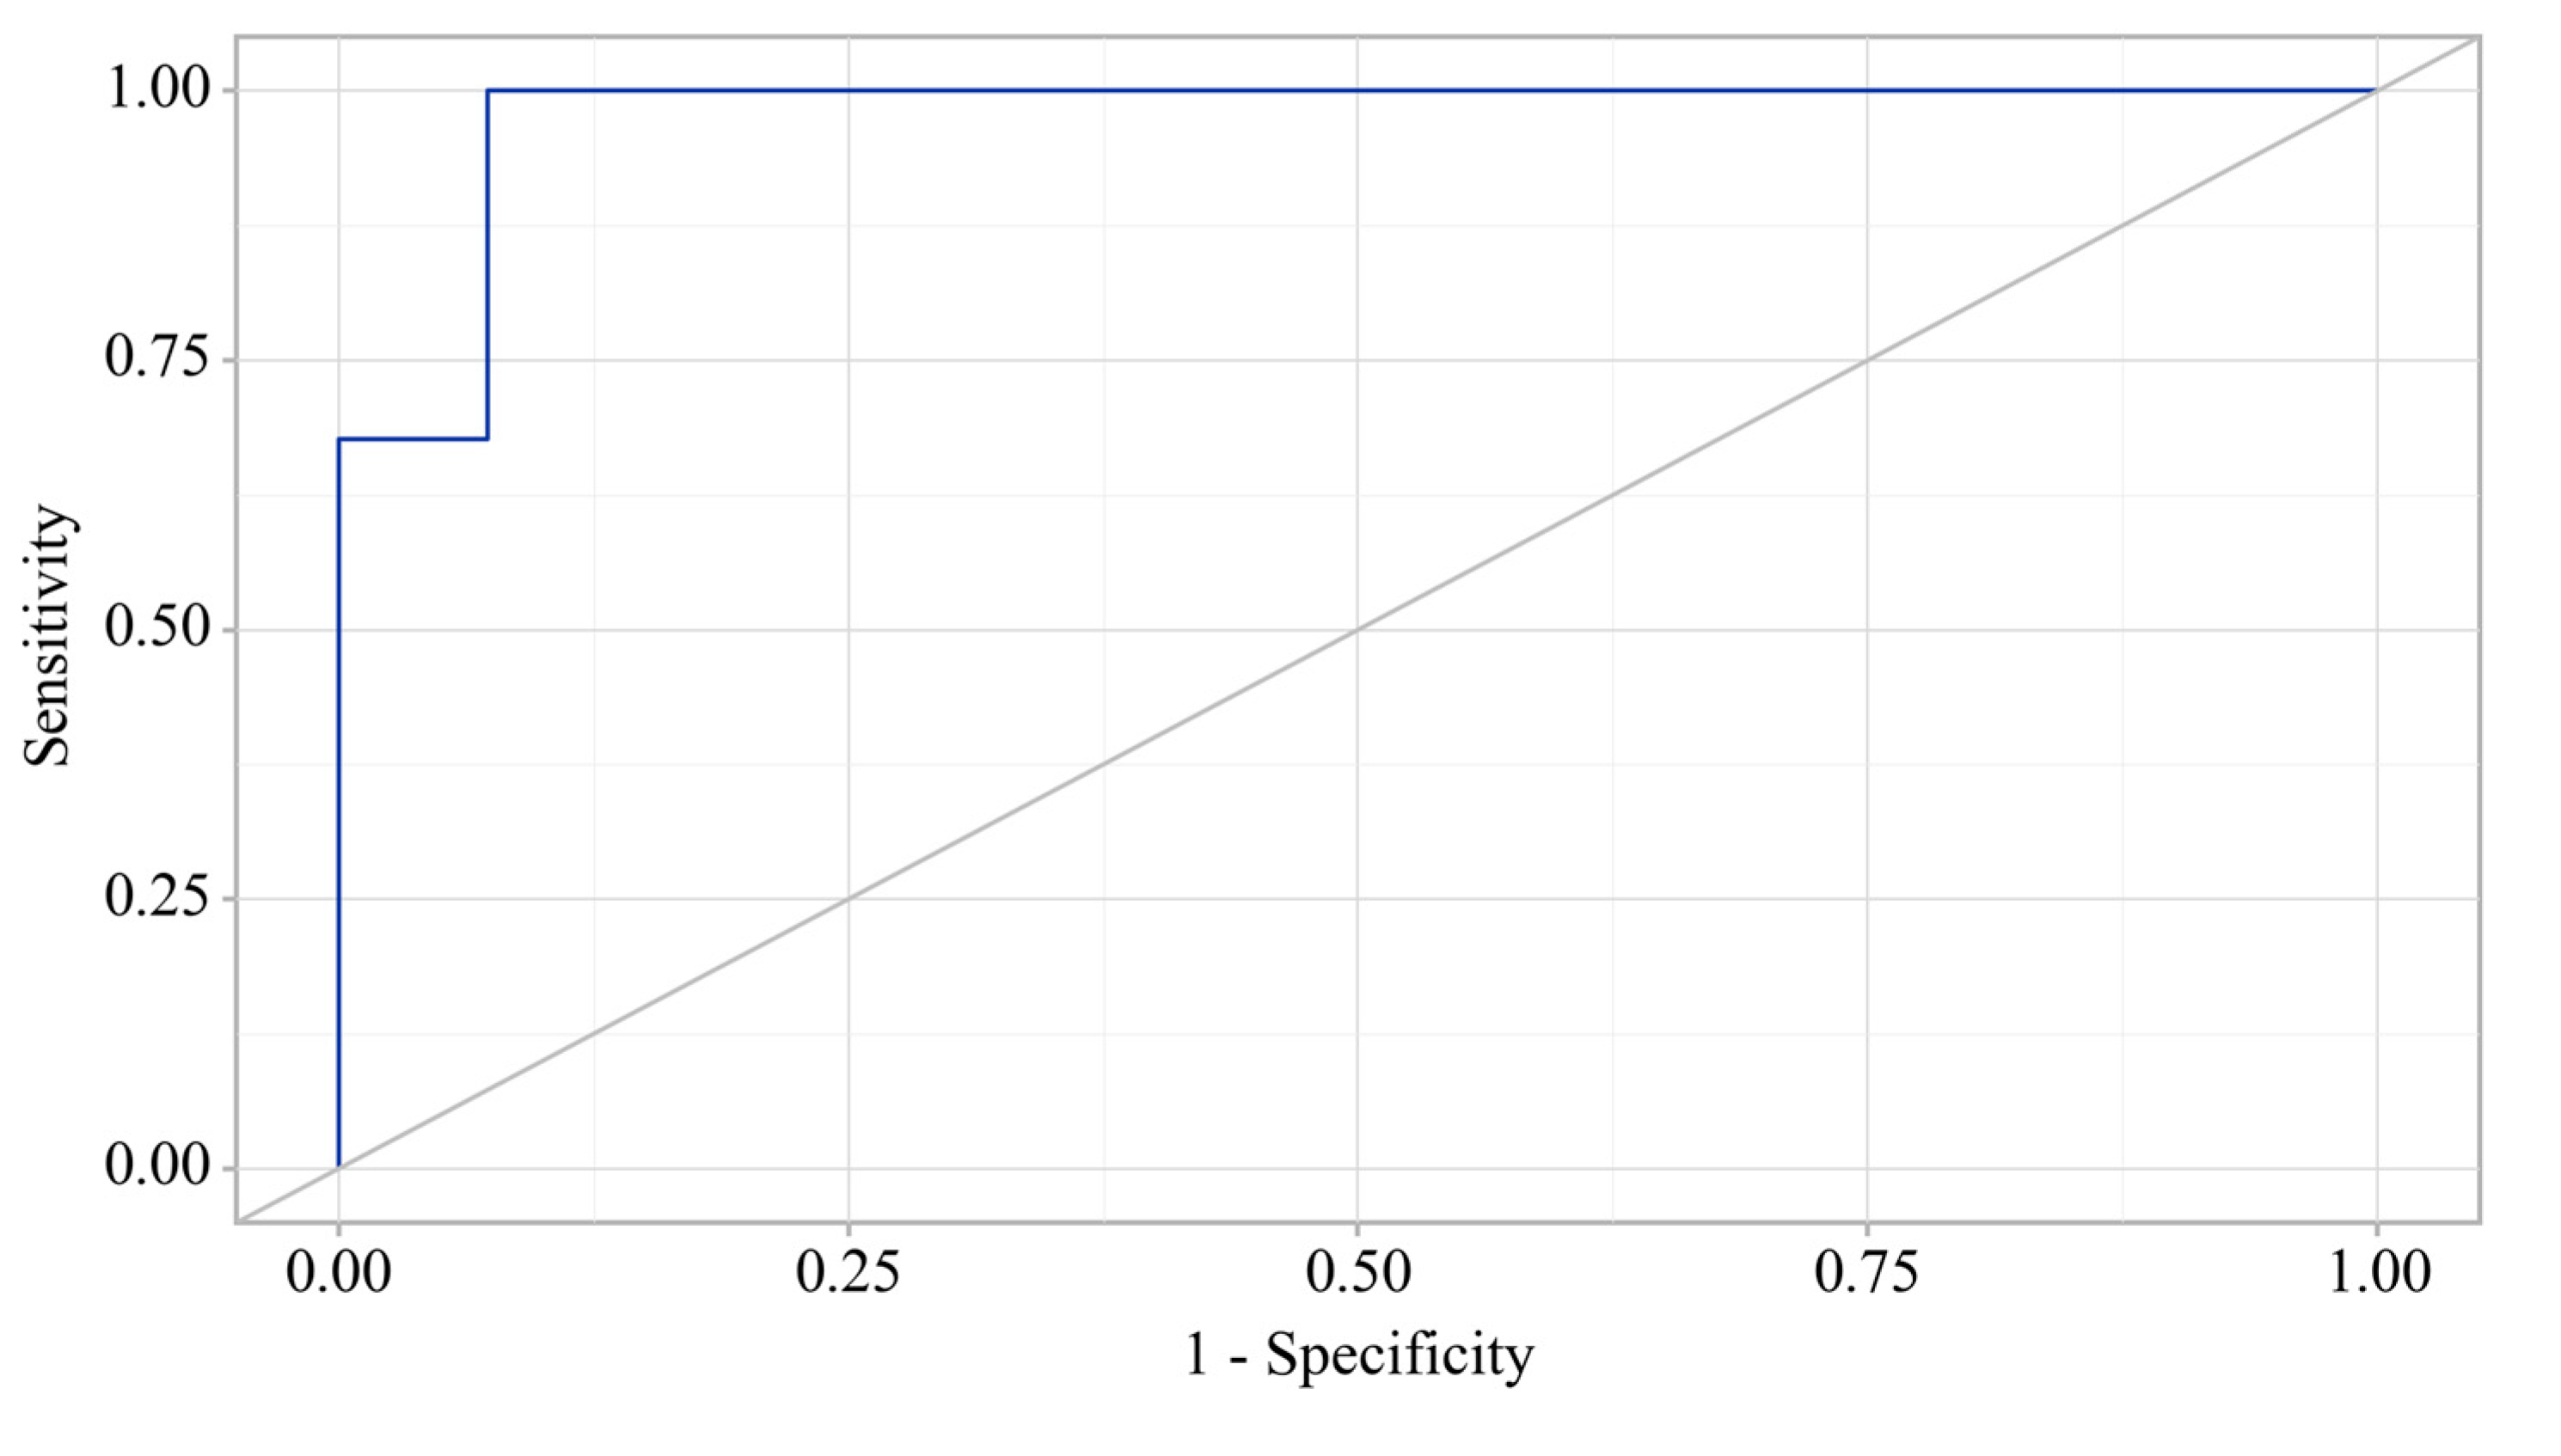
Using the ROC analysis, we examined predictors influencing the comorbidity formation of OA and CP. BMI emerged as a significant predictor of this comorbidity formation.
Figure 3. ROC curve characterizing the relationship between BMI and the comorbidity formation of OA and CP.
Preprints 112058 g003
The area under the ROC curve was 0.983 ± 0.011, with a 95% confidence interval ranging from 0.960 to 1.000. The generated model demonstrated statistical significance (p < 0.001).
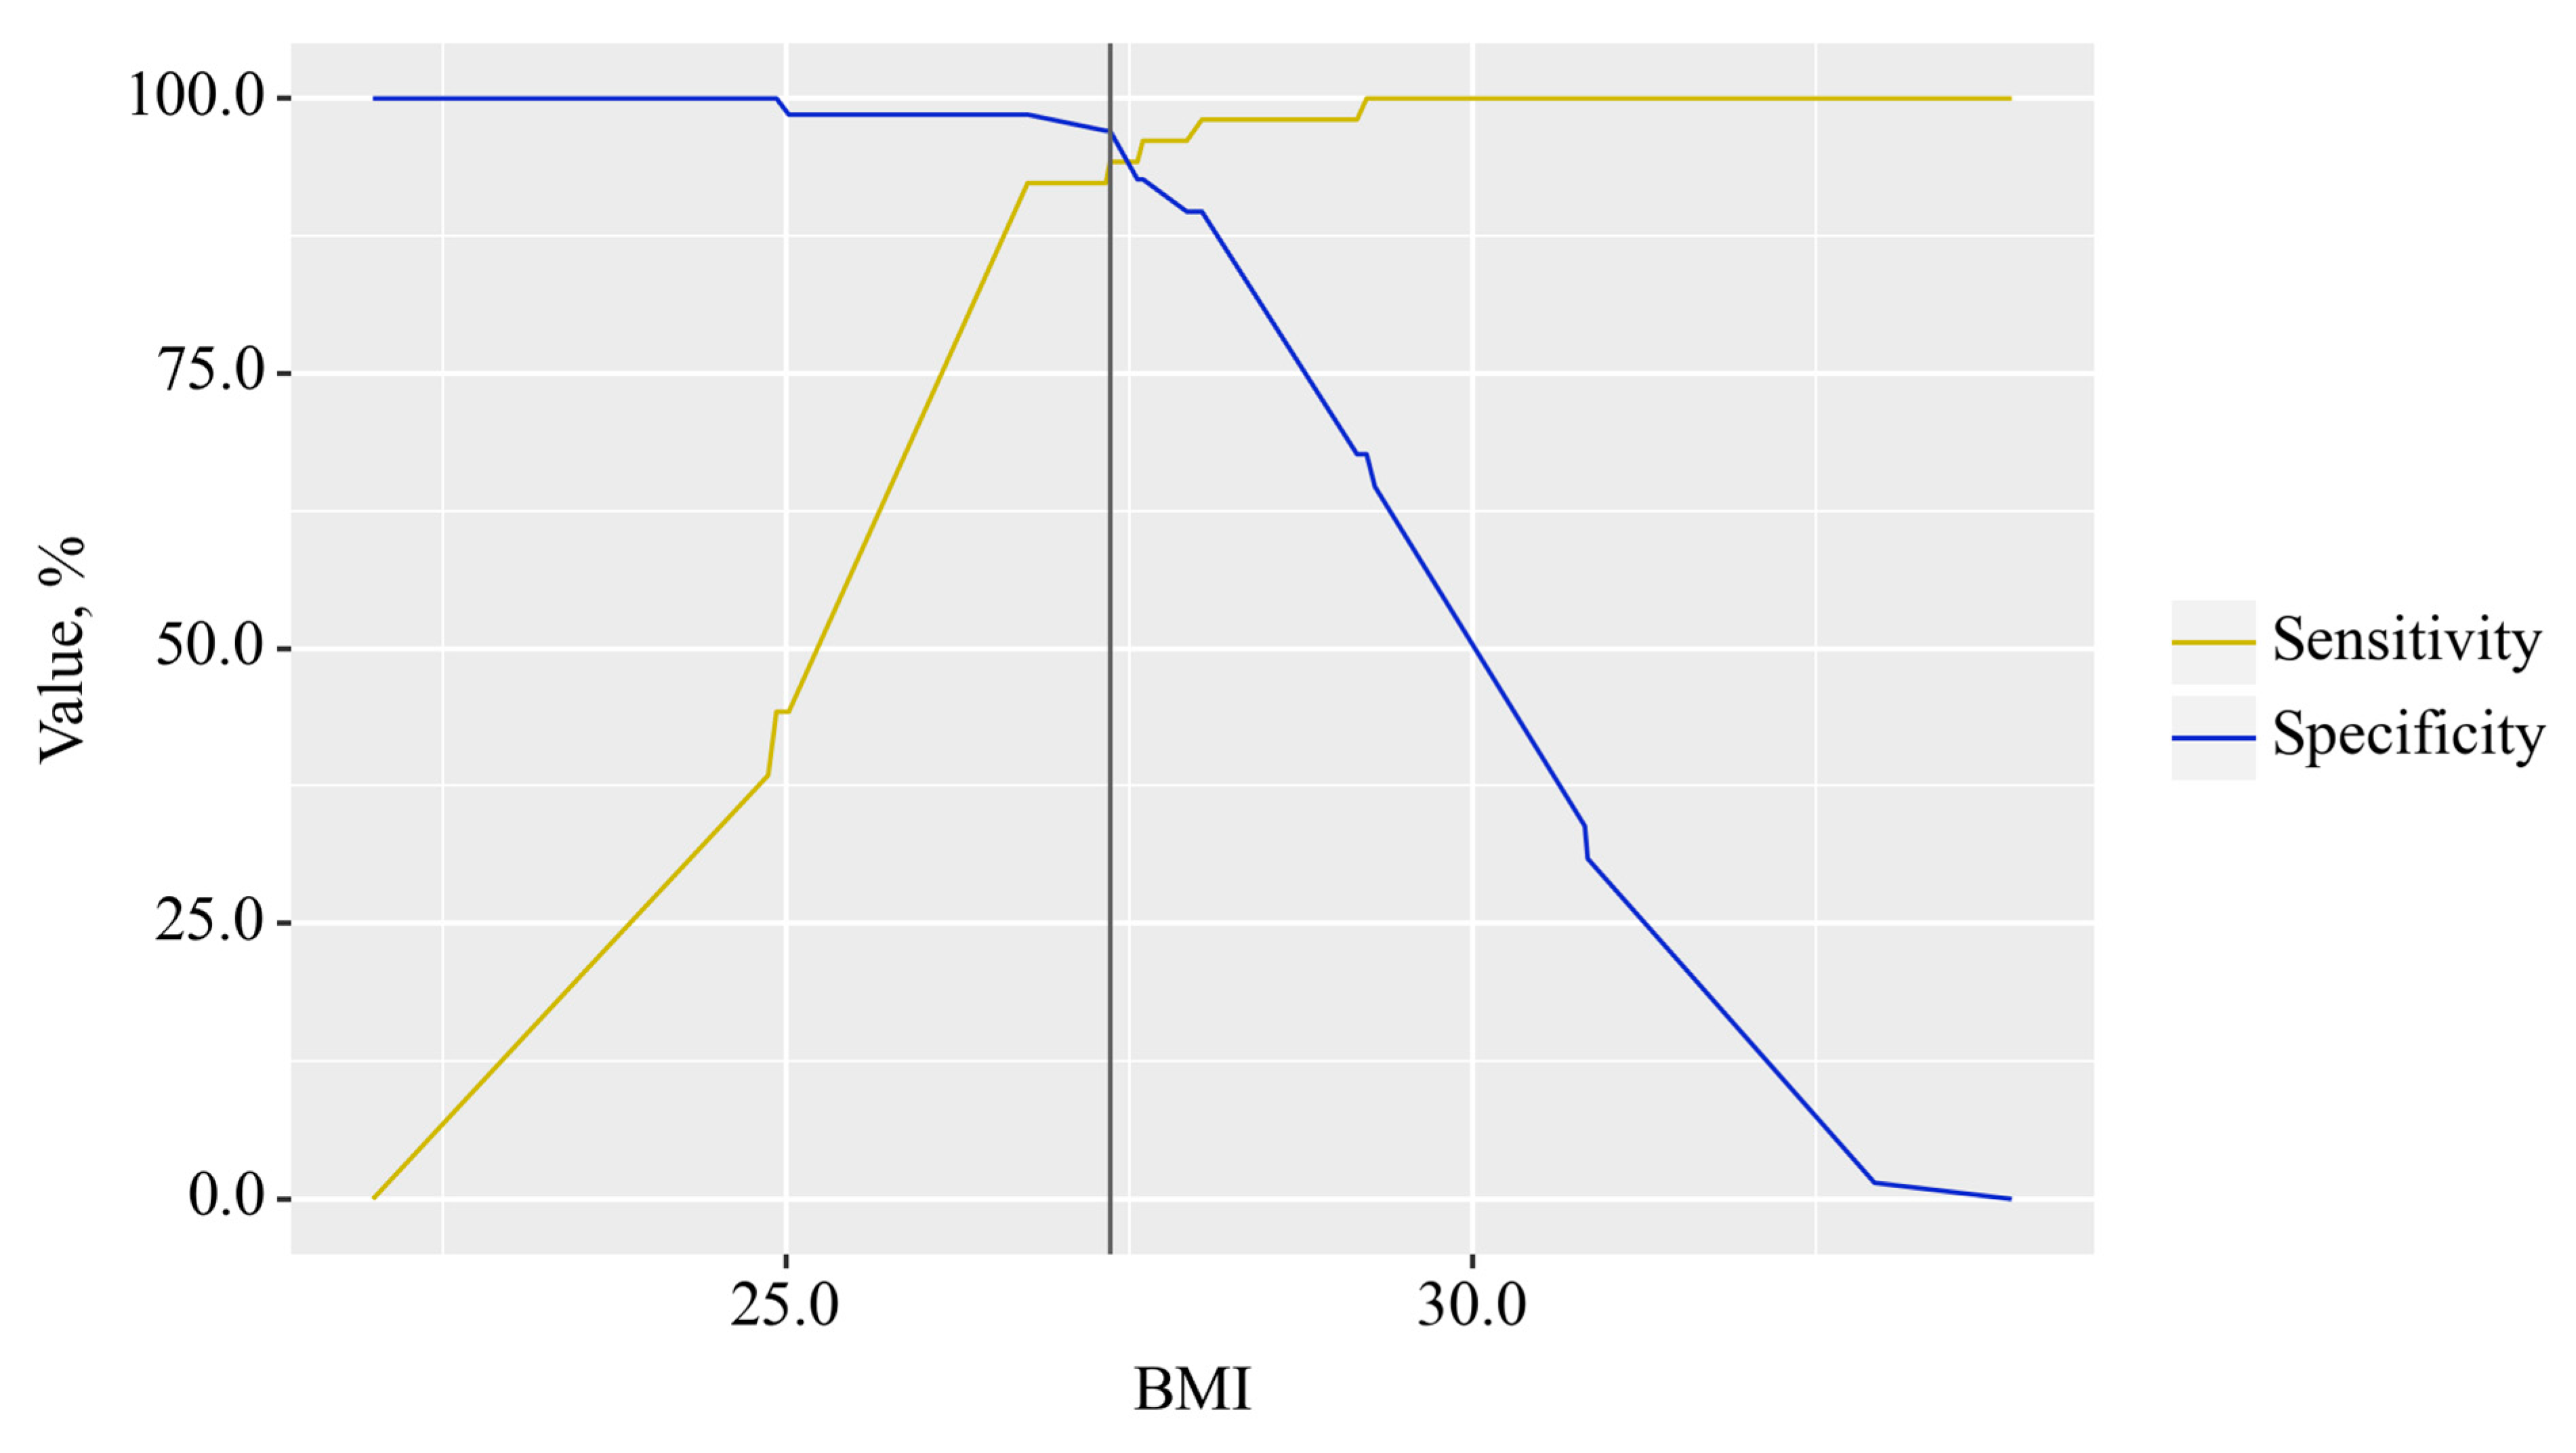
The BMI cut-off value corresponding to the highest Youden's J statistic was determined to be 27.360. Predictive outcomes indicated that BMI values below this threshold were associated with comorbidity of OA and CP. The method's sensitivity and specificity were calculated as 94.2% and 97.1%, respectively (Figure 4).
In the study of EPI predictors in patients with OA, ROC analysis identified fecal elastase-1 as a potential predictor for EPI occurrence in this patient population (Figure 5).
The area under the ROC curve was 0.976 ± 0.012, with a 95% confidence interval of 0.952 to 1.000. The generated model showed statistical significance (p < 0.001).
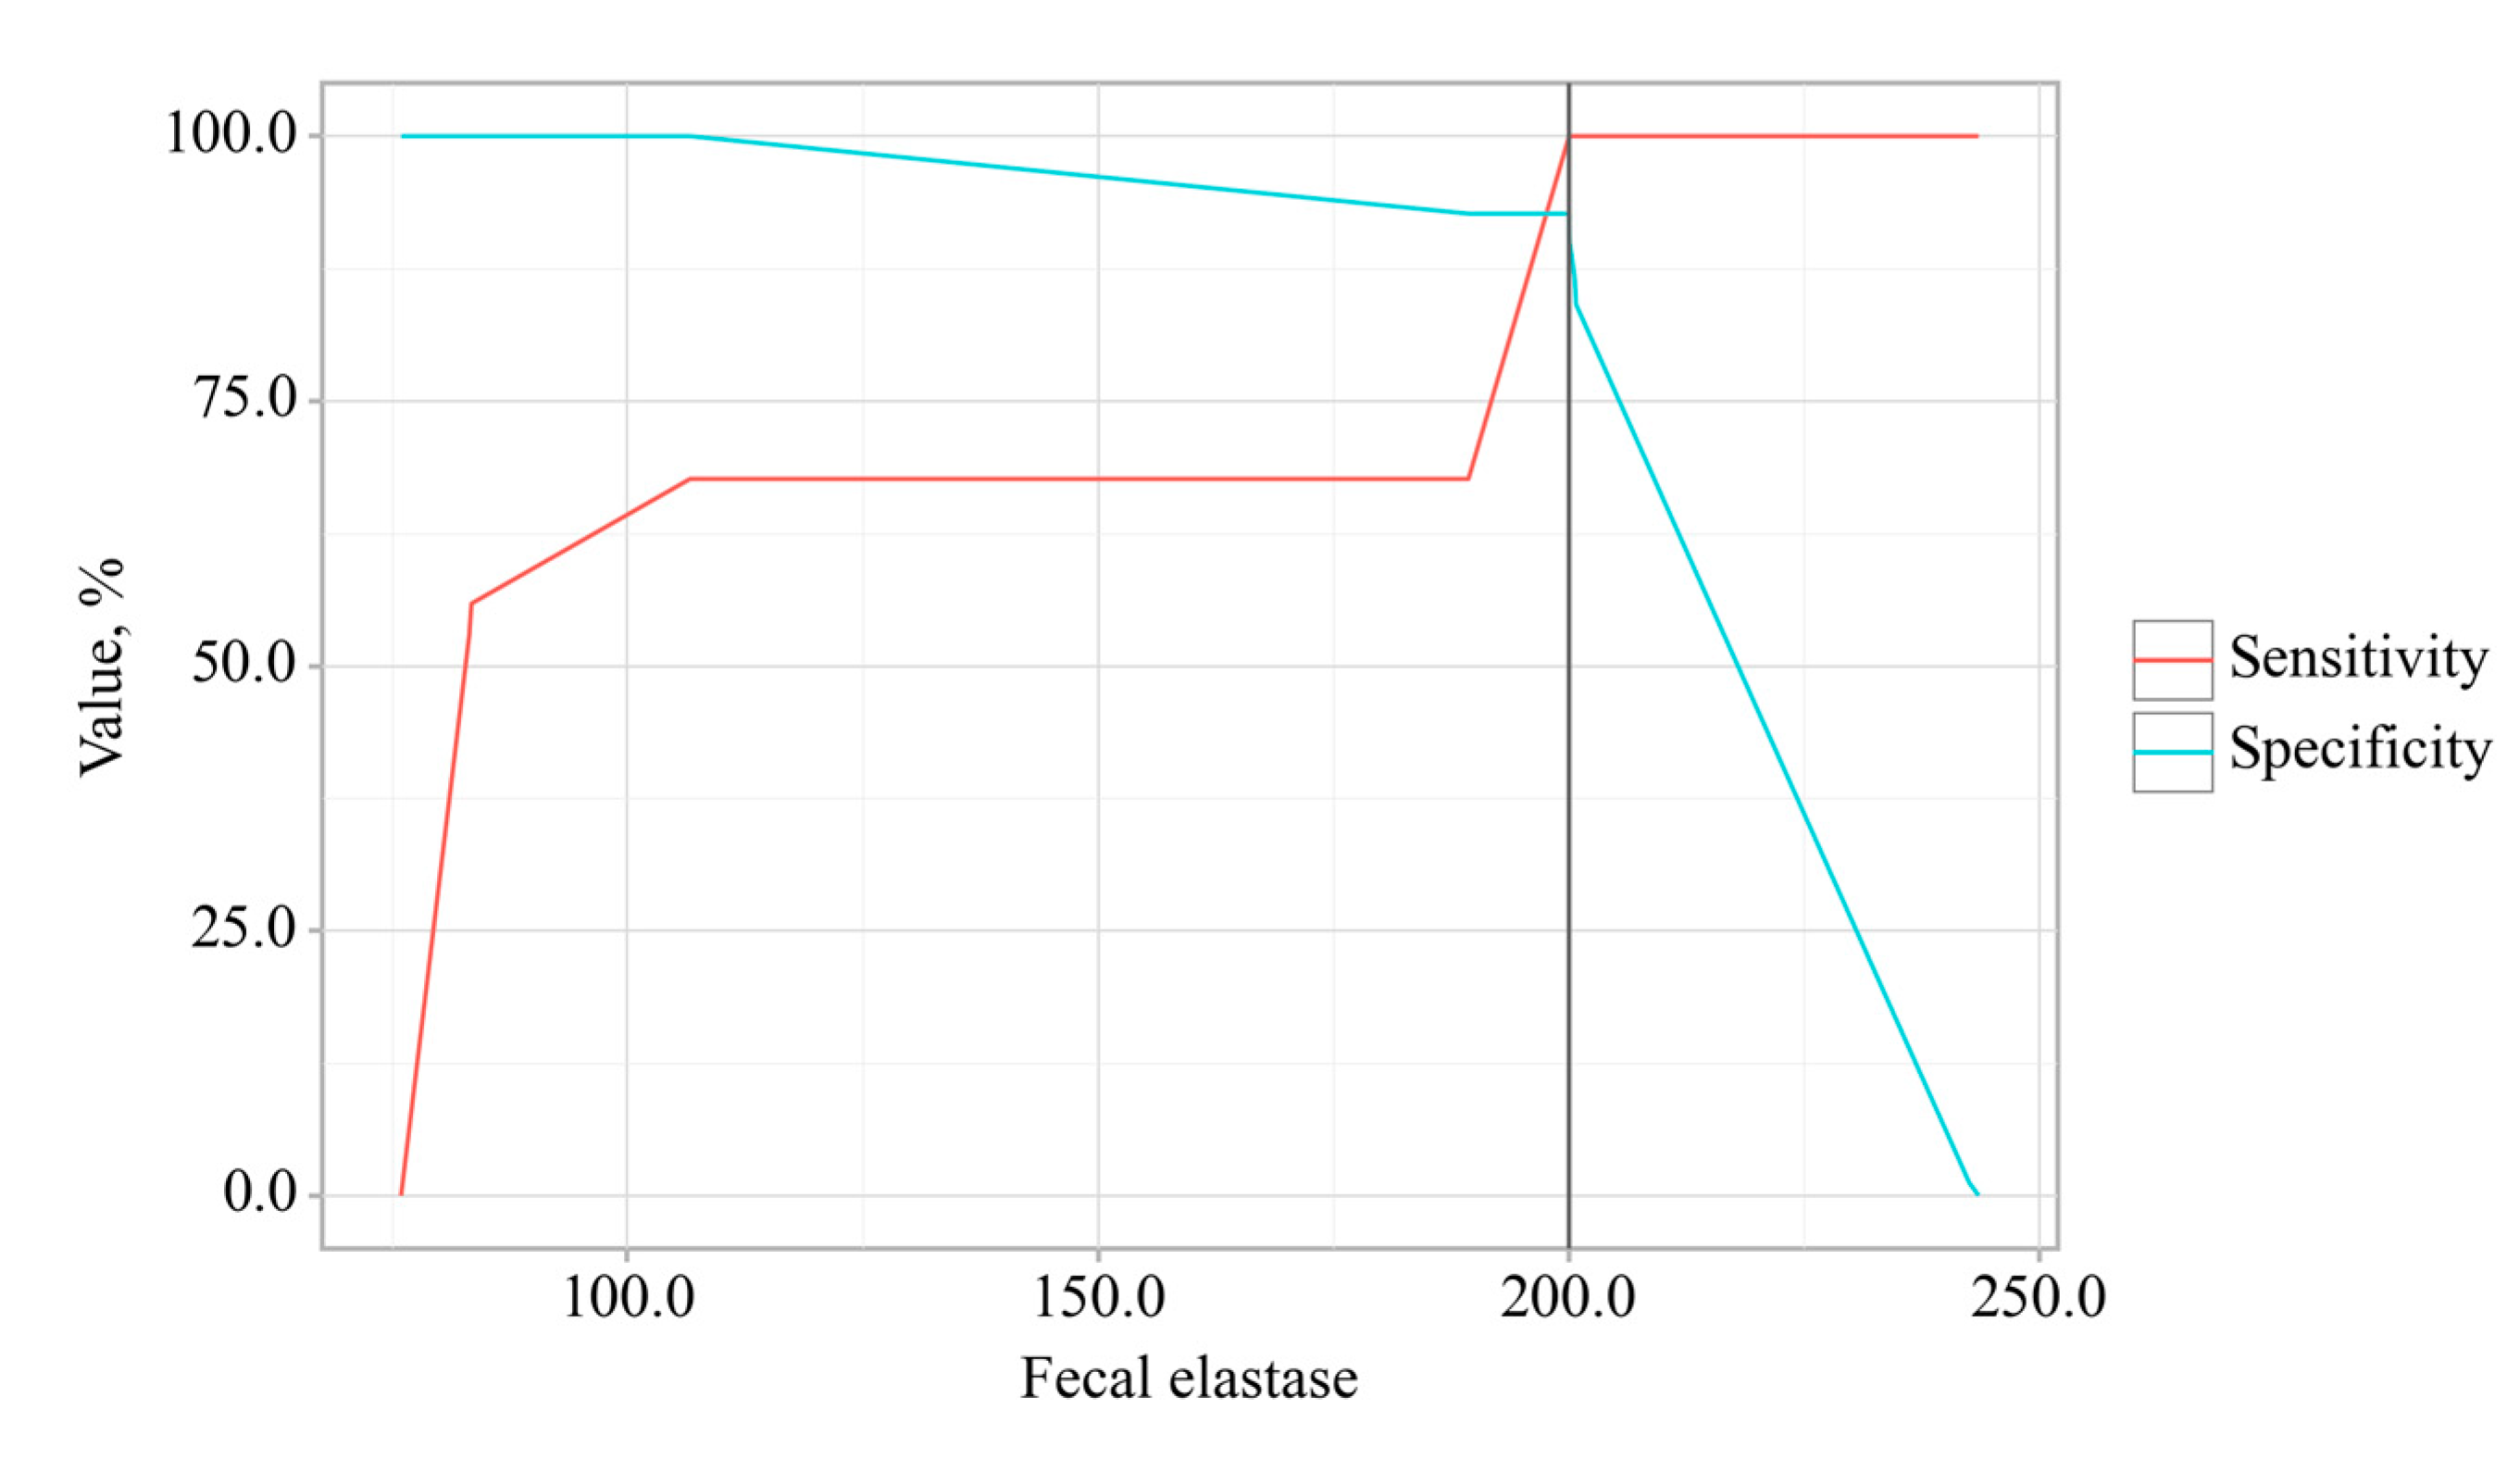
The cut-off value for fecal elastase corresponding to the highest Youden's J statistic was determined to be 200.060. Predictions indicated that fecal elastase-1 levels below this threshold were associated with EPI. The method's sensitivity and specificity were calculated as 100.0% and 92.7%, respectively (Figure 6).

3.4. Principal Component Analysis

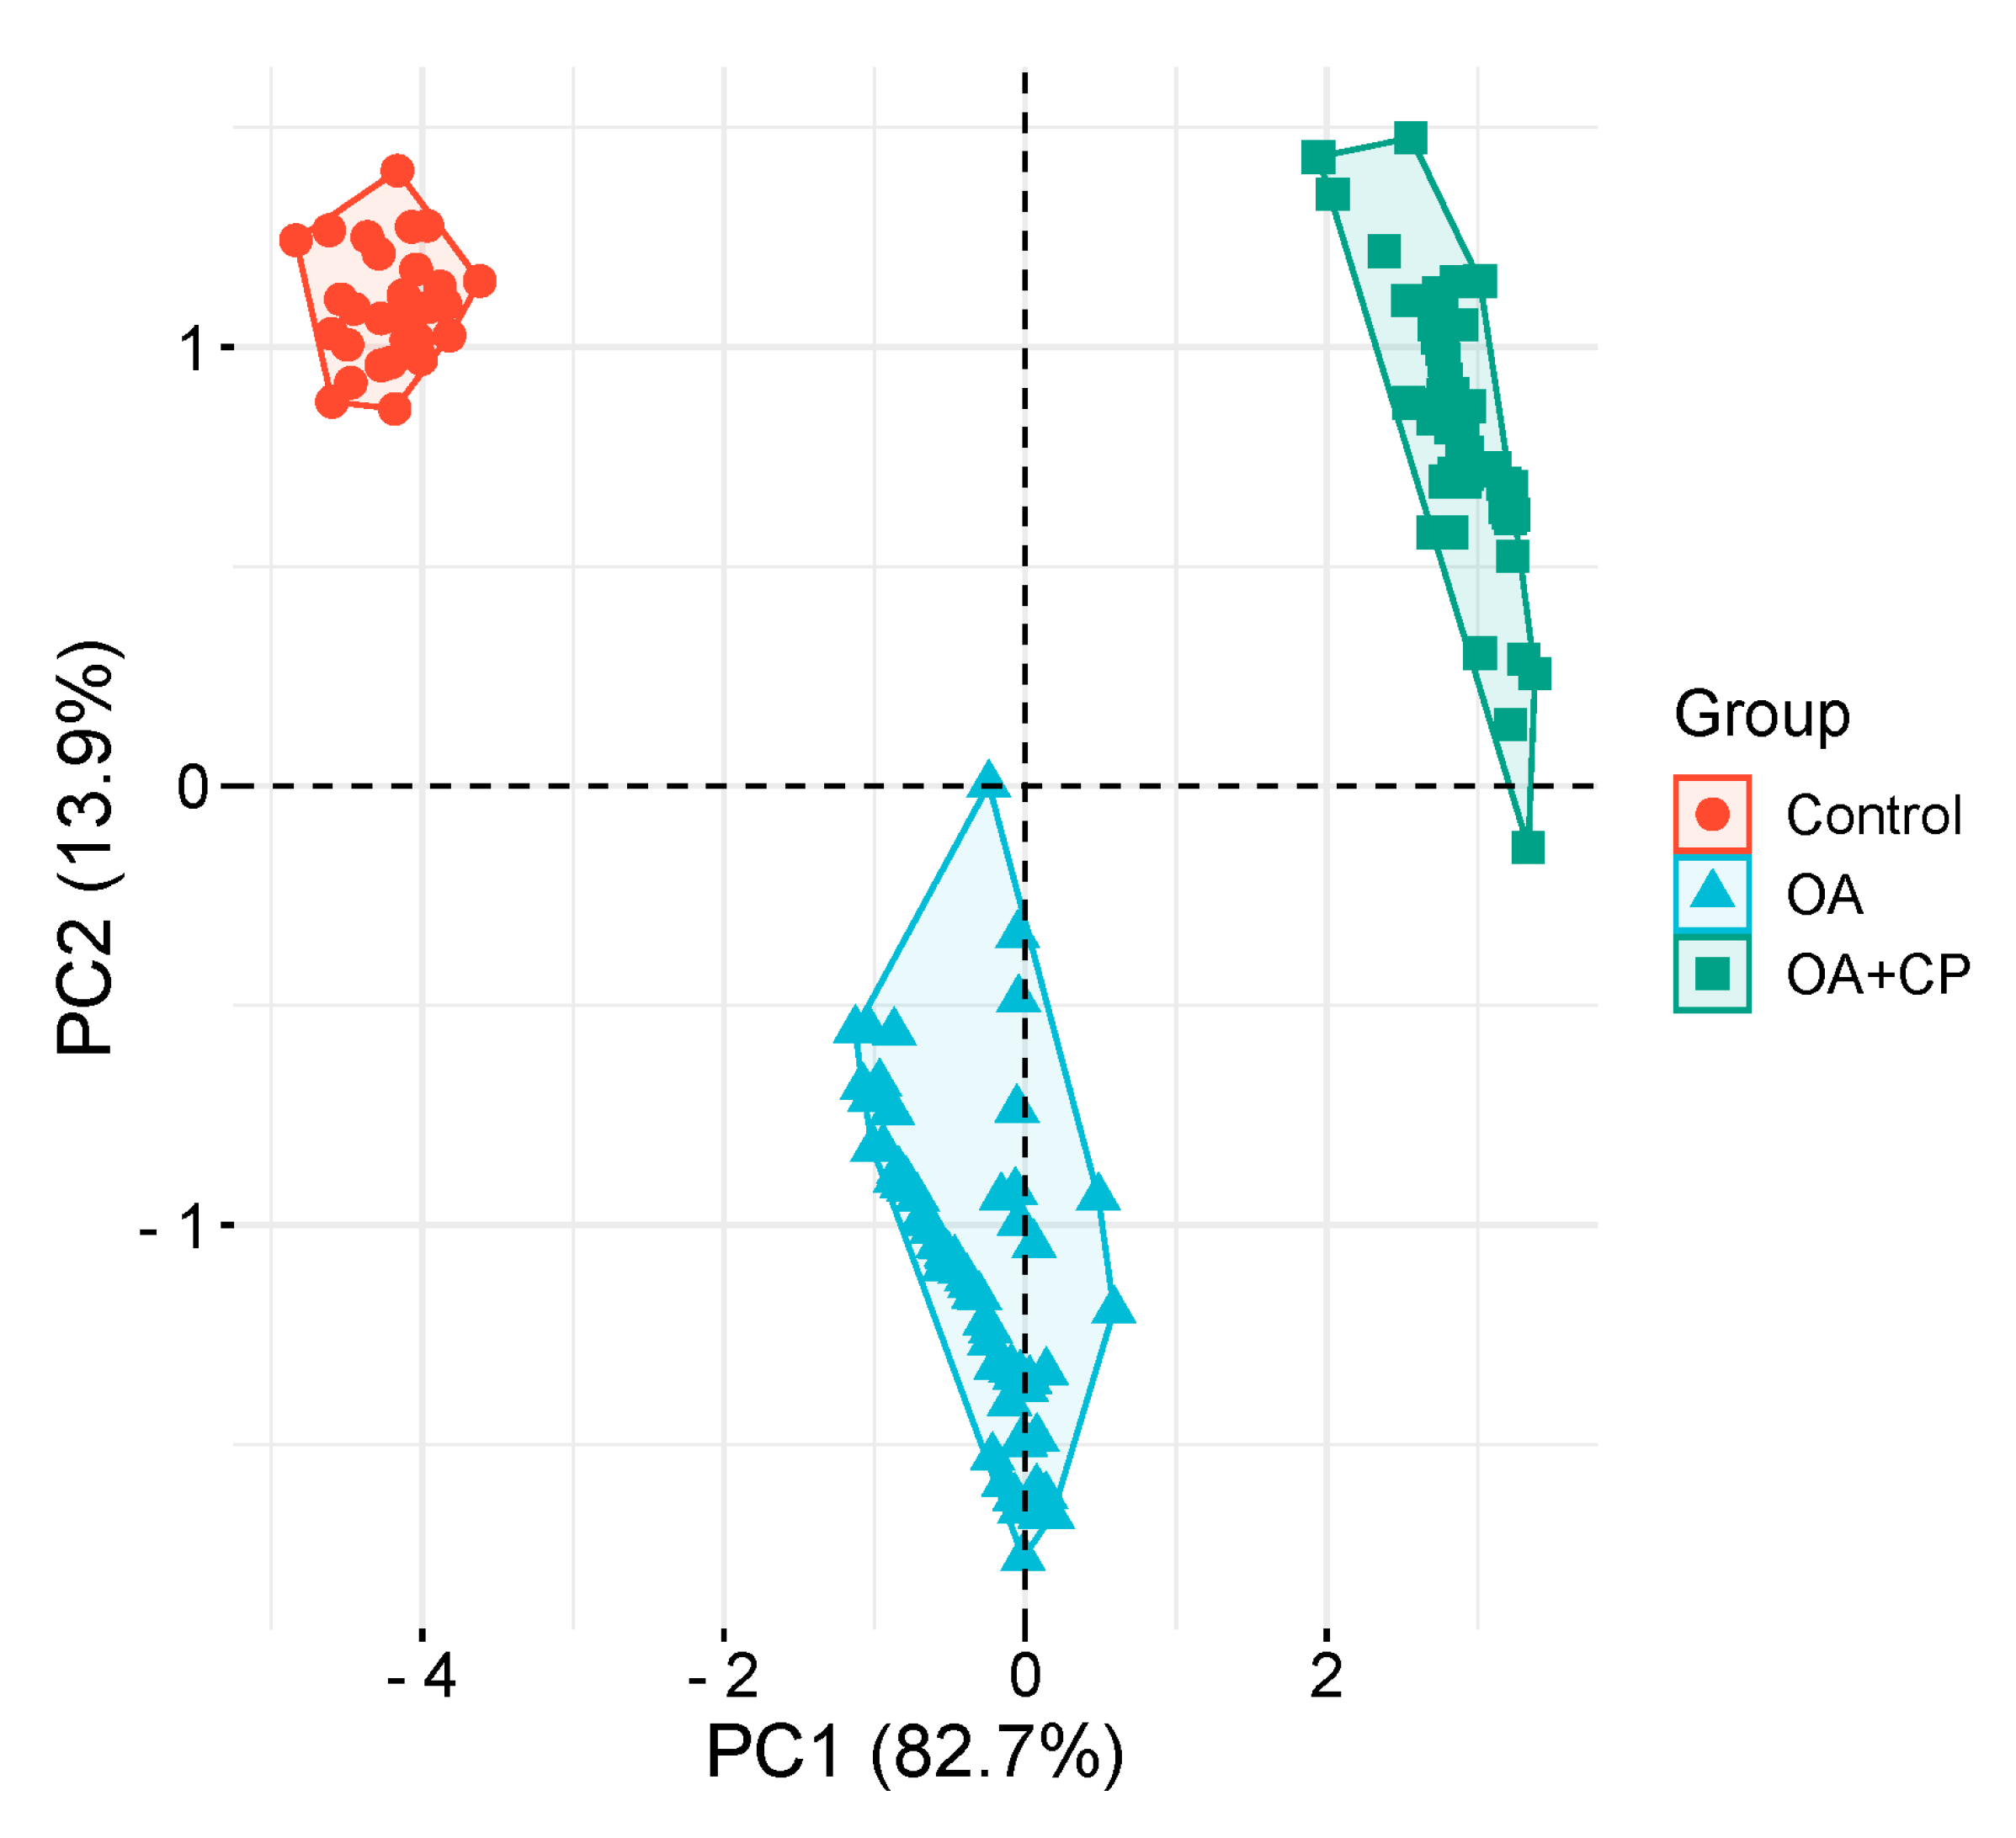
Principal component analysis (PCA) was employed to investigate the underlying determinants contributing to the OA and comorbidity presence (Figure 7).
The PCA identified two principal components (PCs) related to the OA and comorbidity presence, accounting for 96.6% of the variance (82.7% by PC1 and 13.9% by PC2). The Kaiser–Meyer–Olkin (KMO) measure of sampling adequacy was 0.889, indicating the correlation matrix was suitable for PCA. Bartlett’s test of sphericity showed a significance level of p < 0.001, further confirming the appropriateness of using PCA.
PC1 included the WOMAC total score, fecal elastase-1, CRP, ferritin, retinol, tocopherol, and 25(OH) vitamin D3. PC2 comprised BMI (Table 4).

3.5. Binary Logistic Regression

Using binary logistic regression, a predictive model was constructed to predict the likelihood of EPI presence in OA based on GSRS-DS, GSRS-CS, PEI-Q-A, Retinol, Tocopherol, and Iron. The dataset comprised 150 observations. The relationship observed can be expressed by the following equation:
P = 1 / (1 + e-z) × 100%,
z = -0.379 + 2.027XGSRS-DS - 5.942XGSRS-CS + 10.440XPEI-Q-A - 17.074XRetinol + 1.732XTocopherol - 0.549XIron
where P – probability of m-mod-s, XGSRS-DS – GSRS-DS, XGSRS-CS – GSRS-CS, XPEI-Q-A – PEI-Q-A, XRetinol – Retinol, XTocopherol – Tocopherol, XIron – Iron
The resulting regression model is statistically significant (p < 0.001). According to the Nagelkerke R² value, the model accounts for 77.0% of the variability observed in EPI presence in OA.
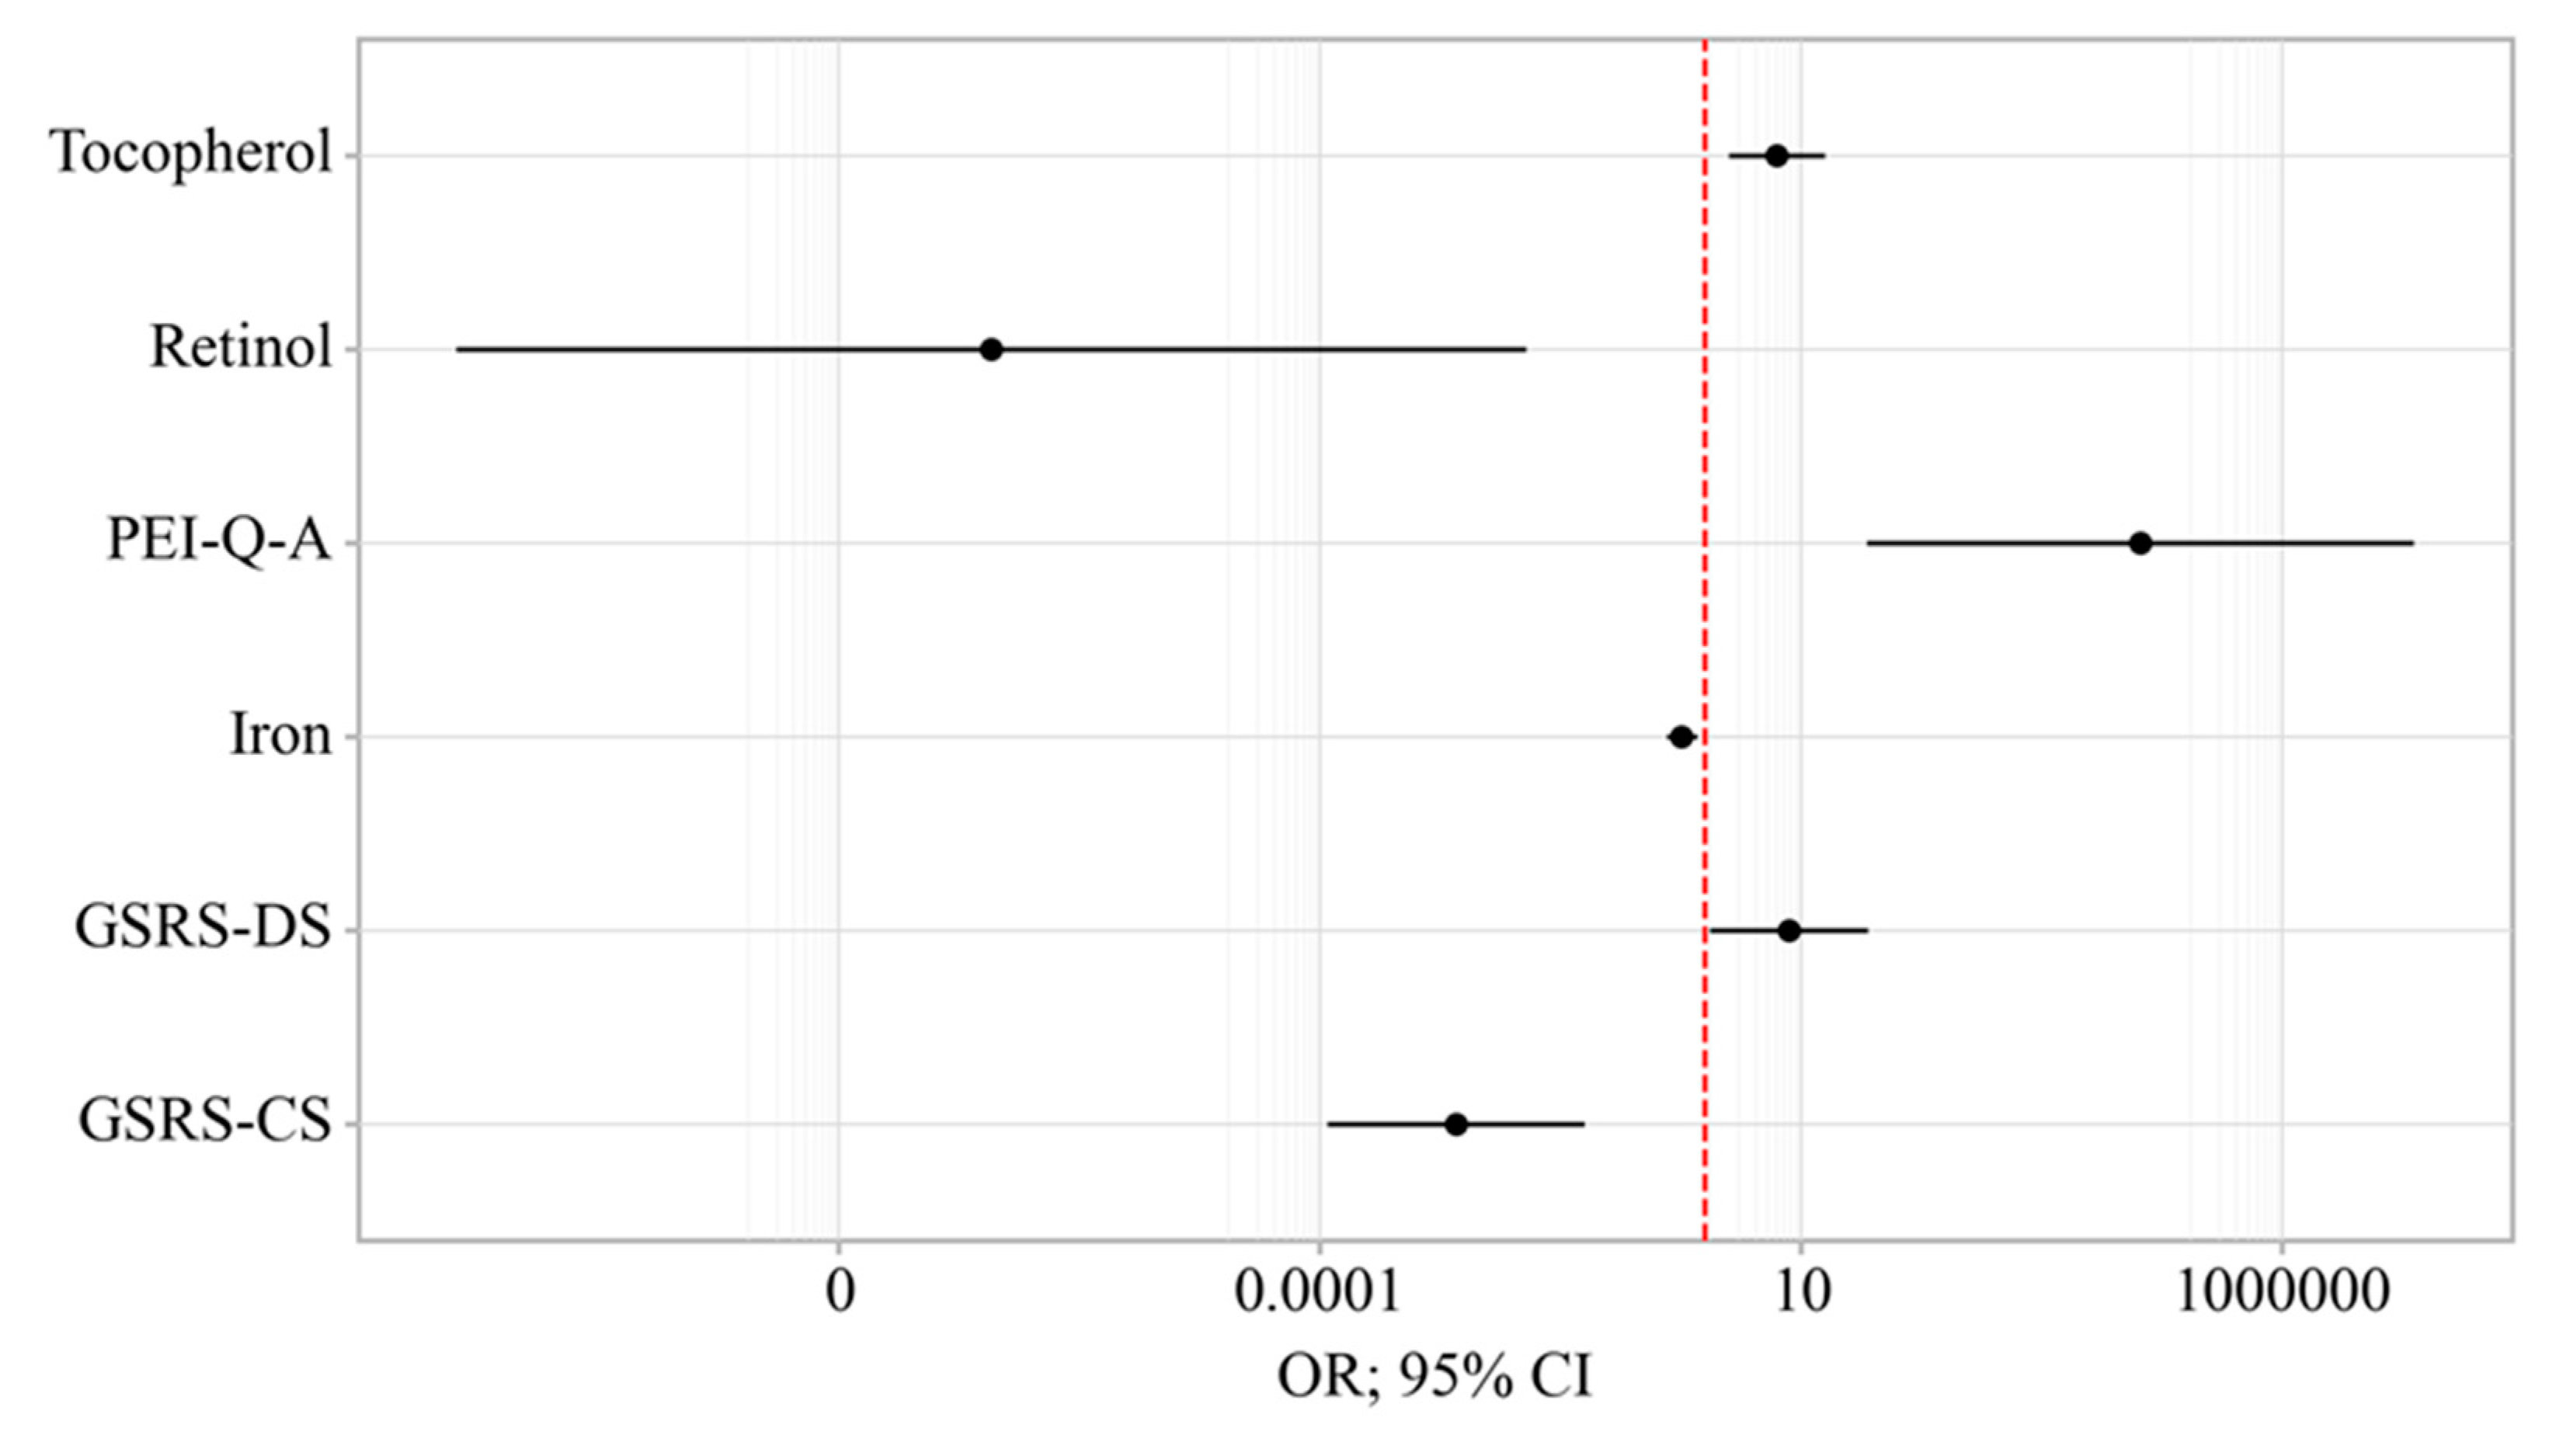
An increase in GSRS-DS is associated with a 7.592-fold increase in the odds of EPI presence in OA. Conversely, an increase in GSRS-CS is associated with a 380.696-fold decrease in the odds of EPI presence in OA. An increase in PEI-Q-A corresponds to a 34,207.493-fold increase in the odds of EPI presence in OA. On the other hand, an increase in Retinol is associated with a 26,002,415.617-fold decrease in the odds of EPI presence in OA. A one-unit increase in Tocopherol is linked with a 5.651-fold increase in the odds of EPI presence in OA, while a one-unit increase in Iron is associated with a 1.732-fold decrease in the odds of EPI presence in OA (Table 5) (Figure 8).
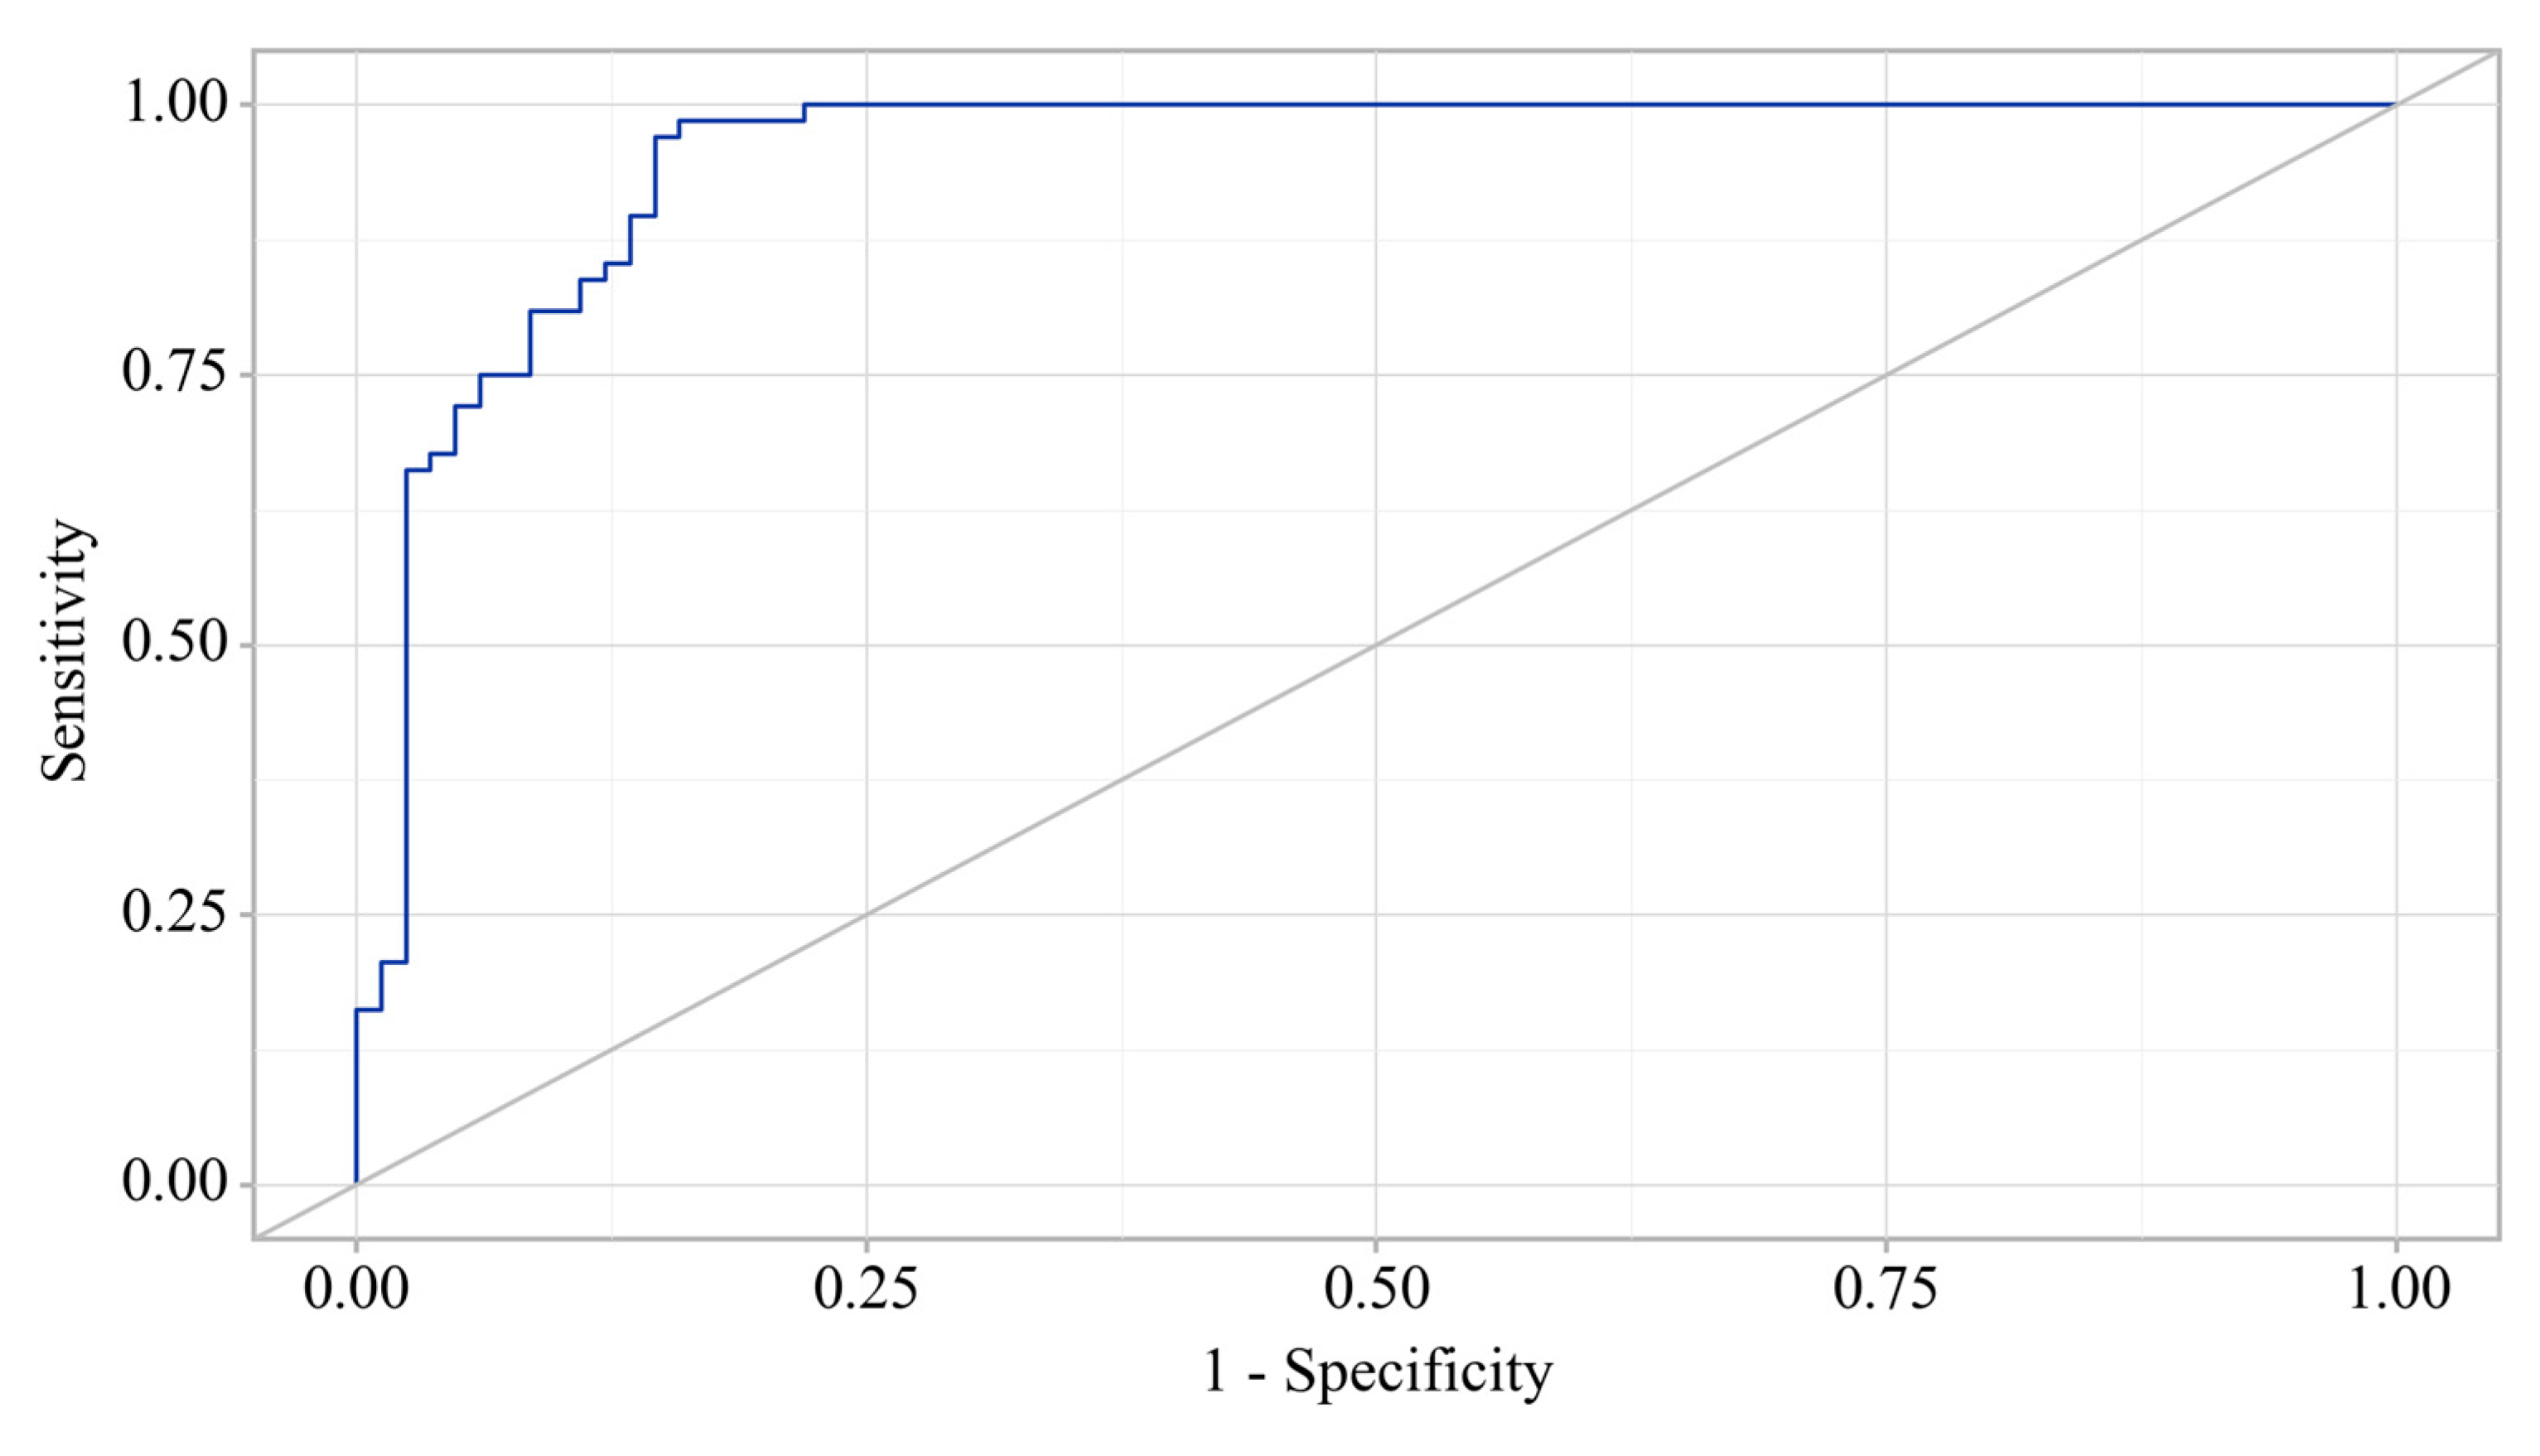
The resulting curve was obtained when assessing the relationship between the probability of EPI presence in OA and the value of the logistic function P using ROC analysis (Figure 9).
The area under the ROC curve was 0.952 ± 0.019 (95% CI: 0.914 - 0.989). The resultant model was statistically significant (p < 0.001).
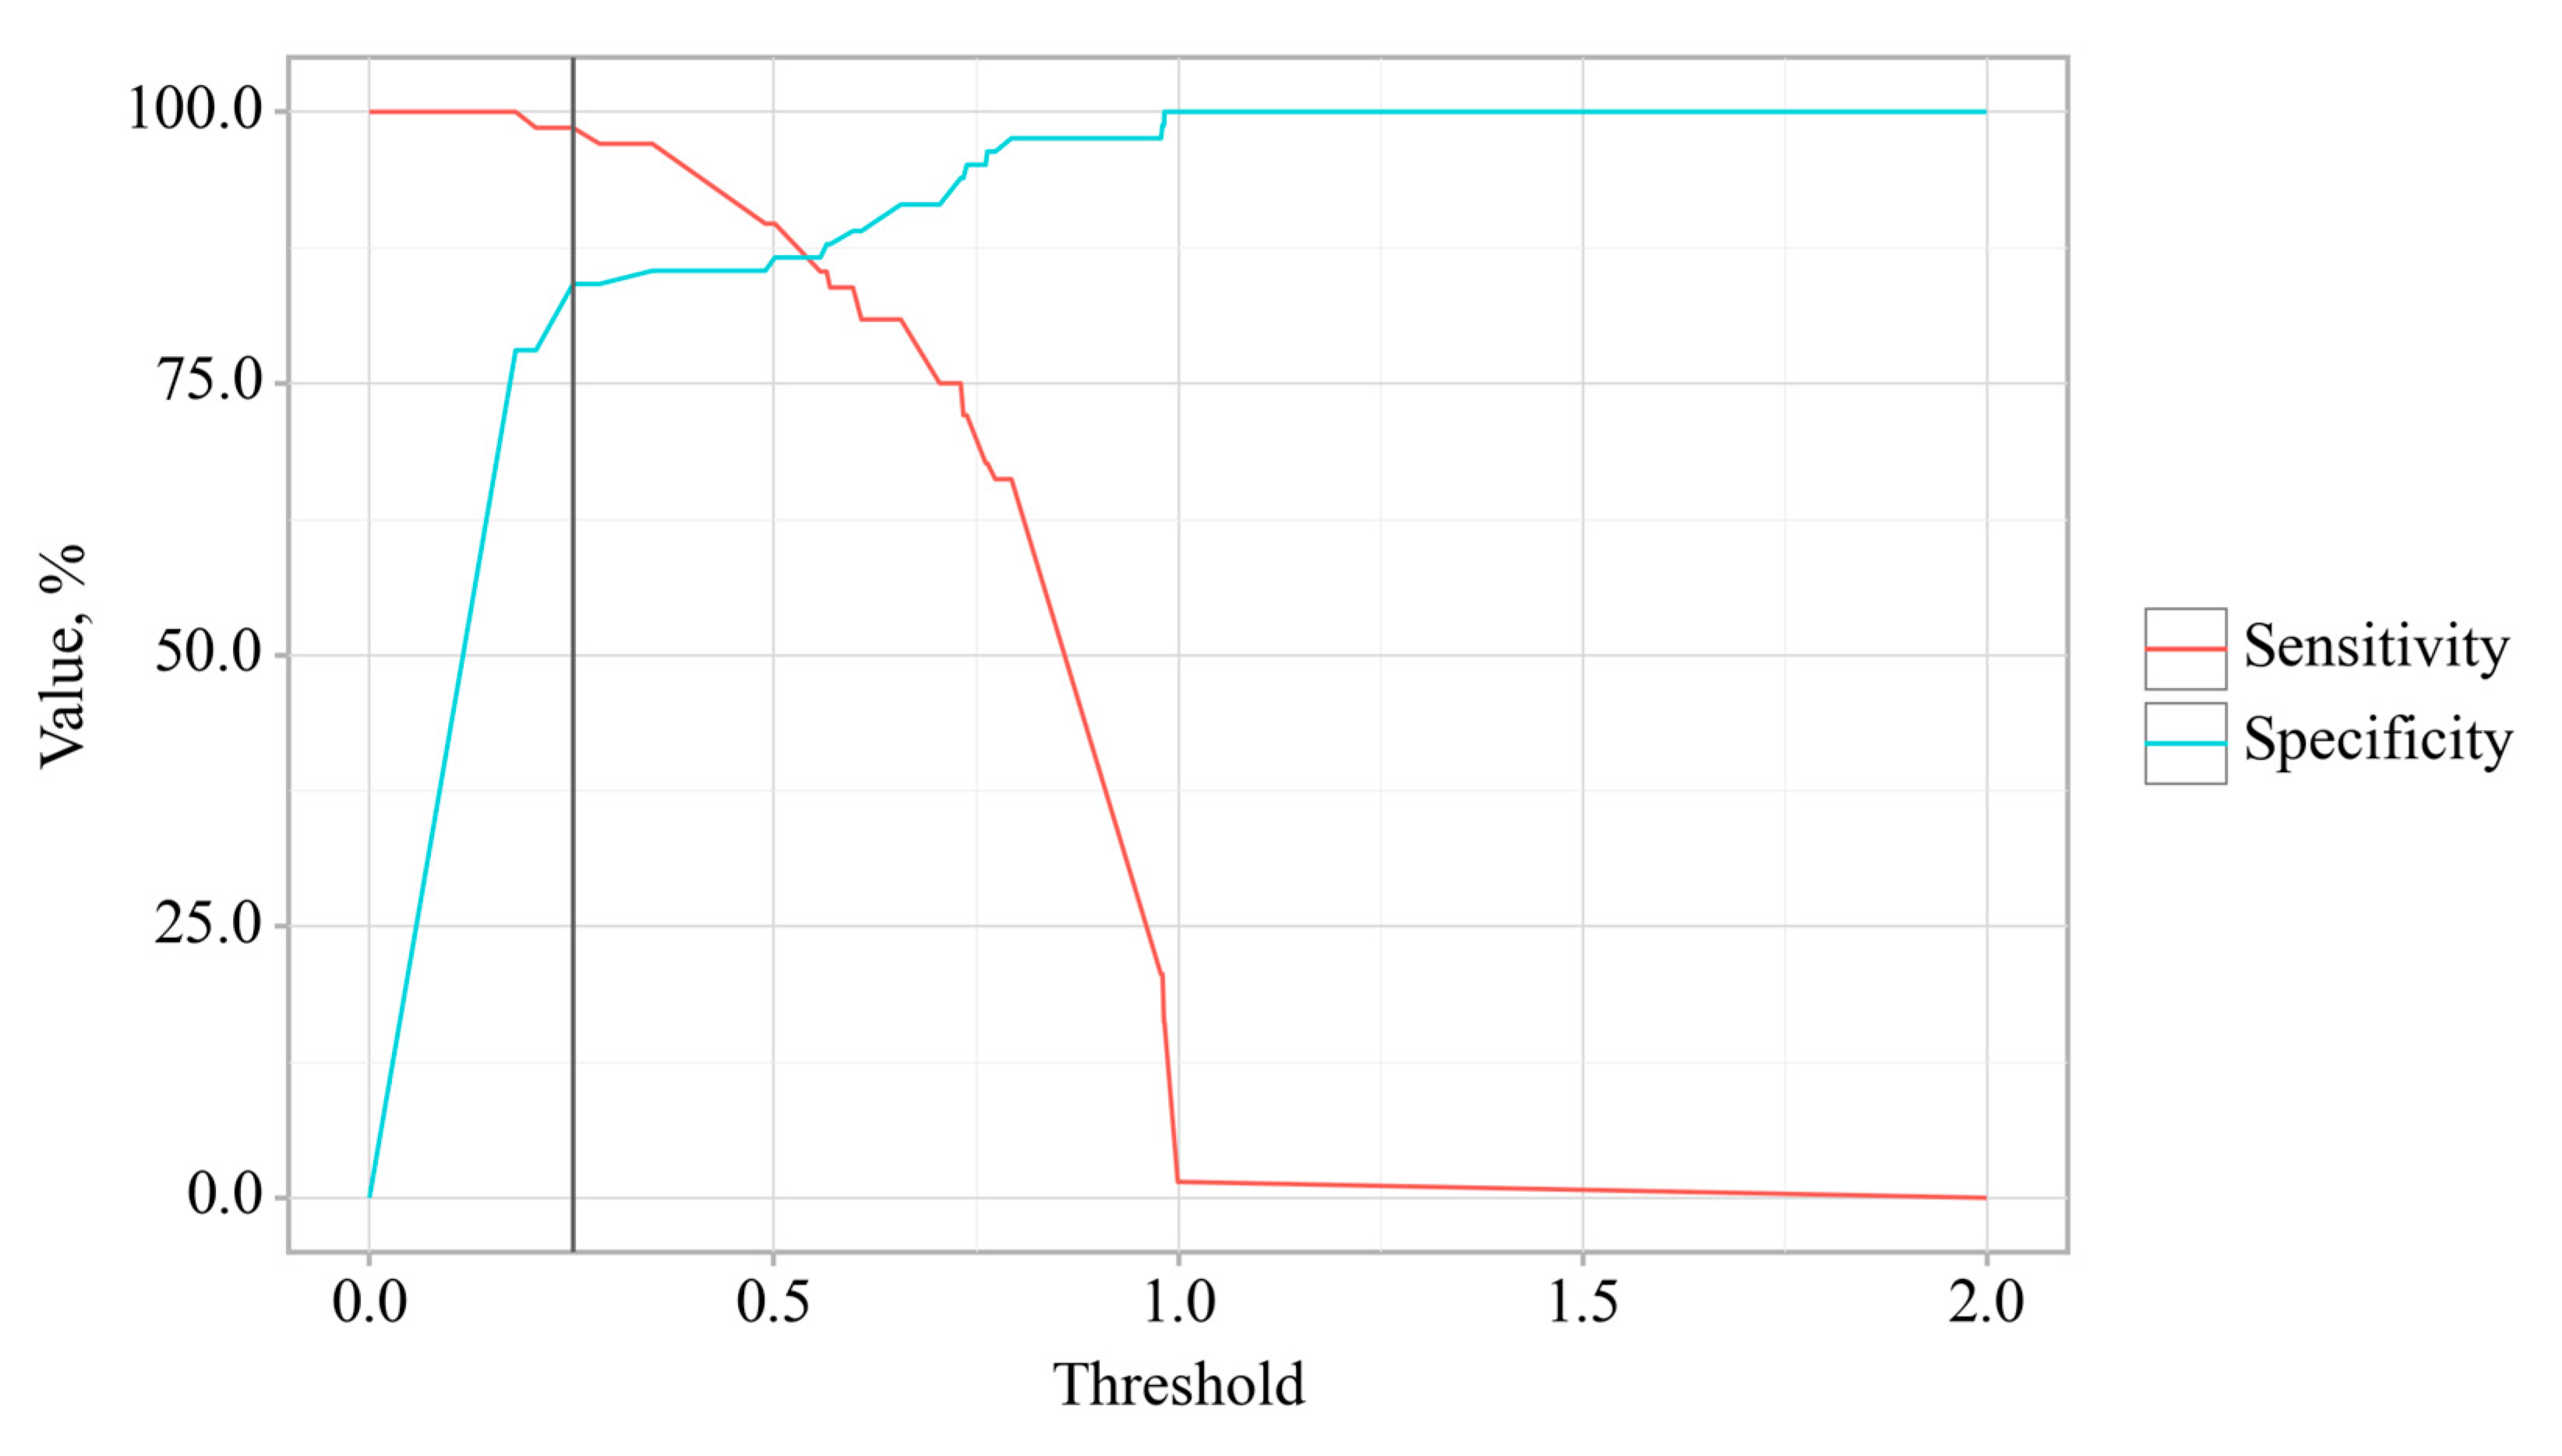
The cut-off value of the logistic function P, which maximizes Youden's J statistic, was determined to be 0.252. When the logistic function P was more significant than or equal to this threshold, EPI presence in OA was predicted. The method's sensitivity and specificity were 98.5% and 84.1%, respectively (Figure 10).

4. Discussion

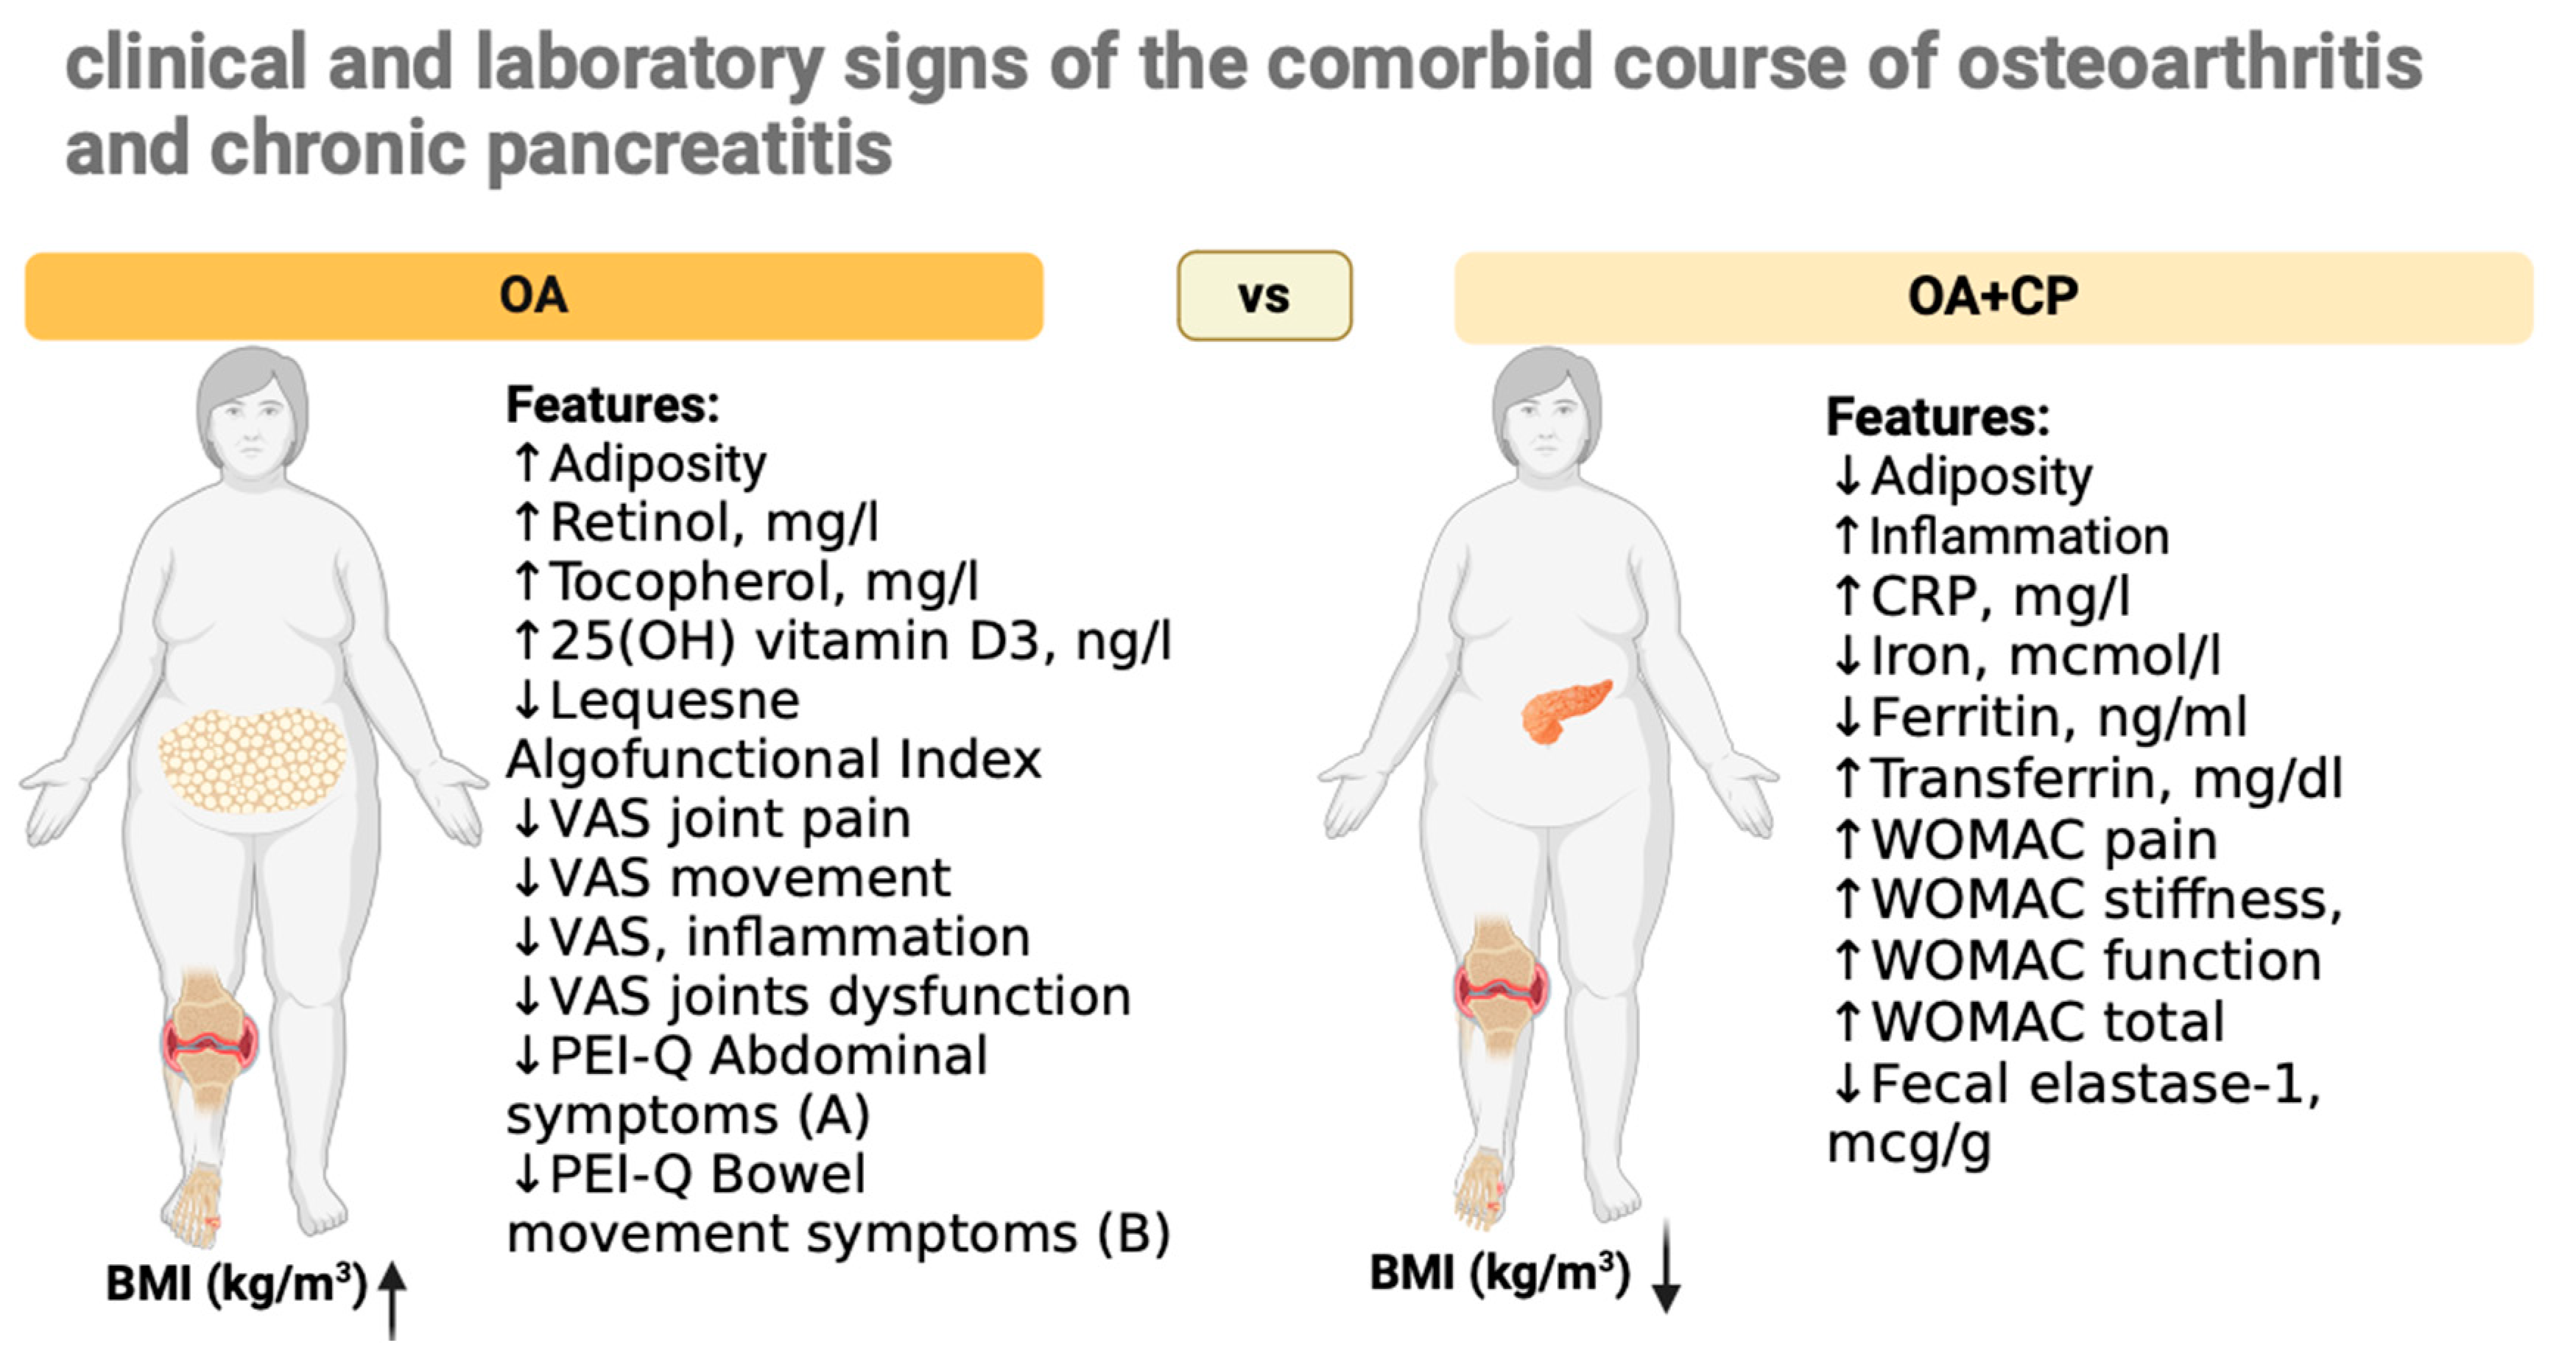
This study investigated the influence of OA and CP comorbidity on disease progression, examined the interrelationship between relevant indicators, and identified potential predictors for the development and complications of this comorbidity (Figure 11).
A prior study hypothesized that CP (CP) in growing pigs leads to alterations in articular cartilage and subchondral bone, potentially contributing to OA development. Findings from the pig model of cerulein-induced CP revealed significant changes in subchondral bone and articular cartilage, such as reduced bone volume and decreased proteoglycan content, suggesting a link between CP and musculoskeletal alterations, and highlighting the need for further research into CP's systemic effects [22].
Recent advances in understanding the molecular mechanisms of inflammation in OA have highlighted the complexity of cellular contributions to joint destruction and tissue regeneration, emphasizing the need for clinical trials on anti-inflammatory treatments, especially sustained-release intra-articular formulations, to mitigate disease progression and associated pain [23]. Advances in understanding how damage-associated molecular patterns (DAMPs) trigger monocyte/macrophage recruitment and activation in joints offer potential for disease-modifying therapies, but the complexity of macrophage phenotypes and their distinct cellular lineages has hindered treatment development, highlighting the need for precise patient selection based on specific OA subtypes like obesity or genetic risk [24].
OA is now established as a low-grade inflammatory disease that affects the entire joint, with synovial macrophages playing a crucial role in its symptomatology and progression through various signaling pathways that regulate their activation and polarization. This underscores the potential of macrophage reprogramming from the M1 to M2 phenotype as a promising therapeutic strategy [25]. Cartilage lesions and OA present a growing clinical and socioeconomic burden, primarily driven by synovial inflammation and an inflammatory articular environment that contribute to chondrocyte apoptosis and hypertrophy, ectopic bone formation, and OA progression.
Effective treatment of OA necessitates the development of therapeutic agents that shift inflammation towards a pro-chondrogenic microenvironment, with promising approaches including immune cell modulation and cell therapy, particularly through the promotion of anti-inflammatory M2 macrophages via various stimuli such as physical exercise and mesenchymal stem cells (MSCs) [26]. Findings suggest a potential positive correlation between higher serum C reactive protein (CRP) levels and increased pain sensitivity, yet further research [27].
Researches also highlight the pivotal role of inflammation in CP. Elevated levels of CRP, Cancer Antigen 19-9 (CA 19-9), and Carcinoembryonic Antigen (CEA) were observed in pancreatic cancer and CP patients. Moreover, increased levels of these markers correlated with worse survival outcomes in CP [28]. Macrophages play a critical role in the pathogenesis of pancreatitis. They exhibit distinct phenotypic variations and functions in acute pancreatitis (AP) and CP. In CP, macrophages tend to polarize towards an M2 phenotype, interacting with pancreatic stellate cells (PSCs) through autocrine and paracrine cytokine signaling, thereby promoting pancreatic fibrosis progression[29]. Macrophage-derived cytokines serve as biomarkers offering new avenues for early diagnosis CP and differentiation from pancreatic cancer and other pancreatic disorders. In established CP, interactions between macrophages and T lymphocytes contribute to immune dysregulation, with macrophage-produced proinflammatory cytokines playing a critical role in driving acinar-to-ductal metaplasia (ADM) [30].
The study demonstrated that CP in mice and patients was associated with gut dysbiosis, characterized by a reduced abundance of short-chain fatty acids (SCFAs)-producing G+ bacteria. Specifically, the depletion of G+ bacteria exacerbated CP severity, highlighting their critical role in modulating pancreatic fibrosis [31]. Dysbiosis, alongside metabolic factors such as hyperinsulinemia, insulin resistance, dyslipidemia, overstimulation of the sympathetic nervous system and renin-angiotensin system, and oxidative stress, leads to dysfunction of the gut barrier, increased intestinal permeability, and the release of toxic bacterial metabolites into circulation [32,33,34]. It was indicated that alterations in gut microbiota could serve as a potential biomarker for inflammation, as measured by CRP levels, in patients with T2D and COVID-19 [35]. These factors collectively promote the development of low-grade systemic inflammation [36].
Recent research has revealed specific alterations in the microbiome linked to OA, characterized by an elevated Firmicutes/Bacteroides ratio, increased prevalence of Streptococcus spp., and localized inflammatory responses [37]. The gastrointestinal tract represents a compelling and innovative target for OA therapy [37].
In our investigation, we detected an inflammatory condition in individuals diagnosed with OA, including those concurrently diagnosed with pancreatitis. Moreover, our findings revealed that this comorbidity was associated with higher C-reactive protein levels, suggesting heightened inflammatory activity. These results are consistent with existing studies, there remains an insufficient body of research concerning the inflammatory impact of OA and CP comorbidity on disease progression and complication development, necessitating further investigation.
Non-steroidal anti-inflammatory drugs (NSAID) are frequently utilized pharmacological agents in the management of pain associated with OA [38,39]. However, the administration of these drugs is linked with substantial gastrointestinal toxicity, impacting both the upper gastrointestinal tract, potentially causing peptic ulcer disease, and the lower gastrointestinal tract, which can result in NSAID-induced enteropathy. Furthermore, NSAID usage has been associated with an increased likelihood of clinical relapse in individuals with inflammatory bowel disease, underscoring the necessity for cautious prescribing in this patient population [40,41,42]. This damage is attributed to mechanisms involving prostaglandin-endoperoxide synthase 1 (PTGS1 or COX1) and PTGS2 (COX2), as well as additional factors [43,44]. These mechanisms include NSAID interactions with phospholipids and the uncoupling of mitochondrial oxidative phosphorylation, which lead to the disruption of gastrointestinal barrier function, increased intestinal permeability, and low-grade inflammation [43,44].
The inhibition of COX enzymes by NSAIDs, coupled with the presence of luminal aggressors, results in the formation of erosions and ulcers, with potential complications such as bleeding, protein loss, stricture formation, and perforation [45]. Damage to the pancreatic systems caused by non-steroidal anti-inflammatory drugs (NSAIDs) may present as pancreatitis [46,47]. The occurrence of these complications may result in digestive disorders, impaired nutrient absorption, and subsequently, the onset of malnutrition [48,49]. Exocrine pancreatic insufficiency associated with CP contributes to the development of malnutrition [12,50]. In our investigation, we also documented gastrointestinal symptomatology in patients with OA evaluated by the GSRS scale, potentially exacerbated by long-term NSAID use, consistent with previous research. Furthermore, we observed the onset of malnutrition based on levels of fat-soluble vitamins and markers of iron metabolism, particularly intensified in the presence of comorbid OA and CP, aligning with findings reported in other studies.

5. Limitations

We recognize that our study possesses several limitations. Primarily, the relatively small sample size restricts the generalizability of our results to a broader population. A more extensive multicenter study would be required to validate these findings and improve their generalizability. Additionally, the monocentric design of this research inherently limits the studied population and may introduce selection bias. Future studies should ideally include participants from multiple centers to obtain a more representative sample. Furthermore, the investigated parameters were not analyzed in a cohort of patients with CP who do not have comorbid OA.

6. Conclusions

In this research, the study focused on exploring the influence of comorbidity between OA and CP on diseases progression and the occurrence of malnutrition. It was determined that the concurrent presence of OA and CP potentially exacerbates the progression of both conditions and contributes to the development of malnutrition. Additionally, the study identified the potential impacts of OA progression indicators on markers of exocrine pancreatic insufficiency. BMI emerged as a potential predictor for the development of CP comorbidity in OA patients. Fecal elastase-1 level was identified as potential predictors for the presence of exocrine pancreatic insufficiency in individuals with OA. Moreover, the study highlighted that WOMAC total score, fecal elastase-1, CRP, ferritin, retinol, tocopherol, 25(OH) vitamin D3, and BMI are potential influencing factors in the development of comorbidity between OA and CP. Furthermore, Gastrointestinal Symptom Rating Scale-Diarrhea Syndrome (GSRS-DS), Gastrointestinal Symptom Rating Scale-Constipation syndrome (GSRS-CS), Qualitative Assessment of the Symptoms and Impact of Pancreatic Exocrine Insufficiency domain A (PEI-Q-A), retinol, tocopherol, and iron were recognized as potential predictors for the presence of exocrine pancreatic insufficiency in OA patients. By identifying potential predictors of this comorbidity and its complications, we lay the foundation for future research that may enhance clinical strategies for managing patients with these conditions.

Author Contributions

Conceptualization and writing—original draft preparation, I.H, L.B. and O.K.; writing—review and editing, I.H., L.B., V.O., and O.K.; supervision, L.B., O.K. and V.O.; project administration, V.O. and O.K.; visualization, I.H and O.K. All authors have read and agreed to the published version of the manuscript.

Funding

This research received no external funding.

Institutional Review Board Statement

The study protocol met the requirements for biomedical research and was approved by the Local Ethics Committee of the I. Horbachevsky Ternopil National Medical University as protocol N75, dated November 1, 2023.

Informed Consent Statement

All patients signed an informed consent for the study.

Data Availability Statement

Data are contained within the article.

Conflicts of Interest

The authors declare no conflicts of interest.

References

  1. Swain, S.; Kamps, A.; Runhaar, J.; Dell'Isola, A.; Turkiewicz, A.; Robinson, D.; Strauss, V.; Mallen, C.; Kuo, C. F.; Coupland, C.; Doherty, M.; Sarmanova, A.; Prieto-Alhambra, D.; Englund, M.; Bierma-Zeinstra, S. M. A.; Zhang, W. , Comorbidities in osteoarthritis (ComOA): a combined cross-sectional, case-control and cohort study using large electronic health records in four European countries. BMJ open 2022, 12, e052816. [Google Scholar] [CrossRef] [PubMed]
  2. Chen, Z.; Wang, W.; Zhang, Y.; Xue, X.; Hua, Y. , Identification of four-gene signature to diagnose osteoarthritis through bioinformatics and machine learning methods. Cytokine 2023, 169, 156300. [Google Scholar] [CrossRef] [PubMed]
  3. Wang, L.; Xu, Q.; Chen, Y.; Zhu, Z.; Cao, Y. , Associations between weather conditions and osteoarthritis pain: a systematic review and meta-analysis. Annals of medicine 2023, 55, 2196439. [Google Scholar] [CrossRef] [PubMed]
  4. Zemedikun, D. T.; Lee, H.; Nirantharakumar, K.; Raza, K.; Chandan, J. S.; Lord, J. M.; Jackson, T. A. Comorbidity phenotypes and risk of mortality in patients with osteoarthritis in the UK: a latent class analysis. Arthritis research & therapy, 2022; 24, 231. [Google Scholar]
  5. Wood, M. J.; Miller, R. E.; Malfait, A. M. , The Genesis of Pain in Osteoarthritis: Inflammation as a Mediator of Osteoarthritis Pain. Clinics in geriatric medicine 2022, 38, 221–238. [Google Scholar] [CrossRef] [PubMed]
  6. Amodeo, G.; Magni, G.; Galimberti, G.; Riboldi, B.; Franchi, S.; Sacerdote, P.; Ceruti, S. , Neuroinflammation in osteoarthritis: From pain to mood disorders. Biochemical pharmacology 2024, 116182. [Google Scholar] [CrossRef] [PubMed]
  7. Swain, S.; Sarmanova, A.; Coupland, C.; Doherty, M.; Zhang, W. , Comorbidities in Osteoarthritis: A Systematic Review and Meta-Analysis of Observational Studies. Arthritis care & research, 2020; 72, 991–1000. [Google Scholar]
  8. Li, B.; Yang, Z.; Li, Y.; Zhang, J.; Li, C.; Lv, N. , Exploration beyond osteoarthritis: the association and mechanism of its related comorbidities. Frontiers in endocrinology 2024, 15, 1352671. [Google Scholar] [CrossRef] [PubMed]
  9. Hines, O. J.; Pandol, S. J. , Management of chronic pancreatitis. BMJ (Clinical research ed.), 2024; 384, e070920. [Google Scholar]
  10. Khan, E.; Chakrabarty, S.; Shariff, S.; Bardhan, M. , Genetics and Genomics of Chronic Pancreatitis with a Focus on Disease Biology and Molecular Pathogenesis. Global medical genetics 2023, 10, 324–334. [Google Scholar] [CrossRef] [PubMed]
  11. Benjamin, O.; Lappin, S. L. Chronic Pancreatitis. In StatPearls; StatPearls Publishing.
  12. Copyright © 2024, StatPearls Publishing LLC.: Treasure Island (FL) ineligible companies. Disclosure: Sarah Lappin declares no relevant financial relationships with ineligible companies., 2024.
  13. Capurso, G.; Tacelli, M.; Vanella, G.; Ponz de Leon Pisani, R.; Dell'Anna, G.; Abati, M.; Mele, R.; Lauri, G.; Panaitescu, A.; Nunziata, R.; Zaccari, P.; Archibugi, L.; Arcidiacono, P. G. , Managing complications of chronic pancreatitis: a guide for the gastroenterologist. Expert review of gastroenterology & hepatology, 2023; 17, 1267–1283. [Google Scholar]
  14. Beyer, G.; Habtezion, A.; Werner, J.; Lerch, M. M.; Mayerle, J. , Chronic pancreatitis. Lancet (London, England), 2020; 396, 499–512. [Google Scholar]
  15. Löhr, J. M.; Dominguez-Munoz, E.; Rosendahl, J.; Besselink, M.; Mayerle, J.; Lerch, M. M.; Haas, S.; Akisik, F.; Kartalis, N.; Iglesias-Garcia, J.; Keller, J.; Boermeester, M.; Werner, J.; Dumonceau, J. M.; Fockens, P.; Drewes, A.; Ceyhan, G.; Lindkvist, B.; Drenth, J.; Ewald, N.; Hardt, P.; de Madaria, E.; Witt, H.; Schneider, A.; Manfredi, R.; Brøndum, F. J.; Rudolf, S.; Bollen, T.; Bruno, M. , United European Gastroenterology evidence-based guidelines for the diagnosis and therapy of chronic pancreatitis (HaPanEU). United European gastroenterology journal 2017, 5, 153–199. [Google Scholar] [CrossRef]
  16. Kleeff, J.; Whitcomb, D. C.; Shimosegawa, T.; Esposito, I.; Lerch, M. M.; Gress, T.; Mayerle, J.; Drewes, A. M.; Rebours, V.; Akisik, F.; Muñoz, J. E. D.; Neoptolemos, J. P. , Chronic pancreatitis. Nature reviews. Disease primers 2017, 3, 17060. [Google Scholar] [CrossRef]
  17. Nag, D. S.; Swain, B. P.; Anand, R.; Barman, T. K. ; Vatsala, Pain management in chronic pancreatitis. World journal of clinical cases 2024, 12, 2016–2022. [Google Scholar] [CrossRef]
  18. Teo, K.; Johnson, M. H.; Truter, S.; Pandanaboyana, S.; Windsor, J. A. , Pain assessment in chronic pancreatitis: A comparative review of methods. Pancreatology : official journal of the International Association of Pancreatology (IAP)... [et al.], 2016; 16, 931–939. [Google Scholar]
  19. Cai, Q. Y.; Tan, K.; Zhang, X. L.; Han, X.; Pan, J. P.; Huang, Z. Y.; Tang, C. W.; Li, J. , Incidence, prevalence, and comorbidities of chronic pancreatitis: A 7-year population-based study. World journal of gastroenterology 2023, 29, 4671–4684. [Google Scholar] [CrossRef] [PubMed]
  20. Phillips, A. E.; Faghih, M.; Drewes, A. M.; Singh, V. K.; Yadav, D.; Olesen, S. S. , Psychiatric Comorbidity in Patients With Chronic Pancreatitis Associates With Pain and Reduced Quality of Life. The American journal of gastroenterology 2020, 115, 2077–2085. [Google Scholar] [CrossRef] [PubMed]
  21. Redkva, O. V.; Babinets, L. S.; Halabitska, I. M. , EVALUATION OF PARAMETERS OF ACTUAL TYPICAL PATHOGENETIC SYNDROMES IN COMORBIDITY OF TYPE 2 DIABETES MELLITUS AND CHRONIC PANCREATITIS. Wiadomosci lekarskie (Warsaw, Poland : 1960), 2021; 74, 2557–2559. [Google Scholar]
  22. Halabitska, I. M.; Babinets, L. S.; Vysotskyi, V. I. , POSSIBILITIES OF METABOLIC AND FUNCTIONAL DISORDERS CORRECTION IN OSTEOARTHRITIS WITH COMPLEX COMORBIDITY. Wiadomosci lekarskie (Warsaw, Poland : 1960), 2022; 75, 645–648. [Google Scholar]
  23. Tomaszewska, E.; Hułas-Stasiak, M.; Dobrowolski, P.; Świątkiewicz, M.; Muszyński, S.; Tomczyk-Warunek, A.; Blicharski, T.; Donaldson, J.; Arciszewski, M. B.; Świetlicki, M.; Puzio, I.; Bonior, J. , Does Chronic Pancreatitis in Growing Pigs Lead to Articular Cartilage Degradation and Alterations in Subchondral Bone? International journal of molecular sciences, 2024; 25. [Google Scholar]
  24. Knights, A. J.; Redding, S. J.; Maerz, T. , Inflammation in osteoarthritis: the latest progress and ongoing challenges. Current opinion in rheumatology 2023, 35, 128–134. [Google Scholar] [CrossRef] [PubMed]
  25. Griffin, T. M.; Scanzello, C. R. , Innate inflammation and synovial macrophages in osteoarthritis pathophysiology. Clinical and experimental rheumatology 2019, 120(5), 57–63. [Google Scholar]
  26. Zhang, H.; Cai, D.; Bai, X. , Macrophages regulate the progression of osteoarthritis. Osteoarthritis and cartilage 2020, 28, 555–561. [Google Scholar] [CrossRef] [PubMed]
  27. Fernandes, T. L.; Gomoll, A. H.; Lattermann, C.; Hernandez, A. J.; Bueno, D. F.; Amano, M. T. , Macrophage: A Potential Target on Cartilage Regeneration. Frontiers in immunology 2020, 11, 111. [Google Scholar] [CrossRef] [PubMed]
  28. Dainese, P.; Mahieu, H.; De Mits, S.; Wittoek, R.; Stautemas, J.; Calders, P. , Associations between markers of inflammation and altered pain perception mechanisms in people with knee osteoarthritis: a systematic review. RMD open, 2023; 9. [Google Scholar]
  29. Tanţău, A.; Leucuţa, D. C.; Tanţău, M.; Boţan, E.; Zaharie, R.; Mândruţiu, A.; Tomuleasa, I. C. , Inflammation, Tumoral Markers and Interleukin-17, -10, and -6 Profiles in Pancreatic Adenocarcinoma and Chronic Pancreatitis. Digestive diseases and sciences 2021, 66, 3427–3438. [Google Scholar] [CrossRef]
  30. Hu, F.; Lou, N.; Jiao, J.; Guo, F.; Xiang, H.; Shang, D. , Macrophages in pancreatitis: Mechanisms and therapeutic potential. Biomedicine & pharmacotherapy = Biomedecine & pharmacotherapie, 2020; 131, 110693. [Google Scholar]
  31. Xiang, H.; Yu, H.; Zhou, Q.; Wu, Y.; Ren, J.; Zhao, Z.; Tao, X.; Dong, D. , Macrophages: A rising star in immunotherapy for chronic pancreatitis. Pharmacological research 2022, 185, 106508. [Google Scholar] [CrossRef]
  32. Pan, L. L.; Ren, Z. N.; Yang, J.; Li, B. B.; Huang, Y. W.; Song, D. X.; Li, X.; Xu, J. J.; Bhatia, M.; Zou, D. W.; Zhou, C. H.; Sun, J. , Gut microbiota controls the development of chronic pancreatitis: A critical role of short-chain fatty acids-producing Gram-positive bacteria. Acta pharmaceutica Sinica. B 2023, 13, 4202–4216. [Google Scholar] [CrossRef]
  33. Pavlo, P.; Kamyshna, I.; Kamyshnyi, A. , Effects of metformin on the gut microbiota: A systematic review. Molecular metabolism 2023, 77, 101805. [Google Scholar] [CrossRef]
  34. Petakh, P.; Kobyliak, N.; Kamyshnyi, A. , Gut microbiota in patients with COVID-19 and type 2 diabetes: A culture-based method. Frontiers in cellular and infection microbiology 2023, 13, 1142578. [Google Scholar] [CrossRef]
  35. Thursby, E.; Juge, N. , Introduction to the human gut microbiota. The Biochemical journal 2017, 474, 1823–1836. [Google Scholar] [CrossRef]
  36. Petakh, P.; Oksenych, V.; Kamyshnyi, A. , The F/B ratio as a biomarker for inflammation in COVID-19 and T2D: Impact of metformin. Biomedicine & pharmacotherapy = Biomedecine & pharmacotherapie, 2023; 163, 114892. [Google Scholar]
  37. Malesza, I. J.; Malesza, M.; Walkowiak, J.; Mussin, N.; Walkowiak, D.; Aringazina, R.; Bartkowiak-Wieczorek, J.; Mądry, E. , High-Fat, Western-Style Diet, Systemic Inflammation, and Gut Microbiota: A Narrative Review. Cells, 2021; 10. [Google Scholar]
  38. Gleason, B.; Chisari, E.; Parvizi, J. , Osteoarthritis Can Also Start in the Gut: The Gut-Joint Axis. Indian journal of orthopaedics 2022, 56, 1150–1155. [Google Scholar] [CrossRef] [PubMed]
  39. Bannuru, R. R.; Osani, M. C.; Vaysbrot, E. E.; Arden, N. K.; Bennell, K.; Bierma-Zeinstra, S. M. A.; Kraus, V. B.; Lohmander, L. S.; Abbott, J. H.; Bhandari, M.; Blanco, F. J.; Espinosa, R.; Haugen, I. K.; Lin, J.; Mandl, L. A.; Moilanen, E.; Nakamura, N.; Snyder-Mackler, L.; Trojian, T.; Underwood, M.; McAlindon, T. E. , OARSI guidelines for the non-surgical management of knee, hip, and polyarticular osteoarthritis. Osteoarthritis and cartilage 2019, 27, 1578–1589. [Google Scholar] [CrossRef] [PubMed]
  40. Sabha, M.; Hochberg, M. C. , Non-surgical management of hip and knee osteoarthritis; comparison of ACR/AF and OARSI 2019 and VA/DoD 2020 guidelines. Osteoarthritis and cartilage open 2022, 4, 100232. [Google Scholar] [CrossRef]
  41. Hijos-Mallada, G.; Sostres, C.; Gomollón, F. , NSAIDs, gastrointestinal toxicity and inflammatory bowel disease. Gastroenterologia y hepatologia 2022, 45, 215–222. [Google Scholar] [CrossRef]
  42. Kefalakes, H.; Stylianides, T. J.; Amanakis, G.; Kolios, G. , Exacerbation of inflammatory bowel diseases associated with the use of nonsteroidal anti-inflammatory drugs: myth or reality? European journal of clinical pharmacology 2009, 65, 963–70. [Google Scholar] [CrossRef] [PubMed]
  43. Kvasnovsky, C. L.; Aujla, U.; Bjarnason, I. , Nonsteroidal anti-inflammatory drugs and exacerbations of inflammatory bowel disease. Scandinavian journal of gastroenterology 2015, 50, 255–63. [Google Scholar] [CrossRef]
  44. Santos, A. C. F.; Monteiro, L. P. G.; Gomes, A. C. C.; Martel, F.; Santos, T. M.; Ferreira, B. , NSAID-Based Coordination Compounds for Biomedical Applications: Recent Advances and Developments. International journal of molecular sciences, 2022; 23. [Google Scholar]
  45. Bindu, S.; Mazumder, S.; Bandyopadhyay, U. , Non-steroidal anti-inflammatory drugs (NSAIDs) and organ damage: A current perspective. Biochemical pharmacology 2020, 180, 114147. [Google Scholar] [CrossRef]
  46. Bjarnason, I.; Scarpignato, C.; Holmgren, E.; Olszewski, M.; Rainsford, K. D.; Lanas, A. , Mechanisms of Damage to the Gastrointestinal Tract From Nonsteroidal Anti-Inflammatory Drugs. Gastroenterology 2018, 154, 500–514. [Google Scholar] [CrossRef]
  47. McGettigan, M. J.; Menias, C. O.; Gao, Z. J.; Mellnick, V. M.; Hara, A. K. , Imaging of Drug-induced Complications in the Gastrointestinal System. Radiographics : a review publication of the Radiological Society of North America, Inc, 2016; 36, 71–87. [Google Scholar]
  48. Soreide, K. , Damage to the Gastrointestinal Tract From Nonsteroidal Anti-Inflammatory Drugs: What About Perforations and the Healing Intestine? Gastroenterology 2018, 155, 1271–1272. [Google Scholar] [CrossRef] [PubMed]
  49. Serón-Arbeloa, C.; Labarta-Monzón, L.; Puzo-Foncillas, J.; Mallor-Bonet, T.; Lafita-López, A.; Bueno-Vidales, N.; Montoro-Huguet, M. , Malnutrition Screening and Assessment. Nutrients, 2022; 14. [Google Scholar]
  50. Dent, E.; Wright, O. R. L.; Woo, J.; Hoogendijk, E. O. , Malnutrition in older adults. Lancet (London, England), 2023; 401, 951–966. [Google Scholar]
  51. Capurso, G.; Traini, M.; Piciucchi, M.; Signoretti, M.; Arcidiacono, P. G. , Exocrine pancreatic insufficiency: prevalence, diagnosis, and management. Clinical and experimental gastroenterology 2019, 12, 129–139. [Google Scholar] [CrossRef] [PubMed]
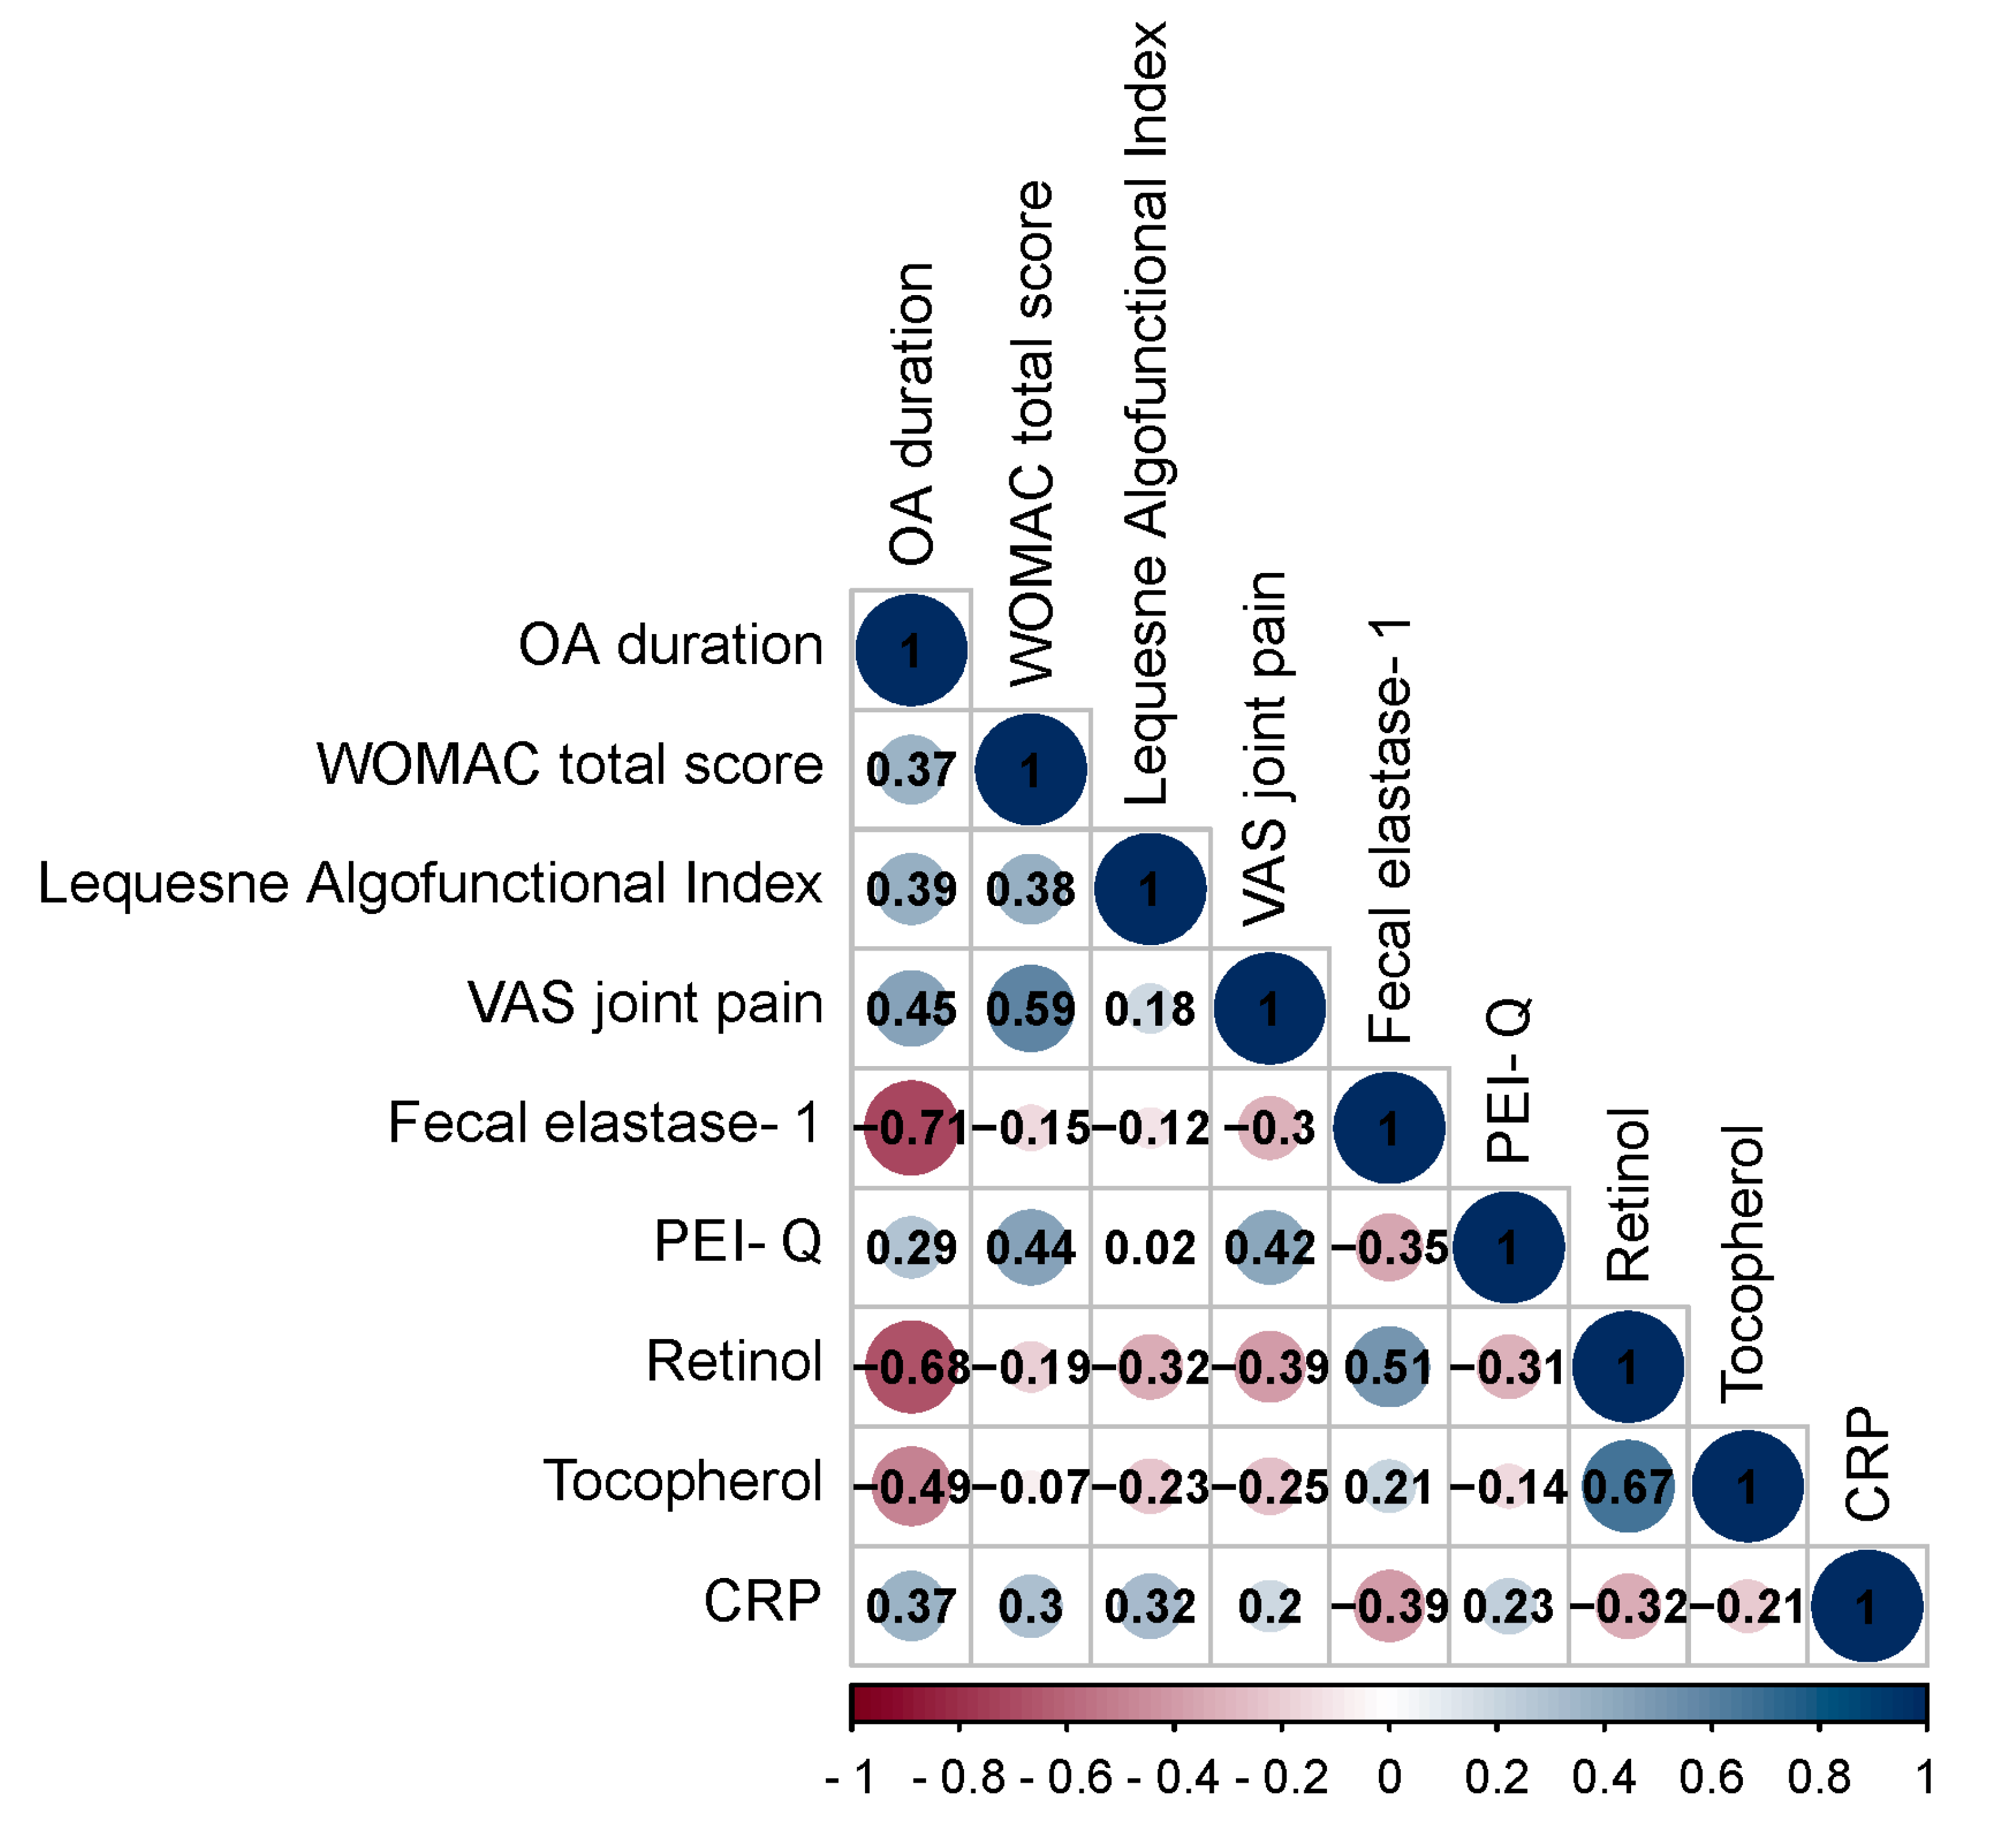
Figure 1. Spearman correlation correlogram used for correlations between data in patients with OA. Red: Strong negative correlation (r = −1.0). Blue: Strong positive correlation (r = 1.0).
Preprints 112058 g001
Figure 2. Spearman correlation correlogram used for correlations between data in patients with OA+CP. Red: Strong negative correlation (r = −1.0). Blue: Strong positive correlation (r = 1.0).
Preprints 112058 g002
Figure 4. Analysis of the sensitivity and specificity of the relationship between BMI on the comorbidity formation of OA and CP.
Preprints 112058 g004
Figure 5. ROC curve characterizing the relationship between fecal elastase-1 levels and the formation of exocrine pancreatic insufficiency (EPI) in OA.
Preprints 112058 g005
Figure 6. Analysis of the sensitivity and specificity regarding the association between fecal elastase-1 levels and the development of exocrine pancreatic insufficiency (EPI) in OA.
Preprints 112058 g006
Figure 7. Principal component analysis for the OA and comorbidity presence.
Preprints 112058 g007
Figure 8. Odds ratios estimates with corresponding 95% CI's for predictors included to the model EPI presence in OA.
Preprints 112058 g008
Figure 9. ROC-curve characterizing the dependence of the probability EPI presence in OA on Value of logistic function P.
Preprints 112058 g009
Figure 10. Analysis of the sensitivity and specificity of EPI presence in OA depending on Value of logistic function P.
Preprints 112058 g010
Figure 11. Clinical and laboratory signs of comorbid course of OA and CP. The Figure was designed using BioRender.
Preprints 112058 g011
Table 1. Indicators of OA course.
OA (n=68) OA+CP (n=52) p-value a
Kellgren-Lawrence grade 1.5 (1–2) 2 (1–2) p = 0.1437
WOMAC pain 10 (10–11) 16 (16–16) p < 0.001
WOMAC stiffness, 3 (3–3) 4(4–5) p = 0.02
WOMAC function 28 (28–29) 38 (37–39) p < 0.001
WOMAC total 42 (41–43) 58 (57.75–60) p < 0.001
Lequesne Algofunctional Index 5 (5–6) 8 (8–8) p < 0.001
VAS joint pain 31 (30–32.25) 44 (43–45) p < 0.001
VAS movement 37 (36–38.25) 52 (51–52) p < 0.001
VAS inflammation 16 (15–17) 28 (27–29) p < 0.001
VAS joint dysfunction 15 (14–16) 30 (29–31) p < 0.001
Median and interquartile range (IQR) were used to summarize the data. a Mann–Whitney test.
Table 2. Indicators of exocrine pancreatic insufficiency and gastrointestinal symptoms.
Control (n=30) OA (n=68) OA+CP (n=52) p-value b
Fecal elastase-1, mcg/g 233.88 (228.46–237.38) 201.24 (198.93–204.28) 81.43 (76–87.9) p < 0.001
Total bilirubin, µmol/L 5.05 (4.44–5.71) 5.11 (4.77–5.61) 5.14 (4.63–5.64) p = 0.923
Direct bilirubin, µmol/L 1.96 (1.55–2.2) 1.86 (1.47–2.2) 2.09 (1.65–2.34) p = 0.1767
Indirect bilirubin, µmol/L 3.39 (3.13–3.61) 3.41 (3.11–3.76) 3.44 (2.99–3.78) p = 0.6505
ALT, µkat/L 0.28 (0.19–0.38) 0.3 (0.23–0.38) 0,36 (0,23–0,51) p = 0.0787
AST, µkat/L 0.24 (0.21–0.29) 0.24 (0.19–0.32) 0.29 (0.22–0.32) p = 0.1886
GGT, U/L 18.09 (17.01–19.02) 18.11 (17.33–18.73) 16.77 (14.52–20.57) p = 0.7773
Alkaline phosphatase, U/L 77.32 (73.04–80.53) 78.99 (75.48–86.43) 80.93 (75.75–85.64) p = 0.0633
PEI-Q
OA (n=68) OA+CP (n=52) p-value a
Abdominal symptoms (А) 0.31 (0.25–0.37) 1.86 (1.78–1.91) p < 0.001
Bowel movement symptoms (В) 0.27 (0.23–0.31) 1.8 (1.72–1.85) p < 0.001
Total symptom score 0.29 (0.25–00.33) 1.83 (1.75–1.89) p < 0.001
Impact (С) 0 (0–0) 1.89 (1.79–1.96)
Total summary score 0 (0–0) 1.85 (1.78–1.9)
GSRS
Control (n=30) OA (n=68) OA+CP (n=52)
GSRS-AP 1.22 (1.01–1.44) 4.9 (4.74–5.13) p < 0.001
GSRS-IS 0.91 (0.76–1.11) 4.75 (4.61–4.91) p < 0.001
GSRS-DS 1.23 (1.01–1.37) 4.61 (4.41–4.74) p < 0.001
GSRS-CS 0.47 (0.4–0.52) 4.14 (3.99–4.22) p < 0.001
GSRS-RS 1.01 (0.85–1.14) 4.25 (4.12–4.33) p < 0.001
Median and interquartile range (IQR) were used to summarize the data. a Mann–Whitney b Kruskal–Wallis test.
Table 3. Clinical and laboratory signs of the comorbid course of OA and CP.
Control (n=30) OA (n=68) OA+CP (n=52) p-value b
Retinol, mg/l 0.71 (0.63–079) 0.43 (0.37–0.49) 0.19 (0.15–0.23) p < 0.001
Tocopherol, mg/l 11.92 (11.34–12.33) 6.96 (6.69–7.19) 3.69 (3.37–3.94) p < 0.001
25(OH) vitamin D3, ng/l 42.59 (42.07–43.44) 32.07 (30.95–33.55) 21.81 (20.77–23.81) p < 0.001
Thiamine, µg/L 60.45 (52.82–65.82) 60.73 (55.57–64.9) 59.24 (57.16–60.96) p = 0.6889
Pyridoxine, µg/L 25.33 (24.42–26.6) 23.31 (19.57–27.58) 21.89 (15.79–30.18) p = 0.1408
BMI, kg/m² 20.55 (20.17–20.9) 29.78 (28.84–30.97) 25.1 (24.21–25.63) p < 0.001
RBC, 10¹²/L 3.66 (3.45–3.99) 3.84 (3.56–4.06) 3.64 (3.39–3.89) p = 0.0688
WBC, 10[9]/L 4.68 (4.33–4.95) 4.91 (4.53–5.48) 4.87 (4.55–5.48) p = 0.065
Hemoglobin, g/L 130 (119–137.25) 125.5 (112.75–135) 123 (114.25–135) p = 0.3282
Iron, mcmol/l 27.31 (25.43–28.61) 15.73 (13.69–17.58) 6.61 (5.37–7.73) p < 0.001
Ferritin, ng/ml 88.98 (86.78–92.25) 64.18 (60.61–66.66) 36.29 (34.43–38.15) p < 0.001
Transferrin, mg/dl 318.17 (313.28–321.83) 461.7 (456.23–466.88) 527.57 (521.64–534.79) p < 0.001
CRP, mg/l 1.00 (0.81–1.22) 2.68 (2.54–2.77) 4.52 (4.33–4.64) p < 0.001
Median and interquartile range (IQR) were used to summarize the data. b Kruskal–Wallis test.
Table 4. Rotated Component Matrix for the OA and comorbidity presence.
Component
Factor 1 Factor 2
WOMAC total score -0,890 0,429
Fecal elastase-1 0,976 0,172
CRP -0,979 0,104
BMI -0,110 0,992
Ferritin 0,978 -0,135
Retinol 0,920 -0,227
Tocopherol 0,947 -0,289
25(OH) vitamin D3 0,957 -0,187
Extraction Method: Principal Component Analysis. Rotation Method: Varimax with Kaiser Normalization. Rotation converged in 3 iterations.
Table 5. Characteristics of the association of predictors with the probability of EPI presence in OA.
Predictors Unadjusted Adjusted
COR; 95% CI p AOR; 95% CI p
GSRS-DS 2.773; 2.061 – 3.732 < 0.001* 7.592; 1.146 – 50.350 0.036*
GSRS-CS 2.511; 1.916 – 3.294 < 0.001* 0.003; 0.000 – 0.057 < 0.001*
PEI-Q-A 10.285; 5.186 – 20.389 < 0.001* 34207.493; 48.570 – 24082596.484 0.002*
Retinol 0.000; 0.000 – 0.000 < 0.001* 0.000; 0.000 – 0.014 0.009*
Tocopherol 0.399; 0.296 – 0.538 < 0.001* 5.651; 1.793 – 17.814 0.003*
Iron 0.705; 0.634 – 0.784 < 0.001* 0.577; 0.399 – 0.835 0.004*
* – association of the outcome value with the predictor value is statistically significant (p < 0.05).
Disclaimer/Publisher’s Note: The statements, opinions and data contained in all publications are solely those of the individual author(s) and contributor(s) and not of MDPI and/or the editor(s). MDPI and/or the editor(s) disclaim responsibility for any injury to people or property resulting from any ideas, methods, instructions or products referred to in the content.
Copyright: This open access article is published under a Creative Commons CC BY 4.0 license, which permit the free download, distribution, and reuse, provided that the author and preprint are cited in any reuse.
Prerpints.org logo

Preprints.org is a free preprint server supported by MDPI in Basel, Switzerland.

Subscribe

© 2024 MDPI (Basel, Switzerland) unless otherwise stated