Preprint
Article

Coil Misalignment Perception and Correction in a Mobile Inductive Power Transfer System for Wirelessly Recharging Underground Agricultural Sensors

Altmetrics

Downloads

121

Views

66

Comments

0

Submitted:

13 July 2024

Posted:

15 July 2024

You are already at the latest version

Alerts
Abstract
Field implementations of inductive power transfer (IPT) face many practical challenges that dramatically reduce power transmission effectiveness. Coil misalignment is a persistent issue in IPT systems, especially in applications involving vehicles or nonvisible coils. Furthermore, magnetic field symmetry convolutes the decomposition of misalignment measurements in multiple dimensions and frequently impedes the efficacy of traditional position correction strategies. This paper presents an automated methodology to sense misalignments and align IPT coils using robotic actuators and sequential Monte Carlo methods. The misalignment of a Class EF inverter-driven IPT system was modeled by tracking changes as its coils move apart laterally and distally. These models were integrated with particle filters to estimate the location of a hidden coil in 3D, given a sequence of sensor measurements. During laboratory tests on a Cartesian robot, these algorithms aligned the IPT system within 1 cm (0.025 coil diameters) of peak lateral alignment. On average, the alignment algorithms required less than four sensor measurements for localization. After laboratory testing, this approach was implemented with an agricultural sensor platform at the Utah Agricultural Experiment Station in Kaysville, Utah. In this implementation, a buried sensor platform was successfully charged using an aboveground, vehicle-mounted transmitter.
Keywords: 
Subject: Engineering  -   Electrical and Electronic Engineering

1. Introduction

Emerging technology in the field of inductive power transfer (IPT) has had a significant impact on consumer electronics and embedded systems [1]. These innovations have provided a new framework for transferring power to inaccessible places. In many of these applications of IPT, part of the coupled system is hidden in some way from its counterpart. For example, rechargeable biomedical implants are often positioned beneath biological tissues [2], and underground sensor installations are generally inaccessible from aboveground [3]. The nature of this issue often leads to the inevitable problem of misalignment between the transmitter (primary) and receiver (secondary) ends of the inductive power link. Misalignment (see Figure 1a) negatively influences IPT systems because it reduces the coils’ mutual inductance L p s and reduces power transmission effectiveness. Accordingly, coil misalignment is often one of the limiting factors in applications of IPT [4]. Since many mobile IPT applications (Figure 1b) often rely on batteries as the power source for the transmitter, any reduction in efficiency reduces the amount of transferable power. Similarly, the diminution of power transfer magnitude will increase recharge mission duration, which may not be permissible under a given set of vehicle operating conditions.
Most works examining misalignment compensation have focused on dynamically tuning the primary-side hardware, which is typically a type of resonant power converter, e.g., Class E or full-bridge inverters [5,6,7]. While control methods differ based on hardware topology, many focus on controlling the switching frequency or the pulse width of the inverter’s output signal [7]. However, transmitter tuning realistically only works for minor alignment errors relative to the diameter of the coils and compensates for misalignment rather than corrects, i.e., attempts to maximize efficiency under the misaligned coupling conditions [4]. An approach focusing instead on misalignment correction is position control of the IPT system’s coils. In this approach, a sensor system detects position errors, and a robot or vehicle physically aligns the IPT coils. Unfortunately, the symmetry of the magnetic field about the transmitter means a single estimate of misalignment based on inductive coupling cannot easily be broken into i ^ , j ^ , and k ^ contributions. This fact leads to an issue of state observability and limits the viability of traditional feedback controllers. Prior research has mainly proposed two potential solutions to this issue: optimization and multi-coil receiver arrays [8,9]. While numerical optimization techniques have proven capable of physical alignment [10], the issue of state observability still negatively impacts their performance. Because misalignment measurements cannot be decomposed into directional contributions, these solutions often rely on approaches called "derivative-free" methods, such as coordinate descent, that can take many iterations to approach a solution and are not necessarily guaranteed to converge. The multi-coil array approach [8,9] seeks to eliminate the issue of state observability by adding multiple "sense" coils to the power transfer link. Each of these coils acts like an individual IPT receiver, and with an array of them, coupling-based misalignment estimates can be broken down into i ^ , j ^ , and k ^ components. Unfortunately, this muti-coil solution does not scale well with larger coil diameters (added size and weight), requires additional complex hardware, and has an increased parasitic power draw on the IPT link (reduced efficiency). Another limitation of this approach is that it requires additional data telemetry communication if the transmitter end of the IPT link is mobile instead of the receiver.
Because of these issues in existing solutions, there is a clear need for an alignment approach that can detect and correct for misalignments, work on both sides of an IPT transmission link, i.e., correct for misalignments using either transmitter or receiver data exclusively, and accomplish these tasks without complex coil topologies. The work presented in this paper focuses on perceiving and correcting (Section 2) IPT coil misalignment using a single IPT coil pair. The power transmission hardware in this work is based on the Class EF-driven system presented in [3]. Methods of misalignment perception are limited to direct measurements or estimates of induced voltage on the transmitting and receiving ends of the IPT system. This restriction excludes planar coil arrays to avoid the added complexity, parasitic power draws, weight, and bulk associated with such systems. Perceived misalignments are corrected using sequential Monte Carlo particle filters and a path planning routine. This statistical approach addresses the state observability issue common in current misalignment correction approaches. The effectiveness and speed of this alignment approach are benchmarked extensively in Section 3 of this work. The results of these tests and a field test demonstrating effective power transfer through the soil to an underground agricultural soil sensing platform are discussed in Section 4. This paper concludes Section 5 by remarking on the overall viability of this methodology.

2. Materials and Methods

2.1. Inductive Power Transmission Hardware and Perception of Coil Misalignment

IPT applications use various transmission hardware architectures and form factors to achieve wireless power transmission. System architectures are typically selected based on multiple factors, but operating frequency, desired power output, and size requirements are the most common factors influencing system design. In the MHz regime, most systems rely on resonant power converters to generate the oscillating magnetic field required for IPT. Because IPT systems vary so much in hardware design, methods of perceiving misalignment may need to differ slightly based on the specifics of the hardware.
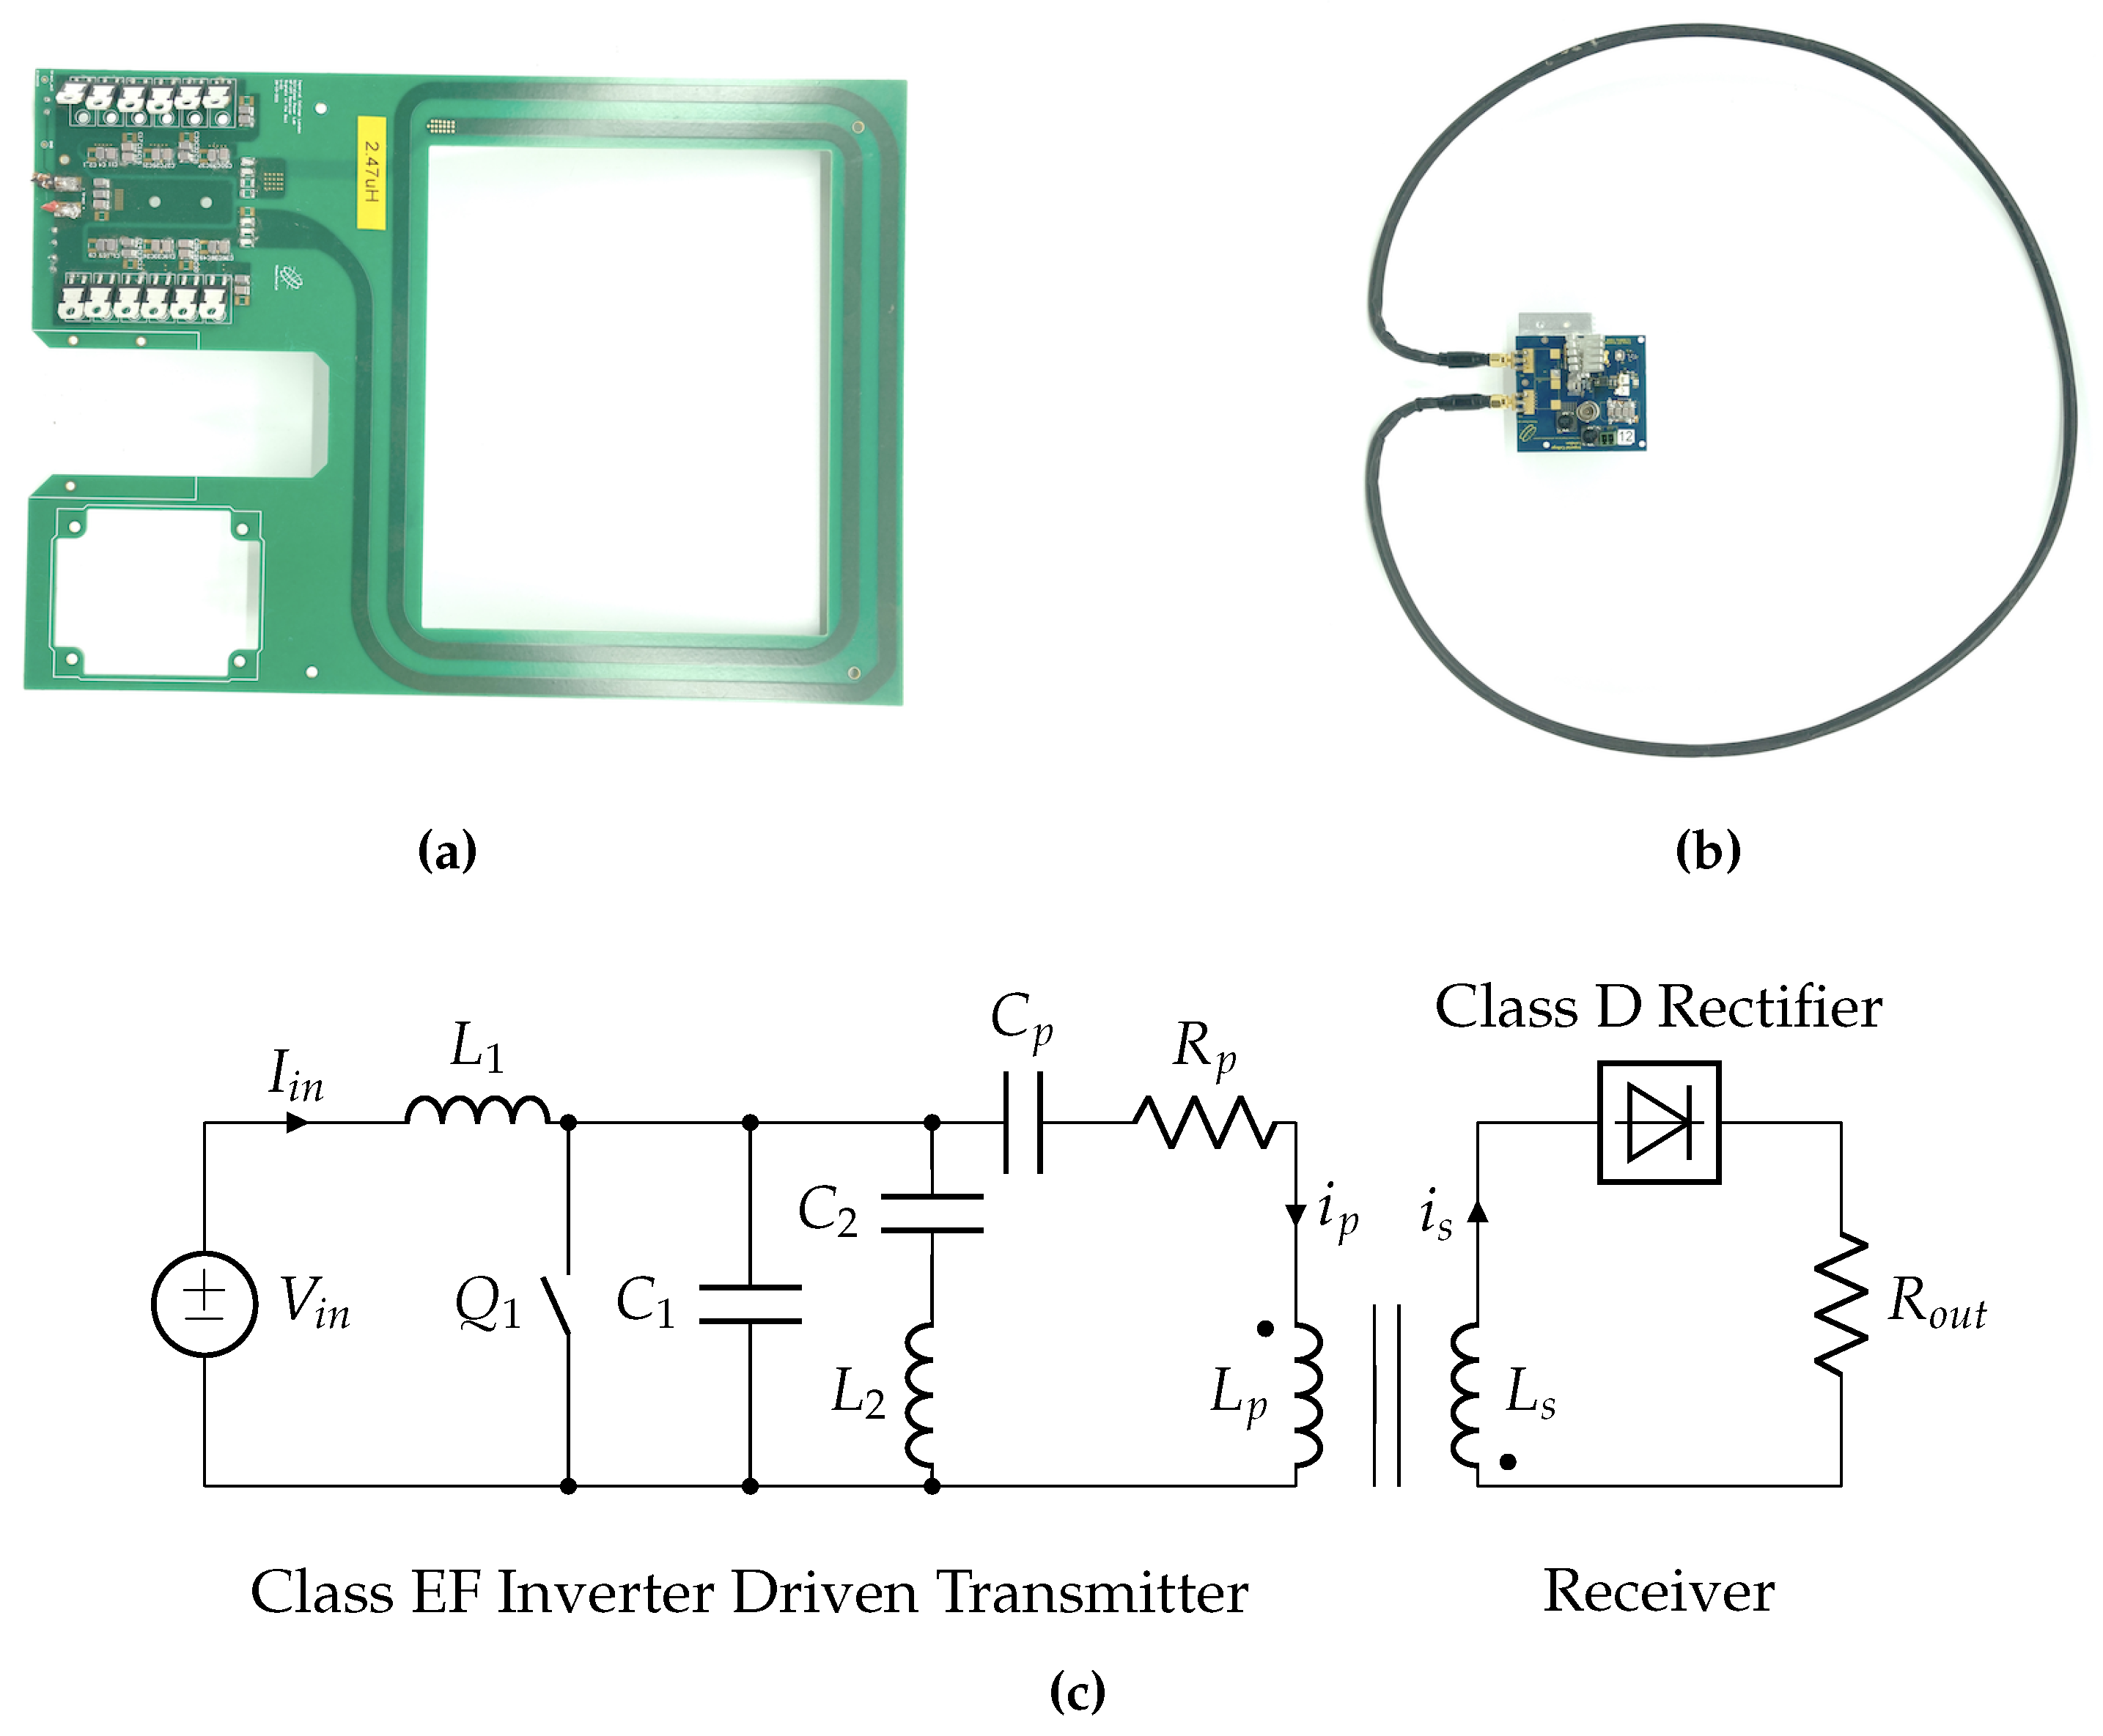
The IPT transmitter used in this work (Figure 2b) is based on a 13.56 MHz load-independent Class EF inverter [11], a type of single-switch resonator. This inverter excites a 40 cm diameter copper-pipe coil to generate a time-varying magnetic field. The coupled receiver seen in Figure 2a uses a Class D voltage multiplier rectifier and 20 cm width PCB coil (square; 2 turns) to collect power from the transmitter. While typically used to charge batteries or supercapacitor banks, the receiver in this work is terminated with a 200 Ohm rheostat to reduce the number of influencing factors on test data. The shapes of the coils were selected for the field application presented in [3]. Given the loading conditions and DC excitation voltage used in this work (40 VDC), the IPT system can transfer 10 Watts of power at 40% efficiency at perfect concentric alignment [12] and 20 cm of distal separation (distal separation is based on application requirements). Under different operating conditions, power transfer magnitude and efficiency can be improved (greater than 40 W and 80% efficiency [3]) by increasing the coupling factor, increasing the DC excitation voltage, and using a power-hungrier load. Under the agricultural operational scenario discussed later in this work, it is quite plausible that the underground system may need to operate for several months without recharging. The high power transmission capabilities of this IPT system facilitate rapid, high-energy recharging of the coupled underground hardware for additional convenience to equipment operators and as a protective measure against infrequent charge missions. However, it should be noted this paper focuses on the alignment of IPT systems, not their design or optimization.

2.1.1. Misalignment Estimation with a Class EF Inverter

Coil misalignment negatively impacts IPT mainly because of its effect on the system’s magnetic coupling factor k. As the coils of an IPT system move apart laterally, the mutual magnetic flux between the coils drops significantly. Without any additional changes to the system, Faraday’s law states that the induced EMF in the receiver will decrease in proportion to the change in flux. While this effect negatively impacts IPT system performance, it provides a useful means of misalignment estimation [13]. However, many applications of IPT using mobile robotics focus on mobile transmission hardware that charges stationary receivers. Thus, the induced voltage on the receiver must be measured via the transmitter alone, which is challenging and heavily architecture-dependent. Because the IPT hardware used in this work is based on a Class EF inverter, methods of characterizing misalignment via changes in induced voltage will focus on this specific topology.
Measuring induced voltage on a Class EF-driven IPT system has been discussed in [14]. Figure 2c shows a simplified circuit schematic of a load-independent Class EF inverter and the corresponding receiver circuitry. The transmitter coil is represented by an equivalent capacitance C p , resistance R p , and inductance L p . Inductor L p is magnetically coupled to the receiver coil L s with the coupling coefficient of k. On the receiver, voltage probes can be attached parallel to the load R o u t to measure induced voltage V R o u t directly. Estimating the induced voltage with the transmitter alone is more challenging. Unlike other topologies (namely Class E and Φ inverters), load-independent Class EF inverters produce a constant magnitude current i p in the primary coil instead of a constant voltage [11]. Because Class EF inverters are fed with a constant input voltage source V i n , the DC current draw I i n changes based on shifts in the load reflected from the receiver circuitry. If R o u t is held constant, as in this work, changes in magnetic coupling k, i.e., misalignment, will have the largest impact on I i n . Based on these relationships, the induced voltage in the secondary coil and, therefore, misalignment can directly be estimated as a function of the inverter’s DC current I i n if the receiver hardware is inaccessible or does not support rapid data telemetry.

2.1.2. Numerically Modeling Misalignment with a Class EF Inverter

In this work, numerically modeling the IPT system helps predict the behavior of the signals I i n and V R o u t under various conditions. The value of predicting these signals is related to two critical tasks in the coil alignment process: hardware design and control signal prediction. As the overall power delivery system is intended for embedded field applications, data-logging equipment must be purpose-built and cannot rely on benchtop equipment such as oscilloscopes and voltage supplies. The signals output by this numerical model influence design factors such as analog-to-digital converter selection, filter design, and power requirements. While numerous environmental factors, e.g., coupling with metallic structures, can impact these models’ accuracy, the IPT system’s misalignment response should follow the same general trends as the model. If sufficiently accurate, control signals can be drawn directly from the model and implemented on the alignment hardware, though the viability of such a scenario requires further validation. The control signals I i n and V R o u t can be estimated by beginning with the Biot–Savart law:
B ( r ) = μ 0 4 π C i p l × r r 3
where r represents a Cartesian coordinate in space, B ( r ) the magnetic field vector at point r , μ 0 the permeability of free space, i p the current through the transmitter coil, vector d l a differential section of the transmitter coil, l the coordinate of d l , and r = r l . This law can be applied to a three-dimensional grid of coordinates in a computing environment such as MatLab to form the basis of this numerical model. The goal of this initial step is to estimate the shape and magnitude of the magnetic field that forms around the IPT transmitter. With a grid of precalculated B vectors, the misalignment and inclination angle of the receiver coil can easily be adjusted without significant reformulation. Once B is calculated for a sufficient number of points in space, the magnetic flux through the receiver Φ b can be calculated using:
Φ b ( t ) = Σ B ( t ) · d A = B a v g sin ( ω t ) · A
where A is the area vector of the receiver about the closed path Σ , and B a v g is the average magnetic field strength through Σ . In an inductive power transfer system, B ( t ) is created by the transmitter by oscillating its current i p at circular frequency ω . Once magnetic flux is calculated, the voltage induced in the receiver U s can be calculated using Faraday’s law:
U s = N d Φ b d t = ω N B a v g cos ( ω t ) · A
with N representing the number of coil turns in the receiver. Mutual inductance L p s and the coupling factor k can optionally be calculated using Equations 4 and 5. In these equations, L p and L s are the self-inductances of the transmitter and receiver coils, respectively.
L p s = U s j ω i p
k = L p s L p L s
Once U s is obtained, the power output dissipated by the receiver’s load P o u t can be calculated using:
P o u t , r m s = V R o u t 2 R o u t U s , r m s 2 R o u t
where R o u t is the resistance of the load and V R o u t is the DC voltage output by the receiver’s rectifier. Finally, I i n can be calculated using the following relationship where η is the power transmission efficiency of the inverter.
I i n = P o u t η V i n
Efficiency η can be calculated using the following equation [15]:
η = k 2 Q p Q s 1 + 1 + k 2 Q p Q s ) 2
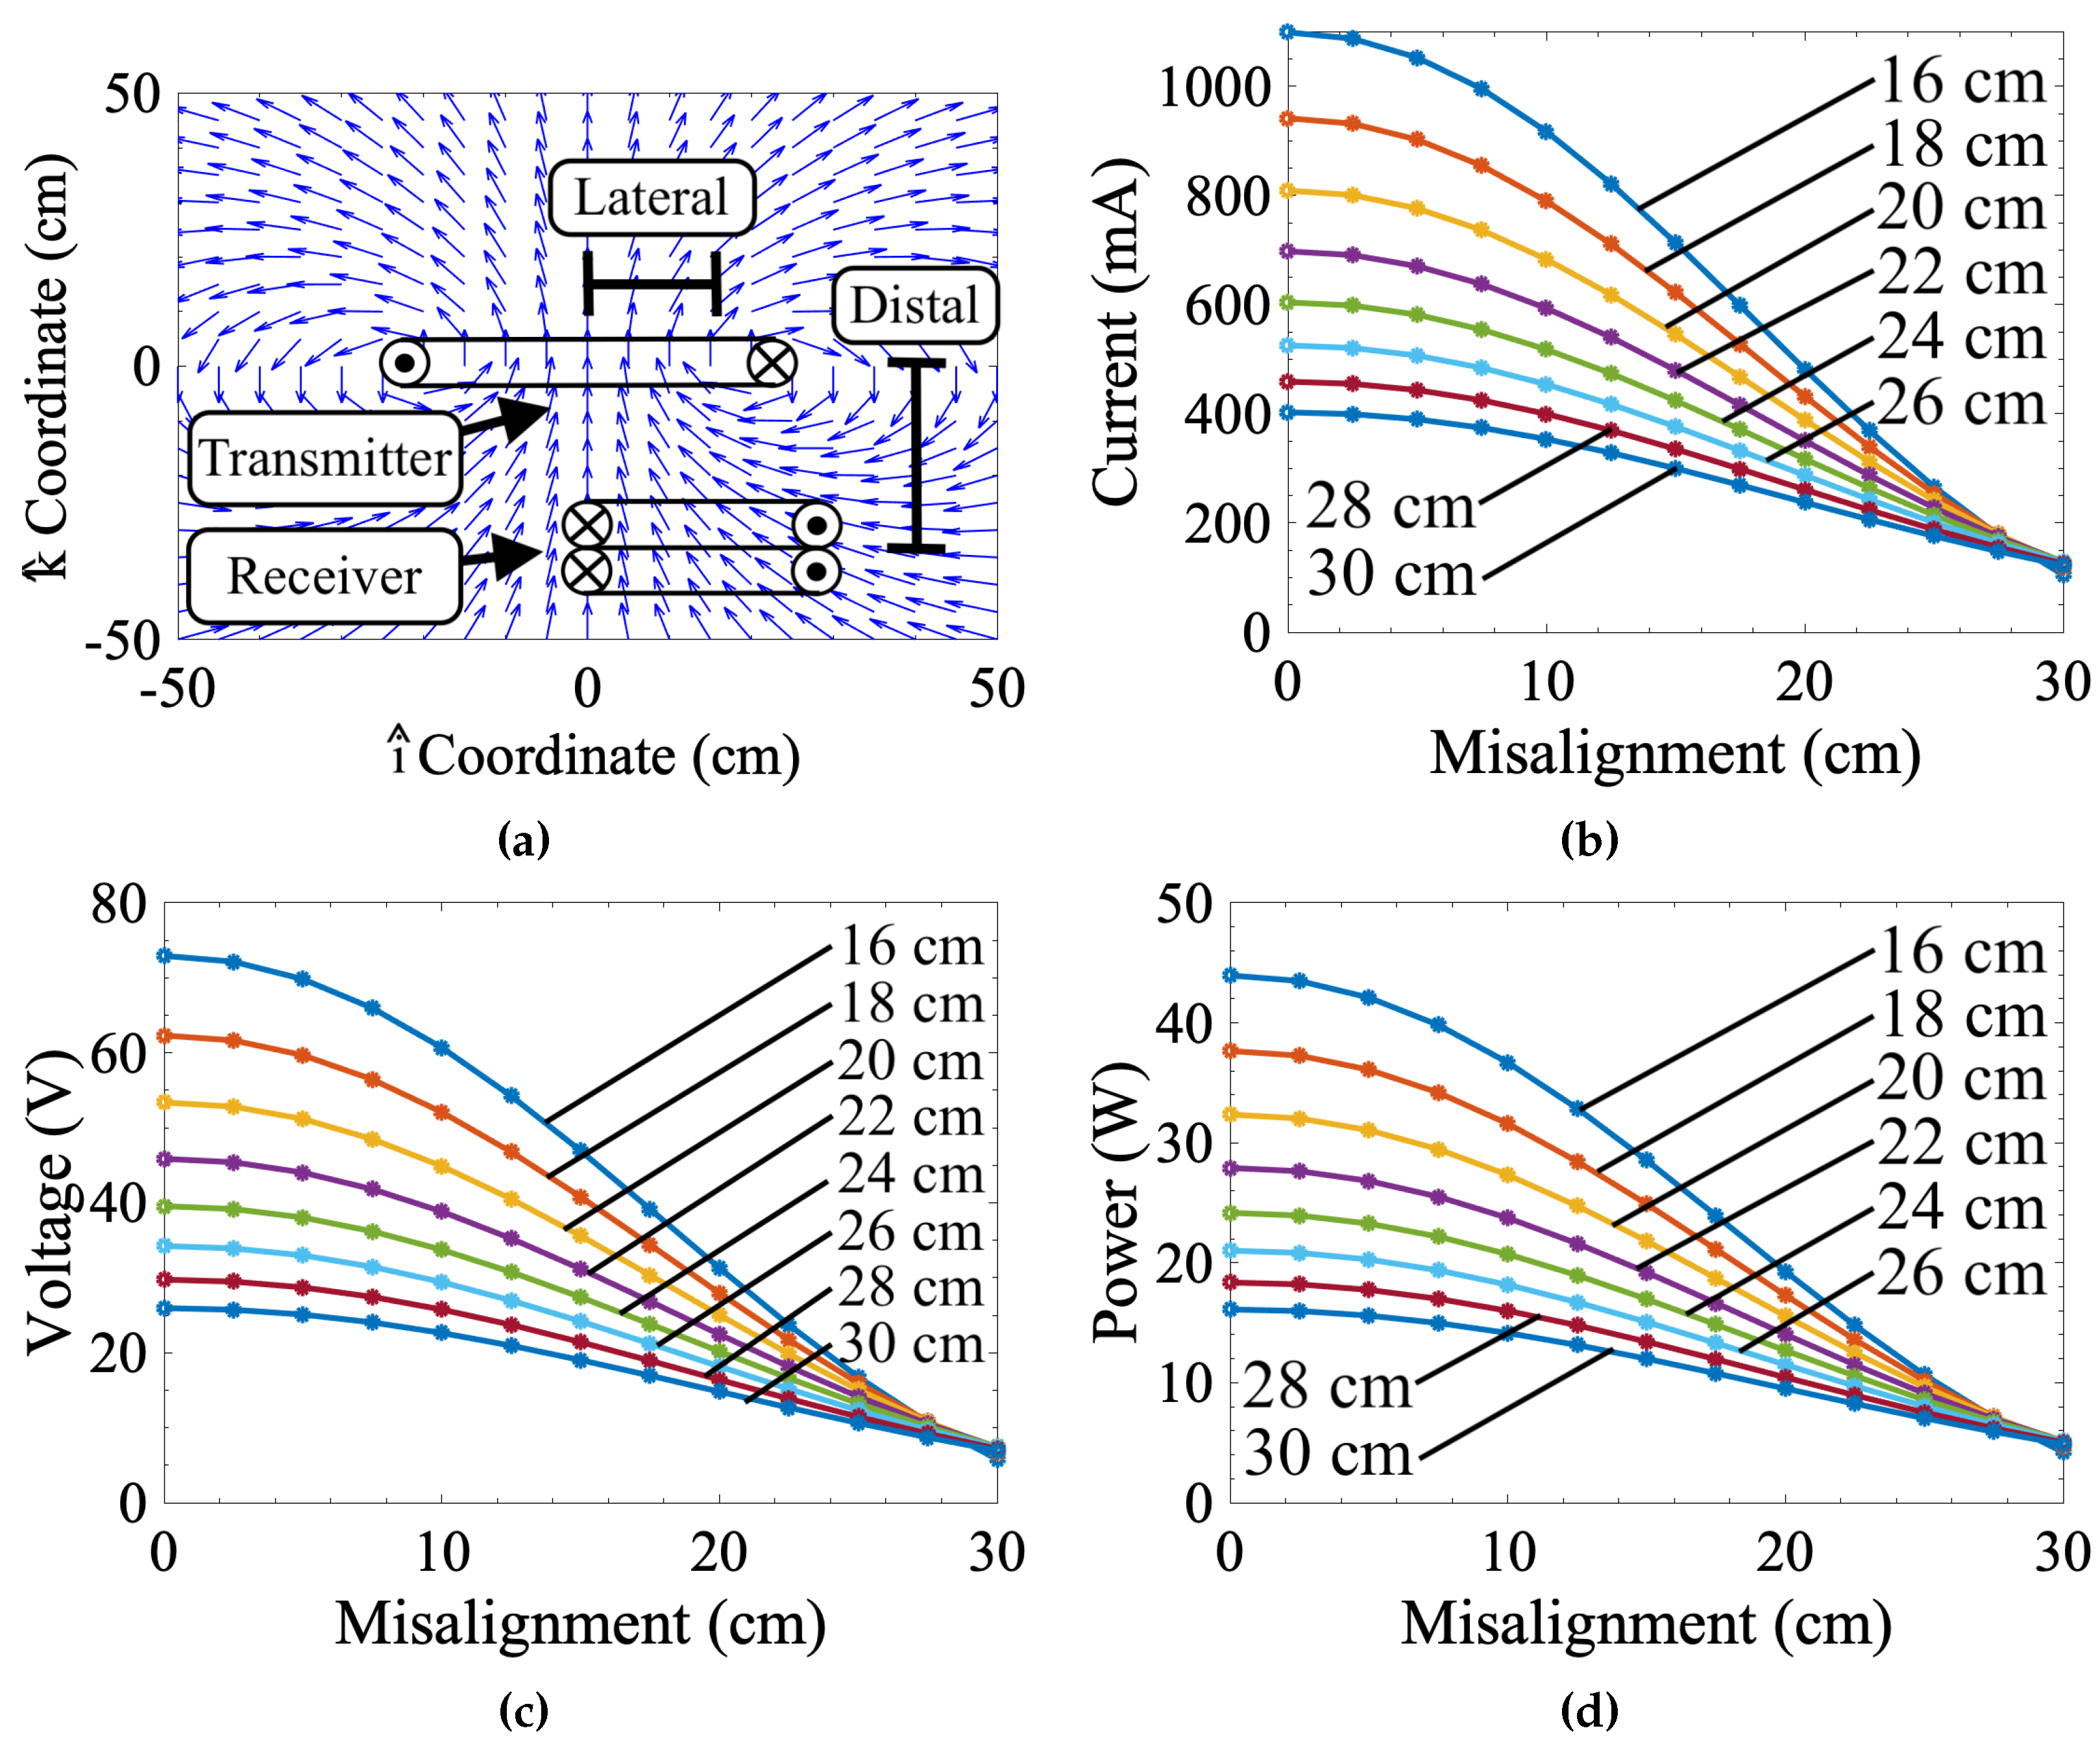
where Q p and Q s are the quality factors of the primary and secondary coils, respectively. Figure 3 shows the numerically simulated misalignment response of this work’s IPT system using the nominal operating conditions in Table 1.
This model’s accuracy is discussed further in Section 3.2 of this paper, where the model’s output data are compared against measured values. However, there are some general trends that are expected in terms of prediction accuracy. For example, the Biot-Savart law used in Equation (1) is most accurate when applied to open spaces without nearby structures with high magnetic permeability. As such, the model treats the transmitter coil as a perfectly round closed loop in an open space. In reality, this coil is irregularly shaped and connects to a PCB with metallic heat sinks, RF connectors, and copper traces/pours. All these factors are expected to distort the shape and magnitude of the magnetic field as predicted by the Biot-Savart law, particularly when the coils are extremely close together, i.e., small distal separation. As distal separation increases, the model is expected to become more accurate since the receiver moves farther from the metallic structures, and the environment acts more like an open space. Based on this prediction, the model should be most accurate at 30 cm and least accurate at 16 cm of distal separation.

2.2. Automated Alignment Approach

In multi-coil IPT architectures, additional coils provide extra information about the relative position of the primary and secondary power transfer coils. In particular, the sensing coils can provide information about the direction (i.e., i ^ , j ^ , and j ^ contributions) of misalignment. With this information, an alignment robot could effectively align the coils using a standard feedback controller. Unfortunately, if the IPT system has a single coil pair, the measurement of current/voltage used to determine misalignment cannot be broken down into i ^ , j ^ , and j ^ contributions, leading to a lack of state observability. By contrast, schemas drawn from the robot navigation and localization field seem better suited to this specific control problem. These navigation approaches are often used with ranging methodologies such as radio Received Signal Strength Indicators (RSSI), which similarly struggle with issues of state observability [16]. Because transmitter current and receiver voltage do not give information about the direction of the misalignment, single-hypothesis approaches to localization, such as Kalman filtering, are not viable. Instead, a multi-hypothesis approach called a sequential importance sampling (SIS) particle filter was selected [17]. Fundamentally, this approach approximates the posterior probability distribution of some hidden Markov process’s internal states using weighted samples [18], i.e., "particles." In this work, the internal state is just the location of the hidden coil. The following probability equation describes this particle filter:
p x k | z 1 : k i = 1 N s w k i δ x k x k i
where x k represents the internal states of a Markov process that can be approximated using a series of observations, z 1 : k [18]. In this multi-hypothesis approach, N s samples, i.e., particles indexed by i, of x k i represent estimates of x k . Each hypothesis is assigned a significance weight w k i for every discrete observation k. Particle weights are calculated using the following equation [18]:
w k i w k 1 i p z k | x k i p x k i | x k 1 i q x k i | x k 1 i , z k
where q x k i | x k 1 i , z k is the importance density of the distribution, p x k i | x k 1 i is the transition prior probability of x k , and p z k | x k i is the conditional probability of z k given x k i . Typically, this expression is reduced to:
w k i w k 1 i p z k | x k i
by selecting the prior probability distribution as the importance density [18].

2.2.1. Coil Alignment Particle Filter Formulation

In this work, coil alignment can be described as moving the position of a mobile coil g k to the particle location x k i with the highest likelihood of containing a hidden coil x k i , b e s t . The measurement z k is represented by the current and voltage measurements made during alignment. Particle weights are calculated by first finding the expected sensor measurements z k , e x p e c t e d i at every particle using a model of z ( r , h ) such as the numerical model derived in this paper:
z k , e x p e c t e d i = f r k i , h k i
In this equation, r k i and h k i are the lateral and distal misalignments at each particle, respectively. For every particle, r k i is the distance between g k and x k i :
r k i = g k x k i
Once the expected sensor measurements are computed, the conditional probability of z k given x k i can be found using the following equation:
p z k | x k i = 1 σ 2 π exp 1 2 σ 2 z k z k , e x p e c t e d i 2
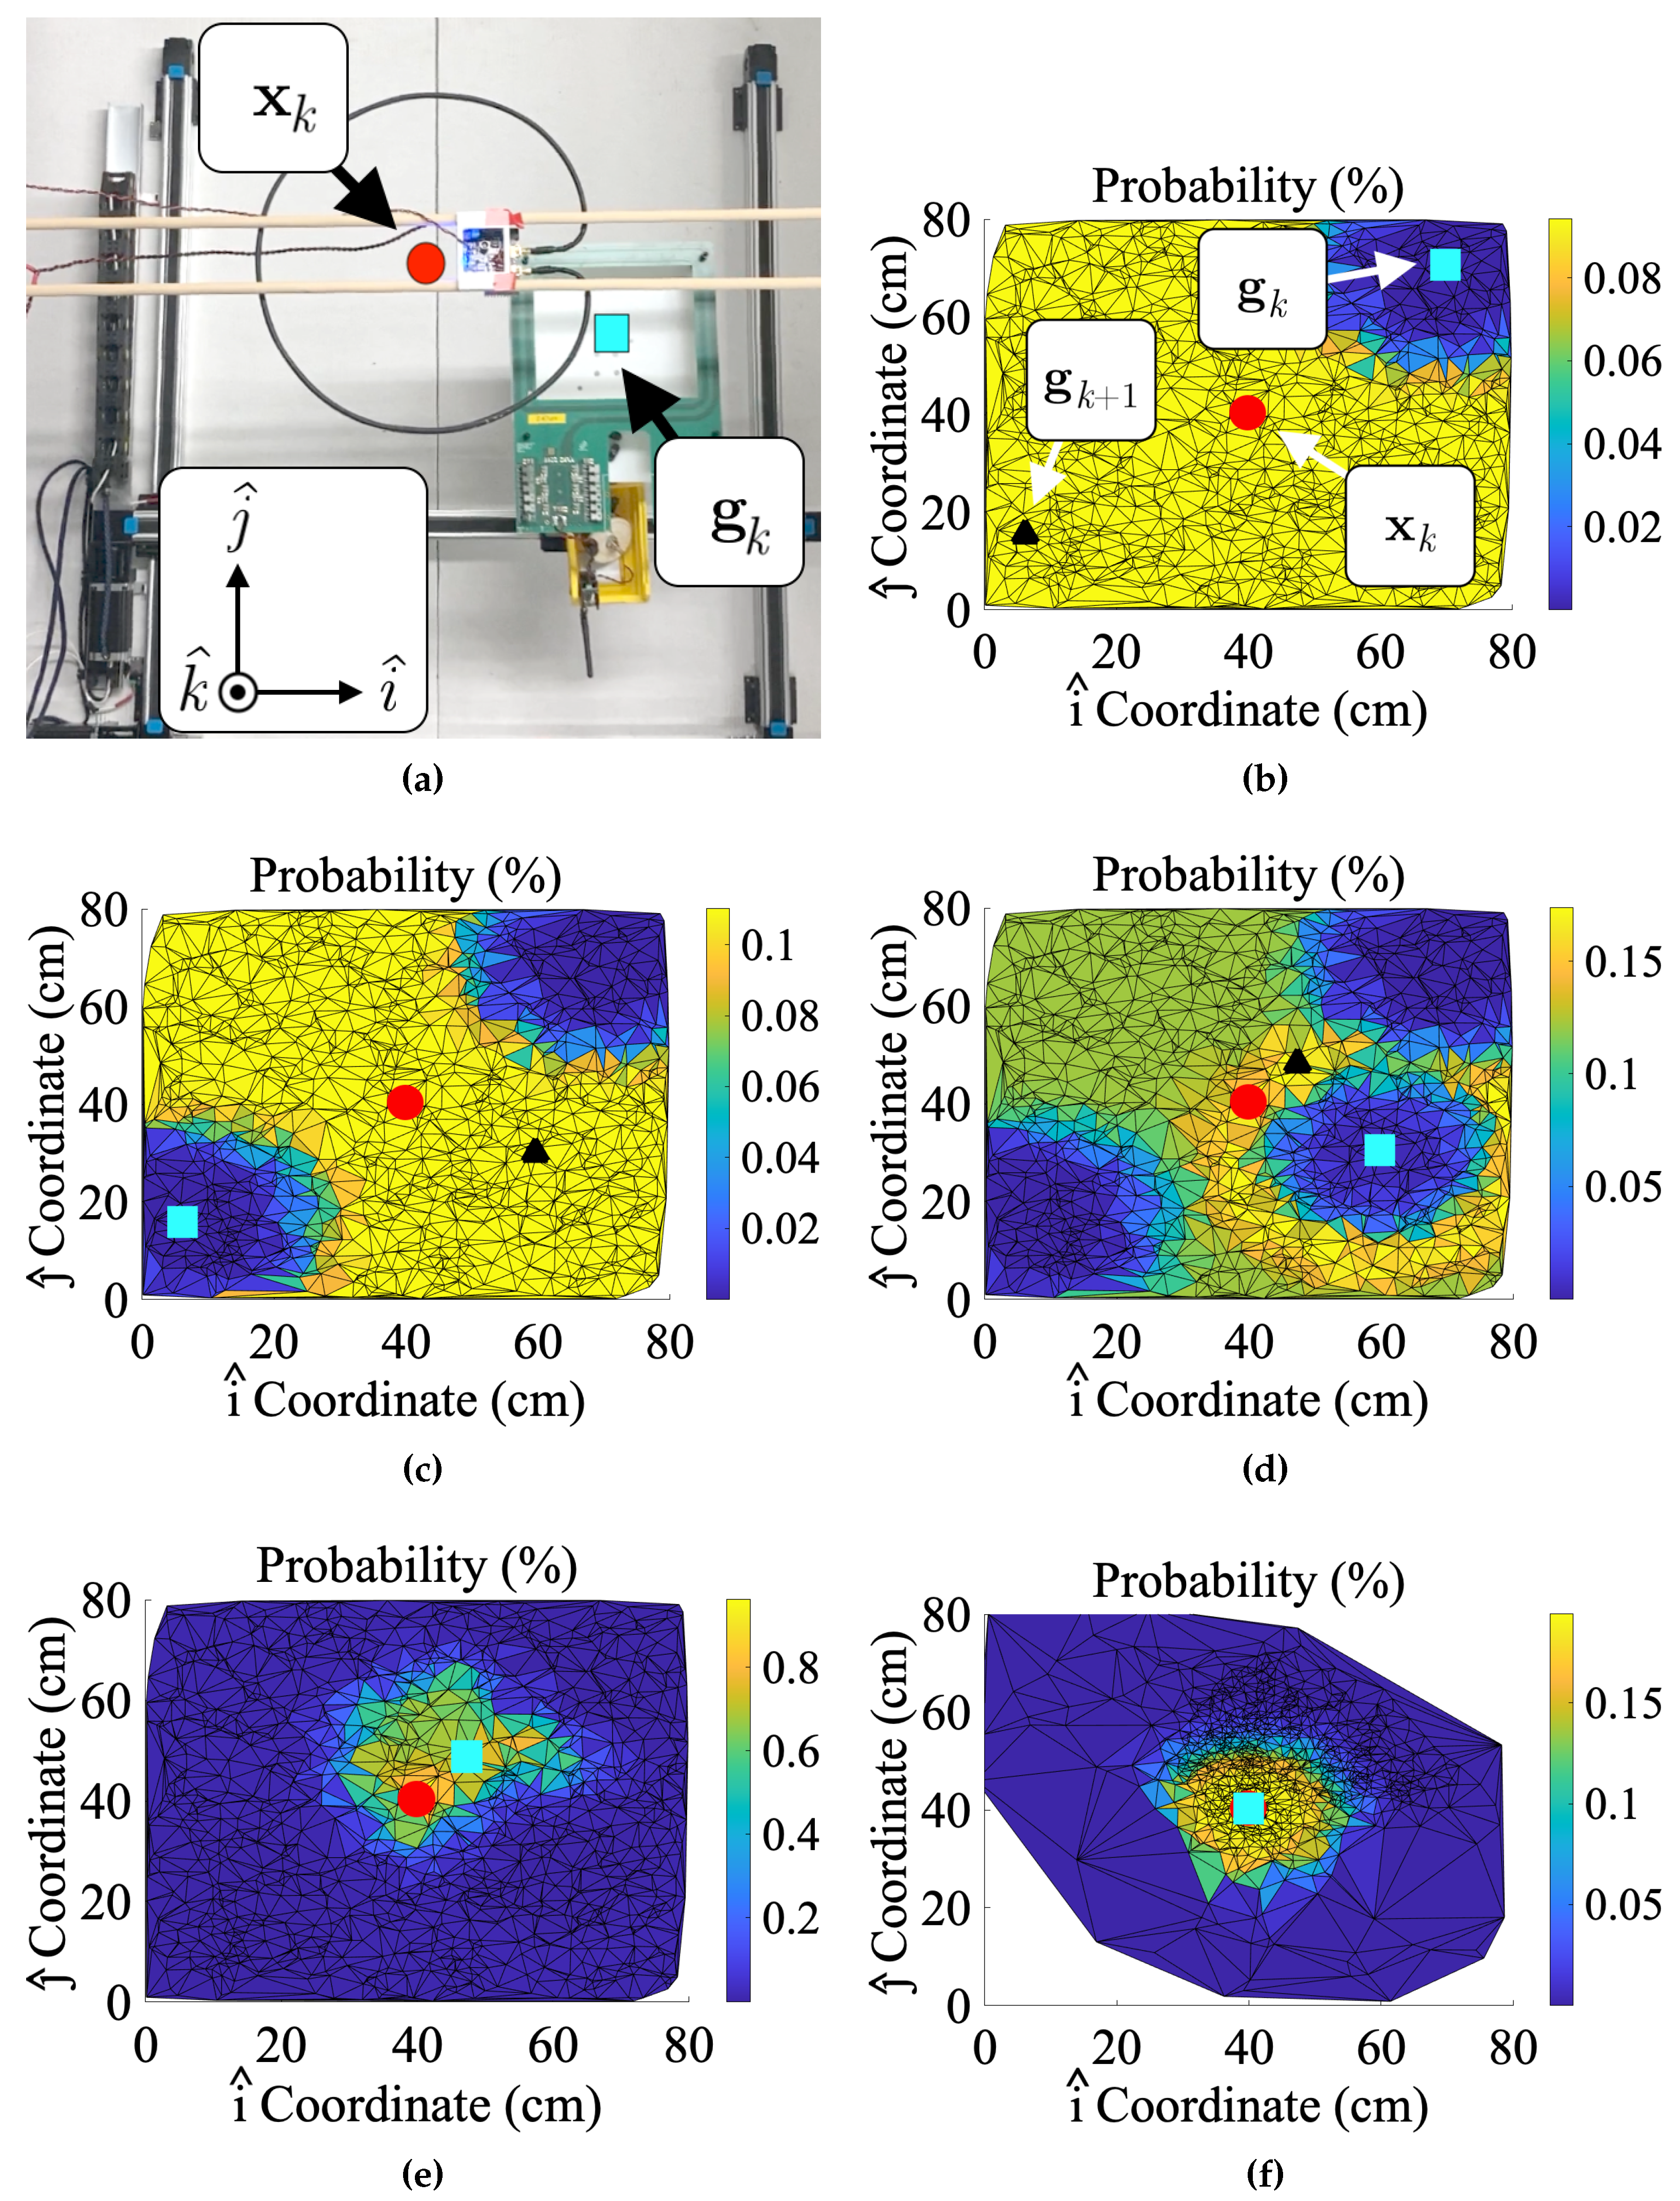
In this computation, individual sensor measurements are assumed to be normally distributed due to noise with measurement variance σ 2 . Figure 4 shows this process when applied to coil localization. This figure depicts a mobile coil g k iteratively converging to the location of the hidden coil x k .

2.2.2. Particle Resampling

Resampling is a process in particle filtering in which new particles are drawn from an older set of particles. Low-weight particles from prior iterations are discarded to propagate higher-weight particles. The solution tends to be a better approximation due to the higher concentration of particles in high-likelihood positions. Particle filters incorporating resampling are often called sequential importance resampling (SIR) algorithms [18]. There are several standard resampling schemas, but a multinomial [19] approach was selected in this work due to ease of implementation. Resampling in the alignment particle filter produces a dense field of particles in areas where the hidden coil is most probably located. However, overuse of resampling prevents the particle filter from converging in an appreciable amount of time [18]. For this reason, the SIR particle filter in this work only resamples a single time when the sensor output exceeds some predetermined threshold value Z. The selection of Z can be somewhat arbitrary, but the effect of concentrating particles remains the same regardless. Resampling can be seen in Figure 4f. In this figure, the particles are resampled and concentrated around the center of the gantry’s workspace.

2.2.3. 3D Particle Filter Extension

In the previous particle filter formulations, h k i has been held constant. However, knowing the exact distal separation between the IPT coils beforehand may be difficult or impossible in real applications of IPT. Instead of making an educated guess at some constant h k i , the SIS or SIR filter particles can be initialized using varying values of distal separation. Initializing particles in this manner allows for coil misalignment correction in all three spatial dimensions and helps correct minor inaccuracies in the parametric models of misalignment (modeling errors treated as an effective change in h k i ). Unfortunately, maintaining the same particle spread as the two-dimensional approach would require N s 3 / 2 particles (1000 particles per square meter in 2D or 31623 particles per cubic meter in 3D). This dramatic increase in particle volume is often called the "curse of dimensionality" in prior literature [18] since adding additional particle states frequently has this effect. Because each particle requires a minimum of 16 bytes of RAM ( i ^ , j ^ , k ^ , and w k 1 i , each stored as a 4-byte floating point number), large particle cloud volumes require tremendous amounts of memory. If memory is a limiting factor in particle initiation, the particles can instead be initialized on discrete planes in the k ^ direction. While the number of planes used in the particle filter is somewhat arbitrary, with a good initial guess of distal coil separation, only a few planes should be necessary to achieve better alignment accuracy. Functionally, this approach is similar to the well-documented Fast-SLAM algorithm [20,21], where each particle tracks the probability of a known or discovered landmark. Here, each plane of distal separation is treated as an independent landmark, and the filtering algorithm successively decides which "landmark" is the most probable plane of distal separation.

3. Results

3.1. Measured Misalignment Response

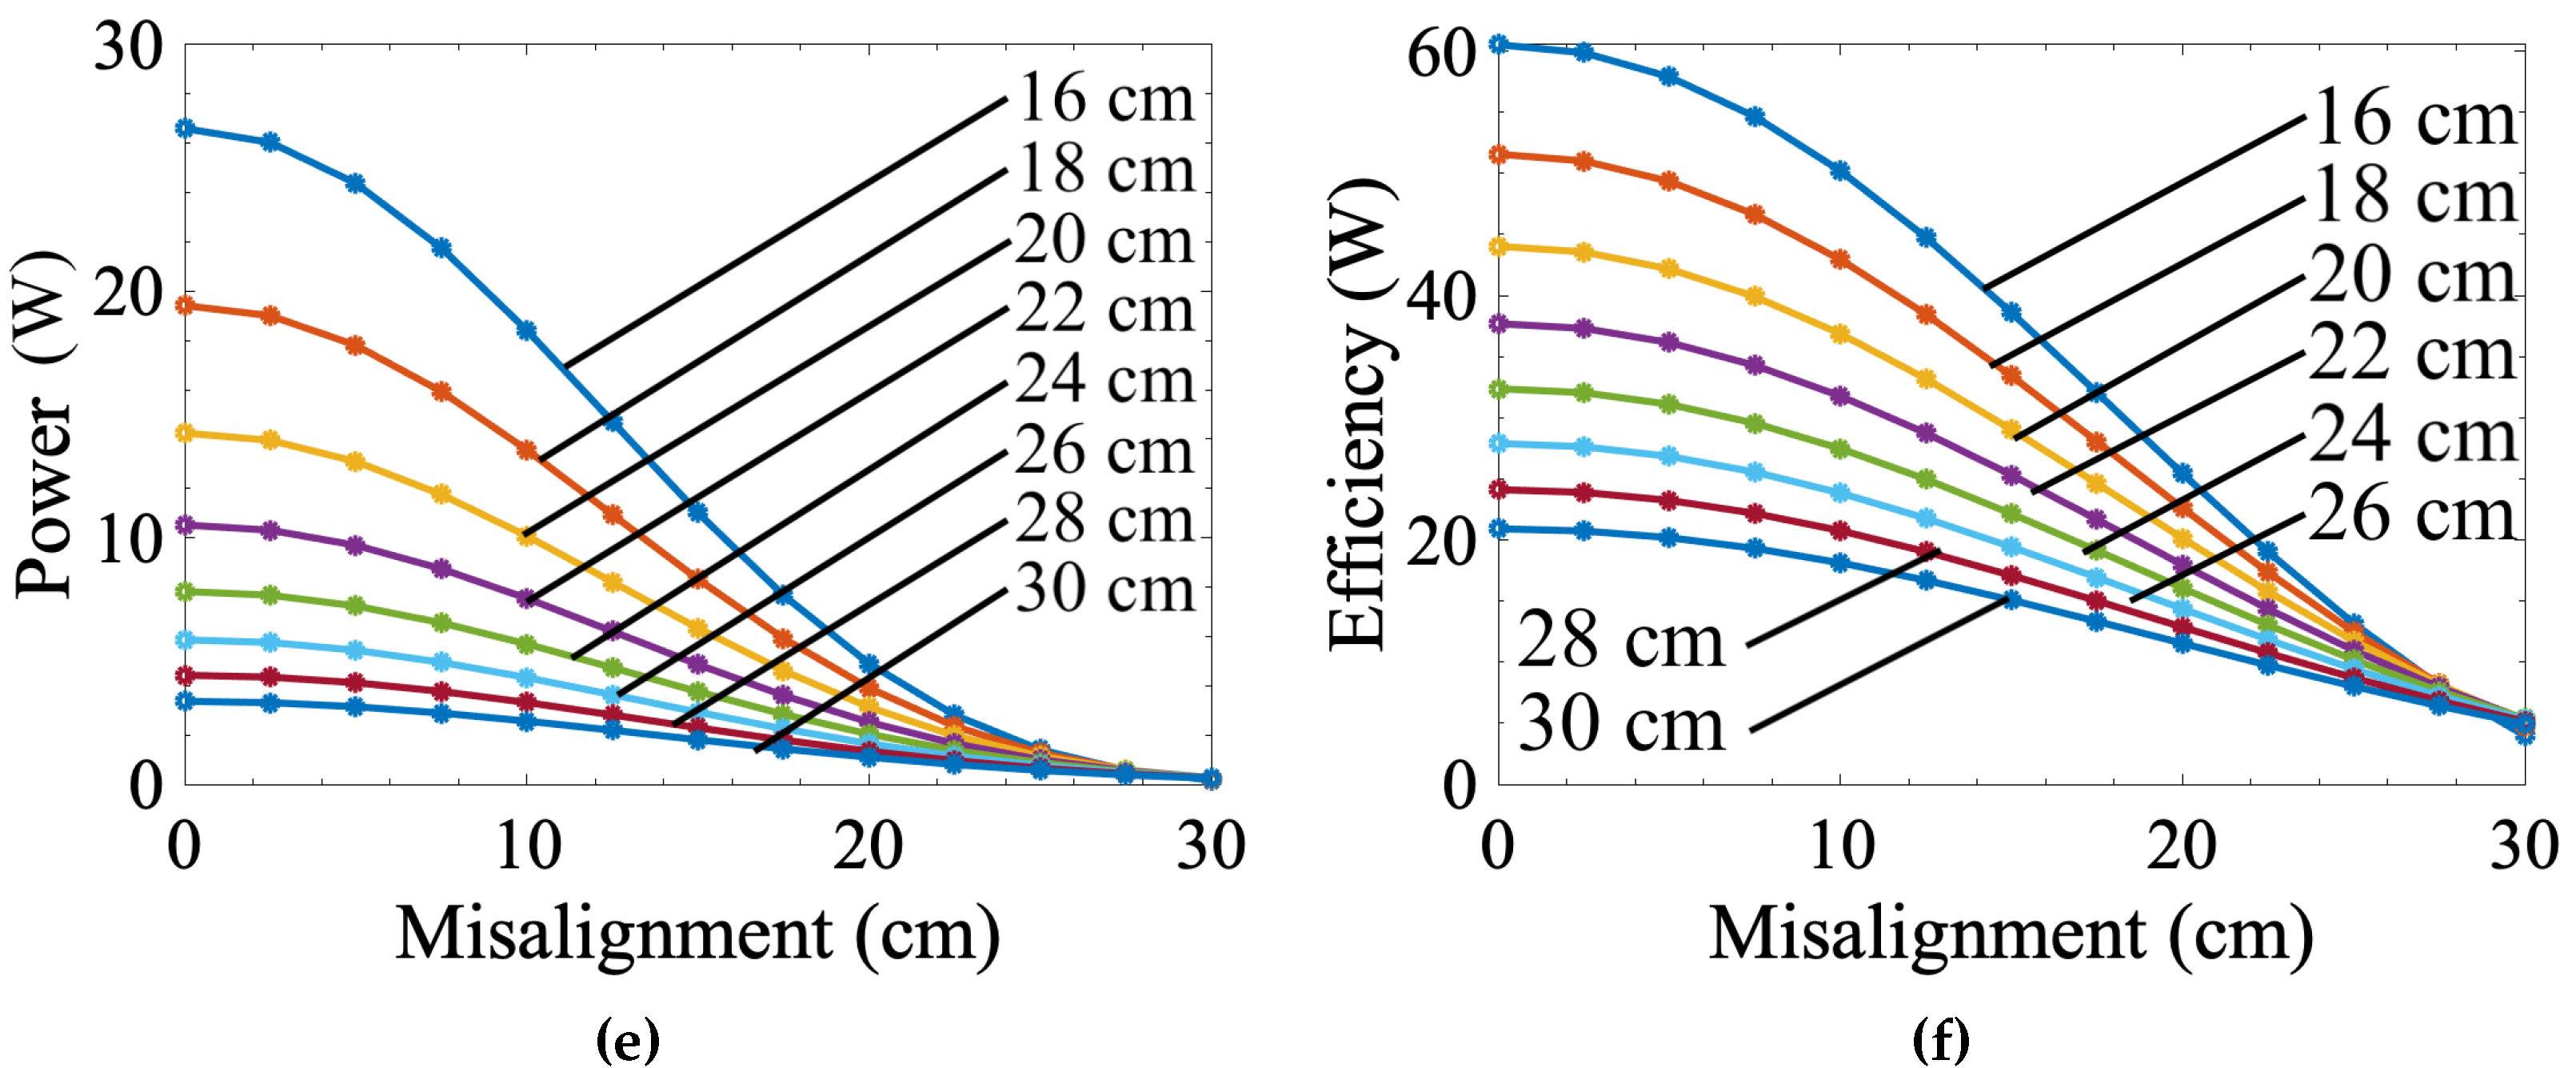
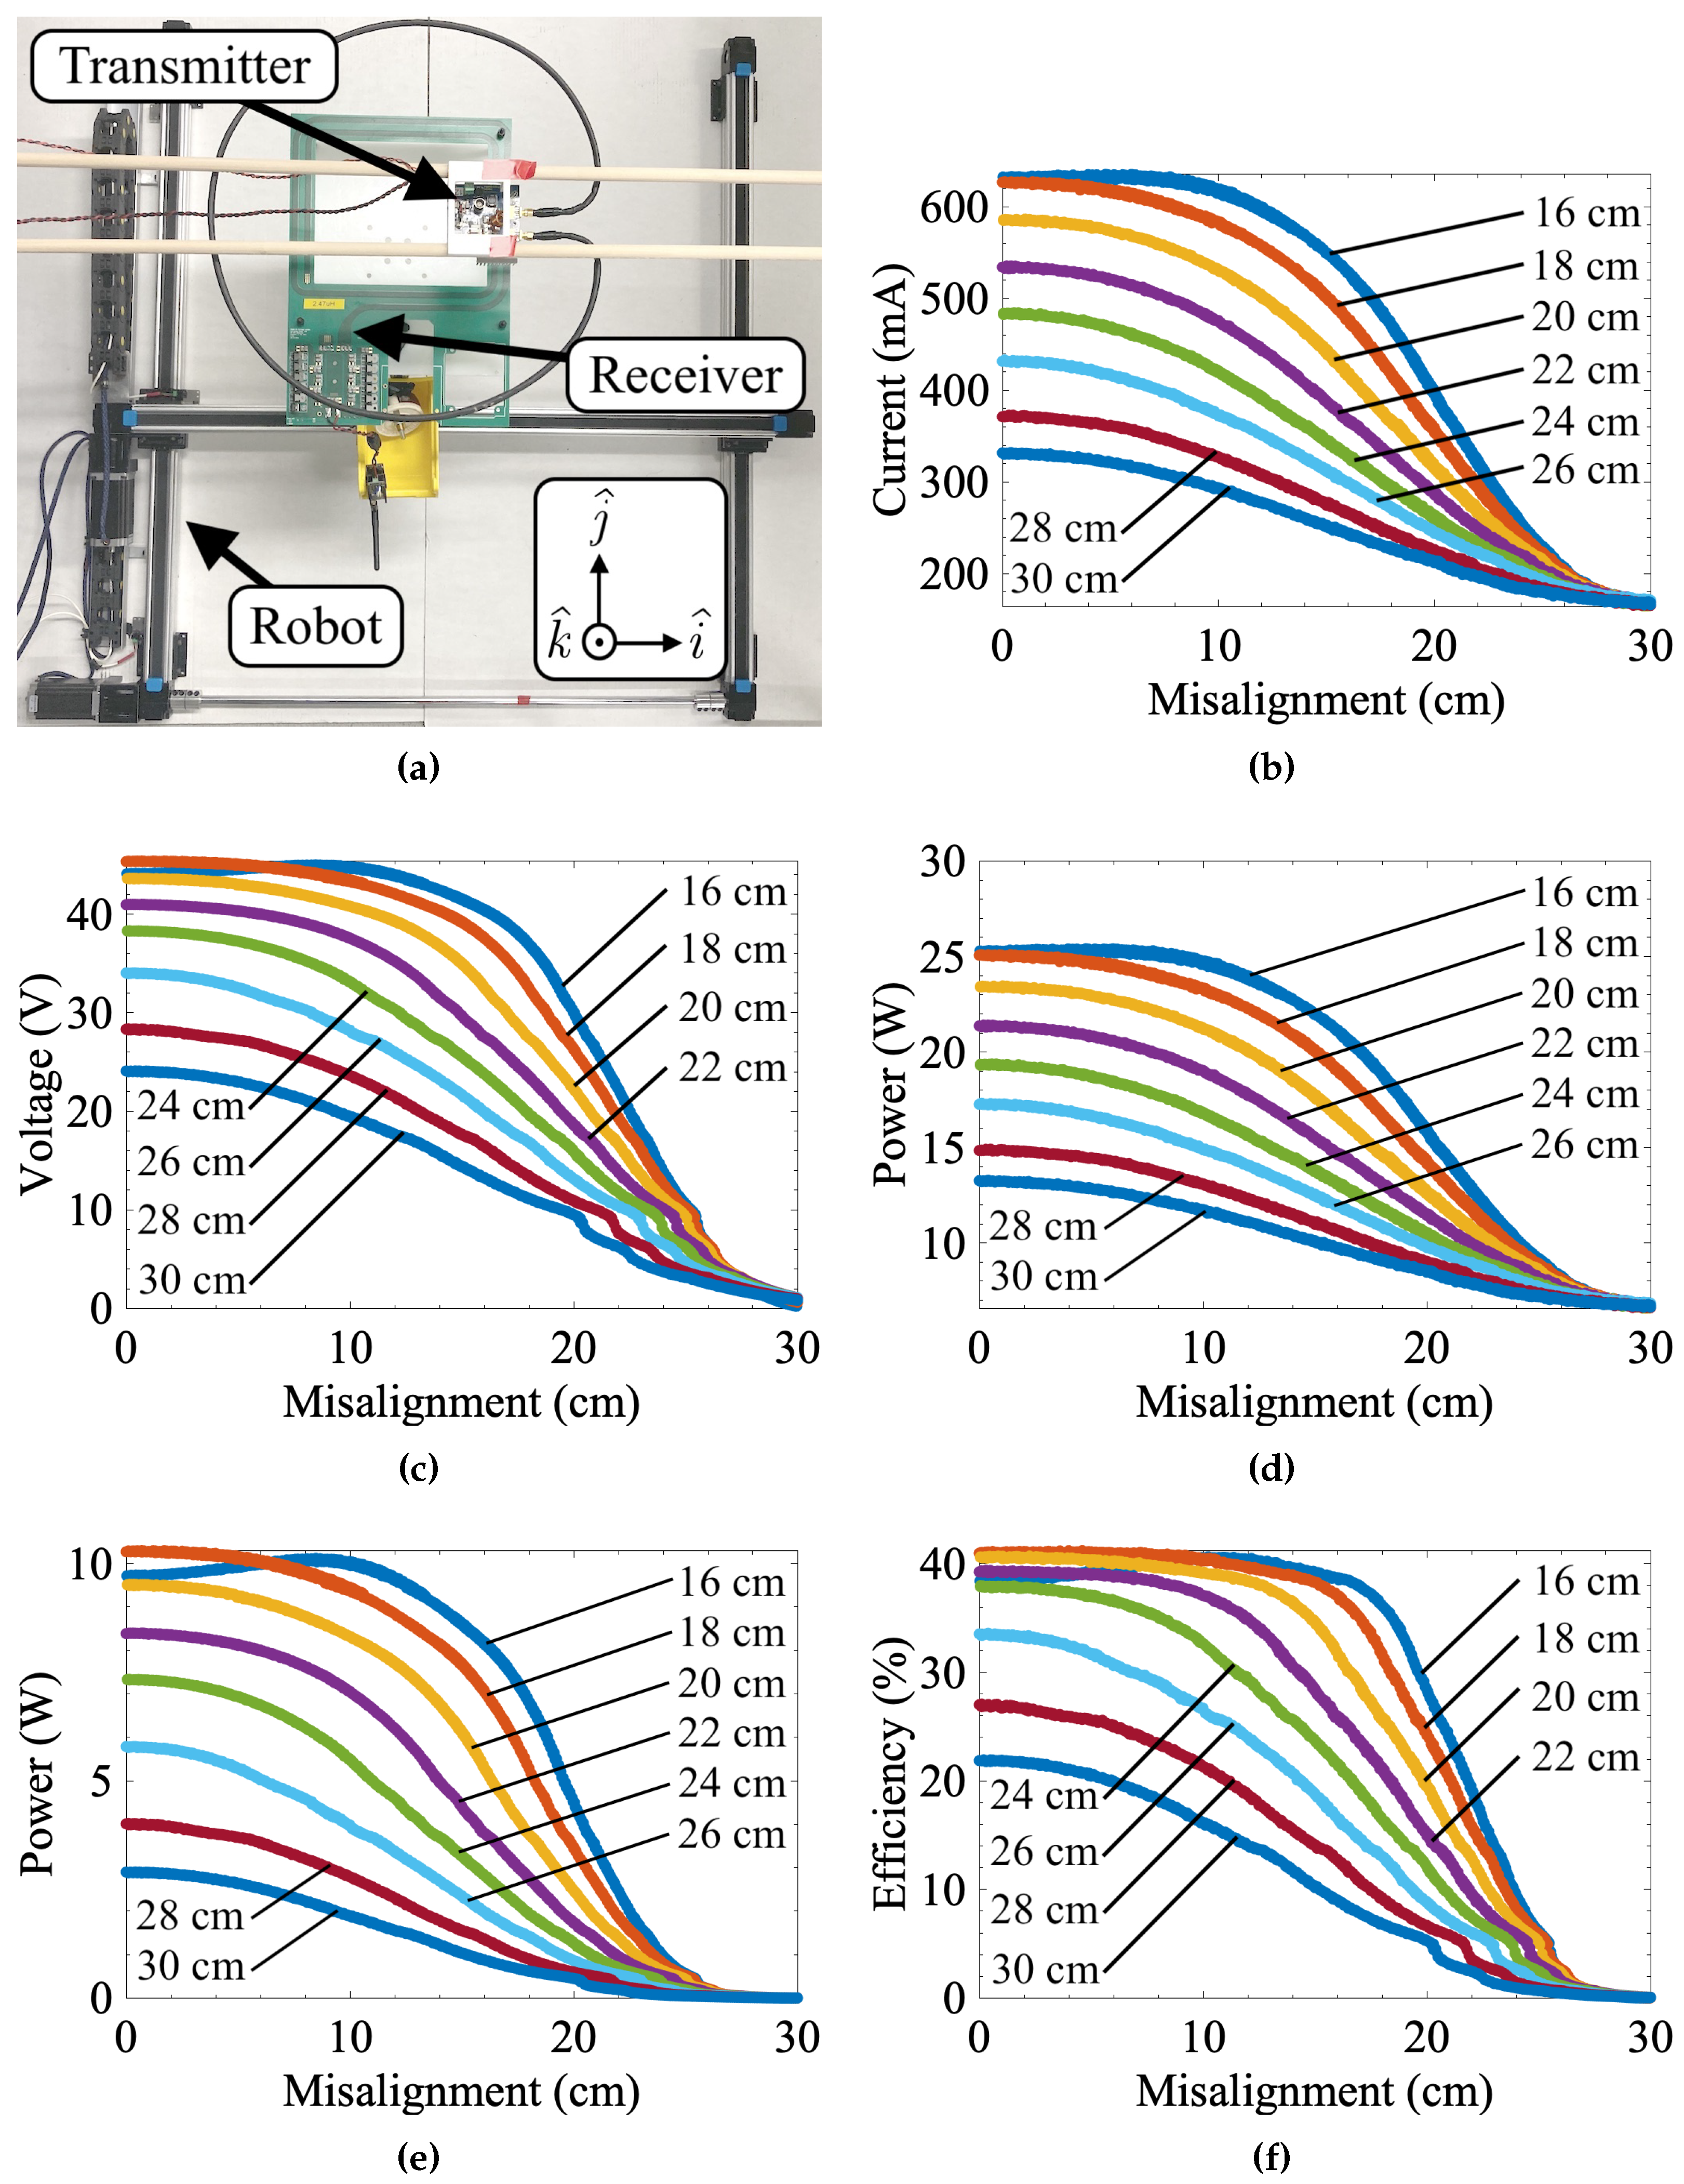
Misalignment characterization tests involved a set of 8 linear sweeps to gather IPT misalignment data for different values of lateral and distal misalignment. These tests were conducted to validate the accuracy of the numerical model and provide a means of generating an empirical model if the numerical approach proved too inaccurate. To facilitate this task, a large (80 by 80 cm workspace), custom-designed Cartesian robot (see Figure 5a) was built to precisely control the alignment of two IPT coils while taking sensor measurements. Parametric sweeps were run on this platform by first mounting the 13.56 MHz IPT system’s receiver on the Cartesian robot. The coupled IPT transmitter was fixed some adjustable distance away from the receiver. Each sweep consisted of exciting the transmitter at a fixed voltage of 40 VDC and moving the receiver to simulate lateral misalignment. While the receiver moved, corresponding changes in input current and rectified voltage were measured. Each 1 mm resolution sweep advanced such that the Cartesian robot moved in a straight line directly over the location of peak alignment between the IPT coils. The location of peak alignment was found using a high-precision grid sweep and interpolation. These linear sweeps gathered data at 16, 18, 20, 22, 24, 26, 28, and 30 cm distal separation between the transmitter and receiver coils. Data were gathered for the linear sweeps by running each sweep multiple times and averaging them together for every value of distal separation. Figure 5b–f shows the results of these sweeps. Overall, reducing misalignment increased the induced voltage estimate, power transmission magnitude, and efficiency. At 16 cm of distal separation, the IPT system acts anomalously where efficiency and received power actually decrease at peak concentric alignment. This effect is not unexpected and is likely due to the previously mentioned effects of nonideal environments, particularly magnetic coupling with the metallic structures of the alignment robot.

3.2. Numerically Modeled vs. Measured Data

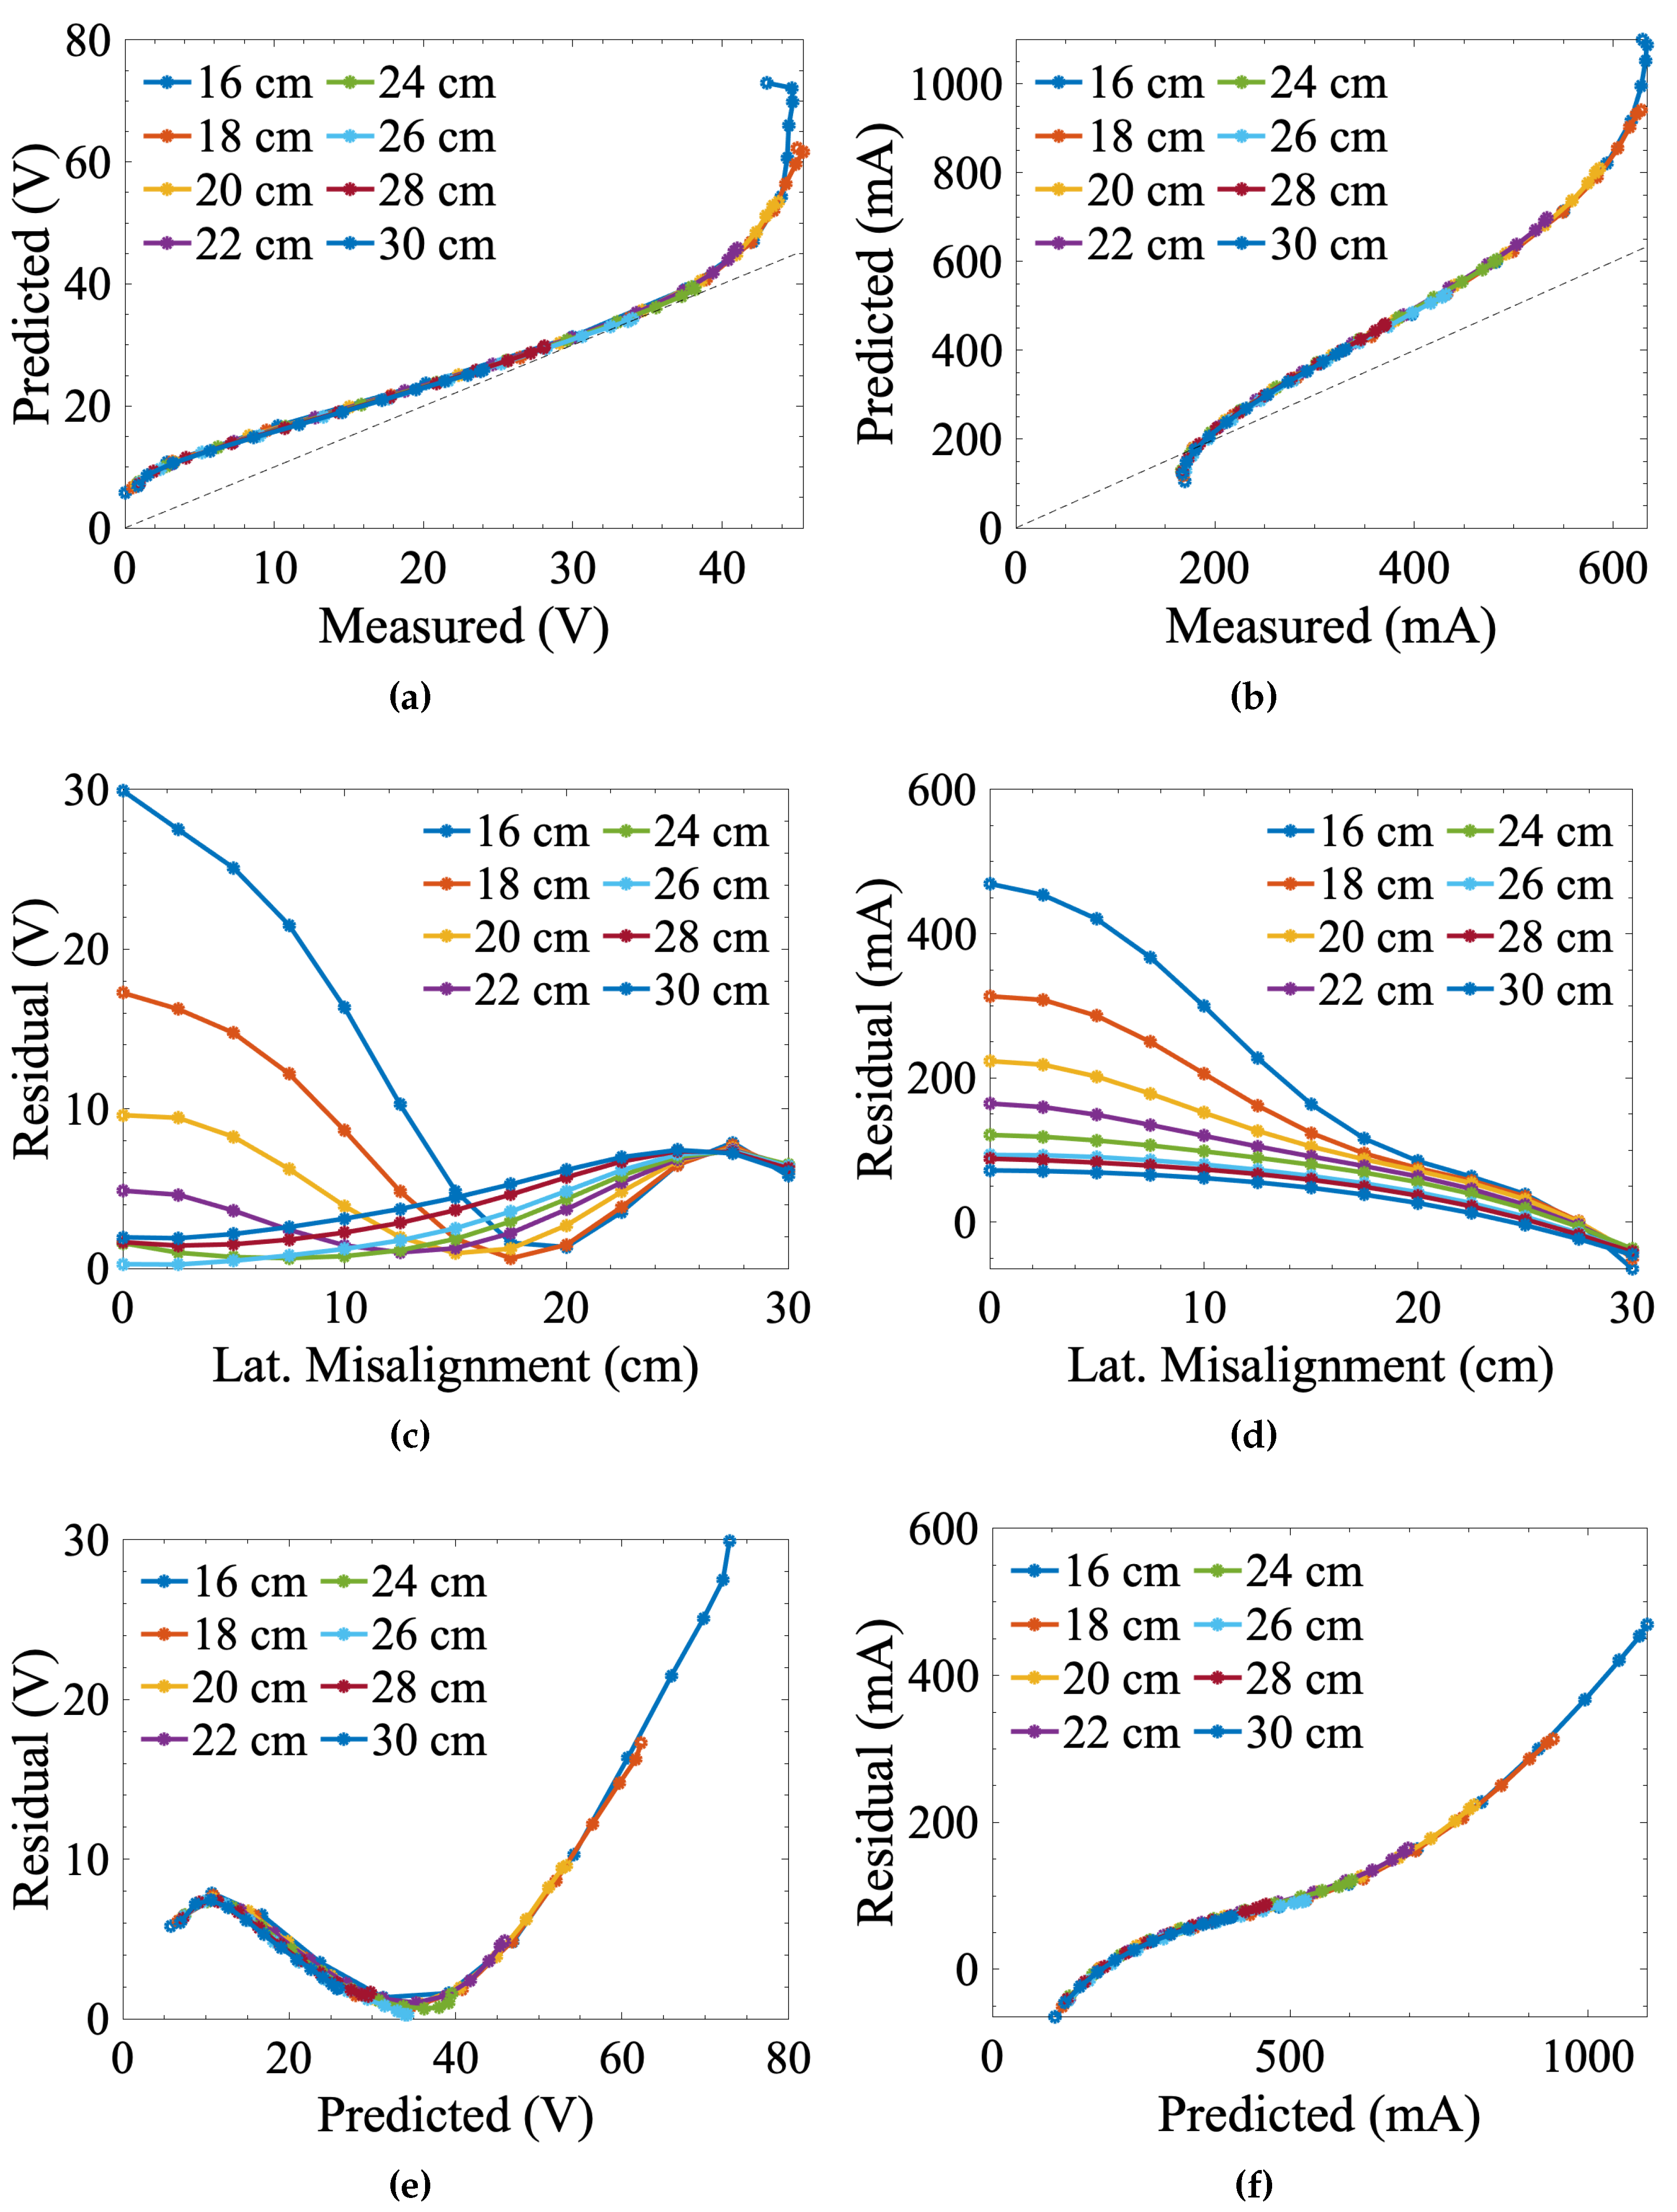
The measured control signal results were compared against data from the numerical model discussed in Section 2 by analyzing residual errors. Ideally, the numerical data should map directly to the measured results, i.e., z p r e d i c t e d z o b s e r v e d = 0 . Figure 6 shows "measured-vs-predicted" plots for each value of distal separation and the corresponding residual plots as functions of the predicted control signals and lateral misalignment. Table 2 shows the root mean square error (RMSE) of the model for different values of distal separation.
For the voltage control signals, errors are relatively high at low values of distal separation (16, 18, and 20 cm) but relatively low at greater coil separations (22, 24, 26, and 30 cm). Overall, the model tends to overpredict the voltage signals, particularly when the IPT coils are extremely close together. The current signals show the same general trends as the voltage signals. These trends are not unexpected and are likely due to magnetic field distortions mentioned earlier in this paper. The greater errors with the current-based control signals are also not unexpected, given that Equation (8) does not consider factors such as switching losses that increase inefficiency. Based on the results in Figure 5, efficiency was observed to change with both distal and lateral misalignment. Interestingly, prediction errors tend to also increase at high values of lateral misalignment, i.e., where control signal magnitude should be the smallest. This effect is most likely observed due to forward power losses in the rectifier diodes. At lower voltages, the diodes used in the receiver’s rectifier will significantly affect the voltage signal due to their forward voltage drops. Regardless of these issues, the numerical model effectively predicts the control signals’ overall general behaviors. Reducing lateral and distal misalignment for both signals improves coupling and results in larger control signal magnitudes. For all but the closest values of distal separation, the predicted control signals only vary by a few volts or 10s of milliamps. Furthermore, the model accurately predicts the IPT system’s maximal tolerance to lateral misalignment ( 30 cm).

3.3. Emperical Modeling

Despite the capabilities of the numerical model, there are several key disadvantages to using this approach in an alignment control system. While the statistical-based alignment approach should be quite tolerant of minor modeling errors, the errors observed from the numerical model are likely too large for effective implementation in the alignment algorithm. For this reason, empirical models of misalignment generated using parametric sweeps may be better suited to the problem of alignment correction in field settings due to their inherent capture of behaviors caused by irregular environmental conditions. Empirical models of the misalignment were created by fitting the linear sweep data to a Fourier fit described by the following equation:
z ( r ) = a 0 + a 1 cos ( ω r + b 1 ) + a 2 cos ( 2 ω r + b 2 )
In the above equation, z r , the transmitter current or receiver voltage, is represented as a function of lateral misalignment r, a fit frequency ω , and constants a and b. Data were fitted to this equation over the range of 0 to 30 cm of lateral misalignment. The resulting equations were coupled with an interpolation algorithm to predict z r , h for values of distal separation h that were never explicitly measured in testing. Based on the RMSE values shown in Table 3, the empirical model demonstrated an average RMSE of only 1.77 mA and 0.255 V for the control signals. This outcome is a significant improvement over the numerical model.

3.4. Benchmarking Alignment Algorithm Performance

Alignment accuracy can be represented in terms of either geometry (overlap of the coils’ centroids) or performance (expected vs. achieved performance). Realistically, geometric accuracy is difficult to measure during testing and may or may not correspond to optimal performance conditions, especially in field settings. Instead, this work uses a performance-based metric by comparing expected (from the linear sweep-based empirical model) and achieved power transfer efficiency. Once computed in terms of efficiency, alignment accuracy in terms of distance can be backtracked using the empirical models formulated in this work. Similarly, speed can be defined in two different ways: iterative (iterations until peak achieved alignment) or literal (time until peak achieved alignment) speed. The iterative metric is a better performance measure because it is invariant of the alignment robot’s speed capabilities.
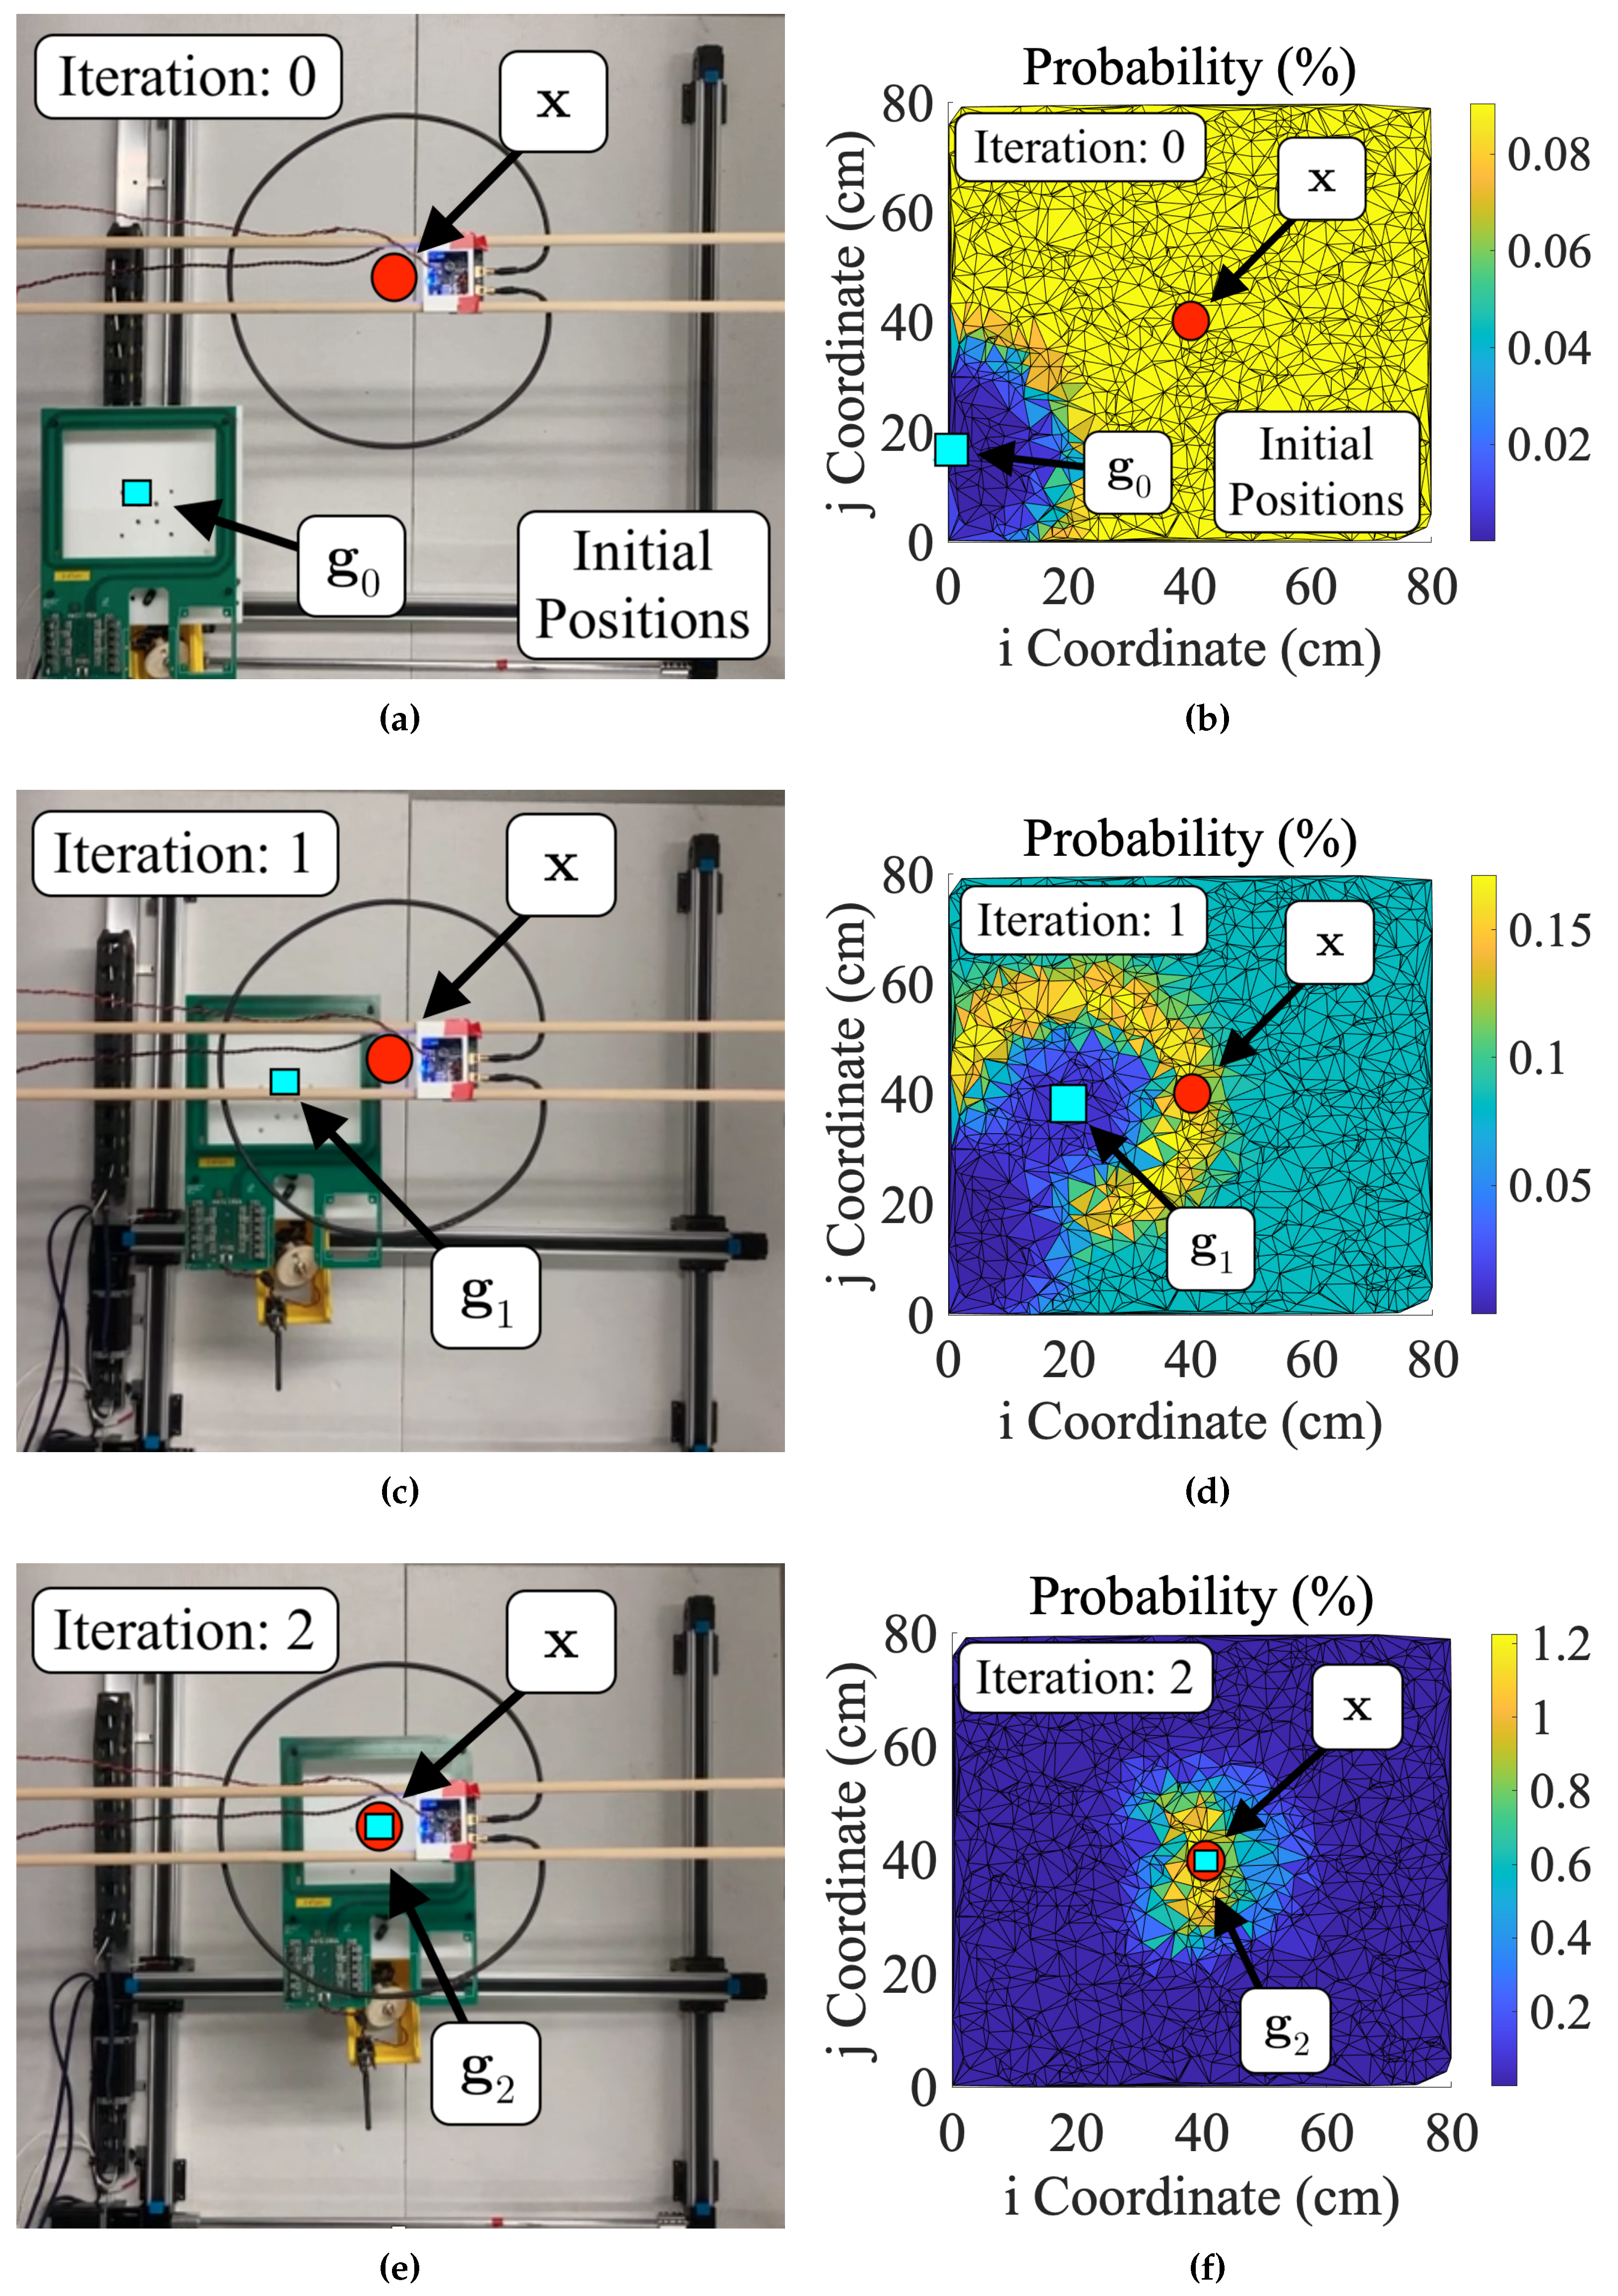
To characterize the performance of the IPT system with particle filter misalignment correction, the test setup shown in Figure 5 was programmed to run the particle filters described in Section 2. The receiver coil position g k was initialized randomly in the Cartesian robot’s 2D workspace for all alignment tests. Distal separation was fixed at 19.75 cm. Due to the randomness of initialization, some IPT tests were initially coupled, and others were uncoupled, i.e., greater than 30 cm lateral coil misalignment. Each particle filter was programmed with a fixed particle count N s of 1875. Once initialized, the Cartesian robot used various particle filters to align the receiver with the fixed, stationary transmitter. Filters computed probabilities (selection of z k variables) using either transmitter current, receiver voltage, or a combination of both and the empirical models of the control signals. The combination approach computes w k i for current and voltage. These independent weights were then multiplied together and normalized. The entire process can be visualized using Figure 7. Although in these tests, the receiver is technically the mobile half of the IPT system, the process is fundamentally identical to using a mobile transmitter so long as the current-based control signal is used for computing probabilities. Table 4 summarizes filter performance from these tests. The values shown in this table represent the achieved power transmission performance at peak achieved alignment. Table 5 compares the results of tests using different control signals (voltage, current, or combined) and particle filter types (SIR, SIS, 2D, and 3D). Each comparison is made using two-sample t-tests.

4. Discussion

4.1. Mobile Transmitter vs. Mobile Receiver Localization Capabilities

Based on the data in Table 5, the SIS particle filters did not differ significantly in achieved transmission efficiency or speed when using current (mobile transmitter perception method) or voltage (mobile receiver perception method) to perceive misalignments. The current-based SIR filter was statistically worse than the voltage-based SIR filter in terms of speed and efficiency. These discrepancies are likely due to how the resampling threshold Z efficiency was selected. In both sets of tests, Z was fixed at a certain percentage of the sensor’s full-scale range (2%). In retrospect, these values map to slightly different lateral misalignments, meaning resampling occurs at other times in the alignment process for the different algorithms. However, despite any differences, the effect size is not large (less than 1% efficiency and 1 iteration), meaning any statistically derived differences are negligible in practice. Consequently, the particle filters should work using either a mobile transmitter or receiver, i.e., transmitter current or induced voltage as z k , without any notable change in performance.
The combined method of computing P ( x k | z k ) was less efficient than the current or voltage-based filters. This result is almost certainly a consequence of accelerated sample degeneracy. The current and voltage measurements are related to the same metric of induced voltage. When combining their probabilities, certainty increases without novel information, causing degeneracy. Still, despite differences in performance, the effect size is still not large, and any decrease in performance is not practically meaningful. This outcome demonstrates that fused sensor data is not necessarily better than the independent misalignment estimates for this particle filter formulation.

4.2. Performance Metrics: Accuracy and Speed

For a distal separation of 19.75 cm, the parametric model predicts a maximum achievable efficiency of 40.8%. Averaging the outcomes of all six filter types (see Table 4, excluding data from the combined probability approach) results in a nominally worse efficiency value of 40.7%. This slight reduction in efficiency corresponds to just under 1 cm misalignment, i.e., 0.025 coil diameters, at 19.75 cm of distal separation. Interestingly, the best-performing particle filters achieved power transmission efficiencies slightly greater than the model prediction, likely due to minor model inaccuracies.
Using the iterative metric and the same six filter types, on average, the filters took 3.45 iterations to localize the hidden coil when initially coupled and 3.92 iterations regardless of coupling. Literal alignment speed was, on average, 11.7 s regardless of coupling. Given an average initial misalignment of 31.5 cm, an effective speed v can defined as:
v = | g Final g Start | Time Final Time Start
and was benchmarked at 2.69 cm/s. Unlike iterative speed, literal speed is a function of the alignment robot and can be altered significantly with software modifications of the robot (programmed maximum speed of 3.00 cm/s during testing).

4.3. Field Testing

After laboratory testing, the hardware used in this work was integrated into an agricultural soil sensing platform to demonstrate the effectiveness of this misalignment perception and correction routine in real-world applications. The building blocks of this platform have been previously discussed in [22]. Fundamentally, this platform consists of a buried IPT receiver attached to multiple soil sensors. An aboveground power transmission system recharges the underground hardware and collects sensor data. Prior works faced two related issues during testing that remained largely unresolved: complete vehicle integration and misalignment correction [22].
For these field tests, the IPT system and misalignment correction hardware were mounted on an agricultural vehicle used in surface irrigation, i.e., a wheel line mover (see Figure 8a). The wheel line irrigation system in these tests provides water to an alfalfa field at the Utah Agricultural Experiment Station in Kaysville, Utah. The accompanying receiver was buried under 10 cm of soil for these initial tests, though greater depths are likely possible. Once the receiver was underground, a series of sweeps similar to those in Section 2 were conducted to generate a parametric model of misalignment regarding transmitter current, receiver voltage, and lateral/distal misalignment (see Figure 8b,c for the response data).
After a series of ten SIS filter tests, the automated alignment algorithm converged after 4.00 iterations on average, which is slightly slower than the results reported during laboratory testing. While convergence speed is slower, the difference between 3.92 iterations and 4.00 is negligible in this application. Furthermore, even moving the Cartesian robot to a single additional position does not take significant time or other resources, i.e., power or fuel. On average, the IPT system and correction hardware could transmit 7.52 W of power at 32.0% efficiency at peak concentric alignment and 19.75 cm of distal separation. At this rate, 2.4 minutes of recharging (1083 J) could theoretically power existing [23] soil monitoring technology for over a year (dormant, no measurements) or empower that same technology to take 13000 measurements. Interestingly, the efficiency values achieved during field testing are actually 1.5% higher than expected from the empirical models, likely due to varying environmental conditions throughout the day. As such, the error using the metric defined in this work was fundamentally 0 cm. This outcome demonstrates that the alignment algorithm can be implemented in field settings without a meaningful change in performance.

5. Conclusions

This paper presents a novel method of sensing and correcting coil misalignment for a Class EF-driven inductive power transfer system. The alignment methodology corrects, rather than compensating for, misalignment and eliminates the need for complex multi-coil measurement systems. The results from Section 3 demonstrate that the alignment approach developed in this work is equally capable of aligning using either half (transmitter or receiver) of the IPT system independently and without data telemetry. Based on these results, this alignment methodology could theoretically be used with a mobile transmitter or receiver with equal effectiveness. Field testing in this work successfully demonstrated the applicability of this perception and correction methodology in real-world applications. Although only tested on a Class EF-driven IPT system, the underlying sensing approach should theoretically work for any IPT system that excites the transmission coil with a constant RMS current. Overall, this work contributes to robot or vehicle-driven wireless power transfer by providing a robust approach to aligning the coils of inaccessible or hidden inductive power transfer systems.

Author Contributions

Conceptualization, J.S.; methodology, J.S.; validation, J.S.; writing—original draft preparation, J.S.; writing—review and editing, J.S., J.M., C.Z., P.M., D.Y., S.R.; supervision, S.R.; Field test coordination C.Z.; Hardware design and construction J.S, J.M.; All authors have read and agreed to the published version of the manuscript.

Funding

This work was funded by the National Science Foundation (NSF), award no. 1935632 and UK Research and Innovation (UKRI), reference numbers: NE/T011467/1 and NE/T011068/1.

Institutional Review Board Statement

Not applicable.

Informed Consent Statement

Not applicable.

Data Availability Statement

The dataset used during this study can be obtained by contacting the corresponding authors and agreeing to terms and conditions.

Conflicts of Interest

The authors declare no conflicts of interest.

Abbreviations

The following abbreviations are used in this manuscript:
IPT Inductive power transfer
SIS Sequential importance sampling
SIR Sequential Importance resampling
WPT Wireless power transfer
SLAM Simultaneous localization and mapping

References

  1. Zhang, Z.; Pang, H.; Georgiadis, A.; Cecati, C. Wireless Power Transfer—An Overview. IEEE Transactions on Industrial Electronics 2019, 66, 1044–1058. [Google Scholar] [CrossRef]
  2. Moore, J.; Castellanos, S.; Xu, S.; Wood, B.; Tse, Z. Applications of Wireless Power Transfer in Medicine: State-of-the-Art Reviews. Annals of Biomedical Engineering 2018, 47. [Google Scholar] [CrossRef] [PubMed]
  3. Arteaga, J.; Mitcheson, P.; Yeatman, E. Development of a Fast-Charging Platform for Buried Sensors Using High Frequency IPT for Agricultural Applications. In Proceedings of the 2022 IEEE Applied Power Electronics Conference and Exposition (APEC). IEEE, 2022.
  4. Vi, V.; Ramezani, A.; Triviño, A.; González, J.; Kadandani, N.; Dahidah, M.; Pickert, V.; Narimani, M.; Aguado, J. Operation of Inductive Charging Systems Under Misalignment Conditions: A Review for Electric Vehicles. IEEE Trans. on Power Electron. 2023, 9. [Google Scholar]
  5. Sample, A.P.; Meyer, D.T.; Smith, J.R. Analysis, Experimental Results, and Range Adaptation of Magnetically Coupled Resonators for Wireless Power Transfer. IEEE Transactions on Industrial Electronics 2011, 58, 544–554. [Google Scholar] [CrossRef]
  6. Bosshard, R.; Badstübner, U.; Kolar, J.W.; Stevanović, I. Comparative evaluation of control methods for Inductive Power Transfer. In Proceedings of the 2012 International Conference on Renewable Energy Research and Applications (ICRERA); 2012; pp. 1–6. [Google Scholar]
  7. Hu, H.; Cai, T.; Duan, S.; Zhang, X.; Niu, J.; Feng, H. An Optimal Variable Frequency Phase Shift Control Strategy for ZVS Operation Within Wide Power Range in IPT Systems. IEEE Transactions on Power Electronics 2020, 35, 5517–5530. [Google Scholar] [CrossRef]
  8. Gao, Y.; Duan, C.; Oliveira, A.A.; Ginart, A.; Farley, K.B.; Tse, Z.T.H. 3-D Coil Positioning Based on Magnetic Sensing for Wireless EV Charging. IEEE Transactions on Transportation Electrification 2017, 3, 578–588. [Google Scholar] [CrossRef]
  9. Zhang, B.; Chen, Q.; Ke, G.; Xu, L.; Ren, X.; Zhang, Z. Coil Positioning Based on DC Pre-excitation and Magnetic Sensing for Wireless Electric Vehicle Charging. IEEE Transactions on Industrial Electronics 2021, 68, 3820–3830. [Google Scholar] [CrossRef]
  10. Mittleider, A.; Griffin, B.; Detweiler, C. Experimental Analysis of a UAV-Based Wireless Power Transfer Localization System. In Springer Tracts in Advanced Robotics; Springer, 2016; Vol. 109, pp. 357–371. [Google Scholar]
  11. Aldhaher, S.; Yates, D.C.; Mitcheson, P.D. Load-Independent Class E/EF Inverters and Rectifiers for MHz-Switching Applications. IEEE Trans. on Power Electron. 2018. [Google Scholar] [CrossRef]
  12. Sanchez, J.; M. Arteaga, J.; Pucci, N.; Mitcheson, P.; Yeatman, E.; Young, D.; Roundy, S. Misalignment parameterization of a 13.56 mhz inductive power transfer system for in-situ soil sensing. In Proceedings of the PowerMEMS Conference Proceedings, 2022.
  13. Lan, L.; Polonelli, T.; Qin, Y.; Pucci, N.; Kwan, C.H.; Arteaga, J.M.; Boyle, D.; Yates, D.C.; Yeatman, E.M.; Mitcheson, P.D. An Induction-Based Localisation Technique for Wirelessly Charged Drones. In Proceedings of the 2020 IEEE PELS Workshop on Emerging Technologies: Wireless Power Transfer (WoW); 2020; pp. 275–277. [Google Scholar]
  14. Arteaga, J.; Pucci, N.; Lan, L.; Mitcheson, P. Load Characterization in High-Frequency IPT Systems Using Class EF Switching Waveforms. IEEE Transactions on Power Electronics 2021, 36, 11036–11044. [Google Scholar] [CrossRef]
  15. Pinuela, M.; Yates, D.C.; Lucyszyn, S.; Mitcheson, P.D. Maximizing DC-to-Load Efficiency for Inductive Power Transfer. IEEE Transactions on Power Electronics 2013, 28, 2437–2447. [Google Scholar] [CrossRef]
  16. Svečko, J.; Malajner, M.; Gleich, D. Distance estimation using RSSI and particle filter. ISA Transactions 2015, 55, 275–285. [Google Scholar] [CrossRef] [PubMed]
  17. Zhu, M.; Xu, W.; Guo, N.; Wei, Z. Joint Sensor Localization and Data Collection in UAV-Assisted Wireless Sensor Network. In Proceedings of the 2022 14th International Conference on Wireless Communications and Signal Processing (WCSP); 2022; pp. 894–899. [Google Scholar]
  18. Arulampalam, M.; Maskell, S.; Gordon, N.; Clapp, T. A tutorial on particle filters for online nonlinear/non-Gaussian Bayesian tracking. IEEE Transactions on Signal Processing 2002, 50, 174–188. [Google Scholar] [CrossRef]
  19. Li, T.; Bolic, M.; Djuric, P.M. Resampling methods for particle filtering: classification, implementation, and strategies. IEEE Signal processing magazine 2015, 32, 70–86. [Google Scholar] [CrossRef]
  20. Montemerlo, M.; Thrun, S.; Koller, D.; Wegbreit, B.; et al. FastSLAM: A factored solution to the simultaneous localization and mapping problem. Aaai/iaai 2002, 593598. [Google Scholar]
  21. Montemerlo, M.; Thrun, S.; Koller, D.; Wegbreit, B.; et al. FastSLAM 2.0: An improved particle filtering algorithm for simultaneous localization and mapping that provably converges. In Proceedings of the IJCAI; 2003; Vol. 3, pp. 1151–1156. [Google Scholar]
  22. Sanchez, J.; Arteaga, J.; Zesiger, C.; Young, D.; Goel, R.; Mitcheson, P.; Yeatman, E.; Roundy, S. Integration of a high frequency inductive power transfer system to energize agricultural sensors through soil. In Proceedings of the IEEE Wireless Power Week (WPW) Proceedings; 2022. [Google Scholar]
  23. Acclima. Acclima TDR Sensor User Manual For Sensor Models: TDR305H TDR310H TDR315H. Acclima, 2022. Available at https://acclima.com/digital-true-tdr-310h-sensor-sdi-12-data-sheet.
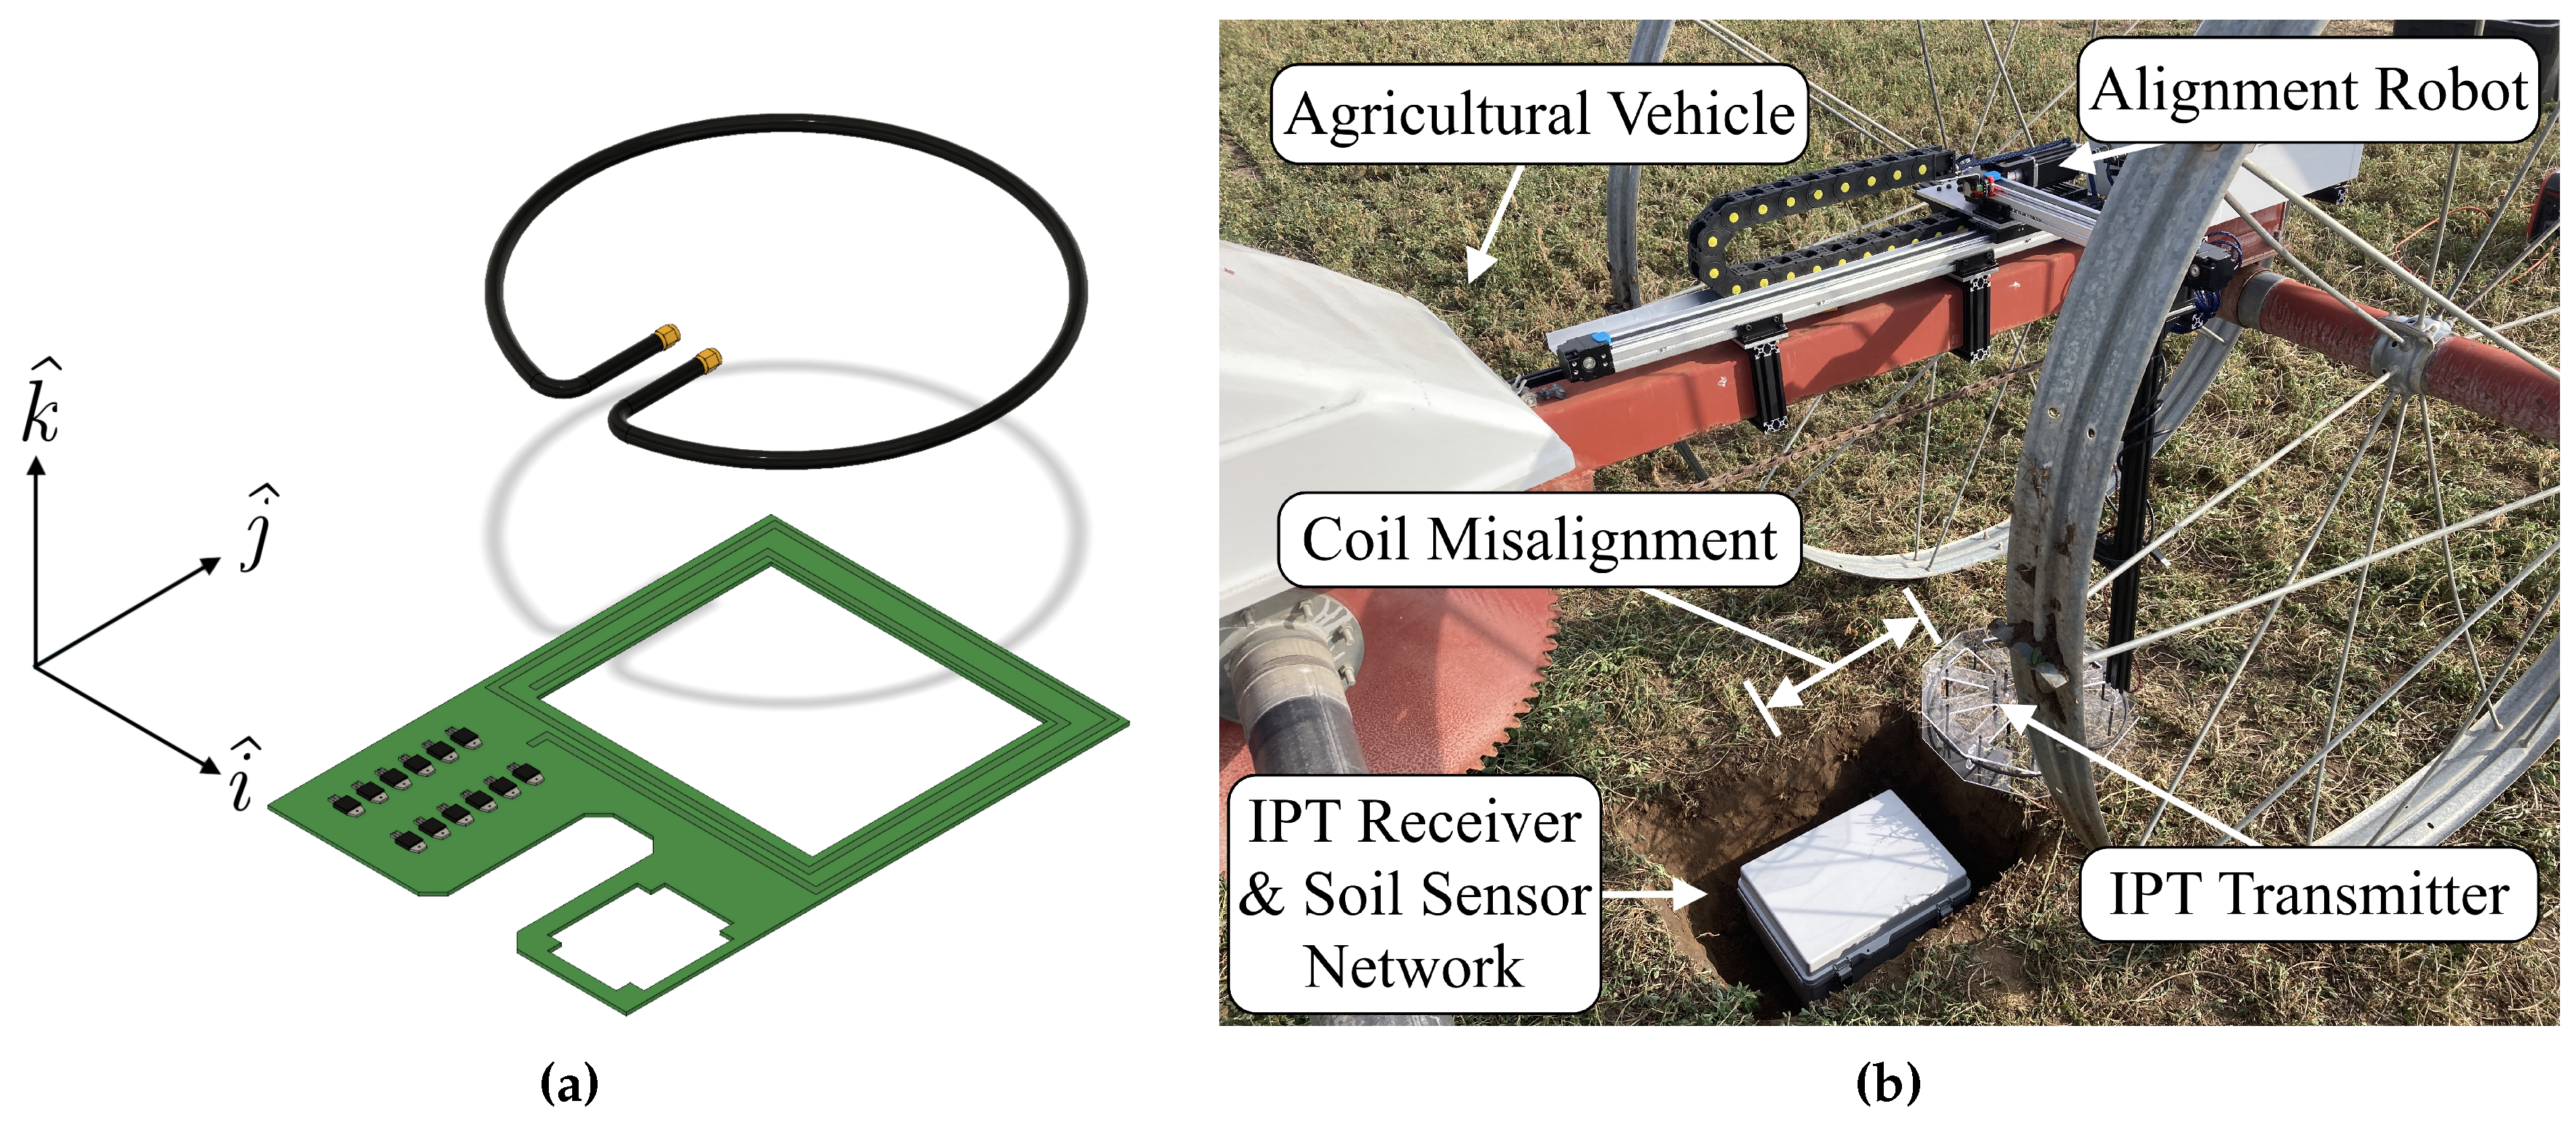
Figure 1. Inductive power transfer coil misalignment: (a) misalignment between IPT coils and (b) misalignment in field implementations of IPT. Lateral misalignment in the i ^ and j ^ directions. Distal separation/misalignment of the coils occurs in the k ^ direction.
Preprints 112092 g001
Figure 2. Inductive power transfer hardware: (a) receiver, (b) transmitter, and (c) simplified circuit of a Class EF-driven inductive power transfer system. (a) and (b) are reproduced courtesy of [12] ©[2022] IEEE.
Preprints 112092 g002
Figure 3. Simulated misalignment response data for 16 to 30 cm of distal separation and 0 to 30 cm of lateral misalignment. (a) Normalized vector plot of B ( r ) showing the location of the transmitter and receiver coils. (b) Transmitter current I i n , (c) receiver voltage V R o u t , (d) transmitted power V i n · I i n , (e) received power P o u t , and (f) efficiency η as functions of lateral (axis values) and distal (labeled values) misalignment.
Preprints 112092 g003aPreprints 112092 g003b
Figure 4. Particle filter tests. (a) Test setup with lateral misalignment in the i ^ and j ^ directions and distal misalignment in the k ^ direction. (b) 1st, (c) 2nd, (d) 3rd, (e) 4th, and (f) 5th iterations of the alignment algorithm. Iterations 1 and 2 are uncoupled. Resampling occurs after the 4th iteration. The gantry’s current position ( g k ), the best prediction of the hidden coil’s position ( g k + 1 ), and the actual position of the hidden coil ( x k ) are marked with cyan (square), black (triangle), and red (square) markers, respectively. The image in (a) corresponds to the 3rd iteration of the particle filter.
Preprints 112092 g004
Figure 5. Measured misalignment response data. (a) Test setup with lateral ( i ^ and j ^ ) and distal ( k ^ ) misalignment. (b) Transmitter current, (c) receiver voltage, (d) transmitted power, (e) received power, and (f) transmission efficiency as functions of lateral (axis values) and distal (labeled values) misalignment.
Preprints 112092 g005
Figure 6. Error analysis of the theoretical model: (a) receiver voltage and (b) transmitter current measured-vs-predicted plots for different values of distal separation. Note the gray line in these figures represents the line y = x + 0 , i.e., the expected trendline for perfect correlation between measured and expected values. Subfigures (c), (d), (e), and (f) show the residual errors of z p r e d i c t e d z o b s e r v e d for both control signals as functions of lateral misalignment and predicted output signals.
Preprints 112092 g006
Figure 7. Sample data and images from a coil alignment test. Subfigures (a) and (b) show the test setup and probability map for an initially uncoupled test. Collectively, these figures represent iteration "zero" of the particle filter as the robot has not actually moved but has updated probabilities once. Subfigures (c) and (d) show data from iteration "one" of the test cycle. Similarly, subfigures (e) and (f) show data from iteration "two" of the test cycle, i.e., the final iteration. While initially uncoupled tests usually take more than 3 measurements to converge, this particular test cycle was simply lucky in its predictions of g k + 1 .
Preprints 112092 g007
Figure 8. Summary of field testing: (a) test setup, (b) transmitter current, and (c) receiver voltage as functions of lateral (axis values) and distal (labeled values) misalignment. Note that the values of distal misalignment denote the distance between the transmitter and the top layer of soil. For the coil-to-coil distance, add an additional 13 cm (10 cm soil and 3 cm air inside the receiver).
Preprints 112092 g008
Table 1. Operating parameters for the 13.56 MHz, Class EF-driven IPT system.
Parameter Symbol Value
Turns in Receiver Coil N 2
Transmission Frequency ω , f 85.2 Mrad/s, 13.56 MHz
Current in Primary Coil i p , r m s 6.25 A
Primary Coil Self-Inductance L p 1181 nF
Secondary Coil Self-Inductance L s 2470 nF
DC Input Voltage V i n 40 V
Output Load R o u t 200 Ω
Quality Factor Q p , Q s 767
Table 2. Root mean square error (RMSE) of the numerical model’s signals benchmarked against measured signals.
Distal Separation (cm) RMSE Voltage Signal (V) RMSE Current Signal (mA)
16 15.9 268
18 9.55 185
20 6.09 135
22 4.48 104
24 4.08 82.2
26 4.22 65.6
28 4.66 60.5
30 4.96 50.6
Table 3. Root mean square error (RMSE) of the empirical model’s signals benchmarked against measured signals.
Distal Separation (cm) RMSE Voltage Signal (V) RMSE Current Signal (mA)
16 0.397 3.19
18 0.256 2.64
20 0.245 2.25
22 0.224 1.35
24 0.224 1.63
26 0.216 0.938
28 0.235 1.17
30 0.240 0.986
Table 4. Alignment algorithm performance metrics in terms of alignment error, efficiency η , and iterative speed. This table includes the frequency of initially uncoupled (IU) and coupled (IC) tests. Results are shown for current (I), voltage (V), and combined (C) methods of calculating probabilities. Note the expected efficiency at peak concentric alignment and 19.75 cm distal separation is 40.8%, meaning some tests exceeded the expected accuracy, likely due to minor modeling errors. Such tests are specially marked (*). Also, note that speed values are only reported for initially coupled tests due to the randomness in initially uncoupled tests.
Filter IU, IC Avg. Error Avg. η Std. η Avg. Speed Std. Speed
2D SIS, I 59, 41 3.8 cm 40.3% 0.974% 3.10 1.05
2D SIS, V 56, 44 2.4 cm 40.5% 0.819% 2.86 1.10
2D SIS, C 57, 43 8.3 cm 39.9% 0.952% 2.79 1.67
2D SIR, I 26, 24 3.1 cm 40.4% 1.04% 4.00 1.47
*2D SIR, V 34, 16 0.0 cm 41.2% 0.966% 3.13 1.15
*3D SIS, I 20, 30 0.0 cm 41.0% 1.16% 3.80 1.65
*3D SIS, V 35, 15 0.0 cm 41.0% 1.06% 3.80 2.48
Table 5. Statistical evaluation of current (I) vs. voltage (V) vs. combined (C) methods of misalignment perception. Mean differences (difference), degrees of freedom (df), and p-values are shown for each t-test.
Compare Filter Metric Difference df p-value
I vs. V 2D SIS η -0.186% 192 .146
Speed 0.234 60 .500
2D SIR η -0.846% 98 <.001
Speed 0.875 37 .0422
3D SIS η 0.0651% 97 .771
Speed 0.00 20 1.00
I vs. C 2D SIS η 0.443% 198 .00132
Speed 0.307 79 .443
V vs. C 2D SIS η 0.629% 194 <.001
Speed 0.0729 70 .808
Disclaimer/Publisher’s Note: The statements, opinions and data contained in all publications are solely those of the individual author(s) and contributor(s) and not of MDPI and/or the editor(s). MDPI and/or the editor(s) disclaim responsibility for any injury to people or property resulting from any ideas, methods, instructions or products referred to in the content.
Copyright: This open access article is published under a Creative Commons CC BY 4.0 license, which permit the free download, distribution, and reuse, provided that the author and preprint are cited in any reuse.
Prerpints.org logo

Preprints.org is a free preprint server supported by MDPI in Basel, Switzerland.

Subscribe

© 2024 MDPI (Basel, Switzerland) unless otherwise stated