Preprint
Article

Genome-Wide Identification of AGO, DCL, and RDR Genes and Their Expression Analysis in Response to Drought Stress in Peach

Altmetrics

Downloads

181

Views

159

Comments

0

Submitted:

15 July 2024

Posted:

16 July 2024

You are already at the latest version

Alerts
Abstract
To address the response of small RNAs (sRNAs) biogenesis to drought stress, we identified sRNAs biogenesis genes, including 11 encoding argonauts (AGO), 8 encoding dicer-like proteins (DCL), and 9 encoding RNA-dependent RNA polymerases (RDR) in the peach genome. Notably, the largest numbers of sRNAs biogenesis genes are located to chromosome 1. The PAZ, PIWI, and MID domains were identified in PpAGOs, while the ribonuclease IIIa and IIIb domains were characterized in PpDCLs. The RDRP domain was recognized in PpRDRs. Orthologous similarity and collinearity analyses between Arabidopsis and peach revealed 5, 1, and 2 collinear blocks in AGOs, DCLs, and RDRs, respectively. Moreover, 41, 40, and 42 cis-acting elements were located in the promoters of PpAGOs, PpDCLs, and PpRDRs, respectively, with the majority related to drought stress response. Analysis of RNA sequencing (RNA-seq) data revealed that sRNAs biogenesis genes were involved in drought stress response in different tissues. Furthermore, the expression of candidate genes was verified in two peach cultivars, Beijing 2-7 (BJ2-7) and Sinai (SN), which are drought tolerance and sensitive, respectively. Interestingly, the expression of PpAGO2b, PpDCL2b, PpDCL4, and PpRDR4 genes was induced in ‘BJ2-7’ but inhibited in ‘SN’ under drought stress. Overall, this study provides insight into the roles of sRNA biogenesis genes in response to drought stress in peach.
Keywords: 
Subject: Biology and Life Sciences  -   Biology and Biotechnology

1. Introduction

Peach (Prunus persica L.) is the most economically important fruit crop in the Rosaceae family, cultivated worldwide [1,2]. Recently, peach has become an emerging model species for fruit crop genomics studies due to its short life cycle and small genome size [3,4]. However, the growth, development, and productivity of peaches are adversely affected by environmental factors, including drought stress [5,6]. During drought stress, plants develop complex and interconnected drought tolerance mechanisms at morphological, physiological, biochemical, and molecular levels [7,8]. Several signaling pathways are activated to mediate the expression of drought stress-related genes. Studies have dissected the underlying mechanisms that influence the transcriptional and post-transcriptional regulation of drought stress response in plants [9]. Talebizadeh [10] reported that various small RNA molecules, including microRNAs (miRNAs), can regulate gene expression.
RNA interference (RNAi) is a gene-silencing technique that can be used to assess gene function, alter plant metabolic activities, and develop stress-tolerant and disease-resistant crops. For example, RNAi-mediated gene silencing has been demonstrated to serve as a defense mechanism against abiotic stresses [11,12,13]. Several studies have highlighted the importance of small RNAs (sRNAs) biogenesis, particularly miRNAs, in regulating plant responses to drought and other abiotic stresses [14,15,16,17,18,19]. Numerous plant regulatory networks are formed by miRNAs and their targets to regulate the overall plant response to stressors like drought [20]. Previously, RNAi-related enzymes were predominantly identified as junk DNA segments due to their small sizes [21].
RNA silencing is a conserved pathway involved in the regulation of growth, development, and abiotic stress responses. RNAi-related genes are key regulatory RNAs that control various plant biological processes, with miRNAs and siRNAs being the most important regulators of plant abiotic stress responses. They represent novel technologies for crop improvement [22].
Three main effector proteins are involved in RNAi: Argonautes (AGOs), Dicer-like proteins (DCLs), and RNA-dependent RNA polymerases (RDRs). These proteins play crucial roles in the RNA silencing machinery, forming RNA-induced silencing complexes with sRNAs, such as siRNAs and miRNAs, thereby triggering sequence-specific destruction or suppression of mRNA translation [23,24,25,26]. The biogenesis and regulation of sRNAs are controlled by AGO, DCL, and RDR proteins [27,28,29,30,31]. AGO, DCL, and RDR proteins contribute to gene-silencing processes during stress response and plant development [32]. miRNA expression levels change when exposed to drought, salinity, temperature variations, and oxidative environments, leading to modulation of target gene expression associated with the abiotic stress response. Despite promising progress in understanding the function of sRNA biogenesis genes in plant growth and development, information related to their role in regulating drought stress response is limited, especially in fruit trees [13].
In this study, RNAi-related genes in peach tree plant were identified, and their expression in response to drought stress was analyzed. The results shed light on the application of sRNAs biogenesis to improve the drought tolerance of peach tree plants through molecular breeding.

2. Results and Discussion

2.1. Identification and Characterization of RNAi-Related Genes in Rosaceae

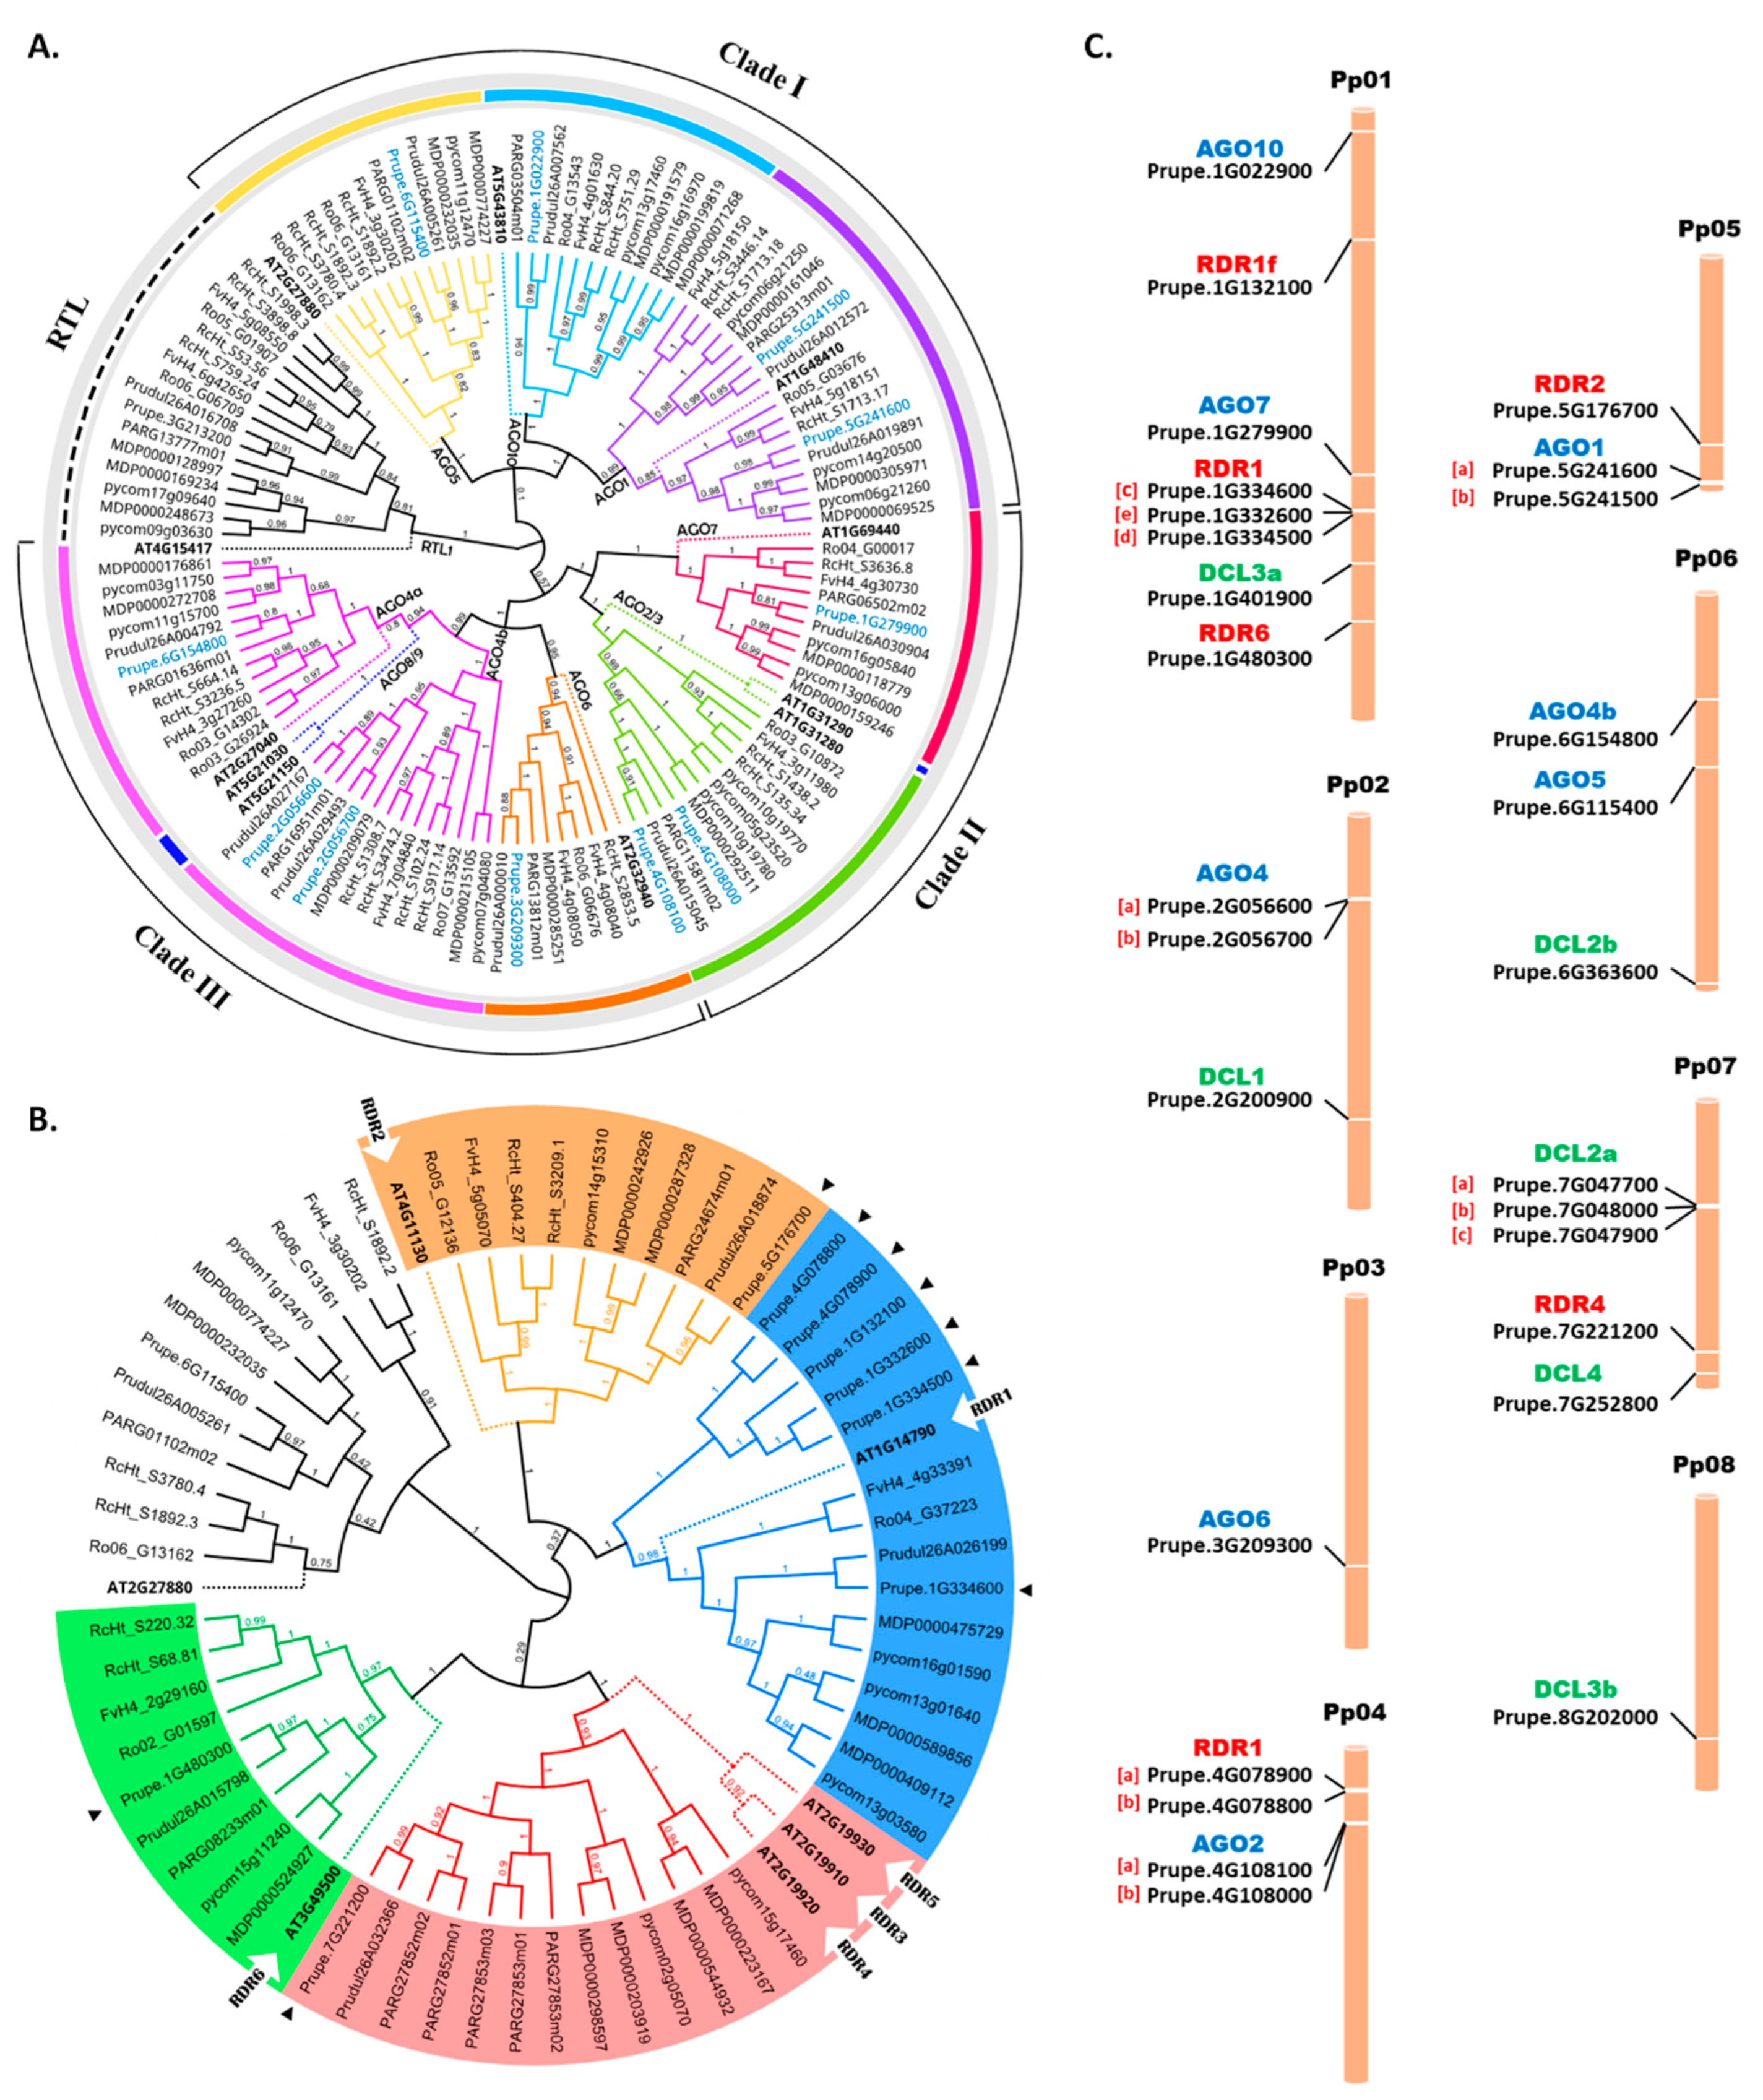
The identified PpAGO, PpDCL, and PpRDR genes were named according to their phylogenetic relationships with the Arabidopsis thaliana sRNAs biogenesis genes (Figure 1). A total of 11 PpAGOs were detected in the peach genome based on the structural integrity of their conserved domains. In addition, phylogenetic analysis was performed to evaluate the relationships between peach and Arabidopsis AGO proteins (Figure 1A). All the peach AGO proteins clearly form three clades: Clade I (AGO1/5/10), Clade II (AGO2/3/7), and Clade III (AGO4/6/8/9). Notably, despite having no orthologous members in the peach genome, three Arabidopsis proteins, including AGOs 8, 9, and 3 were clustered with other peach AGOs. They also shared similar physicochemical properties, such as amino acid length, with other peach AGOs in the same clade. Furthermore, the isoelectric point (pI), molecular weight (MW), and sequence length were analyzed for each identified gene (Table 1).
The phylogenetic analysis was performed for peach DCLs (Figure 1B). PpDCLs were divided into four clades (I, II, III, and IV), and each DCL was clustered and named according to the clade.
Based on the phylogenetic relationship between the peach and A. thaliana proteins, RDR proteins were divided into four clades (I, II, III, and IV) (Figure 1C). Clade I (RDR1) had the largest members of PpRDRs: PpRDR1a, b, c, d, e, and f. Each of Clade II (RDR2) and Clade III (RDR6) had only one RDR gene member. In Clade IV, AtRDR3 and AtRDR4 were grouped with AtRDR5, which blasted into one PpRDR5 (Prupe.7G221200).
To perform genome-wide identification of the AGO, DCL, and RDR gene families in the Genome Database for Rosaceae (GDR), all Hidden Markov Model (HMM) profiles of the conserved domains were gathered, and the identities of AGO, DCL, and RDR conserved domains were examined. A total of 97 AGOs, including 11 genes from peach, were identified in the genomes of the eight tested Rosaceae species (Table S1). Specifically, 10, 18, 10, 16, 14, 10, and 8 members were observed in strawberry (Fragaria vesca), China rose (Rosa chinensis), black raspberry (Rubus occidentalis), apple (Malus × domestica), pear (Pyrus communis), almond (Prunus dulcis), and Armenian plum (Prunus armeniaca), respectively, as shown in Figure 2A. To determine the evolutionary relationship among the orthologues of Rosaceae AGO proteins, a comprehensive neighbor-joining (NJ) phylogenetic tree was constructed. Notably, Clade III was the largest in the Rosaceae family with 38 members, while Clade II was the smallest with 25 members. The AGO4 members were split into two subclades, AGO4a and AGO4b, suggesting their expansion among the tested Rosaceae species. Additionally, the AGO8/9 and AGO3 subclades appeared to have been lost during the evolutionary process in the tested Rosaceae species.
In our previous study, a total of eight PpDCL genes were identified in the peach genome [33] (Table S2). For RDRs, the total of nine PpRDR members were equally grouped into four major clusters (Figure 2B). Furthermore, a total of 112 RDR transcripts were identified from the eight selected Rosaceae genomes (Table S3). Excluding the nine PpRDR copies, a total of 77 non-redundant RDRs were retrieved for further analysis, including 4, 13, 12, 9, 6, 10, and 14 copies from F. vesca, R. chinensis, P. armeniaca, P. dulcis, R. occidentalis, P. communis, and M. x domestica, respectively. All the obtained Rosaceae RDR genes were displayed in four clades, each clade was outgrouped with AtRDR. Notably, the PpAGO5 genes were clustered with AtAGO5, which is included with other AtRDR3 and AtRDR4 subfamilies, according to higher sequence similarity with AtAGO5 (Figure 2B).

2.2. Chromosomal Localization, and Evolutionary Analysis in P. persica

The localization of predicted AGO, DCL, and RDR genes across the eight chromosomes in the peach genome was performed through a BLAST search to determine the physical location of each gene. As a result, the 11 AGO genes were unevenly distributed across the eight chromosomes (Figure 2C). Notably, Chr2, Chr4, and Chr5 contained three duplicate paralogous pairs: PpAGO4b/PpAGO4a, PpAGO2b/PpAGO2a, and PpAGO1b/PpAGO1a, respectively, while Chr1 and Chr6 contained two AGO genes each, including PpAGO10, PpAGO7, and PpAGO5/PpAGO4c, respectively. The Arabidopsis AGO4 gene mapped to three duplicated members in the peach genome, including PpAGO4a, PpAGO4b, and PpAGO4c, with the latter two genes being tandemly duplicated. The adjacency of these genes indicates that they originated through tandem duplication events, suggesting that tandem duplication is a key evolutionary process driving the expansion of this gene family in the peach genome.
The distribution of DCL genes in the peach genome showed that the eight predicted DCL genes could be mapped on five out of the eight chromosomes (Figure 2C).
The nine identified PpRDR genes are located on four chromosomes (Chr1, Chr4, Chr5, and Chr7). Chr1 contained the majority of PpRDR genes (five genes), although it is the longest chromosome. The results showed that PpRDR genes, such as the paralogous pair of PpRDR1a (Prupe.4G078900) and PpRDR1b (Prupe.4G078800), were closely located on Chr4. The existence of homologous genes in the same location indicates that these genes originated by tandem duplication, giving rise to paralogous genes. Tandem duplication is frequently regarded as a primary factor driving various biological functions. Similarly, triple duplications of PpRDR1c, PpRDR1d, and PpRDR1e (Prupe.1G334600, Prupe.1G334500, and Prupe.1G332600, respectively) were located on Chr1. The results indicate that duplicated genes may have complex phylogenetic structures due to variations in their evolutionary alterations.
The duplication of PpRDR genes is centralized on four chromosomes, making it interesting to study the characteristics of phylogenetic relationships in different species. Triple copies or multi-gene sets of putative orthologs may contain paralogs that have not been detected. Notably, some PpRDR genes, such as PpRDR3 and PpRDR5, are absent, as shown in the phylogenetic tree (Figure 2C) and NJ clusters (Figure 1C). This absence might be due to high similarity between the reference genome sequences of AtAGO and AtRDR and their peach counterparts, leading to the absence of PpRDR3 and PpRDR5 in the BLAST results. The similarity between these genes includes molecular properties such as sequence length (992 and 977 amino acids) and molecular weight (112.8 and 110.9 kDa), respectively. AtRDR3 and AtRDR5 cluster as siblings with AtRDR4 in the same clade. This high similarity may explain why PpRDR3 and PpRDR5 were not detected in the peach genome, possibly due to data processing deletions or resulting isoform copies of genes.

2.3. Gene structure and Motif Analysis in P. persica

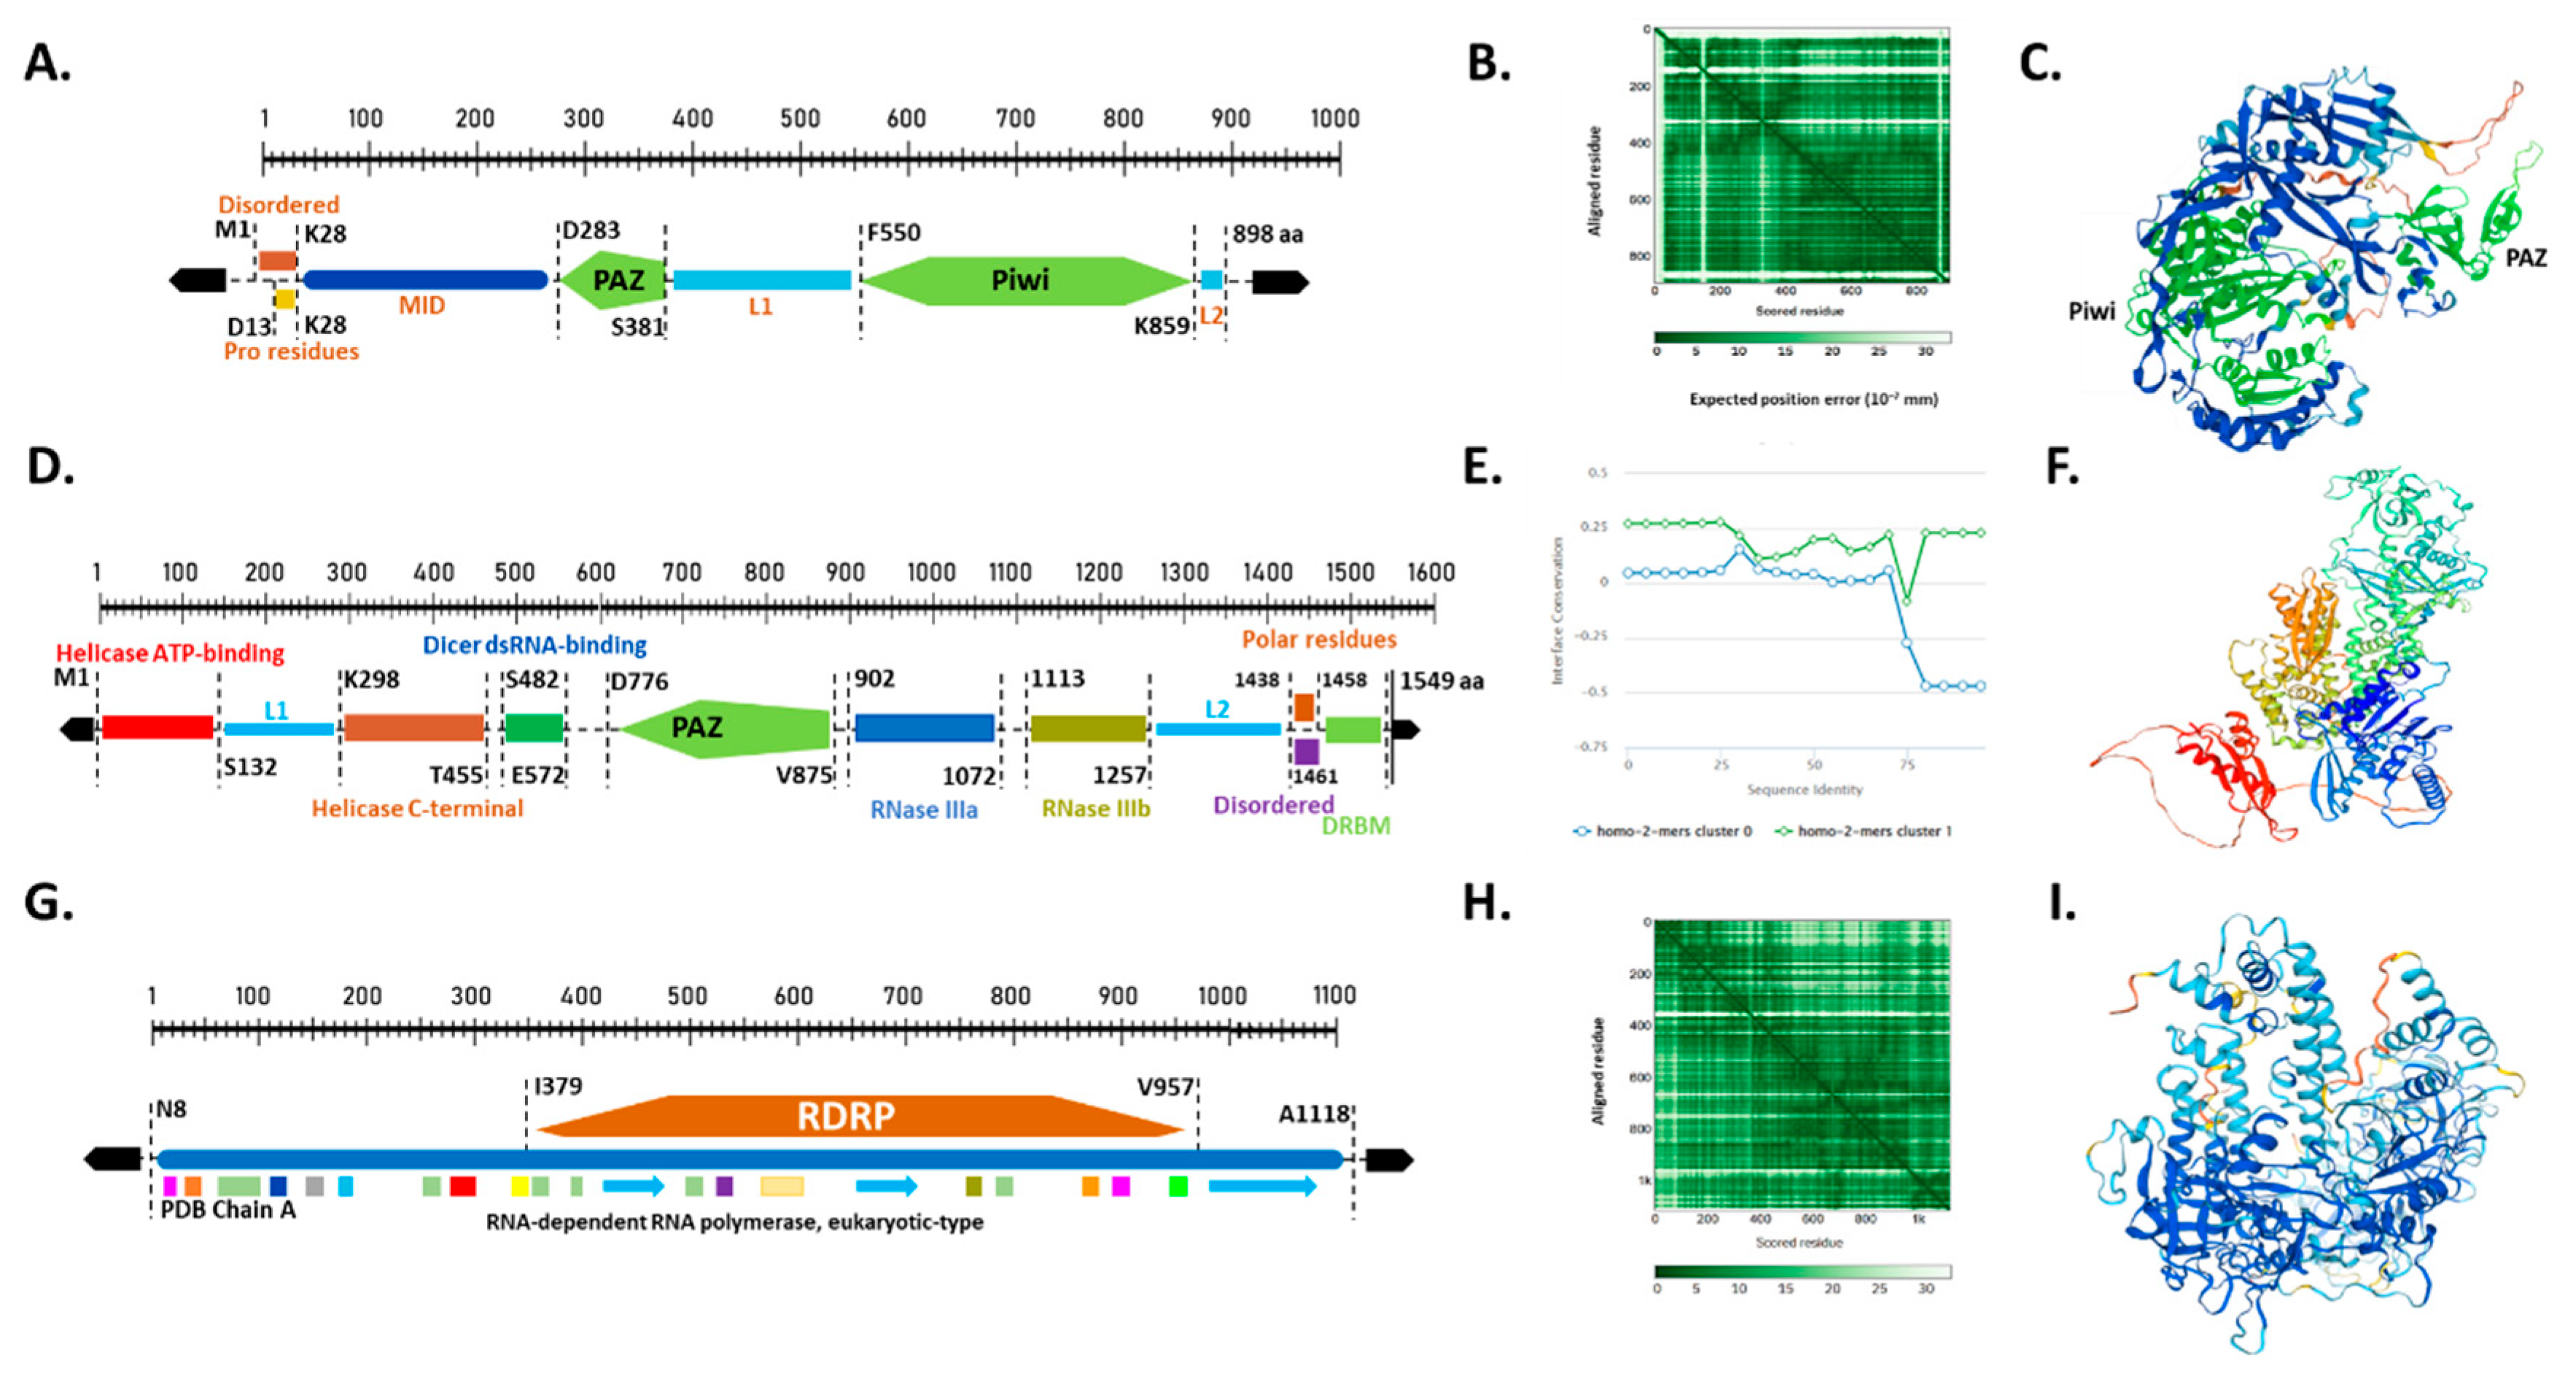
To further validate and gain insights into the potential activities of the identified peach sRNAs biogenesis proteins, we analyzed their gene structure and conserved regions involved in RNA binding, enzyme catalysis, and other critical features. Previous studies have demonstrated that these predicted domains play crucial roles in protein activity in plants [34,35]. The functional domain analysis revealed that most peach AGO, DCL, and RDR proteins are highly conserved (Figure 3)
Peach AGO proteins are primarily characterized by three domains: PAZ, MID, and PIWI (Figure 3A), consistent with previous studies [36,37,38]. It has been reported that the PAZ and PIWI domains play critical roles in RNase activity in AGOs [12,39,40]. Both PAZ and PIWI domains were detected in all the putative PpAGO proteins, showing similarities with their Arabidopsis orthologs. The PAZ domain is essential for binding the 2-nt 3' overhang of sRNAs, while the PIWI domain of certain AGOs has RNase activity [35,41]. The MID domain anchors the 5' phosphate end of sRNAs onto Argonaute proteins [35,39,42,43,44,45]. The putative PpAGO6 (Prupe.3G209300) was highlighted for structural prediction and generic domain structure analysis of AGOs. PpAGO6 has a protein length of 898 amino acids. The PAZ domain is located between residues D283 and S381 (99 amino acids in length), while the PIWI domain is located between F550 and K859 (310 amino acids in length). Both domains showed identical homology with RNase H, which binds to the 5′ end of the siRNA of the target RNA and cleaves it, demonstrating that sRNAs are complementary sequences [46,47].
The residues of AGO domains are involved in sRNA binding, sorting, and sRNA-targeted RNA pairing. sRNA sorting into different AGOs depends on features such as sRNA length and 5′ end nucleotide type [48,49,50]. sRNA 5′ terminal nucleotide of sRNA is recognized by the nucleotide specificity loop within the MID domain (Figure 3A). The MID domain is reported to be the main component of AGO with crucial functions in RNA silencing [49,51]. Additionally, other highly conserved residues or motifs with potential functional importance were detected within the 3′ end of sRNAs. These motifs are labeled as "L" in Figure 3A.
Dicer-like (DCL) proteins are endonucleases with two RNase III domains [52,53,54]. DCL proteins split both strands near the terminal loop to generate the miRNA duplex, containing the miRNA paired with its passenger strand. Figure 3D presents PpDCL4 as an example model of peach Dicer-like proteins. PpDCL4 is composed of six functional parts: the PAZ domain (residues D776–V875), two helicase binding fragments, dicer dsRNA-binding residues, and two RNase III domains. The PAZ domain is connected to RNase IIIa on one side, while the helicase C-terminal contacts the PAZ domain from the opposite direction through dicer dsRNA-binding residues. RNase-IIIb follows RNase IIIa in structure. The helicase binding fragments include helicase ATP-binding (M1–S132) and helicase C-terminal (K298–T455), while the Dicer dsRNA-binding domain is located between S482 and E572. RNase-IIIa and RNase-IIIb, located between positions 902–1072 and 1113–1257, respectively, are the main components of DCL domains and interact directly with substrate RNAs. The overall structure of DCL domains resembles a hacksaw [54].
The structure of PpRDR and the distribution of domains along the PpRDR sequence are depicted schematically in Figure 3G. PpRDR2 has a canonical RNA-dependent RNA polymerase (RDRP) domain characteristic of known polymerase structures, with the PDB chain regions playing an important role in the observed structure. The RDRP domain occupies the largest part of the PpRDR2 protein sequence, spanning 579 amino acids in length (I379–V957).
The Protein Data Bank (PDB) format is shown as a standard for files containing atomic coordinates. Using the Swiss-Model software for online analysis, we found that the tertiary amino acid sequences of 28 members were highly similar (Figure 3B,E,H). In this study, we modeled the amino acid sequences of 28 RNAi-related genes from the three gene families using 3D structural homology. One gene from each family was chosen for modeling, as shown in Figure 3C,F,I.
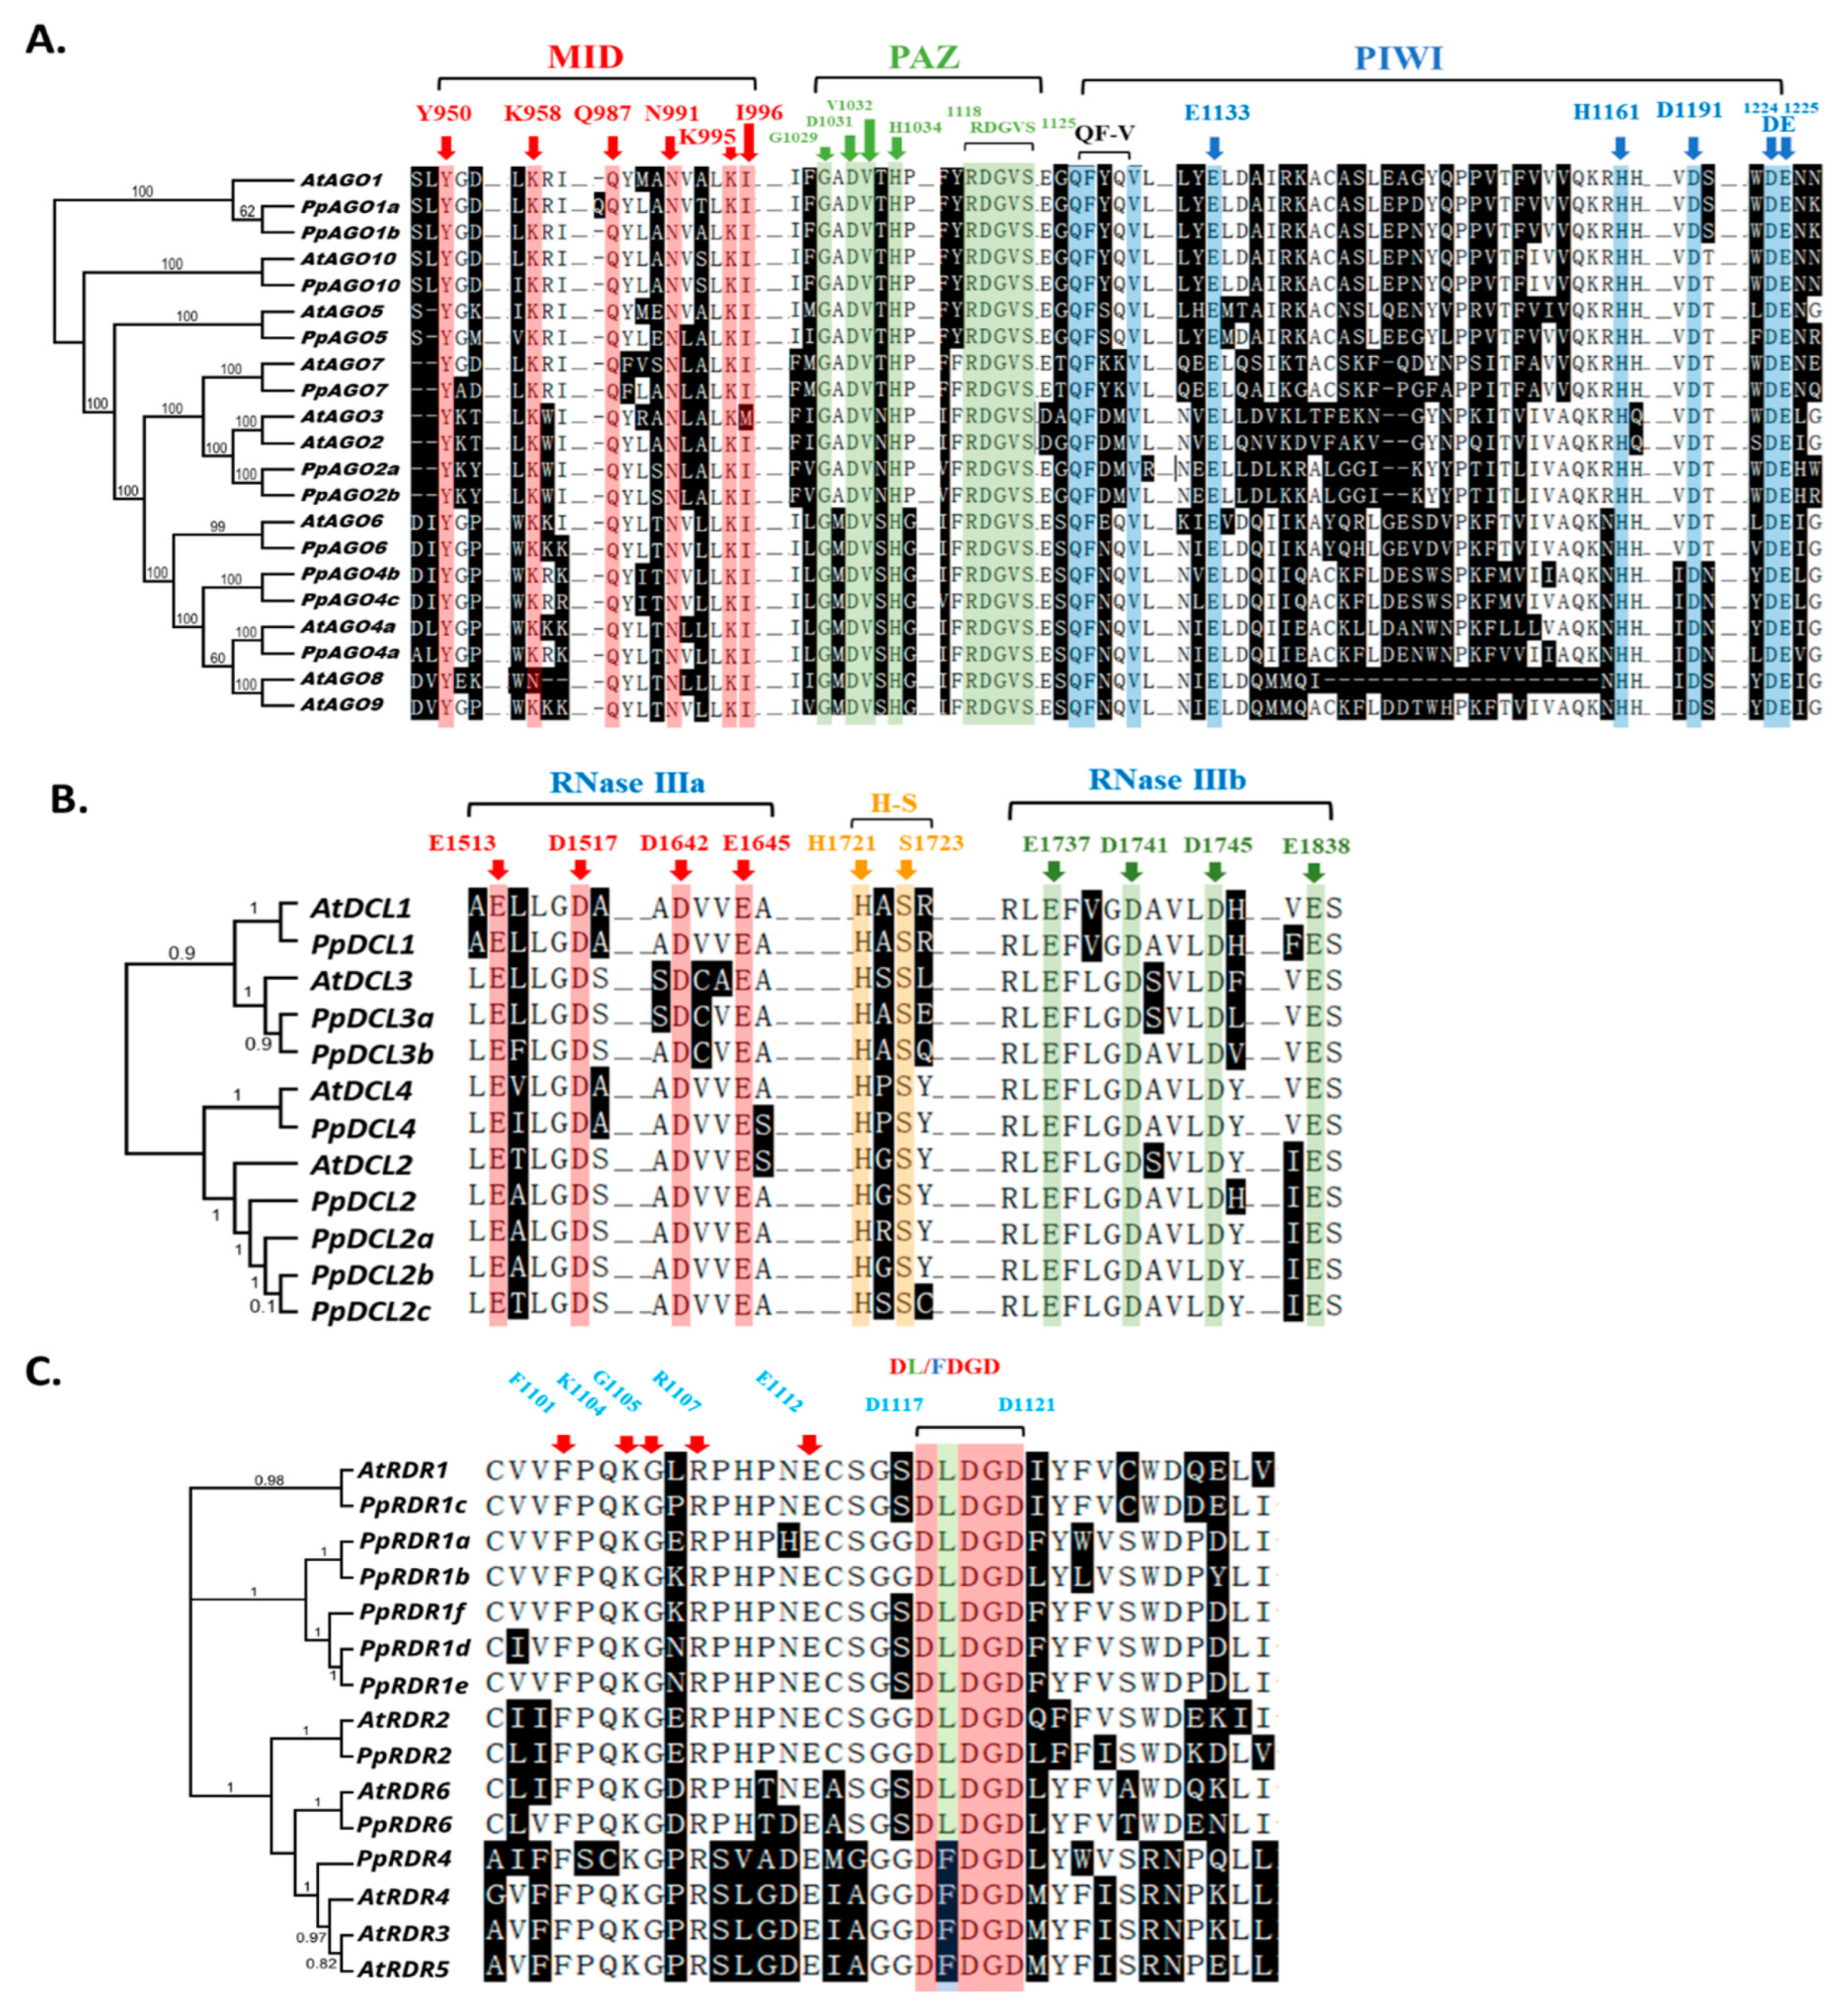
The analysis focused on conserved motifs involved in RNA-binding, enzyme catalysis, and other critical features to characterize the identified P. persica silencing proteins. The predicted PpDCL, PpAGO, and PpRDR protein sequences were aligned with reference sequences of AtDCL, AtAGO, and AtRDR (Figure 4). Conserved functional motifs in PpAGOs were confirmed, such as Y950, K958, Q978, N991, K995, and I996, crucial for the MID domain's role in sRNA 5′-phosphate-binding [59], which were fully conserved across peach AGO proteins (Figure 4A). The PAZ domain residues (G1929, D1931, V1932, and H1934) were also universally present. Furthermore, the RDGVS (1118–1122 aa) motifs were conserved in all AGOs of peach and Arabidopsis. Examination of the PIWI domain revealed conserved residues like E1133, D1191, DE (1224 and 1125), and H1161, implicated in enzyme catalysis [38,41,55]. Further functional analysis is needed to elucidate the specific roles of these residues in PpAGO proteins. The glutamine-phenylalanine-valine (QF-V) motif critical for sRNA duplex recognition and sorting was conserved across all PpAGOs [37,38,56] (Figure 4A), suggesting their importance in sRNA 3′-end binding within PAZ and PIWI domains.
To assess the functional similarity of peach DCL proteins with Arabidopsis counterparts, we conducted multiple sequence alignments and motif composition analyses. Computational modeling of the catalytic core of AtDCL4 provided insights into the amino acids critical for dsRNA recognition, binding, and cleavage. The alignment revealed conserved RNase IIIa, RNase IIIb, and an RNA binding motif across PpDCL proteins (Figure 4B). Specifically, the RNase III catalytic sites of peach DCL proteins featured glutamate (E), aspartate (D), aspartate (D), and glutamate (E) (EDDE), analogous to their orthologs in AtDCLs. Key residues include E1513, D1517, D1642, and E1645 for RNase IIIa, and E1737, D1741, D1745, and E1838 for RNase IIIb, with the RNA-binding motif characterized by the H-S loop (Figure 4B). Additionally, sequence alignment of AtRDRs with putative PpRDR proteins identified the conserved D-DGD catalytic motif, a hallmark of the RDR conserved domain (Figure 4C).

2.4. Orthologous Similarity and Collinearity Analysis for Non-Coding RNA Genes

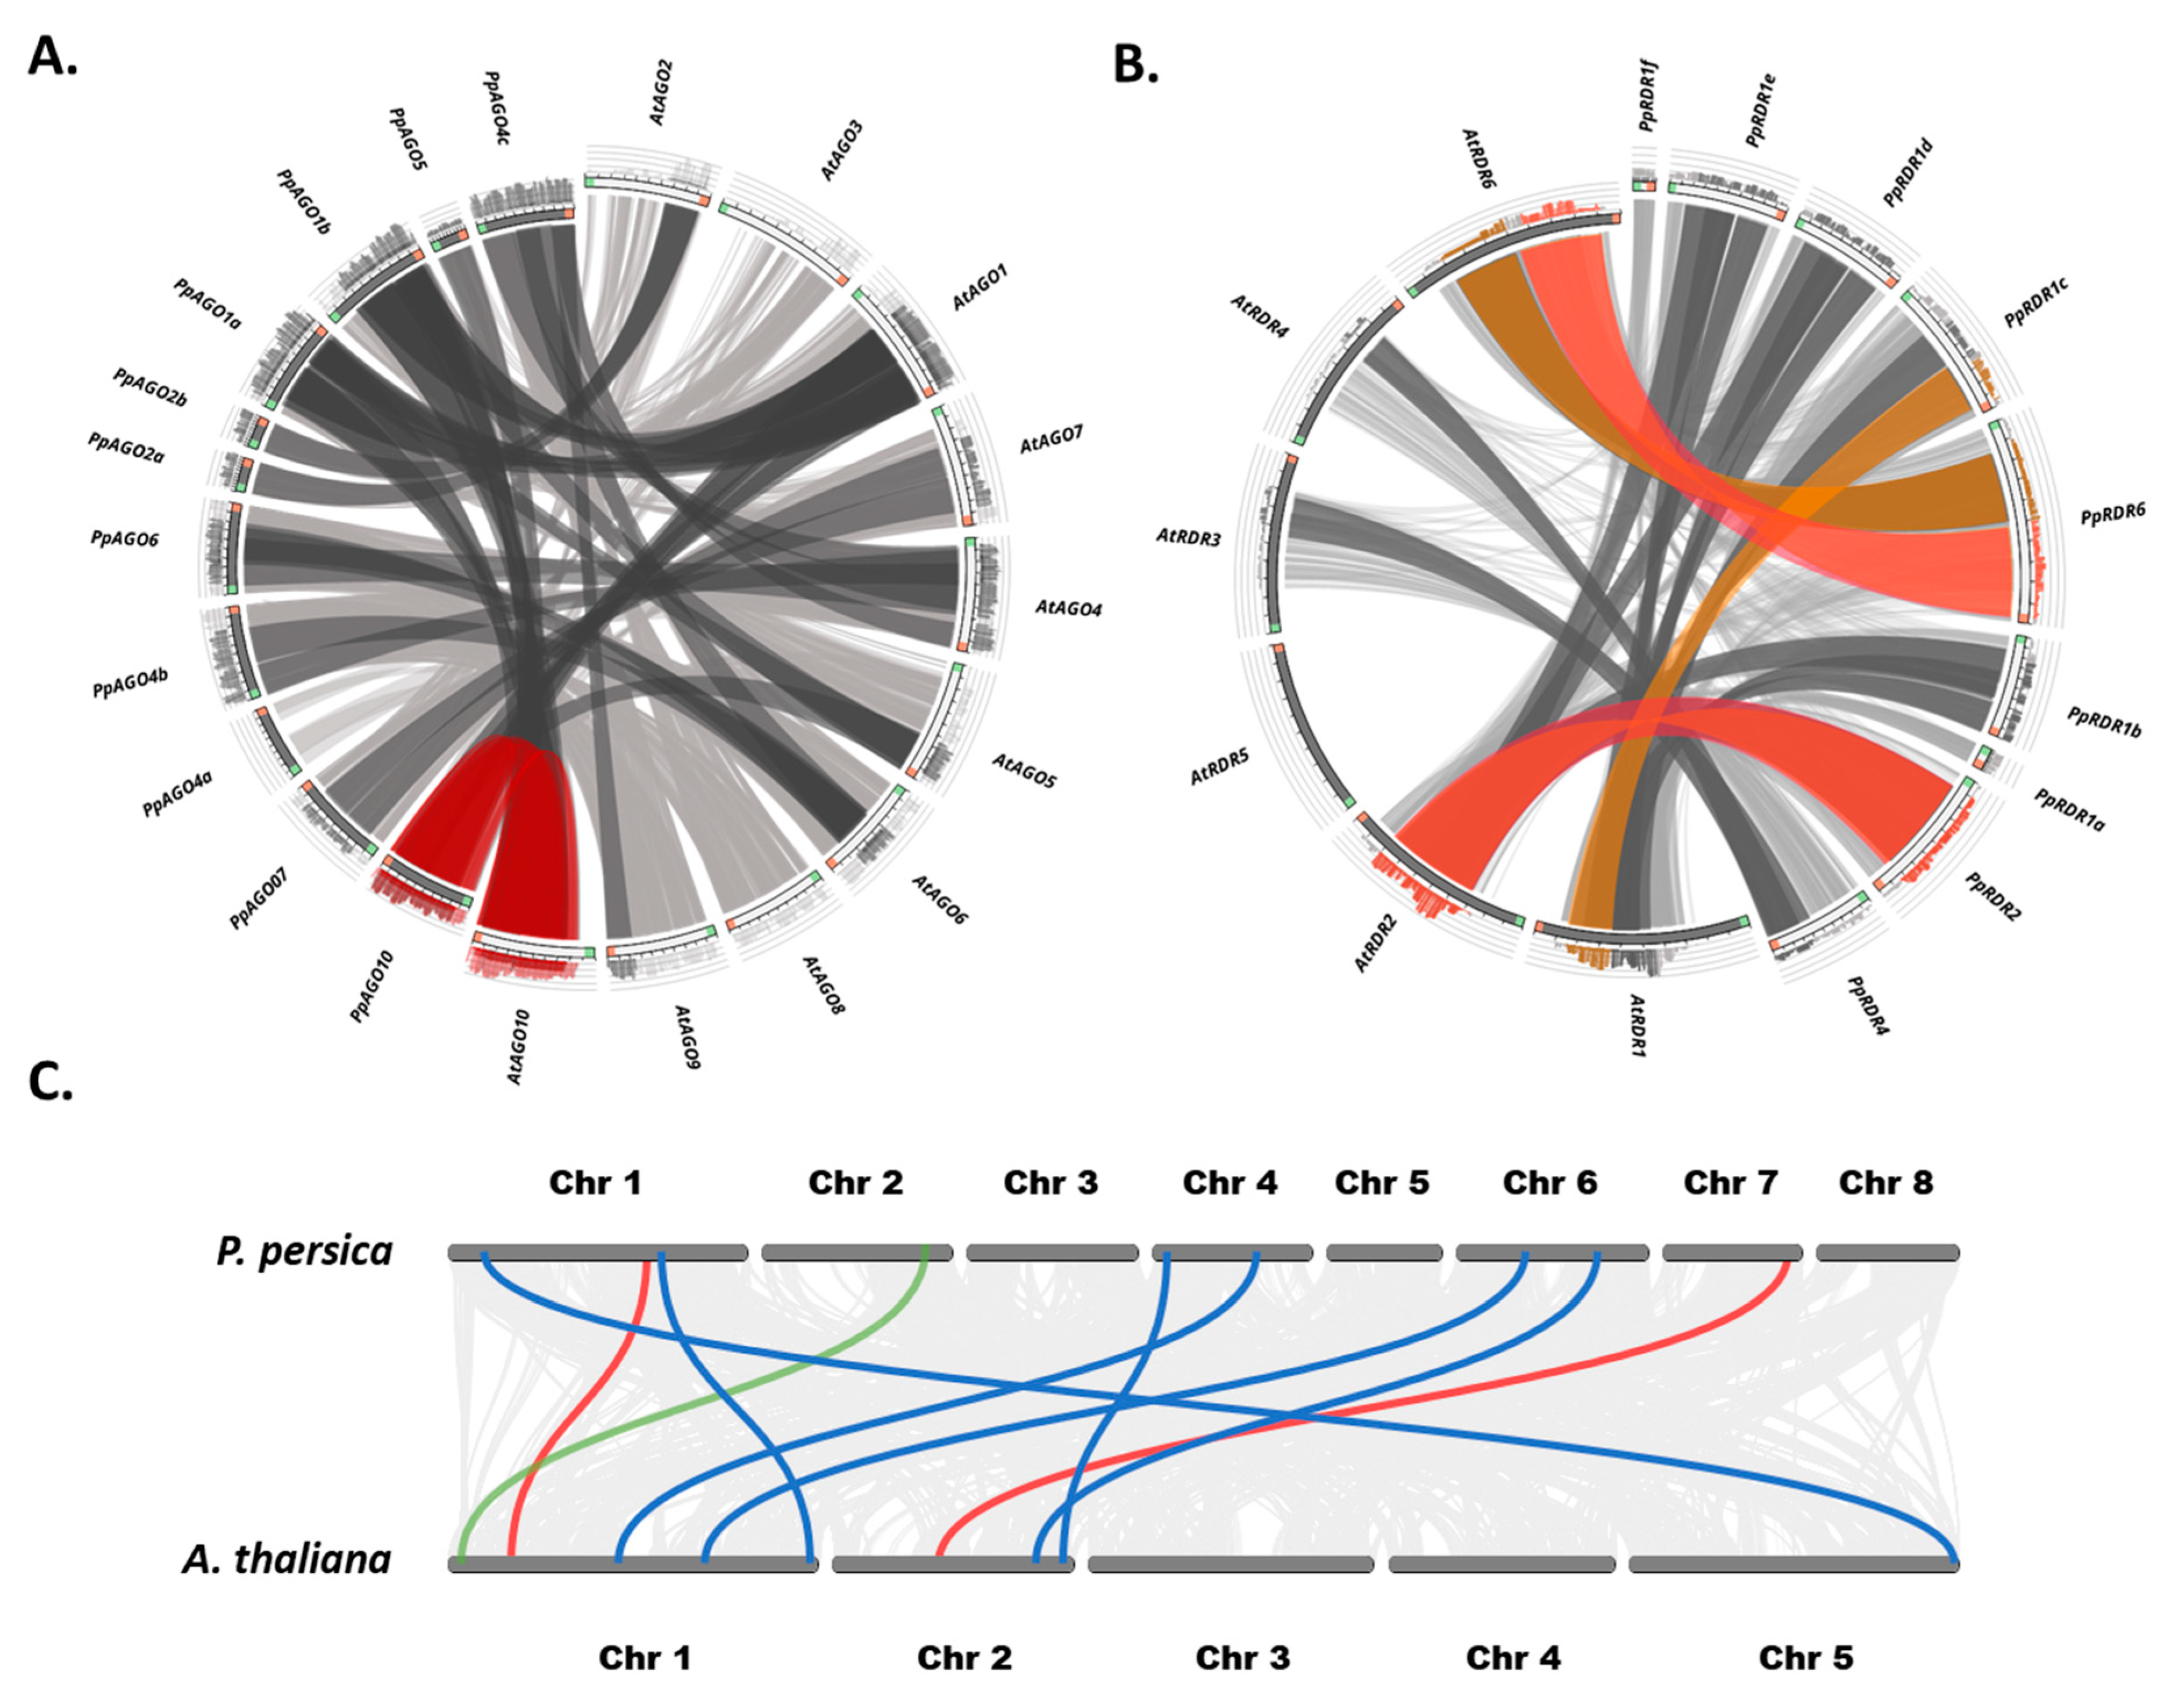
Our analysis indicated that most gene pairs had a Ka/Ks ratio <1, signifying strong purifying selection and underscoring their essential roles in plant fitness under stressful conditions. Notably, significant sequence similarities were identified between peach and Arabidopsis AGO orthologs (Figure 5A). AtDCL1 exhibited the highest similarity score among peach DCLs with its ortholog, scoring ≥ 0.75, followed by AtDCL2 and AtDCL4 with scores ≤ 0.50, while AtDCL3 showed lower similarity with its orthologous genes.
RDR genes were mapped using Blastp protein sequence comparisons [57], revealing distinct similarity patterns between PpRDRs and their AtRDR orthologs (Figure 5B). PpRDR1 genes comprised six copies (PpRDR1a to PpRDR1f), each showing high similarity with specific AtRDR counterparts, whereas other AtRDR genes exhibited less similarity with their duplicates. PpRDR2, PpRDR4, and PpRDR6 each showed varying degrees of similarity with different AtRDRs, with PpRDR6 (Prupe.1G480300) demonstrating the highest similarity score among all copies, followed by PpRDR2 (Prupe.5G176700).
Additionally, chromosomal collinearity analyses of AGOs, DCLs, and RDRs (Figure 5C) revealed extensive conservation between peach and Arabidopsis. Five AGO genomic collinear pairs exhibited shared gene order: PpAGO7-AtAGO7, PpAGO10-AtAGO10, PpAGO6-AtAGO6, PpAGO2a-AtAGO2, PpAGO1a-AtAGO1, and PpAGO5-AtAGO5. DCLs showed lower collinearity with only one pair (PpDCL1-AtDCL1) maintaining collinearity. For RDRs, two collinear regions were identified: PpRDR1d-AtRDR1 and PpRDR4-AtRDR4. These findings underscore a conserved genomic structure between these species across the three non-coding small RNA gene families.
Predicted cis-acting elements in the promoter regions were identified for all candidate AGOs, DCLs, and RDRs genes, classified into three functional groups: phytohormone-responsive, specific expression and stress-related, and light-responsive-related. A total of 41, 40, and 42 promoter cis-acting elements were identified in PpAGOs, PpDCLs, and PpRDRs, respectively (Figure S1). Predominantly, these elements were associated with specific expression and stress response, highlighting their crucial roles in both biotic and abiotic stress responses (Figure S1). Notably, the analysis revealed a prevalence of CAAT-boxes and TATA-boxes across all AGOs, DCLs, and RDRs, underscoring their importance in transcriptional regulation. Additionally, TC-rich repeats, LTRs, and MBS promoters known to regulate responses to biotic and abiotic stresses [58] were prominently represented, indicating their direct involvement in the regulation of sRNAs biogenesis genes, particularly under drought conditions (Figure S1) [59,60].
In AGO genes, promoter regions such as TAG-box and TATC-box, HD-Zip 1, A-box, CCAAT-box, and LAMP-element were specifically detected in PpAGO6, PpAGO7, PpAGO1a, PpAGO2a, and PpAGO10, respectively (Figure S1A). The analysis revealed consistent patterns of promoter cis-elements across homologous genes. For example, PpAGO1a and PpAGO1b exhibited 11 shared representations and 18 absences out of a total of 41 promoter regions. In DCL genes, MSA-like and MRE elements were identified exclusively in PpDCL3a, whereas A-box, HD-Zip3, AAAC-motif, and AT1-motif were present only in PpDCL3b. Additionally, Box II and chs-CMA2a were found in PpDCL1 and PpDCL4, respectively (Figure S1B). Similar expression patterns were observed among paralogous genes, with PpDCL2a, PpDCL2b, and PpDCL2c sharing six representations and 18 absences. Moreover, PpDCL3a and PpDCL3b showed 10 shared representations and 6 absences out of a total of 40 promoter regions. In RDR genes, the Sp1 promoter region was identified uniquely in the PpRDR1b gene, while the ATC-motif and Circadian elements were present in PpRDR1c and PpRDR1d, respectively. Furthermore, Box III and ACE promoter regions were specific to the PpRDR1f gene sequence. Conversely, the GARE-motif and LAMP-element were exclusively detected in PpRDR2. Additionally, the TGA-box, AACA-motif, and A-box promoter regions were found only in PpRDR4, while chs-Unit1 m1 was identified in PpRDR6 (Figure S1C). Similar patterns were observed among the six paralogous genes of PpRDR1, with five shared representations and 11 absences identified in the promoter cis-elements.

2.6. Expression Patterns of AGO, DCL and RDR Genes in Peach under Drought Stress

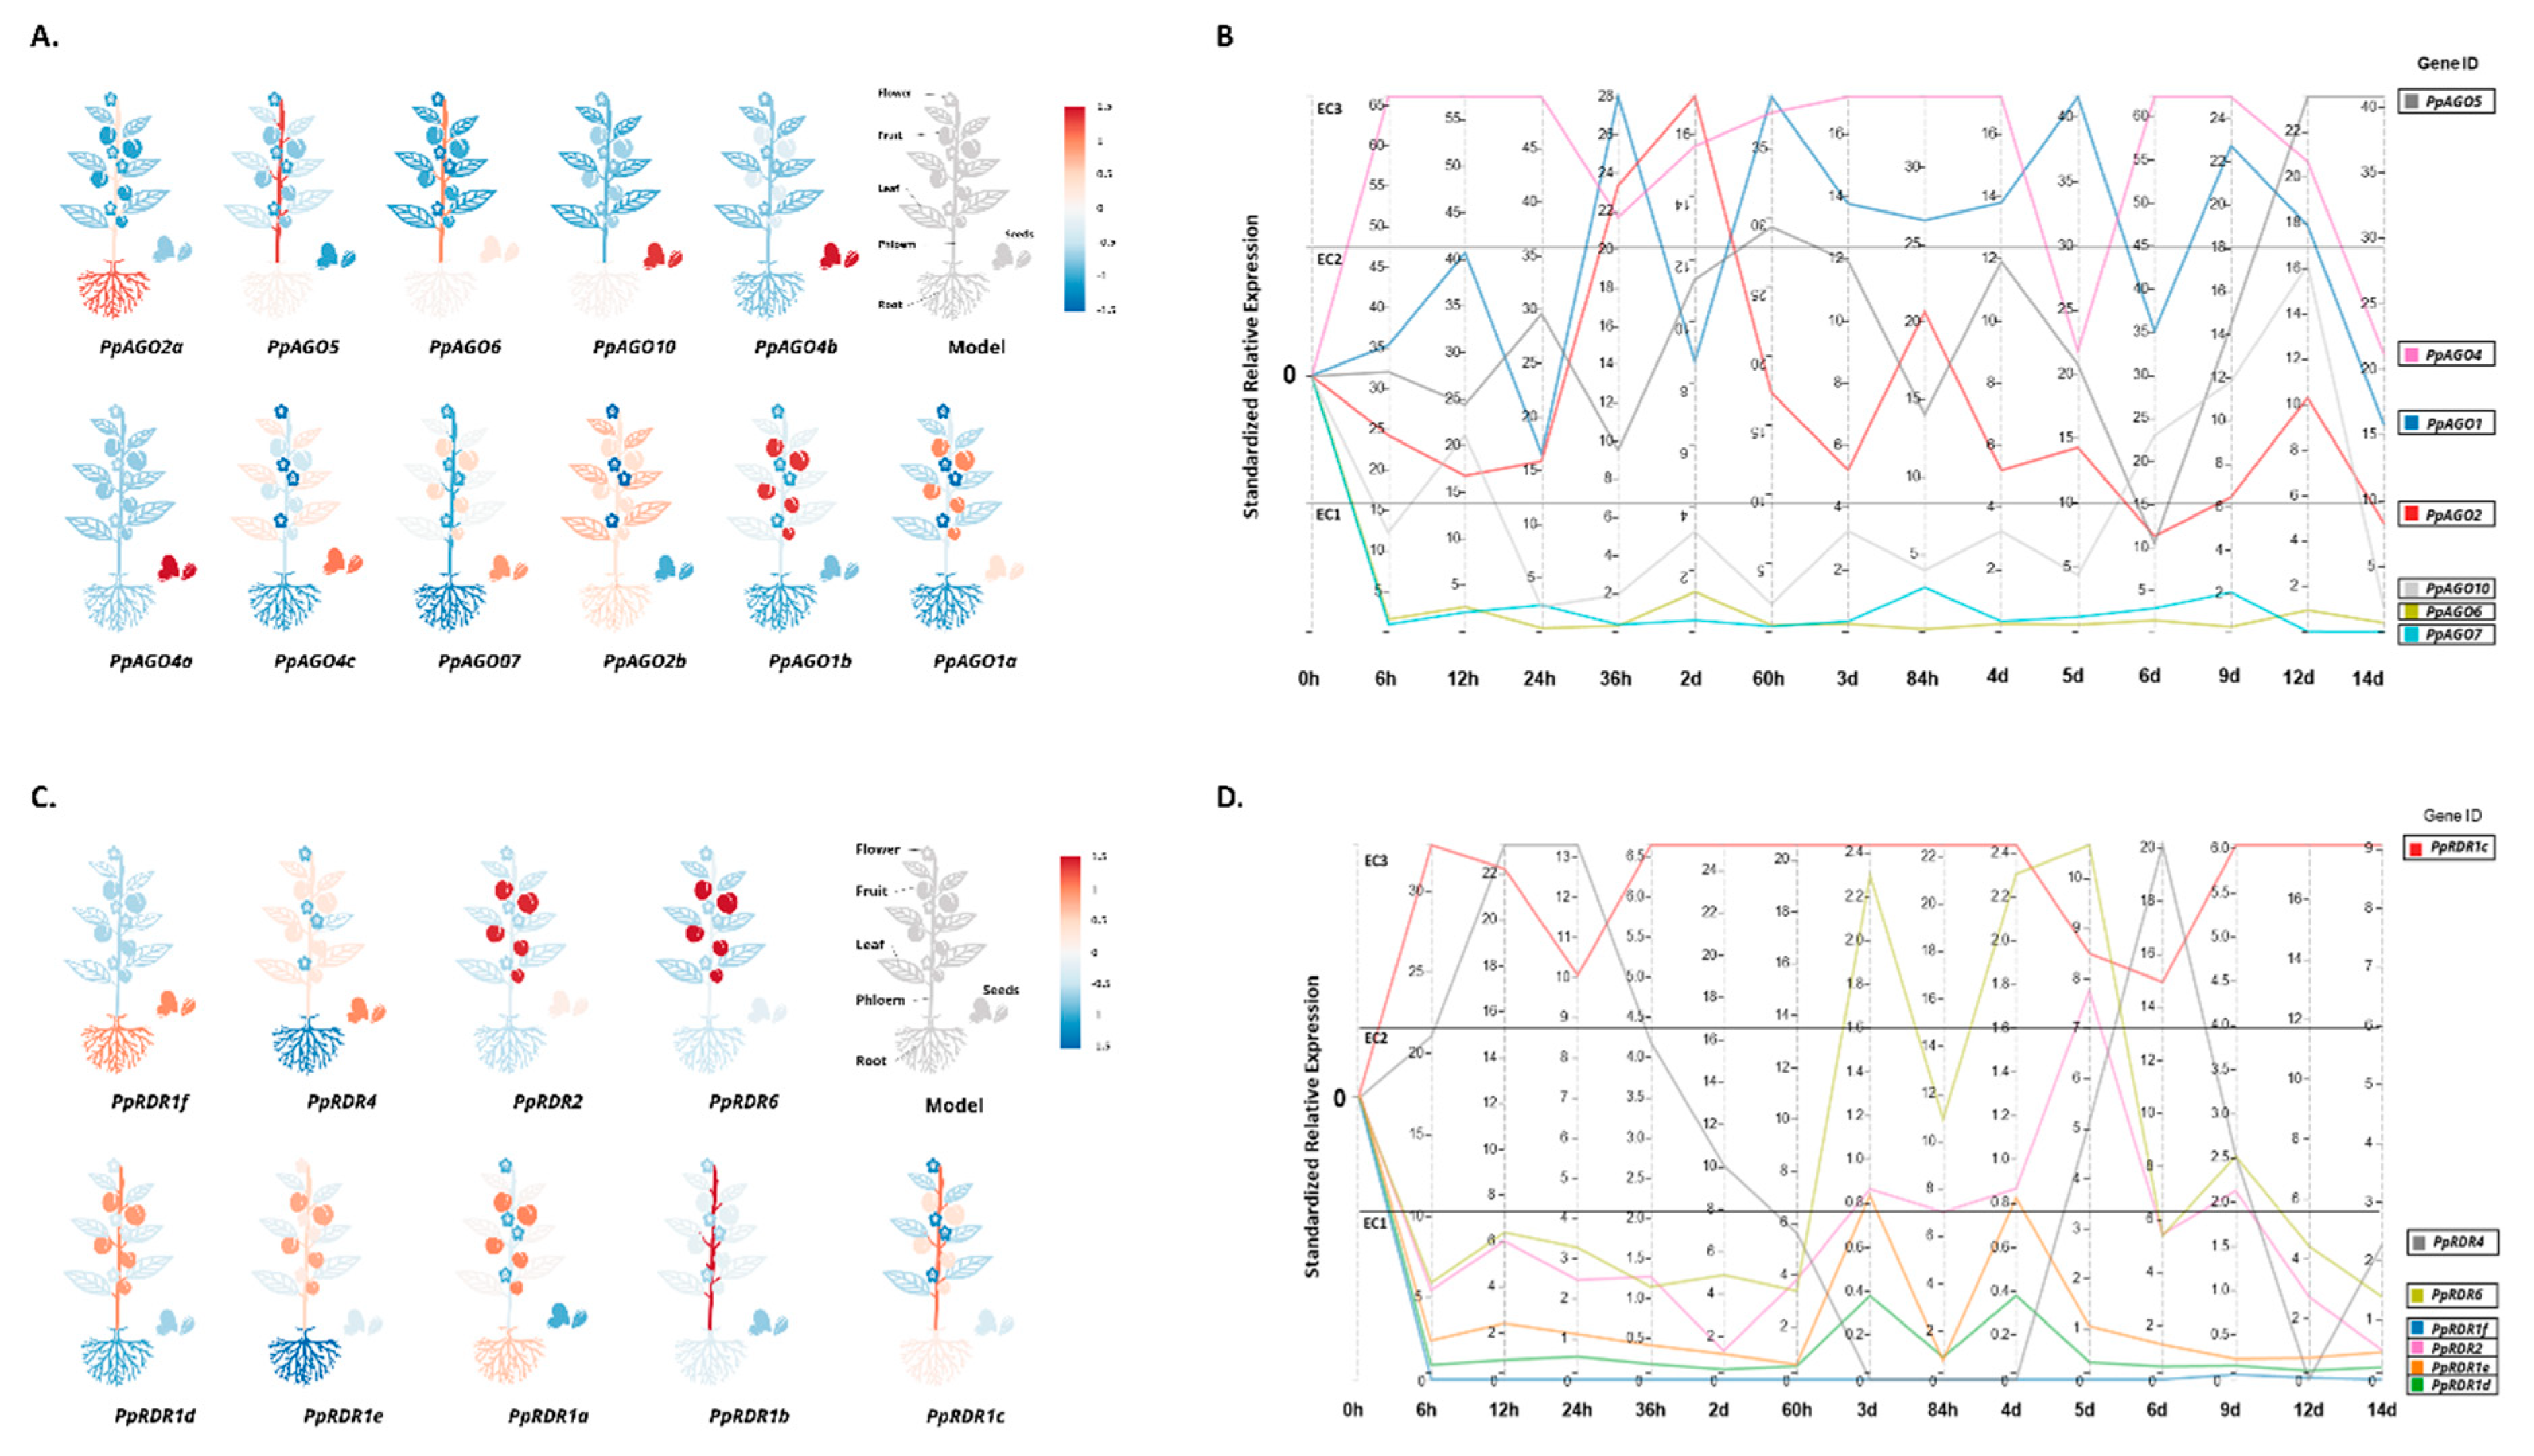
To predict the functions of AGO genes in peach, we analyzed their FPKM expression across different tissues including leaf, fruit, phloem, root, flower, and seed using available transcriptome data (v2.0.a1) (Figure 6A). Our findings revealed widespread expression of all peach AGOs across multiple tissues. Notably, PpAGO2a exhibited highest expression in roots followed by PpAGO2b, while PpAGO2b and PpAGO4c were prominently expressed in leaves, indicating potential roles in drought stress response. Particularly, PpAGO2b showed predominant expression in leaves, roots, and phloem tissues. These insights contribute to understanding the evolutionary dynamics of AGO genes in Rosaceae and their roles in peach's response to drought stress.
Time-course expression analysis of AGO genes under drought stress further demonstrated differential expression patterns across peach tissues (Figure 6B). PpAGO4c exhibited peak expression on the first day of prolonged drought treatment but downregulated at subsequent time points (36 hours, 5 days, and 14 days). Conversely, PpAGO1a, PpAGO2b, PpAGO5, and PpAGO10 showed varying upregulation profiles under prolonged drought conditions. Conversely, PpAGO1b, PpAGO2a, PpAGO4b, PpAGO4a, PpAGO6, and PpAGO7 displayed low relative expression in expression cluster 1 (EC1), suggesting potential co-expression in inducing drought resistance mechanisms under prolonged stress. Notably, phylogenetic analysis clustered PpAGO4c, PpAGO4b, and PpAGO4a closely together, suggesting functional redundancy or neo-functionalization in evolution (Figure 6B).
Environmental stresses profoundly influence plant gene regulation and adaptation. Stress-related genes are induced under adverse conditions to bolster plant resilience. Expression patterns of PpDCL genes under drought stress have been previously investigated [33] and are further detailed in supplementary results (Figure S2).
RDR genes, crucial in small RNAs biogenesis, play pivotal roles in plant growth and development [61,62,63,64]. Expression patterns of PpRDR genes across six tissues (root, fruit, seed, flower, phloem, and leaf) were analyzed to infer their functional roles (Figure 6C). All PpRDR genes were found to be expressed in these tissues, each exhibiting distinct expression patterns indicative of their roles in stress responses and development.
To delineate PpRDR gene functions under drought stress, their expression patterns were analyzed across different time points (Figure 6D). All PpRDRs displayed differential expression across expression clusters (EC) in response to short-term and prolonged drought conditions. For instance, PpRDR1c exhibited stable and elevated expression initially but decreased later, while PpRDR4 showed dramatic fluctuations in expression levels across various time points. PpRDR2 and PpRDR6 showed parallel expression patterns, with PpRDR6 displaying higher expression in EC2 and EC3. Conversely, PpRDR1b exhibited the lowest expression among PpRDR1 copies in EC1, suggesting a potential role as a chronic co-expression gene in drought resilience. The expression of PpRDR1 copies (d, e, and f) was significantly upregulated under prolonged drought stress from 3 to 12 days, indicating functional redundancy or neo-functionalization within this clade. These findings provide valuable insights into the molecular evolution and adaptive responses of PpRDR genes in Rosaceae, particularly in the context of drought stress in peach cultivation regions [6].
PpRDR4 exhibited a distinctive expression pattern characterized by a sharp increase within the first 12 hours, followed by stable expression for the subsequent 12 hours, and a dramatic decline within two days of treatment. It then stabilized for a day until a notable increase was observed on the sixth day, followed by another decline on day 12, and a subsequent increase on day 14. PpRDR2 and PpRDR6 displayed similar expression patterns, although PpRDR6 showed enhanced expression in EC2 and EC3. Conversely, PpRDR1b exhibited the lowest expression during the initial phase of drought treatment in EC1, while PpRDR1f and PpRDR1a showed no significant expression patterns, implying their potential roles as constitutive co-expressed genes in drought resistance (Figure 6F). Expression of PpRDR1 copies (d, e, and f) was significantly upregulated from days 3 to 12 of drought stress, whereas other genes from the same clade as PpRDR1 remained unchanged, suggesting functional redundancy or neo-functionalization from a common ancestor during evolution. These findings offer insights into the molecular evolution of PpRDR genes within Rosaceae and their likely contributions to drought response in peach, a crop commonly cultivated in irrigated semi-arid and arid regions [6].

2.7. Quantitative Real-Time PCR (qRT-PCR) Validation of AGO, DCL, and RDR Genes

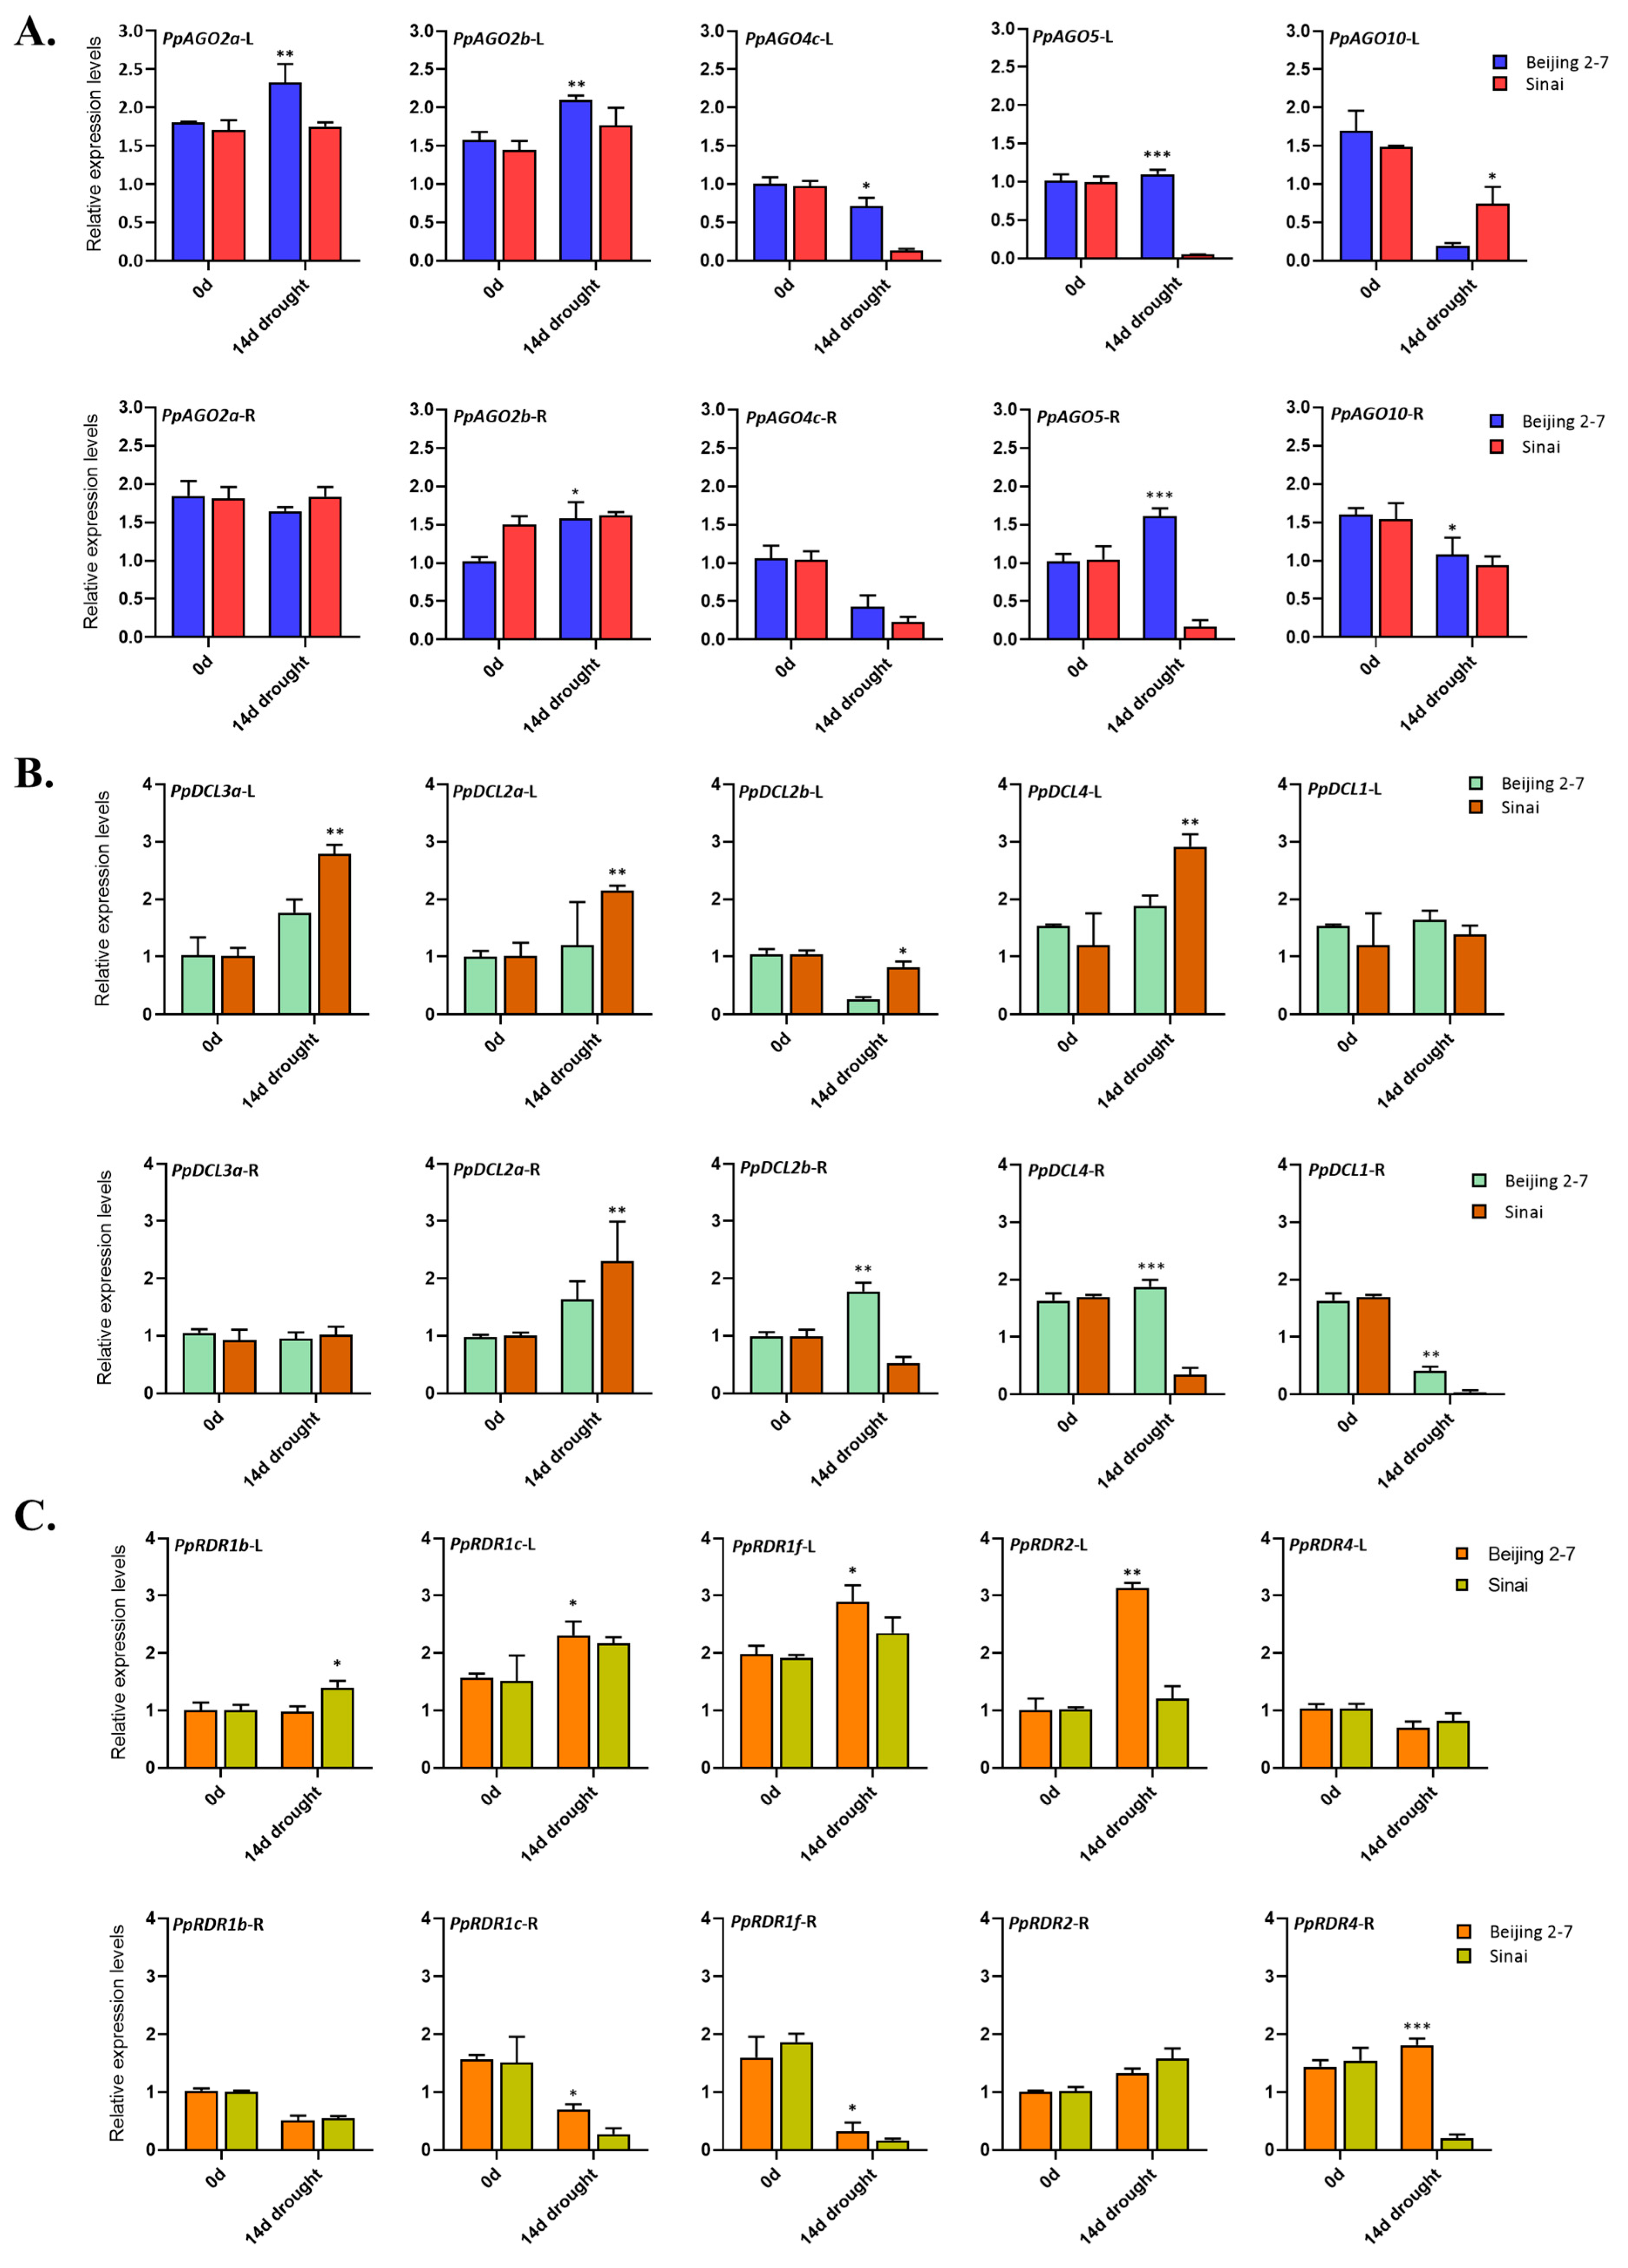
To gain insights into the roles of AGOs, DCLs, and RDRs in drought stress response, we assessed the expression of PpAGO, PpDCL, and PpRDR genes in two P. persica cultivars, ‘BJ2-7’ and ‘SN’ peach, known for their differing drought tolerance levels. Five candidate genes from each gene family were selected for qPCR analysis. Our findings revealed that under drought stress conditions, PpAGO2a and PpAGO2b genes were significantly induced in the leaves and roots of both cultivars. Notably, their expression was markedly higher in the leaves of ‘BJ2-7’ compared to ‘SN’. In contrast, drought stress inhibited the expression of PpAGO4c and PpAGO10 in the leaves of both cultivars, with PpAGO4c showing higher expression in ‘BJ2-7’ and PpAGO10 in ‘SN’. Additionally, PpAGO5 was induced only in the leaves and roots of ‘BJ2-7’ but inhibited in ‘SN’, suggesting a potential role in drought tolerance specific to ‘BJ2-7’ (Figure 7A).
Among the DCL genes, 14 days of drought stress induced the expression of PpDCL1, PpDCL2a, PpDCL3a, and PpDCL4 in the leaves of both cultivars (Figure 7B). Conversely, PpDCL2b was downregulated in response to drought stress in both cultivars. Interestingly, the induction of PpDCL2a, PpDCL2b, PpDCL3a, and PpDCL4 was significantly higher in the leaves of ‘BJ2-7’ compared to ‘SN’. Moreover, PpDCL2b and PpDCL4 were induced only in the roots of ‘BJ2-7’ but inhibited in ‘SN’, while PpDCL1 was inhibited in the roots of both cultivars, albeit with higher expression in ‘BJ2-7’ (Figure 7B).
In the case of RDR genes, drought stress induced the expression of PpRDR1b, PpRDR1c, and PpRDR1f in the leaves but inhibited them in the roots of both cultivars (Figure 7C). Interestingly, the expression levels of PpRDR1b and PpRDR1f in the leaves, and PpRDR1c in the roots, were significantly higher in ‘BJ2-7’ compared to ‘SN’. Although PpRDR2 expression was induced by drought stress in both cultivars, it was inhibited in the leaves of ‘BJ2-7’ while unaffected in ‘SN’. Furthermore, drought stress inhibited the expression of PpRDR4 in the leaves of both cultivars, whereas its expression was induced only in the roots of ‘BJ2-7’ but inhibited in ‘SN’ (Figure 7C). These results highlight the differential responses of AGO, DCL, and RDR genes to drought stress in peach cultivars with varying tolerance levels, providing valuable insights into their roles in drought adaptation mechanisms.

2.8. Analysis of Plant Biomass, Electrolyte Leakage (EL), Proline Content, and Total Soluble Sugars Content in Peach Cultivars under Drought Stress

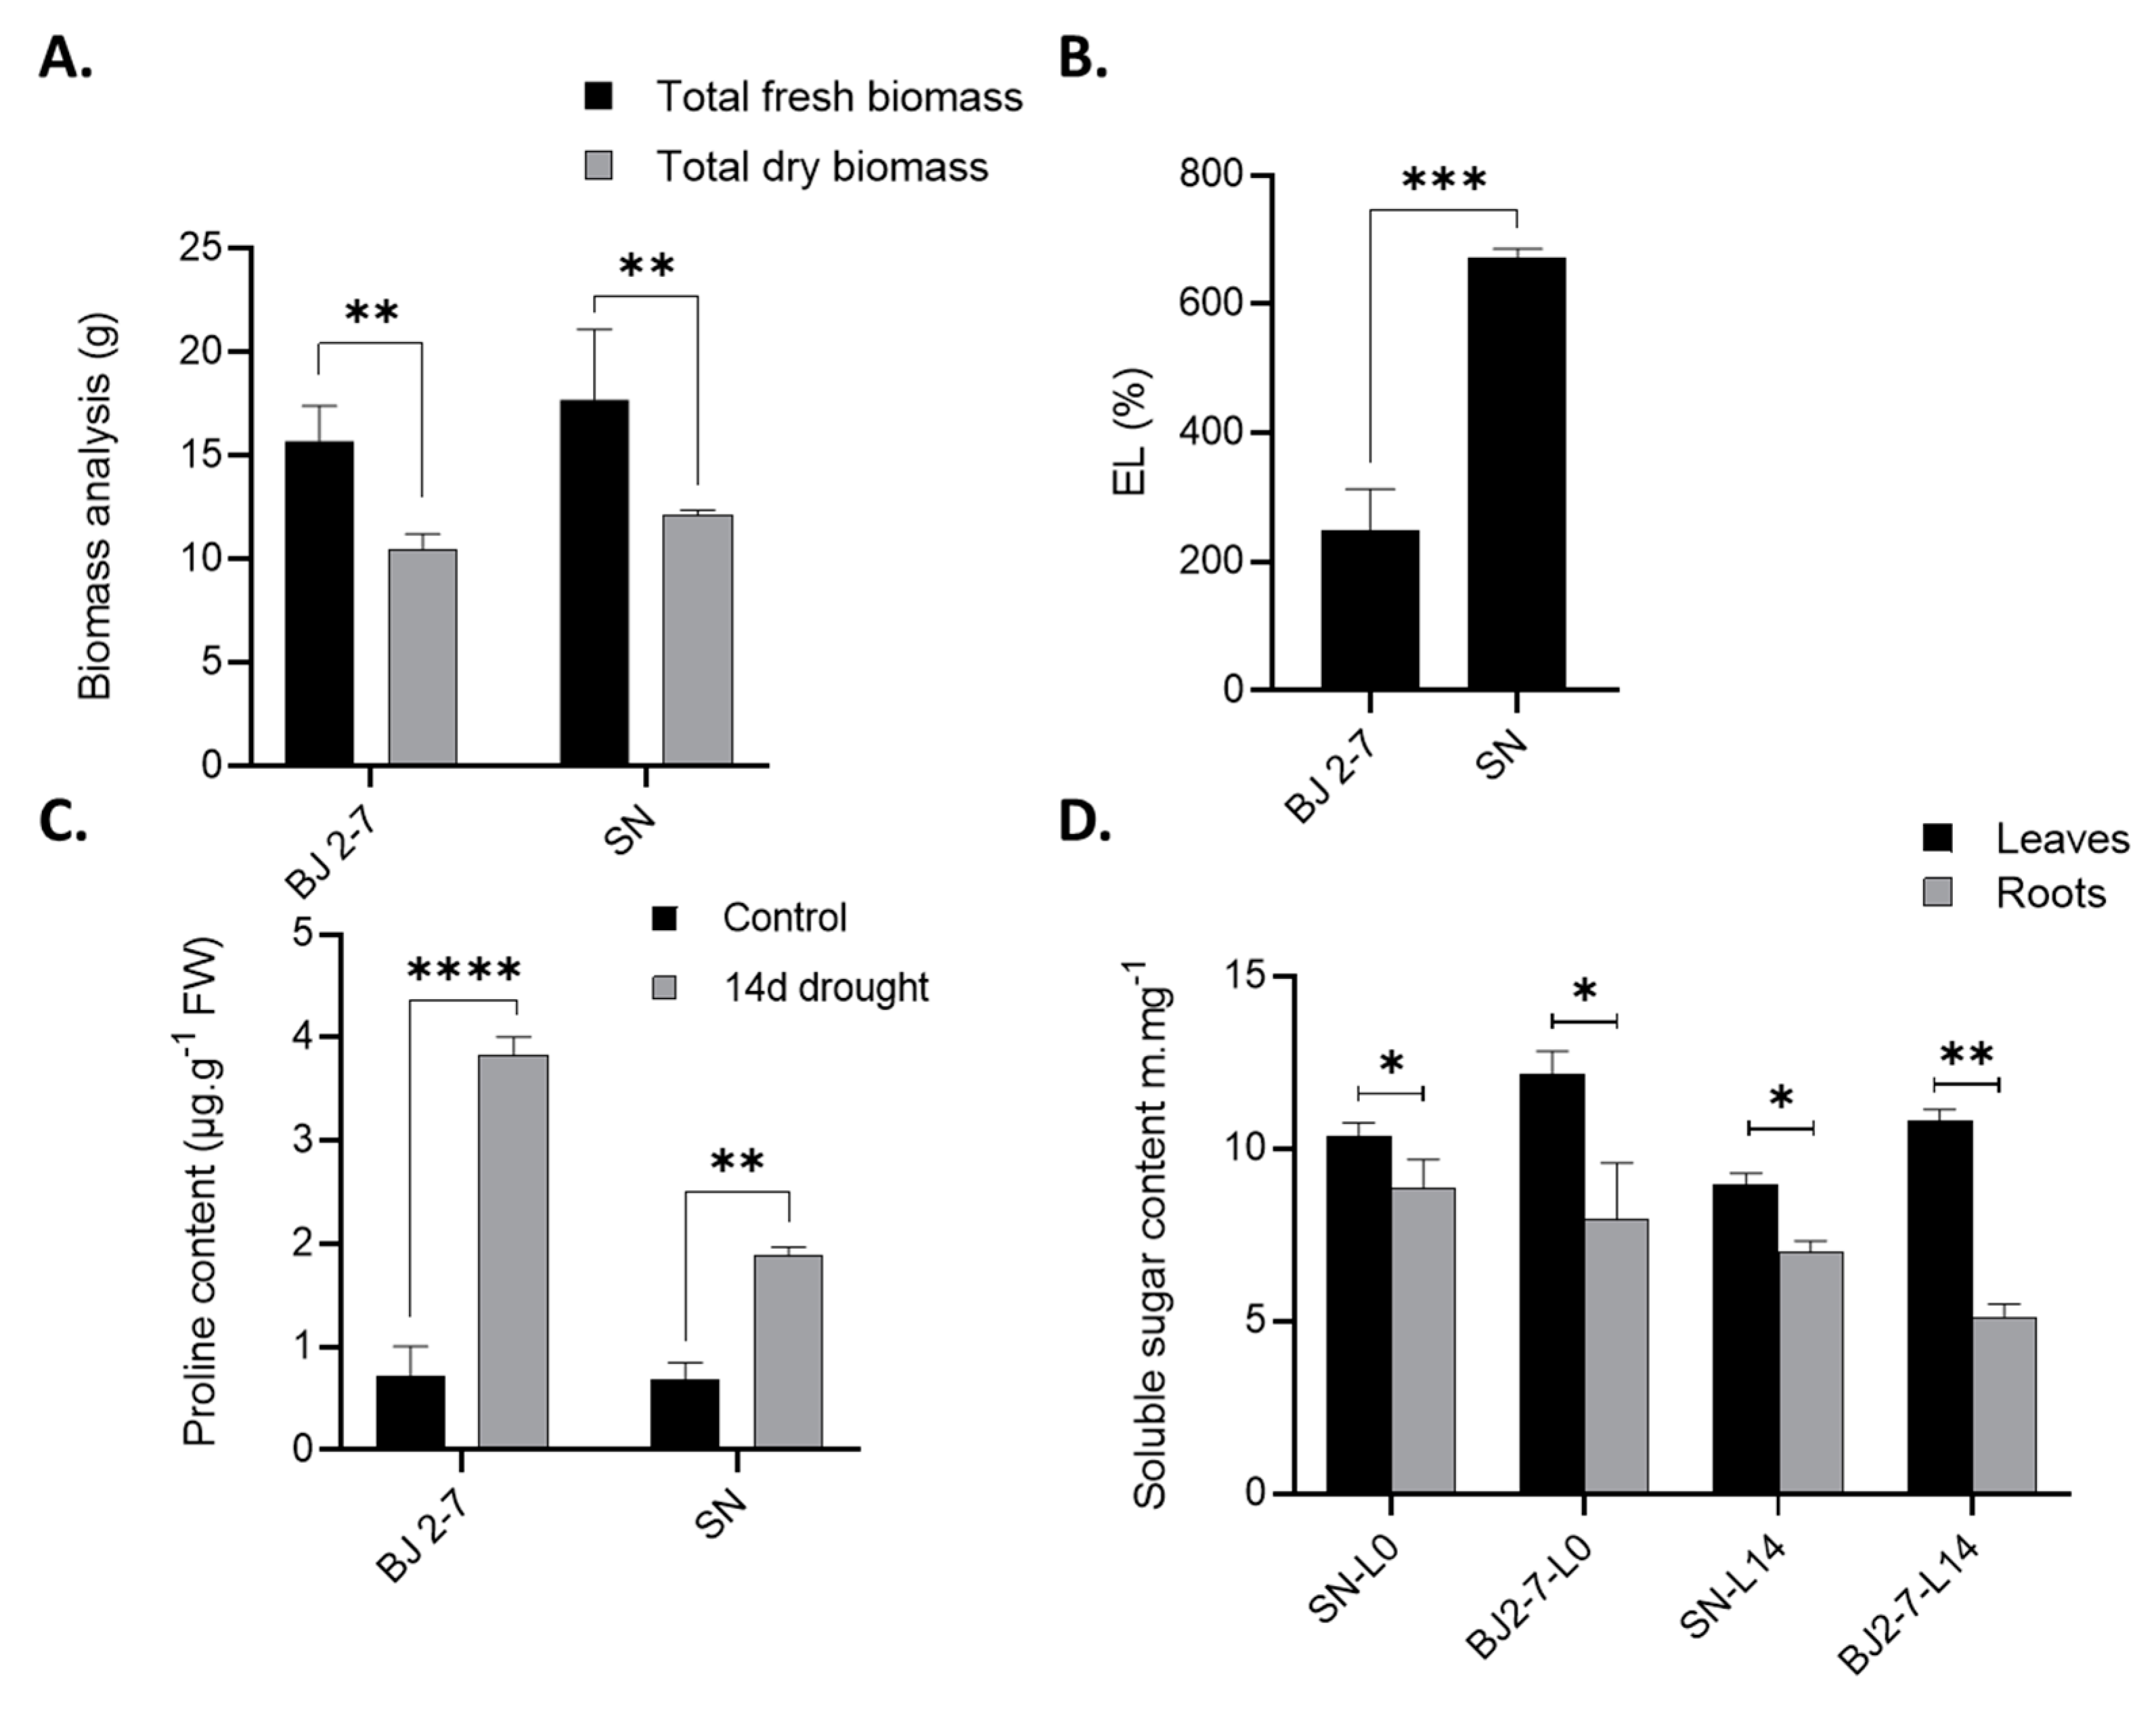
The physiological and biochemical analyses revealed that the Chinese peach cultivar ‘BJ2-7’ exhibits greater drought resistance compared to the Egyptian peach cultivar ‘SN’. As illustrated in Figure 8, ‘SN’ exhibited a substantial biomass decrease (48.8%) under drought stress, whereas ‘BJ2-7’ showed a much lower reduction (10.7%). Additionally, the results of electrolyte leakage (EL) indicated weakened cell wall integrity under severe drought conditions, with a significant increase observed after 14 days. EL percentage was notably higher in the ‘SN’ cultivar compared to ‘BJ2-7’, suggesting greater tissue damage in ‘SN’ under drought conditions. Furthermore, Figure 8C shows that ‘BJ2-7’ recorded the highest proline content after 14 days of drought stress (3.85 µg/g), while ‘SN’ exhibited the lowest proline levels during the same period.
To investigate how drought affects sugar metabolism and distribution between leaves and roots in peach cultivars ‘SN’ and ‘BJ2-7’, we analyzed the total soluble sugar content. Interestingly, under 14 days of drought stress, ‘BJ2-7’ exhibited higher accumulation of total soluble sugars in its leaves compared to ‘SN’. Conversely, in the roots, ‘SN’ showed a higher accumulation of total soluble sugars compared to ‘BJ2-7’ (Figure 8D). Under control conditions, ‘BJ2-7’ accumulated significantly more total soluble sugars in its leaves compared to ‘SN’, whereas in roots, ‘SN’ accumulated more total soluble sugars compared to ‘BJ2-7’.

3. Discussion

Peach (P. persica L.) is a globally significant crop grown in temperate climates, yet its survival and productivity are vulnerable to environmental stresses [5,6]. Small RNAs (sRNAs) biogenesis genes play pivotal roles in regulating chromatin structure at the transcriptional level during plant growth and development [65,66]. Consequently, RNA silencing represents a conserved pathway essential for modulating growth, development, and responses to abiotic stresses [20,67]. Central to RNA silencing are key components including AGOs, DCLs, and RDRs. Despite the economic importance of peach, comprehensive studies elucidating its RNA silencing pathways and regulation have been lacking [33]. In this study, systematic genome-wide screening identified 11 AGOs, 8 DCLs, and 9 RDRs as candidate genes in peach. While these gene families have been extensively studied in other plants, their characterization in peach has been limited.
Recent genome-wide analyses and phylogenetic studies have identified a range of small RNA (sRNA) biogenesis genes across various plant species. For instance, diploid strawberry revealed 13 AGOs, six DCLs, and nine RDRs candidates [68], while tea exhibited 18 AGOs, five DCLs, and nine RDRs candidates in tea [69]. Similarly, banana showed 13 AGOs, three DCLs, and five RDRs candidate genes, and the modern sugarcane cultivar genome [70], contained 21 AGOs, four DCLs, and 11 RDRs candidates [71]. Sweet orange and pepper [72], also demonstrated diverse compositions with 13 AGOs, five DCLs, and seven RDRs candidates, and 12 AGOs, four DCLs, and six RDRs candidates [89], respectively. Across these studies, AGOs emerged as the predominant RNAi-related gene family members, followed by RDRs, whereas DCLs typically constituted a minority. These findings underscore the critical roles and evolutionary variations of sRNAs biogenesis genes in plants, highlighting their importance in RNA silencing pathways and adaptive responses to environmental challenges.
The chromosomal localization of the 28 Prupe-sRNA biogenesis genes revealed an uneven distribution across eight peach chromosomes. To analyze duplication patterns, we conducted phylogenetic analysis, identified functional domains and conserved motifs, and performed orthologous similarity assessments. Phylogenetic analysis indicated that PpAGOs segregate into three clades, a pattern consistent with earlier findings [19] and comparable to those observed in the Arabidopsis genome, suggesting highly conserved clade sizes between these two plant species. In our study, we identified a total of 97 AGOs, including 11 genes from the peach genome (PpAGOs), alongside counterparts from seven other Rosaceae species. Physicochemical analysis encompassed parameters such as isoelectric point (pI range: 8.5 to 9.8), molecular weight (MW range: 97.8 to 121.6), and sequence length (base pairs: 3498 to 9382) as well as protein length (amino acids: 872 to 1102) for each identified gene. Phylogenetic analysis of peach AGO genes delineated three primary clades. Notably, PpAGO8 and PpAGO9 were clustered with PpAGO4, while PpAGO4 itself clustered with three other genes (Prupe.2G056700, Prupe.2G056600, and Prupe.6G154800). Arabidopsis AGO3 did not align with any counterparts but clustered with AGO2, which in turn showed two PpAGO2 genes (Prupe.4G108100 and Prupe.4G108000). AGO1 was split into two duplicated PpAGO1 genes in our analysis. Additionally, the clades PpAGO5, PpAGO6, PpAGO7, and PpAGO10 each contained a single gene. Analysis of conserved functional motifs across peach and Arabidopsis revealed that the MID domain involved in sRNA-target interaction was conserved in all identified PpAGO proteins. Furthermore, PAZ, PIWI domain catalytic, H residue, and QF-V motifs were also identified. Chromosomal mapping of PpAGO genes showed uneven distribution across six peach chromosomes, with chromosomes 7 and 8 lacking PpAGO gene members entirely. Also, in our study, we identified 77 RDRs across the genomes of eight Rosaceae species, analyzing their fundamental genomic characteristics and gene expression patterns. This represents the first comprehensive genome-wide analysis and evolutionary study of sRNA biogenesis, employing phylogenetic classifications, chromosomal locations, gene structure, and conserved motif analysis. Functional predictions were made by aligning conserved motifs, which were validated through gene regulation and RNA expression studies.
To investigate the regulation of the RNA silencing pathway, we conducted experimental analysis of gene transcriptional changes in response to drought stress treatments. Gene expression was analyzed using FPKM values and quantitative qRT-PCR across different peach tissues. Our findings demonstrate dynamic regulation of RNA silencing, suggesting its potential involvement in coordinating peach development and environmental adaptation. In summary, this study provides crucial insights into peach RNA silencing components, laying a foundation for selecting candidate factors and conducting detailed functional and mechanistic studies in the future.
The data presented offers valuable insights into the molecular evolution of AGO, DCL, and RDR genes within Rosaceae genomes, particularly in P. persica. This information enhances our understanding of how these mechanisms function to mitigate drought effects in plants. Additionally, it sheds light on the evolutionary history of these genes across various species within the Rosaceae family. This knowledge is pivotal for elucidating the adaptive strategies employed by peach and related species to cope with environmental stresses, contributing to broader agricultural and ecological applications.

4. Materials and Methods

4.1. Identification and Characterization of AGO, DCL and RDR Genes in Rosaceae

The amino acid sequences of Arabidopsis AGO, DCL, and RDR genes were downloaded from the TAIR database (https://www.Arabidopsis.org/). Orthologous AGO, DCL, and RDR protein sequences from seven other Rosaceae species, including strawberry (F. vesca) [73], China rose (R. chinensis) [74,75], black raspberry (R. occidentalis) [76], apple (Malus × domestica) [77], pear (P. communis) [78], almond (P. dulcis) [79], and Armenian plum (P. armeniaca) [80], were retrieved from the GDR (http://www.rosaceae.org/) and Phytozome (https://phytozome-next.jgi.doe.gov/) databases [1,81]. The genome-wide prediction of peach AGO, DCL, and RDR genes was performed using HMMER 3.0 software (http://hmmer.janelia.org/) within the GDR platform. All identified AGO, DCL, and RDR genes were validated using the Conserved Domain Database (CDD) at the National Center for Biotechnology Information (NCBI) (https://www.ncbi.nlm.nih.gov/). Hidden Markov Models (HMM) and the Pfam protein family database (Pfam v3.1) [82] were employed to identify and annotate conserved domains within all protein sequences. The physicochemical properties of the identified peach AGO, DCL, and RDR genes, such as isoelectric point (pI), molecular weight (MW), and instability index, were calculated using Geneious Prime software [83].

4.2. Multiple Sequence Alignments and Phylogenetic Analysis of AGO, DCL and RDR Genes in Peach

The multiple sequence alignments of AGO, DCL, and RDR proteins from P. persica and Arabidopsis genomes were conducted using Clustal-W [84] within MEGA 11.0 software [85] with default parameters. The final sequences were validated and compiled using Geneious Prime software by comparing them against their respective homologs in the NCBI database. Subsequently, a neighbor-joining (NJ) phylogenetic tree [86] was constructed based on the protein sequences with 1,000 bootstrap replicates [87] in MEGA to determine their evolutionary relationships. The evolutionary distances were computed using the Equal Input method [88].

4.3. Chromosomal Localization, Gene Structure, and Motif Analysis in Peach

The peach AGO, DCL, and RDR genes were positioned on the P. persica chromosomes using MapGene2 Chromosome V2 (http://mg2c.iask.in/mg2c/v2.0/) based on their genomic coordinates, and subsequently visualized using TBtools software [89]. For conserved motif analysis, known protein domains were identified using the SMART web server (http://smart.embl-heidelberg.de). Additionally, conserved motifs were predicted using the MEME web server (http://meme-suite.org/tools/meme) [90] with parameters set to an optimum motif width of 6≤n≤200 and a maximum number of motifs of five. The identified motifs were annotated using Pfam [82,91].

4.4. Orthologous Similarity, Collinearity, and Cis-regulatory Elements Analysis for RNAi-Related Genes in Peach

The percentage similarity and identity between peach and Arabidopsis AGO, DCL, and RDR protein sequences were computed using the Ident and Sim online sequence manipulation tool (http://www.bioinformatics.org/sms2/ident_sim.html) [92]. Collinearity between the two genomes was assessed using the MCScanX program [93], with analyses conducted to identify segmental and tandem duplications that contribute to genome evolution. Synonymous (Ks) and non-synonymous (Ka) substitution rates for homologous AGO, DCL, and RDR gene pairs were calculated using DnaSP v6.12.03 software [94]. The TBtools software [89] was utilized to visualize segmentally and tandemly duplicated genome regions. Additionally, cis-elements within the 2 kb regions upstream of AGO, DCL, and RDR genes were screened using PlantCARE (http://bioinformatics.psb.ugent.be/webtools/Plantcare/html/) (accessed on April 2023) [95], and all results were visualized using TBtools.

4.5. Expression Analysis and qRT-PCR Validation

The transcriptome data from the published Bioprojects PRJNA694331 and PRJNA694007 were utilized to assess the FPKM profiles of AGO, DCL, and RDR genes across various peach tissues (leaf, root, flowers, phloem, seeds, and fruits) under drought stress conditions at multiple time points (0-, 6-, 12-, 24-, and 36-hours, as well as 2-, 4-, 5-, 6-, 9-, 12-, and 14-days).Heatmaps visualizing these expression profiles were generated using TBtools [89].
To validate the expression of these candidate genes under drought stress, two peach cultivars with contrasting drought tolerance levels were studied: the drought-resistant cultivar ‘BJ2-7’ and the drought-susceptible cultivar ‘SN’. Seedlings of these cultivars were grown in a controlled environment for 3 months under specific light and temperature conditions with regular watering. Subsequently, the seedlings were subjected to drought stress by withholding water for 14 days, while control plants were maintained under regular watering conditions. Leaf (L) and root (R) samples were collected from each cultivar, immediately frozen in liquid nitrogen, and stored at -80°C until RNA extraction.
Total RNA was extracted from the leaf and root samples using the Magen RNA Extraction Kit (Magen Bio, China), treated with RNase-free DNase I (Promega, USA) to eliminate genomic DNA contamination, and assessed for purity and concentration using a NanoDrop 2000 spectrophotometer (Thermo Scientific). First-strand cDNA synthesis was performed using M-MLV reverse transcriptase (Promega, USA) according to the manufacturer’s instructions.
Gene-specific primers for AGO, DCL, and RDR genes were designed based on NCBI sequences. All the primers used in this study are shown in Table S4. Quantitative real-time PCR (qRT-PCR) analysis was conducted using a qTOWER3.4 system (Analytik Jena, Germany) with Roche LightCycler480 SYBR Green I Master kits. The qRT-PCR reactions were performed in triplicate with biological replicates, and gene expression levels were normalized to the internal control gene PpACTIN (Prupe.8G132000) using the 2−ΔΔCt method [96].

4.6. Plants Physiological and Biochemical Evaluations

To evaluate the response of two peach cultivars to drought stress, plants were subjected to a 14-day drought treatment, with three plants randomly selected from each treatment (drought-stressed) and control group. The leaves and roots of selected plants were harvested. Roots were washed with distilled water and separated from the shoots. The fresh weights of roots and shoots were measured using an analytical balance (precision 0.0001 g). After drying the shoot and root in an oven at 80°C for 24 hours, their dry weights were measured to calculate total biomass: Total fresh biomass (g) = shoot fresh weight + root fresh weight and Total dry biomass (g) = shoot dry weight + root dry weight.
Electrolyte Leakage (EL) was assessed by collecting 0.5 g of fresh peach seedling leaves, which were washed three times with deionized water and transferred to 50 mL plastic centrifuge tubes with 15 mL of deionized water. After incubating for 12 hours at room temperature on a conical shaker, initial conductivity (EL1) was measured using a JENCO-3173 conductivity meter (Jenco Instruments, Inc., San Diego, CA, USA). To release all electrolytes, leaves were autoclaved at 121°C for 30 minutes, cooled, and the final conductivity (EL2) was measured. Relative EL was calculated as: EL (%) = (EL1/EL2) × 100.
Sugar quantification (glucose, fructose, sucrose) was performed using High-performance Liquid Chromatography (HPLC; Shimadzu, Japan) coupled with a refractive index detector (RID-10 AL). The extraction involved sealing samples in plastic film and immersing them in boiling water for 30 minutes. Supernatants were collected twice, mixed, and analyzed after adding Anthrone reagent and sulfuric acid, followed by absorbance measurement at 620 nm to determine total soluble sugar concentration.
Proline content was determined according to established methods using the acid ninhydrin test. Samples were processed using a standard proline curve, and proline concentrations were quantified to assess stress response in peach cultivars under drought conditions.

Supplementary Materials

The following supporting information can be downloaded at: www.mdpi.com/xxx/s1, Figure S1: Cis-elements in the 2kb upstream region of the RNAi-related genes. A. Cis-elemets for PpAGO B. Cis-elemets for PpDCL C. Cis-elemets for PpRDR. Different colors in the left lines indicate different types of cis-elements. The color intensity and number in the cells indicated the number of cis-element in these genes; Figure S2: Tissues and temporal FPKM expression trends. FPKM analysis of PpAGO (A, B), PpDCL (Figure S1), and PpRDR (C, D) genes in various peach tissues under drought stress. Left panels show high expression levels of PpAGO, PpDCL, and PpRDR genes observed in peach seeds, fruits, roots, leaves, phloem, and flowers. Right panels depict temporal expression trends of AGO, DCL, and RDR genes in the fruit flesh of P. persica exposed to drought stress over a 14-day period, with 0h as the control. Expression profiles are categorized into three clusters (EC1, EC2, and EC3) based on standardized relative expression levels. RNA data were used to assess the expression of PpAGO, PpDCL, and PpRDR genes; Table S1: Physicochemical characterization of Rosaceae AGO genes; Table S2: The detailed information of DCL genes among five Rosaceae genomes, Table S3: The RDR proteins profiles in seven Rosaceae species, Table S4: qRT-PCR primers used to validate the expression levels of PpAGO, PpDCL, PpRDR genes., Table S5: Preparation of proline standard curves.

Author Contributions

Conceptualization, M.B. and Y.C.; methodology, M.B., M.D., and M.M.; Software, M.B., M.M. and M.W.; resources, C.N.; validation, E.N. and C.S.; formal analysis, M.B. and M.W.; investigation, M.B. and M.E.; data curation, M.B., M.D. and C.O.; writing—original draft preparation, M.B., M.W., and C.O.; writing—review and editing, M.B., M.W., M.M., E.N., and W.Z.; visualization, M.B., M.M. and M.E.; supervision, E.N. and Y.H.; project administration and funding acquisition, Y.H. All authors have read and agreed to the published version of the manuscript.

Funding

This project was financially supported by the National Natural Science Foundation of China (U23A20206 and 32272687), the Key Special Project of Intergovernmental International Cooperation of the National Key R&D Program of China (2023YFE0125100), and the China Agriculture Research System (CARS-30).

Data Availability Statement

All data can be found online in the main text and supporting information materials. The RNA-seq data can be found in the Sequence Read Archive (SRA) database with accession numbers of PRJNA694007 and PRJNA694331.

Acknowledgments

This project was supported by funds received from the China Agriculture Research System (grant no. CARS-30). We would like to appreciate the kind efforts of Heng Sun from “Aquatic Plant Research Center”, Wuhan Botanical Garden, Chinese Academy of Sciences, and we appreciate the valuable efforts and his kind collaboration. Authors would like to thank Fundacion Seneca (Region de Murcia, Spain) for supporting M.M (Ref. 22416/SF/23).

Conflicts of Interest

The authors declare no conflict of interest.

References

  1. Verde, I.; Abbott, A.G.; Scalabrin, S.; Jung, S.; Shu, S.; Marroni, F.; Zhebentyayeva, T.; Dettori, M.T.; Grimwood, J.; Cattonaro, F.; et al. The high-quality draft genome of peach (Prunus persica) identifies unique patterns of genetic diversity, domestication and genome evolution. Nat Genet 2013, 45, 487–494. [Google Scholar] [CrossRef] [PubMed]
  2. Cao, K.; Zheng, Z.; Wang, L.; Liu, X.; Zhu, G.; Fang, W.; Cheng, S.; Zeng, P.; Chen, C.; Wang, X. Comparative population genomics reveals the domestication history of the peach, Prunus persica, and human influences on perennial fruit crops. Genome Biol. 2014, 15, 1–15. [Google Scholar] [CrossRef] [PubMed]
  3. Byrne, D.H.; Raseira, M.B.; Bassi, D.; Piagnani, M.C.; Gasic, K.; Reighard, G.L.; Moreno, M.A.; Pérez, S. Peach. Fruit Breed. 2012, 505–569. [Google Scholar]
  4. Arús, P.; Verde, I.; Sosinski, B.; Zhebentyayeva, T.; Abbott, A.G. The peach genome. Tree Genet. Genomes 2012, 8, 531–547. [Google Scholar] [CrossRef]
  5. Rahmati, M.; Vercambre, G.; Davarynejad, G.; Bannayan, M.; Azizi, M.; Genard, M. Water scarcity conditions affect peach fruit size and polyphenol contents more severely than other fruit quality traits. J Sci Food Agric 2014, 95, 1055–1065. [Google Scholar] [CrossRef] [PubMed]
  6. Haider, M.S.; Kurjogi, M.M.; Khalil-ur-Rehman, M.; Pervez, T.; Songtao, J.; Fiaz, M.; Jogaiah, S.; Wang, C.; Fang, J. Drought stress revealed physiological, biochemical and gene-expressional variations in ‘Yoshihime’ peach (Prunus Persica L) cultivar. J. Plant Interact. 2018, 13, 83–90. [Google Scholar] [CrossRef]
  7. Belal, M.A.; El-Alakmy, H.A.; Abdelhameed, A.A.; Sourour, M.M.J.S.J.o.A.S. Influence of reducing irrigation rate and addition of super absorbent polymer on peach trees growth under north sinai conditions. 2017, 6, 249–258.
  8. Usman, M.; Bokhari, S.A.M.; Fatima, B.; Rashid, B.; Nadeem, F.; Sarwar, M.B.; Nawaz-ul-Rehman, M.S.; Shahid, M.; Ayub, C.M. Drought stress mitigating morphological, physiological, biochemical, and molecular responses of guava (psidium guajava L.) cultivars. Front. Plant Sci. 2022, 13, 878616. [Google Scholar] [CrossRef] [PubMed]
  9. Wang, Z.; Ni, L.; Hua, J.; Liu, L.; Yin, Y.; Li, H.; Gu, C. Transcriptome analysis reveals regulatory framework for salt and drought tolerance in Hibiscus hamabo siebold & zuccarini. Forests 2021, 12, 454. [Google Scholar] [CrossRef]
  10. Talebizadeh, Z. Regulation of Gene Expression by Small RNAs. Am. J. Hum. Genet. 2010, 86, 328–330. [Google Scholar] [CrossRef]
  11. Hutvágner, G.; Zamore, P.D. RNAi: nature abhors a double-strand. Curr. Opin. Genet. Dev. 2002, 12, 225–232. [Google Scholar] [CrossRef]
  12. Fang, X.; Qi, Y. RNAi in plants: an argonaute-centered view. Plant Cell 2016, 28, 272–285. [Google Scholar] [CrossRef] [PubMed]
  13. Khare, T.; Shriram, V.; Kumar, V. RNAi technology: the role in development of abiotic stress-tolerant crops. In Biochemical, physiological and molecular avenues for combating abiotic stress tolerance in plants; Elsevier: 2018; pp. 117–133.
  14. Bai, M.; Yang, G.S.; Chen, W.T.; Mao, Z.C.; Kang, H.X.; Chen, G.H.; Yang, Y.H.; Xie, B.Y. Genome-wide identification of Dicer-like, Argonaute and RNA-dependent RNA polymerase gene families and their expression analyses in response to viral infection and abiotic stresses in Solanum lycopersicum. Gene 2012, 501, 52–62. [Google Scholar] [CrossRef] [PubMed]
  15. Borges, F.; Martienssen, R.A. The expanding world of small RNAs in plants. Nat. Rev. Mol. Cell Biol. 2015, 16, 727–741. [Google Scholar] [CrossRef]
  16. Noronha Fernandes-Brum, C.; Marinho Rezende, P.; Cherubino Ribeiro, T.H.; Ricon de Oliveira, R.; Cunha de Sousa Cardoso, T.; Rodrigues do Amaral, L.; de Souza Gomes, M.; Chalfun-Junior, A. A genome-wide analysis of the RNA-guided silencing pathway in coffee reveals insights into its regulatory mechanisms. PLoS One 2017, 12, e0176333. [Google Scholar] [CrossRef]
  17. Ruiz-Ferrer, V.; Voinnet, O. Roles of plant small RNAs in biotic stress responses. Annu Rev Plant Biol 2009, 60, 485–510. [Google Scholar] [CrossRef] [PubMed]
  18. Das, S.; Swetha, C.; Pachamuthu, K.; Nair, A.; Shivaprasad, P.V. Loss of function of Oryza sativa Argonaute 18 induces male sterility and reduction in phased small RNAs. Plant Reprod 2020, 33, 59–73. [Google Scholar] [CrossRef]
  19. Li, Z.; Li, W.; Guo, M.; Liu, S.; Liu, L.; Yu, Y.; Mo, B.; Chen, X.; Gao, L. Origin, evolution and diversification of plant ARGONAUTE proteins. Plant J 2022, 109, 1086–1097. [Google Scholar] [CrossRef]
  20. Gelaw, T.A.; Sanan-Mishra, N. Non-coding RNAs in response to drought stress. Int. J. Mol. Sci. 2021, 22, 12519. [Google Scholar] [CrossRef]
  21. Budak, H.; Zhang, B. MicroRNAs in model and complex organisms. 2017, 17, 121–124.
  22. Tiwari, R.; Rajam, M.V. RNA-and miRNA-interference to enhance abiotic stress tolerance in plants. J. Plant Biochem. Biotechnol. 2022, 31, 689–704. [Google Scholar] [CrossRef]
  23. Saplaoura, E.; Kragler, F. Mobile Transcripts and Intercellular Communication in Plants. Enzymes 2016, 40, 1–29. [Google Scholar] [CrossRef]
  24. Kehr, J.; Kragler, F. Long distance RNA movement. New Phytol 2018, 218, 29–40. [Google Scholar] [CrossRef] [PubMed]
  25. Schaefer, M.; Nabih, A.; Spies, D.; Hermes, V.; Bodak, M.; Wischnewski, H.; Stalder, P.; Ngondo, R.P.; Liechti, L.A.; Sajic, T.; et al. Global and precise identification of functional miRNA targets in mESCs by integrative analysis. EMBO Rep 2022, 23, e54762. [Google Scholar] [CrossRef]
  26. Sokolowska, A.; Rugala, M.; Oracz, K. [ARGONAUTE proteins in cell biology and plant development]. Postep. Biochem 2022, 68, 310–320. [Google Scholar] [CrossRef]
  27. Vaucheret, H. Post-transcriptional small RNA pathways in plants: mechanisms and regulations. Genes Dev. 2006, 20, 759–771. [Google Scholar] [CrossRef] [PubMed]
  28. Chapman, E.J.; Carrington, J.C. Specialization and evolution of endogenous small RNA pathways. Nat. Rev. Genet. 2007, 8, 884–896. [Google Scholar] [CrossRef] [PubMed]
  29. Kapoor, M.; Arora, R.; Lama, T.; Nijhawan, A.; Khurana, J.P.; Tyagi, A.K.; Kapoor, S. Genome-wide identification, organization and phylogenetic analysis of Dicer-like, Argonaute and RNA-dependent RNA Polymerase gene families and their expression analysis during reproductive development and stress in rice. BMC Genom. 2008, 9, 451. [Google Scholar] [CrossRef] [PubMed]
  30. Qu, F.; Ye, X.; Morris, T.J. Arabidopsis DRB4, AGO1, AGO7, and RDR6 participate in a DCL4-initiated antiviral RNA silencing pathway negatively regulated by DCL1. Proc Natl Acad Sci U S A 2008, 105, 14732–14737. [Google Scholar] [CrossRef]
  31. Cao, Y.; Xu, X.; Jiang, L. Integrative analysis of the RNA interference toolbox in two Salicaceae willow species, and their roles in stress response in poplar (Populus trichocarpa Torr. & Gray). Int J Biol Macromol 2020, 162, 1127–1139. [Google Scholar] [CrossRef]
  32. Balassa, G.; Balassa, K.; Janda, T.; Rudnóy, S. Expression Pattern of RNA Interference Genes During Drought Stressand MDMV Infection in Maize. J. Plant Growth Regul. 2022, 41, 2048–2058. [Google Scholar] [CrossRef]
  33. Belal, M.A.; Ezzat, M.; Zhang, Y.; Xu, Z.; Cao, Y.; Han, Y. Integrative Analysis of the DICER-like (DCL) Genes From Peach (Prunus persica): A Critical Role in Response to Drought Stress. Front. Ecol. Evol. 2022, 10, 923166. [Google Scholar] [CrossRef]
  34. Ahmed, F.F.; Hossen, M.I.; Sarkar, M.A.R.; Konak, J.N.; Zohra, F.T.; Shoyeb, M.; Mondal, S. Genome-wide identification of DCL, AGO and RDR gene families and their associated functional regulatory elements analyses in banana (Musa acuminata). PLoS One 2021, 16, e0256873. [Google Scholar] [CrossRef]
  35. Wang, J.; Wang, Z.; Jia, C.; Miao, H.; Zhang, J.; Liu, J.; Xu, B.; Jin, Z. Genome-wide identification and transcript analysis of TCP gene family in Banana (Musa acuminata L.). Biochem. Genet. 2022, 60, 204–222. [Google Scholar] [CrossRef]
  36. Parker, J.S.; Barford, D. Argonaute: a scaffold for the function of short regulatory RNAs. Trends Biochem. Sci. 2006, 31, 622–630. [Google Scholar] [CrossRef] [PubMed]
  37. Vaucheret, H. Plant argonautes. Trends Plant Sci. 2008, 13, 350–358. [Google Scholar] [CrossRef]
  38. Hamar, E.; Szaker, H.M.; Kis, A.; Dalmadi, A.; Miloro, F.; Szittya, G.; Taller, J.; Gyula, P.; Csorba, T.; Havelda, Z. Genome-Wide Identification of RNA Silencing-Related Genes and Their Expressional Analysis in Response to Heat Stress in Barley (Hordeum vulgare L.). Biomolecules 2020, 10. [Google Scholar] [CrossRef] [PubMed]
  39. Hutvagner, G.; Simard, M.J. Argonaute proteins: key players in RNA silencing. Nat. Rev. Mol. Cell Biol. 2008, 9, 22–32. [Google Scholar] [CrossRef] [PubMed]
  40. Kwak, P.B.; Tomari, Y. The N domain of Argonaute drives duplex unwinding during RISC assembly. Nat. Struct. Mol. Biol. 2012, 19, 145–151. [Google Scholar] [CrossRef] [PubMed]
  41. Arribas-Hernández, L.; Marchais, A.; Poulsen, C.; Haase, B.; Hauptmann, J.; Benes, V.; Meister, G.; Brodersen, P. The slicer activity of ARGONAUTE1 is required specifically for the phasing, not production, of trans-acting short interfering RNAs in Arabidopsis. Plant Cell 2016, 28, 1563–1580. [Google Scholar] [CrossRef]
  42. Cerutti, L.; Mian, N.; Bateman, A. Domains in gene silencing and cell differentiation proteins: the novel PAZ domain and redefinition of the Piwi domain. Trends Biochem. Sci. 2000, 25, 481–482. [Google Scholar] [CrossRef]
  43. Jinek, M.; Doudna, J.A. A three-dimensional view of the molecular machinery of RNA interference. nature 2009, 457, 405–412. [Google Scholar] [CrossRef]
  44. Moazed, D. Small RNAs in transcriptional gene silencing and genome defence. Nature 2009, 457, 413–420. [Google Scholar] [CrossRef] [PubMed]
  45. Simon, B.; Kirkpatrick, J.P.; Eckhardt, S.; Reuter, M.; Rocha, E.A.; Andrade-Navarro, M.A.; Sehr, P.; Pillai, R.S.; Carlomagno, T. Recognition of 2′-O-methylated 3′-end of piRNA by the PAZ domain of a Piwi protein. Structure 2011, 19, 172–180. [Google Scholar] [CrossRef] [PubMed]
  46. Rivas, F.V.; Tolia, N.H.; Song, J.-J.; Aragon, J.P.; Liu, J.; Hannon, G.J.; Joshua-Tor, L. Purified Argonaute2 and an siRNA form recombinant human RISC. Nat. Struct. Mol. Biol. 2005, 12, 340–349. [Google Scholar] [CrossRef] [PubMed]
  47. Höck, J.; Meister, G. The Argonaute protein family. Genome Biol. 2008, 9, 1–8. [Google Scholar] [CrossRef] [PubMed]
  48. Mi, S.; Cai, T.; Hu, Y.; Chen, Y.; Hodges, E.; Ni, F.; Wu, L.; Li, S.; Zhou, H.; Long, C. Sorting of small RNAs into Arabidopsis argonaute complexes is directed by the 5′ terminal nucleotide. Cell 2008, 133, 116–127. [Google Scholar] [CrossRef] [PubMed]
  49. Frank, F.; Hauver, J.; Sonenberg, N.; Nagar, B. Arabidopsis Argonaute MID domains use their nucleotide specificity loop to sort small RNAs. EMBO J. 2012, 31, 3588–3595. [Google Scholar] [CrossRef] [PubMed]
  50. Thieme, C.J.; Schudoma, C.; May, P.; Walther, D. Give it AGO: The search for miRNA-Argonaute sorting signals in Arabidopsis thaliana indicates a relevance of sequence positions other than the 5′-position alone. Front. Plant Sci. 2012, 3, 272. [Google Scholar] [CrossRef]
  51. Niaz, S. The AGO proteins: an overview. Biol. Chem. 2018, 399, 525–547. [Google Scholar] [CrossRef] [PubMed]
  52. Bernstein, E.; Caudy, A.A.; Hammond, S.M.; Hannon, G.J. Role for a bidentate ribonuclease in the initiation step of RNA interference. Nature 2001, 409, 363–366. [Google Scholar] [CrossRef]
  53. Zhang, H.; Kolb, F.A.; Jaskiewicz, L.; Westhof, E.; Filipowicz, W. Single processing center models for human Dicer and bacterial RNase III. Cell 2004, 118, 57–68. [Google Scholar] [CrossRef]
  54. Wei, X.; Ke, H.; Wen, A.; Gao, B.; Shi, J.; Feng, Y. Structural basis of microRNA processing by Dicer-like 1. Nat. Plants 2021, 7, 1389–1396. [Google Scholar] [CrossRef] [PubMed]
  55. Baumberger, N.; Baulcombe, D. Arabidopsis ARGONAUTE1 is an RNA Slicer that selectively recruits microRNAs and short interfering RNAs. Proc. Natl. Acad. Sci. 2005, 102, 11928–11933. [Google Scholar] [CrossRef] [PubMed]
  56. Vaucheret, H.; Vazquez, F.; Crété, P.; Bartel, D.P. The action of ARGONAUTE1 in the miRNA pathway and its regulation by the miRNA pathway are crucial for plant development. Genes Dev. 2004, 18, 1187–1197. [Google Scholar] [CrossRef] [PubMed]
  57. Wang, Y.-X.; Liu, Z.-W.; Wu, Z.-J.; Li, H.; Wang, W.-L.; Cui, X.; Zhuang, J. Genome-wide identification and expression analysis of GRAS family transcription factors in tea plant (Camellia sinensis). Sci. Rep. 2018, 8, 3949. [Google Scholar] [CrossRef]
  58. Banerjee, J.; Sahoo, D.K.; Dey, N.; Houtz, R.L.; Maiti, I.B. An intergenic region shared by At4g35985 and At4g35987 in Arabidopsis thaliana is a tissue specific and stress inducible bidirectional promoter analyzed in transgenic Arabidopsis and tobacco plants. PLoS One 2013, 8, e79622. [Google Scholar] [CrossRef]
  59. Younger, P. Stedman's Medical Dictionary. Ref. Rev. 2007, 21, 41–42. [Google Scholar]
  60. Mainz, D.; Quadt, I.; Stranzenbach, A.K.; Voss, D.; Guarino, L.A.; Knebel-Mörsdorf, D. Expression and nuclear localization of the TATA-box-binding protein during baculovirus infection. J. Gen. Virol. 2014, 95, 1396–1407. [Google Scholar] [CrossRef] [PubMed]
  61. Howell, M.D.; Fahlgren, N.; Chapman, E.J.; Cumbie, J.S.; Sullivan, C.M.; Givan, S.A.; Kasschau, K.D.; Carrington, J.C. Genome-wide analysis of the RNA-DEPENDENT RNA POLYMERASE6/DICER-LIKE4 pathway in Arabidopsis reveals dependency on miRNA- and tasiRNA-directed targeting. Plant Cell 2007, 19, 926–942. [Google Scholar] [CrossRef] [PubMed]
  62. Garcia-Ruiz, H.; Takeda, A.; Chapman, E.J.; Sullivan, C.M.; Fahlgren, N.; Brempelis, K.J.; Carrington, J.C. Arabidopsis RNA-dependent RNA polymerases and dicer-like proteins in antiviral defense and small interfering RNA biogenesis during Turnip Mosaic Virus infection. Plant Cell 2010, 22, 481–496. [Google Scholar] [CrossRef]
  63. Martínez de Alba, A.E.; Moreno, A.B.; Gabriel, M.; Mallory, A.C.; Christ, A.; Bounon, R.; Balzergue, S.; Aubourg, S.; Gautheret, D.; Crespi, M.D. In plants, decapping prevents RDR6-dependent production of small interfering RNAs from endogenous mRNAs. Nucleic Acids Res. 2015, 43, 2902–2913. [Google Scholar] [CrossRef]
  64. Polydore, S.; Axtell, M.J. Analysis of RDR1/RDR2/RDR6-independent small RNAs in Arabidopsis thaliana improves MIRNA annotations and reveals unexplained types of short interfering RNA loci. Plant J 2018, 94, 1051–1063. [Google Scholar] [CrossRef] [PubMed]
  65. Yan, Y.; Ham, B.K. The Mobile Small RNAs: Important Messengers for Long-Distance Communication in Plants. Front Plant Sci 2022, 13, 928729. [Google Scholar] [CrossRef] [PubMed]
  66. Song, L.; Fang, Y.; Chen, L.; Wang, J.; Chen, X. Role of non-coding RNAs in plant immunity. Plant Commun. 2021, 2, 100180. [Google Scholar] [CrossRef] [PubMed]
  67. Brant, E.J.; Budak, H. Plant small non-coding RNAs and their roles in biotic stresses. Front. Plant Sci. 2018, 9, 1038. [Google Scholar] [CrossRef]
  68. Jing, X.; Xu, L.; Huai, X.; Zhang, H.; Zhao, F.; Qiao, Y. Genome-Wide Identification and Characterization of Argonaute, Dicer-like and RNA-Dependent RNA Polymerase Gene Families and Their Expression Analyses in Fragaria spp. Genes 2023, 14, 121. [Google Scholar] [CrossRef] [PubMed]
  69. Krishnatreya, D.B.; Baruah, P.M.; Dowarah, B.; Chowrasia, S.; Mondal, T.K.; Agarwala, N. Genome-wide identification, evolutionary relationship and expression analysis of AGO, DCL and RDR family genes in tea. Sci Rep 2021, 11, 8679. [Google Scholar] [CrossRef] [PubMed]
  70. Cui, D.L.; Meng, J.Y.; Ren, X.Y.; Yue, J.J.; Fu, H.Y.; Huang, M.T.; Zhang, Q.Q.; Gao, S.J. Genome-wide identification and characterization of DCL, AGO and RDR gene families in Saccharum spontaneum. Sci Rep 2020, 10, 13202. [Google Scholar] [CrossRef] [PubMed]
  71. Sabbione, A.; Daurelio, L.; Vegetti, A.; Talon, M.; Tadeo, F.; Dotto, M. Genome-wide analysis of AGO, DCL and RDR gene families reveals RNA-directed DNA methylation is involved in fruit abscission in Citrus sinensis. BMC Plant Biol 2019, 19, 401. [Google Scholar] [CrossRef]
  72. Qin, L.; Mo, N.; Muhammad, T.; Liang, Y. Genome-Wide Analysis of DCL, AGO, and RDR Gene Families in Pepper (Capsicum Annuum L.). Int J Mol Sci 2018, 19. [Google Scholar] [CrossRef]
  73. Jing, X.; Xu, L.; Huai, X.; Zhang, H.; Zhao, F.; Qiao, Y. Genome-Wide Identification and Characterization of Argonaute, Dicer-like and RNA-Dependent RNA Polymerase Gene Families and Their Expression Analyses in Fragaria spp. Genes 2023, 14, 121. [Google Scholar] [CrossRef]
  74. Lin, W.; Huang, J.; Xue, M.; Wang, X.; Wang, C.J.M.D.P.B. Characterization of the complete chloroplast genome of Chinese rose, Rosa chinensis (Rosaceae: Rosa). 2019, 4, 2984–2985.
  75. Hibrand Saint-Oyant, L.; Ruttink, T.; Hamama, L.; Kirov, I.; Lakhwani, D.; Zhou, N.-N.; Bourke, P.; Daccord, N.; Leus, L.; Schulz, D.J.N.p. A high-quality genome sequence of Rosa chinensis to elucidate ornamental traits. 2018, 4, 473–484.
  76. VanBuren, R.; Wai, C.M.; Colle, M.; Wang, J.; Sullivan, S.; Bushakra, J.M.; Liachko, I.; Vining, K.J.; Dossett, M.; Finn, C.E.; et al. A near complete, chromosome-scale assembly of the black raspberry (Rubus occidentalis) genome. Gigascience 2018, 7. [Google Scholar] [CrossRef] [PubMed]
  77. Bianco, L.; Cestaro, A.; Sargent, D.J.; Banchi, E.; Derdak, S.; Di Guardo, M.; Salvi, S.; Jansen, J.; Viola, R.; Gut, I.; et al. Development and validation of a 20K single nucleotide polymorphism (SNP) whole genome genotyping array for apple (Malus x domestica Borkh). PLoS One 2014, 9, e110377. [Google Scholar] [CrossRef] [PubMed]
  78. Qiao, X.; Li, M.; Li, L.; Yin, H.; Wu, J.; Zhang, S. Genome-wide identification and comparative analysis of the heat shock transcription factor family in Chinese white pear (Pyrus bretschneideri) and five other Rosaceae species. BMC Plant Biol 2015, 15, 12. [Google Scholar] [CrossRef] [PubMed]
  79. Alioto, T.; Alexiou, K.G.; Bardil, A.; Barteri, F.; Castanera, R.; Cruz, F.; Dhingra, A.; Duval, H.; Fernandez, I.M.A.; Frias, L.; et al. Transposons played a major role in the diversification between the closely related almond and peach genomes: results from the almond genome sequence. Plant J 2020, 101, 455–472. [Google Scholar] [CrossRef] [PubMed]
  80. Jiang, F.; Zhang, J.; Wang, S.; Yang, L.; Luo, Y.; Gao, S.; Zhang, M.; Wu, S.; Hu, S.; Sun, H.; et al. The apricot (Prunus armeniaca L.) genome elucidates Rosaceae evolution and beta-carotenoid synthesis. Hortic Res 2019, 6, 128. [Google Scholar] [CrossRef]
  81. Goodstein, D.M.; Shu, S.; Howson, R.; Neupane, R.; Hayes, R.D.; Fazo, J.; Mitros, T.; Dirks, W.; Hellsten, U.; Putnam, N. Phytozome: a comparative platform for green plant genomics. Nucleic Acids Res. 2012, 40, D1178–D1186. [Google Scholar] [CrossRef] [PubMed]
  82. Finn, R.D.; Bateman, A.; Clements, J.; Coggill, P.; Eberhardt, R.Y.; Eddy, S.R.; Heger, A.; Hetherington, K.; Holm, L.; Mistry, J. Pfam: the protein families database. Nucleic Acids Res. 2014, 42, D222–D230. [Google Scholar] [CrossRef] [PubMed]
  83. Kearse, M.; Moir, R.; Wilson, A.; Stones-Havas, S.; Cheung, M.; Sturrock, S.; Buxton, S.; Cooper, A.; Markowitz, S.; Duran, C. Geneious Basic: an integrated and extendable desktop software platform for the organization and analysis of sequence data. Bioinformatics 2012, 28, 1647–1649. [Google Scholar] [CrossRef]
  84. Thompson, J.D.; Higgins, D.G.; Gibson, T.J. CLUSTAL W: improving the sensitivity of progressive multiple sequence alignment through sequence weighting, position-specific gap penalties and weight matrix choice. Nucleic Acids Res. 1994, 22, 4673–4680. [Google Scholar] [CrossRef]
  85. Tamura, K.; Stecher, G.; Kumar, S. MEGA11: molecular evolutionary genetics analysis version 11. Mol. Biol. Evol. 2021, 38, 3022–3027. [Google Scholar] [CrossRef]
  86. Saitou, N.; Nei, M. The neighbor-joining method: a new method for reconstructing phylogenetic trees. Mol. Biol. Evol. 1987, 4, 406–425. [Google Scholar]
  87. Felsenstein, J. Confidence limits on phylogenies: an approach using the bootstrap. evolution 1985, 39, 783–791. [Google Scholar] [CrossRef]
  88. Tajima, F.; Nei, M. Estimation of evolutionary distance between nucleotide sequences. Mol. Biol. Evol. 1984, 1, 269–285. [Google Scholar]
  89. Chen, C.; Chen, H.; Zhang, Y.; Thomas, H.R.; Frank, M.H.; He, Y.; Xia, R. TBtools: an integrative toolkit developed for interactive analyses of big biological data. Mol. Plant 2020, 13, 1194–1202. [Google Scholar] [CrossRef]
  90. Bailey, T.L.; Johnson, J.; Grant, C.E.; Noble, W.S. The MEME suite. Nucleic Acids Res. 2015, 43, W39–W49. [Google Scholar] [CrossRef] [PubMed]
  91. Bateman, A.; Birney, E.; Durbin, R.; Eddy, S.R.; Finn, R.D.; Sonnhammer, E.L. Pfam 3.1: 1313 multiple alignments and profile HMMs match the majority of proteins. Nucleic Acids Res. 1999, 27, 260–262. [Google Scholar] [CrossRef] [PubMed]
  92. Stothard, P. The sequence manipulation suite: JavaScript programs for analyzing and formatting protein and DNA sequences. Biotechniques 2000, 28, 1102–1104. [Google Scholar] [CrossRef] [PubMed]
  93. Wang, Y.; Tang, H.; Debarry, J.D.; Tan, X.; Li, J.; Wang, X.; Lee, T.-h.; Jin, H.; Marler, B.; Guo, H. MCScanX: a toolkit for detection and evolutionary analysis of gene synteny and collinearity. Nucleic Acids Res. 2012, 40, e49. [Google Scholar] [CrossRef]
  94. Rozas, J.; Ferrer-Mata, A.; Sánchez-DelBarrio, J.C.; Guirao-Rico, S.; Librado, P.; Ramos-Onsins, S.E.; Sánchez-Gracia, A. DnaSP 6: DNA sequence polymorphism analysis of large data sets. Mol. Biol. Evol. 2017, 34, 3299–3302. [Google Scholar] [CrossRef]
  95. Rombauts, S.; Déhais, P.; Van Montagu, M.; Rouzé, P. PlantCARE, a plant cis-acting regulatory element database. Nucleic Acids Res. 1999, 27, 295–296. [Google Scholar] [CrossRef]
  96. Livak, K.J.; Schmittgen, T.D. Analysis of relative gene expression data using real-time quantitative PCR and the 2− ΔΔCT method. methods 2001, 25, 402–408. [Google Scholar] [CrossRef] [PubMed]
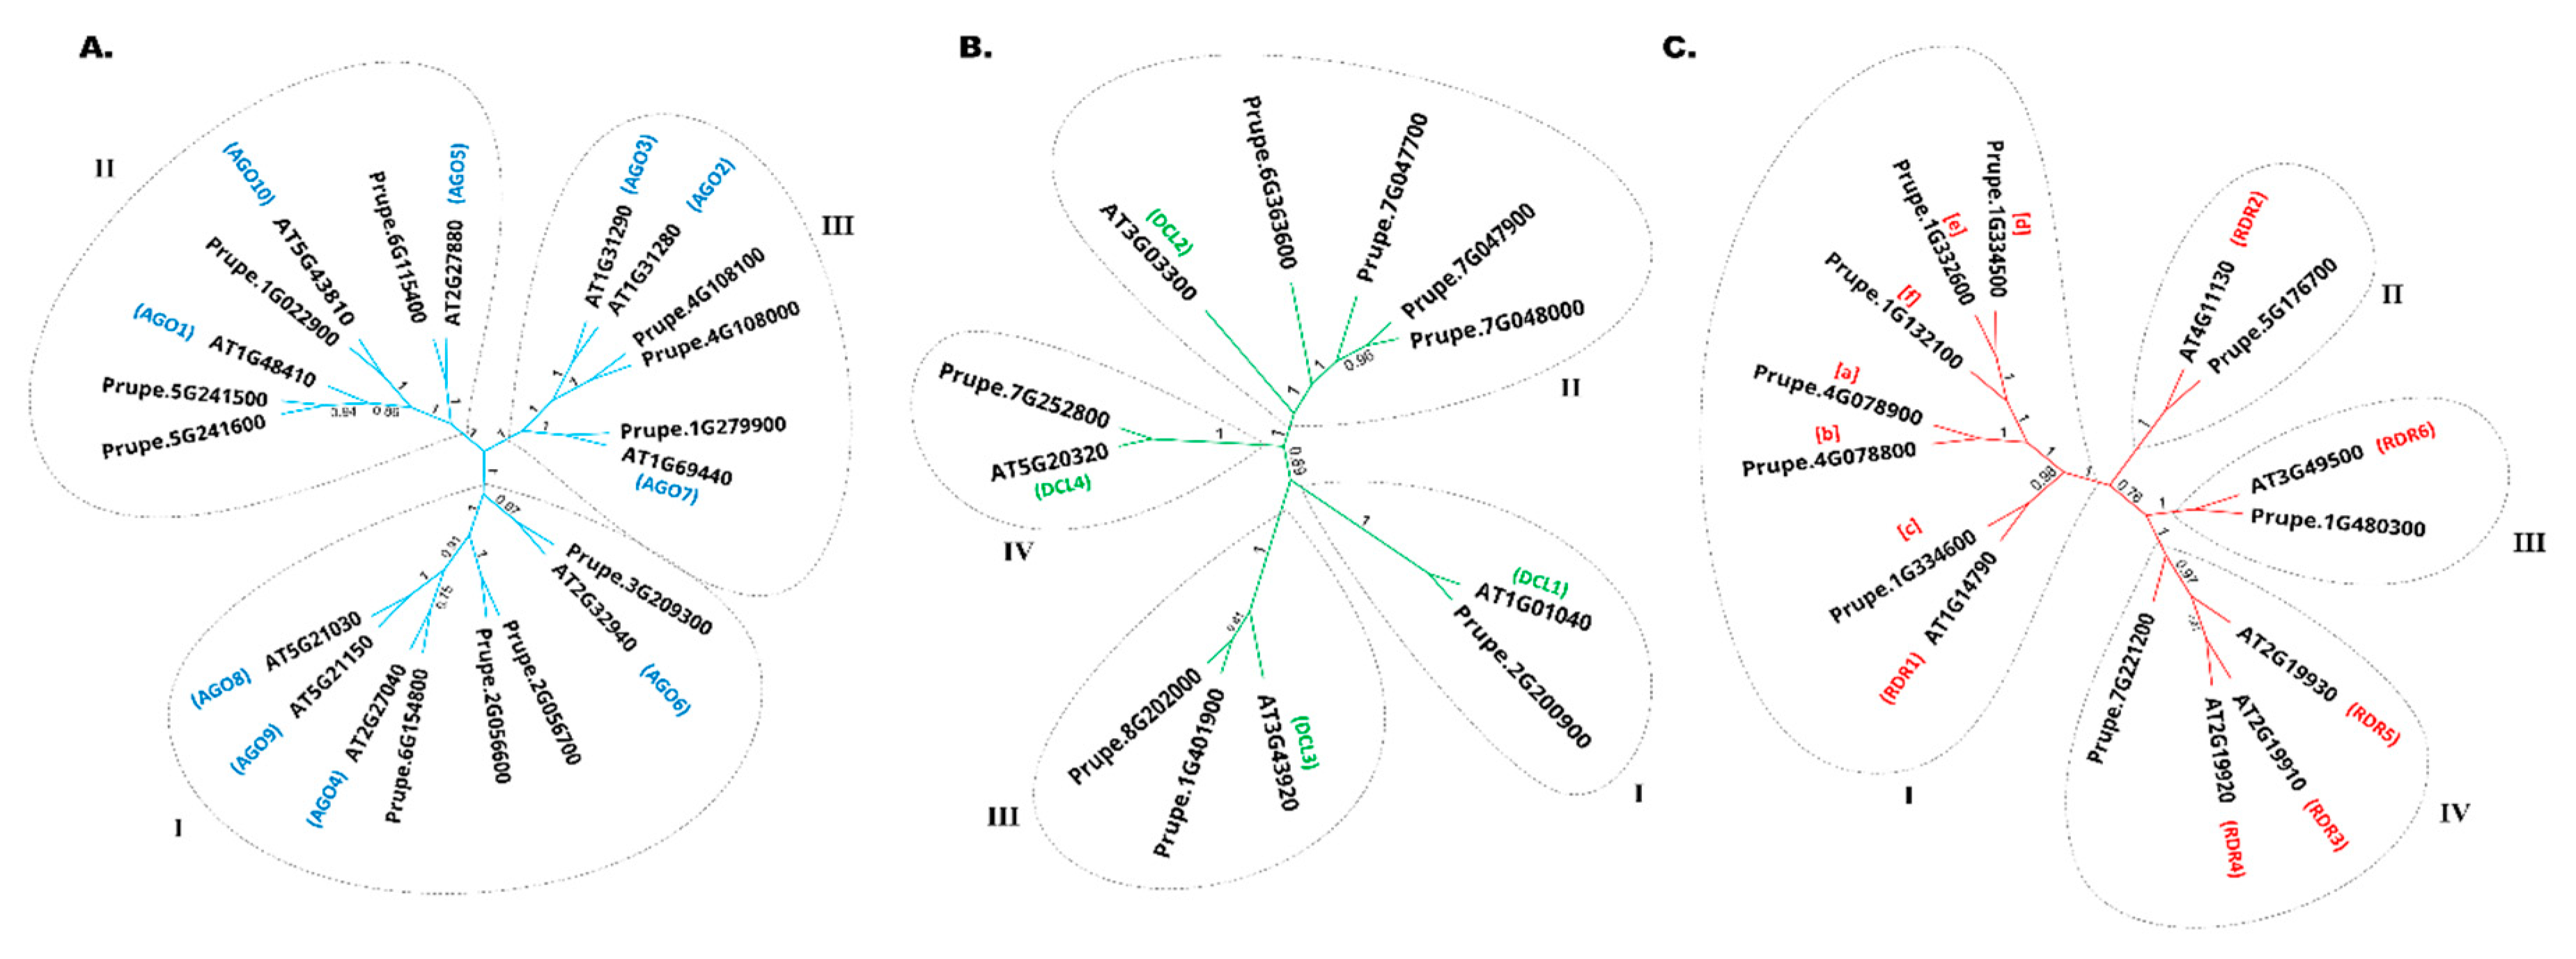
Figure 1. Phylogenetic analysis of peach AGOs, DCLs, and RDRs. (A) Phylogenetic tree for AGO proteins from P. persica and A. thaliana. (B) Phylogenetic tree for DCL proteins from P. persica and A. thaliana. (C) Phylogenetic tree for RDR proteins from P. persica. and A. thaliana. All the phylogenetic trees were constructed using the neighbor-joining method, and the numbers at the nodes indicate the percentages of bootstrap values from 1000 replications.
Preprints 112185 g001
Figure 2. Phylogenetic analysis and Genes chromosomal locations. (A) AGO protein family in Rosaceae. The AGO1/5/10, AGO2/3/7, AGO4/6/8/9 clades were named according to the 10 Arabidopsis AGOs. (B) RDR protein family in Rosaceae. The unrooted NJ tree was constructed in Geneious Prime 2023.1.1. with 1000 bootstrap replicates. RTL1 is rooted as an outgroup (No color). (C) Chromosomal location of PpAGOs, PpDCLs, and PpRDRs. Tandemly duplicated genes are shown in square parenthesis.
Preprints 112185 g002
Figure 3. Illustrates the gene structure and crystal modeling of PpAGO6 (A, B, and C), PpDCL4 (D, E, and F), and PpRDR2 (G, H, and I) proteins. (A) Schematic domain architecture of PpAGO6 proteins. (B) Assessment of inter-domain accuracy for PpAGO6, highlighting expected position errors at residues when aligned with true structures, indicating high prediction reliability (AlphaFold). (C) Representative crystal structure of full-length PpAGO6 protein. (D) Schematic domain architecture of PpDCL4 proteins. (E) Direct physical PPI fingerprint curves of Dicer protein homologs, distinguishing dimeric (blue) and tetrameric (green) quaternary structures critical for understanding molecular interactions and regulation, with differently colored boxes indicating motifs and their positions. (F) Representative crystal structure of full-length PpDCL4 protein. (G) Schematic domain architecture of PpRDR2 proteins. (H) Assessment of inter-domain accuracy for PpRDR2, showing expected position errors at residues when aligned, indicative of robust prediction of domain positions (AlphaFold). (I) Representative crystal structure of full-length PpRDR2 protein.
Preprints 112185 g003
Figure 4. Multiple sequence alignment results of AGOs, DCLs, and RDRs showing conserved bases in the motifs. The phylogenetic clades are shown on the left. (A) Functionally conserved positions within MID, PAZ, and PIWI domains of A. thaliana and peach AGO proteins. Residues within MID domain (indicated by red arrows) crucial for sRNA-target interaction (I996), 5′ terminal nucleotide selection (N991), and 5′-phosphate-binding (YKQK) residues. PIWI domain (blue arrows) highlights the catalytic tetrad (EHDDE) and QF-V motif. Residue numbers correspond to AtAGO1 amino acid positions. (B) Conservation of functionally critical amino acids between A. thaliana and peach DCL proteins. Conserved residues involved in enzyme catalysis within RNase IIIa (E1513, D1517, D1642, E1645; red arrows), RNase IIIb (E1737, D1741, D1745, E1838; green shading and arrows), and RNA-binding motifs (H-S motif; yellow shading and arrows). (C) Presence of functionally critical amino acid residues in peach RDR proteins. The catalytic domain (D[L/F]DGD) within RdRP is highlighted.
Preprints 112185 g004
Figure 5. Orthologous similarity and collinearity analysis of sRNA biogenesis genes in peach and Arabidopsis. (A) Circos plot depicting the similarity among identified AGO orthologs. (B) Circos plot illustrating the similarity among identified RDR orthologs. The highlighted arcs in the center of the Circos plots connect orthologous sRNA biogenesis genes. Interprotein arcs represent significant similarities with p-values <0.05, distinguished by red (>99% identity), brown (95–99%), and gray lines (90–95%) indicating tandem, WGD/segmental duplicates, and other similarities, respectively. (C) Genome-wide collinearity of AGOs (blue), DCLs (green), and RDRs (red) between Arabidopsis and peach chromosomes. Lines connect collinear blocks of gene pairs.
Preprints 112185 g005
Figure 6. Tissues and temporal FPKM expression trends. FPKM analysis of PpAGO (A, B), PpDCL (Figure S2), and PpRDR (C, D) genes in various peach tissues under drought stress. Left panels show high expression levels of PpAGO, PpDCL, and PpRDR genes observed in peach seeds, fruits, roots, leaves, phloem, and flowers. Right panels depict temporal expression trends of AGO, DCL, and RDR genes in the fruit flesh of P. persica exposed to drought stress over a 14-day period, with 0h as the control. Expression profiles are categorized into three clusters (EC1, EC2, and EC3) based on standardized relative expression levels. RNA data were used to assess the expression of PpAGO, PpDCL, and PpRDR genes.
Preprints 112185 g006
Figure 7. Relative expression of candidate genes in the leaves (-L) and roots (-R) of ‘BJ2-7’ and ‘SN’ peach cultivars under drought stress. (A) Expression of PpAGO genes. (B) Expression of PpDCL genes. (C) Expression of PpRDR genes. Plants were exposed to drought stress for 14 days, with control plants receiving regular watering. Data are presented as means ± standard errors (n=3). Asterisks indicate significant differences at *P < 0.05, **P < 0.01, and ***P < 0.001 based on Student's t-test.
Preprints 112185 g007
Figure 8. Physiological and biochemical traits analysis, Biomass analysis (A). Electrolyte leakage percentage (B). Proline content (C). Soluble sugar contents (D).
Preprints 112185 g008
Table 1. Genomic features and chemical properties of the predicted AGO, DCL and RDR proteins in peach.
Protein Name Assigned ID Location Genomic
(bp)
CDS
(bp)
Protein
(aa)
Mw
(kDa)
pI Source of Sequences
PpAGO1b Prupe.5G241600 Chr5 7872 3210 1069 118.5 9.6 NCBI
PpAGO1a Prupe.5G241500 Chr5 8521 3309 1102 121.6 9.7 NCBI
PpAGO2b Prupe.4G108100 Chr4 4728 3192 1063 110.8 8.7 NCBI
PpAGO2a Prupe.4G108000 Chr4 3499 2907 969 108.1 8.5 Phytozome
PpAGO4c Prupe.6G154800 Chr6 8919 2820 939 104.2 8.6 NCBI
PpAGO4a Prupe.2G056700 Chr2 8931 2736 911 101.7 9.5 NCBI
PpAGO4b Prupe.2G056600 Chr2 8406 2619 873 97.8 9.7 Phytozome
PpAGO5 X1* Prupe.6G115400 Chr6 7057 3012 1003 111.9 9.8 NCBI
PpAGO5 X2 2718 905 NCBI
PpAGO5 X3 2508 835 NCBI
PpAGO6 Prupe.3G209300 Chr3 7864 2697 898 100.3 8.7 NCBI
PpAGO7 X1 Prupe.1G279900 Chr1 4021 3042 1013 114.9 9.4 NCBI
PpAGO7 X2 3039 1012 NCBI
PpAGO10 Prupe.1G022900 Chr1 9159 2973 990 111.2 9.4 NCBI
PpDCL1 Prupe.2G200900 Chr2 10239 5916 1971 220.3 5.8 NCBI
PpDCL2a Prupe.7G048000 Chr7 4909 2346 781 88.9 6.3 NCBI
PpDCL2b Prupe.7G047900 Chr7 5286 2349 782 88.8 6.1 NCBI
PpDCL2c X1 Prupe.7G047700 Chr7 23773 2364 782 91.6 6.7 NCBI
PpDCL2c X2 2103 700 NCBI
PpDCL2 Prupe.6G363600 Chr6 10785 4191 1396 159.5 6.4 NCBI
PpDCL3a X1 Prupe.1G401900 Chr1 10655 5073 1690 183.7 6.1 NCBI
PpDCL3a X2 4935 1644 NCBI
PpDCL3a X3 4479 1492 NCBI
PpDCL3b Prupe.8G202000 Chr8 8675 5025 1674 194.6 6.5 NCBI
PpDCL4 X1 Prupe.7G252800 Chr7 13130 4926 1641 183.6 6.0 NCBI
PpDCL4 X2 4914 1637 NCBI
PpRDR1a X1 Prupe.4G078900 Chr4 4121 3435 1144 128.1 6.7 NCBI
PpRDR1a X2 3354 1117 NCBI
PpRDR1b Prupe.4G078800 Chr4 4871 3084 1028 117.0 7.4 Phytozome
PpRDR1c Prupe.1G334600 Chr1 5735 3372 1123 128.3 6.8 NCBI
PpRDR1d Prupe.1G334500 Chr1 4636 3315 1104 124.4 6.6 NCBI
PpRDR1e Prupe.1G332600 Chr1 5347 3774 1257 141.9 6.3 NCBI
PpRDR1f Prupe.1G132100 Chr1 2487 2127 709 79.8 6.5 Phytozome
PpRDR2 Prupe.5G176700 Chr5 7653 3357 1118 127.4 6.4 NCBI
PpRDR4 Prupe.7G221200 Chr7 9707 3240 1079 122.0 7.1 NCBI
PpRDR6 Prupe.1G480300 Chr1 6593 3591 1196 136.4 6.8 NCBI
*X represent different isoforms
Disclaimer/Publisher’s Note: The statements, opinions and data contained in all publications are solely those of the individual author(s) and contributor(s) and not of MDPI and/or the editor(s). MDPI and/or the editor(s) disclaim responsibility for any injury to people or property resulting from any ideas, methods, instructions or products referred to in the content.
Copyright: This open access article is published under a Creative Commons CC BY 4.0 license, which permit the free download, distribution, and reuse, provided that the author and preprint are cited in any reuse.
Prerpints.org logo

Preprints.org is a free preprint server supported by MDPI in Basel, Switzerland.

Subscribe

© 2024 MDPI (Basel, Switzerland) unless otherwise stated