Submitted:
15 July 2024
Posted:
15 July 2024
You are already at the latest version
Abstract
Keywords:
1. Introduction
2. Materials and Methods
2.1. Instrument Description
2.2. Photon Source
2.3. Processing and Sensing System Design
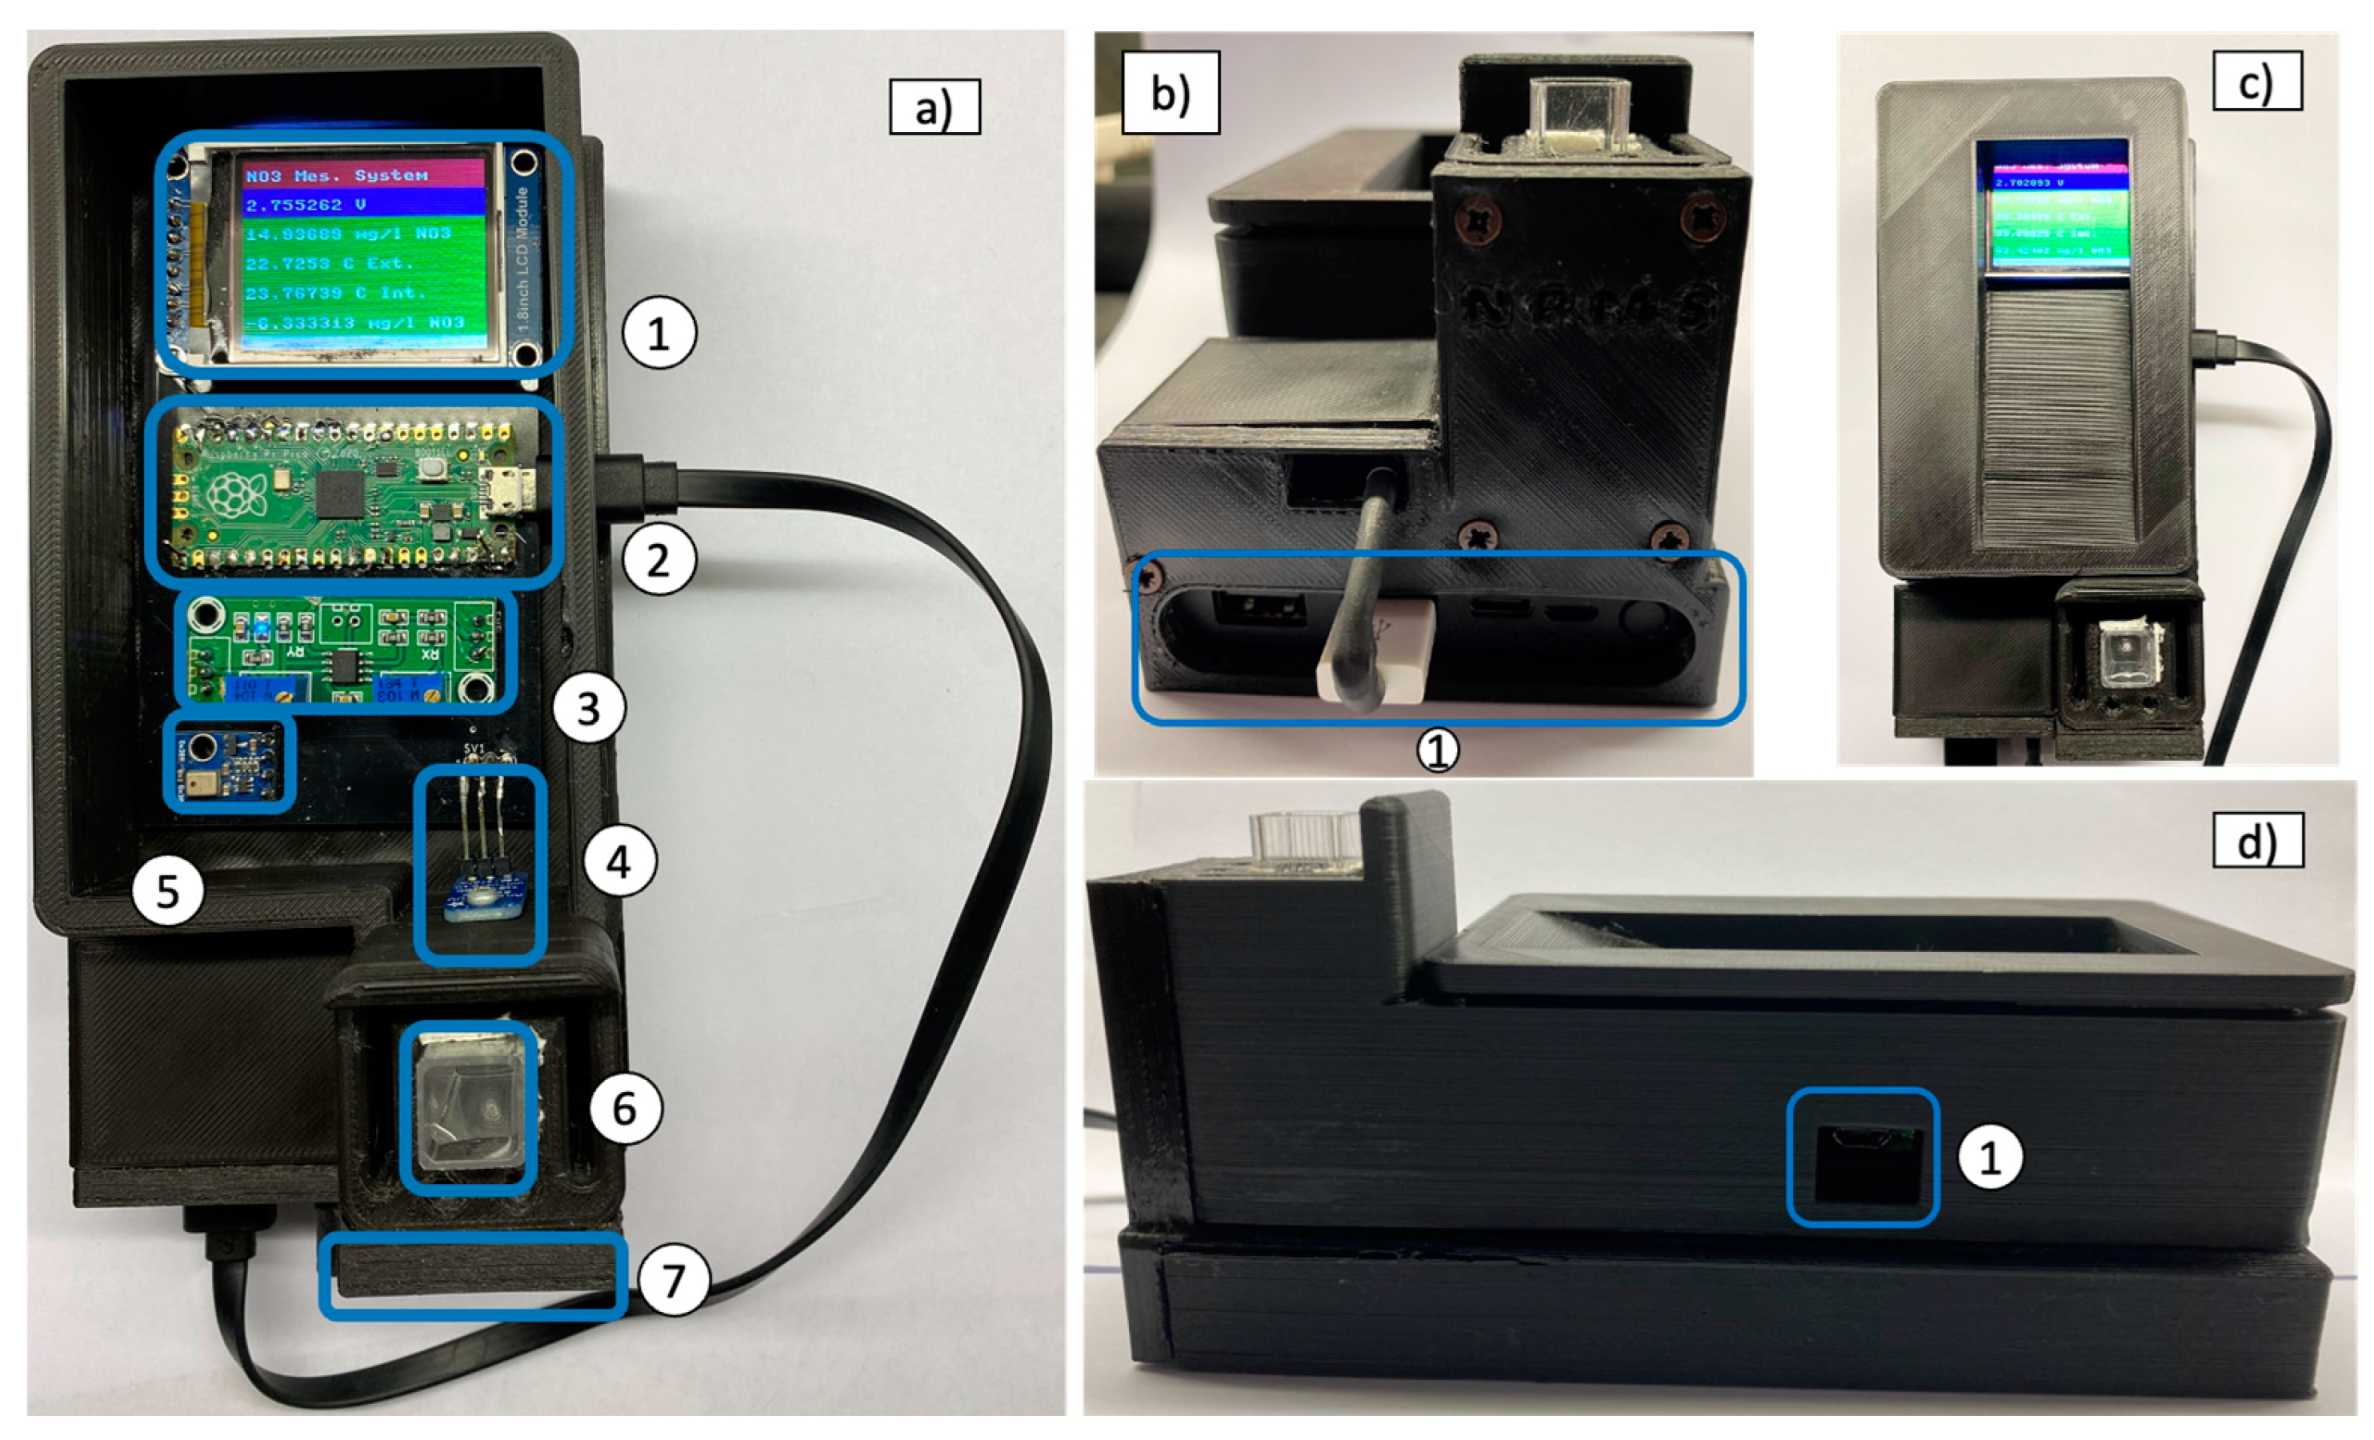
2.4. Enclosure Box and Printed Circuit Board
2.5. Samples: Nitrate Standard Solutions Preparation
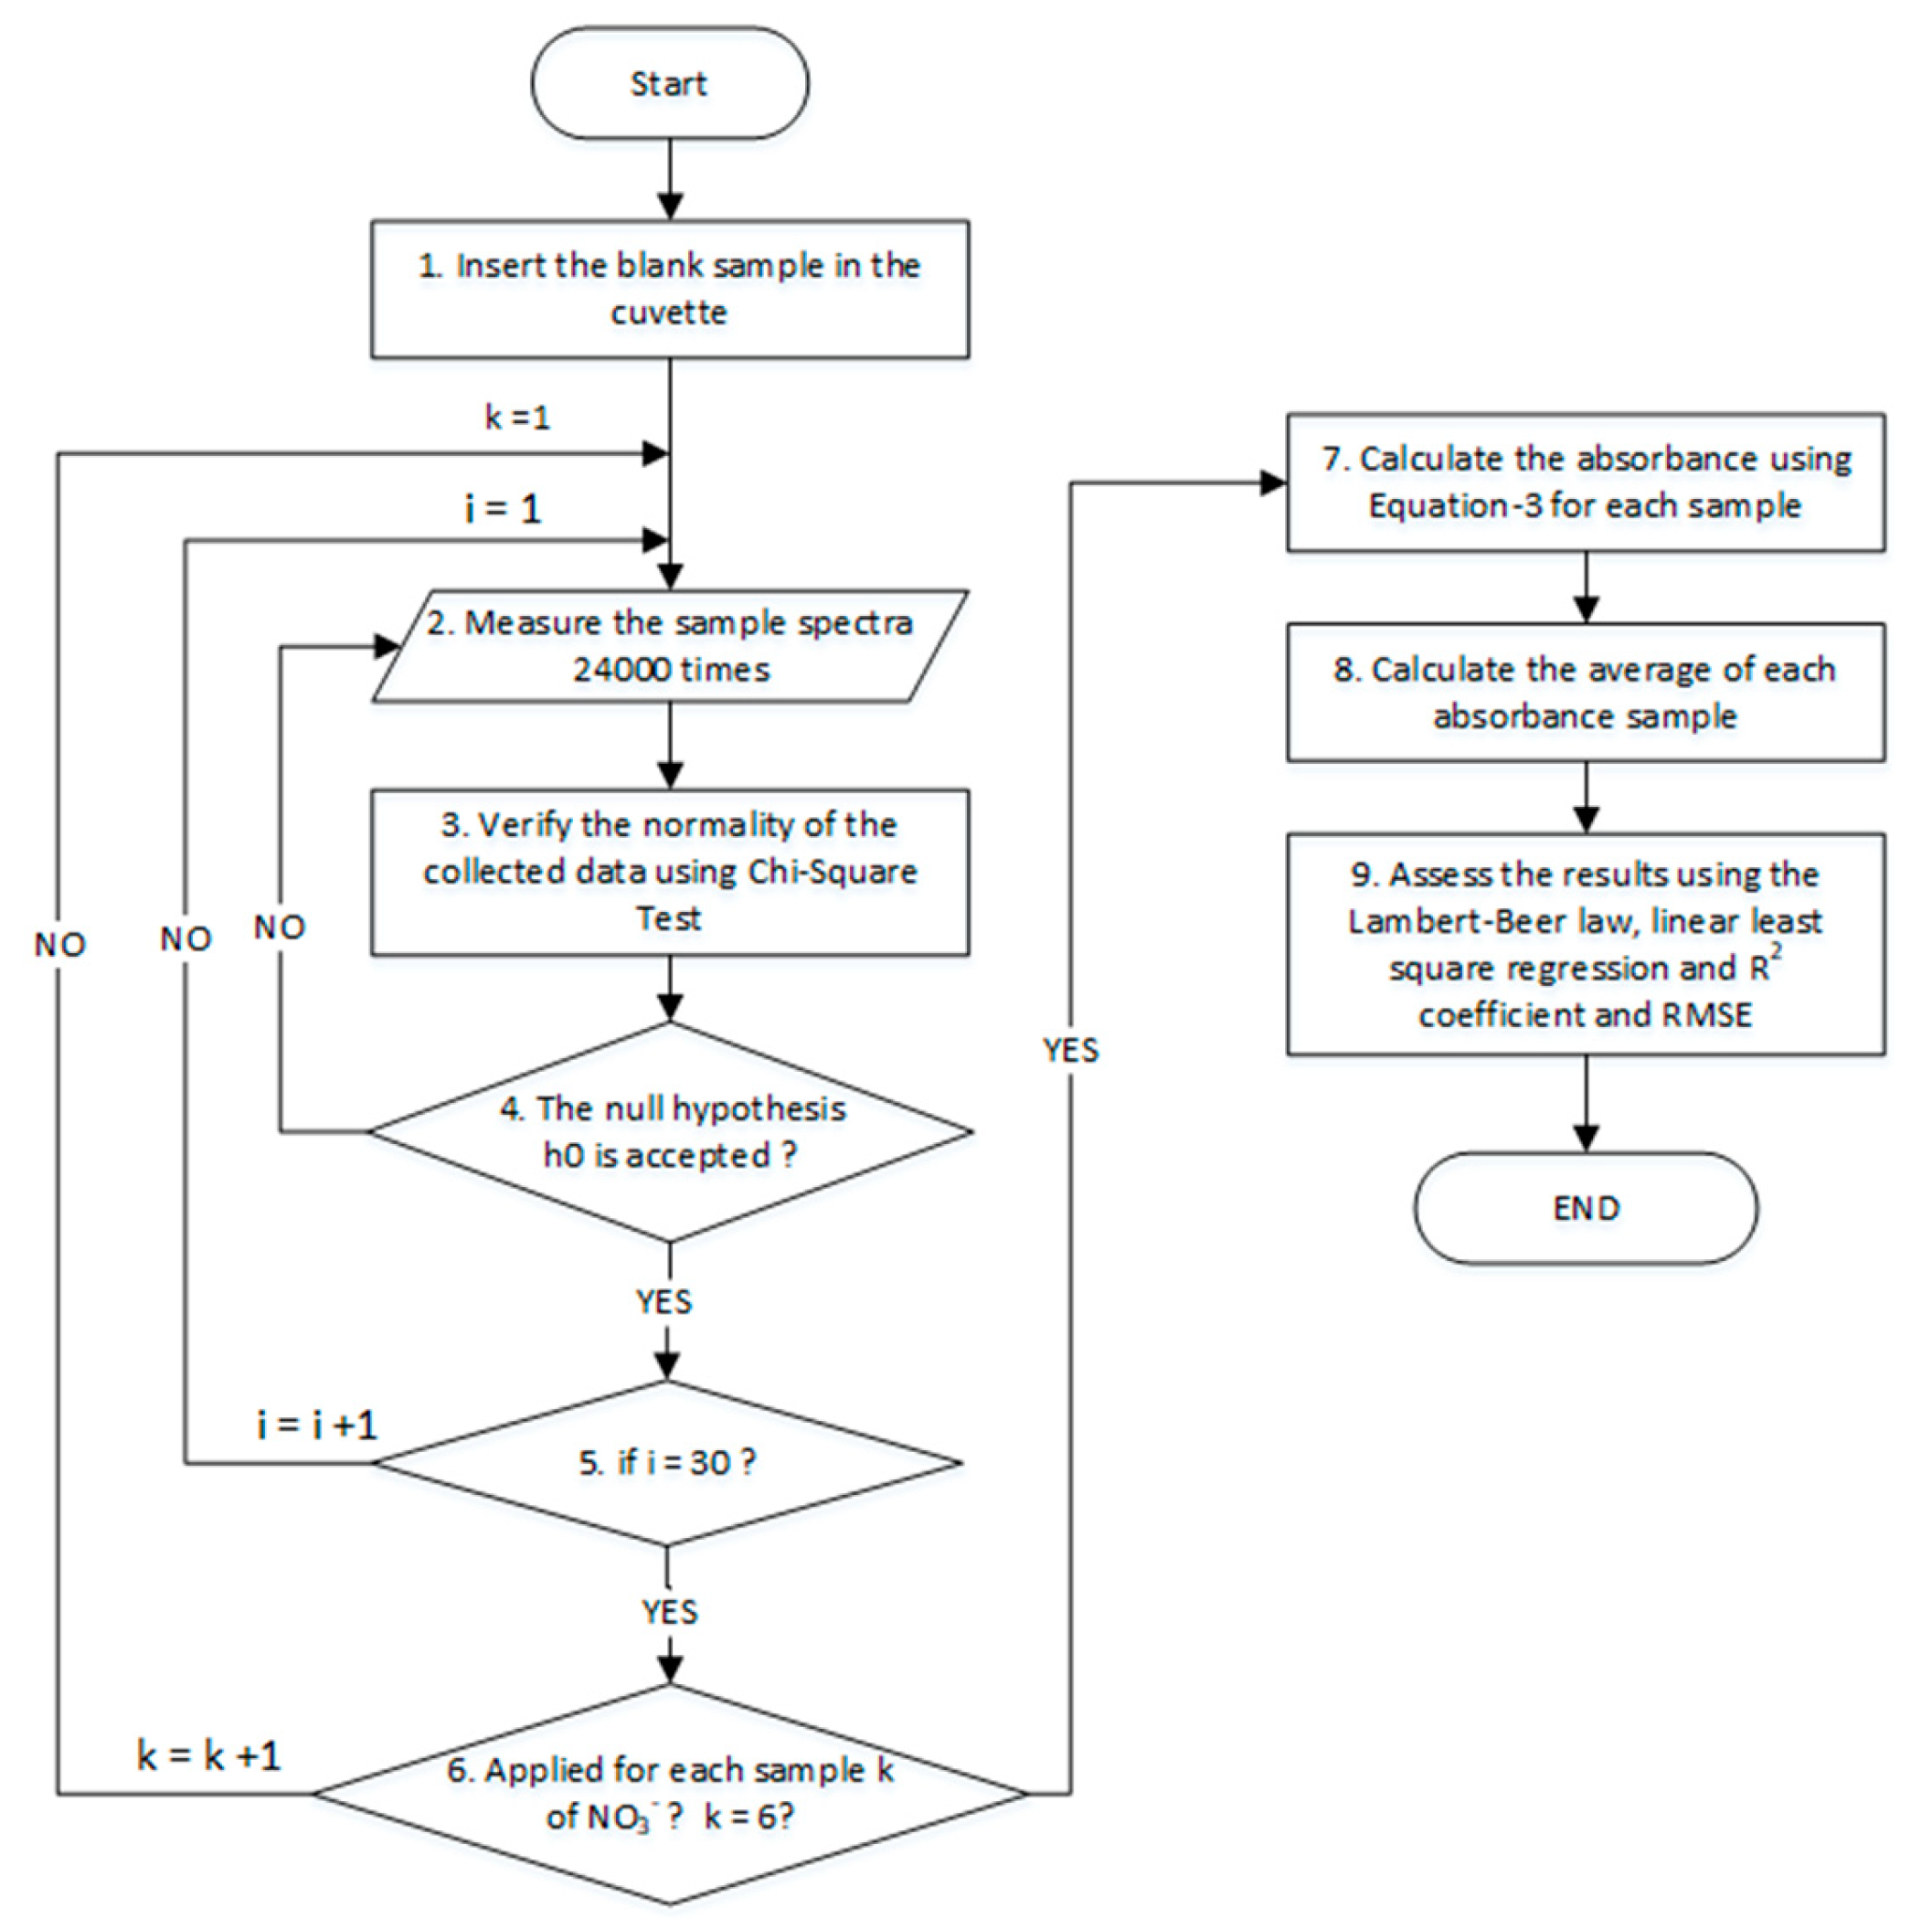
2.6. Calibration Algorithm o
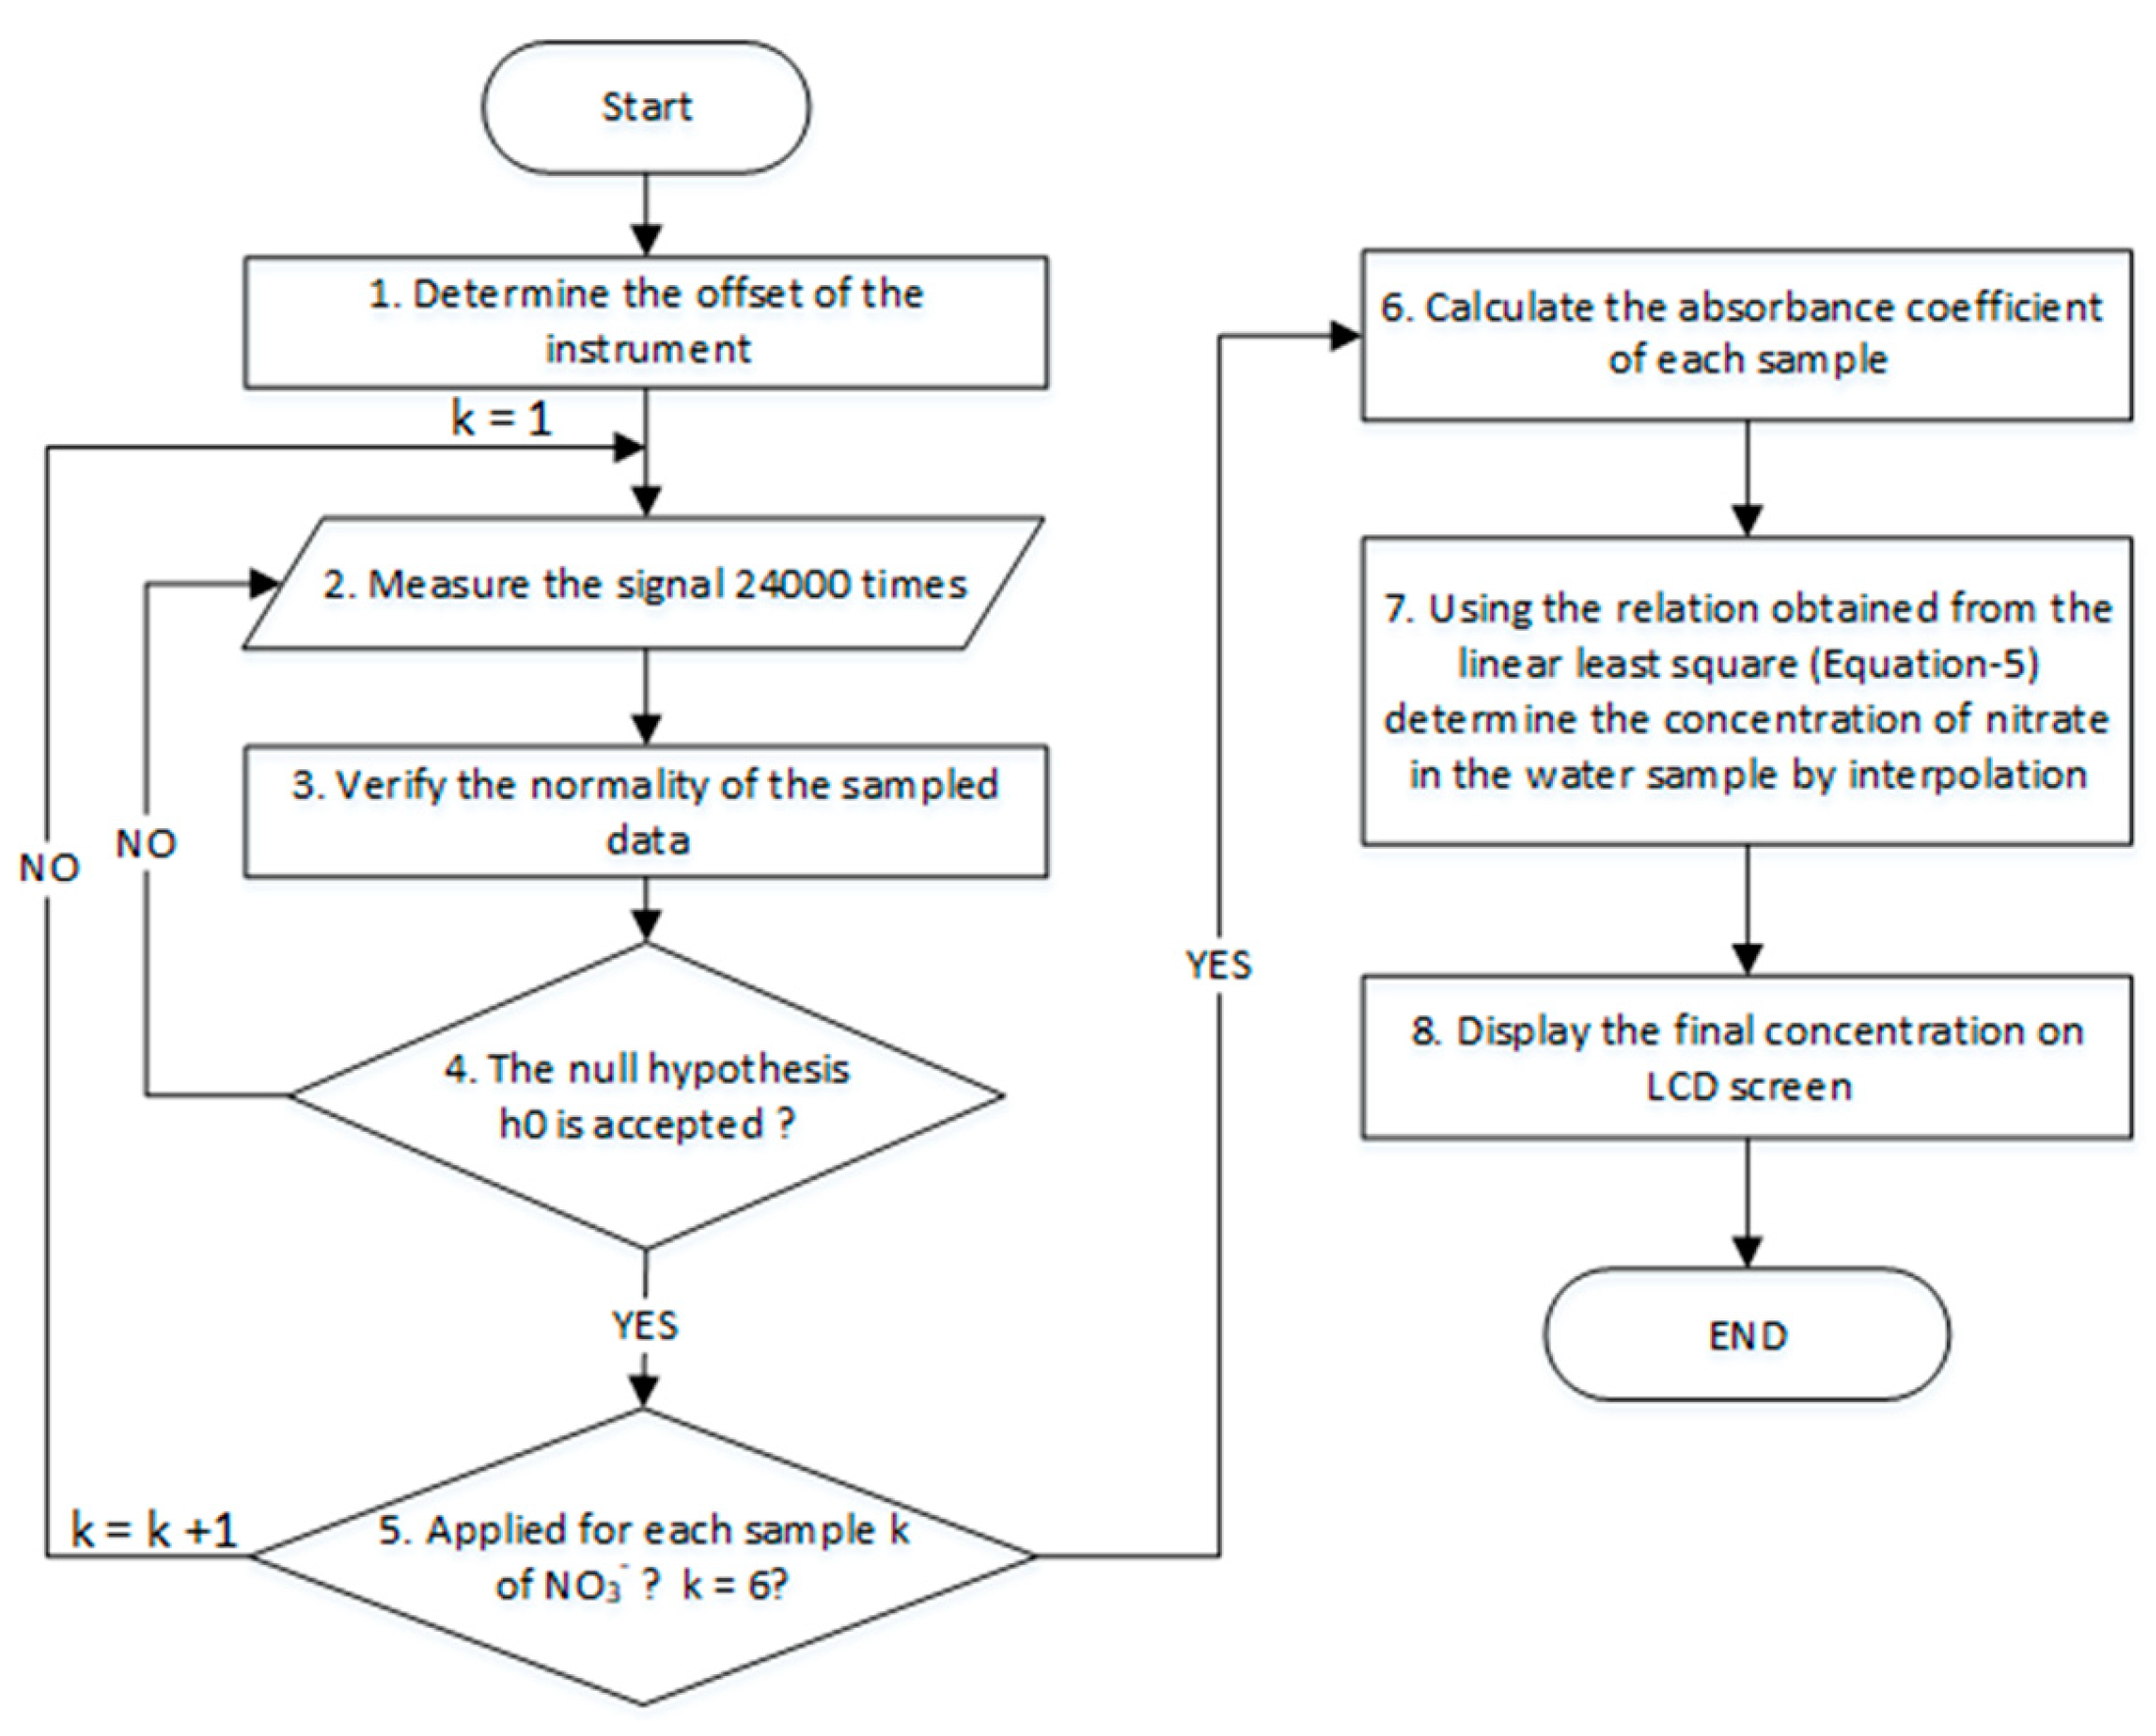
2.7. Processing Algorithm for Standalone Measurements
2.8. Chemical Reagents and Fe2+ Samples
3. Results and Discussion
3.1. Sensitivity Analysis
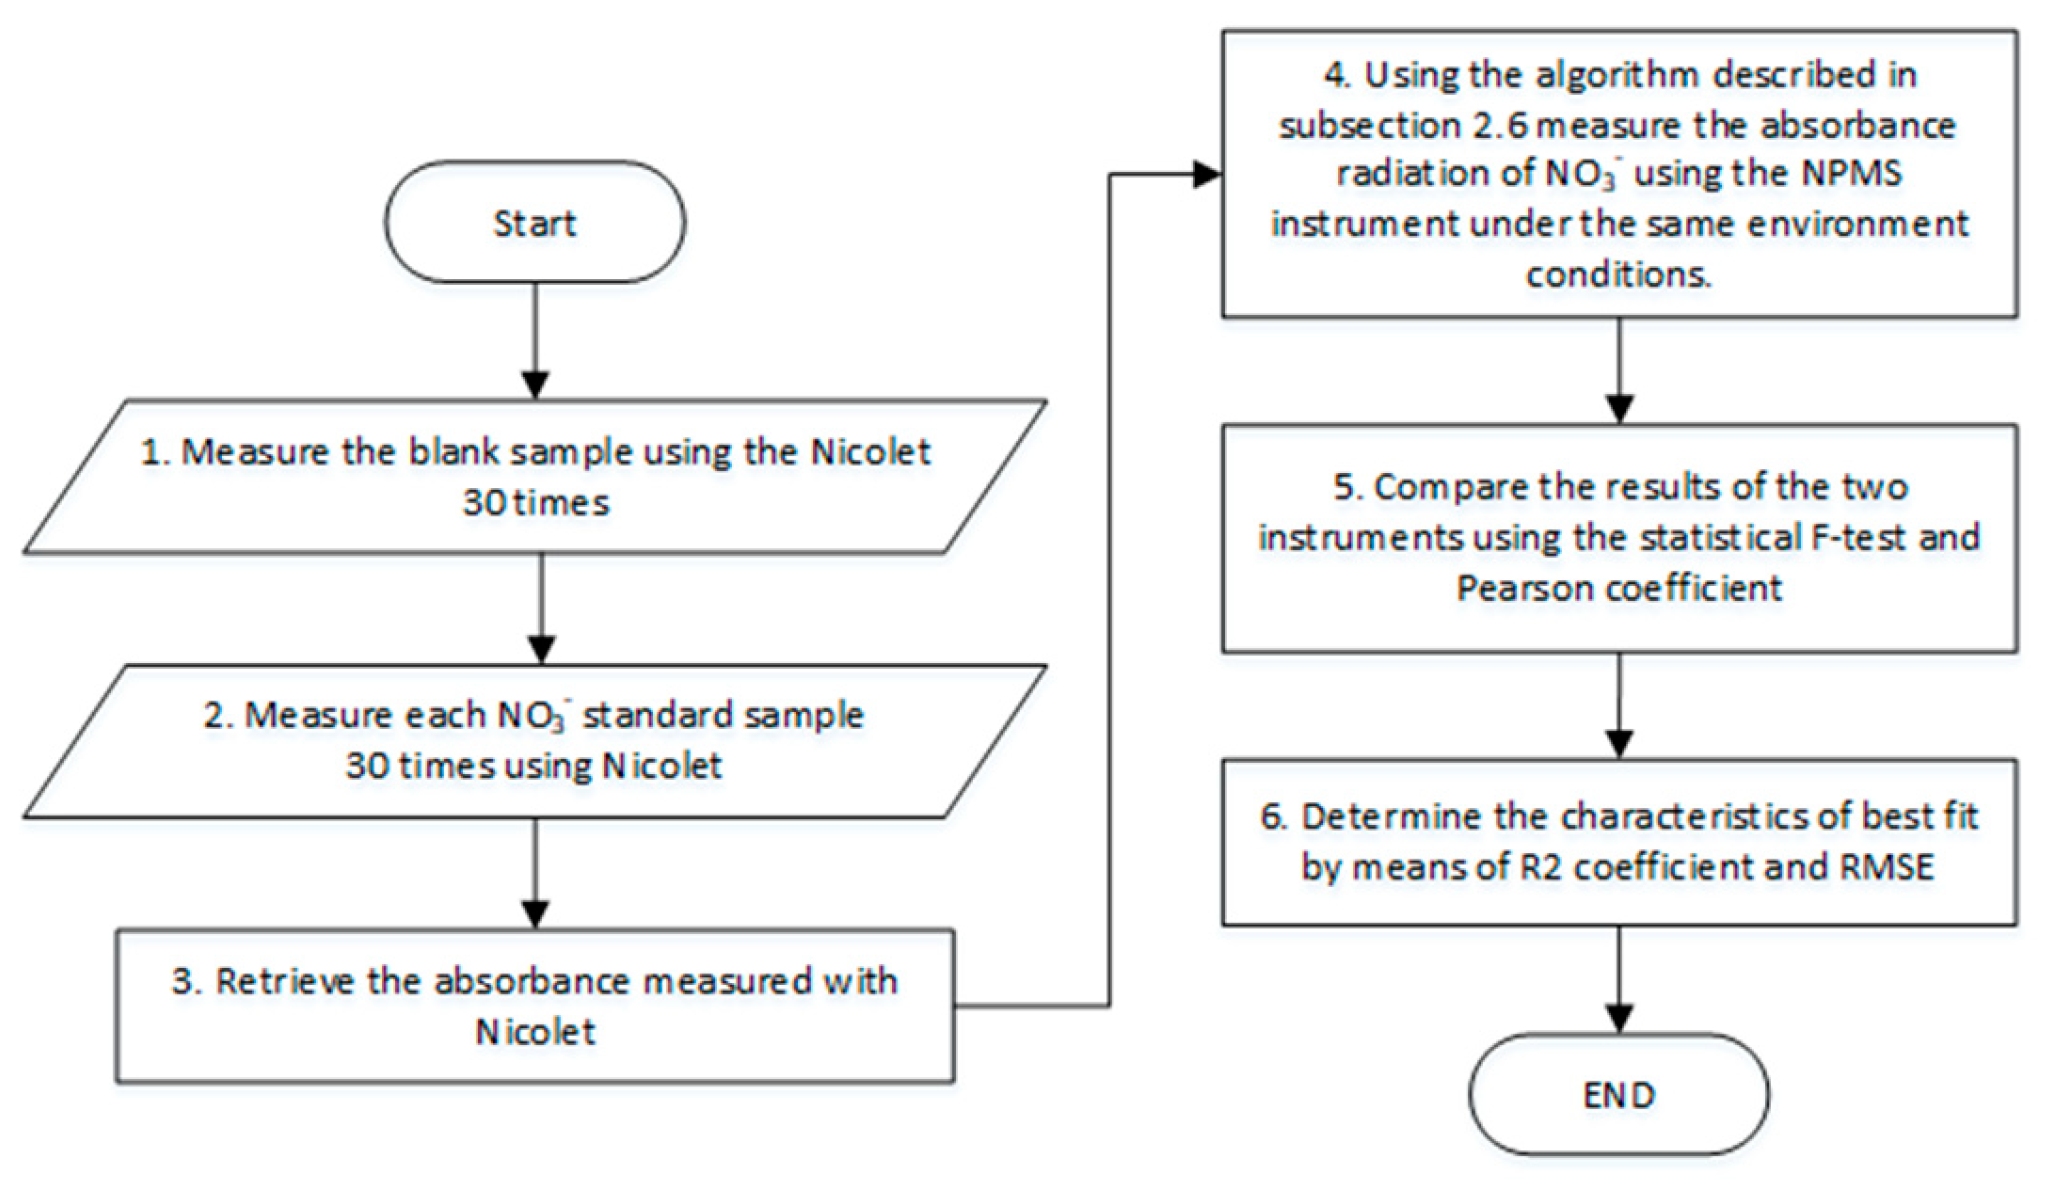
3.2. Results for the NPMS’s Calibration
4. Conclusions
Author Contributions
Funding
Institutional Review Board Statement
Informed Consent Statement
Data Availability Statement
Conflicts of Interest
References
- F. T. Wakida and D. N. Lerner, “Non-agricultural sources of groundwater nitrate: A review and case study,” Water Research, vol. 39, no. 1. pp. 3–16, 2005. [CrossRef]
- E. V. S. Prakasa Rao and K. Puttanna, “Nitrates, agriculture and environment,” Curr. Sci., vol. 79, no. 9, pp. 1163–1168, 2000, Accessed: Mar. 05, 2019. [Online]. Available: https://www.jstor.org/stable/24105267.
- G. W. Randall and D. J. Mulla, “Nitrate nitrogen in surface waters as influenced by climatic conditions and agricultural practices,” J. Environ. Qual., vol. 30, no. 2, pp. 337–344, 2001.
- M. Lasagna, D. A. De Luca, and E. Franchino, “Nitrate contamination of groundwater in the western Po Plain (Italy): The effects of groundwater and surface water interactions,” Environ. Earth Sci., vol. 75, no. 3, pp. 1–16, 2016. [CrossRef]
- J. Górski, K. Dragon, and P. M. J. Kaczmarek, “Nitrate pollution in the Warta River (Poland) between 1958 and 2016: Trends and causes,” Environ. Sci. Pollut. Res., vol. 26, no. 3, pp. 2038–2046, 2019. [CrossRef]
- J. A. Camargo and Á. Alonso, “Ecological and toxicological effects of inorganic nitrogen pollution in aquatic ecosystems: A global assessment,” Environ. Int., vol. 32, no. 6, pp. 831–849, Aug. 2006. [CrossRef]
- M. Ahmed, M. Rauf, Z. Mukhtar, and N. A. Saeed, “Excessive use of nitrogenous fertilizers: An unawareness causing serious threats to environment and human health,” Environ. Sci. Pollut. Res., vol. 24, no. 35, pp. 26983–26987, Dec. 2017. [CrossRef]
- M. H. Ward et al., “Drinking Water Nitrate and Human Health: An Updated Review,” Int. J. Environ. Res. Public Heal. 2018, Vol. 15, Page 1557, vol. 15, no. 7, p. 1557, Jul. 2018. [CrossRef]
- N. Khatri, S. Tyagi, and D. Rawtani, “Assessment of Drinking Water Quality and its Health Effects in Rural Areas of Harij Taluka, Patan District of Northern Gujarat,”, vol. 28, no. 3, pp. 223–246, Jul. 2016. [CrossRef]
- V. M. Wagh, D. B. Panaskar, S. V. Mukate, M. L. Aamalawar, and U. Laxman Sahu, “Nitrate associated health risks from groundwater of Kadava River Basin Nashik, Maharashtra, India,” https://doi.org/10.1080/10807039.2018.1528861, vol. 26, no. 3, pp. 654–672, Mar. 2019. [CrossRef]
- H. Kim, B. Yeon Jo, and H. Soon Kim, “Effect of different concentrations and ratios of ammonium, nitrate, and phosphate on growth of the blue-green alga (cyanobacterium) Microcystis aeruginosa isolated from the Nakdong River, Korea,” Algae, vol. 2017, no. 4, pp. 275–284, 2017. [CrossRef]
- C. Burberg, M. Ilić, T. Petzoldt, and E. von Elert, “Nitrate determines growth and protease inhibitor content of the cyanobacterium Microcystis aeruginosa,” J. Appl. Phycol., vol. 31, no. 3, pp. 1697–1707, Jun. 2019. [CrossRef]
- S. P. Boeykens, M. N. Piol, L. Samudio Legal, A. B. Saralegui, and C. Vázquez, “Eutrophication decrease: Phosphate adsorption processes in presence of nitrates,” J. Environ. Manage., vol. 203, pp. 888–895, Dec. 2017. [CrossRef]
- H. Xu, Y. Liu, Z. Tang, H. Li, G. Li, and Q. He, “Methane production in harmful algal blooms collapsed water: The contribution of non-toxic Microcystis aeruginosa outweighs that of the toxic variety,” J. Clean. Prod., vol. 276, p. 124280, Dec. 2020. [CrossRef]
- R. Gruca-Rokosz and M. Cieśla, “Sediment methane production within eutrophic reservoirs: The importance of sedimenting organic matter,” Sci. Total Environ., vol. 799, p. 149219, Dec. 2021. [CrossRef]
- M. M. Dorsch, R. K. R. Scragg, A. J. Mcmichael, P. A. Baghurst, and K. F. Dyer, “CONGENITAL MALFORMATIONS AND MATERNAL DRINKING WATER SUPPLY IN RURAL SOUTH AUSTRALIA: A CASE-CONTROL STUDY,” Am. J. Epidemiol., vol. 119, no. 4, pp. 473–486, Apr. 1984. [CrossRef]
- J. Blaisdell, M. E. Turyk, K. S. Almberg, R. M. Jones, and L. T. Stayner, “Prenatal exposure to nitrate in drinking water and the risk of congenital anomalies,” Environ. Res., vol. 176, p. 108553, Sep. 2019. [CrossRef]
- S. Fossen Johnson, “Methemoglobinemia: Infants at risk,” Curr. Probl. Pediatr. Adolesc. Health Care, vol. 49, no. 3, pp. 57–67, Mar. 2019. [CrossRef]
- F. R. Greer, M. Shannon, the C. on Nutrition, and and the C. on E. Health, “Infant Methemoglobinemia: The Role of Dietary Nitrate in Food and Water,” Pediatrics, vol. 116, no. 3, pp. 784–786, Sep. 2005. [CrossRef]
- R. U. Hernández-Ramírez et al., “Dietary intake of polyphenols, nitrate and nitrite and gastric cancer risk in Mexico City,” Int. J. Cancer, vol. 125, no. 6, pp. 1424–1430, Sep. 2009. [CrossRef]
- Y. Zhu et al., “Dietary N-nitroso compounds and risk of colorectal cancer: A case–control study in Newfoundland and Labrador and Ontario, Canada,” Br. J. Nutr., vol. 111, no. 6, pp. 1109–1117, Mar. 2014. [CrossRef]
- EEC.Council, Council Directive of 21. May 1991 concerning urban waste water treatment (91/271/EEC), vol. 34. 1991.
- M.Ambiente, “Decree-Law 235/97 Implementing Council Directive 91/676/EEC of Concerning theProtection of Waters Against Pollution Caused by Nitrates from Agricultural Sources,” Diary Port. Republic, 1st Ser. N.o 203. 3 Sept. 1997, 1997.
- J. Alcamo, “Water quality and its interlinkages with the Sustainable Development Goals,” Curr. Opin. Environ. Sustain., vol. 36, pp. 126–140, Feb. 2019. [CrossRef]
- UN, “Water and Sanitation - United Nations Sustainable Development,” Sustainable Development Goals, 2016. https://www.un.org/sustainabledevelopment/water-and-sanitation/ (accessed Nov. 21, 2021).
- P. Singh, M. K. Singh, Y. R. Beg, and G. R. Nishad, “A review on spectroscopic methods for determination of nitrite and nitrate in environmental samples,” Talanta, vol. 191, pp. 364–381, Jan. 2019. [CrossRef]
- C. Edwards, P. S. Hooda, and Y. Cook, “Determination of Nitrate in Water Containing Dissolved Organic Carbon by Ultraviolet Spectroscopy,” Int. J. Environ. Anal. Chem., vol. 80, no. 1, pp. 49–59, May 2001. [CrossRef]
- J. Causse, O. Thomas, A.-V. E. Jung, and M.-F. Thomas, “Direct DOC and nitrate determination in water using dual pathlength and second derivative UV spectrophotometry,” 2016. [CrossRef]
- W. G. Crumpton, T. M. Isenhart, and P. D. Mitchell, “Nitrate and organic N analyses with second-derivative spectroscopy,” Limnol. Oceanogr., vol. 37, no. 4, pp. 907–913, Jun. 1992. [CrossRef]
- E. Goldman and R. Jacobs, “Determination of Nitrates by Ultraviolet Absorption,” J. Am. Water Works Assoc., vol. 53, no. 2, pp. 187–191, 1961. [CrossRef]
- D. Langmuir and R. L. Jacobson, “Specific-ion electrode determination of nitrate in some fresh waters and sewage effluents,” Environ. Sci. Technol., vol. 4, no. 10, pp. 834–838, Oct. 2002. [CrossRef]
- E. D. Wood, F. A. J. Armstrong, and F. A. Richards, “Determination of nitrate in sea water by cadmium-copper reduction to nitrite,” J. Mar. Biol. Assoc. United Kingdom, vol. 47, no. 1, pp. 23–31, 1967.
- J. Hilton and E. Rigg, “Determination of nitrate in lake water by the adaptation of the hydrazine - copper reduction method for use on a discrete analyser: Performance statistics and an instrument-induced difference from segmented flow conditions,” Analyst, vol. 108, no. 1289, pp. 1026–1028, 1983. [CrossRef]
- APHA, Standard Methods for the Examination of Water and Wastewater, 22nd Edition. 2012.
- D. Beaton et al., “Lab-on-Chip Measurement of Nitrate and Nitrite for In Situ Analysis of Natural Waters,” Environ. Sci. Technol, vol. 46, p. 23, 2012. [CrossRef]
- G. Duffy and F. Regan, “Recent developments in sensing methods for eutrophying nutrients with a focus on automation for environmental applications,” Analyst, vol. 142, no. 23, pp. 4355–4372, Nov. 2017. [CrossRef]
- J. Bartram and R. Ballance, Water quality monitoring: A practical guide to the design and implementation of freshwater quality studies and monitoring programmes. CRC Press, 1996.
- D. Duncan, F. Harvey, and M. Walker, “EPA Guidelines Regulatory monitoring and testing Water and wastewater sampling EPA Guidelines: Regulatory monitoring and testing Water and wastewater sampling,” 2007, Accessed: Nov. 21, 2021. [Online]. Available: www.epa.sa.gov.au.
- P. M. Ramos, F. M. Janeiro, M. Tlemçani, and A. C. Serra, “Recent developments on impedance measurements with DSP-based ellipse-fitting algorithms,” IEEE Trans. Instrum. Meas., vol. 58, no. 5, pp. 1680–1689, 2009.
- Albino, D. Bortoli, M. Tlemçani, and A. Joyce, “Modelling and studies of the spectral response of some optoelectronic components,” https://doi.org/10.1117/12.2242024, vol. 10005, pp. 18–26, Oct. 2016. [CrossRef]
- F. Monteiro-Silva, P.A.S. Jorge, R.C. Martins, Optical Sensing of Nitrogen, Phosphorus and Potassium: A Spectrophotometrical Approach Toward Smart Nutrient Deployment, Chemosensors. 7 (2019) 51. [CrossRef]
- Ono, R. Matsumoto, and N. Yamaguchi, “SYSTEM FOR CONTINUOUS MEASUREMENT OF NITRATE ION CONCENTRATION IN PICKLING WASTE WATER.,” Trans. Iron Steel Inst. Japan, vol. 22, no. 2, pp. 121–125, 1982. [CrossRef]
- J. H. Wetters and K. L. Uglum, “Direct spectrophotometric simultaneous determination of nitrite and nitrate in the ultraviolet,” Anal. Chem., vol. 42, no. 3, pp. 335–340, Mar. 2002. [CrossRef]
- N. L. Aluker, M. E. Herrmann, and Y. M. Suzdaltseva, “A Spectrophotometric Study of Nitrate and Nitrite Salts and Their Aqueous Solutions,” Opt. Spectrosc., vol. 127, no. 6, pp. 991–996, Dec. 2019. [CrossRef]
- J. Causse, O. Thomas, A. V. Jung, and M. F. Thomas, “Direct DOC and nitrate determination in water using dual pathlength and second derivative UV spectrophotometry,” Water Res., vol. 108, pp. 312–319, Jan. 2017. [CrossRef]
- E. Yeshno, S. Arnon, and O. Dahan, “Real-time monitoring of nitrate in soils as a key for optimization of agricultural productivity and prevention of groundwater pollution,” Hydrol. Earth Syst. Sci., vol. 23, no. 9, pp. 3997–4010, Sep. 2019. [CrossRef]
- S. Hossain, D. Cook, C. W. K. Chow, and G. A. Hewa, “Development of an Optical Method to Monitor Nitrification in Drinking Water,” Sensors (Basel)., vol. 21, no. 22, Nov. 2021. [CrossRef]
- Y. C. Moo, M. Z. Matjafri, H. S. Lim, and C. H. Tan, “New development of optical fibre sensor for determination of nitrate and nitrite in water,” Optik (Stuttg)., vol. 127, no. 3, pp. 1312–1319, Feb. 2016. [CrossRef]
- L. A. Szolga and T. R. Cilean, “Nitrates and Nitrites Detection System in the Drinking Water Using UV Absorption,” pp. 1–4, Dec. 2020. [CrossRef]
- W.H.O., Guidelines for drinking-water quality, vol. 1. World Health Organization, 2004.
- “The Nitrate Pollution Prevention Regulations,” 2015.
- E. P. A. EPA, “National primary drinking water regulations: Long term 1 enhanced surface water treatment rule. Final rule,” Fed. Regist., vol. 67, no. 9, pp. 1811–1844, 2002.
- “View of Water quality assessment using a portable UV optical absorbance nitrate sensor with a scintillator and smartphone camera.” https://watersa.net/article/view/9453/10840 (accessed Apr. 07, 2022).
- M. Silva, M. Tlemcani, and T. Elias, “Estimation of the total uncertainty of sky-radiance measurements in field experimental conditions: Implications for the aerosol single-scattering albedo,” Appl. Opt. Vol. 41, Issue 24, pp. 5059-5072, vol. 41, no. 24, pp. 5059–5072, Aug. 2002. [CrossRef]
- “GUVA-S12SD UV-B Sensor Features Applications,” 2011.
- SGMicro, “SGM8521/SGM8522/SGM8524 150kHz, 5.5μA, Rail-to-Rail I/O, CMOS Operational Amplifiers,” 2018, Accessed: Nov. 22, 2021. [Online]. Available: www.sg-micro.com.
- S. Smith, “RP2040 Assembly Language Programming,” 2022. [CrossRef]
- D. A. Skoog, F. J. Holler, and S. R. Crouch, Principles of instrumental analysis. Cengage learning, 2017.
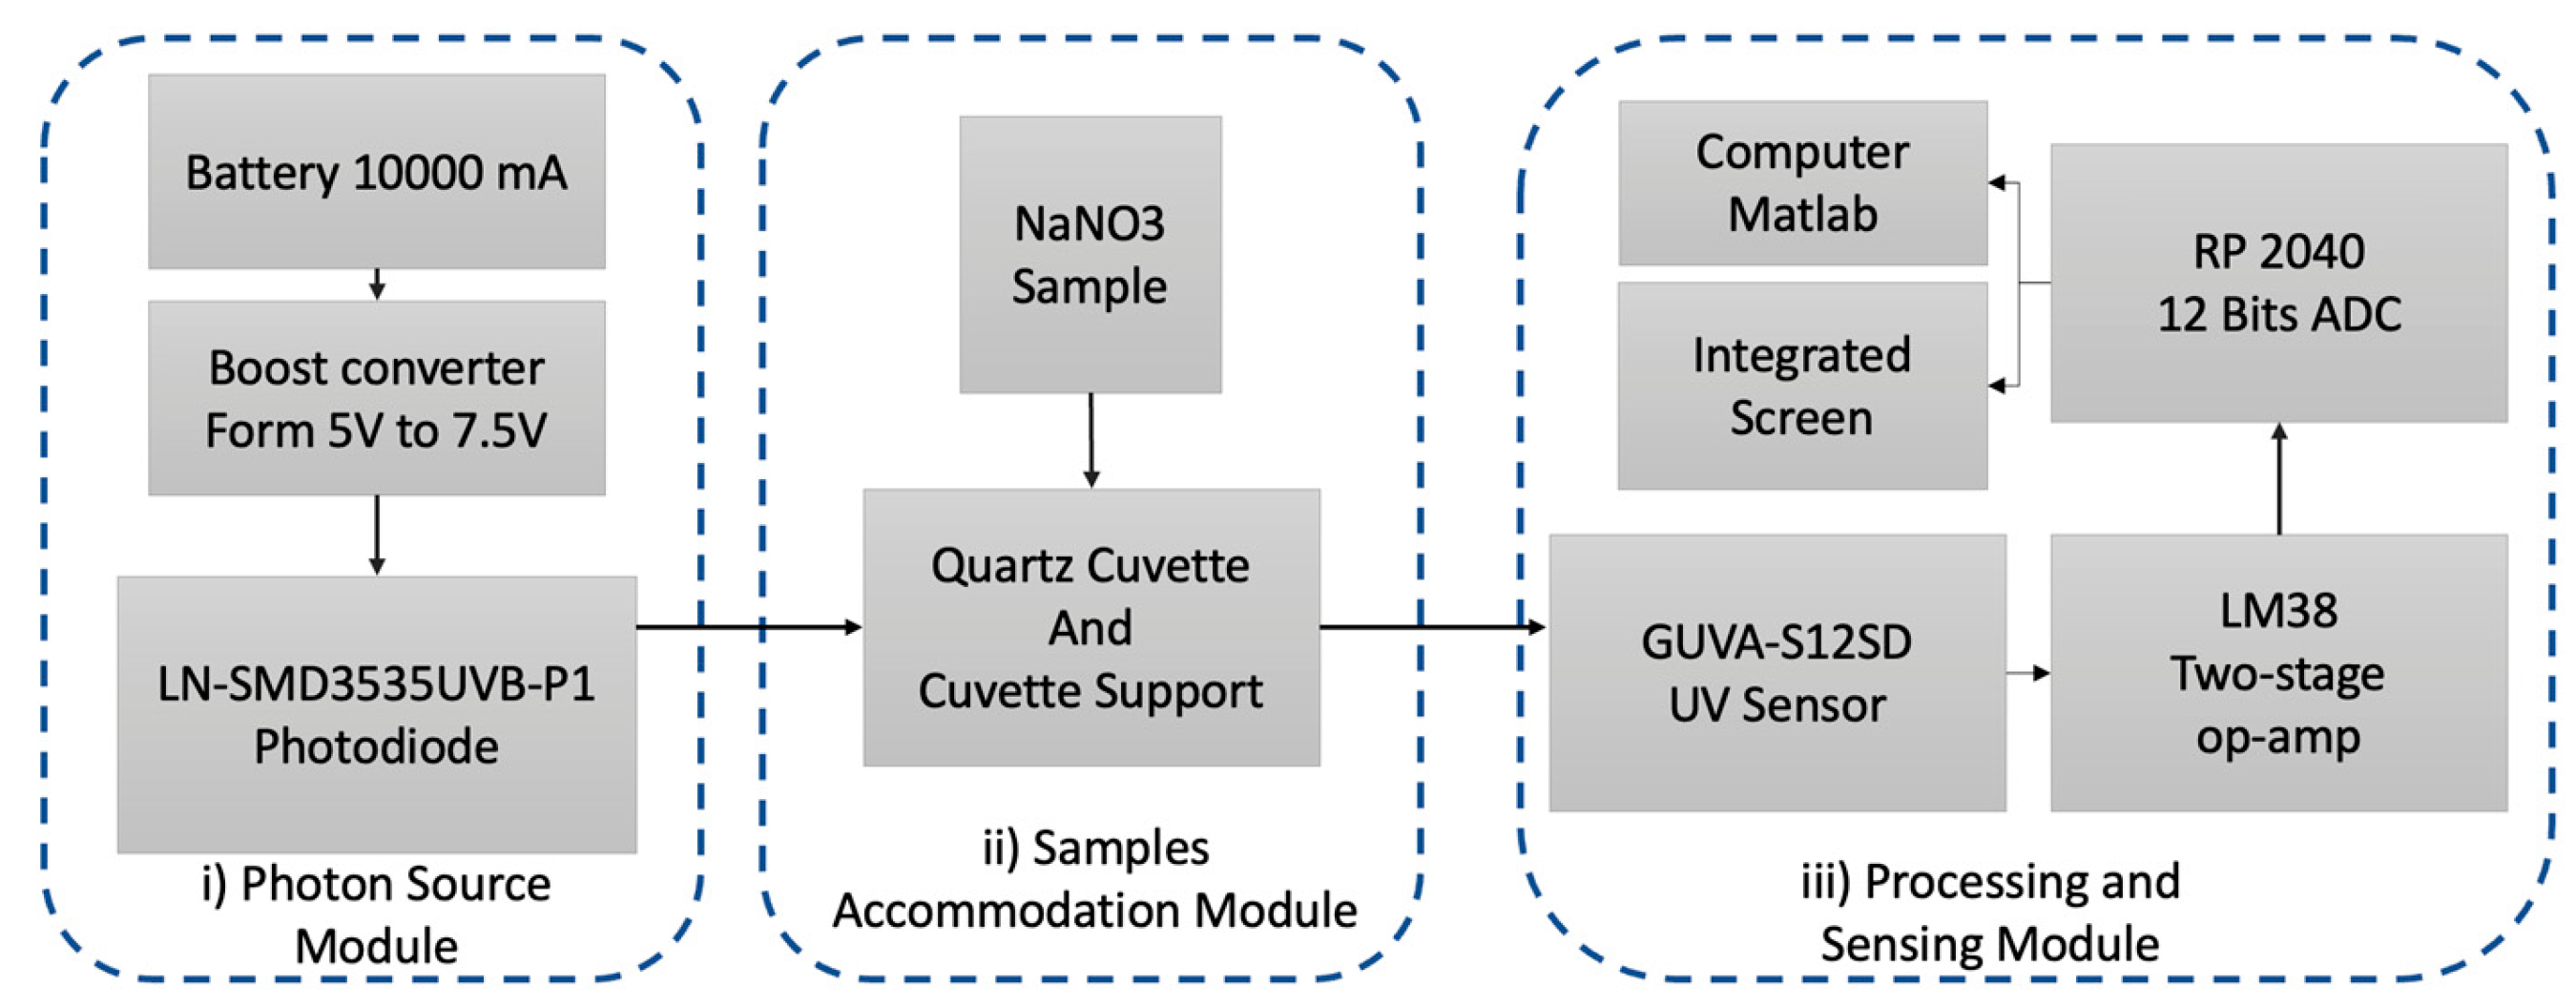

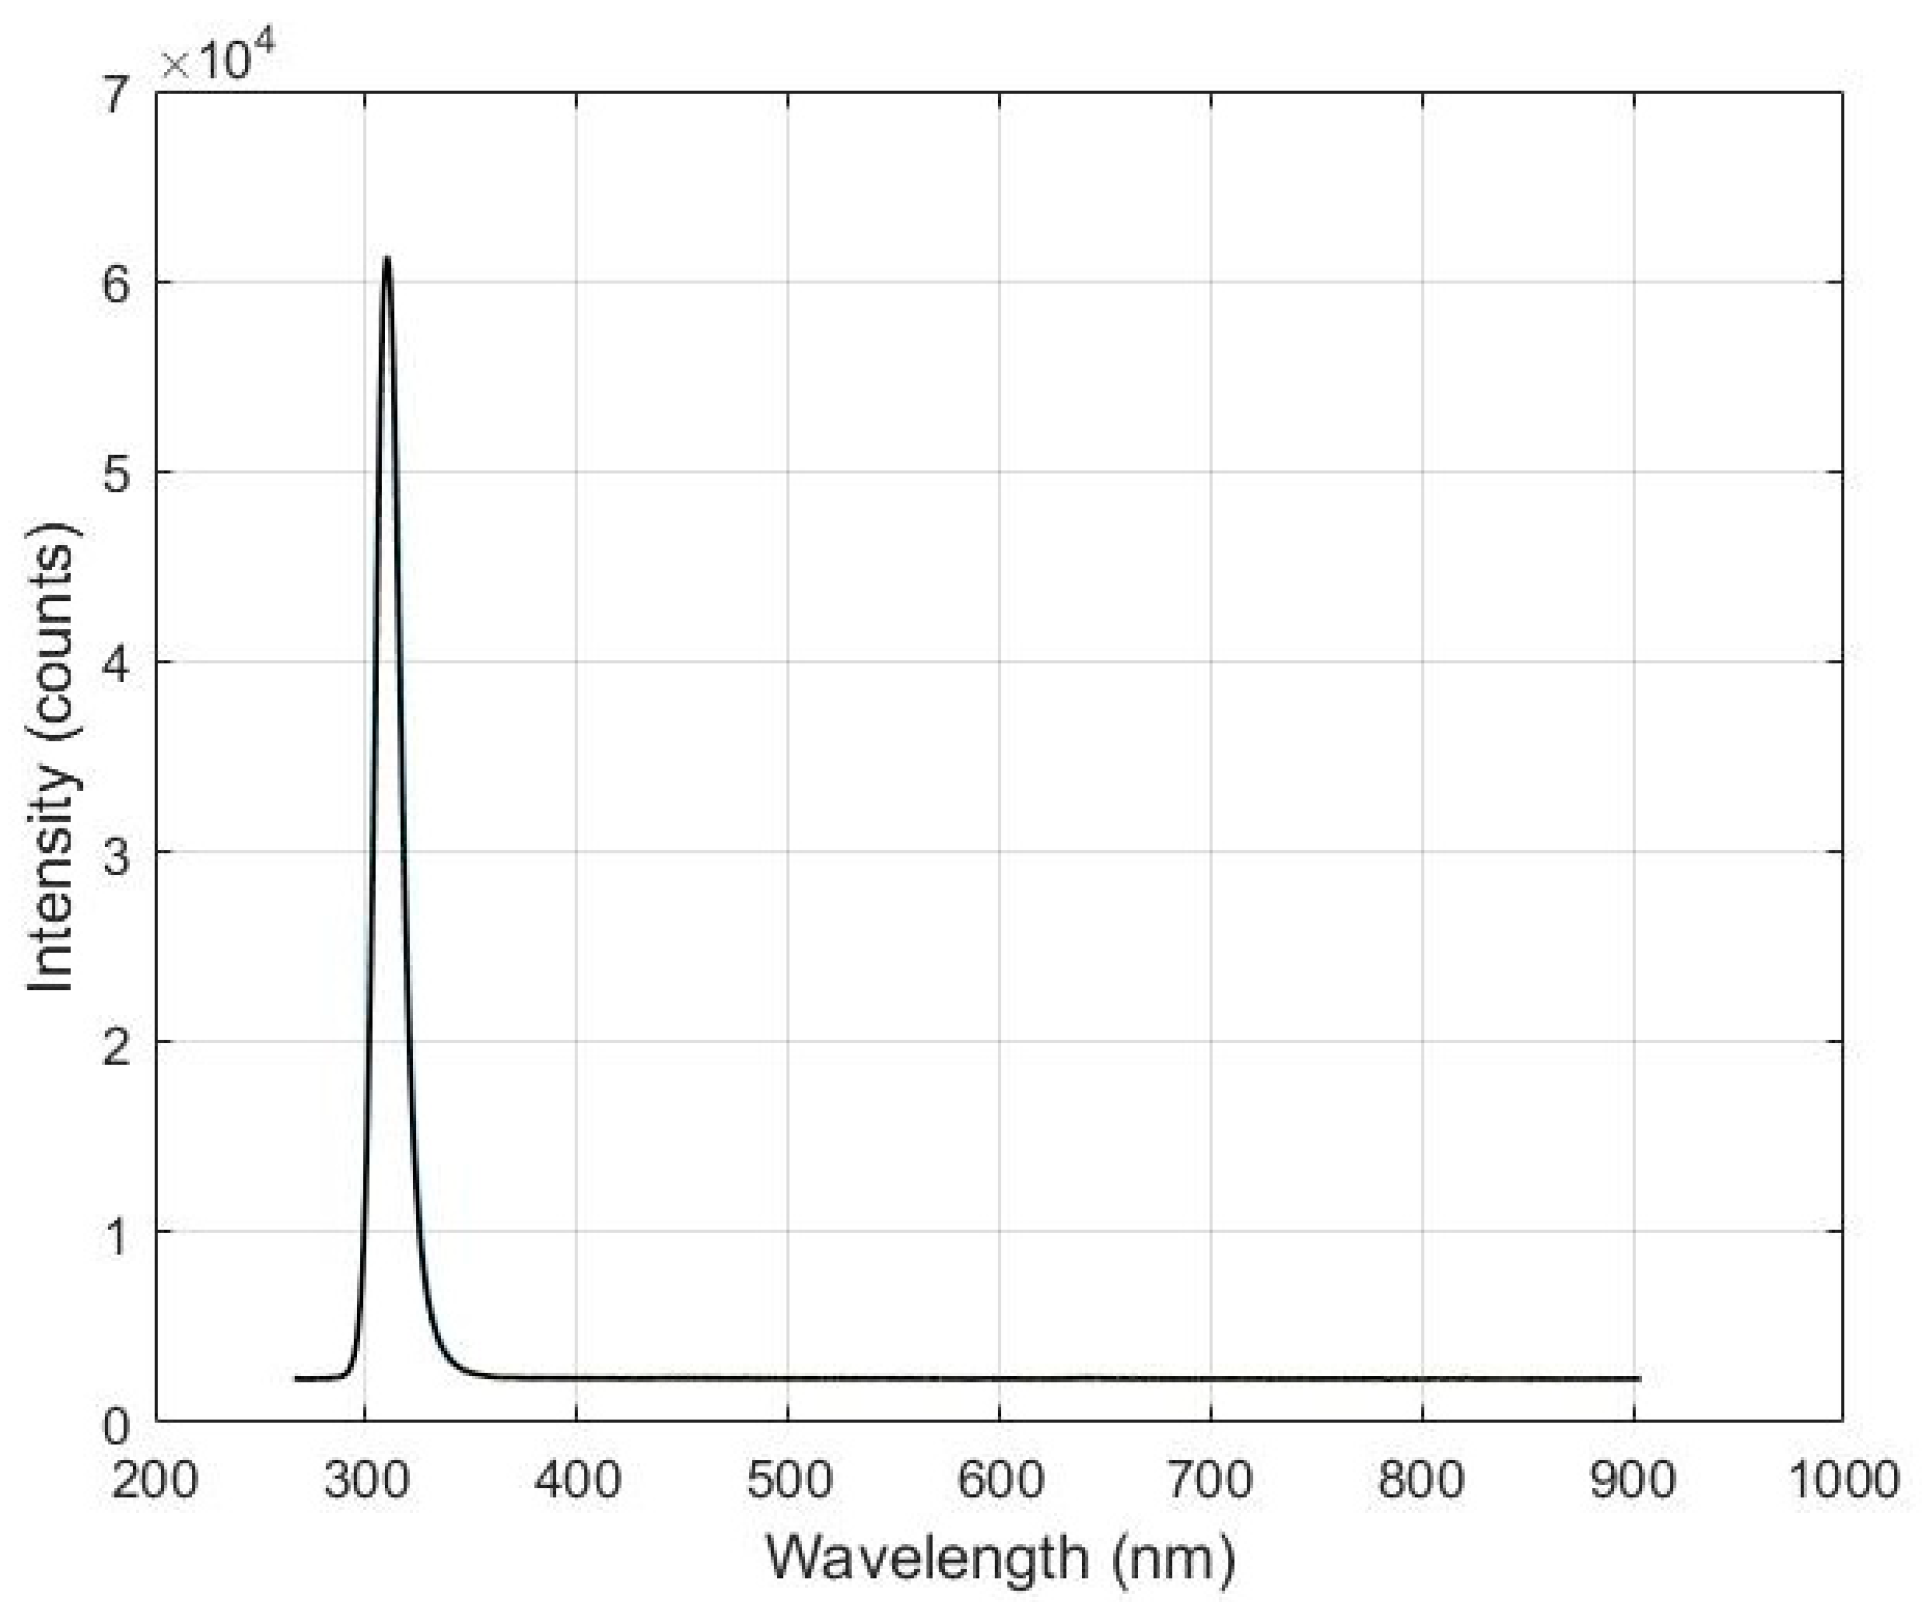

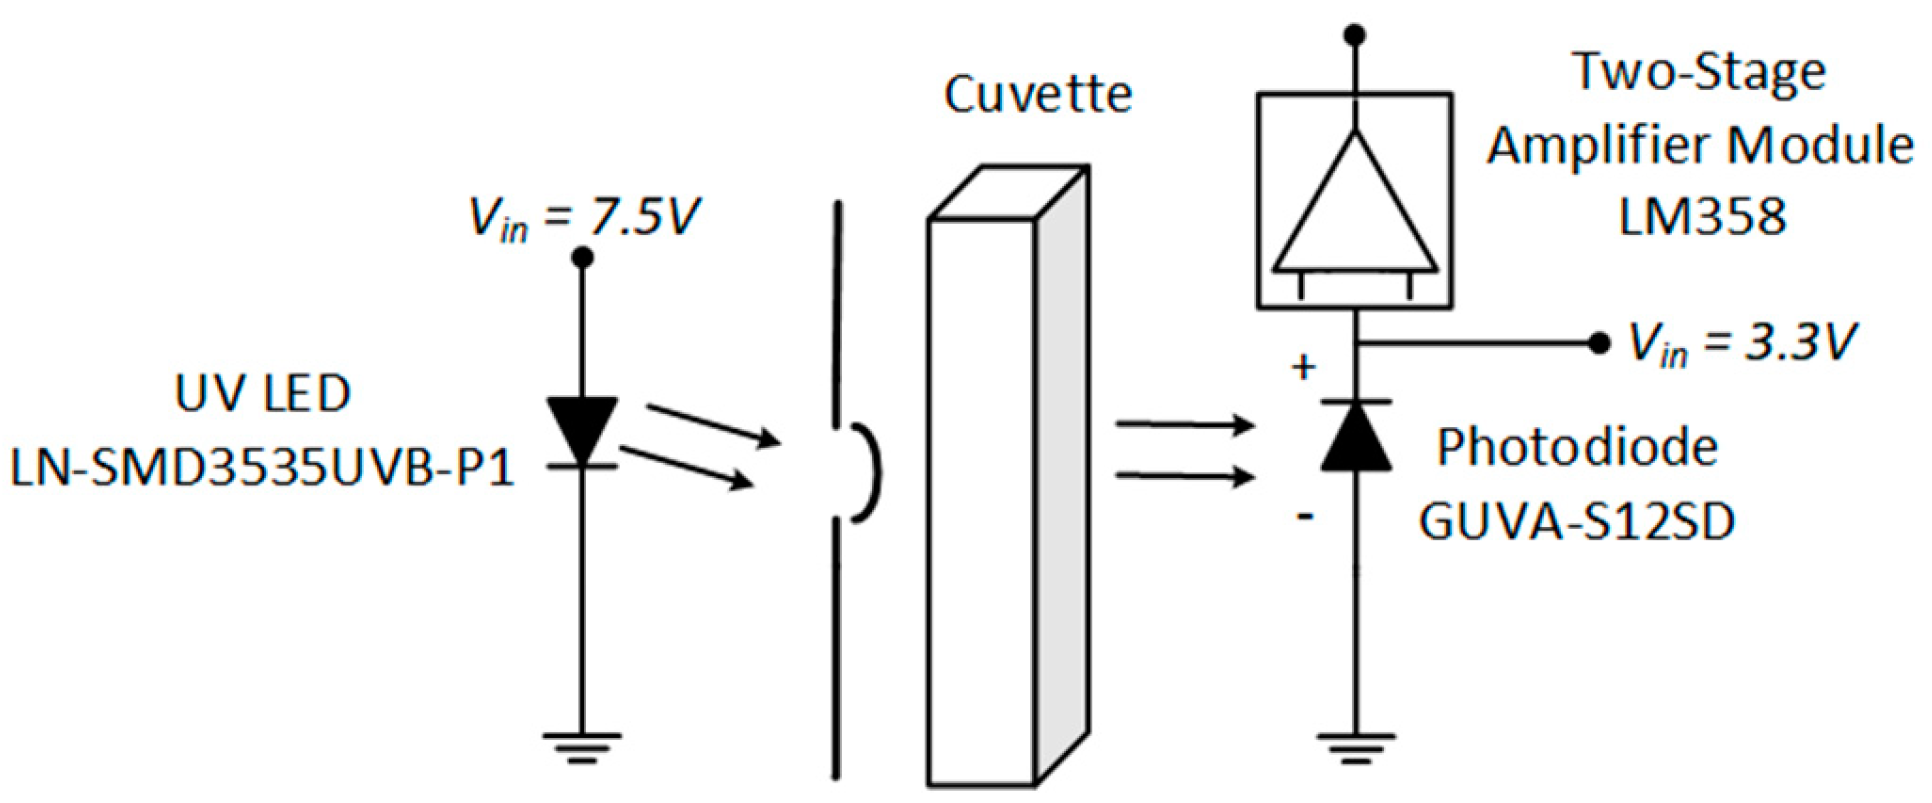

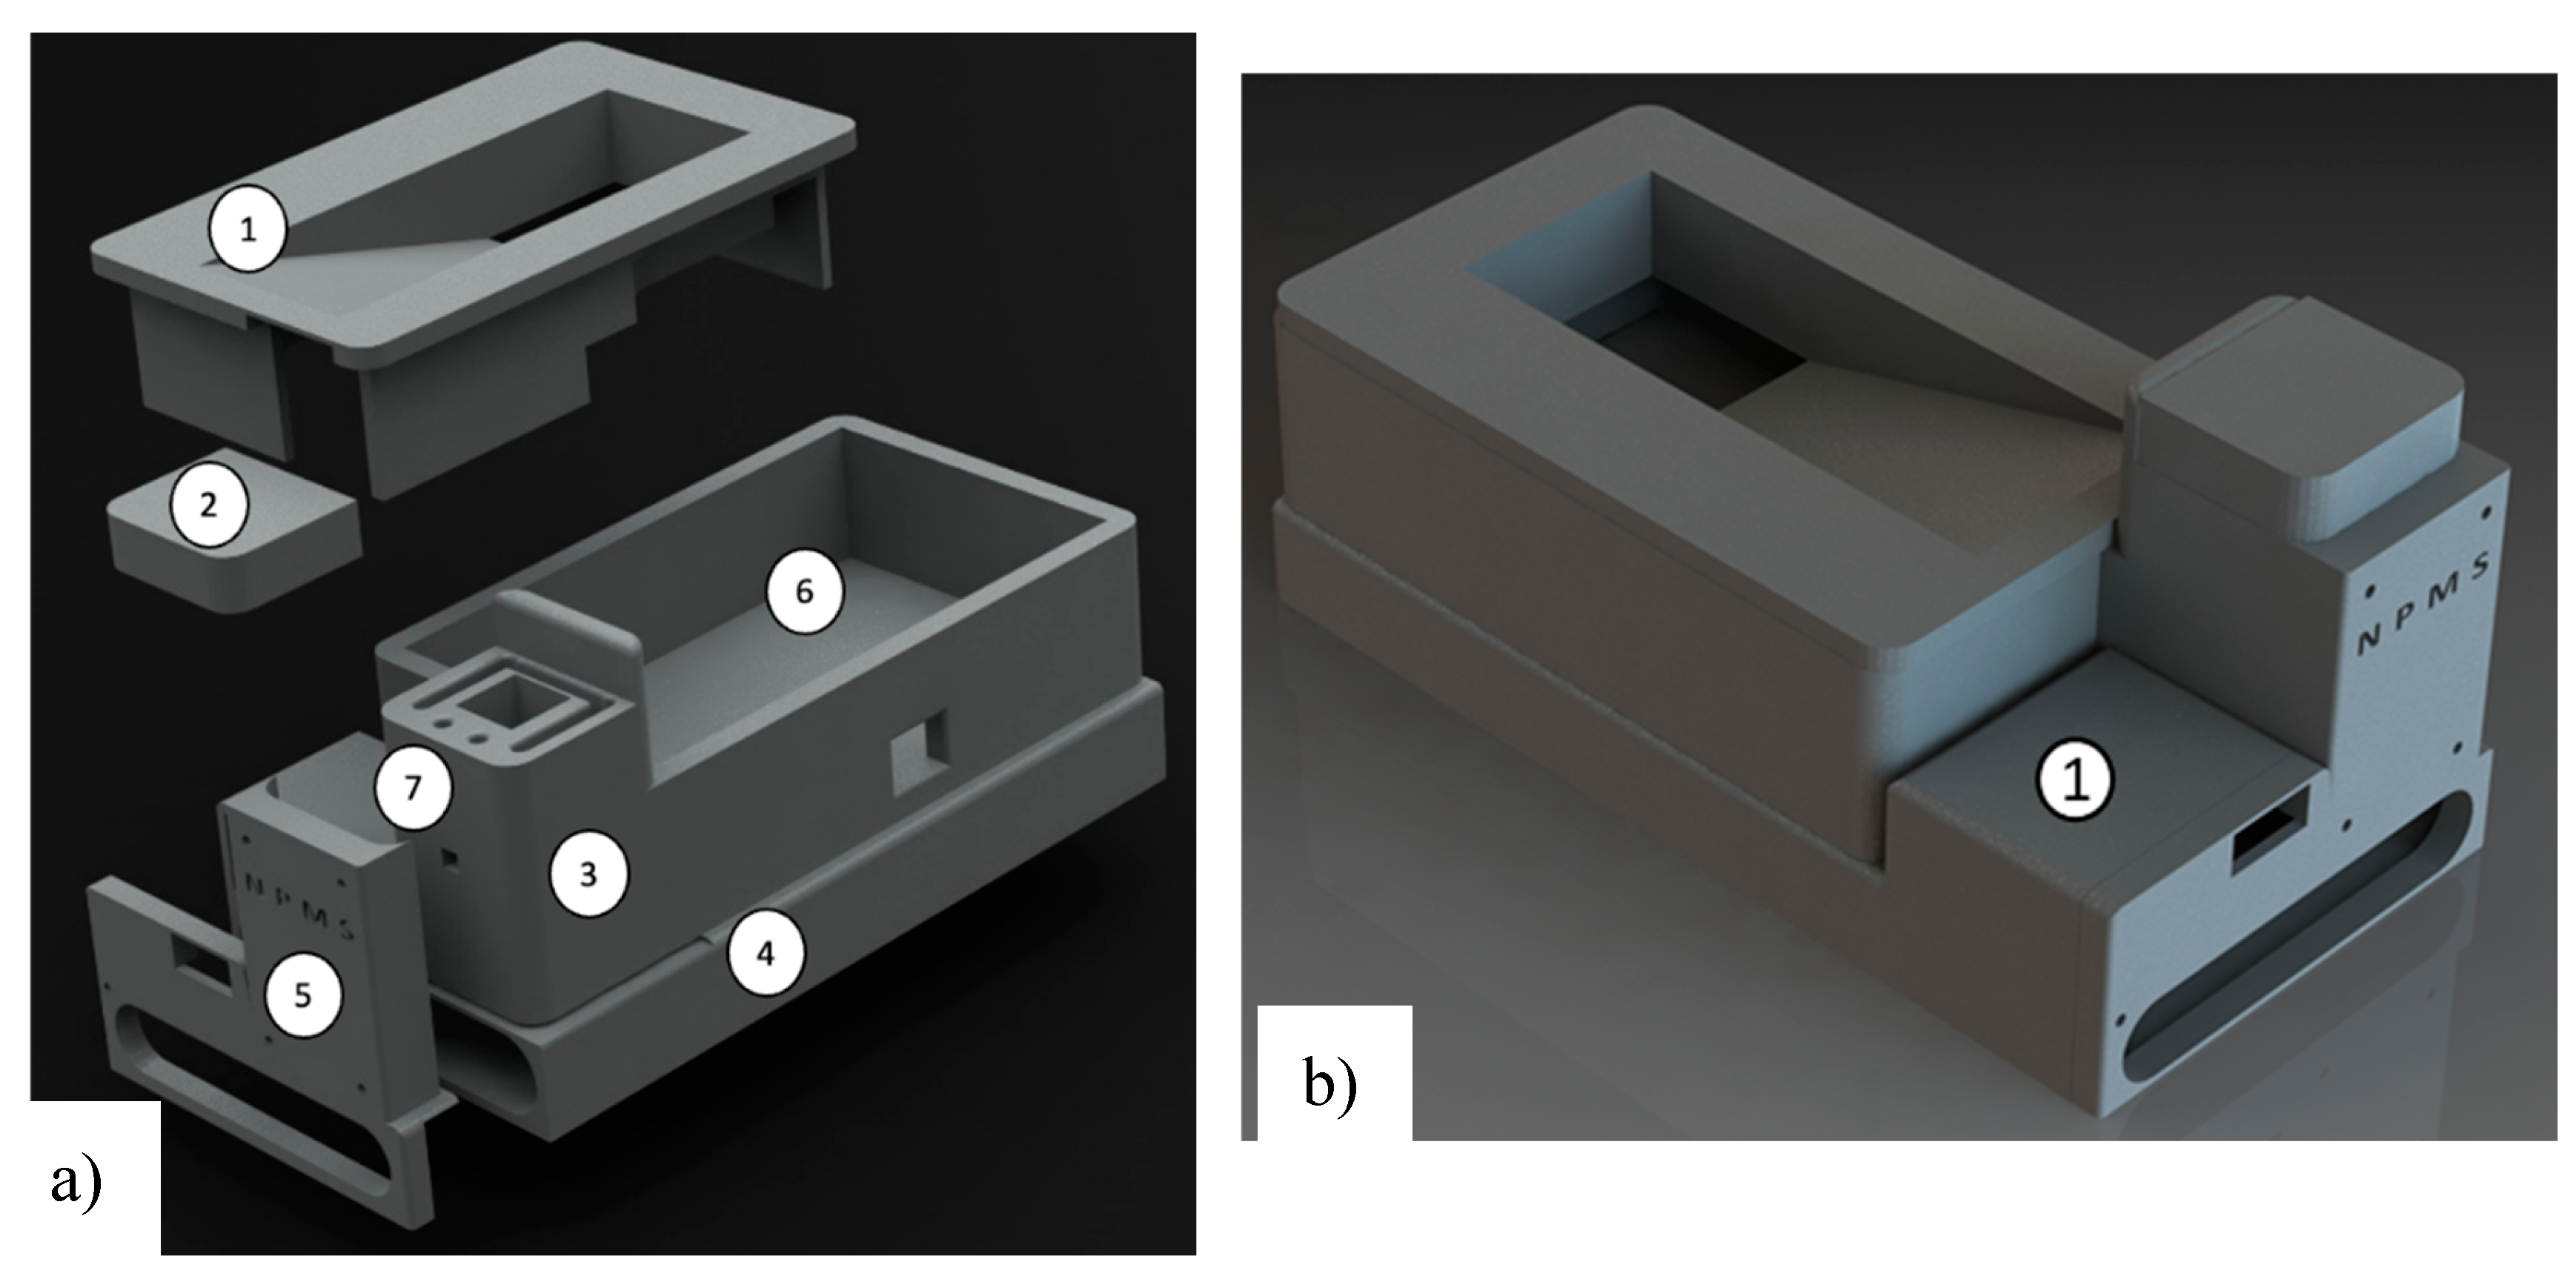

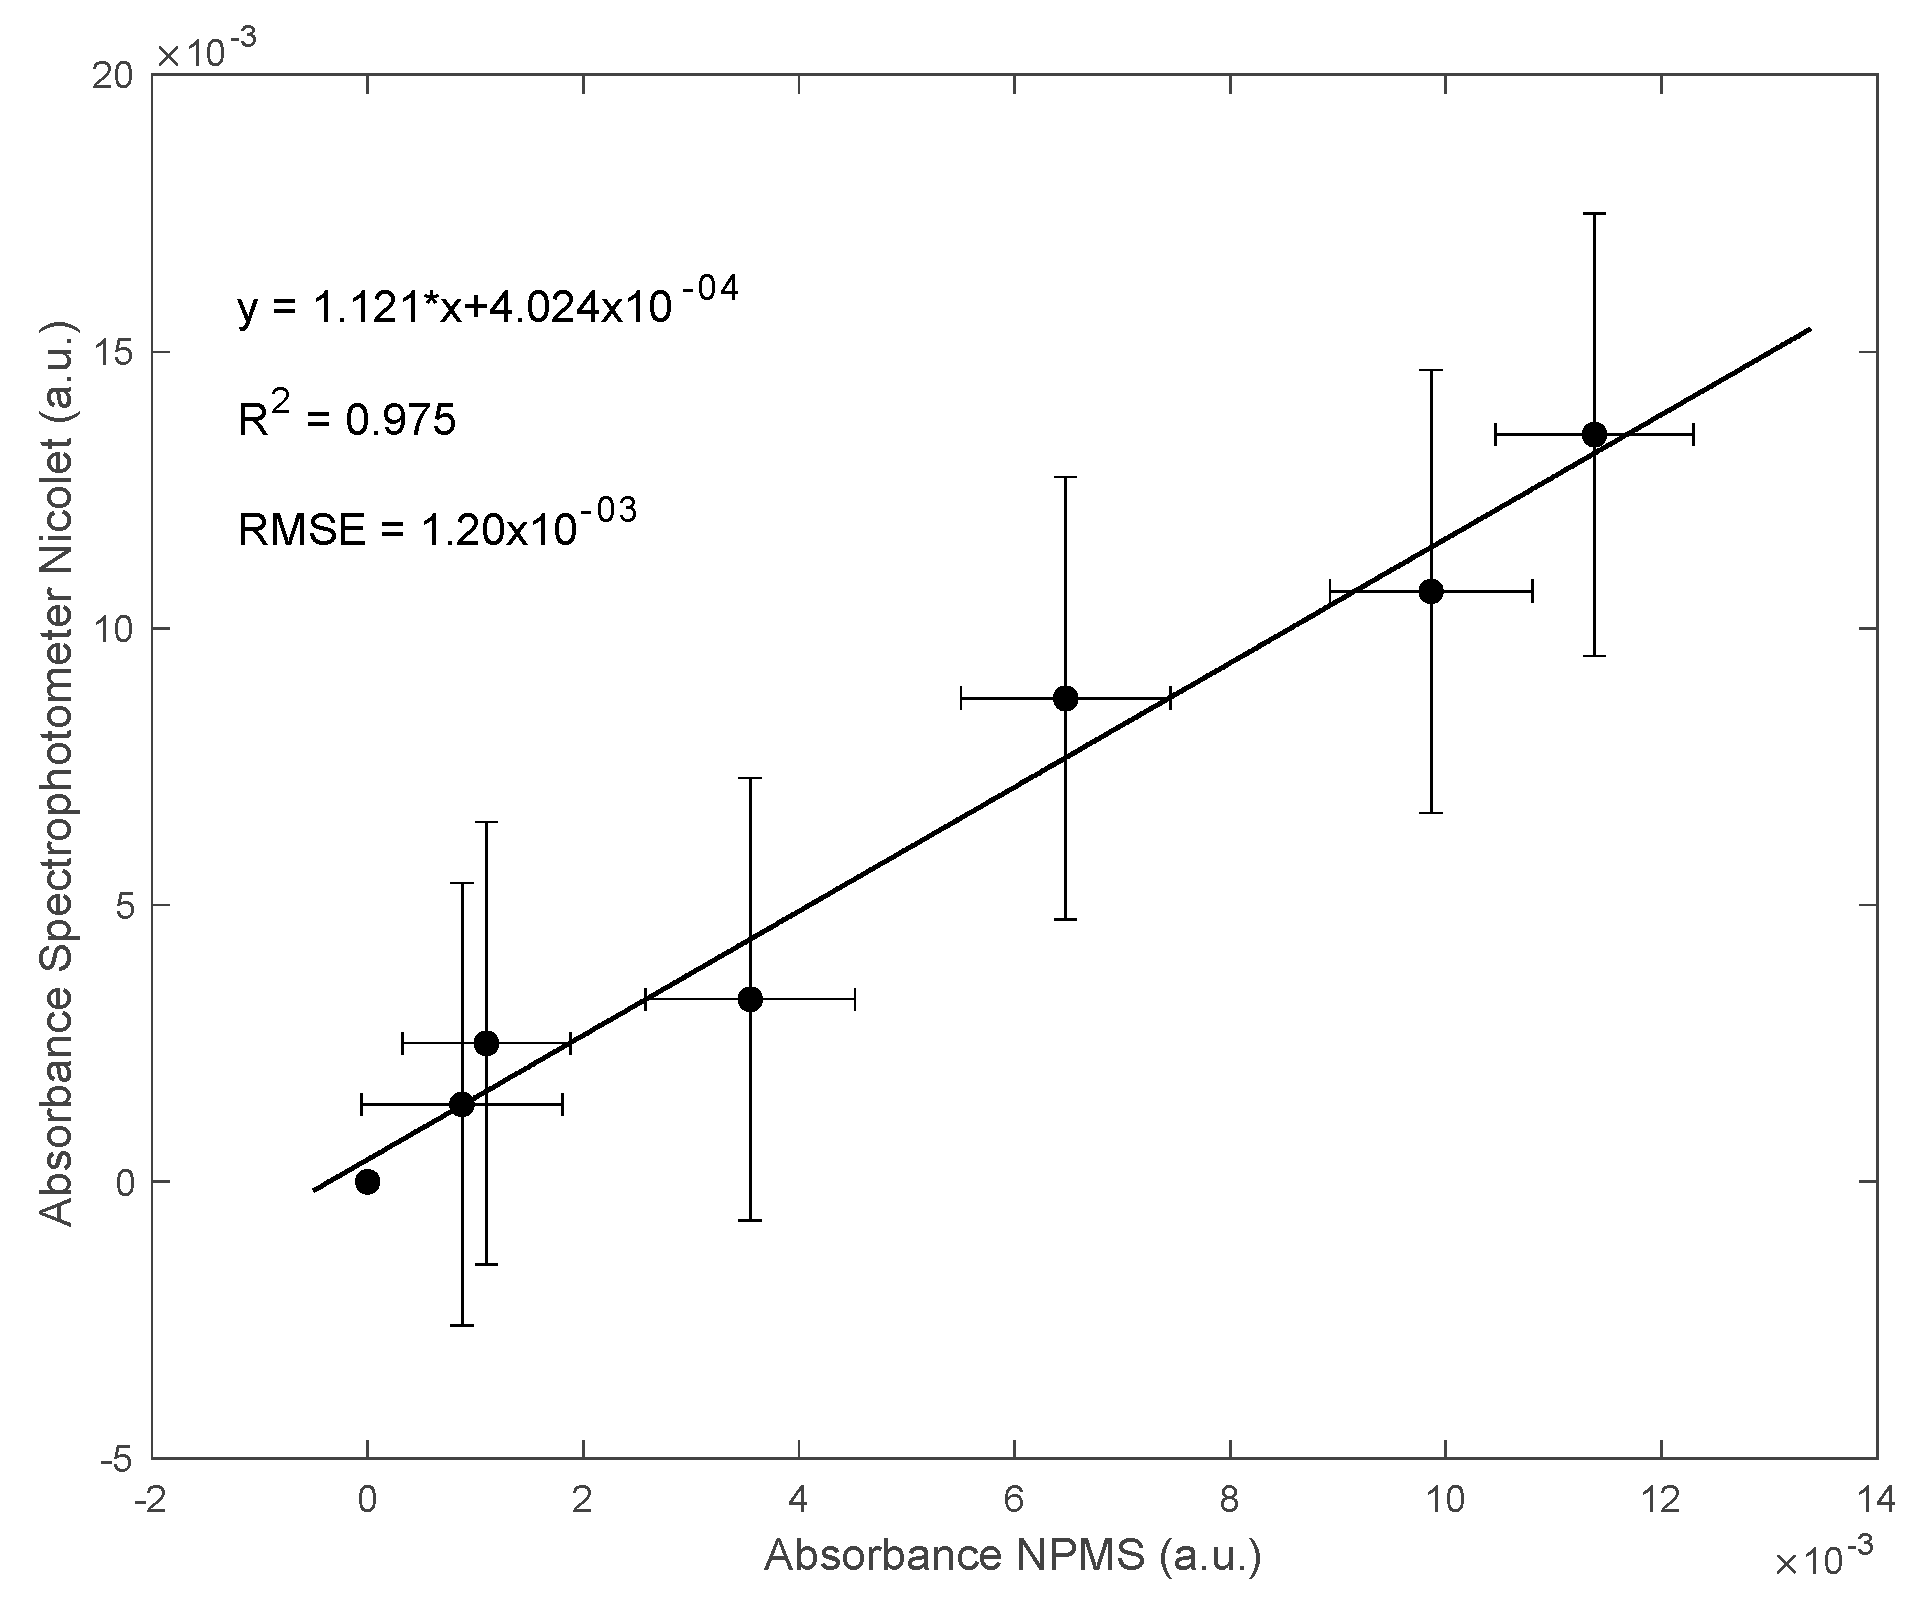
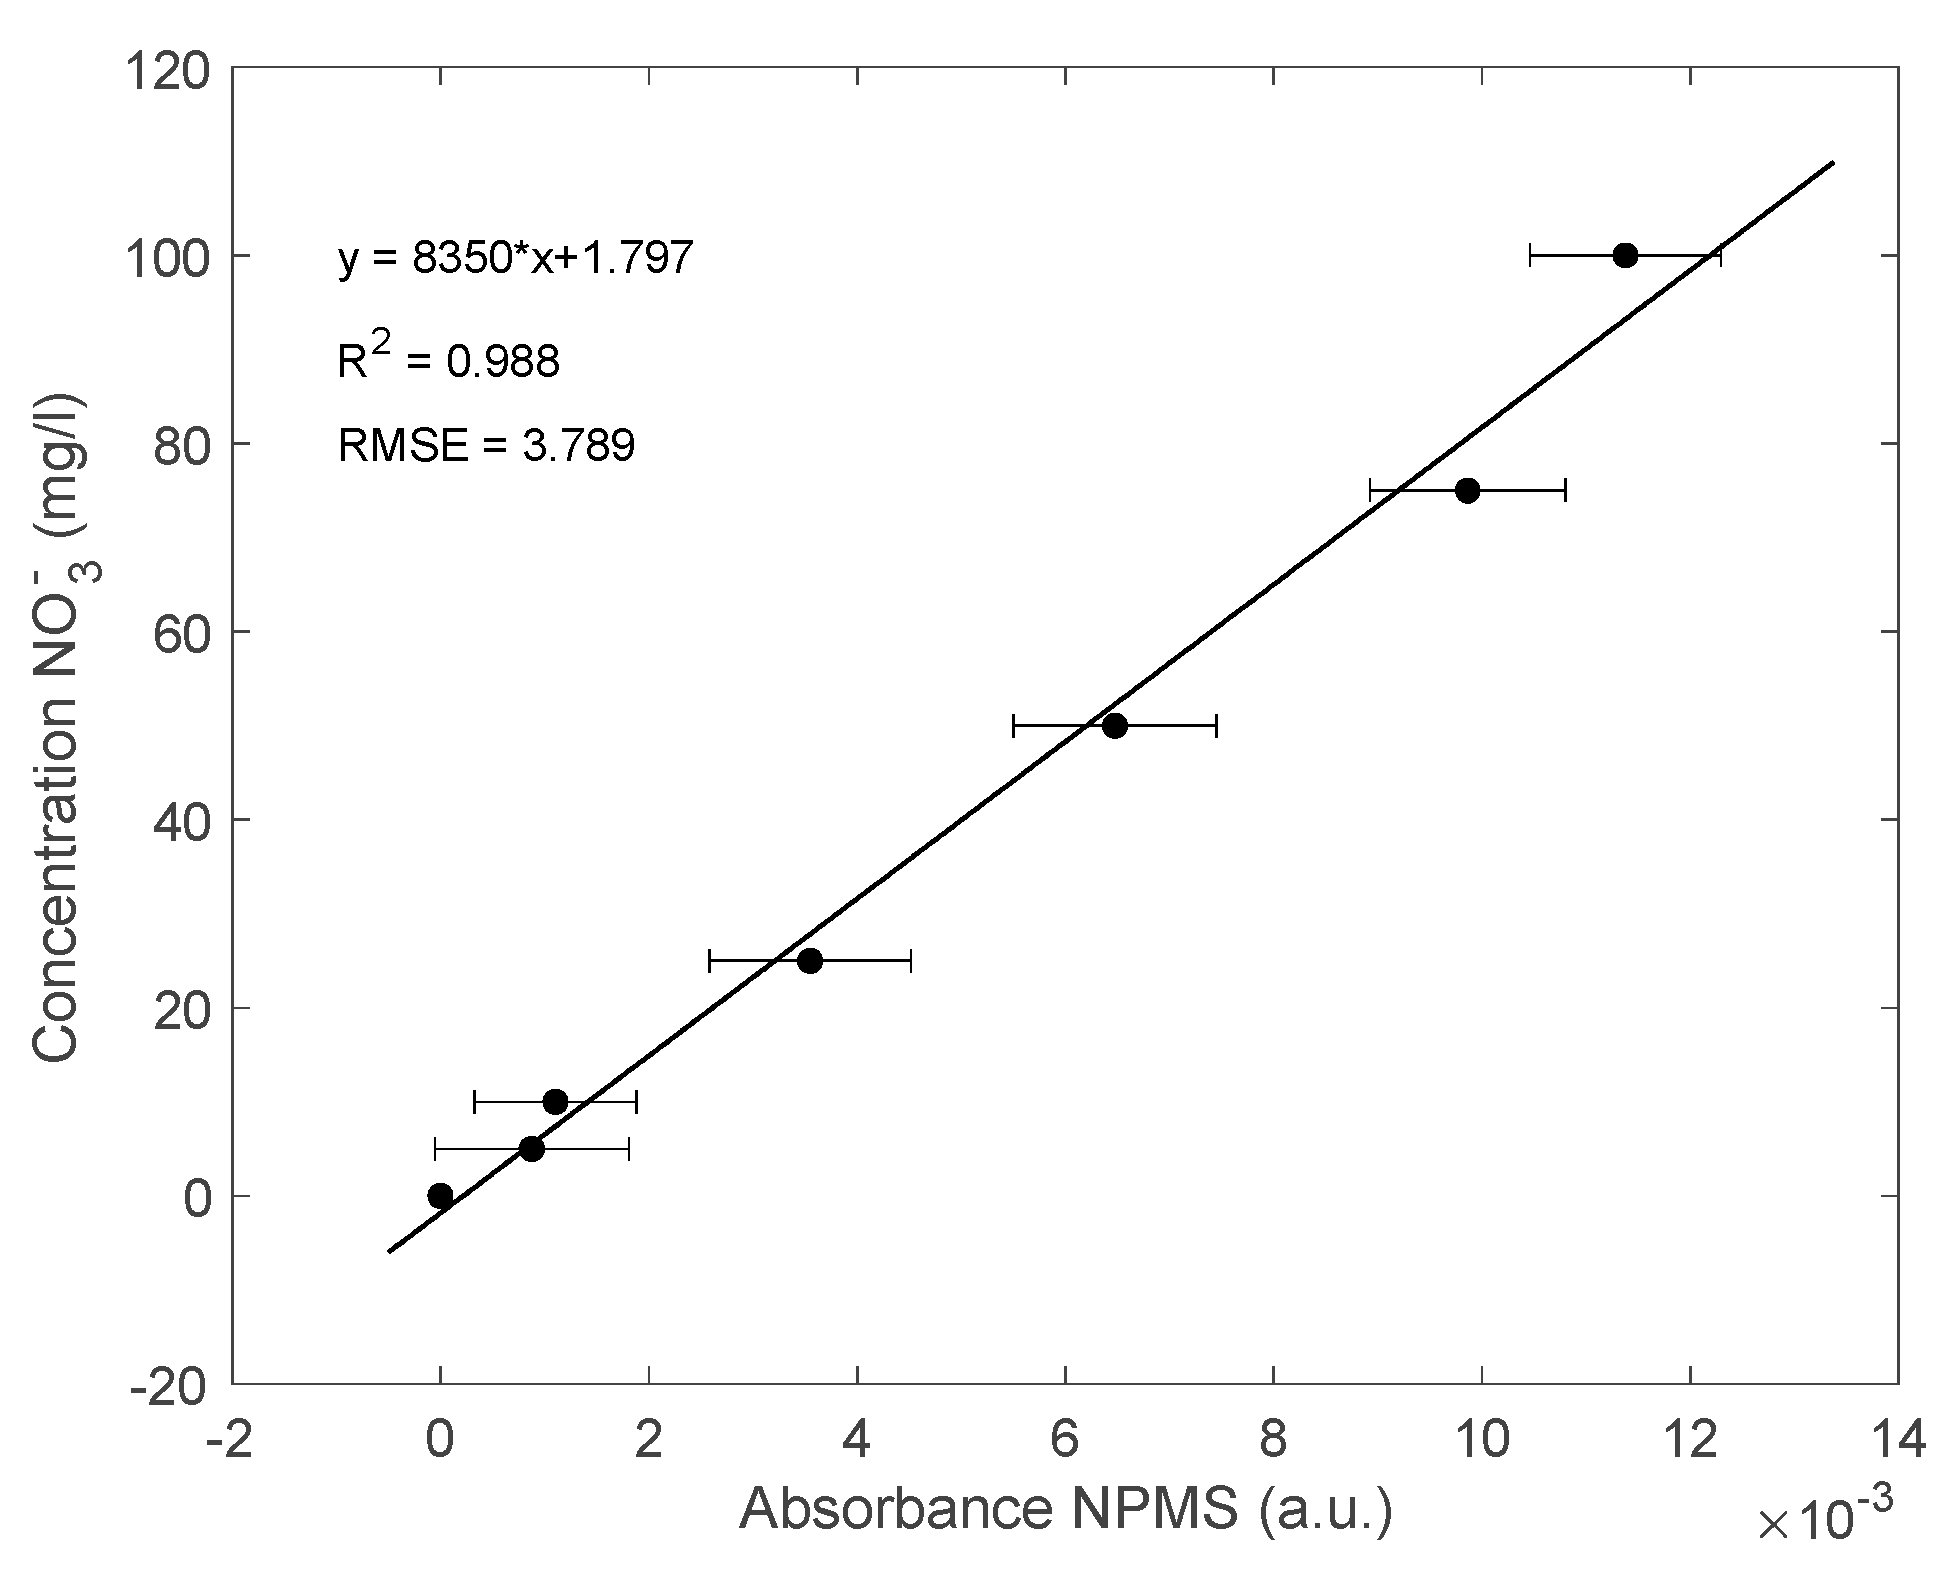
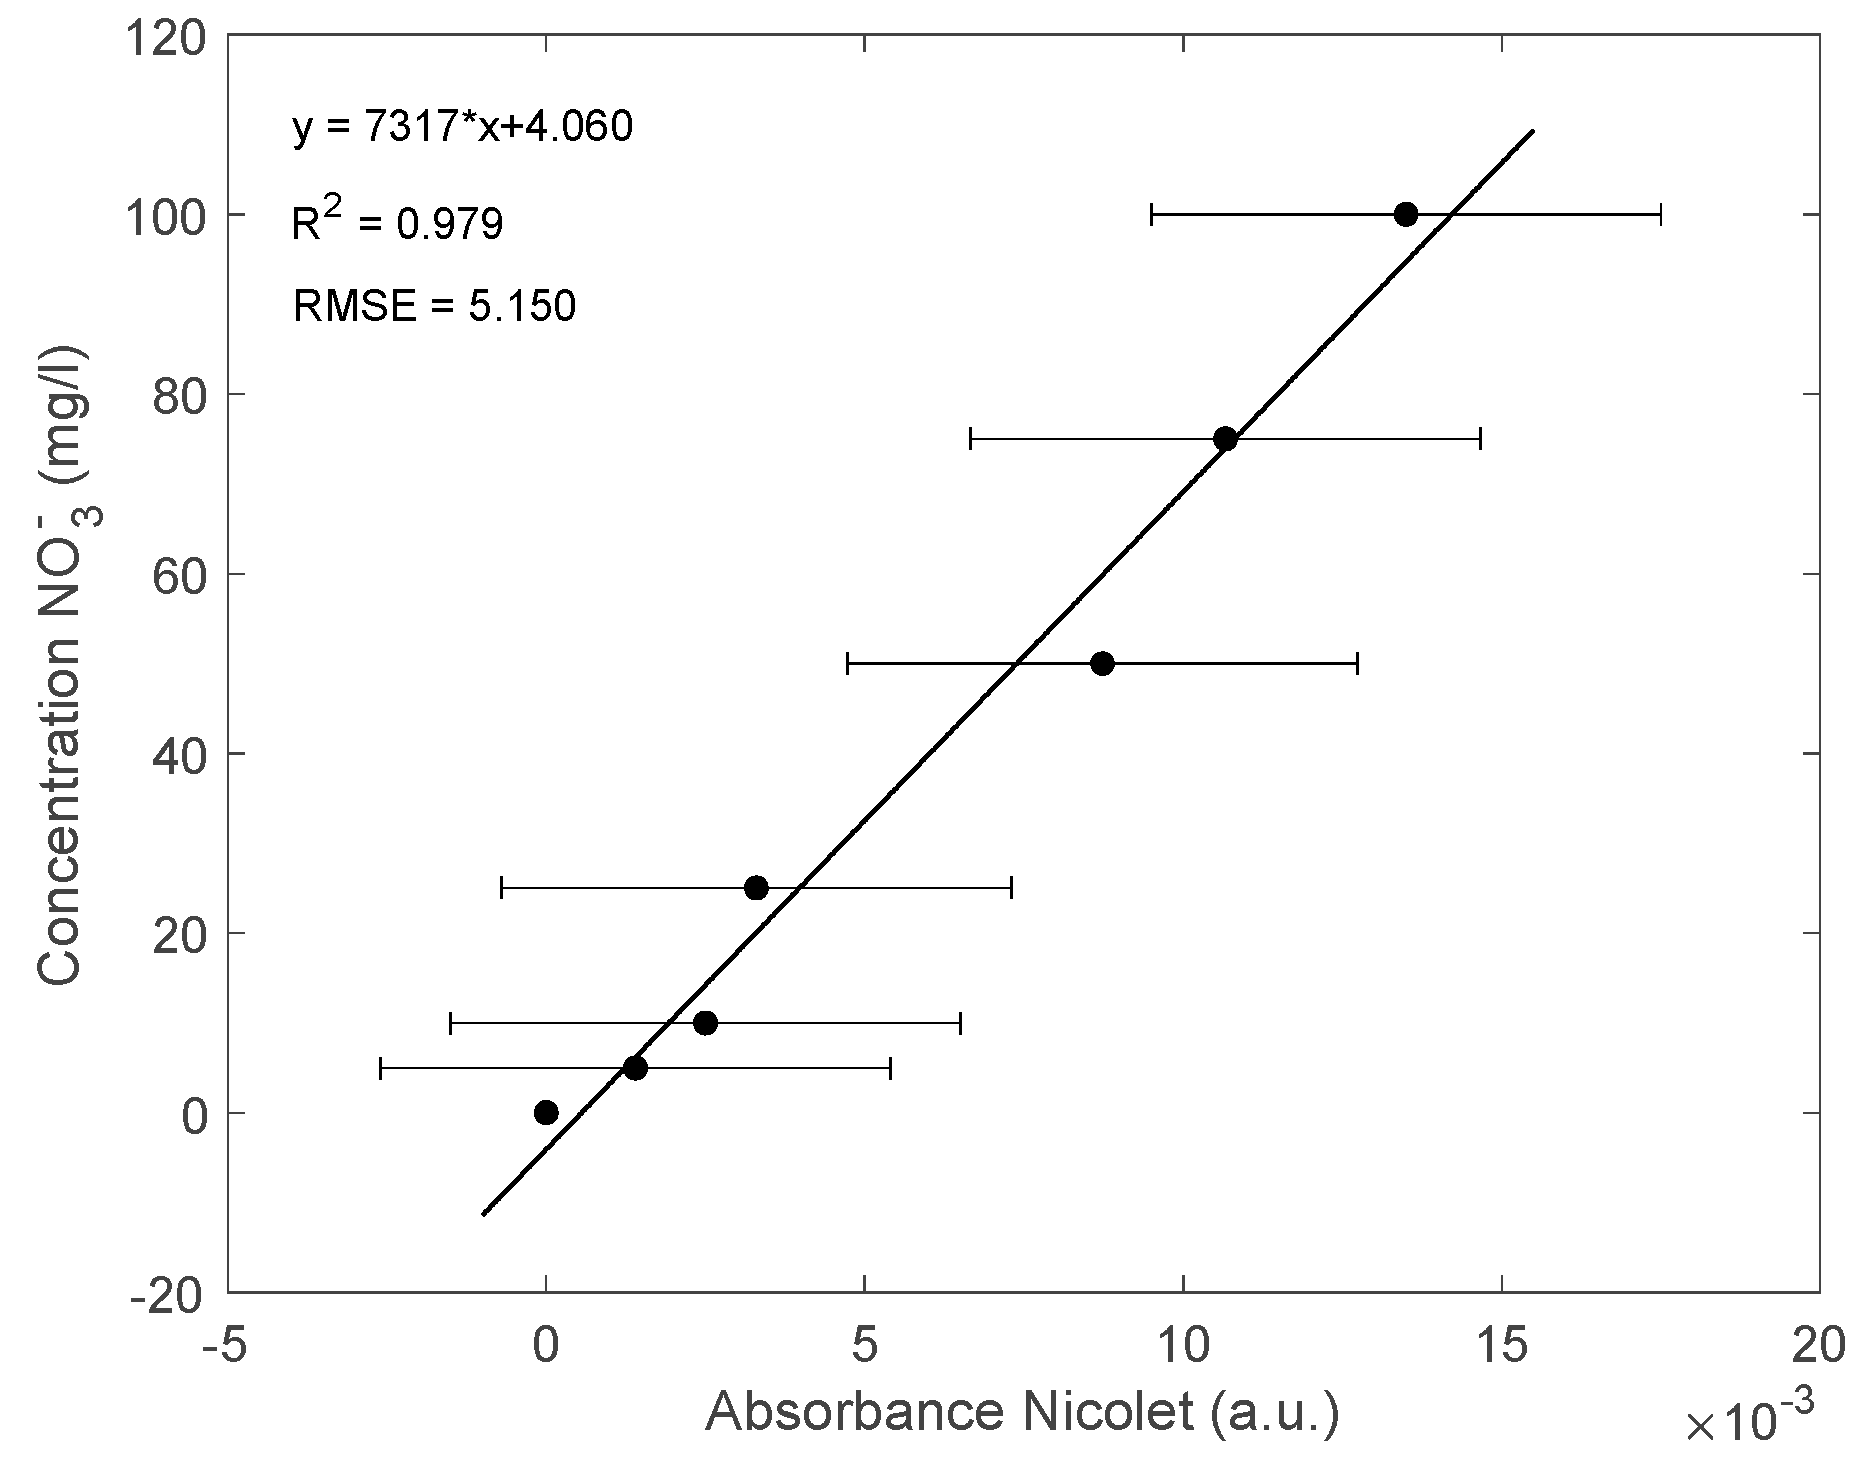
| Parameter | Value |
| Forward current | 1 mA |
| Reverse voltage | 5 V |
| Working voltage | 2.7 V to 5.5 V |
| Active area | 0.076 mm² |
| Typical dark current at 25 °C with VR of 0.1V | 1 nA |
| Photocurrent with UVA Lamp of 1 mW/cm2 | 113 nA |
| Temperature coefficient | 0.08 %/°C |
| Responsivity at λ = 300 nm with VR of 0V | 0.14 A/W |
| Operation temperature | -30 °C to 85 °C |
| Spectral detection range | 240 to 370 nm |
| Parameter | Value/Unity |
| Holographic grating | 1200 lines/mm, blazed at 240 nm |
| Maximum resolution | 0.5 nm |
| Range | 190 to 1100 nm |
| Accuracy | ± 0.20 nm (546.11 nm Hg emission line) ±30 nm (190 to 900 nm) |
| Repeatability peak separation of repetitive scanning of Hg line source | < 0.10 nm |
| Standard deviation of 10 measurements | <0.05 nm |
| Accuracy-instrument | 1A: ± 0.004 A 2A: ± 0.004 A 3A: ± 0.006 A |
| Repeatability of the light intensity measurement | 1A: ± 0.0025 A |
| Drift | <0.0005 Abs/hour at 500 nm, 2.0 nm SBW, 2 hr warm-up |
| Baseline flatness | ± 0.0015 A (200 – 800 nm), 2.0 nm SBW, smoothed |
| Sample (mg NO3-/l) | Mean Abs. NPMS | Mean Abs. Nicolet | Variance NPMS (mg NO3-/l) | Variance Nicolet (mg NO3-/l) | Critical Value |
| 5 | 0.0008 | 0.0014 | 2.1x10-07 | 2.4x10-07 | 1.10 |
| 10 | 0.0011 | 0.0025 | 1.5x10-07 | 2.5x10-07 | 1.65 |
| 25 | 0.0035 | 0.0033 | 2.3x10-07 | 2.1x10-07 | 0.89 |
| 50 | 0.0064 | 0.0087 | 2.3x10-07 | 1.9x10-07 | 0.82 |
| 75 | 0.0098 | 0.0106 | 2.1x10-07 | 2.2x10-07 | 1.01 |
| 100 | 0.0113 | 0.0135 | 2.0x10-07 | 2.5x10-07 | 1.19 |
Disclaimer/Publisher’s Note: The statements, opinions and data contained in all publications are solely those of the individual author(s) and contributor(s) and not of MDPI and/or the editor(s). MDPI and/or the editor(s) disclaim responsibility for any injury to people or property resulting from any ideas, methods, instructions or products referred to in the content. |
© 2024 by the authors. Licensee MDPI, Basel, Switzerland. This article is an open access article distributed under the terms and conditions of the Creative Commons Attribution (CC BY) license (http://creativecommons.org/licenses/by/4.0/).


